Article

Optimization of IEDs Position in MV Smart Grids through Integer Linear Programming

by
Francesco Bonavolontà
1,†,
Vincenzo Caragallo
2,†,
Alessandro Fatica
2,†,
Annalisa Liccardo
1,*,†,
Adriano Masone
1,† and
Claudio Sterle
1,†
1
Department of Electrical Engineering and Information Technology, University of Naples Federico II, 80125 Naples, Italy
2
Operation and Maintenance–Network Analysis and Maintenance, E-Distribuzione S.p.A., 80142 Naples, Italy
*
Author to whom correspondence should be addressed.
These authors contributed equally to this work.
Submission received: 29 April 2021 / Revised: 19 May 2021 / Accepted: 26 May 2021 / Published: 7 June 2021
(This article belongs to the Topic Innovative Techniques for Smart Grids)

Abstract

:
In the paper, an analytical method for determining the optimal positioning of intelligent electronic devices in medium voltage grids is proposed. Intelligent electronic devices are automated devices able to communicate one with each other and command the circuit breaker in order to localize and isolate a line fault as fast as possible. However, the number of intelligent electronic devices to install has to be limited, due to the relevant installation costs and the reduction in the transmission bandwidth caused by the increased number of exchanged messages. So, the electrical distributor has to carefully detect the nodes of the grid where the intelligent electronic devices have to be installed. The authors propose a method based on integer linear programming, which, given the number of intelligent electronic devices to install, finds their optimal position, i.e., the one that minimizes the penalties associated with the power down experienced by customers. In order to highlight the offered advantages in terms of computational effort, the proposed approach has been assessed with a real medium voltage grid.

1. Introduction

Continuity of service is a fundamental characteristic in the electricity distribution field. Indeed, ARERA, the Italian Regulatory Authority for Energy Networks and the Environment, established a system of bonuses and economic penalties for distributors based on the number and duration of electricity interruptions experienced by their consumers [1]. Distribution System Operator (DSO) companies involved in electricity distribution invest considerable resources in the research of efficient tools and methods capable of locating the fault and restoring the service in the shortest time and powering down as few users as possible.
The technological advancement both of the power of microprocessor systems and of communication methodologies contributes to making the electricity network more and more automated. The protection of the Medium Voltage (MV) electrical network is a task that gains enormous benefits from the technological evolution of the electrical network, since computation and communication speed are fundamental aspects for locating and isolating the fault [2,3].
At the present, it is possible to equip the MV network with Intelligent Electronic Devices (IEDs), i.e., microprocessor-based devices capable of (i) receiving analog signal from sensors, (ii) controlling electrical equipment such as circuit breakers, capacitor bank switches, voltage regulators, (iii) exchanging messages with other IEDs or with Supervisory Control And Data Acquisition (SCADA) systems [4] according to a communication standard defined by IEC 61850 [5]. The use of IEDs allows the implementation of extremely fast and efficient methods for locating and isolating the fault [6]. An example is the localization of the fault through a logic selectivity approach [7,8]; it is based on the ability of the IEDs to communicate with each other and, on the basis of the exchanged messages, to decide autonomously to command the trip of a circuit breaker, so isolating only the faulty grid portion in a time interval compatible with the fault current tolerable by the line conductors [9].
In order to switch from a traditional fault location method to a method based on Logic Selectivity (LS), modifying the electrical network is mandatory, since new components have to be installed in each node to be connected in the communication infrastructure [10]. Each automated node, therefore, is characterized by an installation cost that the distributor must support. On the other hand, the number of automated nodes on a network directly determines the efficiency of the fault location and isolation method; the greater the number of automated nodes, the smaller the portion of the network that will be isolated in case of fault.
The distributor then has to identify the proper trade-off between installation costs and efficiency in isolating the fault. For this aim, the authors propose in the paper a method for the optimal positioning of the IEDs. Once the desired number of IEDs has been set (determined by the sustainable installation costs and available transmission bandwidth), the proposed method exploits the information of the MV network (such as topology, consumers of each substation, fault historical data) and, through an Integer Linear Programming (ILP) problem, provides the best position on the network of the IEDs to be installed, which is the position that minimizes the penalties related to the disservice for consumers.
Several contributions investigate and simulate the benefits arising either from the switch placement or from the use of IEDs in different configurations [7,11,12,13,14,15]. However, to the best of authors’ knowledge, this is the first work dealing with the IED optimal location in a logic selectivity perspective.
The research activity has been carried out in collaboration with e-distribuzione, a company of the ENEL S.p.A. group, Italian leader in the distribution of electricity, which provided both details on the method of localization and isolation of the fault, and the test networks validated the method.
The article is organized as follows: in Section 2, the logic selectivity approach is described, with particular attention to the method implemented by e-distribuzione; in Section 3, the description and the ILP formulation of the IED optimal location problem is given; Section 4 shows the assessment procedure to prove the effectiveness of the proposed methodology and the obtained results; finally, in Section 5, some concluding remarks are given.

2. Automated Fault Location in Smart Grids

2.1. Traditional Automation

To highlight the benefits associated with the LS approach, a brief description of the technique currently in use for the protection of MV grids is made in this paragraph [16].
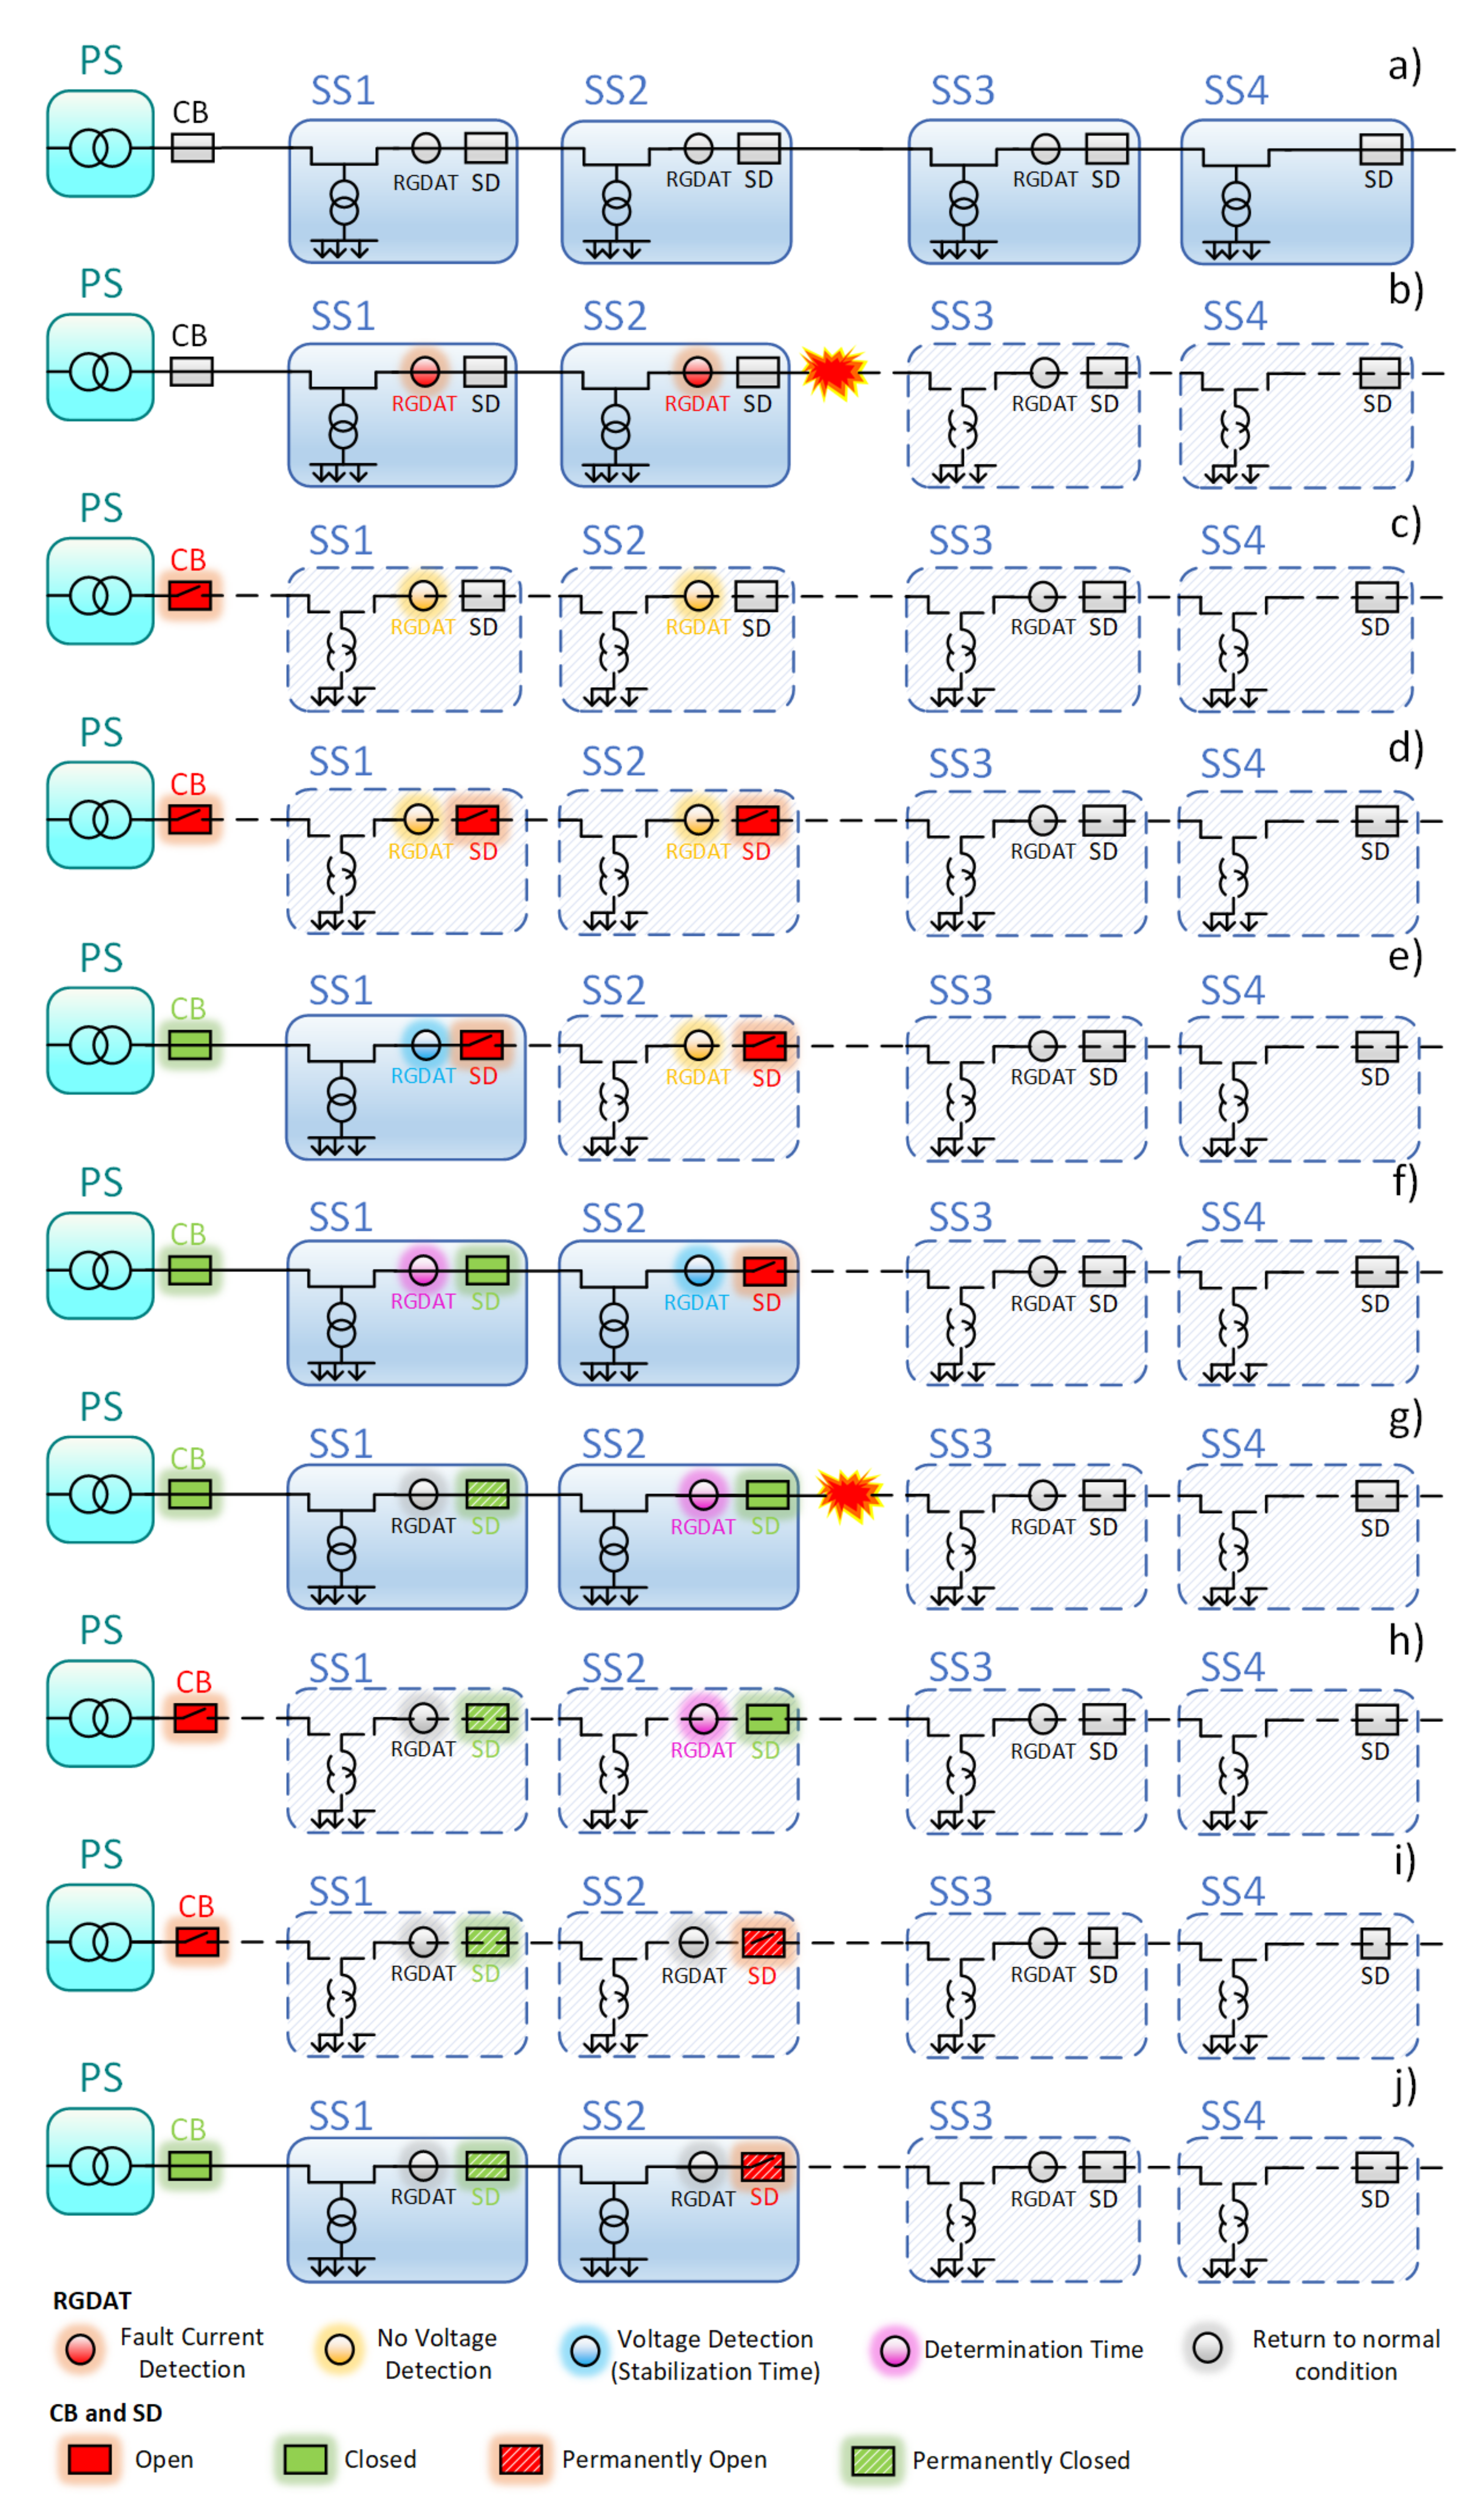
The MV line represented in Figure 1a is considered. It is powered by the primary substation PS, which exhibits a circuit breaker (CB) at its output to protect the entire line. The PS node is equipped with a panel to perform the protective functions. Automation processes use these functions (identified by their ANSI code): 51 (to detect overcurrent and short-circuit events), 67 (to detect grounded fault events), 79 (to perform short and long reclosures). The line supplies four secondary substations, indicated as SS1, SS2, SS3 and SS4, which serve both MV and LV consumers. In order to enable the line automation, the SSs must be equipped with a Remote Terminal Unit (RTU), a motorized Switch-Disconnector (SD), a device named Directional Fault and Voltage Absence Detector (RGDAT), which allows one to replicate the 51 and 67 functions as the PS panels and to detect the presence/absence of voltage on the SS’s busbar. The maximum number of automated SSs is three and in Figure 1 the automated sustations are SS1, SS2, and SS3.
There are different techniques of automation depending on the type of fault and the type of connection of the neutral conductor. Here, we consider the method called Fault Search Function (FRG), which is used in the event of a short-circuit fault and grounded fault on lines with both isolated neutral and compensated neutral. Similar conclusions, however, can also be drawn for the other types of automation.
When a fault current is detected, the PS breaker opens the circuit and, after a short waiting time, a Rapid Re-closing (RR) is applied to eliminate any self-extinguishing transient faults. If at the end of the RR the fault persists, the Slow Re-closing (SR) functions begin to be applied in order to locate the fault; the number and duration of SRs are based on the type of line considered.
Each automated node in the SS is programmed to perform the following steps:
  • If the RGDAT does not detect any voltage (upstream of the MV line with respect to the point where it is installed) for a certain period of time and has previously detected the presence of a fault current, the RTU automatically commands the opening of the SD;
  • When the SD is opened and a voltage is detected (the line upstream is powered again), the RTU waits for a programmed stabilization time and then sends a closing command to the SD; at this time, a timer for measuring a programmed determination time starts;
  • If the voltage is present for the duration of the determination time, the RTU leaves the SD closed and inhibits its opening in the successive steps. Otherwise, if no voltage is detected during the determination time, the RTU opens the SD permanently. This information is sent to the Operations Center.
Assuming that the fault occurs between the secondary substations SS2 and SS3, both the RGDATs in SS1 and in SS2 sense the fault current, as shown in Figure 1b. The circuit breaker CB in PS opens to protect the line, tries the RR and, if the fault persists, opens again. The RGDATs of all the secondary substations detect the absence of voltage (Figure 1c). Therefore, the nodes in SS1 and SS2 perform step 1 and command the opening of the respective SDs, as shown in Figure 1d. Instead, in the substations downstream of the fault (SS3 and SS4) if the fault current has not been detected, the absence of voltage does not cause any procedure. After the programmed time of 30 s, the recloser in the PS feeds the line again. The node in SS1 enters step 2 (Figure 1e); when the stabilization time elapses, the RTU closes the SD, starts the timer of the determination time and enters step 3, as shown in Figure 1f. As can be seen in the figure, SS2 also enters step 2 since it detects the power supply voltage. The localization procedure is correctly carried out if the SD of SS2 cannot be closed until the SS1 determination time has elapsed; therefore, the stabilization time must be suitably sized, always coordinating the closure of an SD with the determination time of the upstream substations. When the determination time elapses, SS1 does not detect fault currents; therefore, it keeps its SD closed and inhibits its opening in subsequent operations (Figure 1g). The RTU in SS2, which is performing step 2, closes the SD, starts the timer for the determination time and enters step 3. In this case, the closure of the SD causes the powering of the fault and the breaker CB in PS opens the circuit again, as shown in Figure 1h. The RTU in SS2 then permanently opens the SD and sends the related message to the Operations Center, because the absence of voltage has been experienced during the determination time (Figure 1i). Finally, after a time interval ranging from 70 to 120 s, the line is powered again by the recloser. This time the fault was correctly located and isolated as noticeable in Figure 1j. The consumers connected to the substations SS1 and SS2, upstream of the faulty section, are powered; they have experienced an interruption of less than 180 s, which is classified by the authority as a short interruption. Users powered by the substations downstream of the fault are disconnected and experience a long interruption until the line is restored.

2.2. Logic Selectivity and Smart Fault Selection

In the FRG automation technique, the localization and isolation of the fault are achieved by means of nodes working locally, independently from the other nodes in the grid [17]. The only transmitted message is the notification to the Operations Center of an SD that is permanently open (that of SS2 in the example). This guarantees independence on the communication carrier but there is strong dependence on the time of selection. However the automation process is also completed when communication carrier is down.
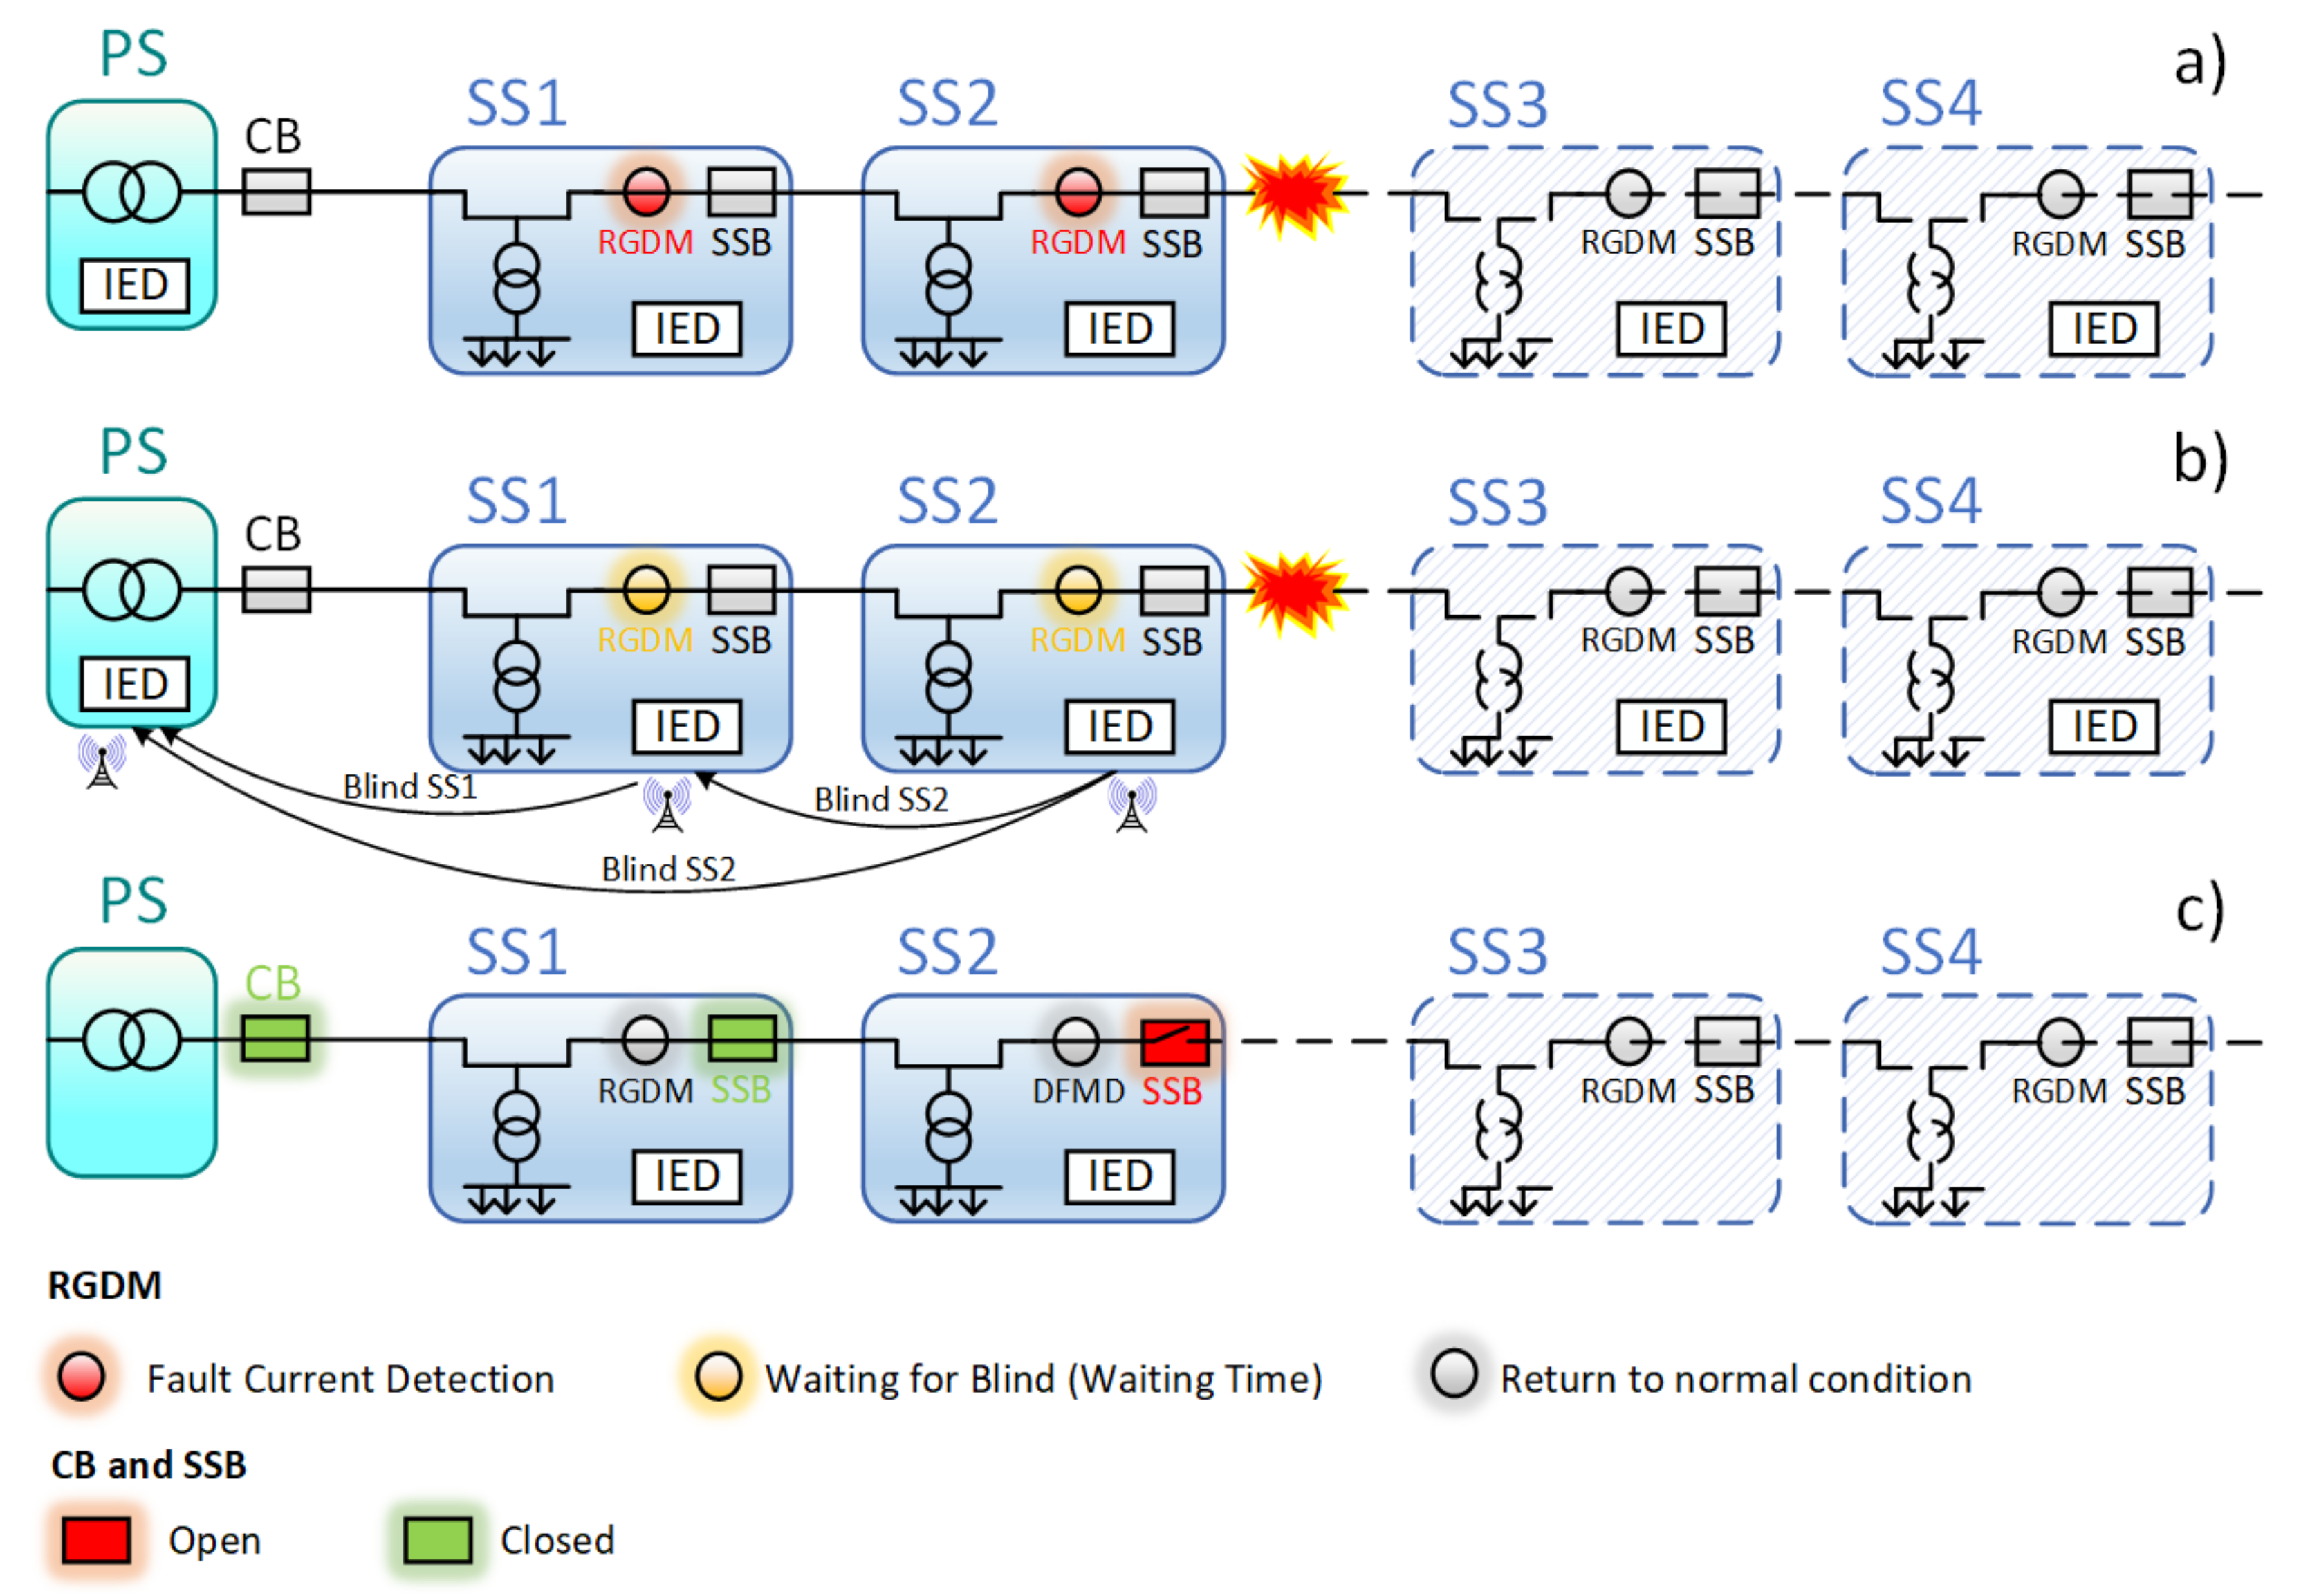
The Logic Selectivity (LS) approach takes advantage of the possibility of making the substations communicate in real time with each other in order to locate the fault in a much faster time. According to this approach, in each automated substation the SD has to be replaced by a motorized Secondary Substation Breaker (SSB), capable of interrupting the fault currents and characterized by trip time suitable for the automation technique (70 ms), whereas the SD is characterized by a trip time of about 4 s. Moreover, the RGDAT is replaced by a Directional Fault and Measure Detector (RGDM) that has to sense fault currents and constantly measures the voltage and line current. The automation process is controlled by the IED, which has the ability to communicate with the other IEDs via a fast communication medium (LTE, optical fiber).
The Smart Fault Selection (SFS) is an improved LS approach, where each node that detects the fault current performs two steps:
  • It transmits a block signal, called Blind, to the other IEDs installed on the grid; then it starts a timer to measure a programmed waiting time;
  • If it receive a Blind message from a downstream node during the waiting time, it leaves the breaker SSB closed; otherwise, it commands opening of the SSB.
The contents of the Blind message also contain the topological position (namely, tag) of the IED that has transmitted the message; this allows each IED to determine whether the information received has been sent by an IED installed electrically upstream or downstream on the line.
Referring to Figure 2, again the case of a short-circuit fault between the substations SS2 and SS3 is considered. The fault current is detected by the PS, SS1 and SS2, as indicated in Figure 2a. In Figure 2b, the transmitted messages are highlighted. Substations SS1 and SS2 transmit the Blind message. The IED in the PS receives both the SS1 Blind signals; since at least a Blind signal from a downstream node has been received, the IED in PS inhibits the opening of its breaker. Similarly, SS1, which receives the Blind message from SS2 before the waiting time has expired, inhibits the opening of its breaker. Since the nodes downstream of the fault have not detected the fault current, they do not transmit the Blind message. So, SS2 does not receive any message and, at the end of the programmed waiting time, commands the opening of the SSB.
Additionally, in this case, the final configuration, shown in Figure 2c, ensures that the substations SS1 and SS2 are powered upstream of the faulty line section, while the users connected to the substations downstream of the fault will experience a long interruption. However, advantages can be highlighted with respect to the traditional approach: the time within which the fault is isolated is independent of the number of automated substations but depends only on the implemented transmission technology. The waiting time for opening the SSB is set based on the time required for the transmission/reception of the Blind signal (typically a few milliseconds), resulting in a stress reduction in the conductors.
Actually, no advantage is perceived by switching from a traditional protection technique to the SFS approach for consumers connected to the substations SS3 and SS4. A notable improvement is obtained when the SFS allows the isolation only the section of line affected by the fault and to power the substations that are downstream of the fault through connection with another primary substation.
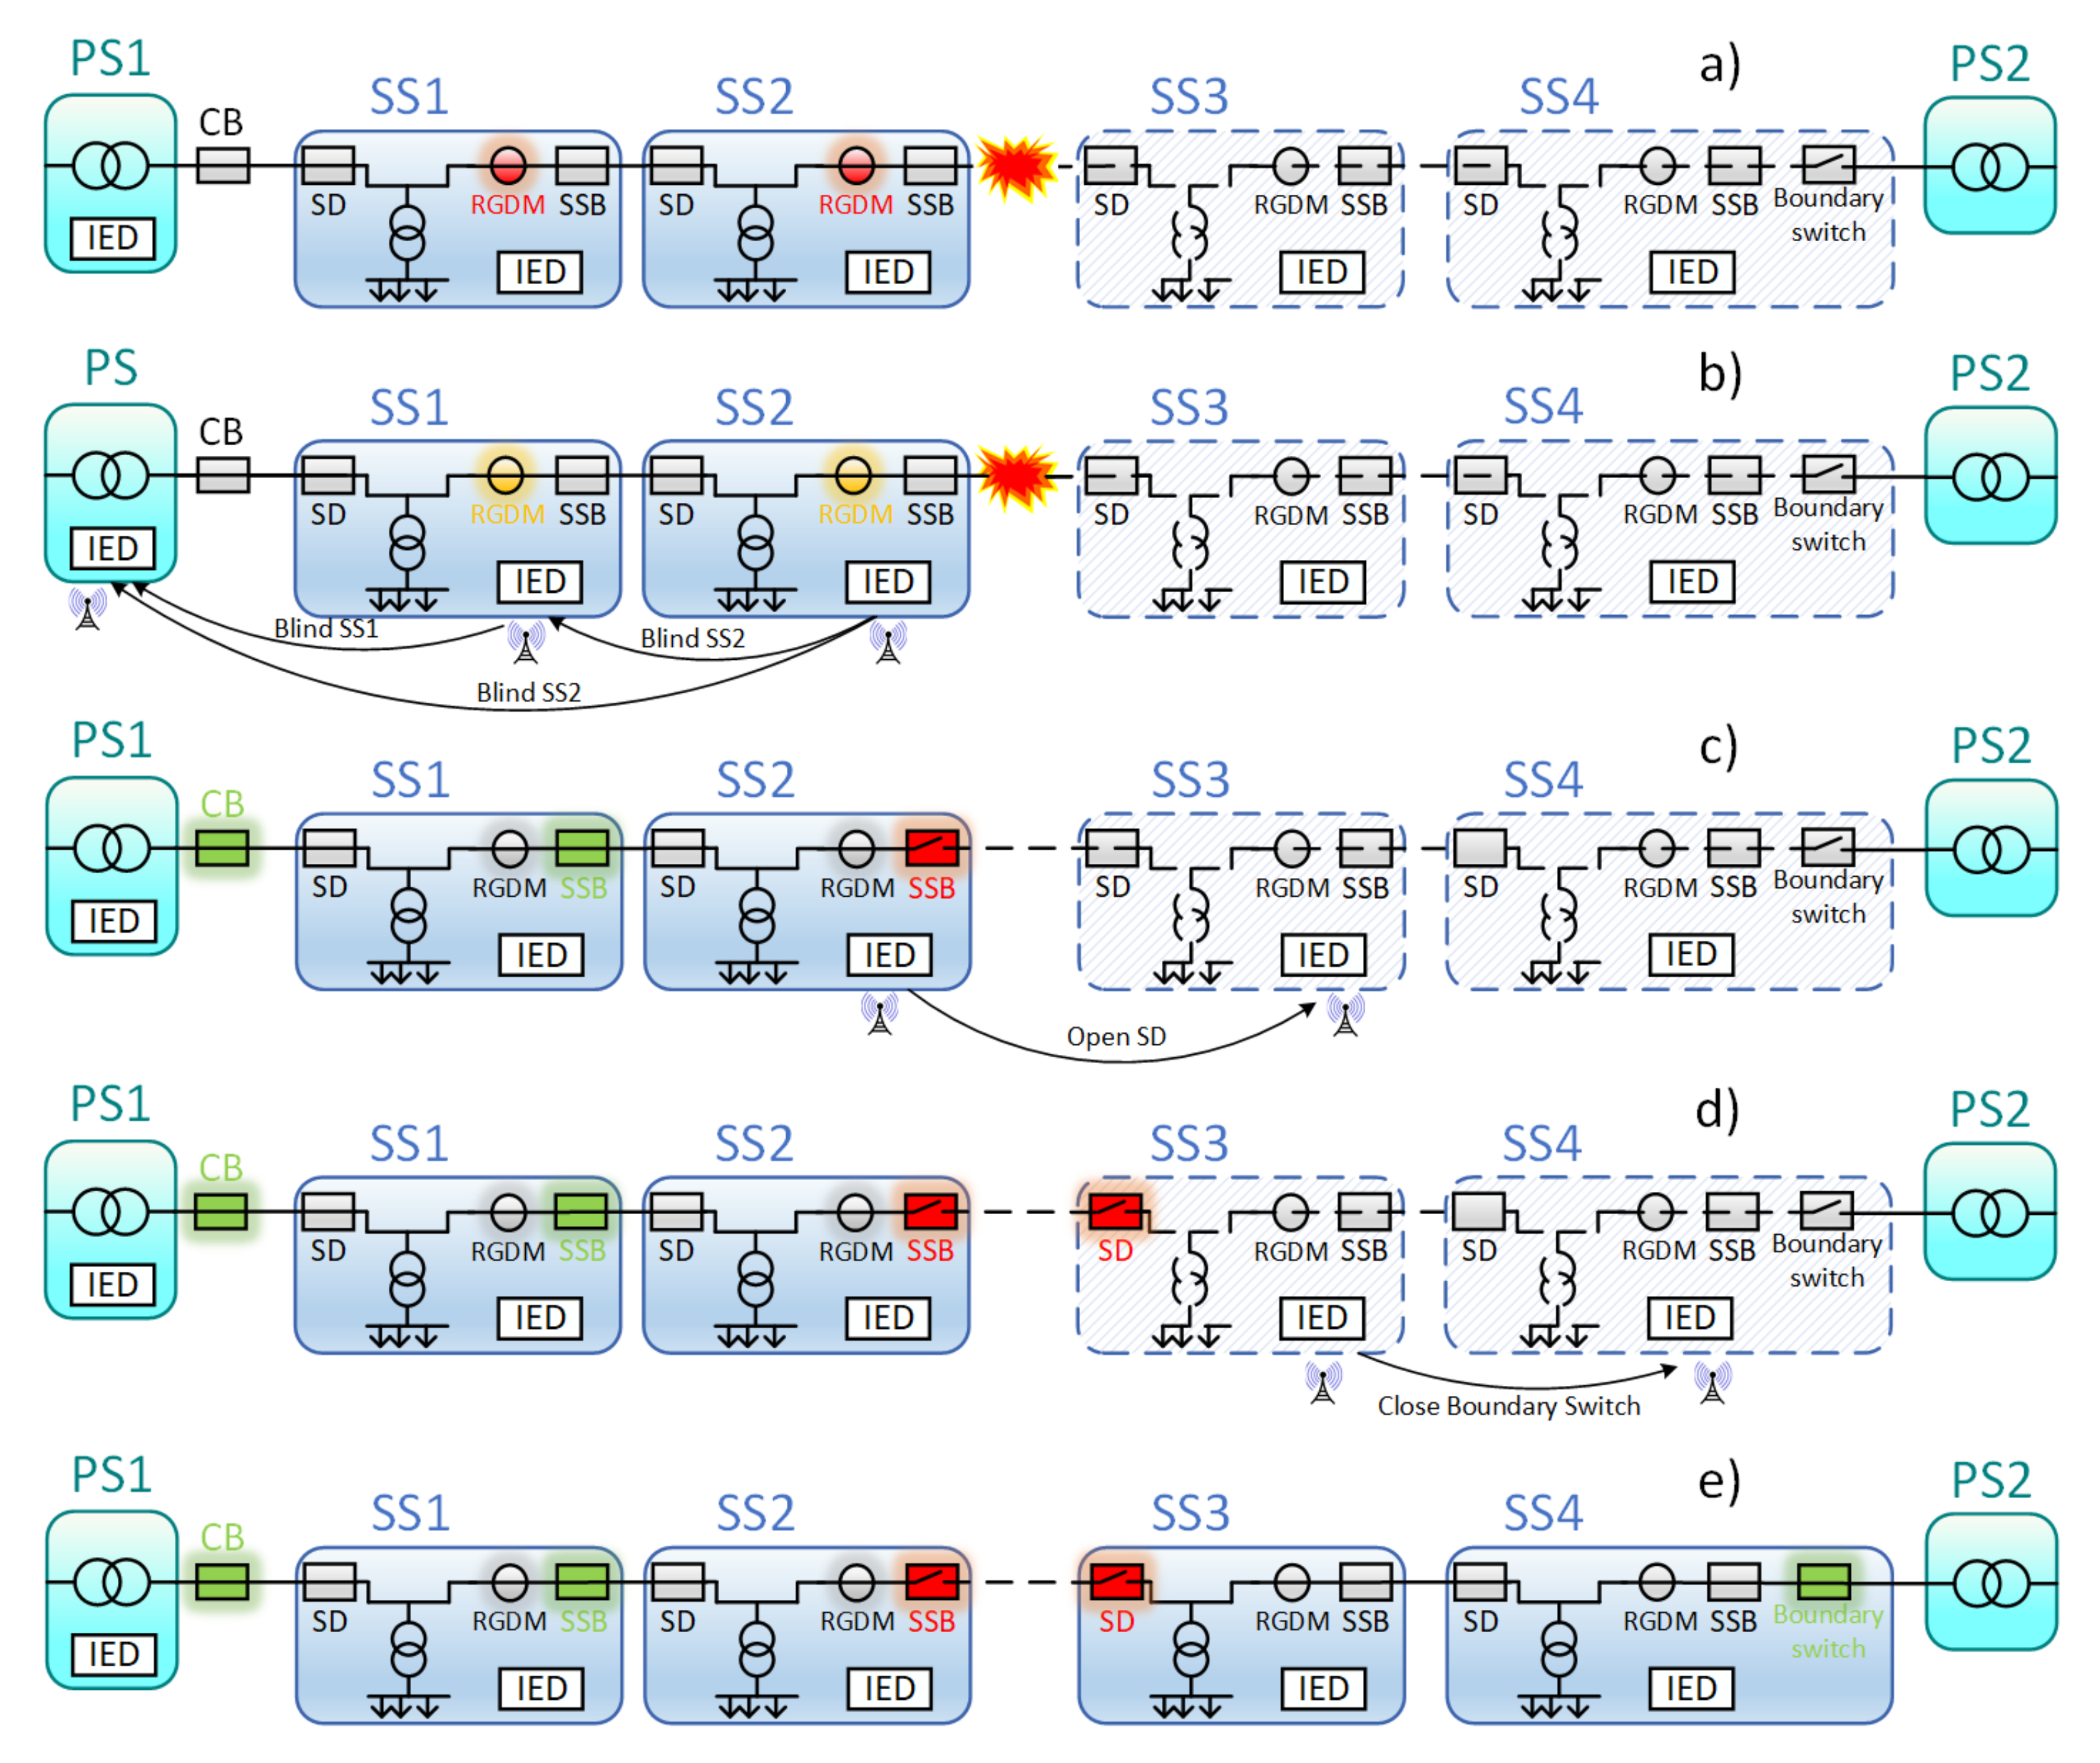
To enable the re-powering of the line, each substation has to also be equipped with an SD controlled by the IED at the substation input, in addition to the breaker SSB at the substations output, as shown in Figure 3. Moreover, along the MV line there is a boundary substation (SS4 in the figure) that includes another node, called the boundary switch, which is normally open, but it can be closed to connect the MV line to another primary substation (PS2). Considering a fault between SS2 and SS3, the fault is localized according to the same steps previously described.
The difference is that when the IED in SS2 opens the SSB, it successively sends an Open message to the IED of the substation SS3 (Figure 3c), which opens the SD at the substation input. In this configuration, the faulty section has been isolated and it is possible to supply the MV line from the right side. The IED in SS2 then transmits a Close message to the boundary substation (Figure 3d), which closes the boundary switch and the substations SS3 and SS4 are powered by the primary substation PS2, as shown in Figure 3e.
If the line can be re-powered within one second from the start of the fault, costumers connected to the SS3 and SS4 will experience only a transient interruption, with a significant increase in the quality of service indicators.
It is worth noting that the re-powering from another primary substation can be carried out also by the traditional FRG approach described in Section 2.1. However, it is necessary to open the SD at the input of SS3. Therefore, in SS3, the presence of a device with a communication interface that can receive messages to command the opening of the input SD must be provided or it is necessary to send an intervention team to carry out the necessary operations. In any case, substations SS3 and SS4 would be out of power for a longer time and connected costumers would experience a short or long interruption.
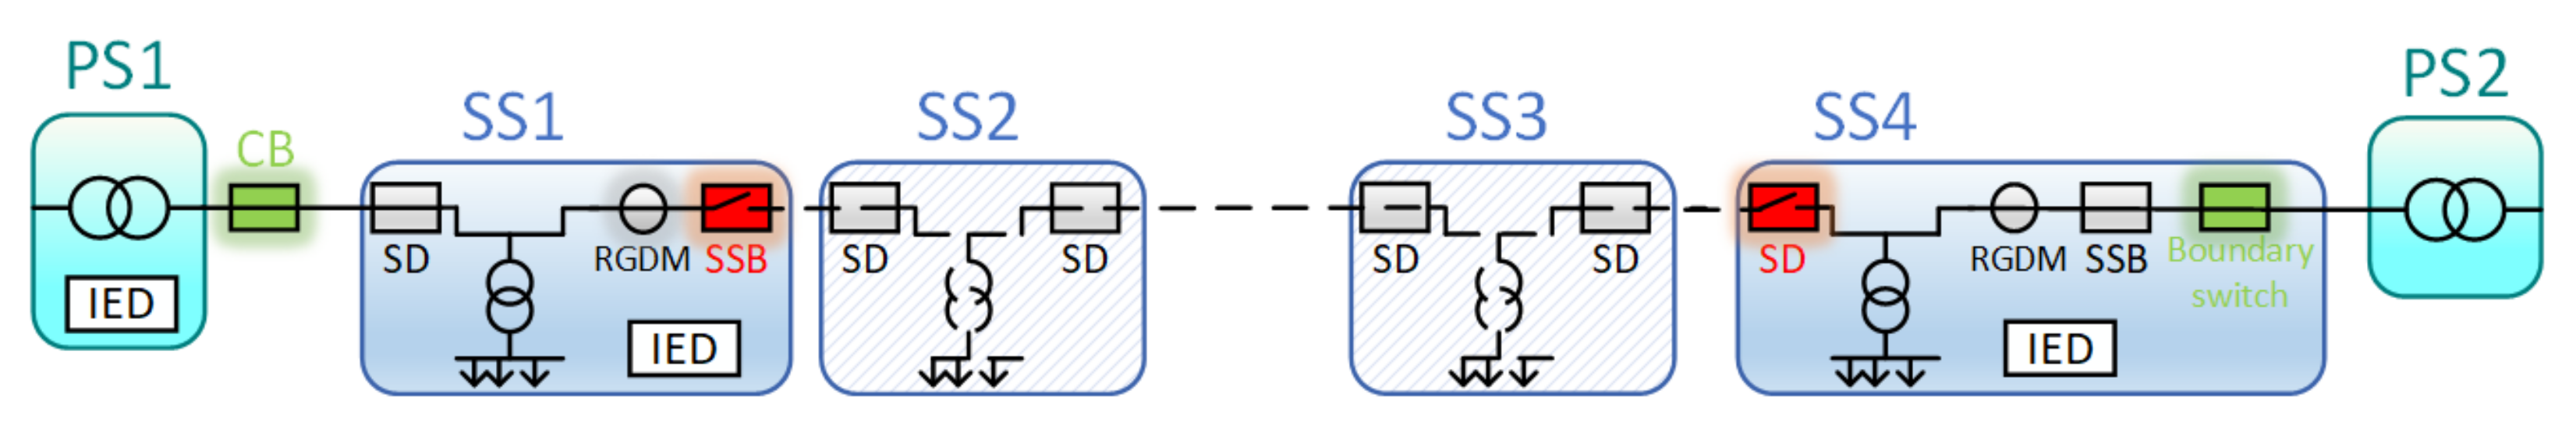
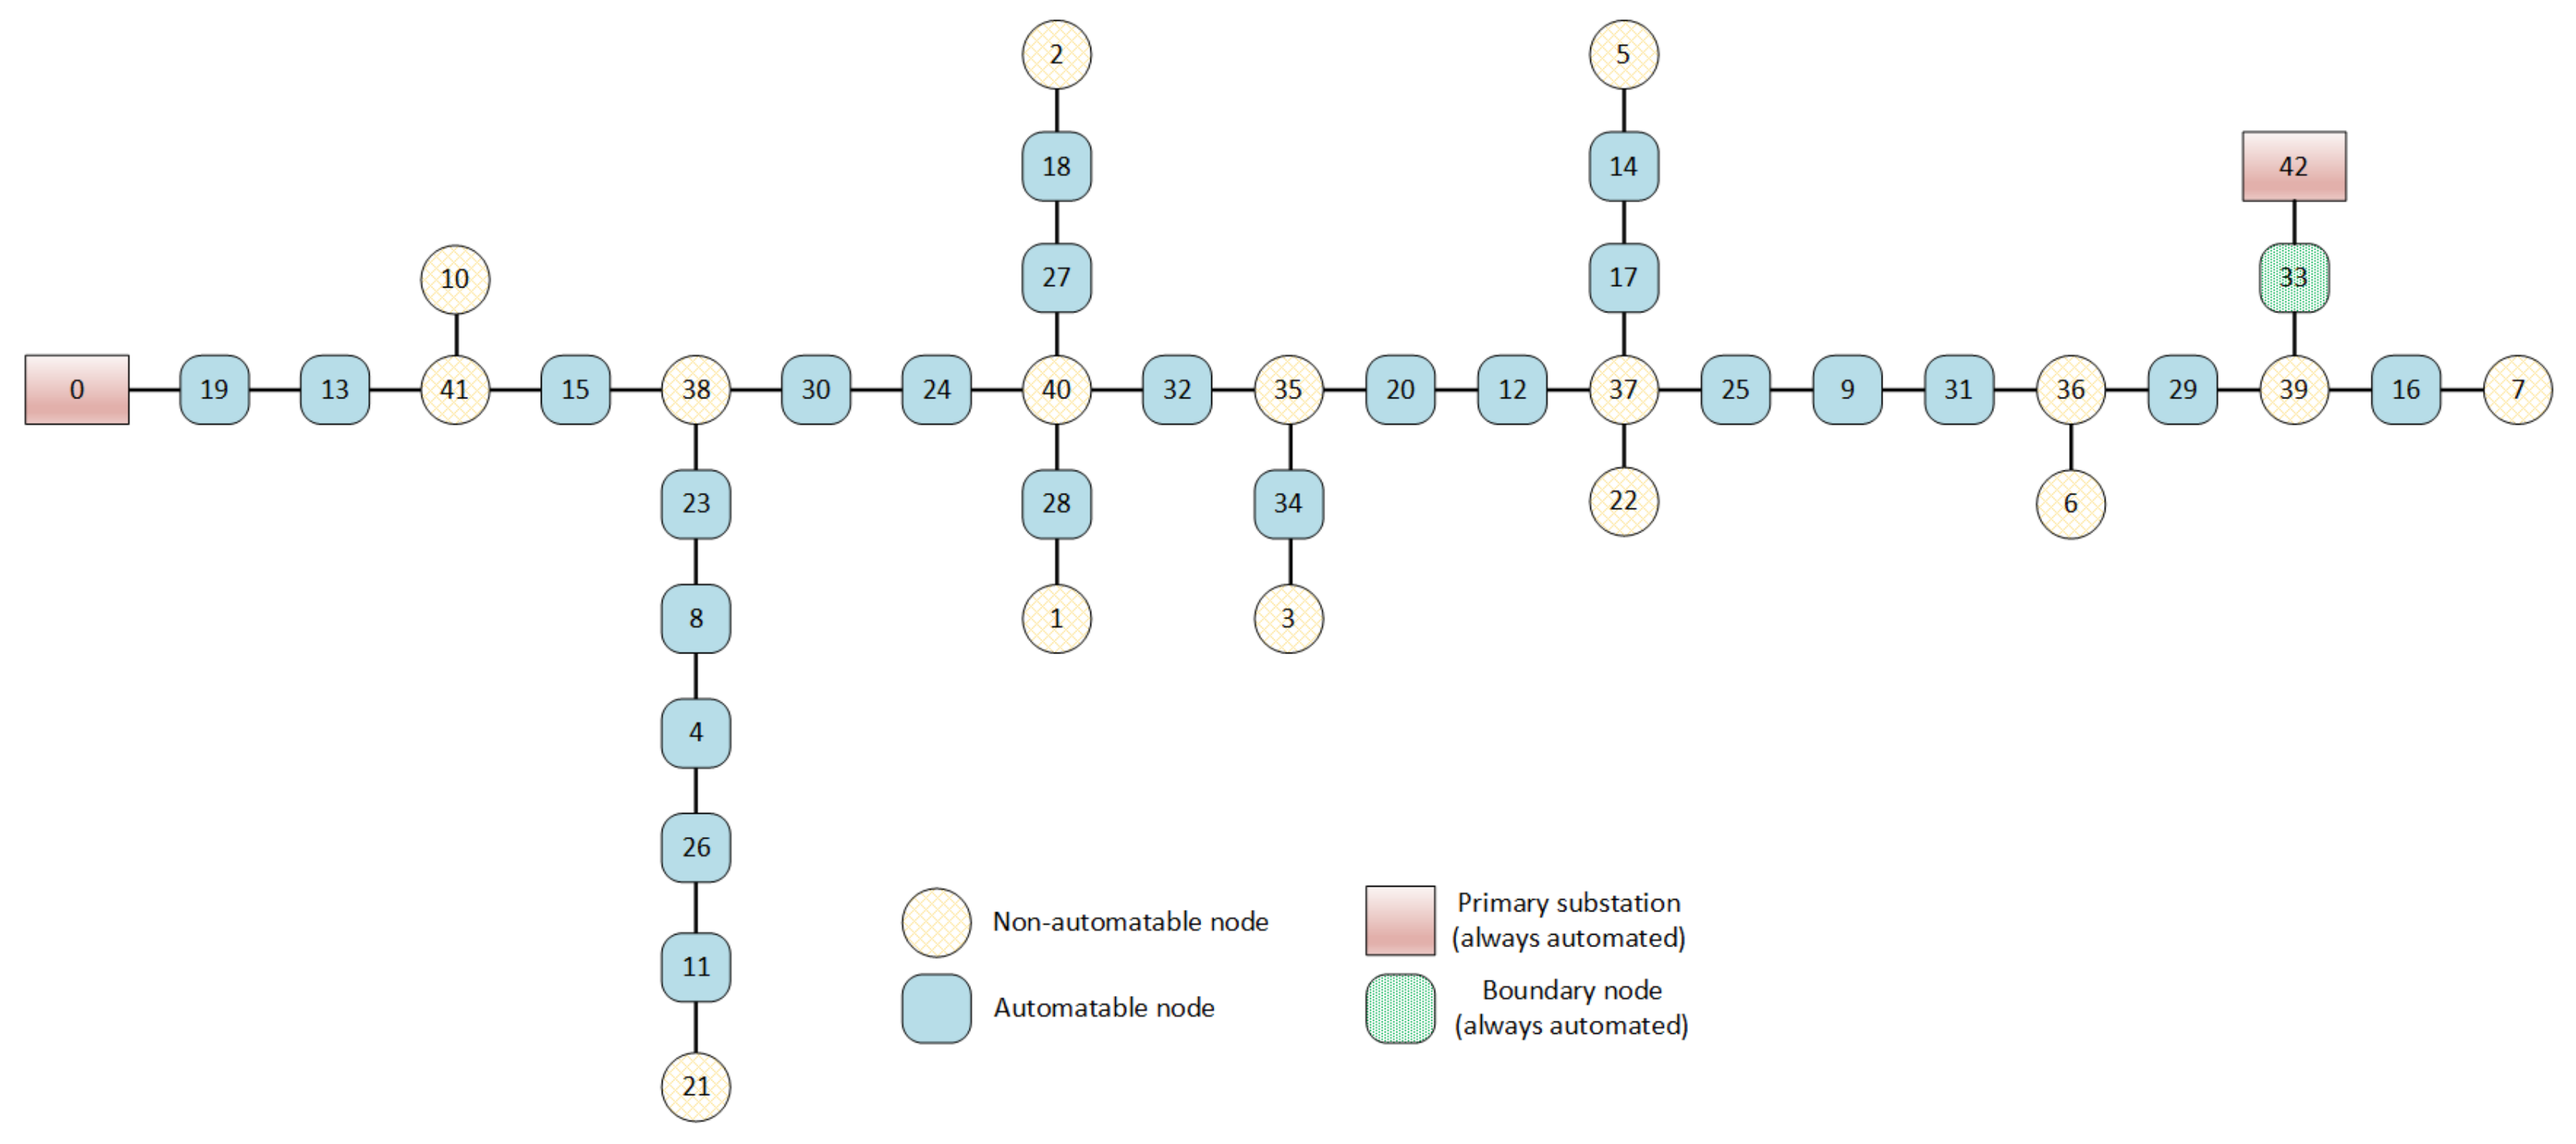
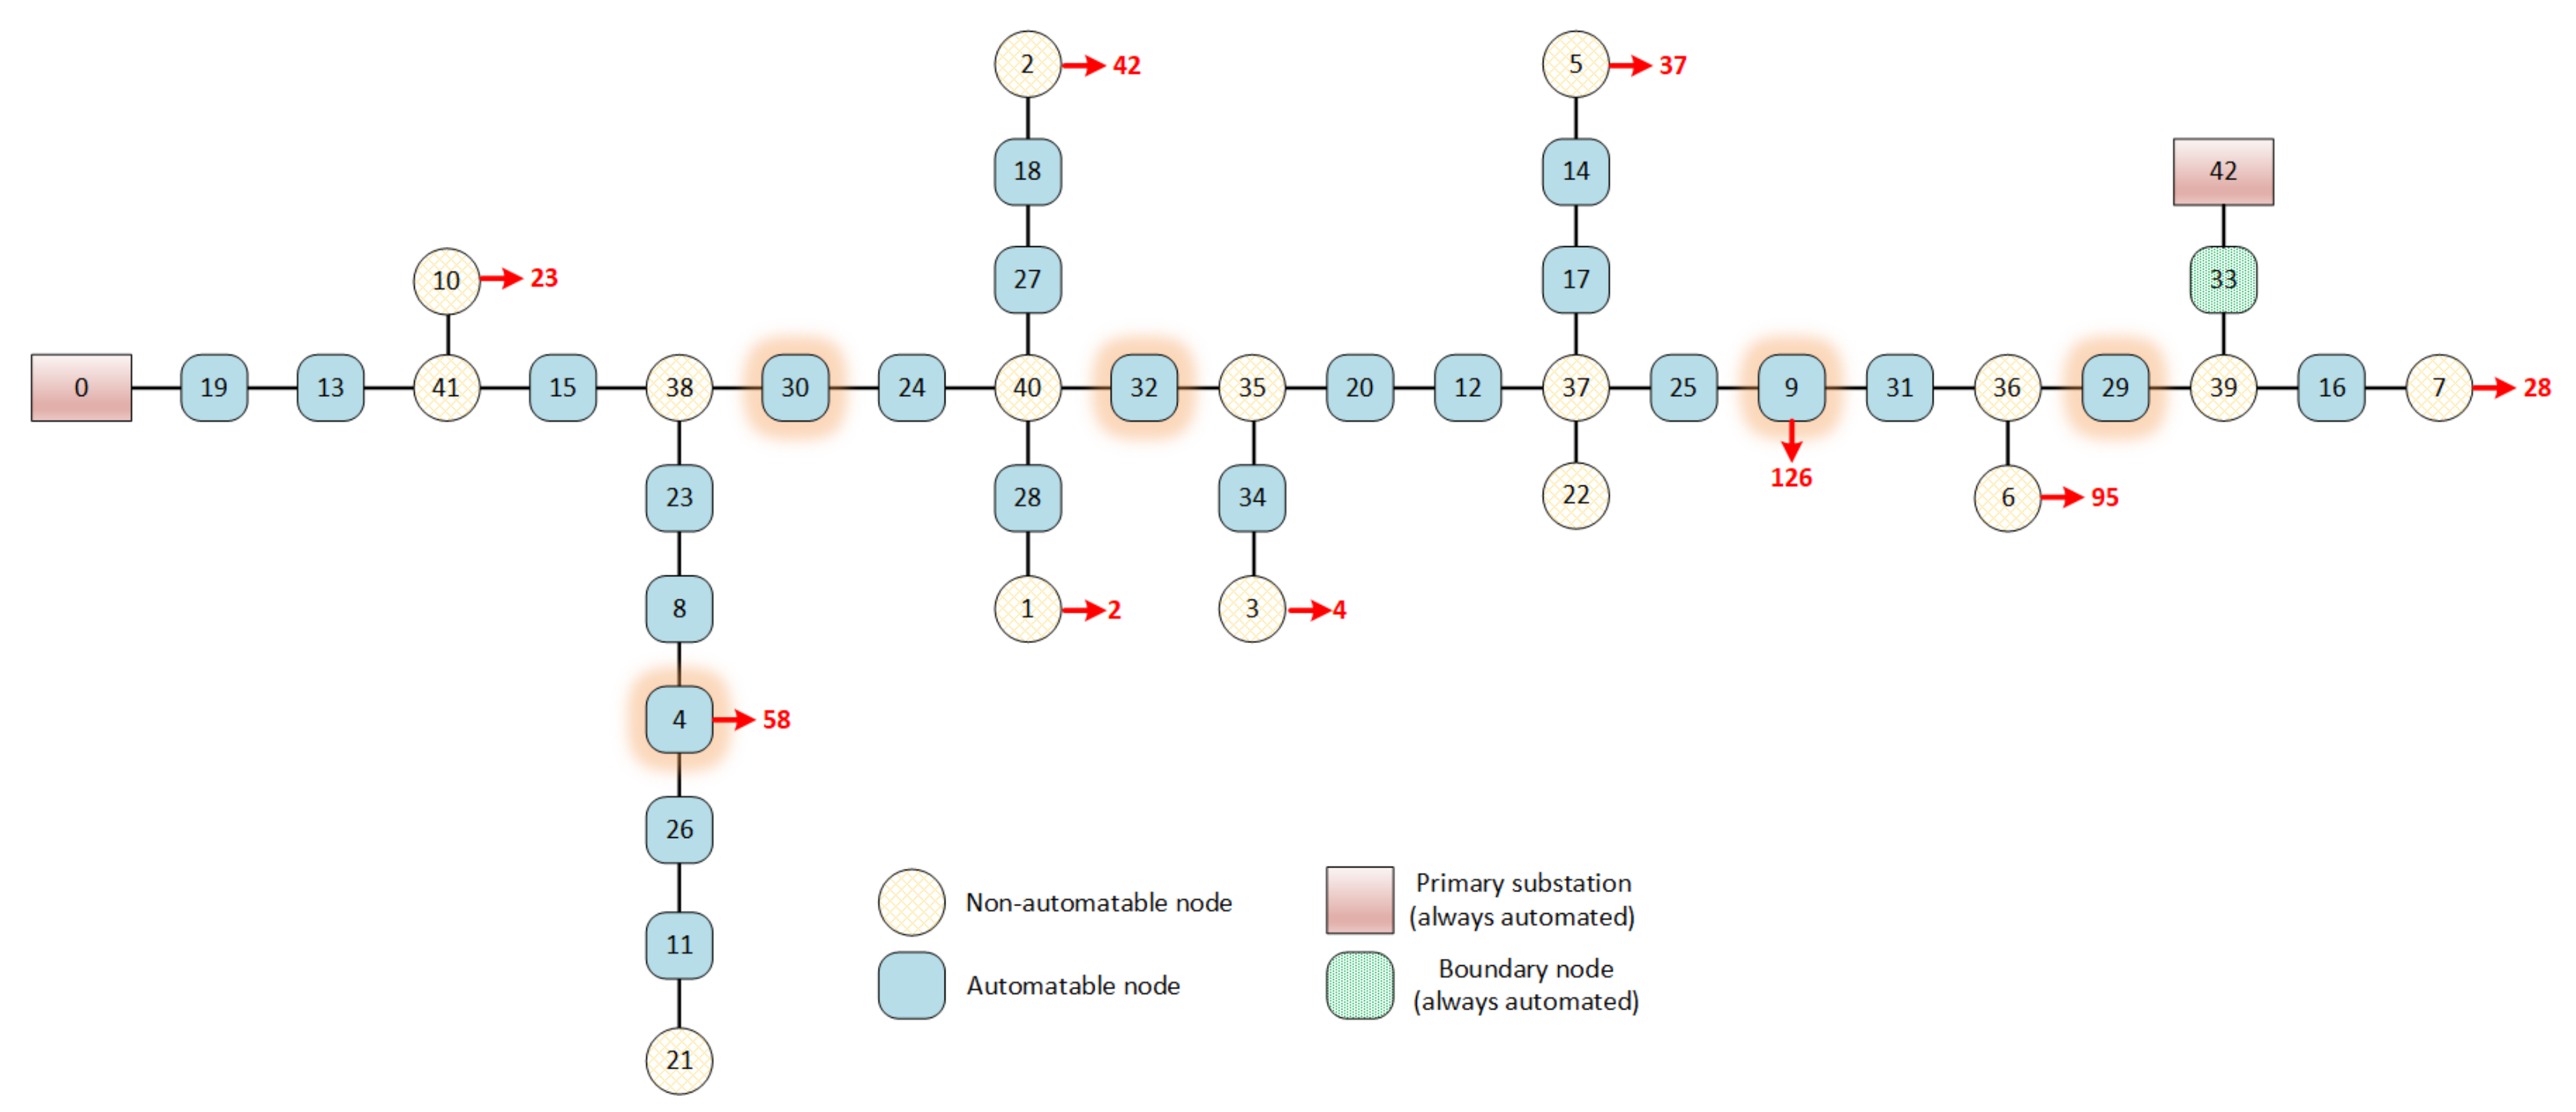
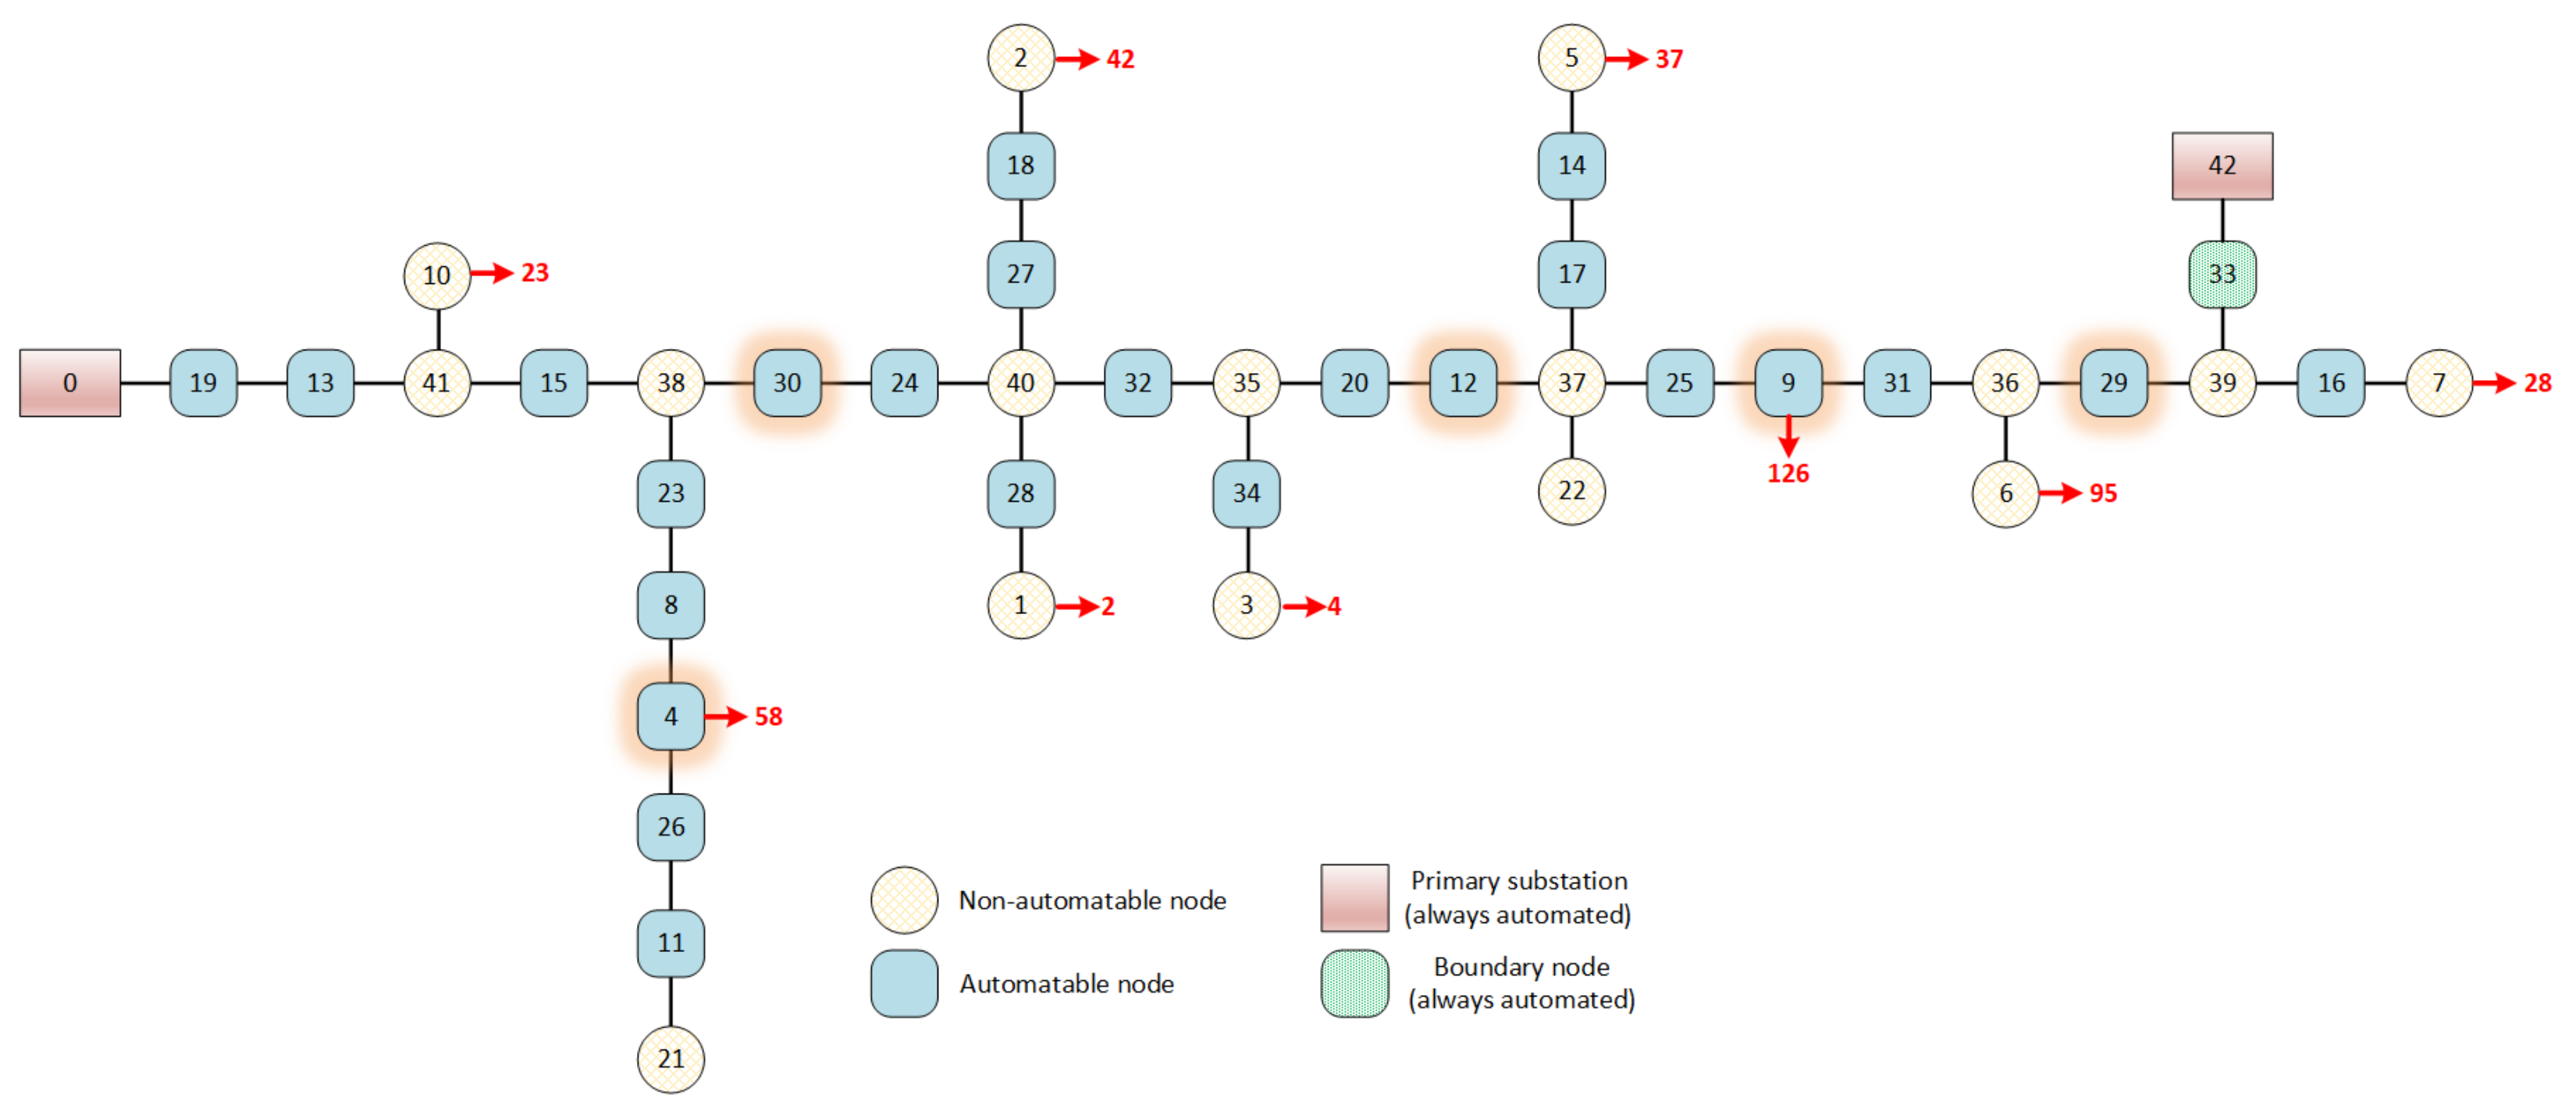
In the considered example, it was assumed that all the substations were automated in accordance with an SFS approach. It is understood that enabling SFS automation for all the nodes of the grid would represent an unsustainable expense for the electricity distributor. Moreover, the greater the number of IEDs in the line, the higher the number of exchanged messages during a fault; the technological limits of the transmission medium impose a maximum number of IEDs that can be installed. A feasible solution involves automating only some nodes of the network.
In Figure 4, the same line of Figure 3 has been considered, with the same fault, but only substations SS1 and SS4 are automated. In this case, the IED in SS1 senses the fault current and sends the Blind message to PS. After the waiting time has elapsed, the IED in SS1 has not received any Blind message (because SS2 is not automated) and commands the opening of the output breaker SSB. At the same time, the IED in SS1 transmits the Open message to the nearest automated substation downstream of the fault, i.e., SS4, which opens its input SD. Then the closure of the border switch for the re-powering is also commanded. In the current configuration, substations SS1 and SS4 are powered, while SS2 and SS3 are not powered.
In general, after a fault, the entire section between the two automated substations upstream and downstream of the fault remains disconnected. In the section between the two automated substations SS1 and SS4, the localization of the fault is carried out by commanding the SDs from the Operating Center or through the manual operation of the maintenance team, according to an algorithm based on dichotomy similar to that executed in FRG technique. The final result is the same—all users are powered and the section between SS2 and SS3, where the fault has occurred, is isolated. However, in this case, consumers powered by SS2 and SS3 experience a longer interruption, with a worsening of the quality of service indicators.

3. Optimal Location of Automated IEDs on a Grid Network

The problem of determining the optimal location of a set of SFS automated IEDs in the substations composing a smart grid in order to minimize the effects of potential faults occurring on the system can be approached as a network optimization problem. More precisely, it falls within the class of facility location problems, namely, a variant of the p-median problem (PMP) [18,19]. In the following, first we describe the IED optimal location problem (denoted as IED-OLP), related to basic assumptions and objectives. Then, we focused on its integer linear programming (ILP) formulation, derived by the one proposed in the literature for the PMP [20,21].

3.1. Problem Description

An MV smart grid can be naturally represented by a network whose nodes are the primary and secondary substations (PS and SS), the customers and the disconnectors, while the arcs represent the sections of the line. Each customer is served by a substation, whose total demand is given by the sum of all the demands of the supplied customers. Each arc, instead, is associated with a failure probability, computed on the basis of the fault time series (generally considering the faults that occurred in the five previous years). The smart grid can be protected by the deployment of two or more SFS automated IEDs to be installed in the grid nodes.
In order to tackle the problem, the following assumptions about customers and faults were made:
i.
We considered smart grids with radial topologies, composed of one primary line and one or more secondary lines. The primary line is composed of a single PS and several SSs. The primary line is powered by the PS and it can be re-powered through a boundary switch by a back-up PS in case of a fault.
ii.
Only LV customers were considered, since MV customers can be converted into equivalent LV customers;
iii.
Only the penalties determined by the number of LV customers interrupted for a long duration were considered. Indeed, in SFS automation, short duration interruptions (greater than 1 s and lower than 3 min) do not occur;
iv.
The case of double fault is not considered, and thus the faults are nonconcurrent. Moreover, the faults occurring in two sections are considered as disjoint and independent events.
We highlight that, since the network has a radial topology and each fault is associated with a single section, then the cardinality of the fault set is equal to or lower than the number of links composing the network.
On this basis, given a radial network protected by SFS automated IEDs, according to Figure 4, the LV customers can be clustered into three groups through consideration of their relative position with respect to the fault:
  • Upstream customers: they are located between the PS and the faulty section and they do not suffer any service interruption in case of a fault;
  • Faulty customers: they are located in the faulty section and they suffer a service interruption for the time needed to identify and isolate the faulty section and re-power the customers. The duration of the interruption is proportional to the number of SSs present in the faulty section;
  • Downstream customers: they are located after the faulty section and they are re-powered by the boundary switch within 1 s. Therefore, they do not experience any interruption.
Focusing on the faulty customers, the service interruption caused by a generic fault can be evaluated in terms of AV20 value, i.e., an indicator which reckons the penalty paid by distributors in case of service interruption. More precisely, with f , f F being a generic fault, the related AV20 value is computed as:
A V 20 f = c C t c
where C is the set of faulty customers and t c is the duration of the interruption experienced by each customer c, c C .
The AV20 value can be particularized in terms of all the potential faults occurring on the network with respect to a specific set of installed SFS automated IEDs (referred to as IED configuration in the following). Indeed, let us indicate a , a A as a generic IED configuration and by p f the occurrence probability of a fault f , f F . Then, the AV20 for a configuration a , a A , can be computed as:
A V 20 a = f F A V 20 f p f
Thus, the IED-OPL coincides with the problem of determining the IED configuration characterized by the lowest A V 20 a value.

3.2. Problem Setting and Formulation

The above described problem can be approached as a network optimization problem, namely, by a variant of the PMP.
Let us briefly recall the p-median main concept in order to better highlight the connections between the IED-OLP and the PMP. Let us consider a network G ( N , A ) , where N is the set of nodes and A is the set arcs. Moreover, let C be the weight values associated with the arcs. We define C ( i , j ) , i , j N , as the minimum distance between nodes i and j. Then, the distance between a subset N p of p nodes, N p N , and a generic node of the network j, is defined as: C ( N p , j ) = m i n i N p C ( i , j ) . Likewise, we can define the distance between a node set N p and all the other nodes of a network as: C ( N p ) = k N C ( N p , k ) .
On this basis, the p-median of a network is the subset of p nodes N p such that: C ( N p ) = m i n N p N [ s u m k N C ( N p , k ) ] . In other words, the PMP consists of determining simultaneously the location of p facilities in the nodes of a network and the one-to-one node-to-median assignments with the aim of minimizing the overall distance between the customers and the selected facilities.
As explained above, in the IED-OLP we want to simultaneously determine the location of a set of SFS automated IEDs in the substations of a smart grid and the fault-to-IED assignments with the aim of minimizing the AV20 value. On this basis, the correspondence between IEDs and medians, faults and nodes, and between distance values and AV20 values, is straightforward.
What makes the IED-OLP and the PMP different is the fact that in the IED-OLP the p located IEDs act in tandem. Thus, the derived value in the objective function does not depend on a one-to-one assignment but on a one-to-IED couple assignment with the two IEDs, which actually isolate the fault. Moreover, in the PMP we have a single distance value, while the AV20 value depends on the fault occurring on the network.
In order to formulate the problem, we define the following setting and parameters of a smart grid network G ( N , A ) :
Pset of primary substations;
Sset of secondary substations/disconnectors, which are the potential locations for the IEDs deployment;
Cset of customers, each of them supplied by one secondary substation;
N = P S set of all the nodes composing the network;
Aset of arcs ( i , j ) , i , j N , composing the network;
Fset of potential faults occurring on the network, or, in other words, set of the failure scenarios. Being each fault associated with an arc, these two sets coincide. In the following we keep the distinction in order to make the formulation more general;
pnumber of IEDs to be installed on the network;
F A I L i j f a penalty matrix reporting the AV20 value deriving from a fault f isolated by the couple of IEDs installed in nodes i and j. This value coincides with the AV20 value achievable when only a couple of IEDs is installed on the network.
On this basis, we define the following binary variables:
IED location variable, z s equal to 1 if an IED is installed in secondary
substation s , s S , 0 otherwise;
Assignment variable, x i j f equal to 1 if the couple of substations ( i , j ) , i , j S ,
intervenes to isolate the fault f , f F ,
0 otherwise.
On this basis, the IED-OLP can be modeled as follows:
( IED OLP NLP ) min z = f F i , j S F A I L i j f x i j f subject to :
i , j S x i j f = 1 f F
x i j f z i z j f F , i , j S
i S x i = p
x i j f { 0 , 1 } f F , i , j S
z i { 0 , 1 } i S
The objective function (3) minimizes the AV20 value overall the failure scenarios. Given the way the AV20 is computed, it minimizes the expected AV20 value overall the possible scenarios. The constraints in (5) are assignment constraints ensuring that all the fails have to be assigned to a couple of IEDs or, in other words, for all the potential fails there is a IED pair that isolates the fault. Obviously, the best couple will be selected on the basis of the objective function. The constraints in (3) are consistency constraints between IED location and assignment variables. They allow a fail f can be isolated by a couple ( i , j ) only if both nodes of the couple are active. Constraint (6) fixes the number of IEDs to be installed. Finally, constraints (7) and (8) fix the domain of the decision variables.
The IED-OLP-NLP formulation (3)–(8) is a nonlinear programming formulation due to nonlinear constraints (6). However, it can be easily linearized by the introduction of couple activation variable for each couple of IEDs. This variable, denoted as y i j , is equal to 1 if the couple of substations ( i , j ) , i , j S , is active and can intervene to isolate a fault, 0 otherwise. This allows to-reformulate the problem as follows:
( I E D - O L P - I L P 1 ) min z = f F i , j S F A I L i j f x i j f s u b j e c t t o : C o n s t r a i n t s (4 ) , (6 ) (8 )
x i j f y i j f F , i , j S
z i + z j y i j + 1 i , j S
z i y i j i , j S
z j y i j i , j S
y i j { 0 , 1 } i , j S
The constraints in (9) replace constraints (5), ensuring that a fail can be assigned to an IED couple if the couple is active. Constraints (10)–(12) link IED location variables and couple activation variables. More precisely, they model an AND condition, since the couple variable y i j can assume a value of 1 if both the variables z i and z j assume a value of 1. The constraints in (13) ensure the binary nature of the variables.
We highlight that it is possible also to integrate our formulation to take into account the possibility of more than two IEDs intervening in case of a fault. This situation arises when the radial network can be re-powered also by a PS of a secondary line. Indeed, in this case there is the possibility of having an intervention by two IEDs installed along the primary line and one installed along the secondary line, in order to isolate the fault and re-power the substations located on the secondary line. Thus, the formulation can be extended, specifying the assignment and the activation variables for all the potential of IEDs that can intervene.
Finally, as said above, the proposed model optimizes the system against the expected AV20 value or, in other words, the average failure case. It is possible to consider a min–max version of the problem, where we determine the deployment of the IEDs in order to minimize the worst-failure case. This can be easily achieved by replacing the min–sum objective function by a min–max objective function, which can be easily linearized as well. In particular, the model would become:
( IED OLP ILP 2 ) min w subject to :
w i , j S F A I L i j f x i j f f F Constraints (4 ) , (6 ) (13 )

4. Assessment on a Real Mv Grid

The proposed IED-OLP formulations (ILP1 and ILP2) have been realized on a real radial network topology with an aim that is twofold. On the one hand, we analyzed the real advantages in terms of the AV20 value obtainable when equipping the network with a varying number of IEDs. On the other hand, we proved the efficiency and the effectiveness of the proposed ILP-based solution method to determine the optimal solution of the IED-OPL.
The considered network is sketched out in Figure 5, where each node has been reported with its ID number. It is made up of 41 nodes (i.e., | N | = 41 ) plus a primary substation with an ID number equal of 0. The term node is used to identify the secondary substations supplying customers, as well as disconnectors along the line or an intersection node. Only substations and disconnectors can be automated and, therefore, the network is characterized by 24 potential IED locations ( | S | = 24 ).
As said above, the considered network has a tree structure, and therefore the nodes are connected by 40 sections of different lengths [22]. We assumed a one-to-one correspondence between sections and failure scenarios; therefore, | F | = 40 and each scenario represent a section failure. Finally, we point out that the considered grid serves 415 customers distributed among 30% of the grid nodes in the real applications. In our experimentation, we generated four additional customer distributions (CDs) over the grid nodes. We additionally considered that the 415 customers were distributed over 50%, 70%, 90% and 100% of the grid nodes.
The ILP formulations have been solved by the off-the-shelf optimization software, FICO Xpress-MP 8.9, and the experiment was run on an Intel(R) Core(TM) i7-9750H CPU @ 2.60 GHz Processor and 16.00 GB RAM.
As an example, in Figure 6, the provided solution, considering the installation of five IEDs, is shown. The red numbers with the red arrows represent the customers supplied by the secondary substations. The nodes representing the optimal position of the IEDs are displayed with a red shade.
In Table 1, we report the AV20 value over all the failure scenarios for different numbers of installed IEDs where each row corresponds to a different customer distribution. In particular, we solved the IED-OLP-ILP1 with a number of IEDs belonging to the range (2, 8). In terms of AV20 value variations for the different customer distributions, we can observe that, generally, the AV20 value increases when customers are distributed among a greater number of nodes. In terms of the benefits of the AV20 value when installing more IEDs, obviously the best values are obtained with the highest number of installed IEDs. Indeed, we can observe that, on average, with eight IEDs the corresponding AV20 value is the 25% of the AV20 value with two IEDs. However, there is a trade-off between the penalty costs arising from the failures and the costs of IED deployment and maintenance that have to be evaluated by the supplier case by case. Nevertheless, we point out that even by installing only four IEDs it is possible to reduce the AV20 value of the 50%.
In Table 2, we report the running times for the solution of the IED-OLP-ILP1. Moreover, to prove the effectiveness of the proposed method, we compare its running times with those of an exhaustive enumeration of all the potential IED configurations computed through a brute force approach (BF).
We can observe that when the number of IEDs is small, then the BF approach shows running times similar to those of the ILP. However, considering a greater number of IEDs, we can observe that the running times of BF are even two orders of magnitude higher than those of the ILP. On average, we can conclude that the proposed approach, as expected, outperforms in terms of running times a BF approach, proving its effectiveness.
Finally, for the sake of completeness, we report, in Table 3, the solution of the IED-OLP-ILP2 formulation varying the number of IEDs.
We can observe that the benefit in terms of worst-failure case arising from the placement of IEDs are similar to those of the overall failure case. Indeed, considering the AV20 value with 2 IEDs as a reference, if we install four and eight IEDs we are able to reduce the AV20 value for 50% and 75%, respectively.
In Figure 7, the provided solution with five IEDs and CD = 30% is shown. It can be seen that the optimal IEDs position changed when compared with that provided by IED-OLP-ILP1 formulation reported in Figure 6.
To better highlight the differences between the IED-OLP-ILP1 and IED-OLP-ILP2 solutions, we reported, in Table 4, the IEDs selected in the respective optimal solutions (denoted in the following with z and w, respectively).
We can observe that the solution in terms of IEDs changes significantly varying the customer distribution and the considered objective. However, by fixing these two parameters, we can observe that often on the tested instance given a solution with p IEDs, the solution with p + 1 IEDs is equal to the previous one with the addition of a new IED not considered before. If this behavior is confirmed for a specific real application, then the company could exploit it by deploying, in successive steps, the different IEDs on the basis of the company requirements.

5. Conclusions

In the paper, the authors proposed an ILP-based method for determining the optimal location of a limited number of IEDs in an MV smart grid. The problem has been modeled as an original variant of the p-median problem, referred to as IED-OLP, which takes into account that IEDs always act in pairs.
In particular, the proposed IED-OLP formulation minimizes the AV20 index, i.e., a parameter establishing the economic penalty suffered by the energy supplier, as a result of the inefficiency caused to costumers due to a fault in the network. The proposed approach has been tested using a real radial network, constituted of 41 nodes, considering different customer distributions and varying the number of IEDs to be installed within the range (2–8).
The proposed method returns optimal solutions minimizing the AV20 value (average and worst cases) for all the tested instances. This allows the energy provider/distributor to easily evaluate the economic penalty and determine the best trade-off between the penalties and the installation costs of the automated SFS system.
In the experimental results, the efficiency and the effectiveness of the proposed approach have been shown also in terms of computation time with respect to a brute force approach. The brute force approach has computation times that exponentially increase with the number of possible solutions. On the contrary, the proposed approach always ensures running times of a few seconds, regardless of the input conditions.
Future research directions naturally include the development of a scalable heuristics for large-scale instances. In addition, it may be worth exploring other variants of the proposed formulations that consider different strategic, tactical and operational issues (e.g., IED installation costs, online computation of the AV20 value).

Author Contributions

Conceptualization, A.F., A.L. and C.S.; data curation, V.C. and A.M.; formal analysis, A.L. and C.S.; methodology, V.C., A.L. and C.S.; resources, V.C. and A.F.; software, V.C., A.M. and C.S.; validation, F.B. and A.M.; writing—original draft, F.B. and A.M.; writing—review and editing, A.F., A.L. and C.S. All authors have read and agreed to the published version of the manuscript.

Funding

This research received no external funding.

Institutional Review Board Statement

Not applicable.

Informed Consent Statement

Not applicable.

Acknowledgments

The authors would like to thank e-distribuzione for the technical support and for getting the chance to work with real networks and data for their experiments.

Conflicts of Interest

The authors declare no conflict of interest.

References

  1. 568/2019/R/EEL: Update of the Tariff Regulation of Electricity Transmission, Distribution and Metering Services for the Period 2020–2023; Standard, Regulatory Authority for Energy; Networks and Environment (ARERA): Milan, Italy, 2019. (In Italian)
  2. Bonavolontà, F.; Caputi, C.; Liccardo, A.; Teotino, A. Protection of MV smart grid based on IoT technology. In Proceedings of the 2019 II Workshop on Metrology for Industry 4.0 and IoT (MetroInd4. 0&IoT), Naples, Italy, 4–6 June 2019; pp. 112–116. [Google Scholar]
  3. Cepeda, C.; Orozco-Henao, C.; Percybrooks, W.; Pulgarín-Rivera, J.D.; Montoya, O.D.; Gil-González, W.; Vélez, J.C. Intelligent fault detection system for microgrids. Energies 2020, 13, 1223. [Google Scholar] [CrossRef] [Green Version]
  4. Nam, S.R.; Ko, W.H.; Key, S.; Kang, S.H.; Lee, N.H. IEC 61850-Based Centralized Protection against Single Line-To-Ground Faults in Ungrounded Distribution Systems. Energies 2021, 14, 722. [Google Scholar] [CrossRef]
  5. IEC 61850: Communication Networks and Systems in Substations; Standard, International Electrotechnical Commission: Geneva, Switzerland, 2013.
  6. Blair, S.M.; Booth, C.D. A practical and open source implementation of IEC 61850-7-2 for IED monitoring applications. IEEE Trans. Smart Grid 2015, 6, 1992–1993. [Google Scholar] [CrossRef] [Green Version]
  7. Angrisani, L.; Bonavolontà, F.; Liccardo, A.; Schiano Lo Moriello, R. On the use of LORA technology for logic selectivity in MV distribution networks. Energies 2018, 11, 3079. [Google Scholar] [CrossRef] [Green Version]
  8. Della Giustina, D.; Alvarez de Sotomayor, A.; Dedè, A.; Ramos, F. A Model-Based Design of Distributed Automation Systems for the Smart Grid: Implementation and Validation. Energies 2020, 13, 3560. [Google Scholar] [CrossRef]
  9. Dede, A.; Della Giustina, D.; Franzoni, F.; Pegoiani, A. IEC 61850-based logic selectivity scheme for the MV distribution network. In Proceedings of the 2014 IEEE International Workshop on Applied Measurements for Power Systems Proceedings (AMPS), Aachen, Germany, 24–26 September 2014; pp. 1–5. [Google Scholar]
  10. Pala, D.; Proserpio, G.; Bionda, E.; Pugliese, S.; Della Giustina, D. IEC CIM-61850 harmonization—The logic selectivity case. In Proceedings of the 2016 IEEE 16th International Conference on Environment and Electrical Engineering (EEEIC), Florence, Italy, 7–10 June 2016; pp. 1–5. [Google Scholar]
  11. Bezerra, J.R.; Barroso, G.C.; Leão, R.P.S.; Sampaio, R.F. Multiobjective optimization algorithm for switch placement in radial power distribution networks. IEEE Trans. Power Deliv. 2014, 30, 545–552. [Google Scholar] [CrossRef]
  12. Das, S.; Santoso, S.; Gaikwad, A.; Patel, M. Impedance-based fault location in transmission networks: Theory and application. IEEE Access 2014, 2, 537–557. [Google Scholar] [CrossRef]
  13. Dutta, P.; Guan, Y.; Kezunovic, M. Use of substation IED data for improved alarm processing and fault location. In Proceedings of the 2008 40th North American Power Symposium, Calgary, AB, Canada, 28–30 September 2008; pp. 1–8. [Google Scholar]
  14. Gong, Y.; Guzmán, A. Distribution feeder fault location using IED and FCI information. In Proceedings of the 2011 64th Annual Conference for Protective Relay Engineers, College Station, TX, USA, 11–14 April 2011; pp. 168–177. [Google Scholar]
  15. Heidari, S.; Fotuhi-Firuzabad, M.; Lehtonen, M. Planning to equip the power distribution networks with automation system. IEEE Trans. Power Syst. 2017, 32, 3451–3460. [Google Scholar] [CrossRef]
  16. Prévé, C. Protection of Electrical Networks; John Wiley & Sons: Hoboken, NJ, USA, 2013. [Google Scholar]
  17. Sallam, A.A.; Malik, O.P. Electric Distribution Systems; John Wiley & Sons: Hoboken, NJ, USA, 2018. [Google Scholar]
  18. Masone, A.; Sforza, A.; Sterle, C.; Vasilyev, I.; Masone, A.; Sterle, C.; Vasilyev, I.; Ushakov, A.; Sforza, A.; Sidorov, D.; et al. A graph clustering based decomposition approach for large scale p-median problems. Int. J. 2018, 13, 229–242. [Google Scholar]
  19. Masone, A.; Sterle, C.; Vasilyev, I.; Ushakov, A. A three-stage p-median based exact method for the optimal diversity management problem. Networks 2019, 74, 174–189. [Google Scholar] [CrossRef]
  20. Tansel, B.C.; Francis, R.L.; Lowe, T.J. State of the Art—Location on Networks: A Survey. Part I: The p-Center and p-Median Problems. Manag. Sci. 1983, 29, 482–497. [Google Scholar] [CrossRef] [Green Version]
  21. Mladenović, N.; Brimberg, J.; Hansen, P.; Moreno-Pérez, J.A. The p-median problem: A survey of metaheuristic approaches. Eur. J. Oper. Res. 2007, 179, 927–939. [Google Scholar] [CrossRef] [Green Version]
  22. Masone, A.; Nenni, M.E.; Sforza, A.; Sterle, C. The Minimum Routing Cost Tree Problem. Soft Comput. 2019, 179, 2947–2957. [Google Scholar] [CrossRef]
Figure 1. Automation steps according to the FRG approach; (a) normal operation, (b) fault occurrence, (c) CB opening, (d) SDs opening, (e) CB closing, (f) SD of SS1 closing, (g) SD of SS2 closing and fault current detection, (h) circuit breaker opening, (i) SD of SS2 opening, (j) CB closing and fault isolation.
Energies 14 03346 g001
Figure 2. Automation steps according to the SFS approach; (a) fault occurrence and detection by RGDMs, (b) blind messages are sent upstream to prevent CB and SSB opening, (c) SS2 opens its SSB, since it does not receive the blind message.
Energies 14 03346 g002
Figure 3. SFS automation steps with re-powering from a downstream PS; (a) fault occurrence and detection by RGDMs, (b) blind messages are sent upstream to prevent CB and SSB opening, (c) since it does not receive the blind message, SS2 opens its SSB and sends downstream a message to open the SD of the successive substation, (d) the substation propagates downstream to the other substations a message to close boundary switch, (e) SS3 and SS4 are re-powered by closing the boundary switch.
Energies 14 03346 g003
Figure 4. SFS approach with only two automated nodes.
Energies 14 03346 g004
Figure 5. Scheme of the grid adopted for the assessment.
Energies 14 03346 g005
Figure 6. Optimal IED positions provided by IED-OLP-ILP1.
Energies 14 03346 g006
Figure 7. Optimal IEDs position provided by IED-OLP-ILP2.
Energies 14 03346 g007
Table 1. AV20 value over all the failure scenarios when varying the number of IEDs in (2–8).
CD2345678
30%4532327924331742146712951194
50%5122307619921229859650595
70%6114442031142312208219041765
90%6086436631202435199617871647
100%6334447932522437200018111651
Table 2. Comparison of the running times of the ILP and the brute force approaches.
CDSM2345678Average
30%ILP5.43.24.91.5221.62.9
BF0.20.73.311.940156.4432.192.1
50%ILP7.57.22.75.42.83.42.94.6
BF0.31.23.3126.2379.6134.9381.2146.7
70%ILP6.74.84.42.61.71.21.13.2
BF0.71.44.519.850.7157.7370.786.5
90%ILP7.75.57.94.13.42.34.35.0
BF0.31.25.419.853174.2503.7108.2
100%ILP8.46.64.35.63.13.74.85.2
BF0.41.55.621.268.8222.1482.4114.6
Table 3. AV20 worst-failure case value varying the number of IEDs in (2, 8).
CD2345678
30%23718110592685757
50%22814512170646060
70%260209122122122122122
90%3611901631131019887
100%271210141105927170
Table 4. Comparison of the IEDs used in the optimal solution considering the two objective functions.
CDOF2345678
30%z9, 249, 30, 324, 9, 30, 324, 9, 29, 30, 324, 9, 12, 29, 30, 324, 9, 12, 15, 24, 29, 324, 9, 12, 15, 24, 29, 31, 32
w9, 249, 29, 304, 9, 24, 294, 9, 12, 29, 304, 9, 15, 24, 29, 324, 9, 13, 29, 30, 31, 324, 8, 9, 12, 13, 24, 29, 31
50%z20, 249, 24, 329, 20, 24, 324, 9, 20, 24, 324, 9, 16, 20, 24, 324, 9, 15, 16, 20, 24, 324, 9, 15, 16, 20, 24, 32, 34
w24, 259, 30, 324, 9, 24, 324, 16, 20, 24, 324, 15, 20, 24, 29, 324, 15, 16, 20, 24, 31, 324, 9, 13, 16, 17, 20, 24, 32
70%z20, 2424, 31, 3213, 24, 31, 3213, 20, 24, 31, 3213, 15, 20, 24, 31, 3213, 15, 20, 24, 27, 31, 324, 13, 15, 20, 24, 27, 31, 32
w20, 3020, 24, 2613, 24, 31, 324, 9, 13, 24, 324, 9, 13, 16, 24, 324, 8, 9, 11, 13, 24, 324, 8, 9, 12, 13, 23, 24, 32
90%z12, 248, 12, 248, 12, 24, 328, 9, 12, 24, 328, 9, 12, 15, 24, 324, 8, 9, 12, 15, 24, 324, 8, 9, 12, 15, 24, 30, 32
w12, 308, 20, 308, 15, 20, 244, 15, 25, 30, 324, 8, 13, 25, 30, 3215, 20, 23, 24, 26, 31, 324, 15, 20, 23, 24, 25, 30, 32
100%z12, 3025, 30, 3215, 25, 30, 329, 12, 15, 30, 3212, 15, 25, 29, 30, 324, 12, 15, 24, 25, 29, 324, 12, 15, 24, 25, 29, 30, 32,
w30, 3115, 24, 259, 12, 15, 308, 13, 20, 24, 314, 12, 15, 30, 31, 324, 9, 12, 15, 29, 30, 329, 15, 20, 24, 26, 29, 30, 32
Publisher’s Note: MDPI stays neutral with regard to jurisdictional claims in published maps and institutional affiliations.

