Article

Comparative Study on the Calendar Aging Behavior of Six Different Lithium-Ion Cell Chemistries in Terms of Parameter Variation

1
Technische Hochschule Ingolstadt, 85049 Ingolstadt, Germany
2
Hochschule Aalen—Technik und Wirtschaft, 73430 Aalen, Germany
*
Author to whom correspondence should be addressed.
Submission received: 10 May 2021 / Revised: 27 May 2021 / Accepted: 1 June 2021 / Published: 7 June 2021
(This article belongs to the Special Issue High-Capacity Cells and Batteries for Electric Vehicles)

Abstract

:
The degradation of lithium-ion cells is an important aspect, not only for quality management, but also for the customer of the application like, e.g., scooters or electric vehicles. During the lifetime of the system, the overall health on the battery plays a key role in its depreciation. Therefore, it is necessary to monitor the health of the battery during operation, i.e., cycle life, but also during stationary conditions, i.e., calendar aging. In this work, the degradation due to calendar aging is analyzed for six different cell chemistries in terms of capacity degradation and impedance increase and their performance are being compared. In a new proposed metric, the relative deviations between various cells with the exact identical aging history are being analyzed for their degradation effects and their differences, which stands out in comparison to similar research. The capacity loss was found to be most drastic at 60 °C and at higher storage voltages, even for titanate-oxide cells. LiNiMnCoO2 (NMC), LiNiCoAlO2 (NCA) and Li2TiO3 (LTO) cells at 60 °C showed the most drastic capacity decrease. NMC and NCA cells at 60 °C and highest storage voltage did not show any open circuit voltage, as their current interrupt mechanism triggered. The effect of aging shows no uniform impact on the changes in the capacity variance when comparing different aging conditions, with respect to the evaluated standard deviation for all cells. The focus of this work was on the calendar aging effect and may be supplemented in a second study for cyclic aging.

1. Introduction

It is difficult to imagine a world, where portable systems like smartphones, laptops, e-scooters and other kinds of micro mobility could exist without any kind of portable power source, like lithium-ion batteries (LiB). Of course, such systems need to be designed in such a way, to work properly during their whole operating time. It is thus important not to only analyze the electrical performance after production in pristine condition, but also a few years after operation and usage. Similar to almost every technical component, lithium-ion cells also suffer from degradation over time. In order to have reliable cells that last for as long as possible, their actual performance needs to be studied at crucial environmental conditions, such as at high temperatures [1]. In addition to the pure electrical performance, it is also important to check for any deviations during the aging phase, as the cell with the lowest performance may be the weakest link in the battery pack and may result in drawbacks for the complete pack, depending on the cell configuration.
The aim of this work is to provide a common ground and a direct comparison between different commercially available cylindrical cells with various electrode materials and to analyze their calendar aging behavior during completely synchronized aging conditions. This means, to have identical procedures that run simultaneously during the aging step as well as for the checkup procedure. This allows an analysis of six different cell chemistries at three different storage voltages and three different storage temperatures, which provides a novel approach. On top of that, the synchronized aging conditions allow for a follow-up analysis on any statistical deviations on the electrical performance, which may result from the effect of aging. The investigated cells were chosen in order to give an overall comparison in technology and with respect to different cell requirements, i.e., a longtime solar power storage cell may differ to that of e-scooters or other micro-mobility applications. In addition, the goal is to analyze differences between the six cell chemistries that may occur during the concurrent storage duration at high temperatures in terms of capacity degradation and impedance increase [1]. For this analysis, calendar aging was chosen, as it makes up a greater proportion in applications like electric vehicles or micro mobility compared to cyclic aging, because the system is most of the time at rest and thus not being charged or discharged [2]. As described in literature, capacity loss and increase of impedance of lithium-ion batteries is observed at shelf-life experiments at raised temperatures [2,3,4,5,6,7,8,9,10,11]. It is generally agreed upon that the formation of the solid electrolyte interface (SEI) plays an important role in the electrical performance of lithium-ion cells, which contain a graphite anode, during aging [11]. For electrochemical reactions, the correlation between temperature and reaction speed is best described by Arrhenius and therefore often used for modelling temperature dependency [3,4,8]. It explains that a higher temperature leads to faster reaction times and thus faster parasitic side reactions, leading to higher capacity loss and impedance increase [1,2,3,4,8,12]. As described before, the calendar aging performance of lithium-ion batteries has been analyzed in past studies for various chemistries [1,2,3,4,5,6,7,8,9,10,11,12], but none has included this huge amount of different cell chemistries during a single investigation with identical aging parameters, as well as a high sample size per aging condition. Additionally, the statistical evaluation of the capacity and impedance deviation has been carried out, by utilizing a suitable metric, in order to track deviation changes due to calendar aging. Not only the aging comparison between various cell chemistries, but also the statistical approach stands out in comparison to similar research in that field [1].

2. Materials and Methods

2.1. Selected Cells

For the proposed goal of analyzing the aging performance with special focus on the statistical behavior, commercially available 18,650 cylindrical cells are selected for investigation. Six cell types with nominal capacity ranges from 1.3 to 2.6 Ah are chosen for their commercial availability and accessible information about the electrode material. Further attributes of the cells, such as capacity, manufacturer and electrode materials are given in Table 1. The displayed cut-off voltages UMin and UMax are taken from the datasheets provided by the manufacturers. In the rightmost column, the total amount of all studied cells is displayed. LTO and LMO cells were hard to obtain in larger quantities from retail sellers; therefore, a reduced set of this cell type was available for this comparison. The relation of the cutoff voltages, the aging voltages and the open circuit voltage (OCV) in general is displayed in Figure 1.
The actual measured capacities of the cells and the average capacity are discussed in the results-section.

2.2. Measurement Setup

Before any accelerated aging conditions were applied, initial measurements were conducted at laboratory conditions (20 ± 2 °C), as described in Section 2.2.1, Section 2.2.2, Section 2.2.3, Section 2.2.4, Section 2.2.5, Section 2.2.6. All accuracies of the mentioned equipment refer to the values described in the data sheet of each device, respectively.

2.2.1. AC Impedance Measurement

The AC impedance measurement of each cell was carried out at a frequency of 1 kHz and at room temperature with an impedance tester (Battery HiTESTER HIOKI 3554, accuracy ±0.8% rdg. ±6 dgt in the 300 mΩ range [13]). This measurement was performed to check each cell for any electrical abnormalities and to verify the general homogeneity of each batch of test subjects for the aging procedure.

2.2.2. Initial Cycles

Initial cycles on all cells were performed, to reduce the effect of initial behavior of new battery cells, i.e., the capacity rise during the first few cycles [4] and thus to better examine the impact of aging on the long-term performance. All the cells were clamped into the cylindrical cell holding mechanism of the battery tester (Neware BTS 4008-5V6A, accuracy ±0.05% of full scale for both current ranges: 0.5–100 mA and 0.1–6 A and for voltage 25 mV–5 V [14]), as can be seen in Figure 2 in the fourth panel. The lithium-titanate-oxide (LTO) cells have two pins on a single side and thus could not fit into the cell holder, as visible in Figure 2 in the first panel. These cells were connected via a cable with crocodile clamp adapter. Both adapter and cylindrical cell clamps are equipped with four-wire measurement capability.

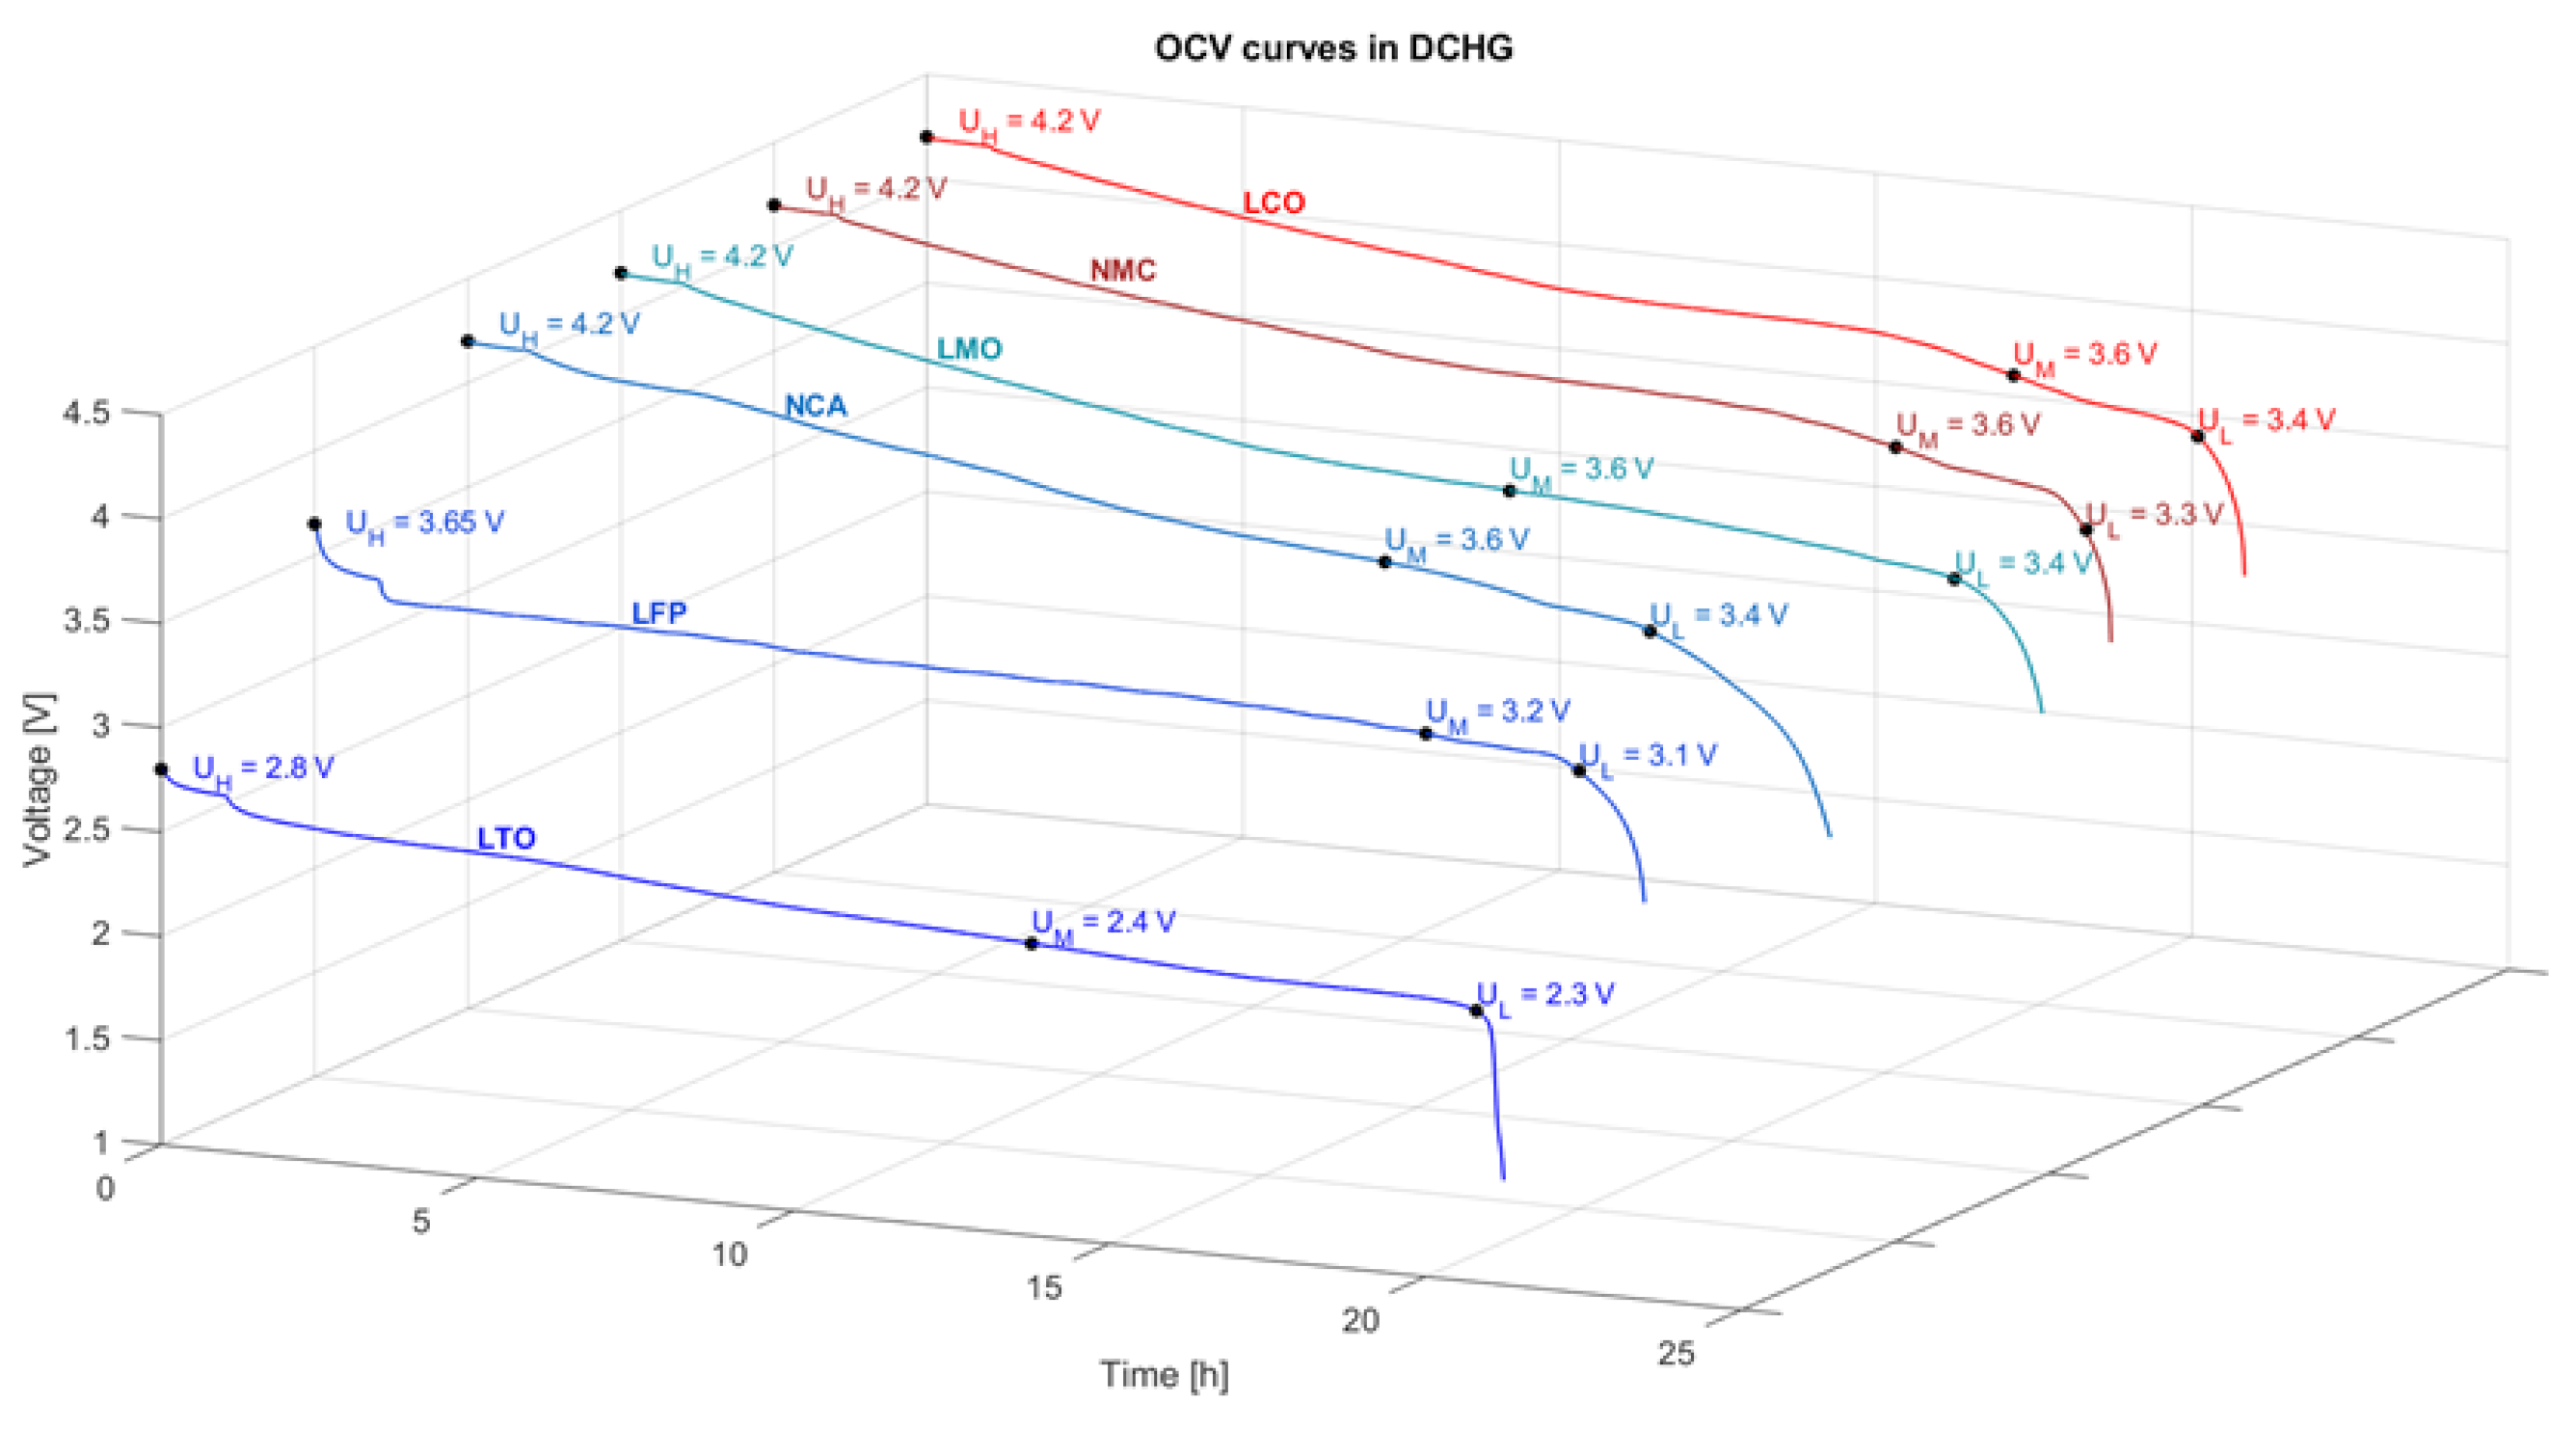
2.2.3. Recording of the Open Cell Voltage

One cell of each chemistry was charged and discharged with a very low current of C/20 (relative to the nominal capacity) after being current constant voltage (CCCV) charged to their upper voltage limits with a cut-off current of C/50. The comparative OCV overview for all electrode materials is shown in Figure 1, with a one-hour waiting phase in the beginning. LFP and LTO cells have a slight decrease in their OCV during this period. Here, the three different storage voltages UL, UM and UH, which are also referred to in Table 2 for the aging procedures, are highlighted in each OCV curve. Each voltage represents the designated storage voltage of a given cell chemistry.

2.2.4. Capacity Determination

The initial capacity of each cell was determined using the battery tester at room temperature with a sample time of one second. Whenever a C-rate description is used in this work, it refers to the nominal capacity documented in the data sheet.
The general proceeding starts with a CCCV 1 C phase until the upper cutoff-voltage is reached and the current decreases to C/50. After a 30 min rest period, a discharge current of 1 C is applied until the lower cutoff-voltage is achieved, again followed by a 30 min rest period. Afterwards, the cell gets charged to UMax with a CCCV charge of 1 C until a cutoff current of C/50 is reached. The charge capacity was also recorded, but not used for this evaluation.
The resulting discharge capacity QC was determined by using coulomb counting, i.e., summing up the product of the current Istep and ∆Ts between each sample, as seen in the following equation:
Q C = t 0 t e n d I   d t = t 0 t e n d I s t e p · Δ T s   ,
the products are added up starting from the maximal cell voltage UMax down to the minimal voltage UMin for the discharge capacity.

2.2.5. Determination of the DC (Direct Current) Resistance

As the capacity determination process ends at UMax, UM was set for each cell accordingly to the values from Figure 1 for the pulse to determine the DC resistance. After at least a 30-min resting phase at the designated voltage level, a constant discharge current of 1 C was applied for 10 s. For this experiment, the same battery tester during room temperature conditions (18 ± 2 °C) was used. Data was sampled with a sample rate of 0.1 Hz and the resulting direct current resistance was calculated by:
R i = Δ U Δ I = U t 0 U t 0 + 100   ms I t 0 I t 0 + 100   ms   ,
in this equation the DC resistance of the battery Ri is calculated by the division of ∆U and ∆I. U at t0 and I at t0 are the last data points prior to the pulse. The delta of 100 ms in the resistance calculation results from the sampling rate of the test bench. Afterwards, the same pulse was mirrored in the charge direction for compensation of the discharged charge during the initial pulse, but not included for resistance calculation.

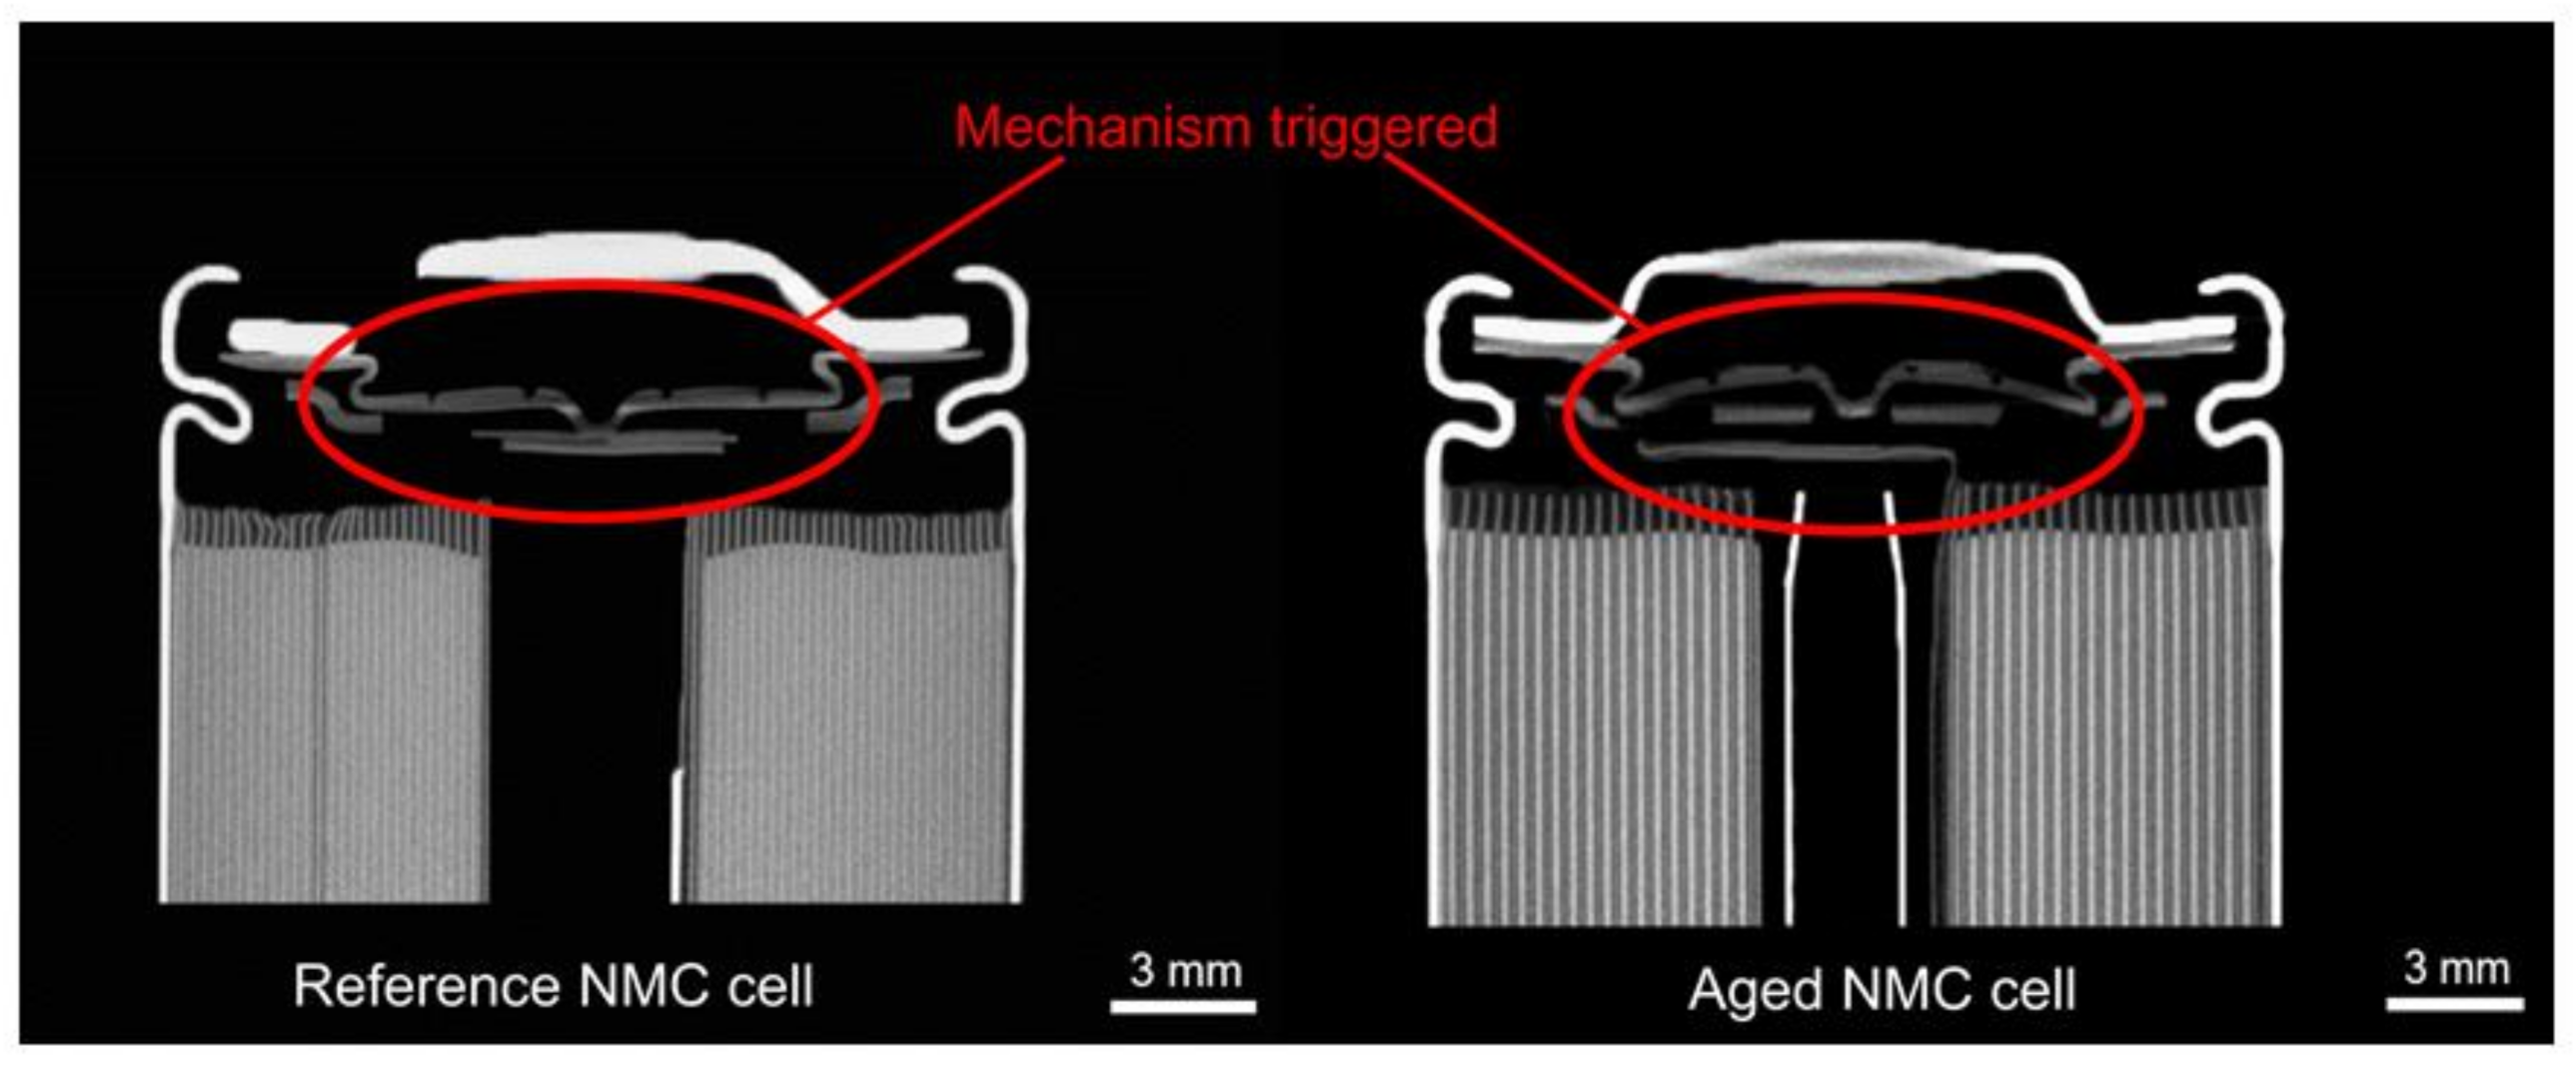
2.2.6. Computer Tomography (CT)

Computer tomography (CT) enables a nondestructive investigation of the whole battery. This allows a macroscopic characterization before and after cell aging. Manufacturing defects can be found before cell aging. Post-aging examination delivers accurate information on aging-related changes. Important criteria are foil protrusion and deformation of the active material layer, delamination, change in the layer thickness of the active material and control of the current interrupt device (CID).
The studies were performed using a Phoenix V/tome/X CT (microfocus tube) with a voltage of 120 kV and a current of 100 μA. The exposure time is 200 ms and the maximum resolution is 22 μm voxel size. This technique was used to analyze the circumstances and failure modes for the NMC cells aged at 60 °C at the highest storage voltage.

2.3. Aging Procedure

2.3.1. Aging Setup

The cells at 50 °C were stored in a climate chamber (VT 4011, Weiss Technik GmbH, Reiskirchen, Germany, accuracy: ±0.5 K in the middle with gradient in the room of ±1.5 K max, [15]) and the cells at 60 °C were stored separately in another climate chamber (VT 4021, Weiss Technik GmbH, Reiskirchen, Germany, accuracy: ±0.5 K in the middle with gradient in the room of ±1.5 K max [16]). In order to arrange the cells in the climate chambers, a setup of homemade wooden shelves were used. These are shown in Figure 2 in the second panel. The shelves were desigend especially for this experiment, including cutouts for a better air circulation inside the climate chamber and thus more homogenous temperature. Each shelve board includes velcro strips to keep the cells at their place during storage and during checkup procedures. Accordingly, each cell was equipped with the opposite velcro strip as can be seen at the most left LMO cell in Figure 2 in the first panel. The velcro concept was chosen, to not put the cells under any mechanical stress, i.e., to influence the aging results. The cells were placed on the wooden shelves with enough space between each other (Figure 2 third panel) and all wooden shelves were placed on top of each other. To confirm the temperature homogeneity on the shelves, the temperature difference of each layer was monitored with a temperature logger (ELV USB-Datalogger UTDL10) for 48 h, respectively, and was to be found below 0.2 K. Similarly, the unaged reference cells were put into a safety cabinet at laboratory conditions and their temperature was monitored also. The temperature condition during room temperature storage was (18.5 ± 2.5) °C at all times. After the cells were put into storage, the door remained closed until the next checkup was due, as will be explained in Section 2.3.3.

2.3.2. Storage Conditions

As described in the introduction, higher storage/operating temperatures lead to faster reaction rates of chemical processes inside lithium-ion batteries and therefore faster parasitic side reactions, leading to higher capacity loss and impedance increase [1,3,4,8,12].
Therefore, two elevated temperatures have been selected for accelerated aging of the cells in this work, being 50 °C and 60 °C.
Similarly, the storage voltages of the cells have been selected by three numerical voltages and not by state of charge, as close-by voltage plateaus can lead to a similar aging behavior [3], thus differing SoC values at similar voltage plateaus might not lead to different aging performance. On a second note, if a SoC setup is used, the actual definition of the SoC is quite important, because if coulomb counting is applied, the resulting actual storage voltage may vary over the course of multiple checkups, as the actual cell capacity decreases and thus the SoC steps are shifting. Additionally, the method of utilizing a fixed storage voltage has practical advantages, especially when managing large amounts of cells, as not every time during a checkup the relative capacity at a defined temperature for all cells needs to be tracked and calculated, which saves time and reduces complexity.
As the cells are set by voltage, UL corresponds to a relative SoC of 2–6%, except for NCA, where it is at 17%. The voltages for the cells with a voltage window up to 4.2 V, i.e., NCA, NMC, LCO and LMO, were set to 3.4 V in order to have a small distance to the lower cutoff voltage and to avoid possible over-discharging at longer storage periods. UL for NMC was set 0.1 V higher, as the voltage plateau is comparably flat at 3.3 V. Similarly, the second storage voltage UM corresponds to a SoC from 17–38% accordingly and was set to 3.6 V for the four previously mentioned cell types each, as this voltage fits to the nominal voltage of the cells. For LMO and LTO, which have different voltage windows anyway, UM was set to the nominal voltage and UL was picked with a small gap to the lower cutoff voltage. On the other hand, UH corresponds to a 100% SoC for all cases.
The distribution of the test cells can be seen in Table 2, as all cells have been distributed into three groups of different storage temperatures and into three groups of storage voltages levels. The amount of test subjects for each storage condition are shown in the table as well.

2.3.3. Checkup Procedure during Storage

For monitoring of the state of the cells, a regular checkup is necessary. The procedure consists of the following steps:
  • Removal out of the climate chamber.
  • Cooling period of two hours at room temperature.
  • Capacity verification.
  • DC-resistance pulse at UM (similar to the initial checkup).
  • Charging/discharging to the designated storage voltage.
During the aging procedure, only a certain amount of cells can be verified, which are marked as ‘Checkup cells’ in Figure 3, due to a limited quantity of test channels. This quantity of checked cells consists of five cells per chemistry at every condition, except for all cells at room temperature and for LTO, which consists of three checkup cells. Therefore, the other leftover cells of the same aging group are also taken out, but only for recharging to their dedicated storage voltage with the same cutoff condition as in the beginning, as can be seen in Figure 3. This process is used in order to have as little time as possible for all cells outside of the elevated temperature storage. After both procedures are finished for all cells of the same aging group, they are put back in the temperature chamber. The cell group that only got recharged cannot be used for the intermediate data points in the further evaluation, but they were included in the first and in the last data point for all plots and calculations.
The cells stored at 50 °C have a checkup after approximately 12 weeks initially, whereas the checkup at 60 °C takes place every four weeks, due to the increased reactivity at the higher temperature.

3. Results

In order to compare the huge amount of cells stored at different voltages, temperatures and with various electrodes, the main tool for analyzation will be the expected value. The mean or expected value µ is defined as μ = 1 N i = 1 N x i with N being the sample size, x the actual physical value and i being the respective index. In the upcoming aging performance evaluation, x will be the capacity and the DC resistance. In the next step, the aging behavior of the expected values, i.e., mean values, of the capacity decrease of each temperature is analyzed. For a detailed look at the values, the three-dimensional graphics are also uploaded as Supplementary Materials in the online section of this work, as well as the scatter plot in the last section.

3.1. Average Capacity Decrease

3.1.1. Cells Aged at (18.5 ± 2.5) °C

For reference and to be able to compare the performance loss at higher temperatures, the capacity decrease during normal storage at room temperature (RT), in this case (18.5 ± 2.5) °C and at UM, was also recorded. The measurements are taken before the 120-day storage period and afterwards with the same setup described above. For all cells, the decrease without any accelerated aging resulted in an overall average residual capacity of 99.8% after 120 days, with the highest loss for NCA dropping to 98.0%, whilst LMO cells slightly increased up to 101% capacity relative to the initial value. Again, this behavior is similar to the behavior of LMO cells stored at UL at higher temperatures, where the least amount of parasitic side reactions are expected. In total, the capacity loss at room temperature for the six cell types is rather minuscule.

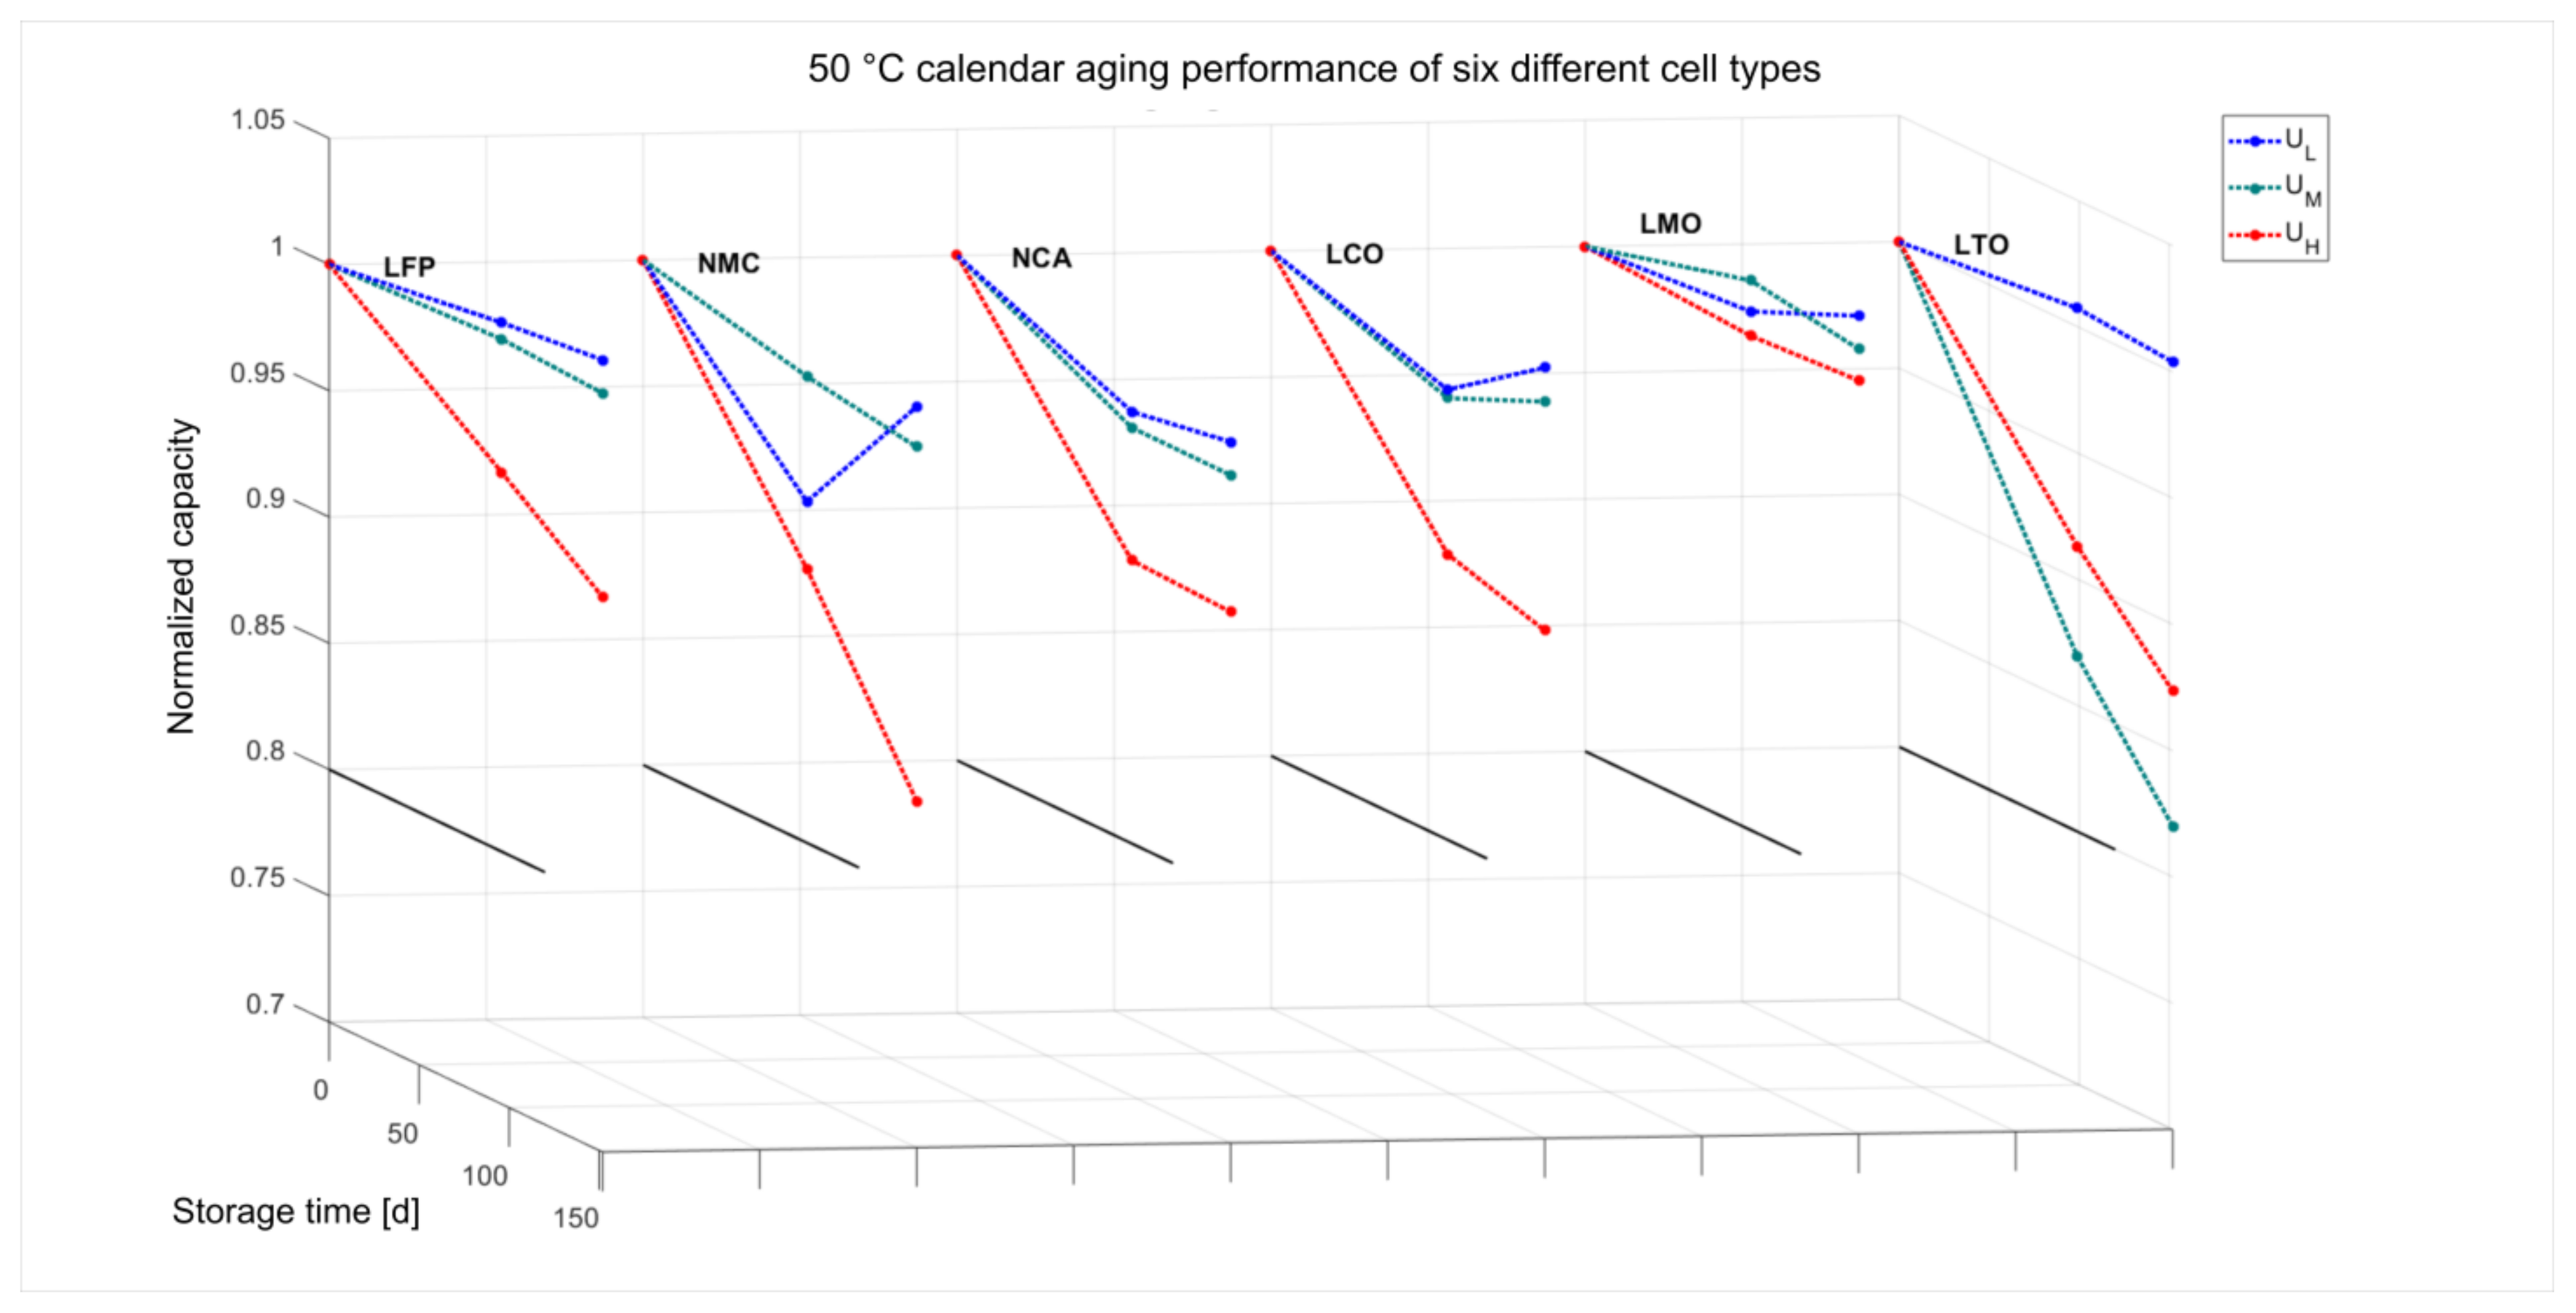
3.1.2. Cells Aged at 50 °C

The capacity decrease of the 18 different batches at 50 °C, divided into six chemistries with each three storage voltages, can be seen in Figure 4. Here, the average of every capacity at every storage condition and time is displayed. For the first and last data point, the amount of checked cells resembles the amount displayed in Table 2, whereas all intermediate points consist of five cells for all voltages and chemistries, except for LTO where this number is three, as a lesser total amount of those cells was available. Due to channel limitations and the relative short time the cells should stay outside of the climate chambers, not all cells were checked, as explained previously.
The Z-axis in Figure 4 displays the normalized capacity of all cells. Here, all later points are displayed in reference to the initial capacity, hence all graphs starting at one. In order to give more orientation for the 3D view, a line at 80% residual capacity is included in the diagrams. Similarly, no additional tolerance bands are plotted within this graph, as too much information would make it hardly readable and this topic will be addressed on its own in the statistics section. The time span covers 150 days of aging for cells stored at 50 °C. At first glance it can be seen that some cells, at some conditions, gain capacity over time in small percentage, such as NMC-UL, LMO-UL, LMO-UM, LCO-UL, LCO-UM and LTO-UL. This common phenomenon can occur, when the capacity still increases after the initial formation cycles of the cells [3], leading to the conclusion that the three initial cycles each cell has obtained are not enough to eliminate this behavior for all cell types. This behavior is mostly expressed for cells at conditions, where the least amount of parasitic side reactions effects are expected. This is expected at cells with lower storage voltages (i.e., UL) and at lower temperatures (i.e., 50 °C) [1,4,8]. On the other hand, all cells, except the LMO cells, show a drastic capacity fade when stored at UH. This can be caused by the more drastic parasitic side reactions because the more extreme electrode potentials. Those not only include the reaction of the electrolyte with the free lithium-ions and the resulting loss of cyclable lithium, cracks in the anode and lithium corrosion [17], but also the reaction of the positive electrode against the electrolyte, especially at higher voltages [11]. The Titanate-Oxide cells behave different in terms of capacity decrease in relation to storage voltage compared to the rest of the probed cells. The capacity decrease of the LTO cells at UM is more drastic than the decrease at UH as can be seen in Figure 1. The cells at UL on the other hand show less negative aging effects, i.e., minor to no capacity loss, like other UL cells. As LTO cells do not form a solid electrolyte interface (SEI) between the negative electrode and the electrolyte [18], a different behavior between LTO and all five other chemistries with graphite electrodes can be expected, as can be seen in the results of this investigation as well.

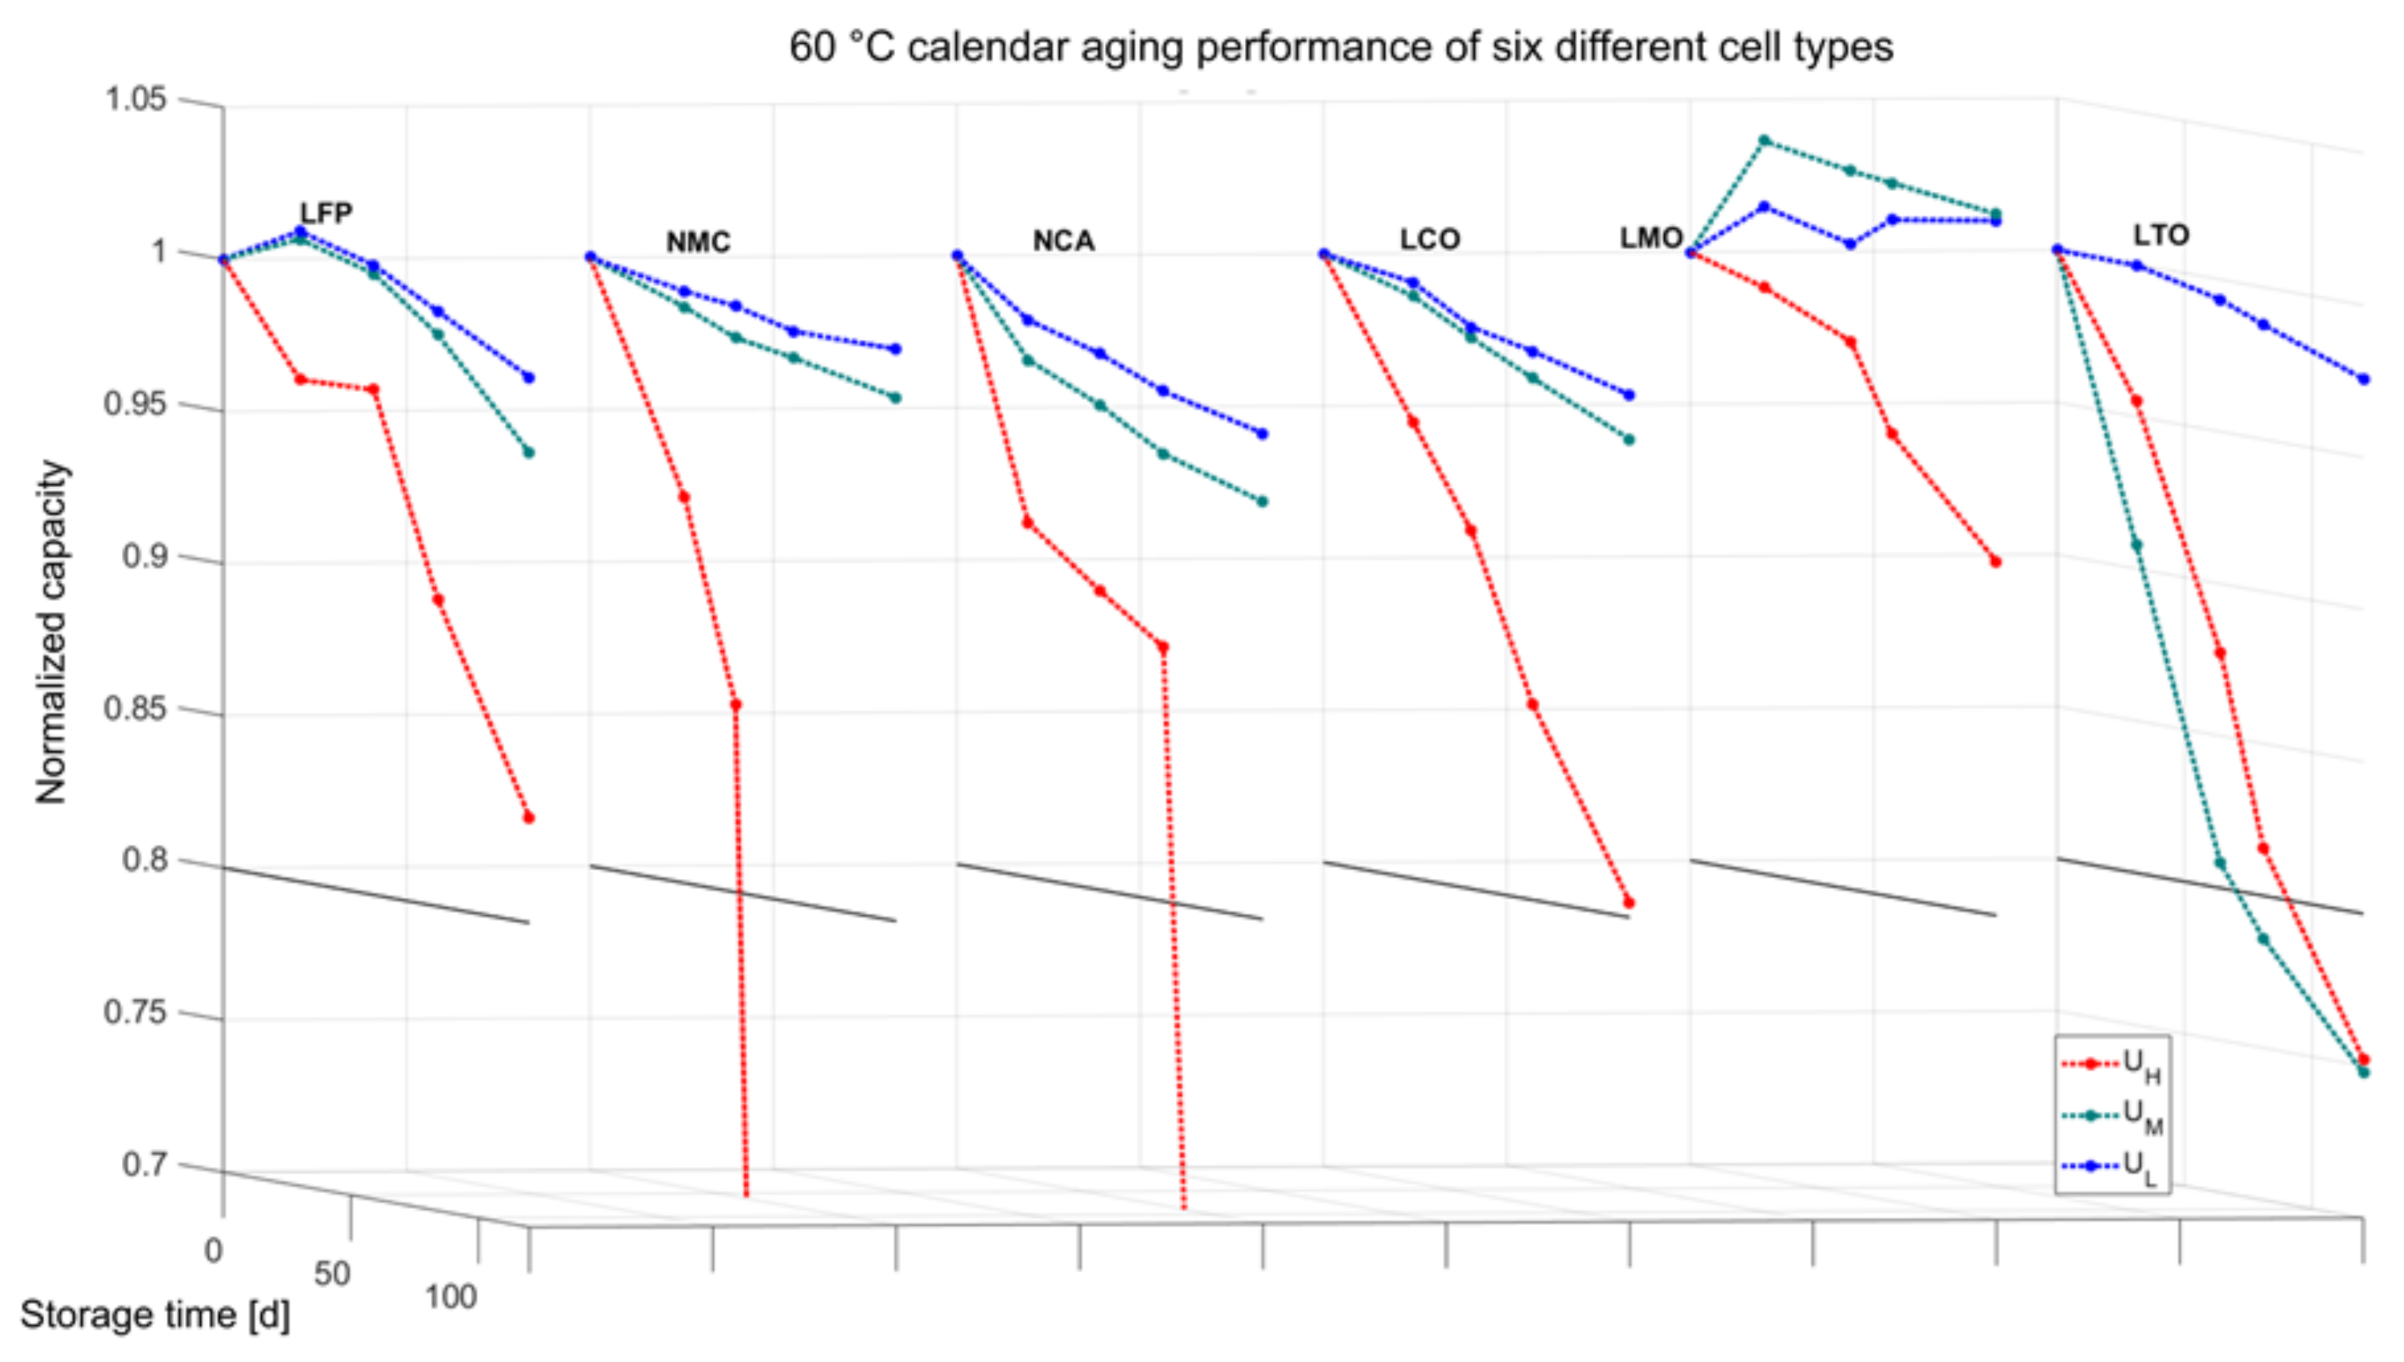
3.1.3. Cells Aged at 60 °C

Similar to the experiment with cells aged at 50 °C, the results of the average cell capacity decrease at 60 °C are shown in Figure 5. Again, analogous to the LMO behavior at 50 °C, cells at UL and UM seem to increase in capacity during the aging, also explainable by the initial cycles in the beginning. For UH, the parasitic side reactions take over and lead to a decrease in capacity over the storage period. In comparison with 50 °C LMO cells at UH, the impact on the capacity is more drastic this time after 120 days with 10% loss, compared to only 3% at 50 °C. Initially, LFP cells at UL and UH show a slight capacity increase after the first checkup, followed by a consistent decrease over time. NMC, NCA and LCO cells stored at UL and UM reveal a very similar performance, where in all cases a lower voltage can be identified as relation for less capacity decrease over time.
In contrast, LFP, NMC, NCA and LCO cells stored at UH show a drastic decline in capacity over time. At the end, with 120 days of storage, LCO and LFP UH almost reach the added limit of 80% residual capacity, all NMC and NCA at the highest voltage even lost their function completely after the second and third checkup, respectively. Those cells did not show any voltage at all or voltages far below UMin, all lower than at 1.2 V, meaning they should not be recharged again in a standard use.
When contacting the cells with a multimeter (UNI-T UT61E), the voltage of all cells that show values above 0 V but below UMin, i.e., the dead cells, dropped further due to the small measurement current of the multimeter. This leads to the conclusion that this observed voltage is somewhat of an open circuit voltage with a rather high internal resistance. A possible explanation would be the triggering of a safety mechanism (CID) during the aging. In order to explore this cell failure further, CT scans were conducted with NCA and NMC cells, respectively. Dead NMC and NCA cells, that were aged at 60 °C and UH were scanned and compared against unaged reference cells. Figure 6 gives a comparitive overview of two NMC cells, with the left cell being aged at room temperature ((18.5 ± 2.5) °C) NMC and the right cell being an aged cell a few days after the failed checkup. It can be clearly seen that the safety mechanism has been triggered as a cause of gas generation due to the accelerated aging. This also explains, why no or only a highly resistive OCV of the dead cells is measureable, as the contact to the cell wrap is partly or completely disrupted. From a visual inspection, a release of the gas could not be identified, only that no clear changes such as deformations etc. are not visible from the outside inspection.

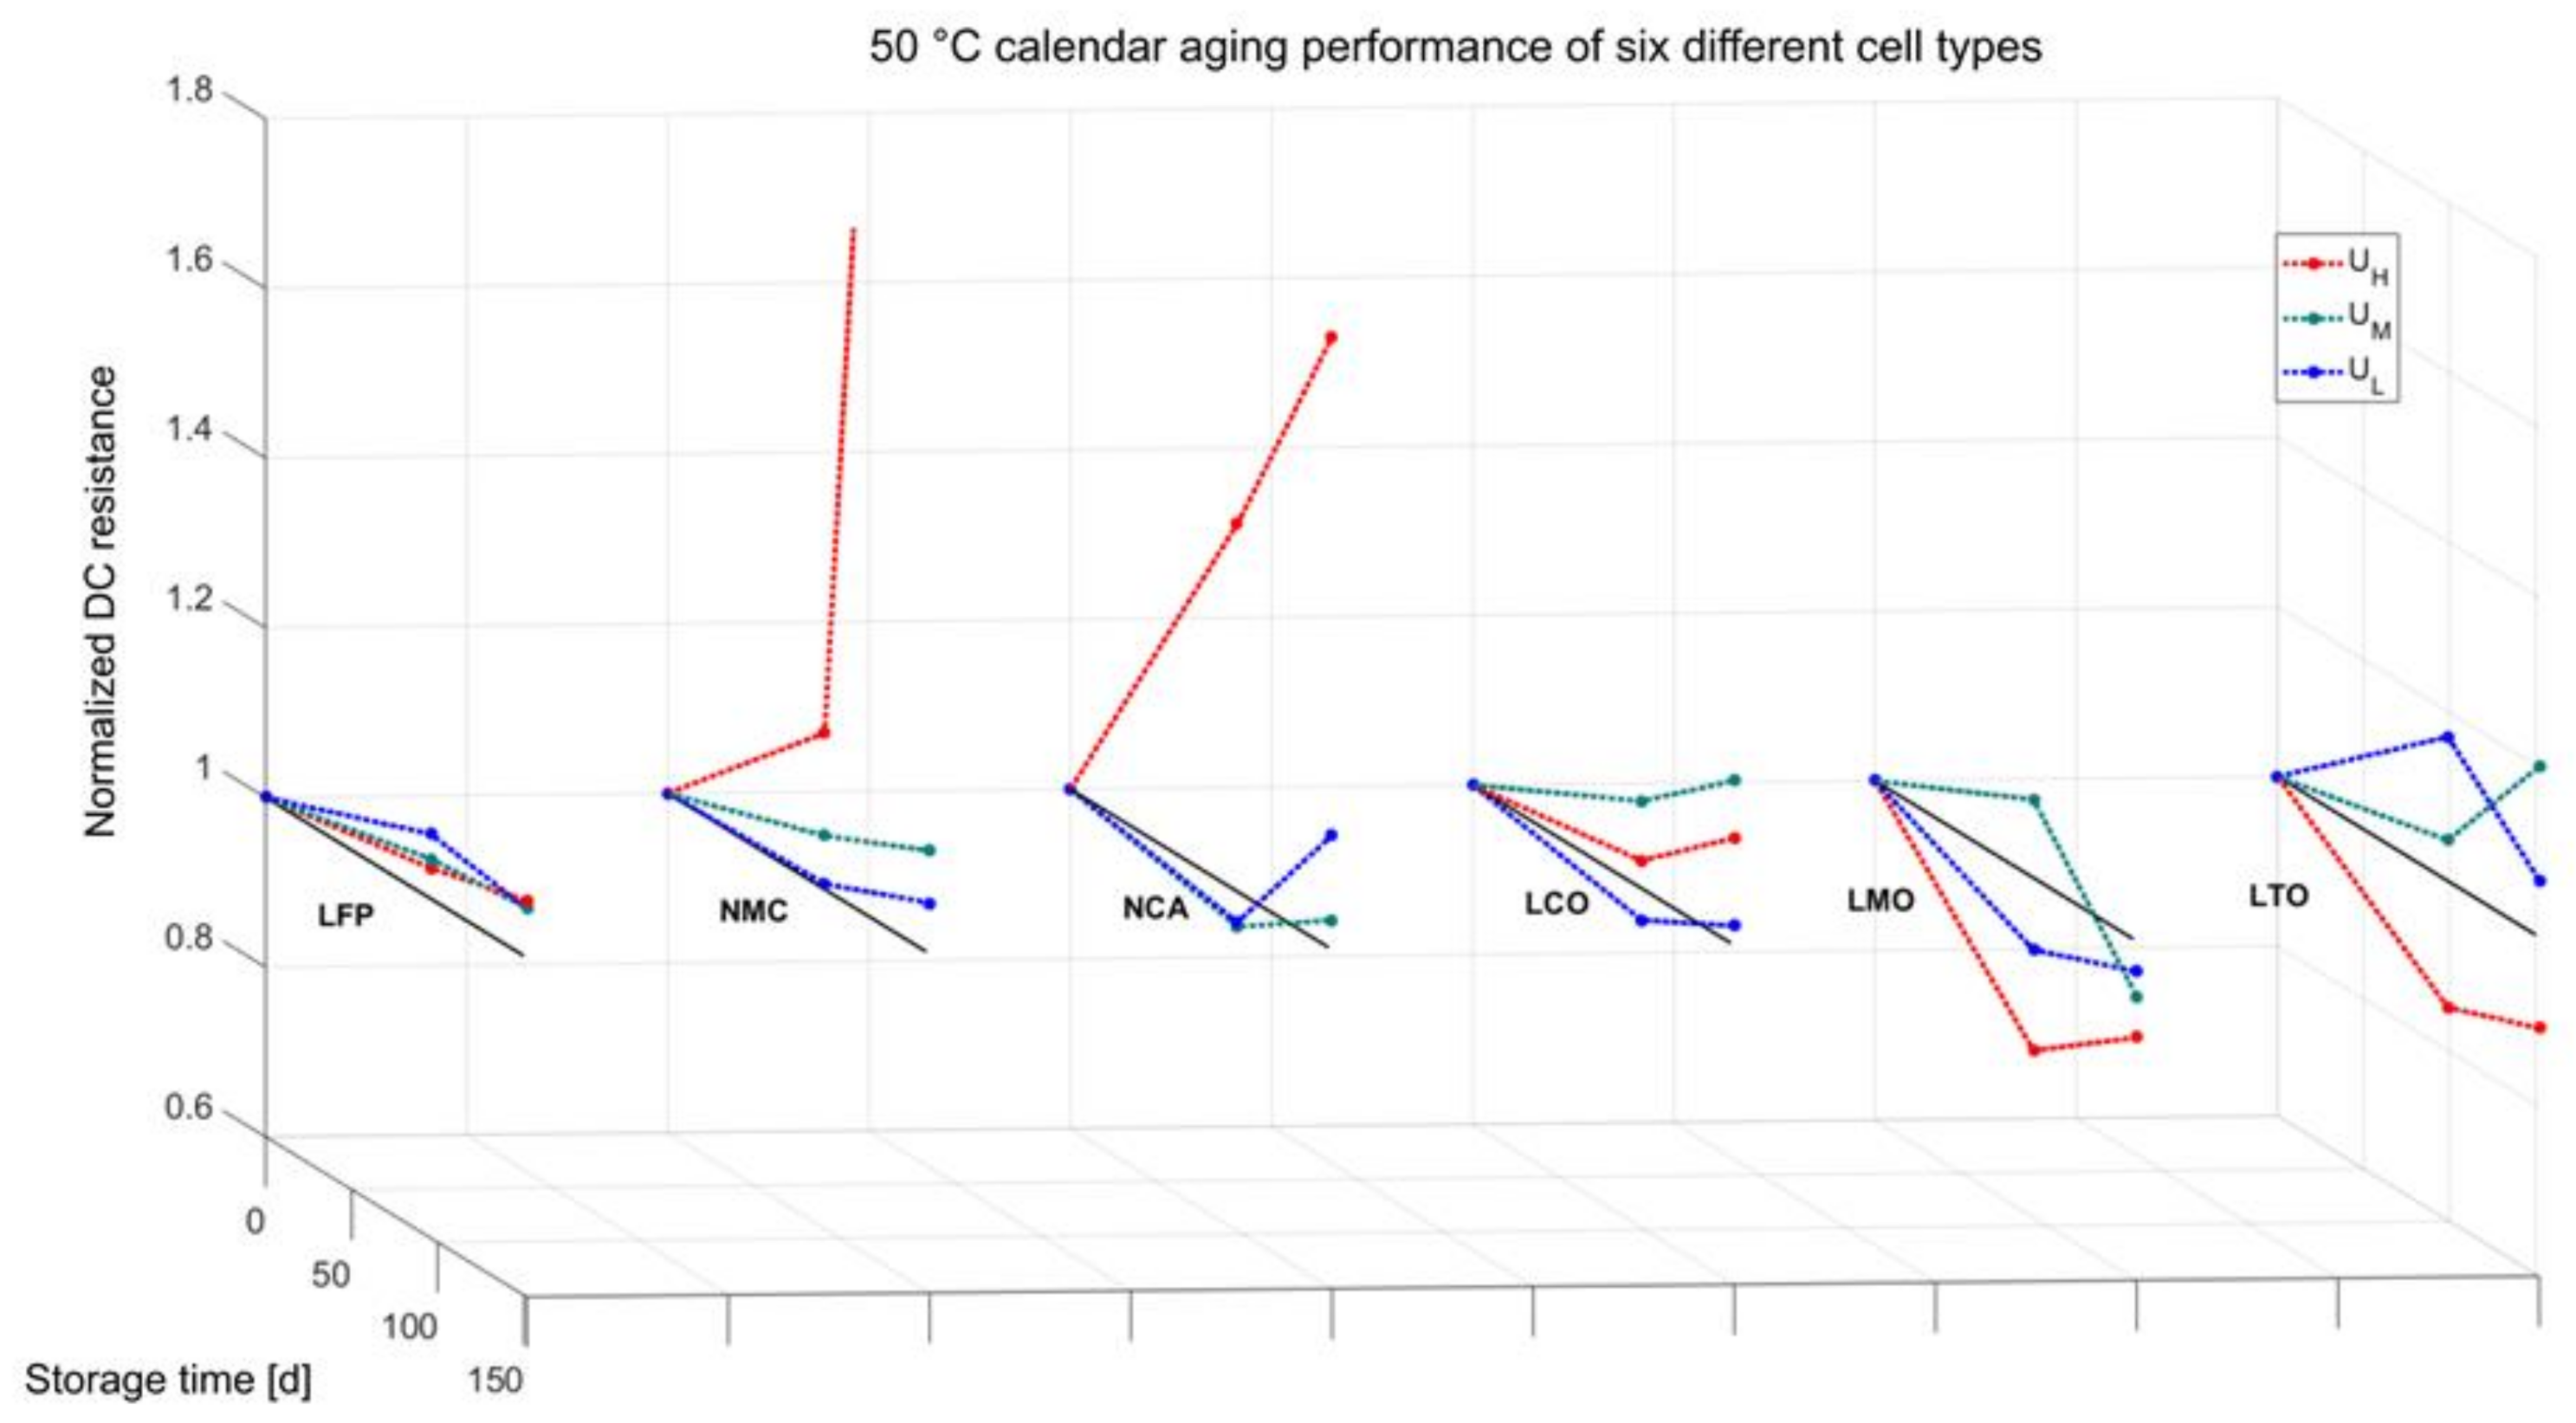
3.2. DC Resistance Evaluation

3.2.1. Cells Aged at 50 °C

In a similar manner to the evaluation of the aging performance in terms of capacity, the internal resistance increase is analyzed for the 50 °C and 60 °C storage duration in the following paragraph and displayed in Figure 7 and Figure 8. At 50 °C, LFP and LCO show a slight increase for all storage conditions after the experiment. NMC and NCA show comparable results for cells aged at UL and UM, but a significant increase for the highest storage voltage. Here, all NMC cells stored at UH do not show any voltage at all after 150 days when being measured with a multimeter (UNI-T UT61E). This again leads to the conclusion that the cells are dead, i.e., that the interrupt mechanism has triggered, similar to all NMC cells at 60 °C.
The LMO cells show a pattern that is comparable to their capacity behavior, being that their resistance first goes down and eventually stabilizes at the end of aging. This effect can also be connected to the fact that more initial cycles could compensate for this initially inverted behavior. The last cell group LTO shows more increase at lower storage voltages, i.e., at UL and UM. Cells stored at UH even decreased in impedance over time, compared to the initial measurement.

3.2.2. Cells Aged at 60 °C

Identical to the behavior at 50 °C, NMC and NCA cells stored at 60 °C and UH show the most drastic increase of impedance of all cells, whereas the increase for NMC, NCA and LCO cells at UL and UM is comparable. All three batches of LFP have slightly different initial increase rates, but eventually meet at the same spot after being stored at 60 °C for 150 days. All LMO cells end up with a slight decreased resistance after the investigation, akin to the performance and reasoning at 50 °C. Interestingly, LCO and LTO stored at UH show the least increase—or even decrease—in comparison to their direct competitors at lower voltages. The overall performance of all LTO cells is rather intriguing, having a complementary performance in direct comparison to NMC, NCA and LFP, being pronounced the most at 60 °C. A different behavior is to be expected though, as a complete different anode is being used in such cells, without forming a SEI layer.

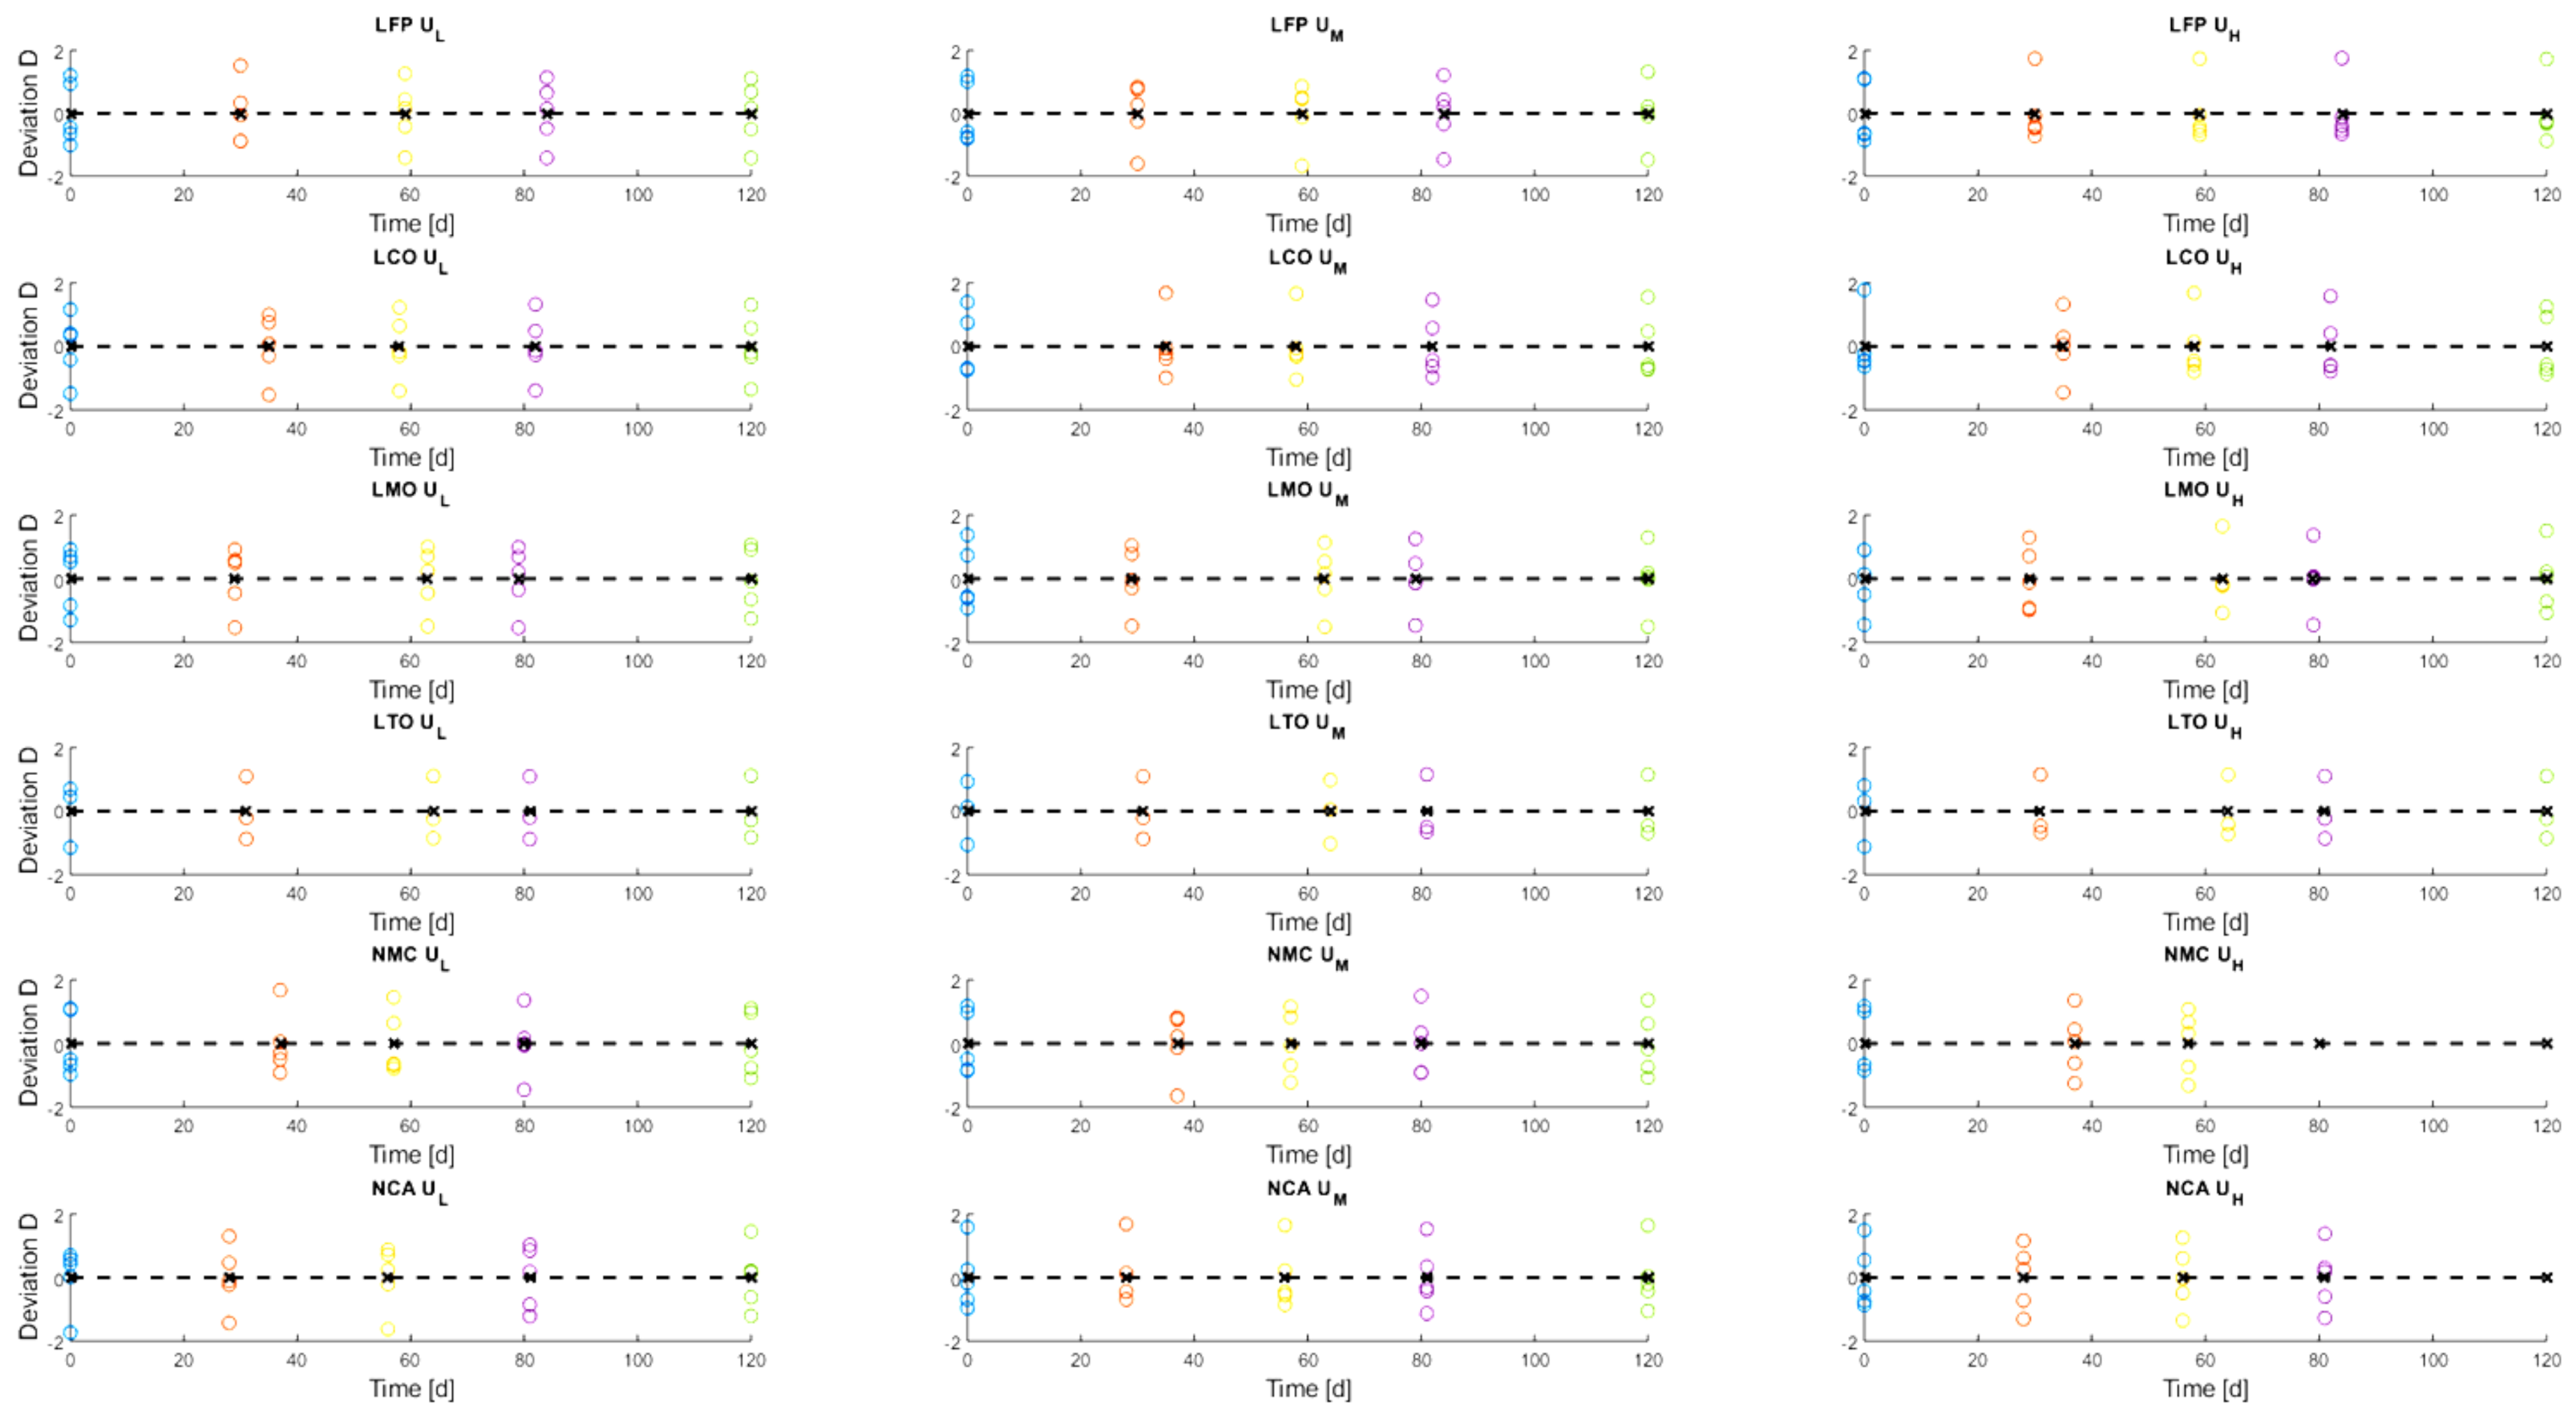
4. Discussion—Distribution Changes Due to Aging

As the goal of this investigation was not to model the different aging parameters as functions of capacity, impedance, time, temperature or voltage, but to look further into any deviation of the capacity development between similar cells, a purposeful approach has to be defined in the beginning to analyze this variation.
Even though manufacturers try to match produced cells as close as possible, slight tolerances in their parameters cannot be fully avoided. This tolerance can have a greater impact on system level. When designing a battery system, the lowest capacity in a series connection of cells will dictate the overall useful capacity of the system. Therefore, the question rises, in what way do different cells vary in capacity fade and impedance increase while aging at similar conditions.
In order to assess the situation in the best way, the following results are compared for each temperature in a single plot. To evaluate the different distributions of the capacity decrease, as not every cell holds the same charge, and to differentiate between changes in distribution and the effect of decrease due to aging, the following mathematical expression is defined and used:
D x , t = C x , t μ t · S t 1 ,
with   S t = N 1 1 · x = 1 N C x t μ t 2 ,
here, the new introduced relative deviation D, dependent on a given data point x and aging time t, gives insight into the individual deviation of mentioned variable in relation to the expected value µ at a given aging time step. Then, it will be divided by the standard deviation S, in order to avoid mixing the occurring deviation with the effect of capacity loss due to aging. The input for calculating the standard deviation S is the sample size N, the actual absolute value Cx at the index x (in this case capacity) and the expected value µ. In general, the sample distribution of the commercially produced cells is assumed to follow a standard deviation.
Figure 9 shows the variation of the deviation of every checked cell during the aging steps at 60 °C storage. 60 °C cells were selected for analysis, as there are more intermediate data points and capacity decrease is more pronounced, therefore the expected changes are also expected to be more pronounced. Each line displays the set of a single cell chemistry at different storage voltages, as explained in Table 2, whereas a row-by-row comparison features the changes between chemistries. The black dotted line, representing the expected value is inserted to make changes in the set at later data points more visible and to guide the eye.
Interestingly, the set of LFP cells showed two distribution peaks between two expected values in the graph, but also in the total amount of 87 cells, which leads to the conclusion that the purchased LFP cells originated from two different production batches. The other cells do not show this distribution in pristine condition. This also goes in accordance with the initial impedance recording, which shows a distribution with a mean of 43.9 mΩ, the minimum value of 36.0 mΩ (−18%), a maximum of 51.4 mΩ (+17%) and the standard deviation being 2.5 mΩ (5.7%). The standard deviation for all LFP cells comes out at 46.1 mAh (3%) with the mean being 1.53 Ah. A similar case can be seen for NMC cells with two slightly separated groups, with a standard deviation in capacity of 26.2 mAh (1%) and a mean of 2.47 Ah in the initial checkup, being less pronounced than the case for LFP cells. In order not to have a production dependency on the statistics, the cells were distributed randomly for all aging groups prior to storage.
For the other cells, no further drastic changes occurred in terms of deviation from the mean, with the relative deviation staying in the bounds of −2 and 2 for all cells. Therefore, no breakout (D > 2) occurred for any given condition during the tests for any single cell. Thus, it is difficult to derive any dependencies between the aging conditions and to draw a clear direct conclusion from the scattering shown in the graph from Figure 9 for all cells. No direct change in dispersion in a set with similar conditions due to aging can be extrapolated by this data set, giving no clear indication for a sign of dependency on similar aging conditions, e.g., storage at low voltage (UL) compared to storage at high voltage (UH).
At this point, it is also worthy to note in general that equilibrium conditions, in terms of temperature deviation, need to be met for cells at different positions in a battery pack to ensure similar aging conditions and not to drift apart. If the temperatures vary, e.g., comparing LFP UH at 50 °C and LFP UH at 60 °C, one can notice the difference in capacity decrease further deviating one from another. In a battery pack, the temperatures usually would not be that high and the system design would look for a homogenous temperature distribution in the cooling system, meaning this effect in total would be weakened, but as such, it needs to be taken into consideration early in the development. In a worst case, if the capacity of a single cell decreases drastically, the overall capacity of the battery system will also decrease in a serial configuration, leading to noticeable effects for the customer, which needs to be minimized by keeping a homogenous temperature for the whole pack.

Development of the Standard Deviation of the Capacity of the Cells at 50 and 60 °C

In the previous analysis, all cells, which were checked in regular intervals, have been investigated for distribution changes and trends. Altogether, the amount of cells of the aging experiment in total is higher than just the regularly checked cells. Therefore, it can be reasoned that a look on the distributive changes on the total amount of cells prior and post aging could lead to results with more significance. The reason is that the sample amount per storage voltage consists of eleven units instead of five. As the remaining capacity, i.e., the remaining time a battery-powered system can be operated, is more impactful on the practical use in generic applications such as e-scooters, solar storages etc., the next analysis will focus on the capacity degradation rather than impedance.
In Table 3, the changes in capacity during accelerated aging are displayed for 50 °C and 60 °C storage condition. The mean value µ is given as absolute value in Ah, whereas the standard deviation S is being represented in relation to the mean value in percent. The subscripted labels indicate the time of the measurement, with “Init” being prior to and “End” directly after the aging procedure. Each pair is additionally subdivided by their storage voltage. The latter values of the NMC cells at UH were not available, as the cells were dead before the final measurement. A look into the measured values, especially the shift of the standard deviation, reveals the emergence of three different groups. Firstly, there is a group consisting of only cells with decreasing standard deviations for all voltages over time, which is LFP. Secondly, a group of cells with continuous increase in the standard deviation can be extracted. This group consists of NCA and LTO. The last group is mixed and consists of LCO, NMC and LMO, where the in- and decrease is not consistent at all voltages.
The first group shows an interesting evolution in the development of S over time. During storage, the individual delta to the mean value seems to cluster back together. This phenomenon may result from the given split in the initial condition for LFP cells, as the mean of all the capacities in the initial state are rather distributed towards two peaks, as can be indicated for LFP in Figure 9.
The second group, consisting of NCA and LTO, shows a visible increase in S over the full aging time for both temperatures. It is noteworthy that LTO and mostly NCA have a slim standard deviation before the accelerated aging procedure. In particular, at UH, the spread and resulting increase of S is mostly noticeable, with an increase of a factor of 14 for LTO at 60 °C. At this point, it can be noted that all LTO cells were contacted via a different mechanism, as they had two terminals on a single side, similar to an electrolyte capacitor (see Figure 2 panel 1). This results in a slight mechanical difference, compared to the five other cell types, which might have had an influence on the aging.
The statistical distribution of the LCO, NMC and LMO cells does not fit into either of the previous two groups, as it changes for the different voltages. Here, no further correlations between comparable conditions can be made. When looking at the evolution of the DC resistance from start to end of the aging period, no clear overall trend can be extracted either. LFP, NCA, LCO and LTO neither increase nor decrease consequently over all voltages and temperatures. In the case of NMC, the standard deviation tends to increase slightly over time. Similarly, the deviation of LMO cells tends to decrease consequently. This is mostly noticeable at 60 °C with values ranging from 13–18% reduction in relative deviation. Similar large values occur for LTO cells at 50 °C, where an increase of 28% at UL, but at the same time a decrease of 16% at UM can be detected.
As the cell group that is referred to as LTO in this paper includes an LCO cathode, it makes sense to compare both LTO/LCO and Graphite/LCO cell groups in particular. When comparing µ in terms of capacity at 60 °C condition, LTO/LCO and Graphite/LCO cells stored at UL tend to behave rather comparable, as well as for UH. The biggest difference is that LTO/LCO cells at UM degrade more drastic compared to Graphite/LCO cells at UM. Furthermore, comparing the LTO/LCO cells at UL and UM, with a comparable voltage plateau, a similar capacity may be expected [3], as stated in the section about the storage conditions. The finding that similar voltage plateaus lead to similar aging performances was conducted with cells consisting of a carbon anode [3], so a direct transfer to the LTO anode might be misleading at this point, as more research would be required to identify the specific behavior for LTO cells at similar plateaus. When comparing the results of LTO/LCO and Graphite/LCO cells, at noticeable difference from previous findings on the calendar aging performance of LTO cells [1] can be found. In a review by Dubarry et al. [1], LTO cells did show far less capacity degradation at higher storage voltages in combination with high temperatures and a more pronounced degradation at lower storage voltages and high temperatures. Whereas in the present investigation, the degradation of the LTO cells in terms of capacity degradation shows an opposing behavior. Not only this can be noticed, but also that LTO cells at the intermediate storage voltage UM seem to experience the most degradation effects. Originally, the loss of lithium inventory and the resulting degradation was thought to be less expressed for LTO cells compared to graphite-based cells [1]. At this stage, this behavior cannot be explained by the authors and requires further investigation. When looking at the standard deviations of both sets, LTO/LCO is placed in the second group of cells, where S continuously increases over time, whilst Graphite/LCO cells are not consistent in their behavior. For the storage voltages UL and UH at 60 °C, where the aging performance between both cells is comparable, the simultaneous increase in S can be observed for both groups qualitatively. Only at UM, where Graphite/LCO cells do not degrade as drastic as LTO/LCO cells, the deviation for Graphite/LCO does not increase as well. For the 50 °C data set, both cell types do have an overall increase in their deviation, for LTO/LCO cells this is expressed more at UM and UH with 5% and 3%, respectively.
In total, without a significant deviation in the complete dataset, neither an increase nor a significant decrease in the deviation, no overall statement can be made at this stage, as the occurring phenomena show no clear trend. It is worth to note though that depending on the individual electrochemical components, i.e., electrolyte, anode and cathode material, the deviation seems to change slightly. For special cases, such as LTO/LCO, the increase in S in the extreme condition, being at the highest temperature and highest storage voltage, lead to a significant deviation in relation to the capacity mean value after aging. This means that a homogenous and overall low temperature distribution in a battery system consisting of LTO cells is especially crucial. Therefore, it is important to monitor each cell configuration individually in a prototype system from a thermal perspective, in order to detect inhomogeneous behavior early enough.
In addition, the effect of cyclic aging plays a similar major role in the operation of lithium-ion cells and for consequences in design decisions for battery system development, which has not been in the scope of this investigation. A similar investigation with a comparable set of cells and conditions is necessary in order to fill the data gap for a cyclic aging analysis.

5. Conclusions

In this study, the aging behavior of six cell types, LFP, NCA, NMC, LCO, LTO and LMO has been investigated. It was found that the cells with different anode and cathode materials differ in variation of the capacity decrease due to calendar aging. Extreme conditions, such as high storage voltages and higher temperatures lead to more capacity degradation and internal resistance increase. This does not account for LMO and LTO cells, as their performance diverged from this behavior. LMO at 50 °C storage showed almost no degradation effects, whereas LTO cells showed the highest capacity decrease at UM. A high storage voltage for LTO cells lead to the highest capacity degradation, but showed the least increase of internal resistance. Both aging phenomena, being capacity loss and internal resistance increase, are mostly noticeable for NCA and NMC cells at 60 °C and UH. The storage condition of 60 °C and UH even lead to a total breakdown of the NCA and NMC cells. This was confirmed by a CT scan of these cells. Here the safety mechanism of these cells was the reason for the complete loss of function. Overall, the aging effects are more prominent at 60 °C in comparison to the 50 °C storage.
As a statistical metric, the relative deviation D was introduced, in order to track the statistical distribution of the cells’ capacity relative to the degradation. The relative deviation is obtained by subtracting the mean µ of every data point and dividing the result by the standard deviation D of the respective aging group. The evaluation showed no scattering for any aging group to reach higher values than two. This means that no clear correlation between aging time and deviation could be detected. Secondly, the standard deviation of the initial state and the final aging state in terms of capacity did not provide an overall trend either. There are some cell groups that:
  • Increased (NCA and LTO, up to 5% gain)
  • Decreased (LFP, up to 2% loss) and
  • Varied (NMC, LCO, LMO) in terms of statistical deviation from the mean, which results in no significant change due to aging.
The highest standard deviations were observed at LTO cells with 6.16% for 50 °C at UM and 5.8% for 60 °C at UH for capacity after aging. This translates to an increase by a factor of 6 and 14 for the aforementioned conditions compared to the initial deviations. Except for NCA cells aged at 60 °C at UL with a factor 9 increase, no other aging group showed notable changes, meaning no overall correlation with temperature and voltage. For the resistance increase, the highest changes in deviation are observed for LMO and LTO cells, where changes up to 27% of relative deviation were measured.
Overall, it can be noted, that with a given homogeneity in the pack and with low differences in temperatures and voltages, the predominantly deviation of all cell groups was in no strong correlation to the aging effect in terms of capacity loss and resistance increase.

Supplementary Materials

The following are available online at https://0-www-mdpi-com.brum.beds.ac.uk/article/10.3390/en14113358/s1, Figure S1: OCV curves of all six cell types, Figure S2: Capacity development at 50 °C, Figure S3: Capacity development at 60 °C, Figure S4: Resistance development at 50 °C, Figure S5: Resistance development at 60 °C, Figure S6: Scatter plot of the relative deviation D.

Author Contributions

Conceptualization, C.G., K.W., D.K. and H.-G.S.; data curation, C.G., K.W. and D.K.; investigation, C.G., K.W., G.W. and G.S.; methodology, C.G. and K.W.; project administration, H.-G.S.; writing—original draft, C.G., K.W. and G.W.; writing—review and editing, C.G., K.W., D.K. and H.-G.S. All authors have read and agreed to the published version of the manuscript.

Funding

This research was funded by EFRE-supported EU research network project SENSE BAY, grant number EU-1802-0005 as well as the HORIZON2020-supported EU project COBRA, grant number H2020-EU.3.4, 875568. This report reflects only the author’s view. The European Commission and the Innovation and Networks Executive Agency (INEA) are not responsible for any use that may be made of the information it contains.

Institutional Review Board Statement

Not applicable.

Informed Consent Statement

Not applicable.

Data Availability Statement

The data is available at Technische Hochschule Ingolstadt, please refer to the corresponding author for further details.

Conflicts of Interest

The authors declare no conflict of interest.

References

  1. Dubarry, M.; Qin, N.; Brooker, P. Calendar aging of commercial Li-ion cells of different chemistries–A review. Curr. Opin. Electrochem. 2018, 9, 106–113. [Google Scholar] [CrossRef]
  2. Redondo-Iglesias, E.; Venet, P.; Pelissier, S. Calendar and cycling ageing combination of batteries in electric vehicles. Microelectron. Reliab. 2018, 88–90, 1212–1215. [Google Scholar] [CrossRef] [Green Version]
  3. Ecker, M.; Nieto, N.; Käbitz, S.; Schmalstieg, J.; Blanke, H.; Warnecke, A.; Sauer, D.U. Calendar and cycle life study of Li(NiMnCo)O2-based 18650 lithium-ion batteries. J. Power Sources 2014, 248, 839–851. [Google Scholar] [CrossRef]
  4. De Hoog, J.; Timmermans, J.-M.; Ioan-Stroe, D.; Swierczynski, M.; Jaguemont, J.; Goutam, S.; Omar, N.; van Mierlo, J.; van den Bossche, P. Combined cycling and calendar capacity fade modeling of a Nickel-Manganese-Cobalt Oxide Cell with real-life profile validation. Appl. Energy 2017, 200, 47–61. [Google Scholar] [CrossRef]
  5. Keil, P.; Schuster, S.; Wilhelm, J.; Travi, J.; Hauser, A.; Karl, R.; Jossen, A. Calendar Aging of Lithium-Ion Batteries. J. Electrochem. Soc. 2016, 163, A1872–A1880. [Google Scholar] [CrossRef]
  6. Liu, Y.; Xie, K.; Pan, Y.; Wang, H.; Li, Y.; Zheng, C. Simplified modeling and parameter estimation to predict calendar life of Li-ion batteries. Solid State Ion. 2018, 320, 126–131. [Google Scholar] [CrossRef]
  7. Sarasketa-Zabala, E.; Gandiaga, I.; Rodriguez-Martinez, L.M.; Villarreal, I. Calendar ageing analysis of a LiFePO4/graphite cell with dynamic model validations: Towards realistic lifetime predictions. J. Power Sources 2014, 272, 45–57. [Google Scholar] [CrossRef]
  8. Schmitt, J.; Maheshwari, A.; Heck, M.; Lux, S.; Vetter, M. Impedance change and capacity fade of lithium nickel manganese cobalt oxide-based batteries during calendar aging. J. Power Sources 2017, 353, 183–194. [Google Scholar] [CrossRef]
  9. Stroe, D.-I.; Swierczynski, M.; Kar, S.K.; Teodorescu, R. Degradation Behavior of Lithium-Ion Batteries During Calendar Ageing—The Case of the Internal Resistance Increase. IEEE Trans. Ind. Appl. 2018, 54, 517–525. [Google Scholar] [CrossRef] [Green Version]
  10. Waag, W.; Käbitz, S.; Sauer, D.U. Experimental investigation of the lithium-ion battery impedance characteristic at various conditions and aging states and its influence on the application. Appl. Energy 2013, 102, 885–897. [Google Scholar] [CrossRef]
  11. Broussely, M.; Biensan, P.; Bonhomme, F.; Blanchard, P.; Herreyre, S.; Nechev, K.; Staniewicz, R.J. Main aging mechanisms in Li ion batteries. J. Power Sources 2005, 146, 90–96. [Google Scholar] [CrossRef]
  12. Harlow, J.E.; Ma, X.; Li, J.; Logan, E.; Liu, Y.; Zhang, N.; Ma, L.; Glazier, S.L.; Cormier, M.M.E.; Genovese, M.; et al. A Wide Range of Testing Results on an Excellent Lithium-Ion Cell Chemistry to be used as Benchmarks for New Battery Technologies. J. Electrochem. Soc. 2019, 166, A3031–A3044. [Google Scholar] [CrossRef]
  13. HIOKI. Datasheet BT3554 HIOKI: Battery Tester. Available online: https://www.hioki.com/en/products/detail/?product_key=6382 (accessed on 2 June 2021).
  14. Neware, Datasheet Neware Battery Tester: CT-4008-5V6A-S1. Available online: https://www.newarelab.com/neware-product-sheet/item/147-bts-4008-5v6a-8-channels-battery-tester-cycler-dual-range (accessed on 2 June 2021).
  15. Weiss Technik AG. Datasheet Vötsch Temperaturprüfschrank VT4011: Technische Beschreibung VT4011. Available online: https://www.weiss-technik.com/de/marken/voetschtechnik/ (accessed on 2 June 2021).
  16. Weiss Technik AG. Datasheet Vötsch Temperaturprüfschrank VT4021: Technische Beschreibung VT4021. Available online: https://www.weiss-technik.com/de/marken/voetschtechnik/ (accessed on 2 June 2021).
  17. Birkl, C.R.; Roberts, M.R.; McTurk, E.; Bruce, P.G.; Howey, D.A. Degradation diagnostics for lithium ion cells. J. Power Sources 2017, 341, 373–386. [Google Scholar] [CrossRef]
  18. Jossen, A.; Weydanz, W. Moderne Akkumulatoren Richtig Einsetzen, 2nd ed.; Matrixmedia GmbH: Göttingen, Germany, 2019. [Google Scholar]
Figure 1. OCV curves of all six cell types, marked with all three storage voltages, respectively (UL-voltage low, UM-voltage mid, UH-voltage high), discharged with C/20 and an initial one-hour rest time in the beginning.
Energies 14 03358 g001
Figure 2. Panel 1: Selected cylindrical cells for the investigation; Panel 2: Wooden shelf construct for storage in climate chambers; Panel 3: Cells in climate chamber, including an additional temperature recorder (ELV USB-Datalogger UTDL10); Panel 4: Cells in four-wire clamps during capacity verification in tester.
Energies 14 03358 g002
Figure 3. Checkup procedure diagram, the process is repeated for every individual cell group and every condition in a similar extent from Table 2.
Energies 14 03358 g003
Figure 4. Normalized discharge-capacity decrease of six chemistries at 50 °C storage over 150 days at three storage voltages (UL-voltage low, UM-voltage mid, UH-voltage high), each plotted point displays the average capacity of all individual cells at that same condition.
Energies 14 03358 g004
Figure 5. Normalized capacity decrease of six chemistries at 60 °C storage over 120 days at three storage voltages (UL-voltage low, UM-voltage mid, UH-voltage high), each plotted point displays the average capacity of all individual cells at that same condition.
Energies 14 03358 g005
Figure 6. CT scan comparison of a “dead” NMC cell on the right side with an unaged reference cell on the left. The NMC cell was aged at 60 °C and UH storage voltage.
Energies 14 03358 g006
Figure 7. Normalized DC resistance increase of six chemistries at 50 °C storage over 150 days at three storage voltages (UL-voltage low, UM-voltage mid, UH-voltage high), every plot point resembles the average of all measurements at that same condition, current pulse for measurement for all cells at UM, with NMC cells dead at the last checkup.
Energies 14 03358 g007
Figure 8. Normalized DC resistance increase of six chemistries at 60 °C storage over 120 days at three storage voltages (UL-voltage low, UM-voltage mid, UH-voltage high), every plot point resembles the average of all measurements at that same condition, current pulse for measurement for all cells at UM, with NMC and NCA cells dead near the end of the aging period.
Energies 14 03358 g008
Figure 9. Calculated deviation relative D of the checked cells over the course of 120 days stored at 60 °C. Each row shows a different electrode material and each column displays the different storage voltages (UL-voltage low, UM-voltage mid, UH-voltage high).
Energies 14 03358 g009
Table 1. Overview of the tested cells, values from the data sheet, respectively, with UMax being equivalent to the later used voltage definition UH.
ManufacturerNegative Electrode MaterialPositive Electrode MaterialNominal Capacity [mAh]UMax [V]UMin [V]Total Amount of Cells in Experiment
SamsungCNCA: LiNiCoAlO22500 4.20 V ± 0.052.5087
SamsungCNMC: LiNiMnCoO22600 4.20 V ± 0.052.7587
HeterCLFP: LiFePO41600 3.65 ± 0.052.5087
PanasonicCLCO: LiCoO22600 4.202.7587
NitecoreCLMO: Li(Mn)O22000 4.202.8034
LTOBATTERY Co.Titanate-OxideLCO: LiCoO21300 2.80 V ± 0.051.60 ± 0.05 47
Table 2. Number of cells at different storage temperature and voltage conditions, with the rightmost column being stored in a safety cabinet in the laboratory.
Temperature(18.5 ± 2.5) °C(50 ± 2) °C (60 ± 2) °C
VoltageUMULUMUHULUMUH
LFP21111111111111
NMC21111111111111
NCA21111111111111
LCO21111111111111
LMO4555555
LTO11666666
Table 3. Comparison of the initial and end capacity and discharge resistance values of the expected value and standard deviation of all cells aged at 50 °C and 60 °C, grouped into the three storage voltage groups, respectively; the sample number n of LFP, NCA, NMC and LCO cells is 11 for each voltage, 6 for LTO and 5 for LMO, limited by the supply of cells at that time.
Storage at ULUMUHT
CapacityµInit [Ah]µEnd [Ah]SInit [%]SEnd [%]µInit [Ah]µEnd [Ah]SIni [%]SEnd [%]µInit [Ah]µEnd [Ah]SInit [%]SEnd [%][°C]
LFP1.531.553.070.611.531.533.270.881.531.403.401.6050
NCA2.522.460.691.582.532.440.300.462.532.310.261.01
NMC2.482.470.860.972.482.421.030.862.472.071.13n.a.
LCO2.482.480.320.972.462.440.340.682.462.220.231.20
LTO1.301.300.851.181.281.050.996.161.291.120.563.58
LMO1.941.982.672.631.931.951.660.761.921.911.081.89
LFP1.521.503.311.641.521.453.661.601.521.282.551.6660
NCA2.532.450.090.842.532.390.230.992.522.220.612.11
NMC2.482.450.930.432.472.410.940.542.46n.a.1.16n.a.
LCO2.452.430.972.082.432.370.890.572.431.990.792.53
LTO1.281.271.352.581.280.940.991.791.290.970.405.80
LMO1.921.982.360.921.921.982.040.701.931.772.211.45
ResistanceµInit
[mΩ]
µEnd
[mΩ]
SInit [%]SEnd [%]µInit
[mΩ]
µEnd [mΩ]SInit [%]SEnd [%]µInit [mΩ]µEnd [mΩ]SInit [%]SEnd [%]
LFP43.447.05.917.4744.747.26.913.0344.046.44.112.1850
NCA20.522.37.228.6519.720.84.792.6219.433.64.113.97
NMC67.570.53.074.2566.974.02.613.0267.085.32.47n.a.
LCO61.465.88.444.2361.369.84.639.1160.967.55.538.45
LTO29.947.313.240.928.939.527.911.628.426.95.3610.4
LMO41.940.415.813.248.345.217.311.748.943.327.819.5
LFP44.053.15.772.5150.752.54.542.8750.756.34.692.7160
NCA20.021.15.113.6819.621.13.214.6320.033.18.165.02
NMC66.872.22.582.7466.577.72.104.8368.1n.a.5.91n.a.
LCO62.366.73.506.3760.875.55.939.7763.065.84.966.09
LTO26.639.216.317.533.640.421.821.733.324.67.2712.3
LMO47.236.436.017.544.333.717.84.6636.635.017.11.79
Publisher’s Note: MDPI stays neutral with regard to jurisdictional claims in published maps and institutional affiliations.

