Next Article in Journal
Comparison of Advanced Charge Strategies for Modular Cascaded Battery Chargers
Next Article in Special Issue
Energy Acquisition of Solar-Powered Joint-Wing Aircraft Considering Mismatch Power Loss
Previous Article in Journal
Assessment of Passive Retrofitting Scenarios in Heritage Residential Buildings in Hot, Dry Climates
 
 
Correction published on 30 August 2022, see Energies 2022, 15(17), 6316.
Article

Modeling, Analysis and Optimization of Grid-Integrated and Islanded Solar PV Systems for the Ethiopian Residential Sector: Considering an Emerging Utility Tariff Plan for 2021 and Beyond

by
Tefera Mekonnen
1,2,*,
Ramchandra Bhandari
1 and
Venkata Ramayya
3
1
Renewable Energy System Department, Institute for Technology and Resources Management in the Tropics and Subtropics (ITT), TH Köln (University of Applied Science), Betzdorfer Strasse 2, 50679 Cologne, Germany
2
Faculty of Electrical and Computer Engineering, Institute of Technology, Jimma University, Jimma P.O. Box 378, Ethiopia
3
Sustainable Energy Engineering, Institute of Technology, Jimma University, Jimma P.O. Box 378, Ethiopia
*
Author to whom correspondence should be addressed.
Submission received: 13 April 2021 / Revised: 27 May 2021 / Accepted: 3 June 2021 / Published: 7 June 2021 / Corrected: 30 August 2022

Abstract

:
Currently, difficulties such as the depletion of fossil fuel resources and the associated environmental pollution have driven the rise of other energy systems based on green energy sources. In this research, modeling and a viability study of grid-connected and islanded photovoltaic (PV) power systems for supplying the residential load in Mekelle City, Ethiopia, were carried out considering the country’s emerging utility tariff plan for 2021 and beyond. The technical viability of the proposed supply option was analyzed using PVGIS, PVWatts and HOMER Pro tool, while the economic and environmental optimization aspects were carried out using HOMER Pro. Sensitivity analyses and output comparisons among the three renewable energy simulation tools are presented. The results showed that under the consideration of an incremental electricity tariff plan (up to 2021), the analyzed cost of energy of the grid/PV system is around 12% lower than the utility grid tariff. Moreover, we also found that by taking the continuous global solar PV cost reduction into account, the cost of energy of the modeled islanded operation of solar PV power units totally broke the grid tariff in Ethiopia after 2029 based on the tariff for 2021 and well before with the expected escalation of the grid tariff on an annual basis. The technical performance of the system realized through PVGIS and PVWatts was almost comparable to the HOMER Pro outputs. Thus, this investigation will offer a clear direction to the concerned target groups and policy developers in the evolution of PV power supply options throughout the technically viable locations in the country.

1. Introduction

World economies are highly reliant on energy. However, in many developing countries, access to an electric supply system is still a particular concern. Ethiopia is one such country, situated in East Africa with a surface area of 1,127,127 km2 and a population of about 109 million at the end of 2019 [1,2]. In 2018, only about 45% of the total population had access to electricity [3], and the current electric power consumption of the country is overly dependent on hydropower, as shown in Figure 1 [4,5]. Due the continual growth of the population in the country and on account of the climatic influences on the hydropower segment, the country has been in an electric power shortage for long period. Electric power outages are experienced in the country every other day. According to some reports (e.g., [6,7]), the yearly average number of interruptions in the country is estimated to be around 102, with the average outage duration lasting 70 h. In order to withstand these outages and to get a reliable power system, most firms in the country use diesel fuel as a power source [8]. However, a diesel generator has its own drawbacks, such as the high associated cost and CO2 emissions.
The residential building sector uses almost 40% of electrical energy consumption in the country, and, in addition to diesel fuel, a significant proportion of traditional biomass energy is consumed by the residential sector [9,10]. Thus, consideration ought to be given to developing and changing the mix of energy system to other clean power sources like solar PV in the domestic sector. Because of the continuing commercial maturation of solar PV, solar power is one of the best solutions to overcome the issue of electric energy demand increments and environmental concerns. Ethiopia is well endowed with solar energy potential and has irradiation potential ranging from 4.5 to 7.5 kWh/m2/day [11,12]. Moreover, Ethiopia has the advantage of extensive sunshine duration hours per day and massive areas of free lands [13]. The overall installation price of solar PV power is expected to decrease significantly in the near term all over the world. The average cost of PV power will be 589 USD/kW by 2030 and 320 USD/kW by 2050 against the average of 1110 USD/kW in 2018 [14,15,16]. Even if though these factors make Ethiopia among the most appropriate countries for the utilization of solar PV power, adoption of solar PV technologies in the country has remained sluggish, as shown in Figure 1. Therefore, tangible investigations analyzing the technical, economic and environmental viability of grid-tied and islanded modes of solar PV power using different simulation software could be very important for the location, since no such investigation has been done in the past. For ensuring the country’s energy security and by taking the 2021 conventional incremental grid tariff into account (from the current 0.04 USD/kWh, which is the lowest in Sub-Saharan Africa to 0.07 $/kWh), recently, the Ethiopian government has also encouraged investigation into renewable distributed generation technologies further, either in grid-connected or off-grid schemes [17].
In the grid-integrated approach, a solar PV microgrid supplies to or draws from the grid depending on the production and demand. In addition to the supply option, a grid-connected PV system provides possibilities for selling the extra power produced to the grid [18]. Because of these advantages, several big utility customers, hospitals, schools, and other organizations are moving towards grid-tied PV systems to meet their needs. In islanded mode, solar PV systems with storage independently operates in islanded mode without connection to the main grid. This system can be applied as an off-grid supply option or could serve during blackouts.
In the past, many researchers have examined the technical and economic viability of grid-tied and off-grid PV systems in various locations using different simulation tools.
Owolabi et al. [19] studied the economic and environmental sustainability of grid-integrated solar PV systems in six regions of the northeastern part of Nigeria using RETScreen software. The results indicated that the Yobe site is considered as the most appropriate location for implementing a 10 MW grid-integrated PV system due to its high yearly solar irradiation of 5.96 kWh/m2/d. This system may reduce 5452 tons of greenhouse gas emissions annually. Tomar et al. [20] presented a viability analysis of a grid-integrated rooftop PV system for the three different residential consumers, with consideration of feed-in tariff techniques in New Delhi, India, utilizing HOMER software. The outputs depicted that the feed-in tariff rule has a lower impact on high slab households than low slab consumers. In [21], for off-grid applications, the solar energy potential of three selected sites in Palestine was evaluated with the help of the System Advisor Model tool. They concluded that the site had enough solar potential and that solar power plant implementation is economically competitive for the locations. The authors in [22] explored the technical and financial analysis of an off-grid PV LED street lighting system for northern regions of Turkey using HOMER optimization tool. The results indicated that based on the solar potential of the site, the COE of the grid-independent PV LED street lighting system varied between 0.229 and 0.362 USD/kWh for the M4 street illumination classes. Zandi et al. [23] analyzed the economic and the environmental impact of solar PV power for the household consumption sector in Iran using RETScreen software. The results showed that the application of solar PV power for household use is economical and it played a high role in minimizing greenhouse emissions. Imam et al. [24] evaluated the technical and financial viability of a grid-integrated PV system for domestic buildings in Jeddah, Saudi Arabia, using the SAM simulation tool. The results showed that grid-tied PV systems for residential building were technically and financially viable. In [25], a performance evaluation of an 84 kW peak grid-connected rooftop solar PV system in Istanbul, Turkey, utilizing PV*SOL software, was introduced. The simulation output showed that the proposed system supplied 13.2% of the buildings’ yearly energy consumption. Kumar et al. [26] pointed out the technical financial viability of a 1 MW grid-tied solar PV system for University Malaysia, Malaysia, utilizing the PVGIS and PVWatts simulation tools. They concluded that the site had enough solar potential and that the proposed system was economically competitive for the location. The authors in [27] explored the financial feasibility of a 5 MW grid-dependent PV system at eight sites in Iran using the RETScreen simulation tool. Fixed, single and double axis tracking methods were analyzed in the study. The results showed that the grid-integrated single axis tracking PV power system was more cost effective than the remaining fixed and double tracking methods for all locations. Nastasi et al. [28] investigated the solar power and hydrogen storage applications for three island buildings situated close to Naples, Italy. The E-OPT tool based on a mixed-integer non-linear programming analyzer was used to optimize the simulated hydrogen energy system’s outline. The outputs revealed that of the different scales of simulated storage options, hydrogen storage provided strong seasonal storage in comparison with battery storage technology with a similar size. Novaes et al. [29] evaluated the economic viability of a grid-tied PV system for air conditioning in two cities of Brazil using the PVSyst optimization tool. The results showed that the grid-tied PV system was financially feasible for the sites. Ayadi et al. [30] analyzed the economic competitiveness of a grid-tied PV system with consideration of fixed, single and double axis tracking PV panels for the University of Jordan in Jordan. The TRNSYS simulation tool was applied in the analysis. The results suggested that the grid-connected single and double axis tracking PV power systems were less cost-effective than the grid-tied fixed axis PV system for the site. Delano et al. [31] analyzed the technical and economic viability of off-grid hybrid renewable power system for Fouay village in Benin, utilizing the HOMER optimization tool. The results indicated that among the considered supply configurations, the PV/diesel/battery system was the least cost system for the area. Cauz et al. [32] examined the technical and economic advantages and disadvantages of three renewable energy combinations options for supplying the energy needs in Easter Island, Chile, using PVSyst software and mixed-integer linear programming. The results showed that the initial investment and the COE of PV/wind/ pyrolysis with battery/hydrogen storage power systems were both reduced by about 50% as compared with the typical PV/battery system. In [33], the financial and technical analysis of a grid-dependent PV system in Guinea’s savannah region was examined using the HOMER tool. The output showed that, in order to increase PV penetration and to make it cost-effective in the location, the proposed system may need legislative provision and operating incentives.
The economic viability gaps of solar PV microgrids against grid tariffs reviewed by different investigations are summarized in Table 1 for some countries elsewhere.
The literature reviewed above affords a strong foundation for this study by examining the technical and economic analysis case studies conducted in various locations of the world. However, a viability study of grid-integrated and islanded PV microgrid systems considering the country’s future grid electricity tariff plan with a comparison of different renewable energy simulation tools has not been properly addressed in the literature. Therefore, this investigation aimed to reduce this gap of awareness by providing a techno-economic viability analysis, modeling and optimization of grid-tied and islanded solar PV operations to supply a residential load for Mekelle City in Ethiopia. To examine the economic feasibility of grid-tied PV systems, the country’s proposed 2021 utility tariff plan was taken into consideration. Currently, the energy tariff in Ethiopia is exceedingly subsidized by the government and is one of the lowest in the Africa. In order to balance the generation cost and the sell tariff, the Ethiopian electric utility (EEU) has a plan to increase the electricity tariff from the current 0.04 USD/kWh to 0.07 USD/kWh by 2021. Because of this, the analysis of grid-tied PV systems in this research considered the amended tariff. In the islanded solar PV power system analysis, by considering the continuing cost reduction of PV panels in the future, a cost breakdown of solar PV power over the main utility grid was analyzed. Yield and capacity factor were examined as technical pointers, whereas the economic indicators comprised the COE, net present cost and payback period. PVGIS, PVWatts and HOMER Pro were utilized to examine the technical viability of the planned system. Due to a lack of financial and emission analysis options in PVGIS and PVWatts packages, only HOMER Pro software was applied for the economic and environmental analysis aspects under both grid-tied and islanded operation of PV systems. A comparison of technical performance among the three software packages (PVGIS, PVWatts and HOMER Pro) and a sensitivity analysis were also conducted.
The next sections of the article are organized as follows: Section 2 introduces the overall depiction of the site. The method and modeling of grid-integrated and islanded operated PV systems for the location are explained in Section 3. Results and discussions are presented in Section 4. Lastly, the conclusions of this investigation are presented in Section 5.

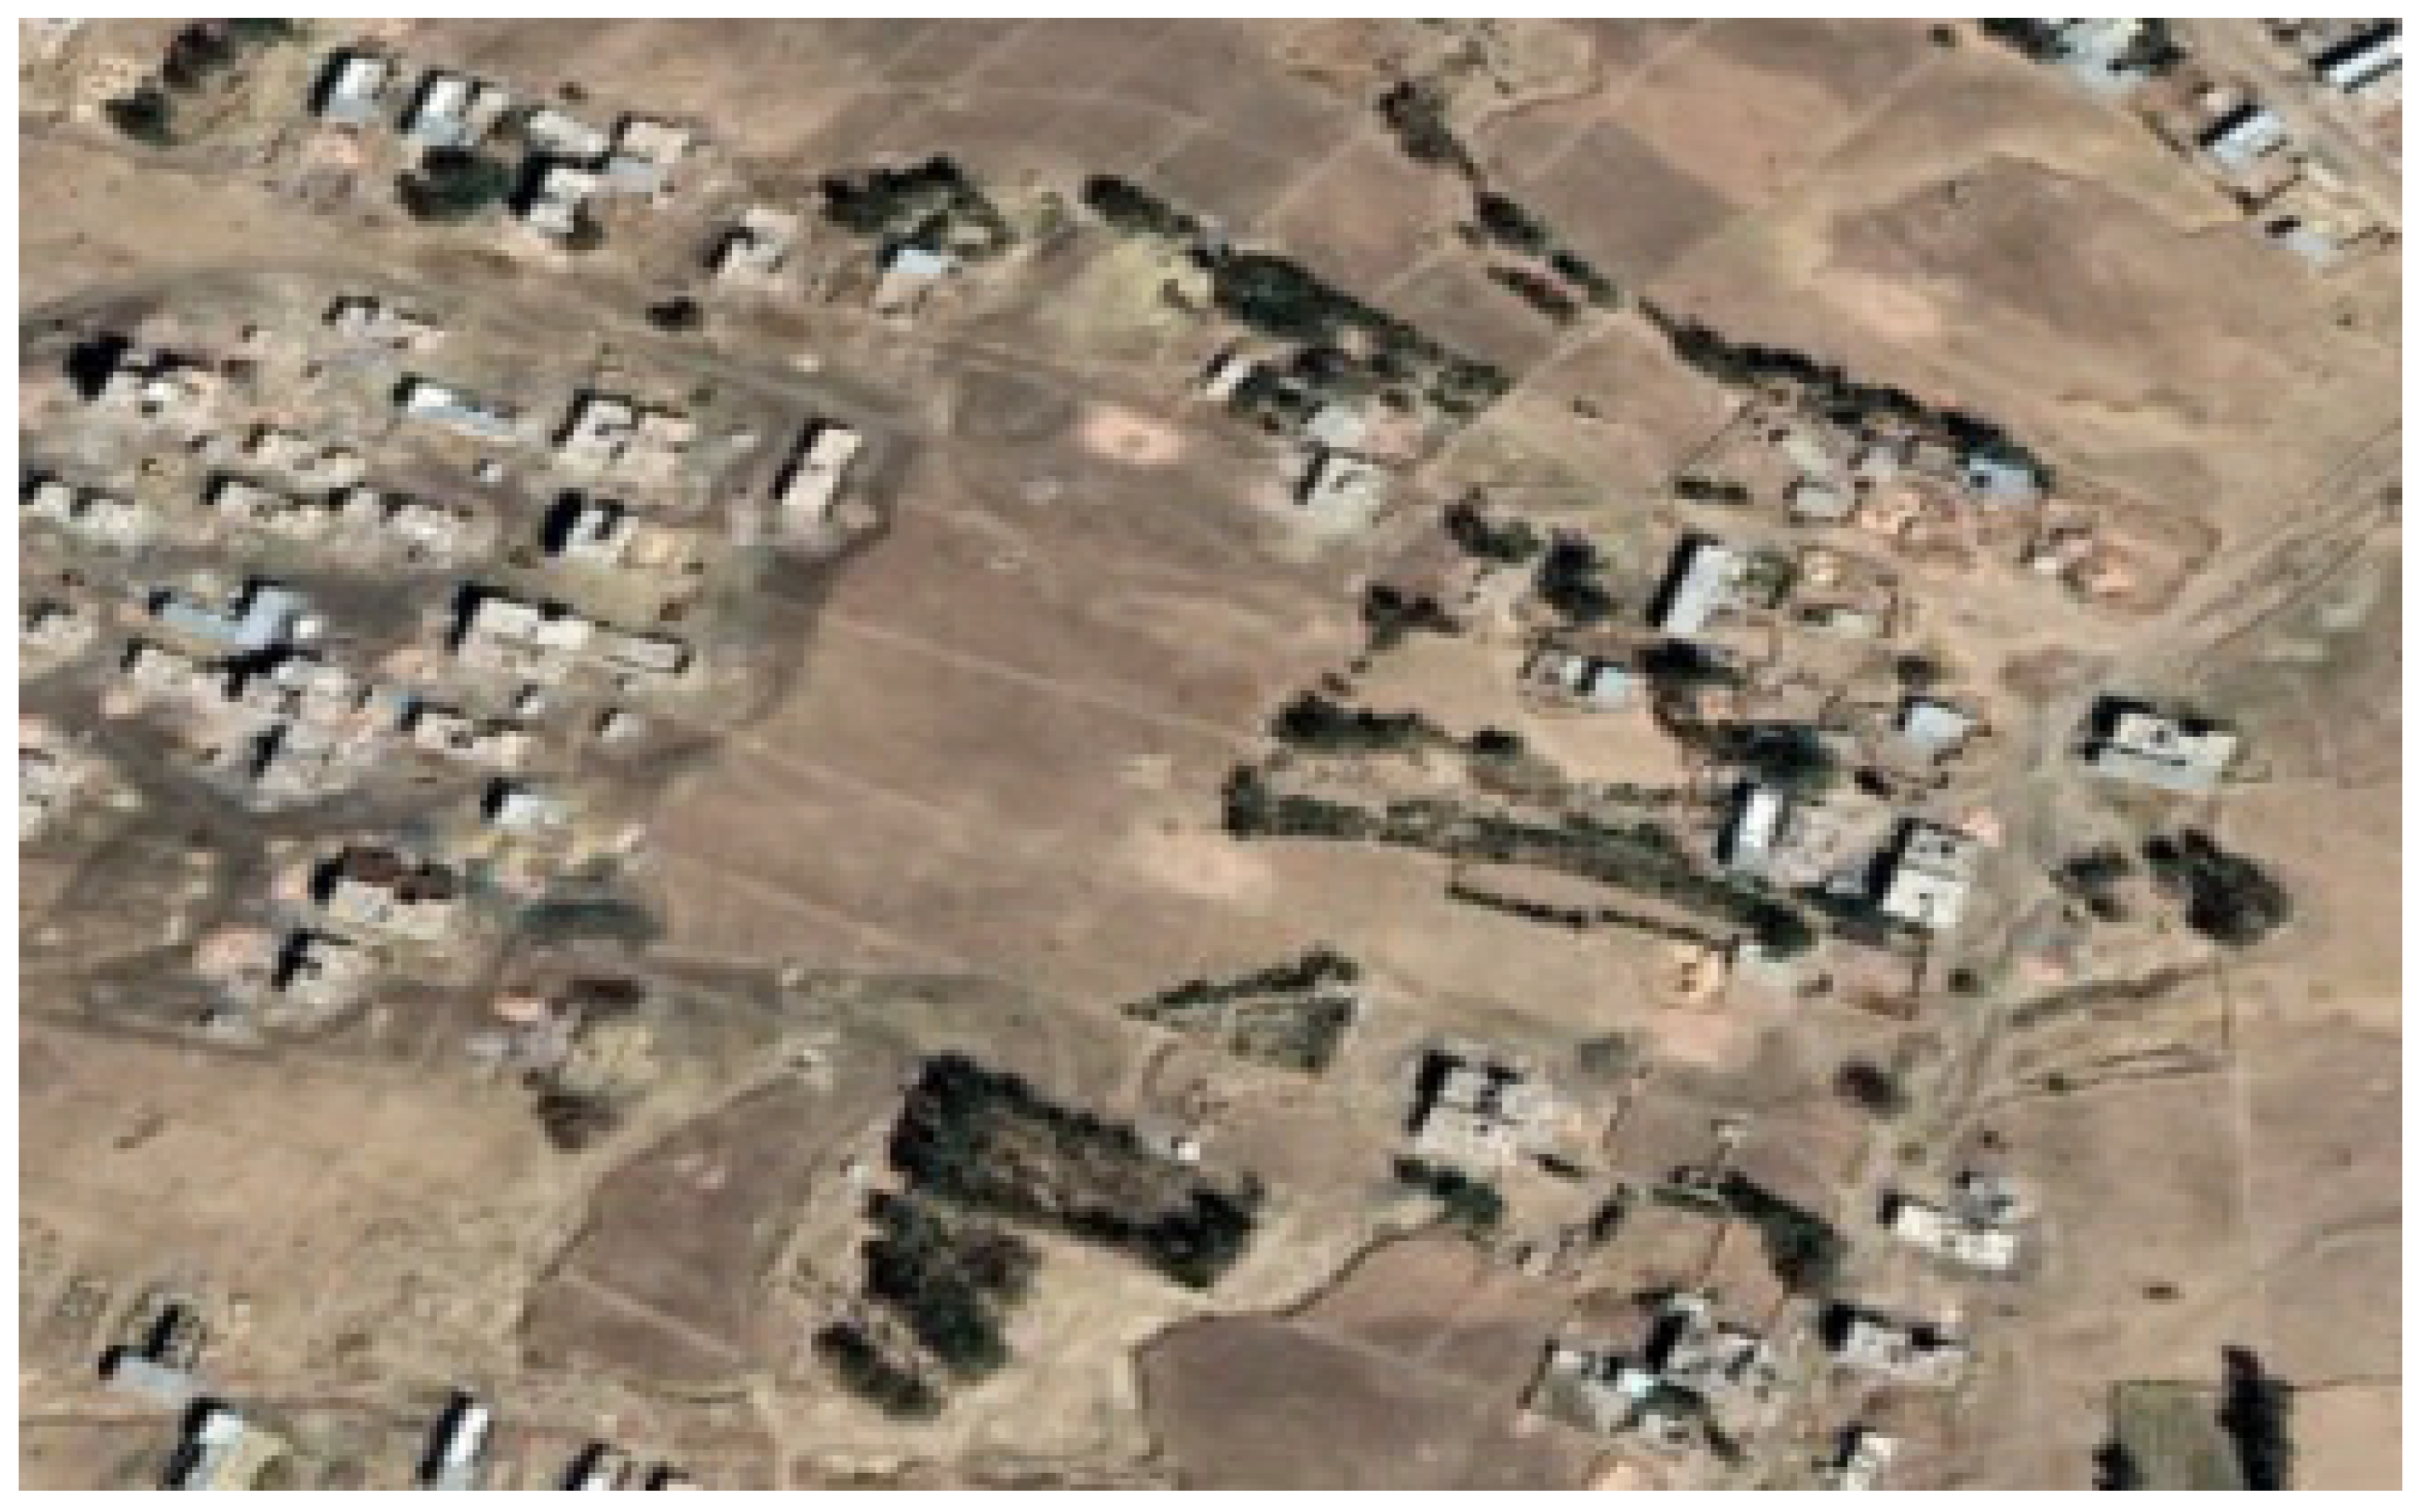
2. Location Description

Ethiopia has embarked on an economic and social transformation process and aims to join the lower middle-income countries by 2025 [42,43]. As explained earlier, economic growth is highly dependent on energy. The consumption of electricity rises according to the population growth in a definite location, especially for the residential building sector. The residential sector identified for this study was estimated to demand a 40.17 kW peak of power, equal to a scaled yearly average of 324 kWh/d. The location is situated in the west of Mekelle City in the Tigray region, Ethiopia, geographically located at latitude 13.29 N and longitude 39.28 E. The elevation above sea level is around 2255 m. The layout of the site is shown in Figure 2.

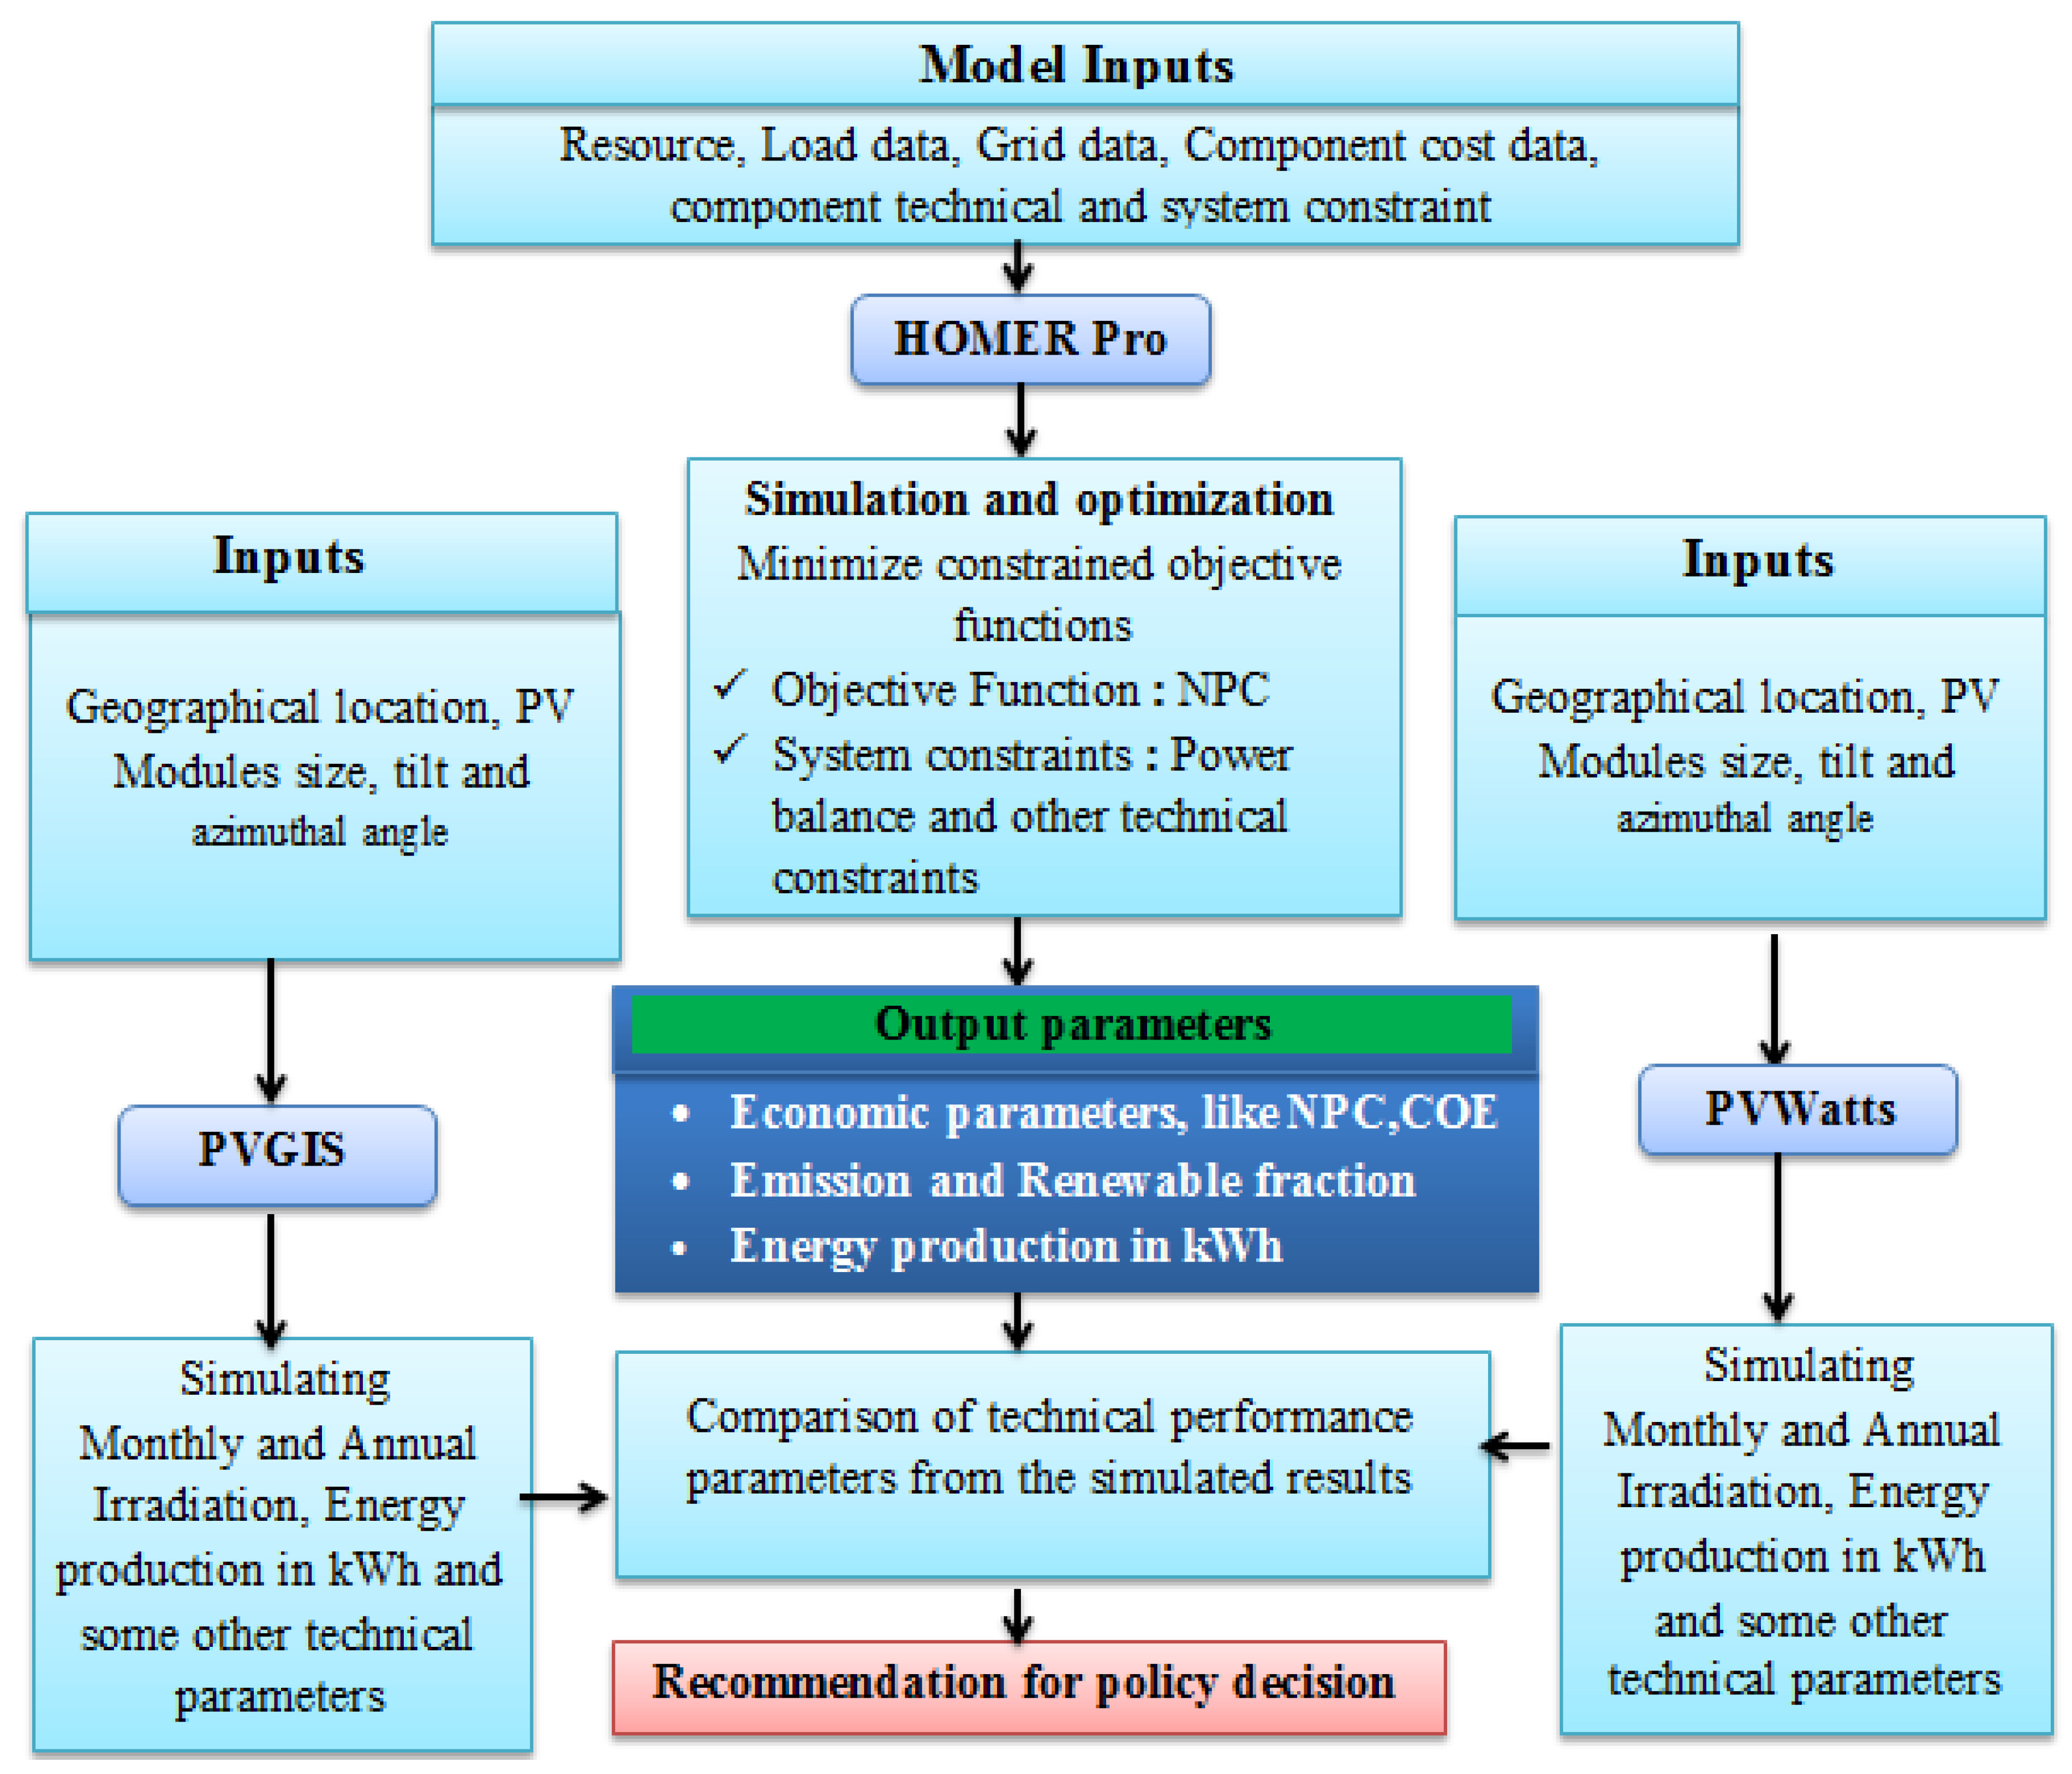
3. Methods and Tools

This section explores the suggested system and the tools utilized for the investigation, including the required input data, the components’ specifications and the mathematical model.

3.1. Simulation Tools

In this study, 3 simulation tools—specifically PVGIS, PVWatts and HOMER Pro— were utilized to evaluate the performance of grid-connected/islanded solar PV power systems.

3.1.1. PVGIS

PVGIS is denoted as a photovoltaic geographical information system. It is one of the best known free online solar PV energy estimator tools for standalone or grid-tied PV systems in the majority of areas of Europe, Asia, America and Africa [44]. This has been developed by the European Commission [45]. This software comes with a package containing the solar irradiance database and a performance valuation technique. The computation method is based on the solar irradiation model, and the key interpolations are realized within the open-source GRASS GIS software The solar irradiation model algorithm utilizes the analysis method available in the Global Solar Radiation Atlas. The software utilizes a big database and maps of the aforementioned countries are available. The maps symbolize a yearly sum of solar irradiance on both flat and inclined surfaces [46].
The maps are accessible with tabs that allow the user to compute the energy output of installed solar PV systems by filling in the required parameters in the boxes. The basic variables needing to be inserted into the software are: the location or the site where the PV plant is proposed (latitude and longitude), PV plant sizing, optimum tilt and azimuthal angle. Finally, annual energy yield, monthly energy yields, solar radiation, capacity factors, annual energy cost and system losses are simulated after running the software. Simulated outputs are visualized in various conceivable ways as per the user’s necessity, i.e., in the form of tabular, graphical, Word or Excel, and in PDF form. The basic limitations of this software are:
There is no function for economic analysis or optimization in the developed package.
There is no option for sensitivity analysis in the developed package.
To run the simulation, internet is always needed.

3.1.2. PVWatts

PVWatts is another web-based simulation device utilized for analyzing the electricity generation of PV systems. The National Renewable Energy Laboratory (NREL) developed it [47]. This software considers the irradiation information for the designated site from the nearby location, and peruses Typical Meteorological Year 3 (TMY3) and Typical Meteorological Year 2 (TMY2) solar data from the National Solar Radiation Database (NSRDB) of the NREL [48]. Using meteorological annual data for the nominated area, PVWatts allows a user to perform a simulation through some default or user-adjusted system parameters. To simulate a solar PV system’s energy production in PVWatts software, the following steps are followed:
  • BeginPVWatts online simulation tools through https://pvwatts.nrel.gov/ [accessed on 12 October 2020].
  • Enter the location name in the “get started tab” found on the top left of the page that allows user to choose the desired location.
  • Click “GO TO” to reach the simulation page.
  • Enter the system size needed for installation.
  • Select the solar PV type to be utilized in the system.
  • Enter the allowable total system losses.
  • Provide/choose the tilt and azimuth angle.
  • Click on calculate to run the simulation.
  • The report is produced, giving data on average monthly/annually energy generation.
PVWatts also allows the user to plot the area that is required for the PV power plant installation. The limitations of PVGIS stated above could also be observed in PVWatts software. In addition to these limitations, for some locations, the data are not available and, by default, PVWatts selects the area nearest to the system’s site, which is a little bit different from the measured value

3.1.3. HOMER

HOMER (Hybrid Optimization Model for Electric Renewable) is a computer simulation tool, which was developed by the NREL and is appropriate for carrying out viability, optimization and sensitivity examinations of grid-tied and off-grid supply systems with any combination of power sources [49]. This tool utilizes inputs like climate data for the specified sites, different technology alternatives, component price, grid, load demand data, and the lifespan of the project to simulate various scheme alignments. After the user-defined decision variable values are given as an input, the HOMER Pro algorithm considers each probable combination of resources and simulates all viable configurations that can meet the required system demand and constraints in each time step of the year. In the outputs, viable configurations of the system are shown according to their NPC in ascending order. HOMER takes NPC as the objective function and power balance as the system constraints in its optimization algorithm. The system that meets the load demand with the lowest NPC is taken as the optimal [50,51]. HOMER Pro version 3.10, which performs all the stated tasks, was used in this study. Figure 3 indicates the flowchart of the HOMER Pro tool’s structure with the other (PVGIS and PVWatts) software packages. Some of the limitations for this tool are:
  • Detailed input values are required.
  • Time consuming.
  • If you miss key values or sizes, HOMER will not guess them.
By considering the basic input parameters, HOMER Pro compares and estimates a system based on the total NPC with the help of the following [41,52,53] formula:
NPC = C an , tot CRF ( i , N )
where C an , tot is the entire annualized cost (USD/year) and CRF(i,N) is the capital recovery factor, which is computed by utilizing the following equation [52,54]:
CRF ( i , N ) = i ( 1 + i ) N ( 1 + i ) N 1
where i is the yearly real interest rate (%) and N is the project lifespan in years. For this research, 25 years was supposed as a project lifespan.
The yearly real interest rate is associated with the nominal interest rate and inflation rate, and was analyzed by the following formula [55]:
i = i n f 1 + f
where i n is the nominal interest rate (%) and f is the yearly inflation rate (%). For this research, a 13.5% nominal interest rate and a 12% annual inflation rate were taken [56]. Within these parameters and utilizing Equation (3), a 1.34% real interest rate was obtained. This was considered as one of the sensitivity variables later.
The COE is, furthermore, an important factor and needs to be considered while modeling any power system configuration. It is analyzed as the ratio of the whole lifecycle price to the entire lifespan’s power generation. HOMER Pro utilizes the following equation to compute the cost of energy [57]:
C O E = C an , tot E P + E d + E gs
where E P is the entire quantity of primary load that the system serves per annum (kWh/yr), E d is the entire amounts of deferrable load that the system serves per annum (kWh/yr) and E gs is the amount of energy vended to the grid per annum (kWh/yr).
The yearly capacity shortage fraction and operating reserve were taken as additional system constraints. The proposed system was considered to be 100% reliable and thus the maximum yearly supply shortage was recognized as 0%. By considering unexpected decrements of the resource and increments in the load, 10% random variability as the operating reserve was considered in this system analysis.
Payback period (PBP) is another significant factor in the systems’ economics analysis, and is explained as the number of years needed to recuperate the entire expense of the project. In this investigation, this time relates to the essential period to get a return in cash from solar PV investment. The PBP is computed as follows [58]:
PBP = IC + j = 1 P NCF ( 1 + i ) j
where NCF is cash flow for year j, i is the yearly interest rate and IC is the initial cost.

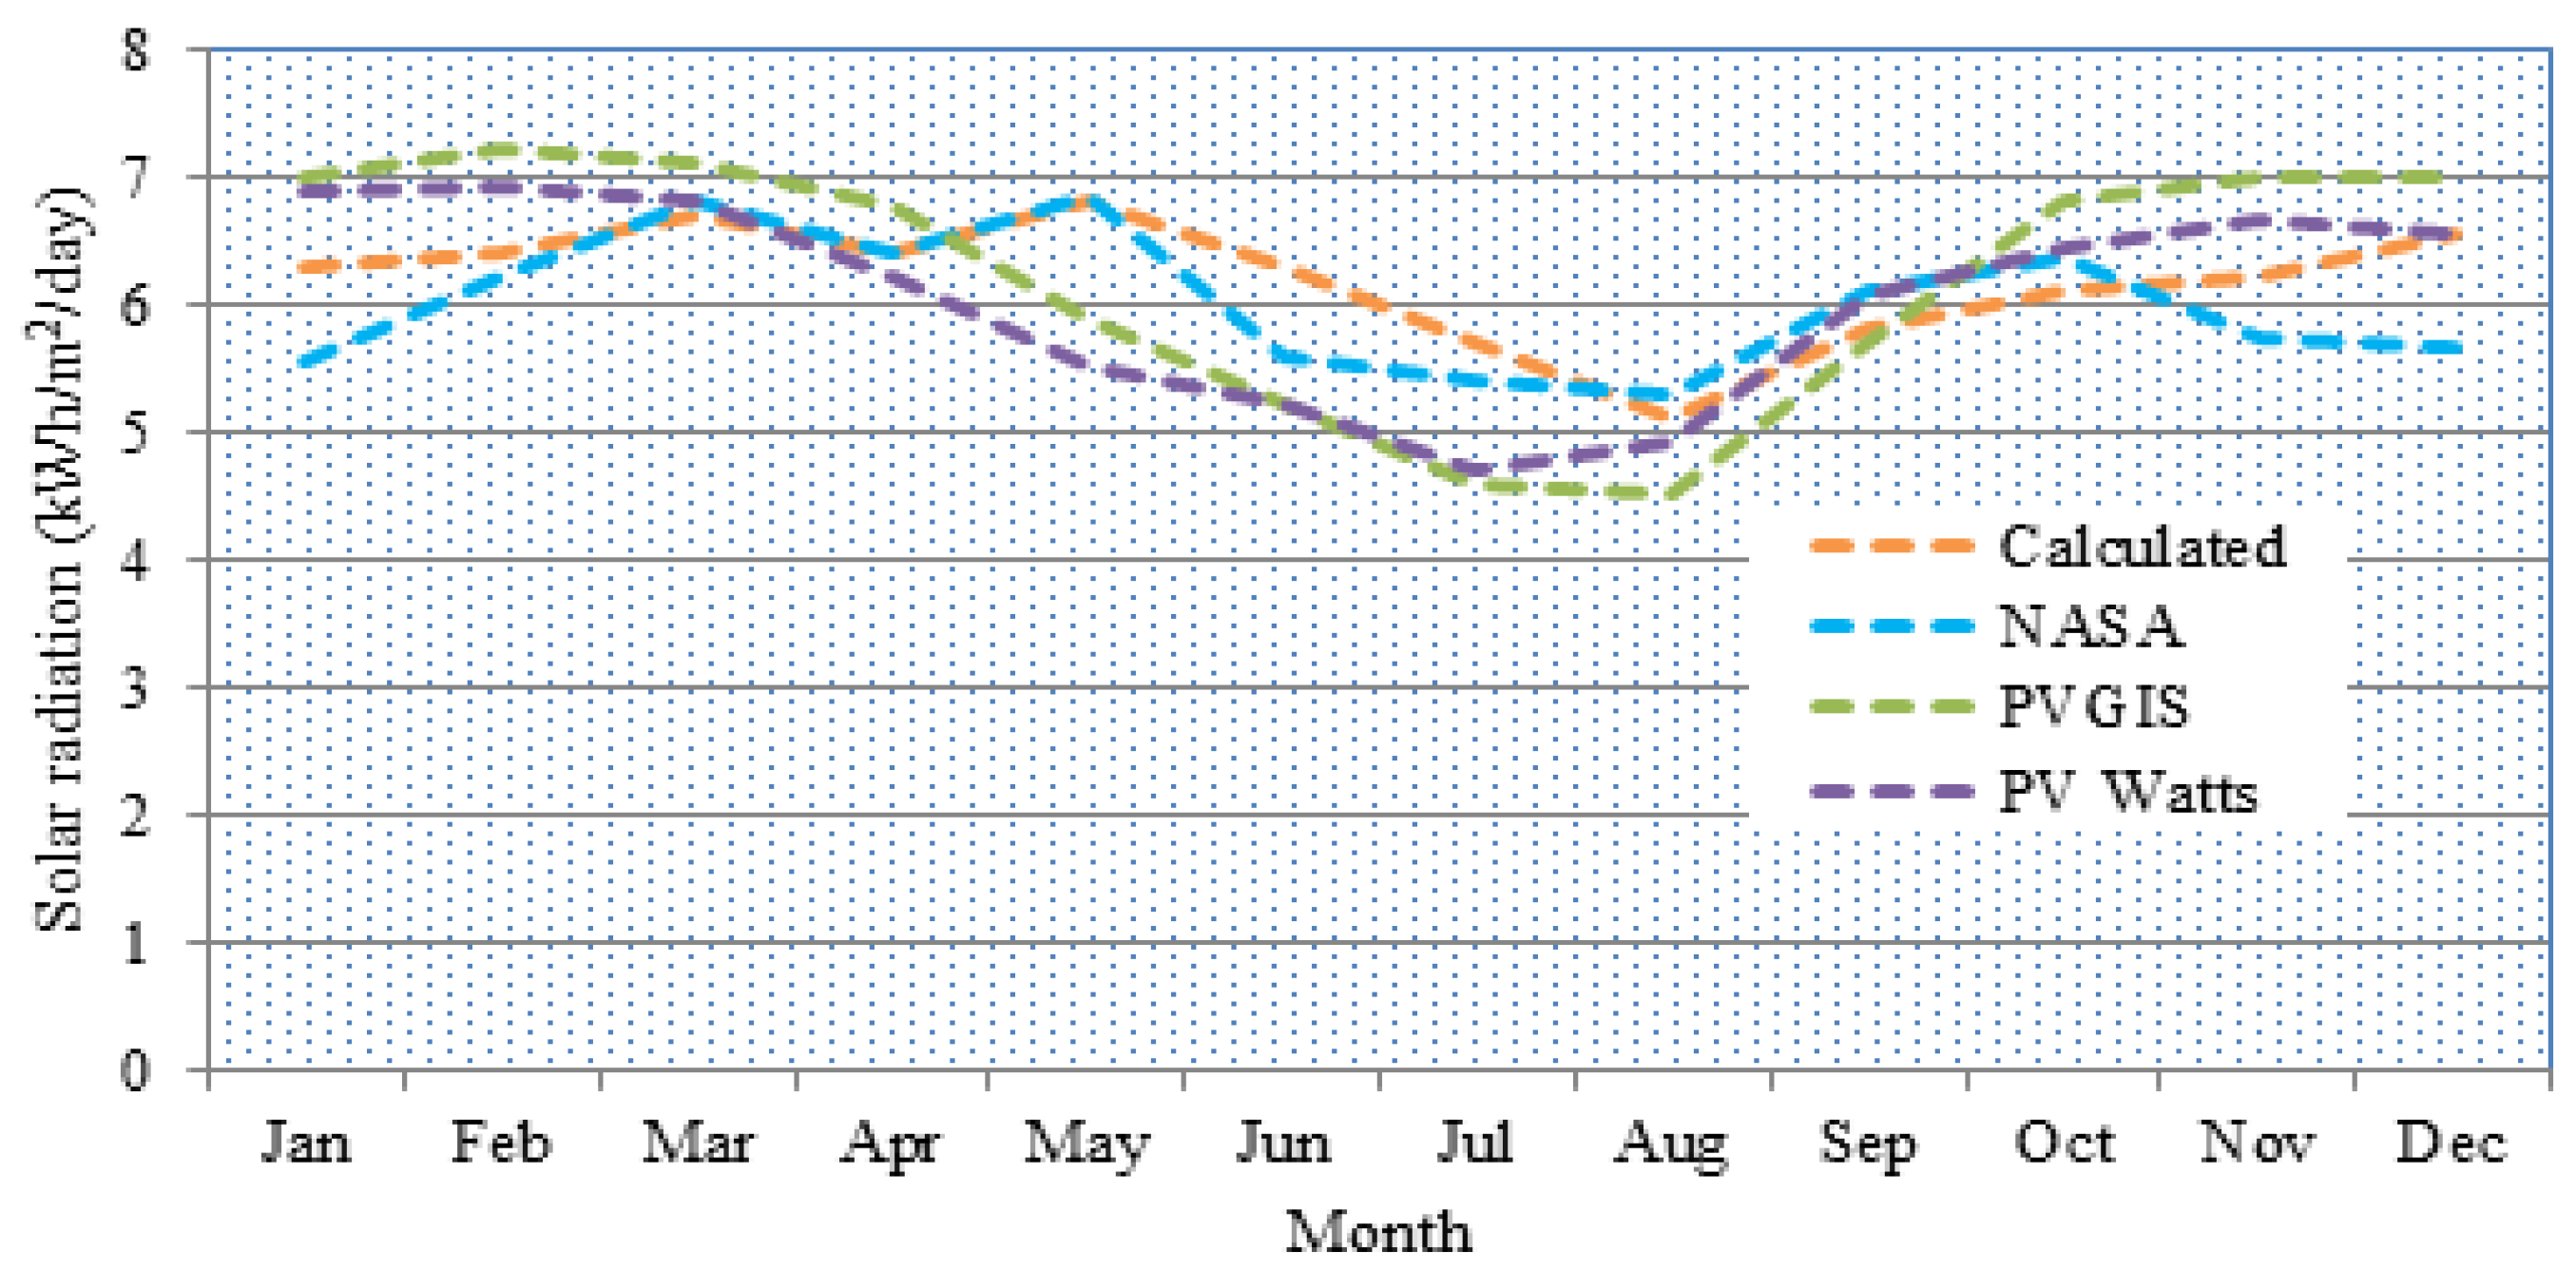
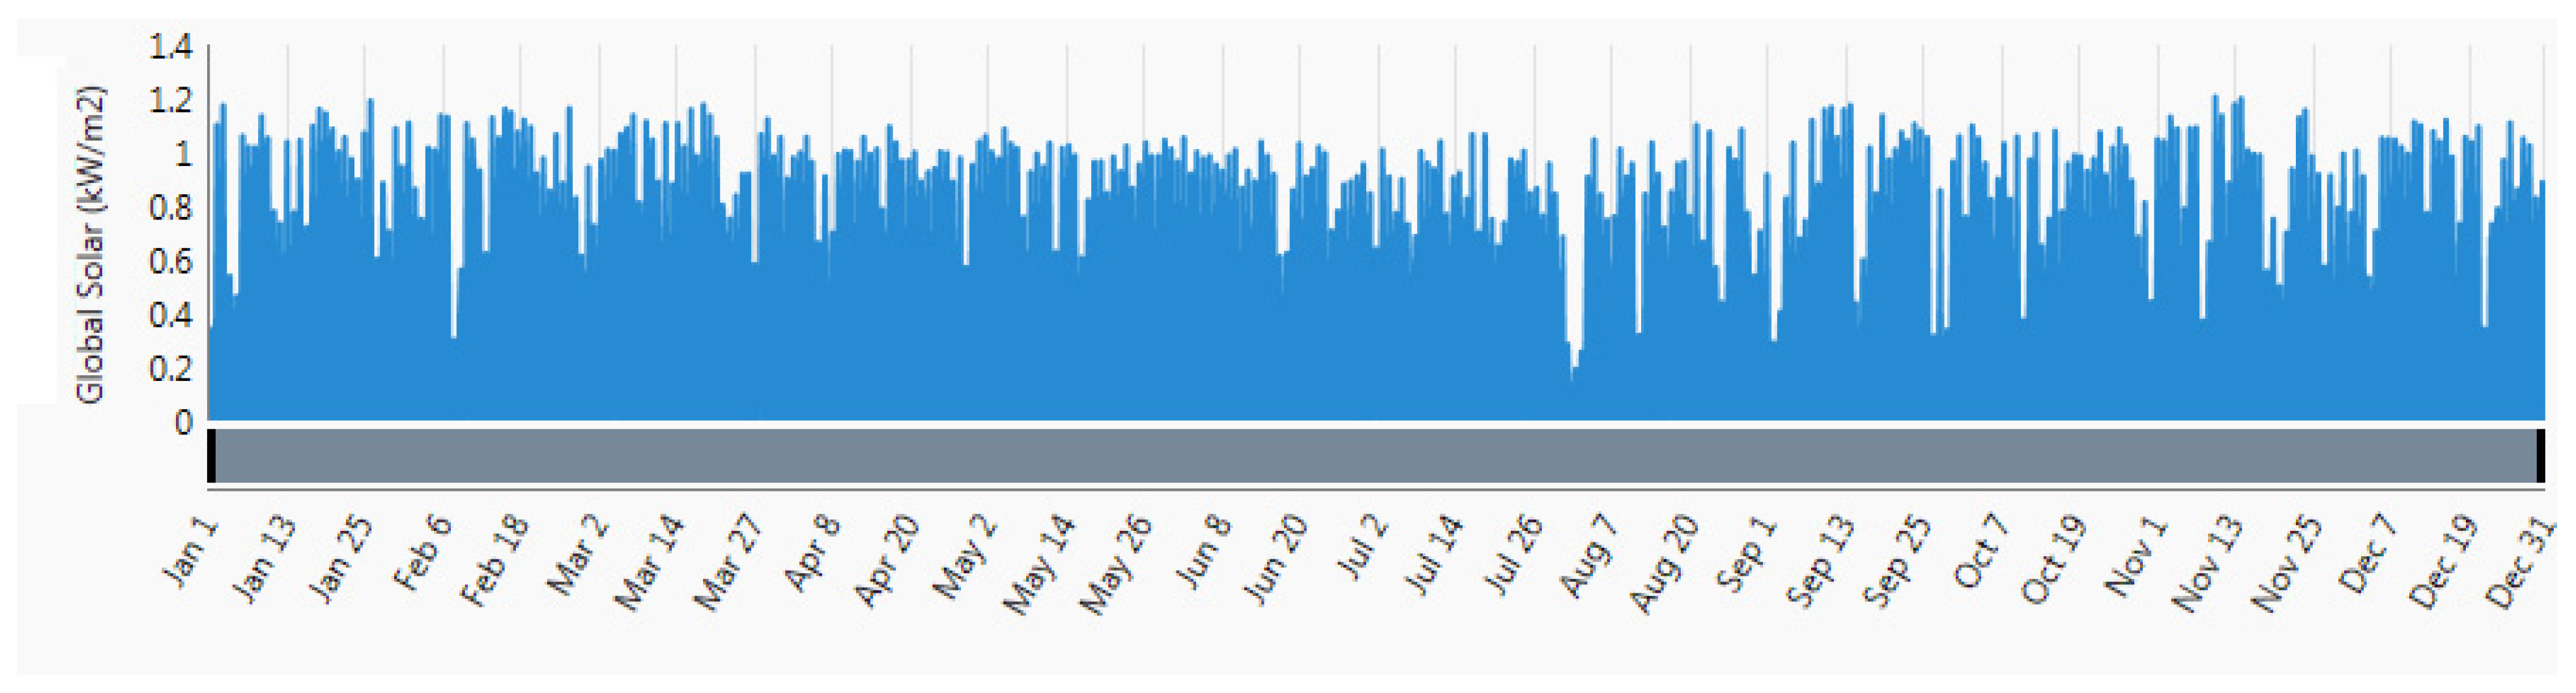
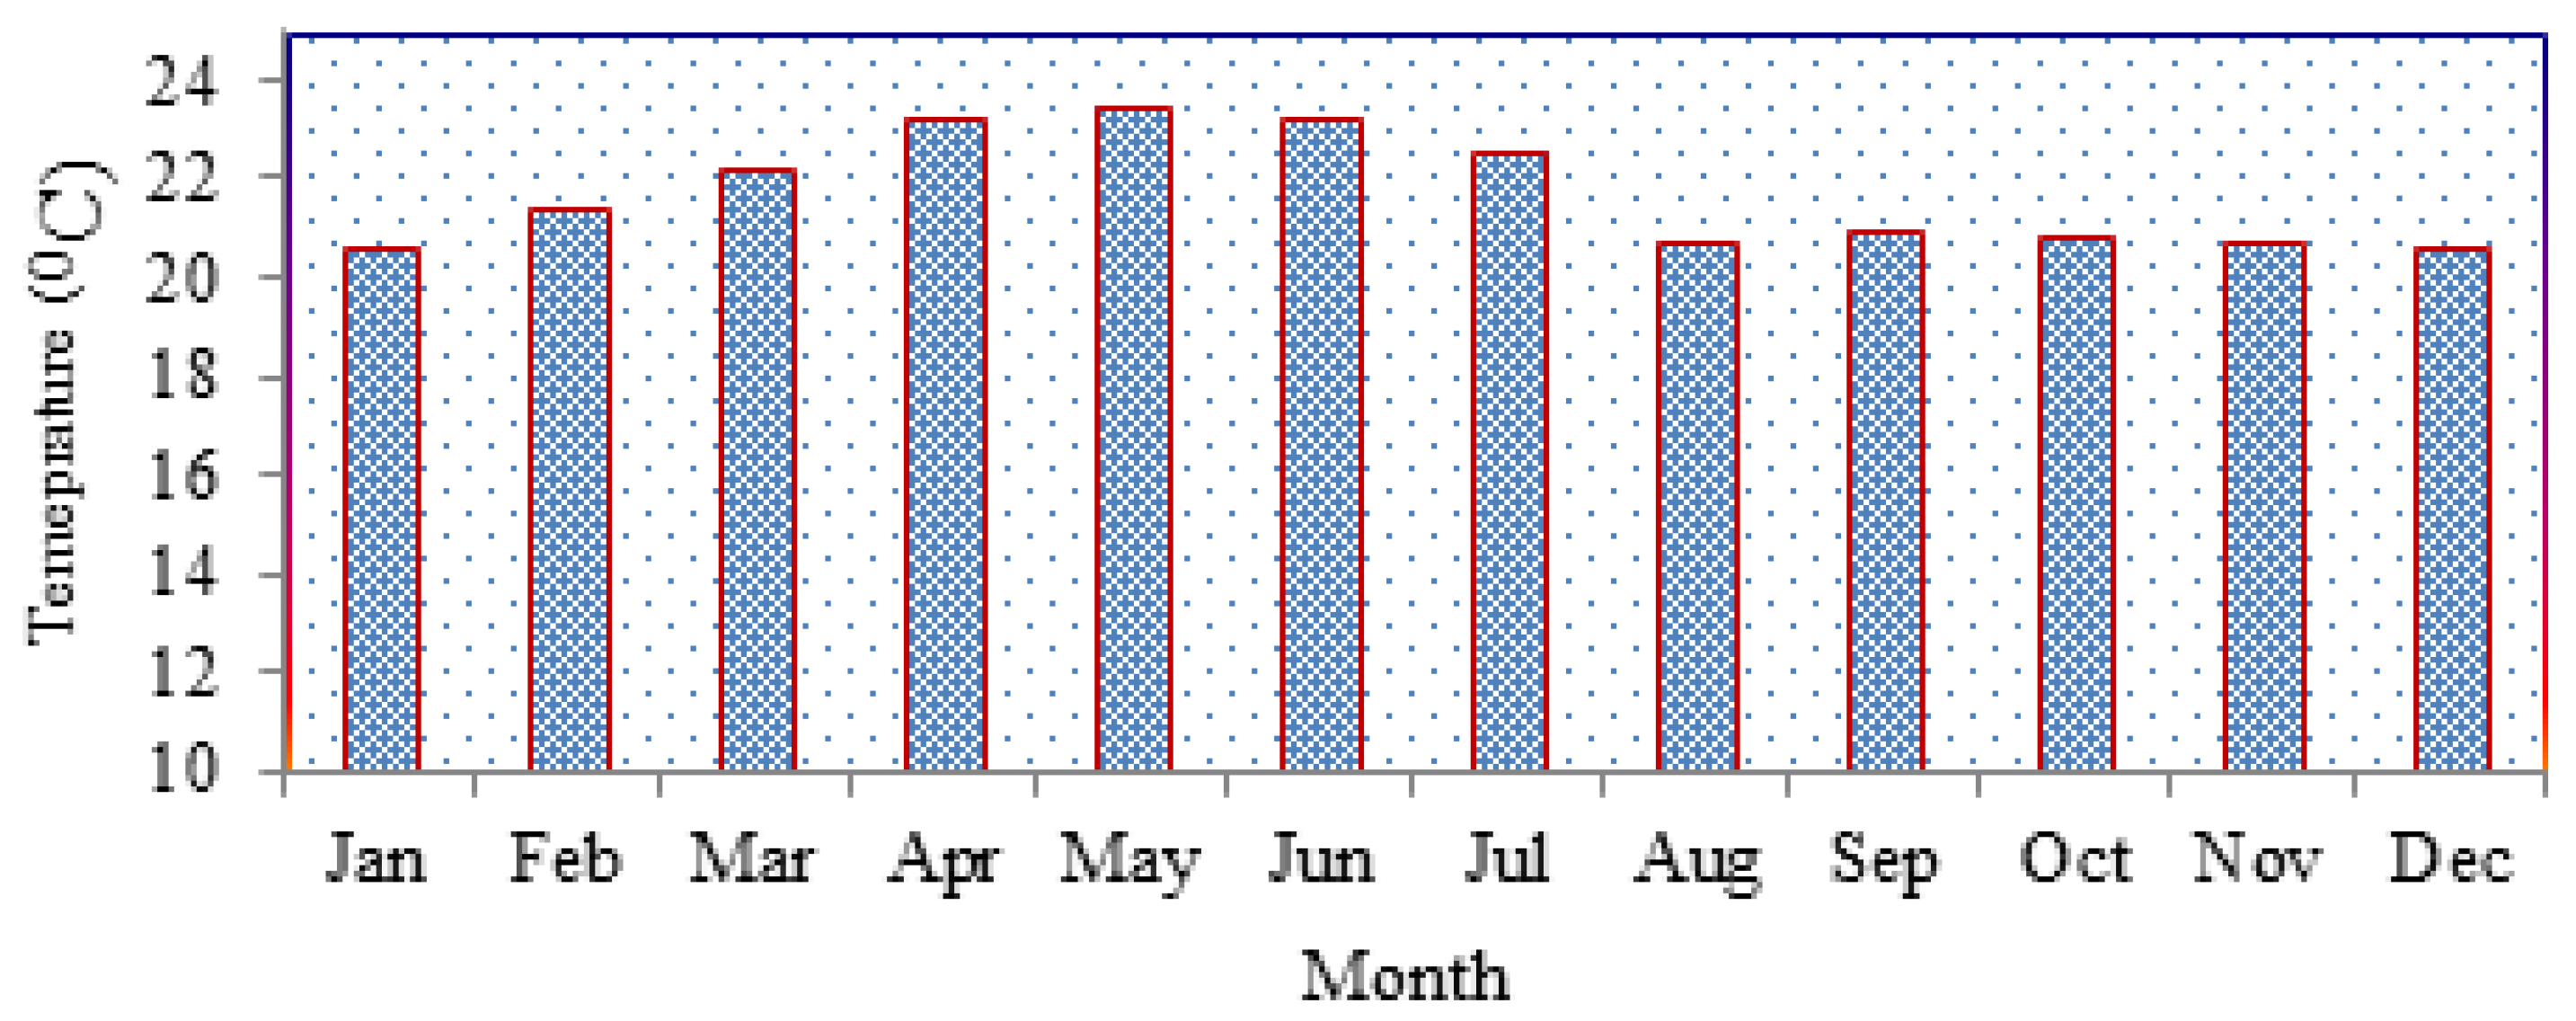
3.2. Climate Data of the Location
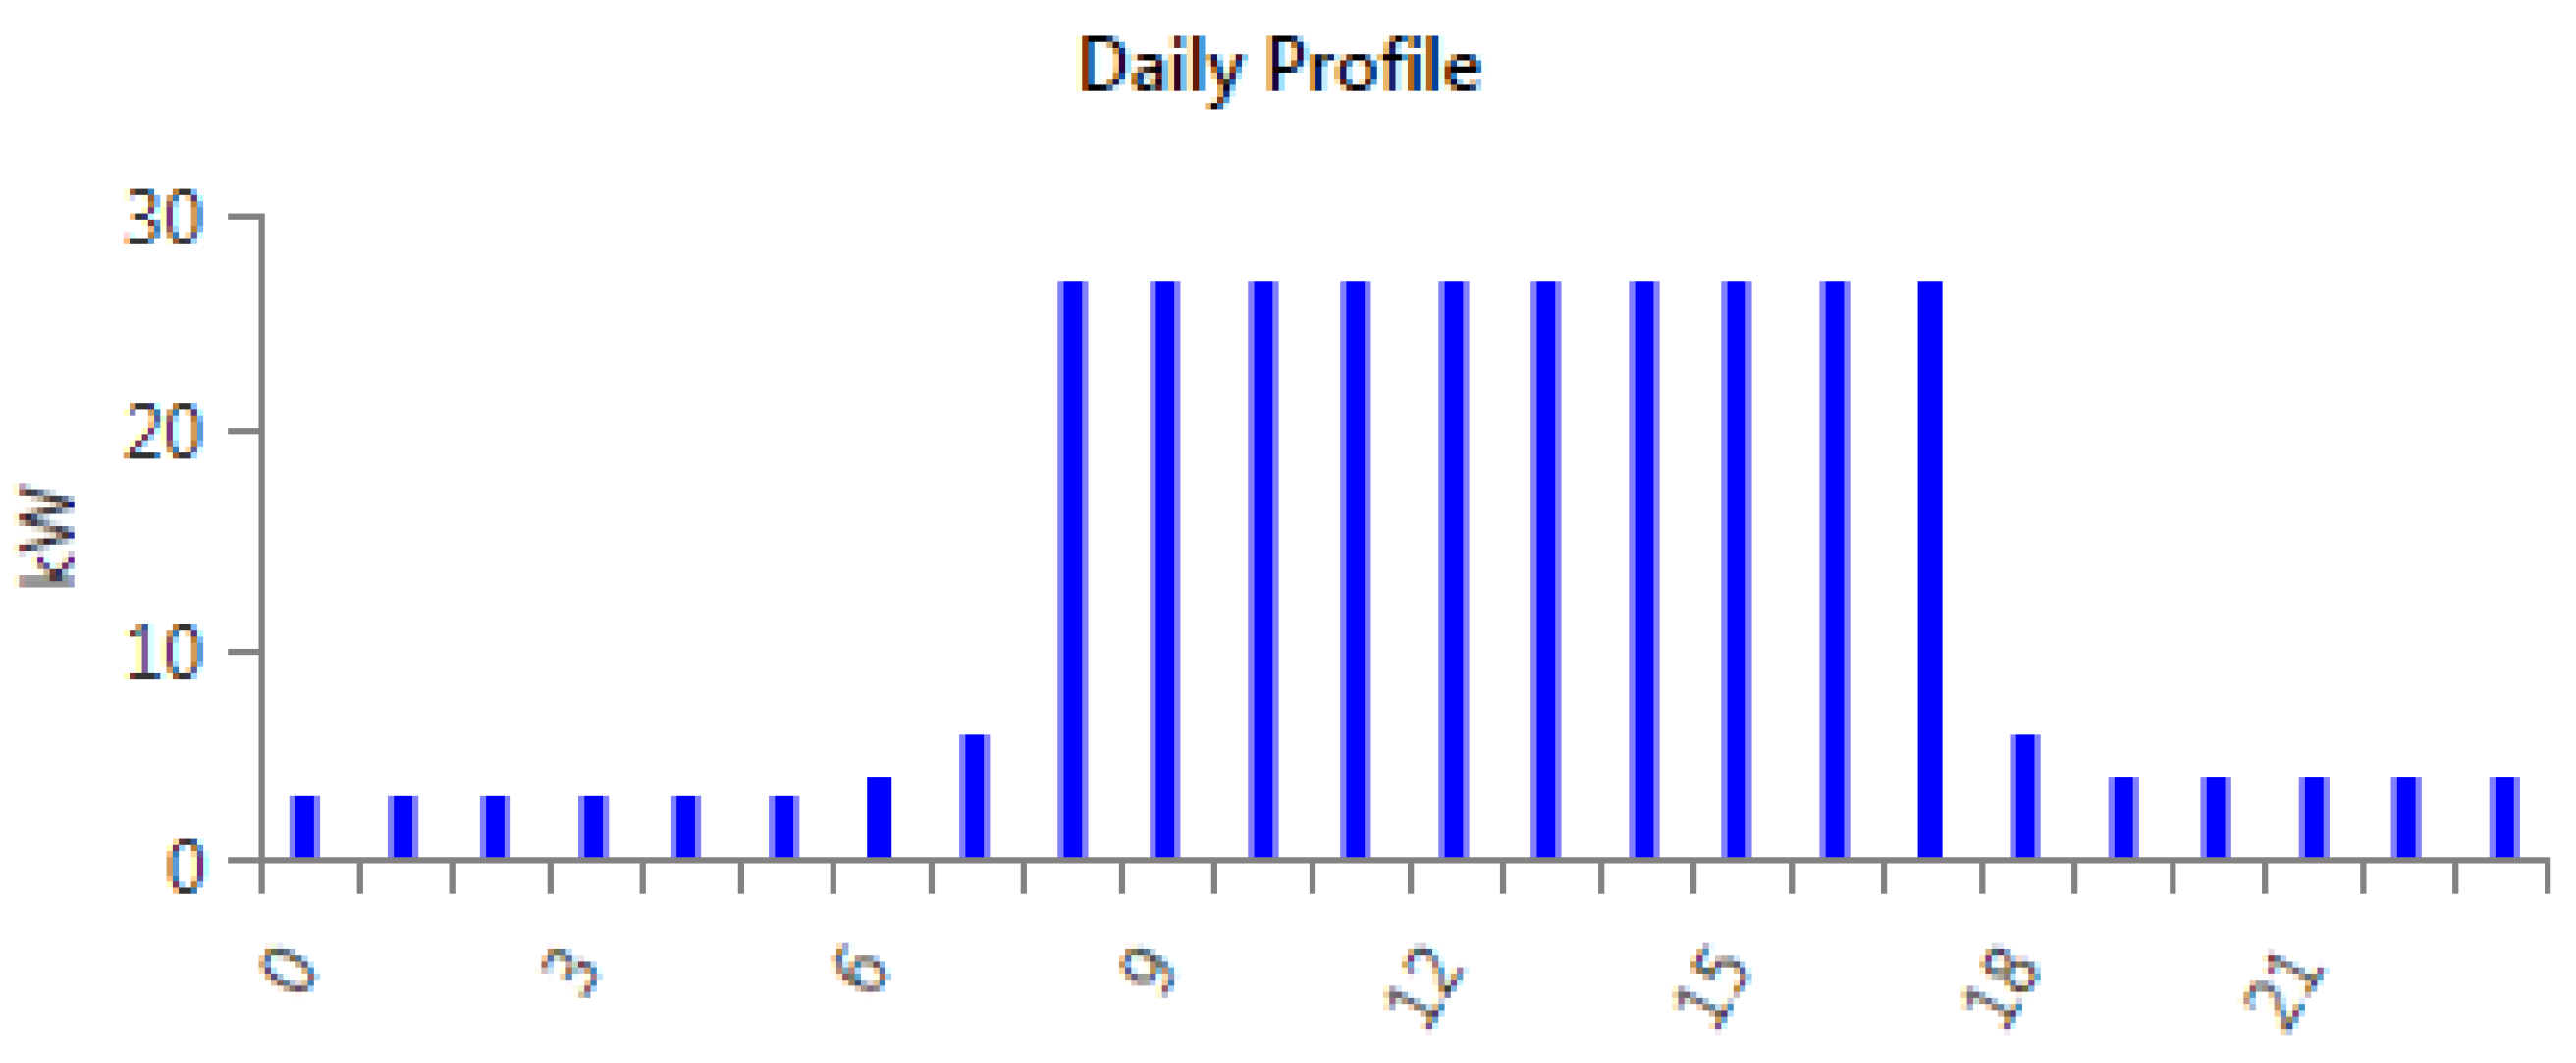
For the investigated site, there is no appropriately documented solar irradiation value; what is accessible in the National Meteorological Agency of Ethiopia is the sunlight duration value only. However, it is possible to calculate the monthly solar irradiation from the daily sunshine data using empirical equations [59,60], which are given by Equations (6)–(10).
H = H O ( a + b ( S S O ) )
where H is the monthly average daily irradiation on a flat surface (MJ / m 2 ) , H O is the monthly average daily extraterrestrial irradiation on a flat surface (MJ / m 2 ) , S is the monthly average daily number of bright sunlight hours, and S O is the maxima probable daily hours of bright sunlight. The constants a and b are regression constants based upon the coordinates of a site. In this research, regression constants that had values of a = 0.33 and b = 0.43 were utilized [59]. The monthly average extraterrestrial irradiation was calculated with help of Equation (7).
H O = 24 3600 G S C π ( 1 + 0.033 c o s ( 360 n d 365 ) ) ( c o s ϕ c o s δ s i n ɷ s + π ɷ s 180 s i n ϕ   s i n δ )
where n d is the day number beginning with 1 January as 1; G S C is the solar constant (1367 W/ m 2 ); ϕ is the latitude of the site (13°29′0.12″ N); δ is the declination angle (°), analyzed with Equation (8) and ɷ s is the sunset hour angle (°), given by Equation (9).
δ = 23.45 s i n ( 360 284 + n d 365 )
ɷ s = c o s 1 ( t a n ϕ     t a n δ )
The maximum probable sunlight duration S O is computed as:
S O = 2 15 c o s 1 ( t a n ϕ     t a n δ )
Based on the above Equations (6)–(10), the solar irradiation of the location was analyzed. The calculated yearly average irradiation for the site is 6.15 kWh/m2/day. To validate the calculated result, the PVGIS, PVWatts and NASA databases were also used. The yearly average irradiation data obtained from PVGIS, PVWatts and NASA for the location were 6.10, 6.08 and 5.99 kWh/m2/day correspondingly.
The average monthly irradiation data taken from PVGIS, PVWatts and NASA, and the calculated value for the studied area is shown in Figure 4. Hourly calculated irradiation is also shown in Figure 5. For this study, the computed data were considered.
To obtain the real power output from solar PV power, recognizing the ambient temperature of the site is very essential. Figure 6 indicates the average monthly temperature of the site obtained from the National Meteorology Agency of Ethiopia. The yearly average temperature in the location is 21.59 °C.

3.3. Load Profile

The considered demand of the site has been taken from the particular region of the Ethiopian Electric Utility (EEU) in 2020. The assumed average daily electric power demand of the site was 324 kWh/day. The proposed grid-integrated and islanded PV power system was demonstrated by considering the demand of this site. The average daily load of this site is revealed in Figure 7.

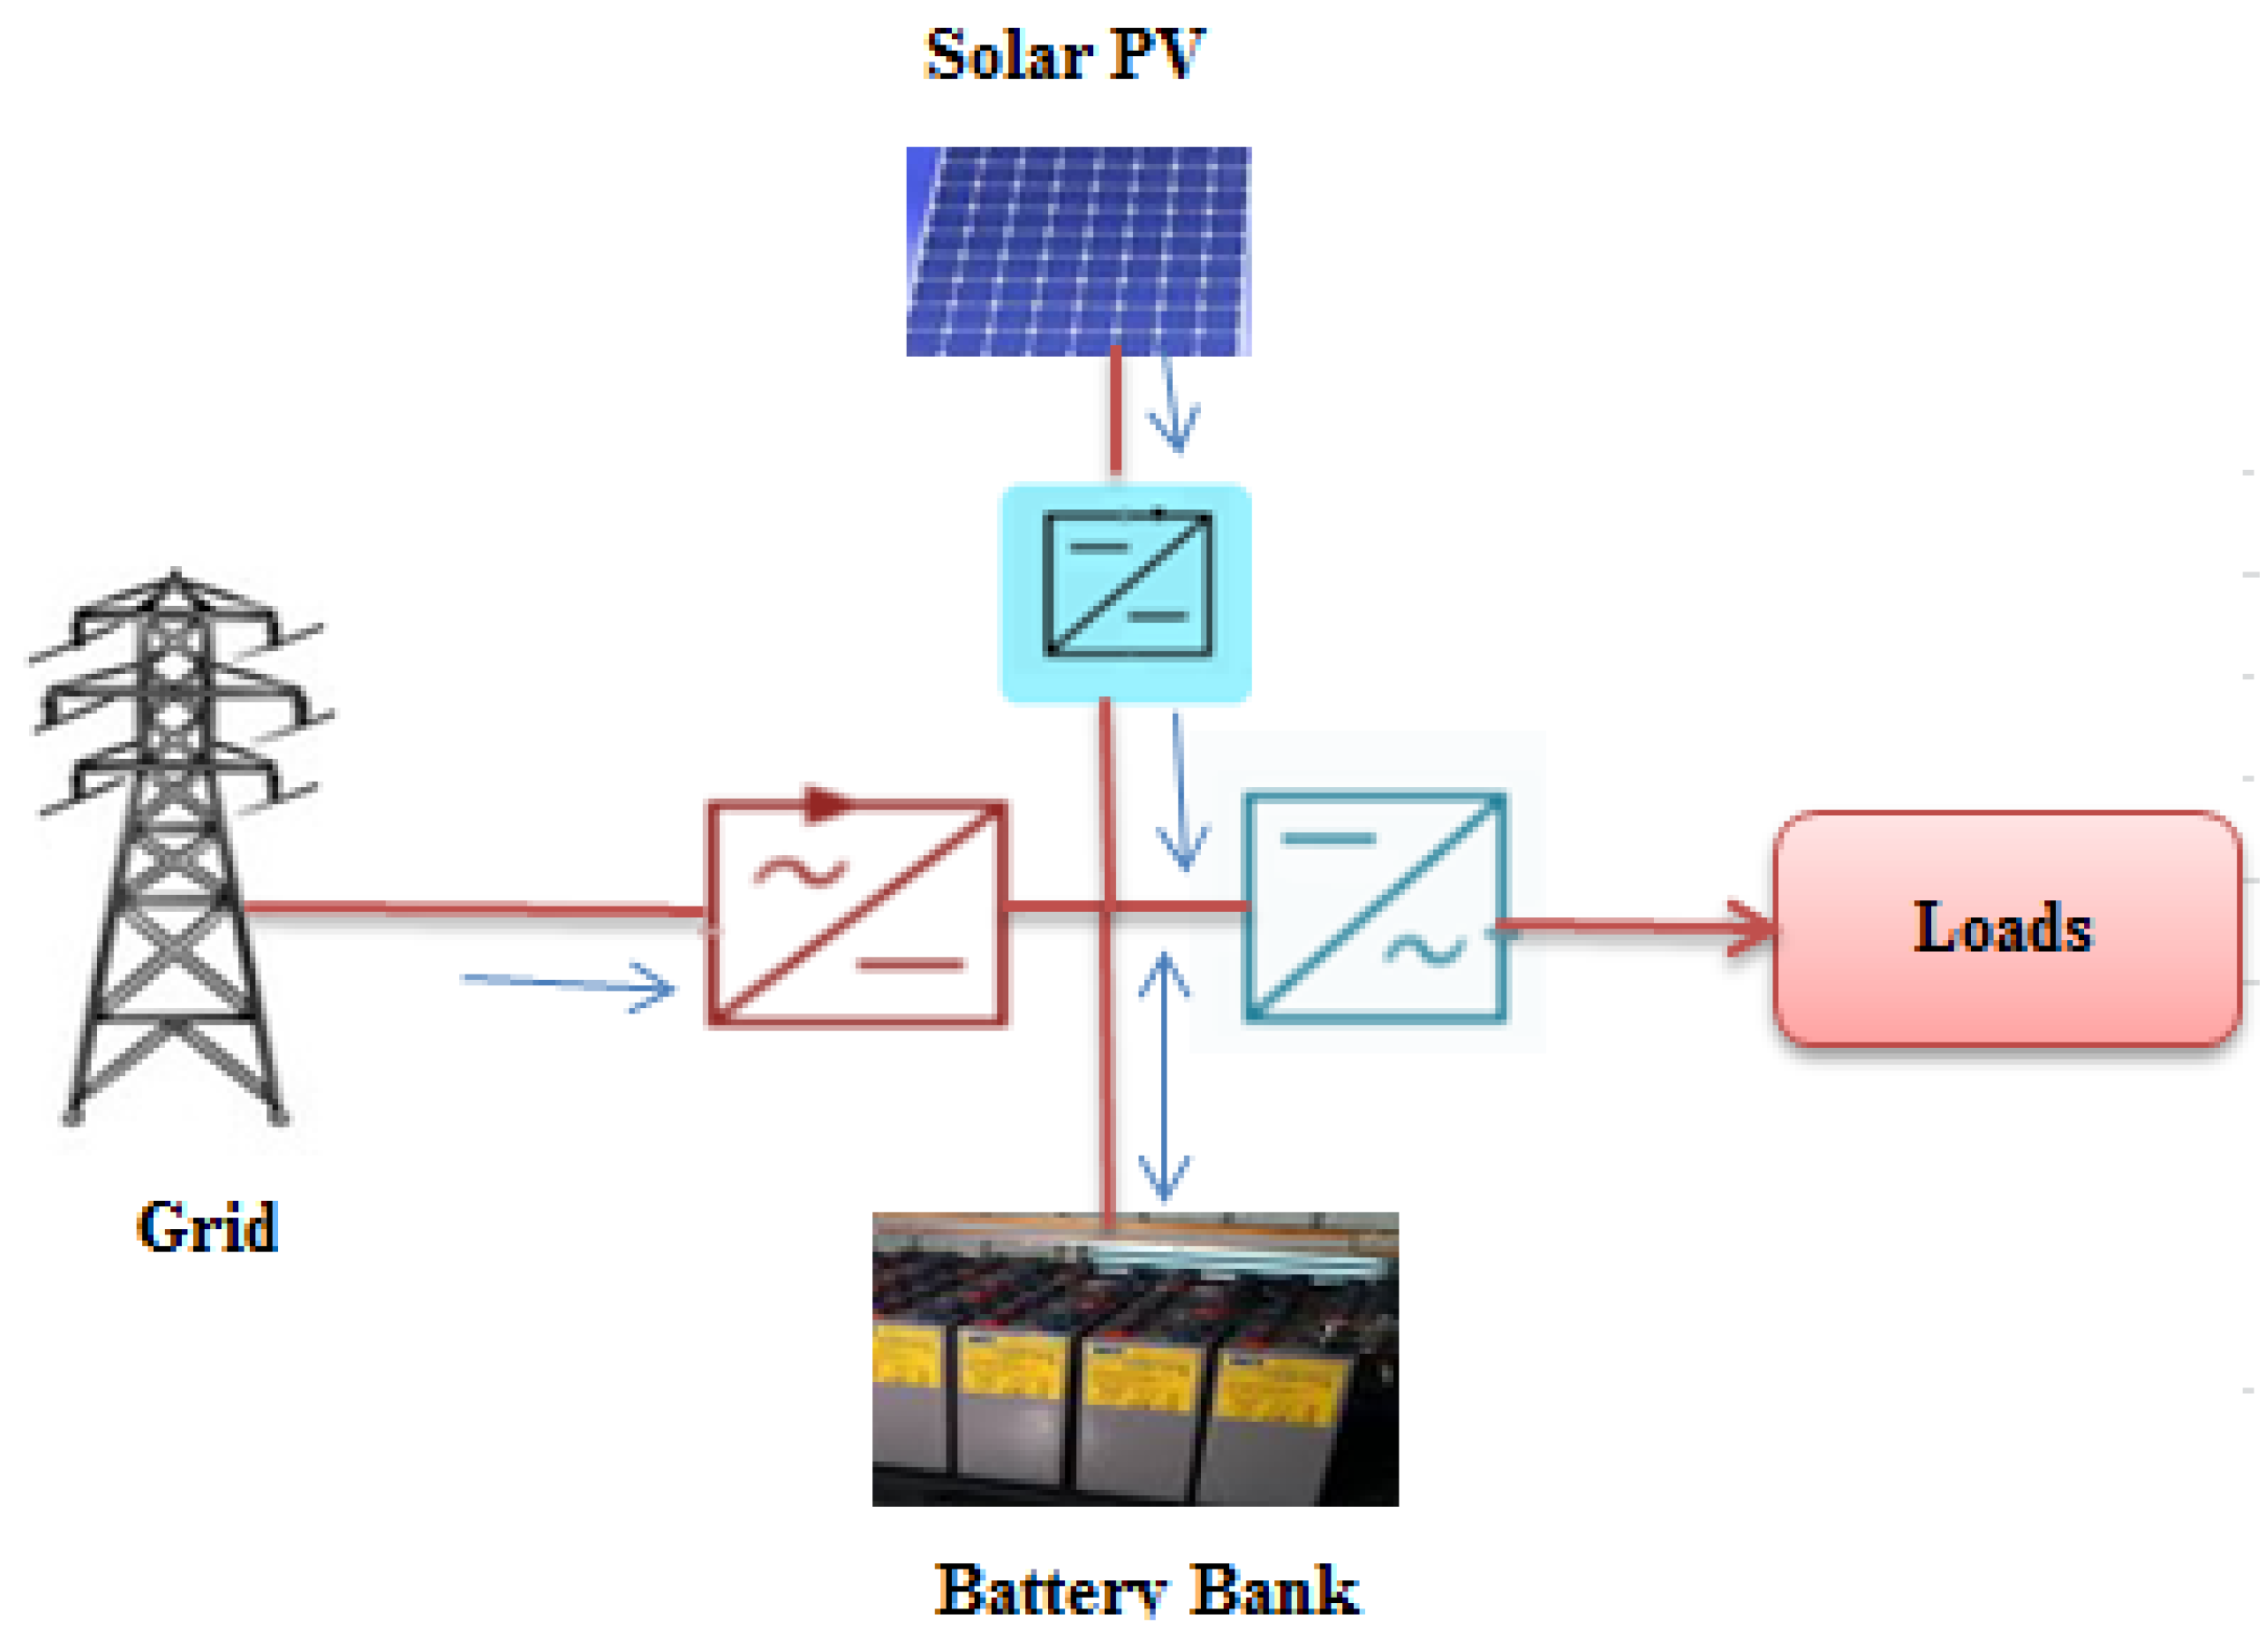
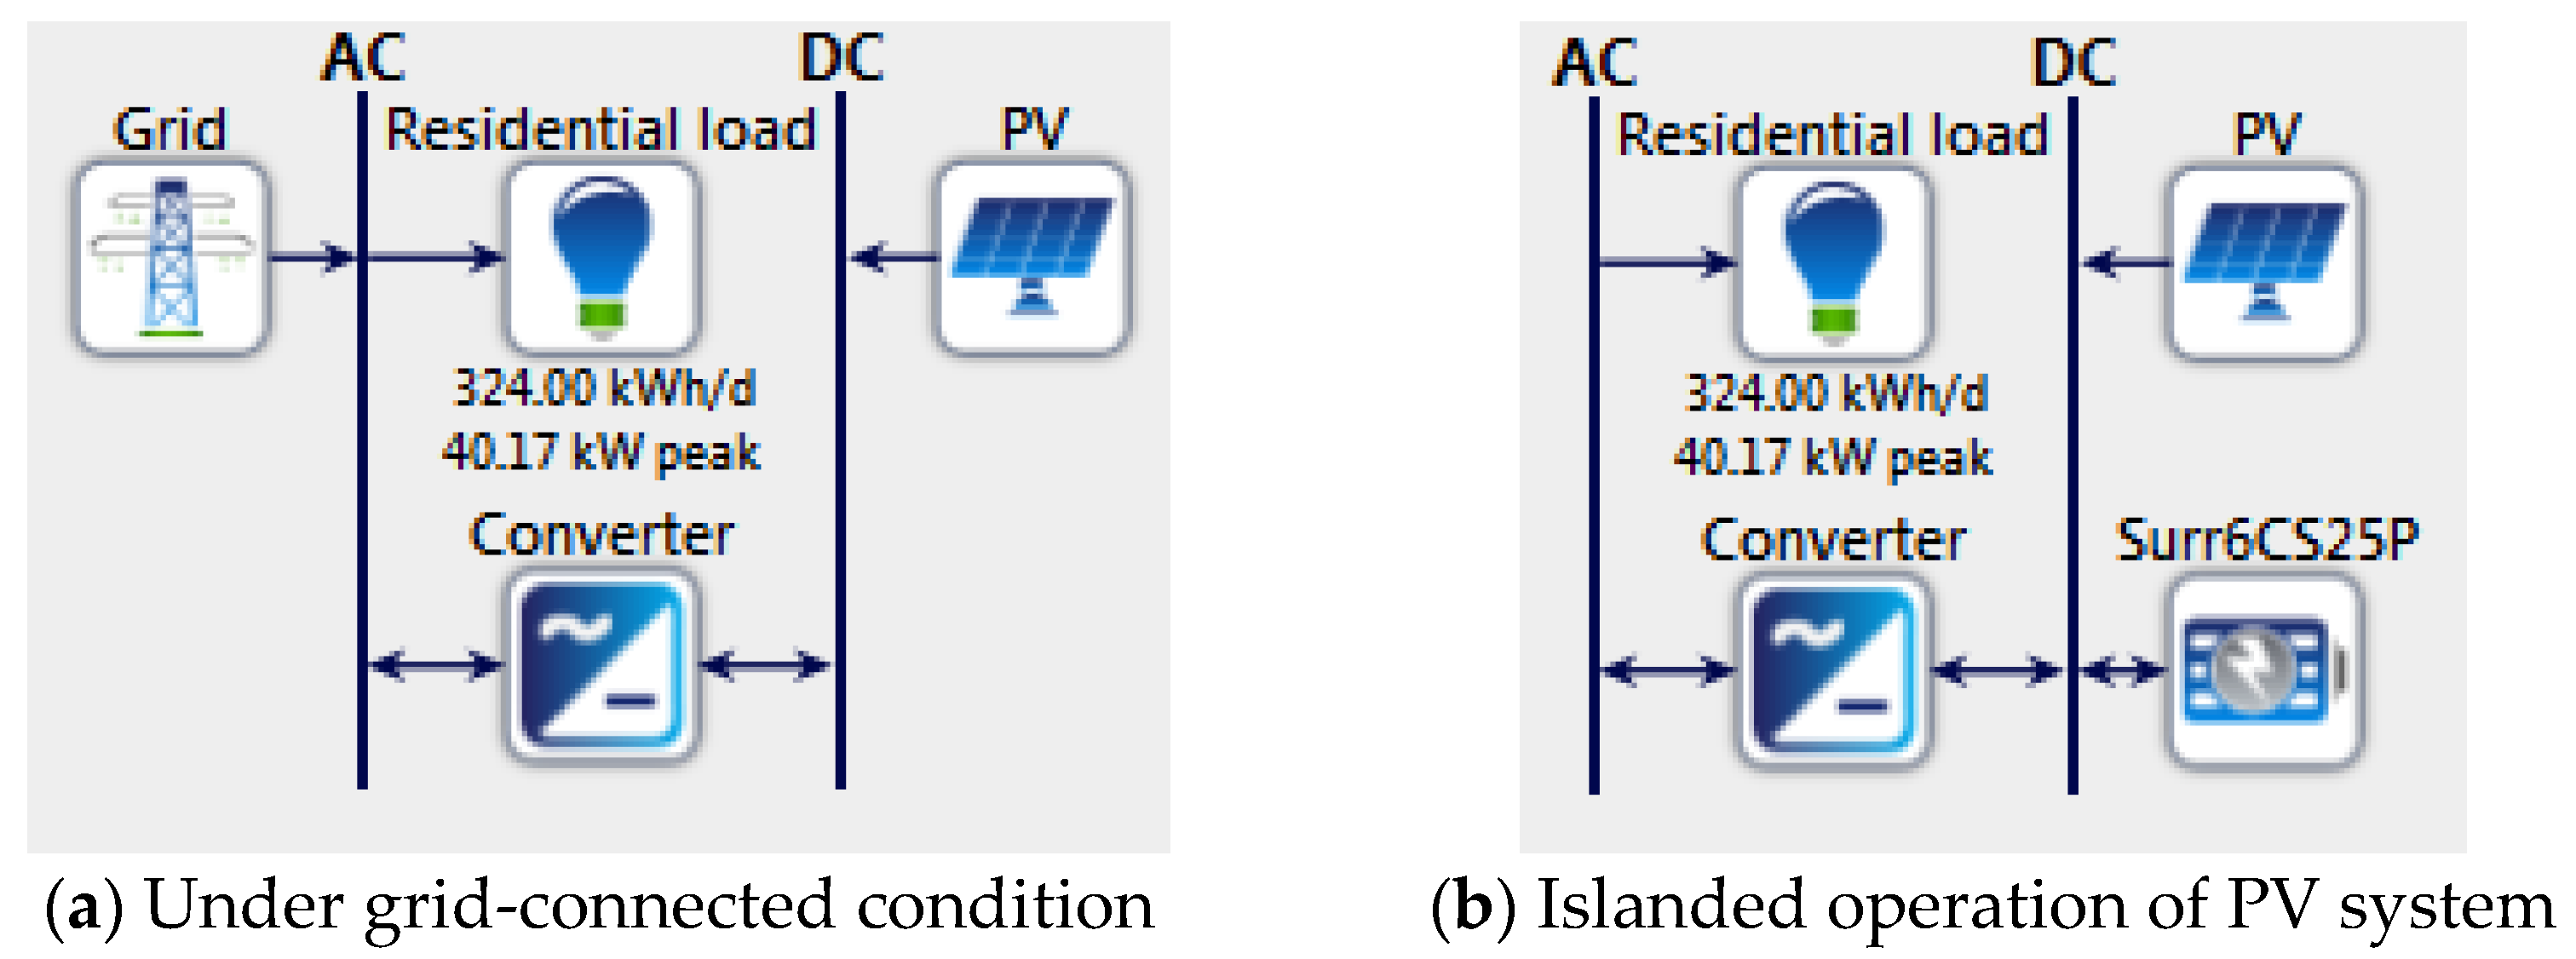
3.4. Depiction of Grid-Tied and Islanded PV Power Systems

The planned system shown in Figure 8 anticipates the integration of PV panels with auxiliary components, like battery banks and convertors. The basic objective of the integration was to support the utility grid and to escalate the grid sale during excess production. For the islanded approach, only a PV panel with battery storage was considered. The designation of Figure 8, after modeling by HOMER Pro, is presented in Figure 9.

3.4.1. Grid Description

HOMER modeled the grid like any component of a grid-connected system analysis. The grid purchase capacity and the grid rate of the tariff value were the components required as input.

3.4.2. PV Panel

The PV array is modeled as a component which produces direct electric power to a coordinate extent with the solar irradiation. The power production of the PV array is given by Equation (11) [61,62]:
P p v = W p v f p v ( G T G T . S T C ) [ 1 + α p ( T C T c . S T C ) ]
where W p v is the peak power output (kW), f p v is the PV derating factor (%), G T is the solar irradiation incident on the PV array in the present period step (kW/m2), G T . S T C is the incident irradiation under standard test circumstances (1 kW/m2), α p is the temperature constants of power (%/°C), T C is the PV cell temperature in the present time step (°C) and T c . S T C is the PV cell temperature under standard test circumstances (25 °C).

PV Cell Technology

One of the good practical methods to harness sunshine as a power source is to convert it into electricity utilizing solar cells. However, there could be upper boundary to the sunlight to electric power transformation efficiency. More than 90 percent of the worldwide PV marketplace depends on solar cells based on crystalline silicon [63]. Based on the structure of the basic material from which they are manufactured, some of the PV cells of silicon are categorized into the following classes:
I.
Mono-crystalline silicon cells, which are produced from a single crystal of silicon. The efficiency of the cell is lies between 18% and 25% [64,65].
II.
Polycrystalline crystalline silicon cells, which are made from cast square ingots, large blocks of molten silicon carefully chilled and hardened. Their efficiency lies between 14% and 18% [63,65].
III.
Ribbon-pulled silicon cells: It is a type of polycrystalline and molded by drawing flat tiny films from molten silicon and results in a polycrystalline configuration. The efficiency varies from 9–14.5% [65].
IV.
Amorphous/microcrystalline: this is inexpensive and the least efficient type of PV cell, which is made by dumping a thin film of silicon onto a material such as glass. The efficiency varies from 8–11% [64].

Tilt Angle

For the proposed PV system, the tilt angle was estimated as 18°, which was taken from the optimized values carried out in PVGIS and PVWatts software.

Yield Factor (YF)

The ratio of the annual net AC energy production of the system to the peak power of the implemented PV module under standard test circumstances is known as the yield factor, and it is given by Equation (12) [24]. This factor aids the PV array’s productivity in some weather conditions.
Y F = E P V ( k W h / y e a r ) PV rated ( kW )
where E P V is the annual energy output in kWh and PVrated is the rated PV power in kW.

Capacity Factor (CF)

The capacity factor is the dimensionless ratio of the actual energy output of PV module (EkWh) to the maximum probable yield from the PV module if it is operating at full rate for 24 h per day for 365 days, which is given by the following equation [66]:
C F = E P V ( k W h / y e a r ) PV rated 24 365 = Y F 8760
The yield and capacity factors obtained from PVGIS, PVWatts and HOMER Pro software for the proposed system are presented and discussed in the Results section.
The overall details of the chosen solar PV panel in this investigation are shown in Table 2. The capital price of the PV panel was assumed based on the present prices in the country.

3.4.3. Battery

In the study, the battery was considered as energy storage for supporting the solar PV and diesel generators. A Surrette 6CS25P battery model, which is applicable for green energy systems, was selected for this investigation [67]. The overall technical description of the nominated battery is explored in Table 3.

3.4.4. Converter

A converter is necessary to most grid-connected and off-grid solar PV systems to regulate the flow of power among the DC and AC elements. During AC load consumption, the inverter mode of operation of the converter is applied, and to transfer DC power, it converts AC into DC in a rectification process. The efficiency of converter was taken as 95% [68]. This value has been varied in the sensitivity analysis. The technical parameters of the chosen converter are given in Table 4.

4. Results and Discussion

The technical and economic viability of a grid-tied and islanded PV power system under the consideration of future electricity tariffs in a typical residential sector in the west of Mekelle City in Tigray region, Ethiopia, is simulated and discussed in this section. To simulate all technically viable supply options that can meet the specified demands for the investigated region, PVGIS, PVWatts and HOMER Pro software tools were utilized. The economic optimization aspect of the system was analyzed by HOMER Pro. To select the optimal system configuration for the location: three different configurations under grid-tied and one configuration system under islanded system conditions were analyzed and are presented below.
A comparative assessment of the three software packages (HOMERPro, PVGIS and PVWatts) for power generation from PV panel was also carried out. Finally, a sensitivity examination was conducted to decide the choices that meet investors’ needs.

4.1. Optimization Result under Grid-Connected Conditions

The following grid alone, grid/PV and grid/PV/battery systems were considered under this optimization condition.

4.1.1. Grid Alone System

The grid alone scheme was studied for comparison purposes, and it has been simulated by involving the 0.07 USD/kWh national tariff plan (2021). Table 5 shows the outputs determined for the study location. The NPC and grid purchase of the grid alone system of the location are USD174,888 and 118,260 kWh/year, respectively. There was no capital cost in this situation. In this system, electrical energy was drawn only from the utility grids to supply the annual demand of 118,260 kWh/year.

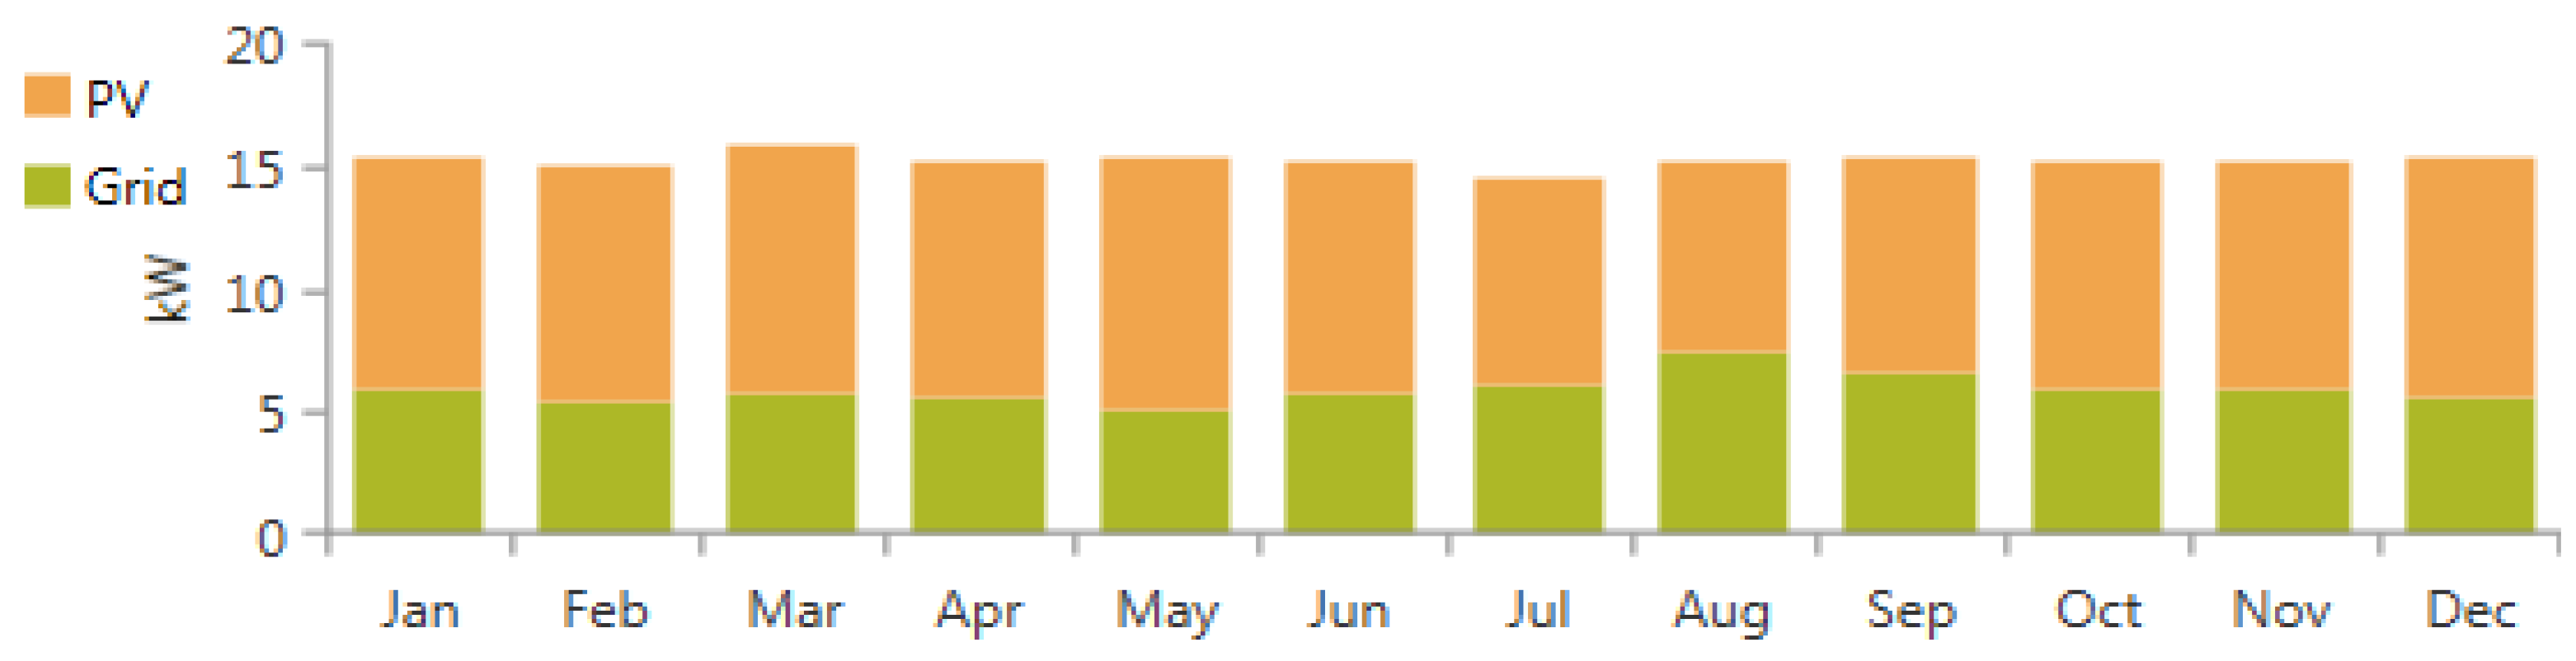
4.1.2. Grid/PV Panel System

In this system, the solar PV panel is integrated into the grid for the sake of assessing the technical and economic sustainability of a grid-tied PV system under the consideration of the 2021 electricity tariff. Table 6 shows the outputs obtained for the optimal grid/PV systems; 80 kW, 45 kW and 25 kW capacity of the grid, PV and converter were consecutively selected as optimal size in the system design. The COE and NPC of the systems are seen to be USD148,409 and 0.058 USD/kWh, respectively.
In this system, power supply comes from the PV module and grid purchases. The monthly average electricity generation of the systems for the site comprised 57.1% and 42.9% from solar PV and the grid, respectively, as indicated in Figure 10. Due to having enough solar potential in the site and on account of the economic competitiveness of solar PV panels, the renewable energy fraction becomes 57.1%, as shown in Table 6.
The summary of annual electricity generation and the utilization of grid/PV systems in the location is shown in Table 7; 80,485 kWh/year energy was produced by the solar PV system, and, from this, 4244 kWh/year was sold to the grid and the remainder supplied the demand of the location to help the grid system.
From this system analysis, we deduced that the grid-tied PV technology is competitive and is found in the mature stage in the country when compared with grid-connected PV systems investigated in some countries, as summarized in Table 8. Comparisons of different optimization methods used in different studies have been also compared with the method used in this investigation. It was revealed that the proposed optimization method has the ability to provide comparable results in comparison with the reviewed optimization tools.

4.1.3. Grid/PV/Storage System

For the optimized grid/PV/battery system, the size of the components and the financial parameter outputs are shown in Table 9: 80 kW, 40 kW and 20 kW capacity of the grid, PV and converter, and six batteries is consecutively selected as optimal size in this system design. The NPC and COE of the grid/PV/battery system was higher than that of the grid/PV system and lower than that of the grid only system. Even if its economic cost is higher than the grid/PV system, for the Ethiopian utility system, whose distribution system is unreliable, using a grid/PV/battery system is economical.

4.2. Optimization Result under Islanded Conditions

Only PV/battery systems were considered in this scenario.

PV/Battery Systems

Now, compared with all generation sources (including fossil fuels), solar PV power is becoming competitive, and, considering its future cost reduction, analyzing the breakeven time of solar PV power’s cost over the utility supply (grid) cost is important. In order to identify the breakeven time, this PV/battery system as an islanded microgrid was considered in this study for the considered location. Based on PV system cost reduction estimations [14,16], taking the current cost of PV systems in the location as a reference with a 4.8% annual reduction of PV cost for the next 10 years, the breakeven cost of a solar plant over the grid cost was analyzed and the result is shown in Figure 11. During the past decade, storage and converters have not shown significant cost changes. As can be seen from Figure 11, the COE varies between 0.01 and 0.15USD/kWh for different years. For the considered years, the COE of the grid system was taken as constant (0.07 USD/kWh) based on the 2021 amended power tariffs of the country. Based on this analysis, after 2029, the COE of PV/battery system will totally break the grid tariff in Ethiopia. On the other hand, when we observed the modified grid tariff in the country from 2018–2021 [17], an average 18% incremental rate can be observed. In this investigation, when we also considered an 18% annual incremental grid tariff for the coming 4 years starting from 2021, after 2023, the COE of PV/battery microgrid system will totally break the grid tariff in Ethiopia, as shown in Figure 11 by the black dotted line. The details of the grid tariff beyond 2025 can only be a subject of conjecture now. Even with the 2021 modified tariff, Ethiopia’s electricity tariff is among the lowest in Sub-Saharan Africa, and we expect the tariff amendment by the EEU in the country after 2021 to be low also. The system report for the optimal PV/battery systems for the area is summarized in Table 10. Considering the current national grid tariff (2021) for some East African power pool countries such as Kenya (0.21), Tanzania (0.1), Uganda (0.18) and Rwanda (0.26 USD/kWh) [38,40,74], and assuming the prevalent economic cost of the PV/battery system to be as in Ethiopia, the analyzed COE of the PV/battery microgrid system already breaks the grid tariff in Kenya, Uganda and Rwanda. For Tanzania, the COE of grid is on par with the PV/battery system, and, after a few years, the PV/battery system’s COE seems to be less than the grid COE, as shown in Figure 11.

4.3. Comparison of Results from PVGIS, PVWatts and HOMER Pro

The proposed grid-tied PV system with 45 kW solar PV power was utilized in order to identify the changes in the output estimations between the three tools introduced above. Simulation outputs utilizing the three software tools are displayed in Table 11. Particularly, annual electricity generation, PV capacity, yield factor and capacity factor are explicitly shown. The measured (based on which the simulations were subsequently derived) and the NASA data were used as an input in HOMER Pro analysis. For all software packages, the same optimal tilt angle value was used. From Table 10, it is shown that PVGIS gave nearer outputs to the actual measured values, and PVWatts predicted the lowest value among the three. Most likely, PVGIS utilized more precise databases for the desired area.
As shown in Table 11, the capacity factor of this system is considered to be 20.4%, based on the measured value of irradiation. This number for CF is sensible compared with the same grid-integrated configurations in Nigeria (20.7%) [19], South Africa (18.1%) [75], Saudi Arabia (22%) [24], Malaysia (15.86%) [26] and Morocco (20.02%) [76].

4.4. Sensitivity Analysis

A sensitivity analysis shows the impact of changing any technical and economic variables on the optimum system performance. Such variables could be inflation rate, global solar irradiation, load demand, inverter efficiency, grid tariff, PV capital cost and any variable associated with financial matters and the environment. In this research, the effects of inflation rate, the nominal discount rate and PV capital cost as economic parameters, and inverter efficiency and solar radiation variations as technical parameters impacting on the optimal modeled grid/PV system are explored.

4.4.1. Economic-Related Sensitivity Parameters

A financial viability investigation in this research was conducted to evaluate whether the proposed grid-tied system would be viable or unfeasible due to the variation of some economic variables. The changeable economic parameters always affect future economic investment. In the following subsection, the impact of inflation rate, nominal discount rate and PV capital cost variations on the performance of the grid/PV system was examined.

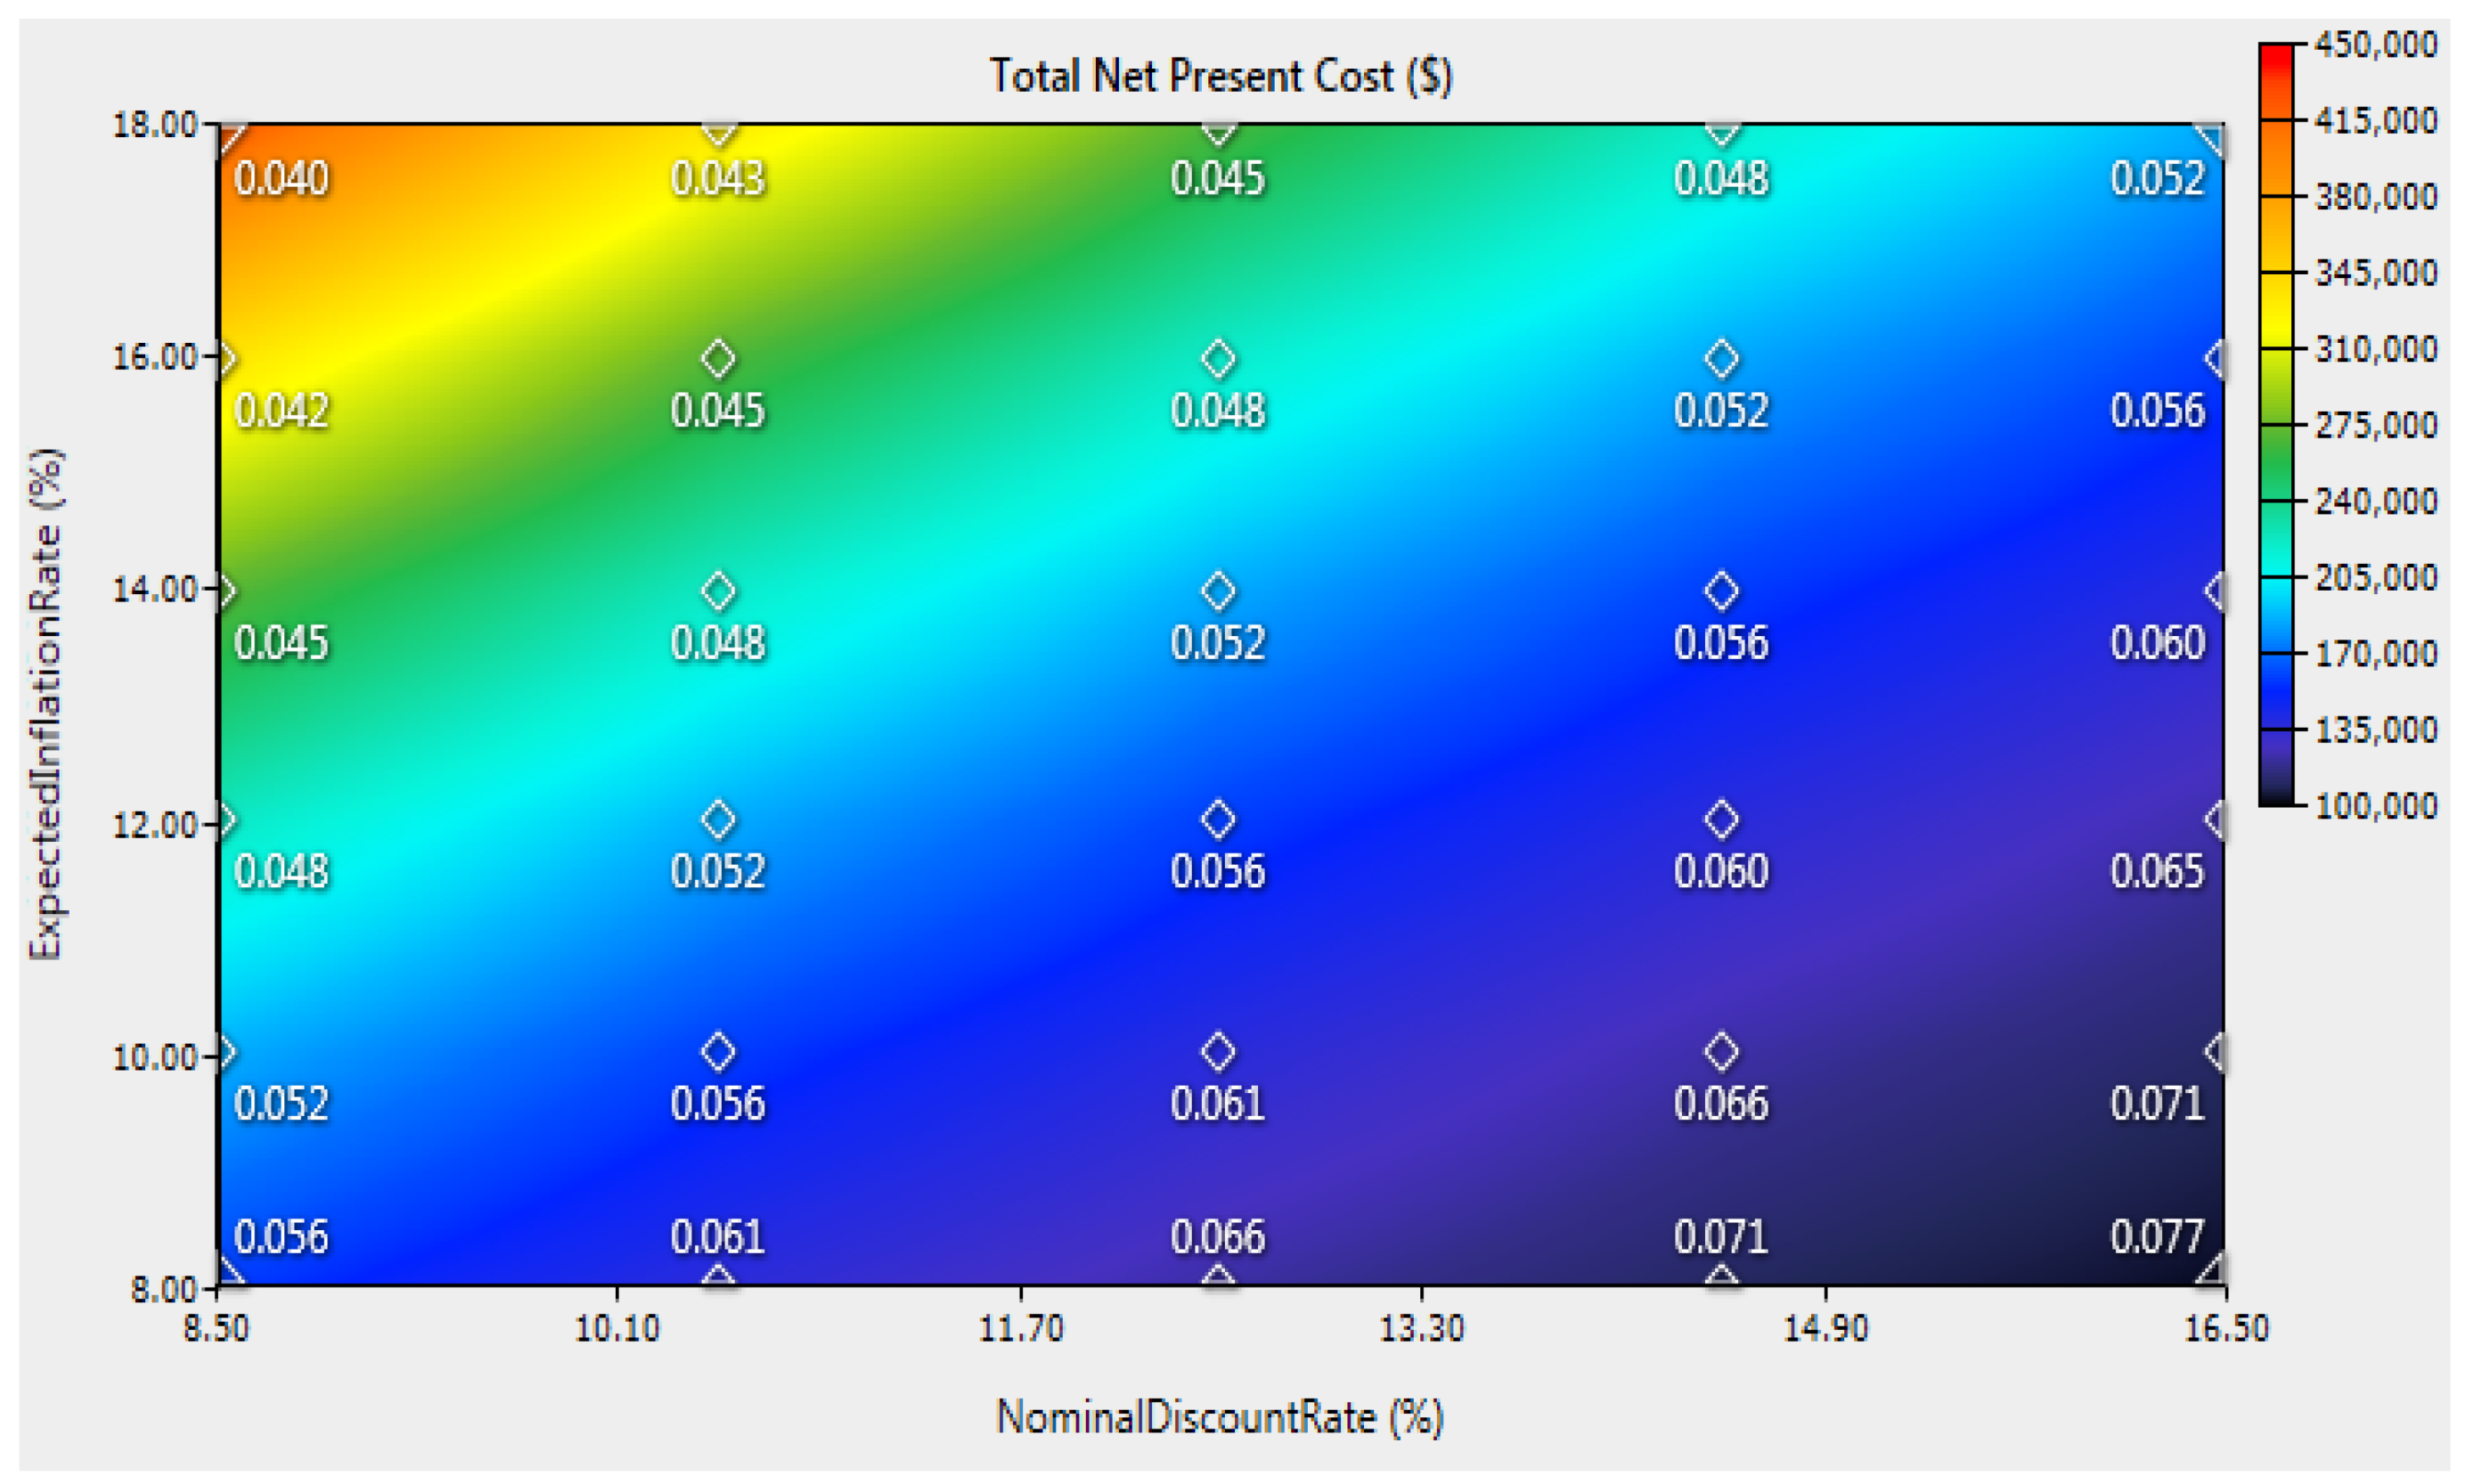
Impact of Inflation Rate and Nominal Interest Rate Variations

The inflation rate in Ethiopia fluctuated between 8% and 12% between 2015 and 2019, respectively. The nominal discount rate is going to trend around 13.5% in 2019 [56]. Therefore, it is essential to subject the NPC and COE to inflation rate and nominal interest rate variations. As analyzed earlier, the inflation rate and the nominal discount rate are economic parameters and they can affect the COE and NPC of the systems, as demonstrated in Figure 12. The figure reveals that cost of energy increases as the discount rates rises from 8.5% to 16.5%; however, the NPC of the entire system decreases with the inflation rate. Moreover, an increase in the inflation rate from 8% to 18% causes a drop in the COE; however, the NPC will rise. From Figure 12, we can observe that the COE and NPC can have different values between 0.056 and 0.077 and between USD100,000 and USD450,000; from the simulation, we see that a 4% inflation rate increment causes a 16.5% COE drop and a 23% NPC incremental. For a 6% discount rate increment, a 22% COE increment can be observed. This analysis verified that the investment is financially viable for this extent of interest rates.

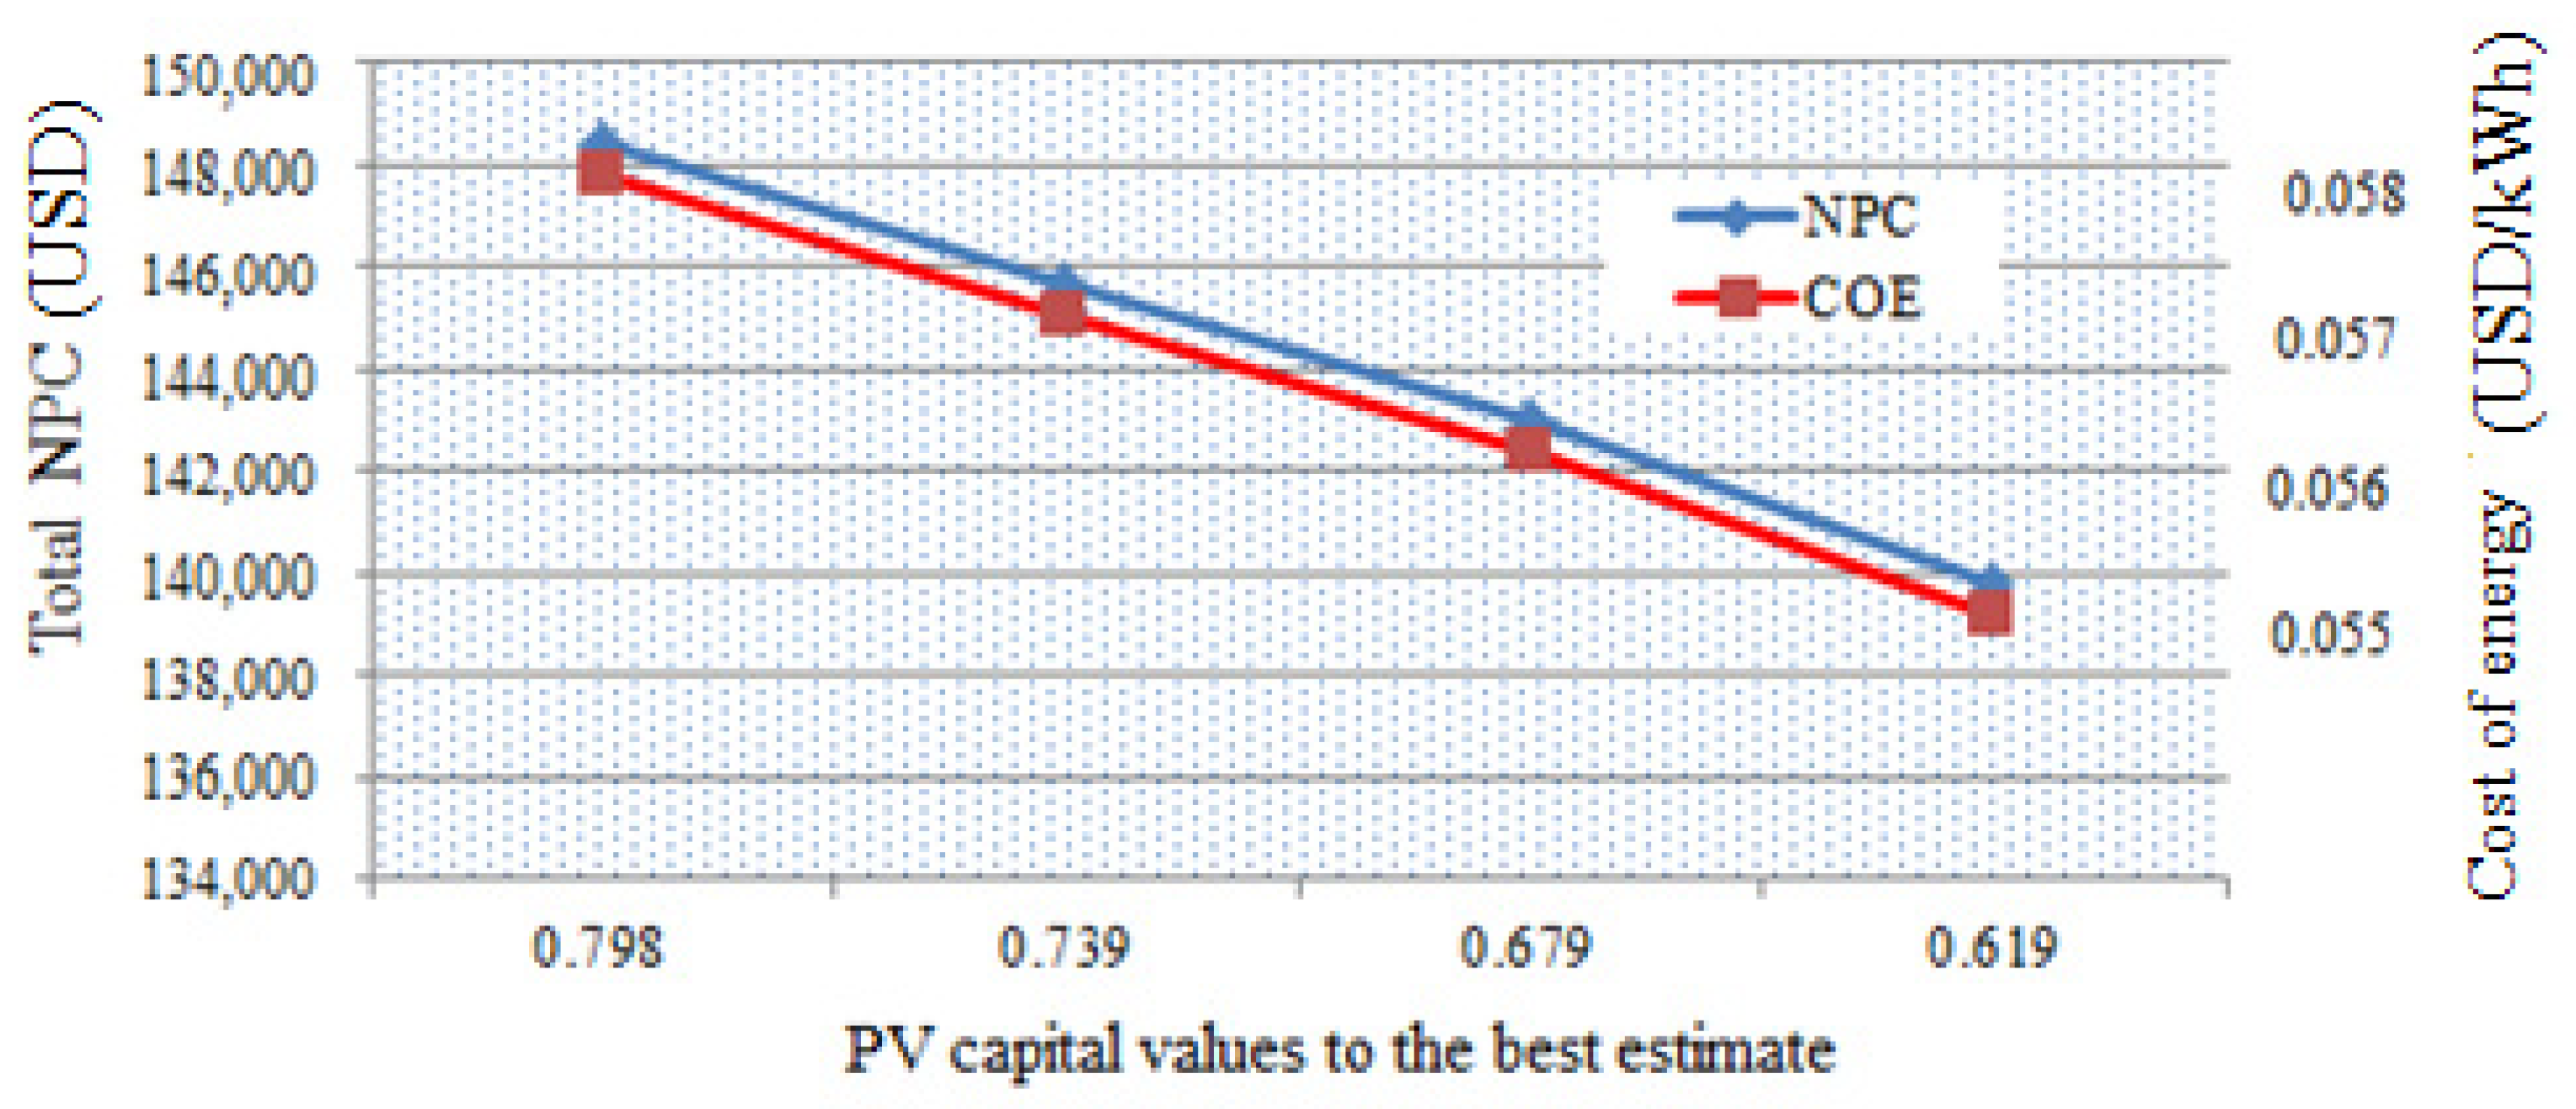
Impact of PV Capital Cost Variations

The effects of change in capital cost of PV panels for grid/PV systems on the total NPC and COE parameters are presented in Figure 13. The cost multiplier was varied from the current 0.798 to 0.619, which is from USD798 to USD619. The PV capital cost is directly related to the NPC of the system, and it is evident from the figure that the NPC and COE decreased by 6.1% and 5.2% when the PV capital cost decreased by 23.5%.

4.4.2. Technical-Related Sensitivity Parameters

Like economic variables, variation of any technical parameters also has its own impact on economic output of the developed system. The effects of some technical variable variation on the proposed grid/PV system are explained below.

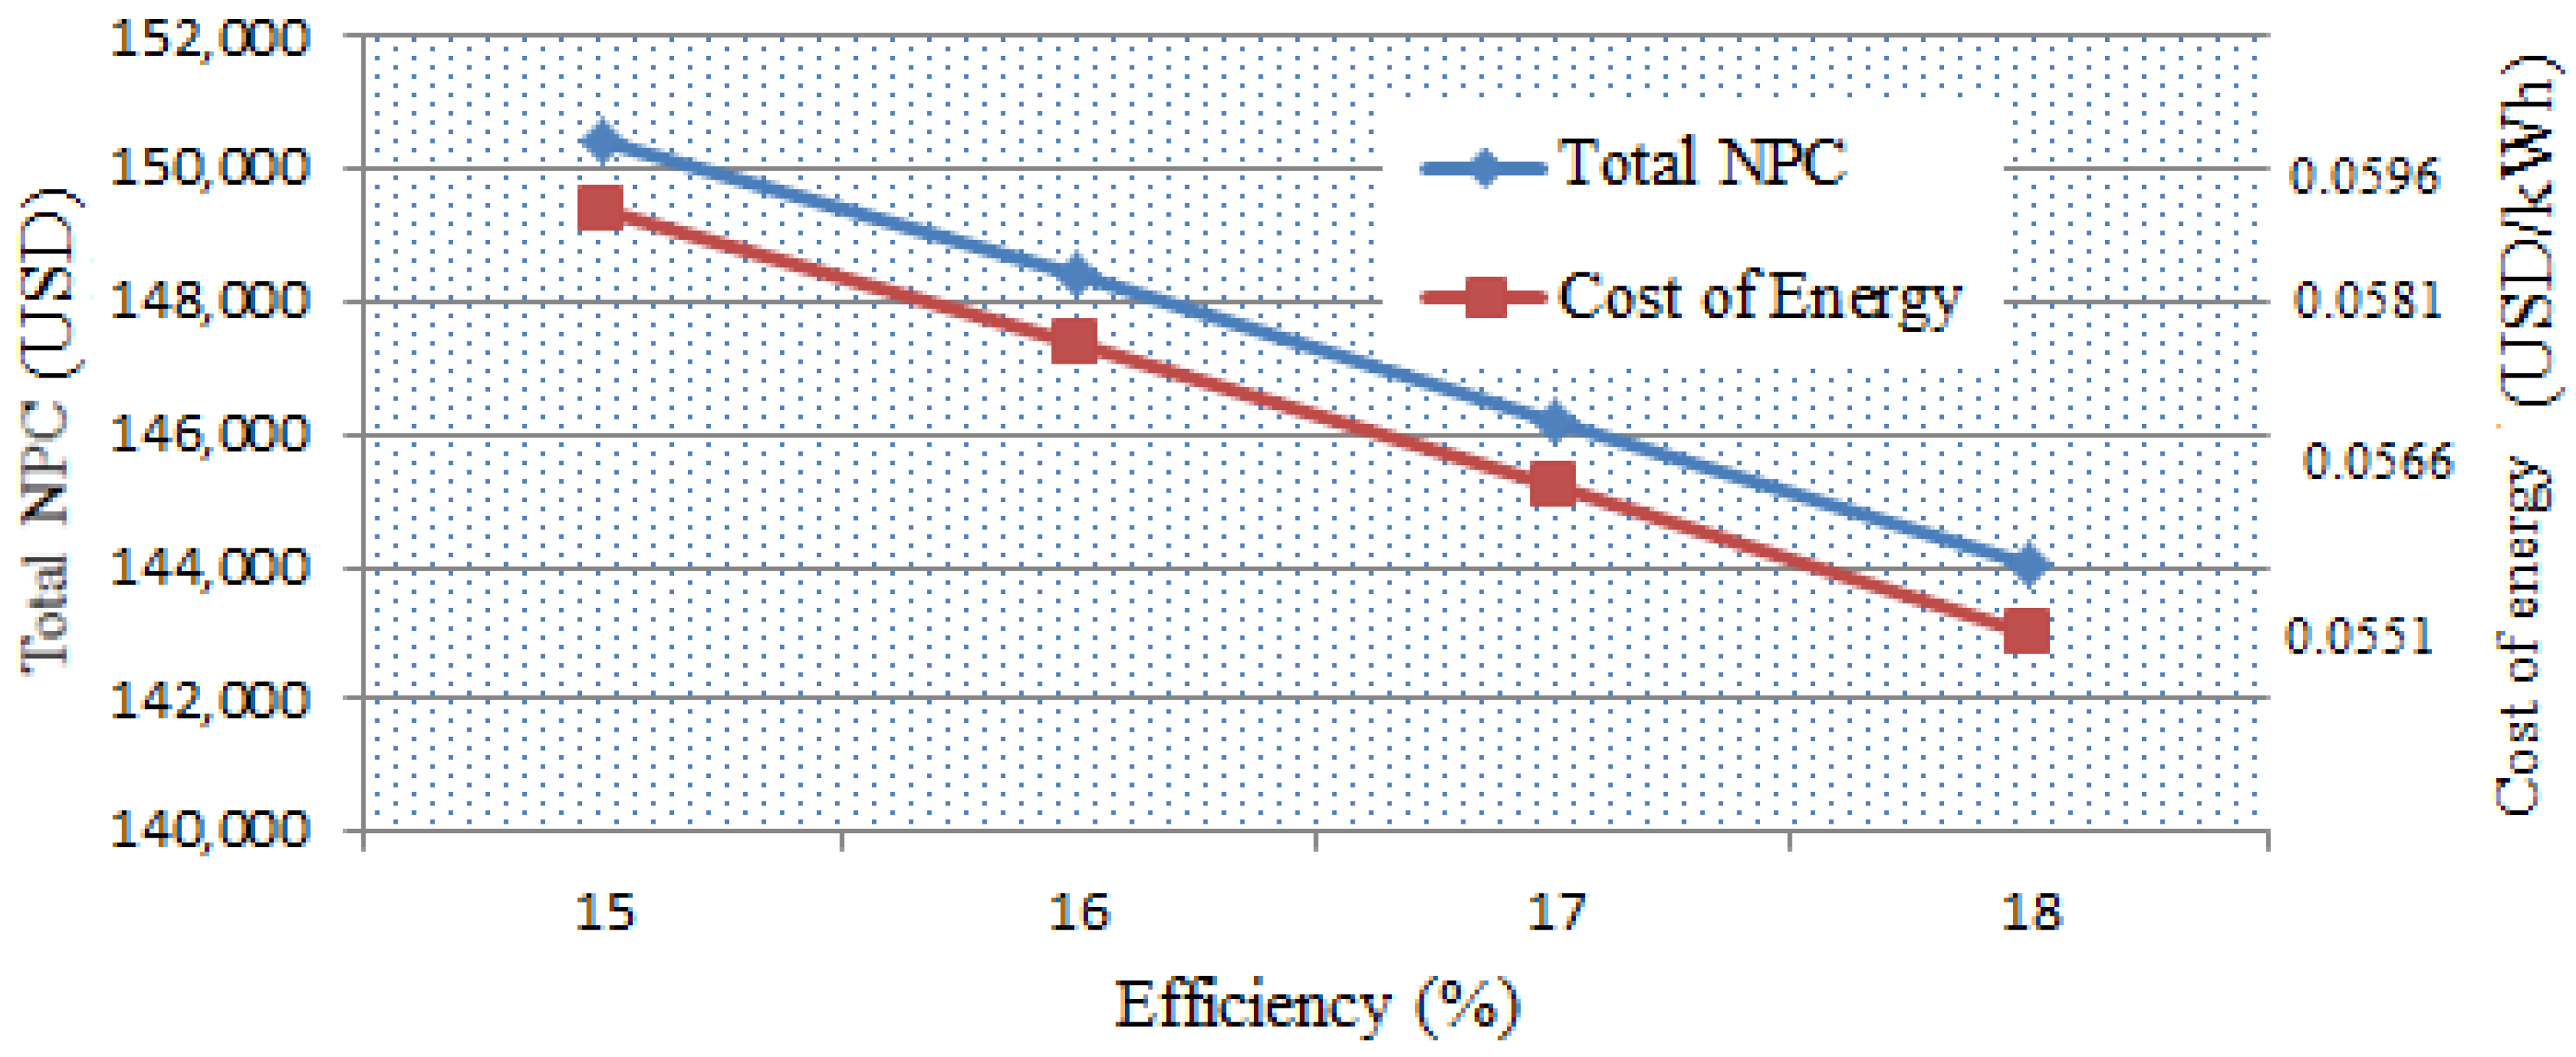
Impact of Inverter and PV Panel Efficiency Variations

The efficiency of the solar PV panel and inverter could be a direct factor in the system’s electricity production. Thus, to make the performance of the system better, good efficiency across the whole power range is important. The emergence of new PV cells has enabled advanced efficiency levels. In 2018, the efficiency of multi-crystalline cells came to 17%, although mono-crystalline cells extended it to 18%. This could be expected to proceed through to 2030 [14]. As shown in Figure 14 and Figure 15, the inverter’s and PV panel’s efficiency drop in the grid/PV system has an influence on the system’s NPC and COE. For 95% inverter efficiency, the COE and NPC are 0.0581 USD/kWh and 148,409 USD/kWh, and for 86% inverter efficiency, the COE and NPC are 0.062 USD/kWh and 153,190 USD/kWh. In this context, for a 9% inverter efficiency increment, 6.5% and 3.8% COE and NPC reductions were found. On the other hand, with a 3% PV panel efficiency increment, 7.6% and 4.8% of COE and NPC decrements are observed. To observe the effect of inverter efficiency variations on the system, we made the PV panel efficiency constant (16%); vice versa, to observe the effect of PV panel efficiency variation, the inverter efficiency was taken as constant (95%).

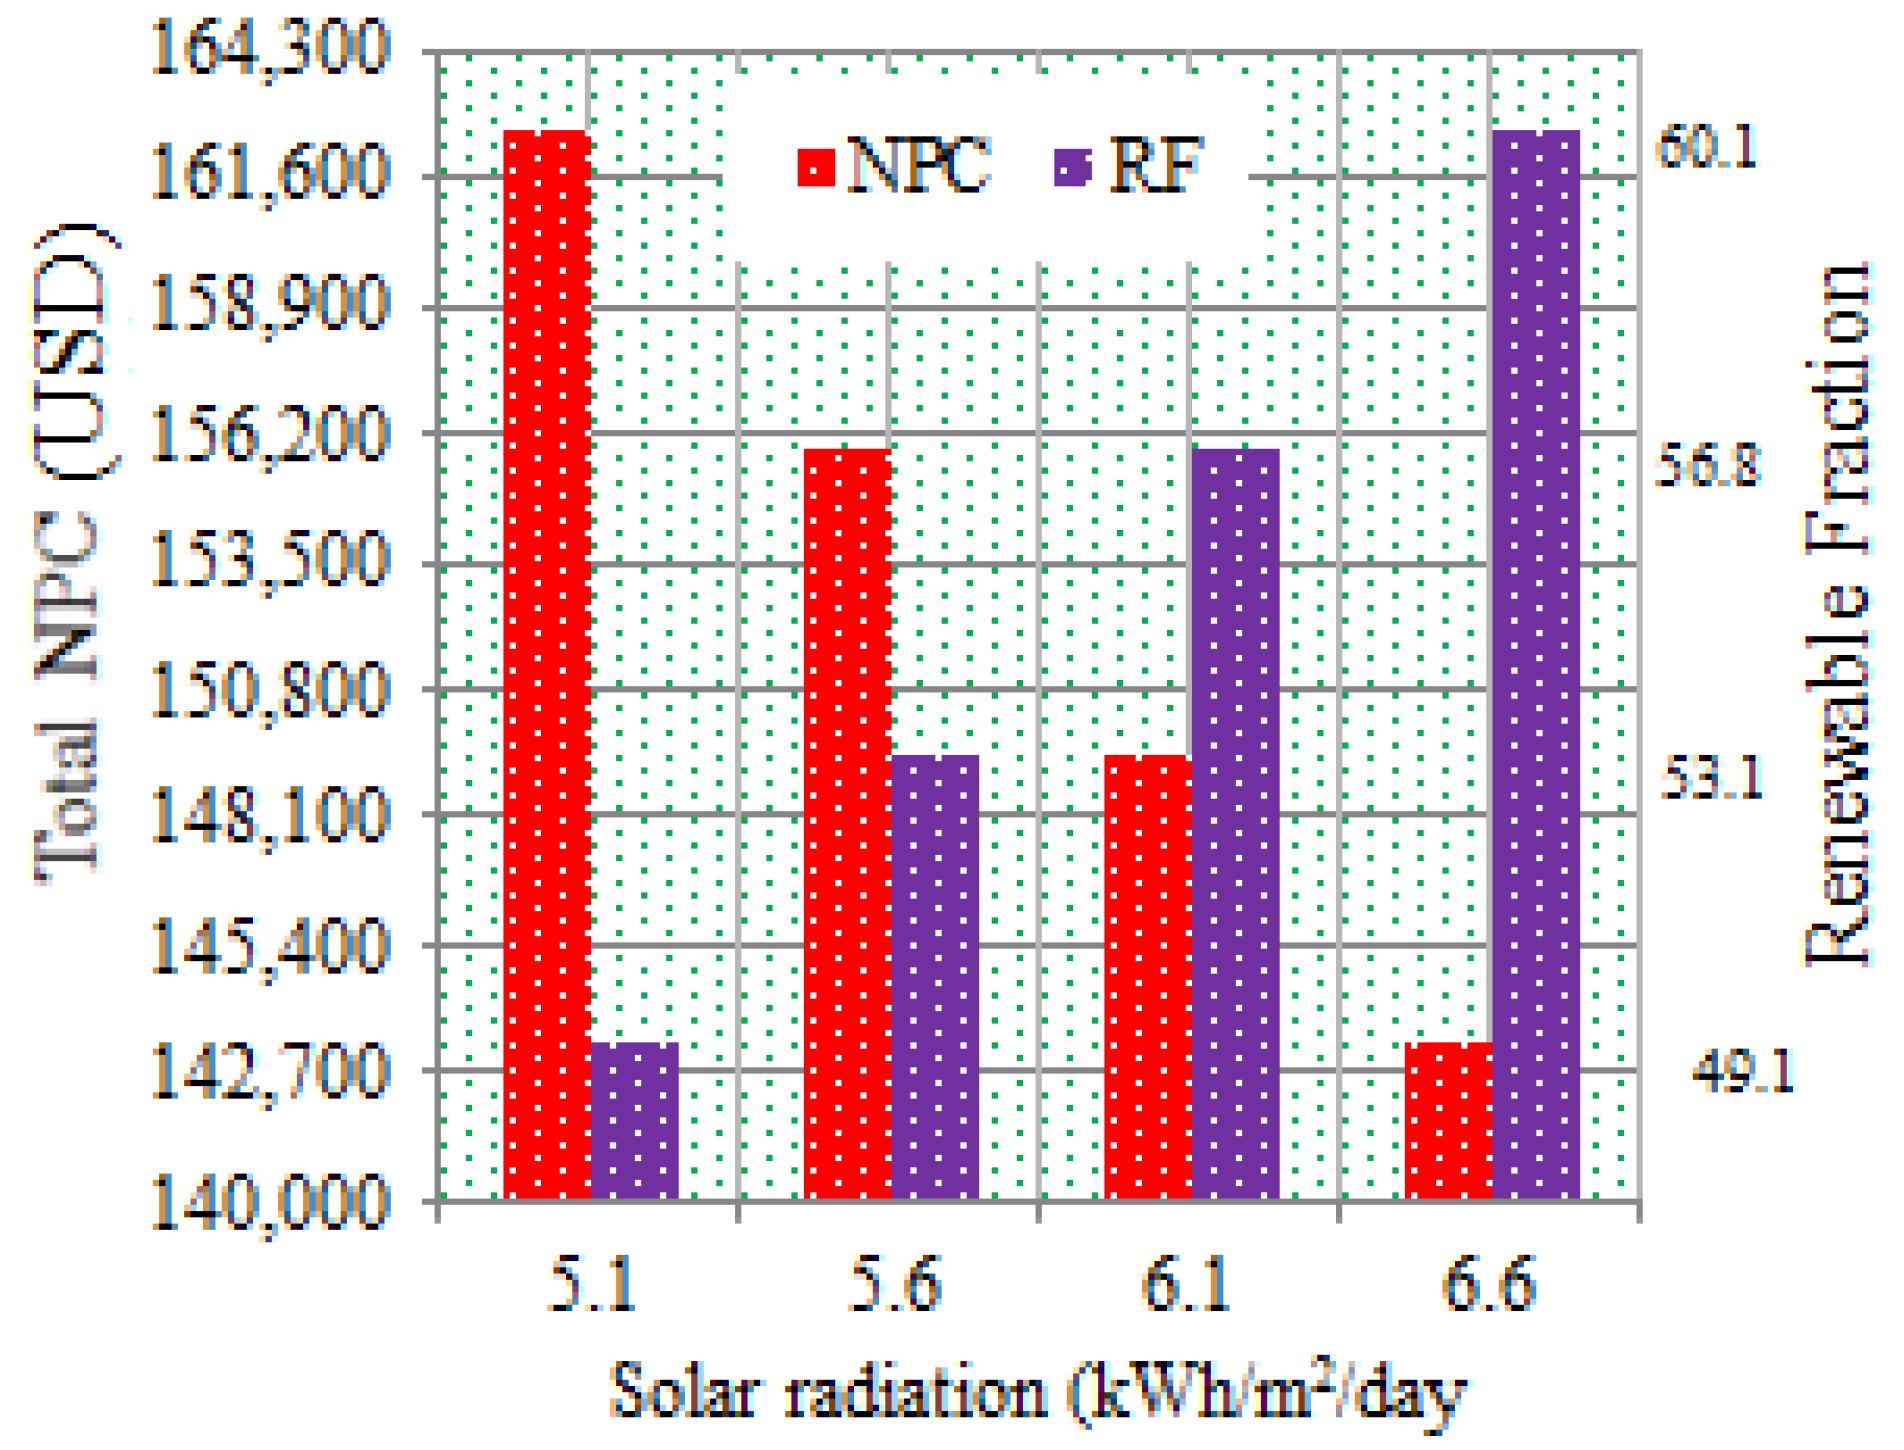
Impact of Solar Irradiation Change

Figure 16 indicates the outputs of the sensitivity analysis of the optimal grid/PV system regarding a change in solar irradiance from 5.1 kWh/m2/day to 6.6 kWh/m2/day. The load (324 kWh/day) and the grid COE (0.04 USD/kWh and 0.07 USD/kWh) of the location were fixed simultaneously. It could be expected that the rise in solar radiation would cause an increment in PV output and consequently increase the renewable fraction and decrease the NPC of the system, as shown in Figure below. From the figure, we can observe that when the solar radiation increases by 23%, the NPC decreases by 12.5%. With the same radiation percentage increment, the COE decreased by 13%.

5. Conclusions

Currently, Ethiopia has given more consideration to increasing the share of its energy supply from solar energy resources. In this respect, the government aims to encourage industries and commercial centers to produce their own energy by relying on renewable distributed energy sources. In this research, modeling, analysis and optimization of grid-integrated and islanded schemes of solar PV power systems considering future utility electricity tariffs for the residential load in the west of Mekelle City in Ethiopia were explored. The analyzed and optimized configuration of the power systems reveals the following:
Technical and economic results:
For the proposed grid-tied systems, 80 kW, 45 kW and 25 kW capacity of grid, PV and converter was sequentially selected as the optimal size, and 80,485 kWh/year energy was generated by the solar PV, which is a 57.1% share of the total load of the location.
Based on the projected grid tariff of the country, the COE of the grid/PV system was found to be around 12% lower compared with the utility grid, with a simple payback time of 7.81 years.
The capacity factor of this configuration was found to be 20.4%, which is reasonable compared with the same grid-connected systems investigated in different countries of the globe, as mentioned in the results.
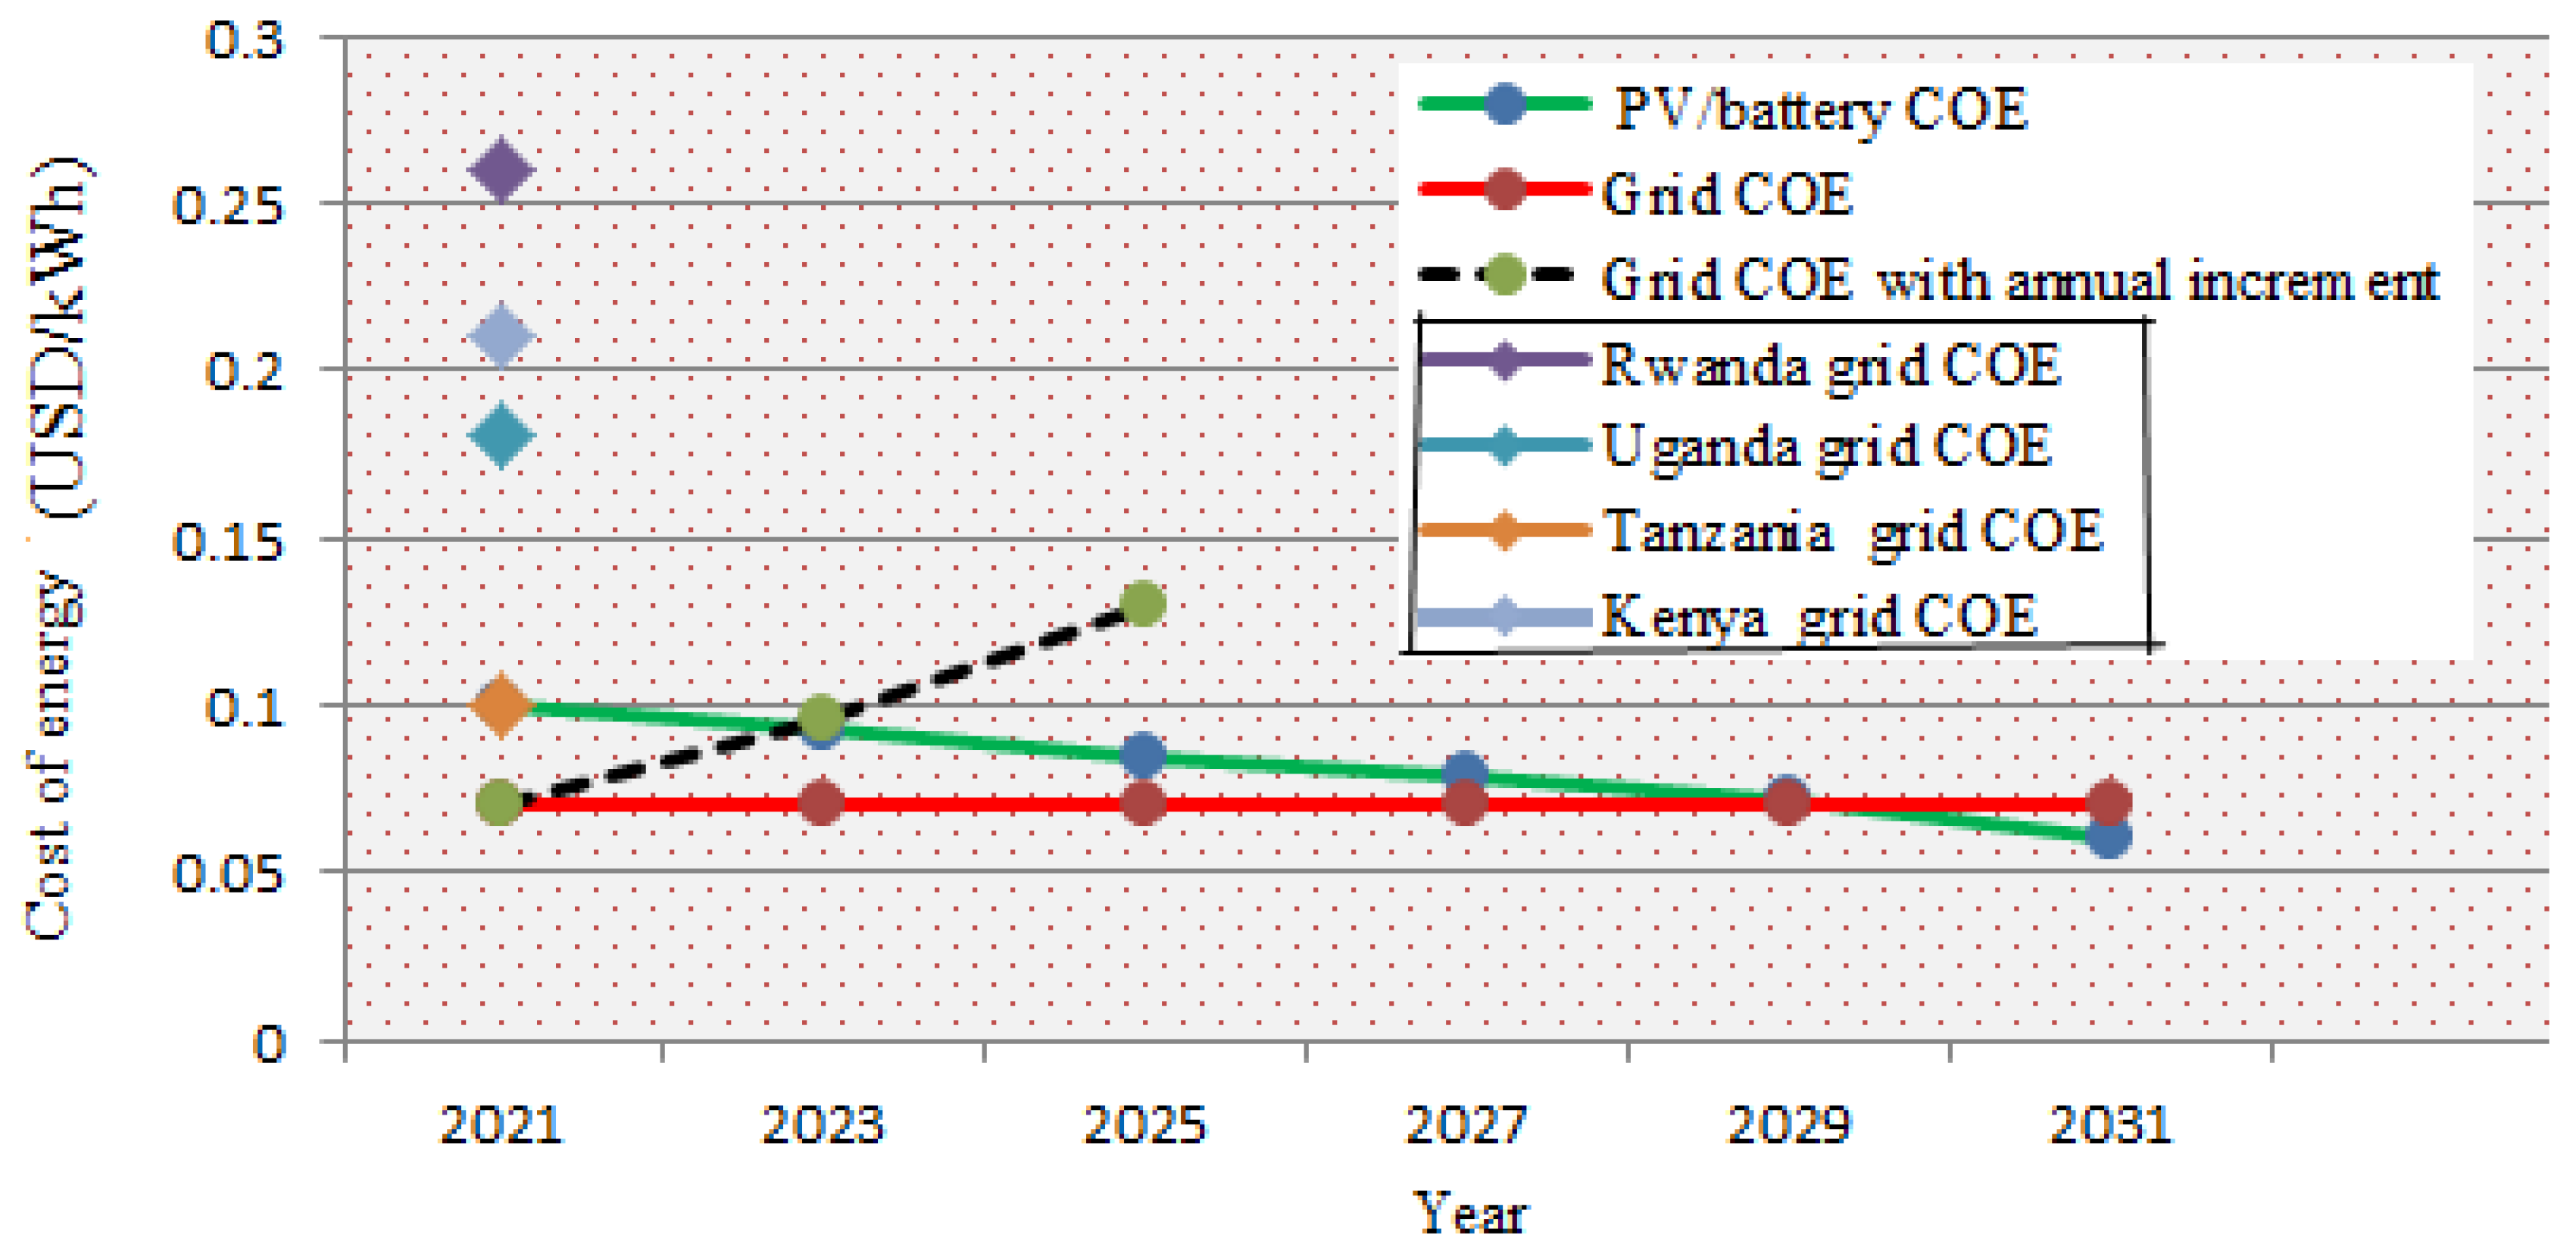
The financial examination of PV/battery systems operated in islanded mode with a 4.8% annual PV cost reduction showed that, after 2029 the COE of the PV/battery microgrid will totally break the grid (utility) tariff in Ethiopia. With an expected 18% annual escalation of the grid tariff for the coming 4 years starting from 2021, the COE of the PV/battery system will totally break the grid tariff in the country after 2023.
From the comparative simulation study, we deduced that grid-tied and islanded solar PV supply options are vital for Ethiopia and, during the stated period in the simulation, policy reform and support are crucial.
Performance comparison of each simulationg software package:
All the three proposed tools can be utilized only as estimation software and not as precise computation tools.
PVGIS and PVWatts are used only for technical viability analyses of grid-connected or standalone PV systems, and there is no function for economic and emission optimization in these packages, and this can be observed as a weakness in these tools. HOMER Pro is more advanced than PVGIS and PVWatts for carrying out technical analyses, economic optimizations and sensitivity investigations of off-grid and grid-tied power systems.
The energy yield obtained using PVGIS was very close to the HOMER Pro measured output. If measured data are not available, PVGIS estimates are better than PVWatts and HOMER Pro NASA solar radiation data.
The sensitivity analysis result:
Of the sensitivity parameters considered, inflation rate variation has more effect on the COE of the system. For a 4% inflation rate increase, the COE tended to reduce by 16.5%. Furthermore, for the same change, the COE is influenced by the discount rate, PV panel efficiency, inverter efficiency, solar radiation and PV capital cost, in the order. With the analyzed sensitivity analysis outputs, solar energy investors from national and international organizations can consider investing in this clean energy technology in Ethiopia.
This study offers significant insights for policy implementation in Ethiopia concerning to energy supply alternatives. The selection of affordable electricity supply options is vital for Ethiopia to achieve the proposed 2025 target of universal energy access. An alteration in the attractiveness of the solar PV power option into the future has so far not been projected in the Ethiopian context in view of the current and emerging grid tariff plan, and we believe that this research can fill this gap. Additionally, this investigation can be a starting point and serve as a database for future solar PV projects, by taking into account location-specific differences, regulations, resource potential and applicable financial indicators for various countries. However, taking this investigation as a viability study, the electrical structure of the optimal grid/PV system and its stability analysis need to be examined in detail, which is not included in this study. Further comparisons with the other metaheuristic optimization techniques could also be carried out, along with the techniques used in this study.

Author Contributions

T.M., performed the data collection and literature review; R.B., V.R. and T.M. developed the methodology, and performed the data analysis and simulation models; T.M. and R.B. contributed to writing the paper; R.B. and V.R. reviewed and edited the manuscript; R.B., as a main supervisor, followed up all study steps and gave helpful advice. All authors discussed the results, and read and approved the manuscript. All authors have read and agreed to the published version of the manuscript.

Funding

This research was funded by Germen Federal Ministry of Education and Research (BMBF) through its Project Management Agency (Pt-DLR) under the framework of WESA-ITT Project with grant No 01DG16010B, and Germen Development Bank (KfW) under ExiST Project with grant No. 51235.

Institutional Review Board Statement

Not applicable.

Informed Consent Statement

Not applicable.

Data Availability Statement

The data presented in this manuscript are available on request from the corresponding Author.

Acknowledgments

The authors would like to acknowledge the German Federal Ministry of Education and Research (BMBF) for funding this research under the framework of the WESA-ITT project. Thanks are also due to the German Development Bank (KfW) for their support in the form of a scholarship to the corresponding author of this article through ExiST project.

Conflicts of Interest

The authors announce no conflict of interest.

References

  1. CIA The World Fact Book. 2020. Available online: https://www.cia.gov/library/publications/the-worldfactbook/geos/et.html (accessed on 11 October 2020).
  2. Food and Agriculture Organization of the United States Country Profile–Ethiopia. 2016. Available online: http://www.fao.org/3/i9732en/I9732EN.pdf (accessed on 2 December 2019).
  3. World Bank. Access to Electricity (% of Population)–Ethiopia. 2018. Available online: https://data.worldbank.org/indicator/EG.ELC.ACCS.ZS?locations=ET (accessed on 19 August 2020).
  4. RES4Africa Foundation. Integration of Variable Renewable Energy in the National Electric System of Ethiopia. 2019. Available online: https://www.res4africa.org/wp-content/uploads/2019/07/Abstract-Integration-StudyEthiopia.pdf (accessed on 19 December 2020).
  5. Solarplaza. Ethiopia Solar Report. 2019. Available online: https://sun-connect-news.org/fileadmin/DATEIEN/Dateien/New/White_Paper_-_Ethiopia_Solar_Report_2019.pdf (accessed on 17 December 2019).
  6. Energy and Economic Growth (EEG) Research Programme. Electricity in Ethiopia. 2018. Available online: https://assets.publishing.service.gov.uk/media/5b39f692ed915d33c48a5746/Energy_Insight_Ethiopia.pdf (accessed on 19 December 2019).
  7. Center for Global Development. Working Papers. 2018. Available online: https://www.cgdev.org/sites/default/files/how-do-african-firms-respond-unreliable-power-exploring-firm-heterogeneity-using-k-means.pdf (accessed on 19 December 2019).
  8. Cole, M.A.; Elliott, R.J.; Occhiali, G.; Strobl, E. Power outages and firm performance in Sub-Saharan Africa. J. Dev. Econ. 2018, 134, 150–159. [Google Scholar] [CrossRef]
  9. Mavoungou, D.G.M.; Raji, A.K.; Showers, S.O.; Luta, D. Energy Efficiency Techniques for Residential, Commercial and Industrial application in Sub- Saharan Africa. In Proceedings of the 2020 IEEE PES/IAS PowerAfrica, Nairobi, Kenya, 25–28 August 2020. [Google Scholar]
  10. Mondal, A.H.; Bryan, E.; Ringler, C.; Mekonnen, D.; Rosegrant, M. Ethiopian energy status and demand scenarios: Prospects to improve energy ef fi ciency and mitigate GHG emissions. Energy 2018, 149, 161–172. [Google Scholar] [CrossRef]
  11. Mondal, A.H.; Bryan, E.; Ringler, C.; Rosegrant, M. Ethiopian power sector development: Renewable based universal electricity access and export strategies. Renew. Sustain. Energy Rev. 2017, 75, 11–20. [Google Scholar] [CrossRef]
  12. Jiangtao, M.; Jianshe, Y.; Kai, Z. Master Plan Report of Wind and Solar Energy in Ethiopia; HydroChina Beijing Engineering Corporation: Addis Ababa, Ethiopia, 2012. [Google Scholar]
  13. Guta, D.D. Determinants of household adoption of solar energy technology in rural Ethiopia. J. Clean. Prod. 2018, 204, 193–204. [Google Scholar] [CrossRef]
  14. IRENA. Future of Solar Photovoltaic. 2019. Available online: https://www.irena.org/-/media/Files/IRENA/Agency/Publication/2019/Nov/IRENA_Future_of_Solar_PV_2019.pdf (accessed on 28 December 2020).
  15. Vartiainen, E.; Breyer, C.; Moser, D.; Román Medina, E. Impact of weighted average cost of capital, capital expenditure, and other parameters on future utility—scale PV levelised cost of electricity. Prog. Photovolt. Res. Appl. 2020, 28, 439–453. [Google Scholar] [CrossRef]
  16. Agora Energiewende. Current and Future Cost of Photovoltaics. 2015. Available online: https://www.agora-energiewende.de/en/publications/current-and-future-cost-of-photovoltaics/ (accessed on 20 October 2020).
  17. Ethiopian Electric Utility. Current Tariffs. 2018. Available online: http://www.eeu.gov.et/index.php/current-tariff (accessed on 12 January 2020).
  18. Isa, N.M.; Das, H.S.; Tan, C.W.; Yatim, A.H.M.; Lau, K.Y. A techno-economic assessment of a combined heat and power photovoltaic/fuel cell/battery energy system in Malaysia hospital. Energy 2016, 112, 75–90. [Google Scholar] [CrossRef]
  19. Owolabi, A.B.; Nsafon, B.E.K.; Roh, J.W.; Suh, D.; Huh, J.-S. Validating the techno-economic and environmental sustainability of solar PV technology in Nigeria using RETScreen Experts to assess its viability. Sustain. Energy Technol. Assess. 2019, 36, 100542. [Google Scholar] [CrossRef]
  20. Tomar, V.; Tiwari, G.N. Techno-economic evaluation of grid connected PV system for households with feed in tari ff and time of day tari ff regulation in New Delhi—A sustainable approach. Renew. Sustain. Energy Rev. 2017, 70, 822–835. [Google Scholar] [CrossRef]
  21. Nassar, Y.F.; Alsadi, S.Y. Assessment of solar energy potential in Gaza Strip-Palestine. Sustain. Energy Technol. Assess. 2019, 31, 318–328. [Google Scholar]
  22. Duman, A.C.; Güler, Ö. Techno-economic analysis of o ff -grid photovoltaic LED road lighting systems: A case study for northern, central and southern regions of Turkey. Build. Environ. 2019, 156, 89–98. [Google Scholar] [CrossRef]
  23. Zandi, M.; Bahrami, M.; Eslami, S.; Gavagsaz-Ghoachani, R.; Payman, A.; Phattanasak, M.; Nahid-Mobarakeh, B.; Pierfederici, S. Evaluation and comparison of economic policies to increase distributed generation capacity in the Iranian household consumption sector using photovoltaic systems and RETScreen software. Renew. Energy 2017, 107, 215–222. [Google Scholar] [CrossRef]
  24. Imam, A.A.; Al-Turki, Y.A. Techno-Economic Feasibility Assessment of Grid-Connected PV Systems for Residential Buildings in Saudi Arabia—A Case Study. Sustainability 2019, 12, 262. [Google Scholar] [CrossRef]
  25. Akpolat, A.N.; Dursun, E.; Kuzucuoğlu, A.E.; Yang, Y.; Blaabjerg, F.; Baba, A.F. Performance Analysis of a Grid-Connected Rooftop Solar Photovoltaic System. Electronics 2019, 8, 905. [Google Scholar] [CrossRef]
  26. Kumar, N.M.; Sudhakar, K.; Samykano, M. Techno-economic analysis of 1 MWp grid connected solar PV plant in Malaysia. Int. J. Ambient. Energy 2017, 40, 434–443. [Google Scholar] [CrossRef]
  27. Mohammadi, K.; Naderi, M.; Sagha, M. Economic feasibility of developing grid-connected photovoltaic plants in the southern coast of Iran. Energy 2018, 156, 17–31. [Google Scholar] [CrossRef]
  28. Nastasi, B.; Mazzoni, S.; Groppi, D.; Romagnoli, A.; Garcia, D.A. Solar power-to-gas application to an island energy system. Renew. Energy 2021, 164, 1005–1016. [Google Scholar] [CrossRef]
  29. De Novaes Pires Leite, G.; Weschenfelder, F.; Araújo, A.M.; Ochoa, A.A.V.; Da Franca Prestrelo Neto, N.; Kraj, A. An economic analysis of the integration between air-conditioning and solar photovoltaic systems. Energy Convers. Manag. 2019, 185, 836–849. [Google Scholar] [CrossRef]
  30. Ayadi, O.; Al-Assad, R.; Al Asfar, J. Techno-economic assessment of a grid connected photovoltaic system for the University of Jordan. Sustain. Cities Soc. 2018, 39, 93–98. [Google Scholar] [CrossRef]
  31. Odou, O.D.T.; Bhandari, R.; Adamou, R. Hybrid off-grid renewable power system for sustainable rural electri fi cation in Benin. Renew. Energy 2020, 145, 1266–1279. [Google Scholar] [CrossRef]
  32. Cauz, M.; Bloch, L.; Rod, C.; Perret, L.; Ballif, C.; Wyrsch, N. Benefits of a Diversified Energy Mix for Islanded Systems. Front. Energy Res. 2020, 8, 1–8. [Google Scholar] [CrossRef]
  33. Tijjani, A.; Wei, C. Optimal sizing and techno-economic analysis of grid-connected nanogrid for tropical climates of the Savannah. Sustain. Cities Soc. 2020, 52, 101824. [Google Scholar]
  34. Li, C.; Zhou, D.; Zheng, Y. Techno-economic comparative study of grid-connected PV power systems in five climate zones, China. Energy 2018, 165, 1352–1369. [Google Scholar] [CrossRef]
  35. Mekonnen, T.; Bhandari, R.; Ramayya, A.V. Techno-economic analysis of grid-integrated PV/wind systems for electricity reliability enhancement in Ethiopian industrial park. Sustain. Cities Soc. 2020, 53, 101915. [Google Scholar]
  36. Bakhshi, R.; Sadeh, J. Economic evaluation of grid-connected photovoltaic systems viability under a new dynamic feed-in tariff scheme: A case study in Iran. Renew. Energy 2017, 119, 354–364. [Google Scholar] [CrossRef]
  37. Shah, S.A.A.; Valasai, G.D.; Memon, A.A.; Laghari, A.N.; Jalbani, N.B.; Strait, J.L. Techno-Economic Analysis of Solar PV Electricity Supply to Rural Areas of Balochistan, Pakistan. Energies 2018, 11, 1777. [Google Scholar] [CrossRef]
  38. Mukisa, N.; Zamora, R.; Lie, T.T. Feasibility assessment of grid-tied rooftop solar photovoltaic systems for industrial sector application in Uganda. Sustain. Energy Technol. Assess. 2019, 32, 83–91. [Google Scholar] [CrossRef]
  39. Aziz, A.S.; Tajuddin, M.F.N.; Adzman, M.R.; Mohammed, M.F.; Ramli, M.A. Feasibility analysis of grid-connected and islanded operation of a solar PV microgrid system: A case study of Iraq. Energy 2020, 191, 116591. [Google Scholar] [CrossRef]
  40. Samu, R.; Poyrazoglu, G.; Fahrioglu, M. The Potential and Economic Analysis of Grid-connected Solar PV Power in Kenya. In Proceedings of the 2019 1st Global Power, Energy and Communication Conference (GPECOM), Nevsehir, Turkey, 12–15 June 2019; pp. 298–301. [Google Scholar] [CrossRef]
  41. Rezk, H.; Ali, M.; Ghenai, C. Performance evaluation and optimal design of stand-alone solar PV-battery system for irrigation in isolated regions: A case study in Al Minya (Egypt). Sustain. Energy Technol. Assess. 2019, 36, 1–11. [Google Scholar] [CrossRef]
  42. KfW Group. Research Focus on Economics. 2019. Available online: https://www.kfw.de/PDF/DownloadCenter/Konzernthemen/Research/PDF-Dokumente-Fokus-Volkswirtschaft/Fokus-englischeDateien/Fokus-2019-EN/Focus-No.-249-March-2019-Ethiopia-2025.pdf (accessed on 23 December 2019).
  43. Okereke, C.; Coke, A.; Geebreyesus, M.; Ginbo, T.; Wakeford, J.J.; Mulugetta, Y. Governing green industrialisation in Africa: Assessing key parameters for a sustainable socio-technical transition in the context of Ethiopia. World Dev. 2019, 115, 279–290. [Google Scholar] [CrossRef]
  44. Psiloglou, B.; Kambezidis, H.; Kaskaoutis, D.; Karagiannis, D.; Polo, J. Comparison between MRM simulations, CAMS and PVGIS databases with measured solar radiation components at the Methoni station, Greece. Renew. Energy 2020, 146, 1372–1391. [Google Scholar] [CrossRef]
  45. Psomopoulos, C.S.; Ioannidis, G.C.; Kaminaris, S.D.; Mardikis, K.D.; Katsikas, N.G. A Comparative Evaluation of Photovoltaic Electricity Production Assessment Software (PVGIS, PVWatts and RETScreen). Environ. Process. 2015, 2, 175–189. [Google Scholar] [CrossRef]
  46. Dondariya, C.; Porwal, D.; Awasthi, A.; Shukla, A.K.; Sudhakar, K.; SR, M.M.; Bhimte, A.; R. Sreerama, A. Performance simulation of grid-connected rooftop solar PV system for small households: A case study of Ujjain, India. Energy Rep. 2018, 4, 546–553. [Google Scholar] [CrossRef]
  47. Formica, T.; Pecht, M. Return on investment analysis and simulation of a 9.12 kilowatt (kW) solar photovoltaic system. Sol. Energy 2017, 144, 629–634. [Google Scholar] [CrossRef]
  48. National Renewable Energy Laboratory (NREL). PV Watts Version 5 Manual. 2015. Available online: https://www.nrel.gov/docs/fy14osti/62641.pdf (accessed on 30 December 2019).
  49. Gautam, J.; Ahmed, I.; Kumar, P. Optimization and Comparative Analysis of Solar-Biomass Hybrid Power Generation System Using Homer. In Proceedings of the 2018 International Conference on Intelligent Circuits and Systems (ICICS), Phagwara, India, 19–20 April 2018; pp. 1–4. [Google Scholar] [CrossRef]
  50. Salameh, T.; Ghenai, C.; Merabet, A.; Alkasrawi, M. Techno-economical optimization of an integrated stand-alone hybrid solar PV tracking and diesel generator power system in Khorfakkan, United Arab Emirates. Energy 2020, 190, 116475. [Google Scholar] [CrossRef]
  51. Duman, A.C.; Güler, Ö. Techno-economic analysis of o ff -grid PV/wind/fuel cell hybrid system combinations with a comparison of regularly and seasonally occupied households. Sustain. Cities Soc. 2018, 42, 107–126. [Google Scholar] [CrossRef]
  52. Sarker, S. Feasibility analysis of a renewable hybrid energy system with producer gas generator ful fi lling remote household electricity demand in Southern Norway. Renew. Energy 2016, 87, 772–781. [Google Scholar] [CrossRef]
  53. Gokcek, M.; Kale, C. Techno-economical evaluation of a hydrogen refuelling station powered by Wind-PV hybrid power system: A case study for Izmir-Cesme. Int. J. Hydrojen Energy 2018, 43, 1–11. [Google Scholar]
  54. Sadeghi, S.; Askari, I.B. Prefeasibility techno-economic assessment of a hybrid power plant with photovoltaic, fuel cell and Compressed Air Energy Storage (CAES). Energy 2018, 168, 409–424. [Google Scholar] [CrossRef]
  55. Li, C.; Zhou, D.; Wang, H.; Cheng, H.; Li, D. Feasibility assessment of a hybrid PV/diesel/battery power system for a housing estate in the severe cold zone—A case study of Harbin, China. Energy 2019, 185, 671–681. [Google Scholar] [CrossRef]
  56. National Bank of Ethiopia. National Bank of Ethiopia Quarterly Bulletin, Volume 35. 2019. Available online: http://www.nbebank.com/pdf/quartelybulletin/Vol%2035%20Q1/First%20Quarter%20Report%202018-19.pdf (accessed on 1 February 2020).
  57. Padrón, I.; Avila, D.; Marichal, G.N.; Rodríguez, J.A. Assessment of Hybrid Renewable Energy Systems to supplied energy to Autonomous Desalination Systems in two islands of the Canary Archipelago. Renew. Sustain. Energy Rev. 2019, 101, 221–230. [Google Scholar] [CrossRef]
  58. Villena-Ruiz, R.; Ramirez, F.J.; Honrubia-Escribano, A.; Gómez-Lázaro, E. A techno-economic analysis of a real wind farm repowering experience: The Malpica case. Energy Convers. Manag. 2018, 172, 182–199. [Google Scholar] [CrossRef]
  59. Mulugeta, Y.; Drake, F. Assessment of solar and wind energy resources in Ethiopia. II. Wind energy. Sol. Energy 1996, 57, 323–334. [Google Scholar] [CrossRef]
  60. Sabbagh, J.; Syigh, A.A.; EL-Salam, E. Estimation of the total solar radiation from meteorological data. Sol. Energy 1977, 19, 301–311. [Google Scholar] [CrossRef]
  61. Ghenai, C.; Salameh, T.; Merabet, A. Technico-economic analysis of off grid solar PV/Fuel cell energy system for residential community in desert region. Int. J. Hydrog. Energy 2018, 1–11. [Google Scholar] [CrossRef]
  62. Ghenai, C.; Bettayeb, M. Modelling and performance analysis of a stand-alone hybrid solar PV/Fuel Cell/Diesel Generator power system for university building. Energy 2019, 171, 180–189. [Google Scholar] [CrossRef]
  63. Andreani, L.C.; Bozzola, A.; Kowalczewski, P.; Liscidini, M.; Redorici, L. Silicon solar cells: Toward the efficiency limits. Adv. Phys. X 2018, 4, 1–25. [Google Scholar] [CrossRef]
  64. Nandal, V.; Kumar, R.; Singh, S.K. Barriers identi fi cation and analysis of solar power implementation in Indian thermal power plants: An Interpretative Structural Modeling approach. Renew. Sustain. Energy Rev. 2019, 114, 109330. [Google Scholar] [CrossRef]
  65. Green, M.A.; Dunlop, E.D.; Hohl-Ebinger, J.; Yoshita, M.; Kopidakis, N.; Ho-Baillie, A.W. Solar cell efficiency tables (Version 55). Prog. Photovolt. Res. Appl. 2020, 28, 3–15. [Google Scholar] [CrossRef]
  66. Sharma, R.; Goel, S. Performance analysis of a 11.2 kWp roof top grid-connected PV system in Eastern India. Energy Rep. 2017, 3, 76–84. [Google Scholar] [CrossRef]
  67. Ajlan, A.; Tan, C.W.; Abdilahi, A.M. Assessment of environmental and economic perspectives for renewable-based hybrid power system in Yemen. Renew. Sustain. Energy Rev. 2017, 75, 559–570. [Google Scholar] [CrossRef]
  68. Kohsri, S.; Meechai, A.; Prapainainar, C.; Narataruksa, P.; Hunpinyo, P.; Sin, G. Design and preliminary operation of a hybrid syngas/solar PV/battery power system for off-grid applications: A case study in Thailand. Chem. Eng. Res. Design 2018, 131, 346–361. [Google Scholar] [CrossRef]
  69. Mokhtara, C.; Negrou, B.; Settou, N. Design optimization of grid-connected PV-Hydrogen for energy prosumers considering sector-coupling paradigm: Case study of a university building in Algeria. Int. J. Hydrog. Energy 2020, in press. [Google Scholar] [CrossRef]
  70. Al Garni, H.Z.; Awasthi, A.; Ramli, M.A.M. Optimal design and analysis of grid-connected photovoltaic under different tracking systems using HOMER. Energy Convers. Manag. 2018, 155, 42–57. [Google Scholar] [CrossRef]
  71. Mayer, M.J.; Gróf, G. Techno-economic optimization of grid-connected, ground-mounted photovoltaic power plants by genetic algorithm based on a comprehensive mathematical model. Sol. Energy 2020, 202, 210–226. [Google Scholar] [CrossRef]
  72. Islam, M.S. A techno-economic feasibility analysis of hybrid renewable energy supply options for a grid-connected large office building in southeastern part of France. Sustain. Cities Soc. 2018, 38, 492–508. [Google Scholar] [CrossRef]
  73. Bakhshi-jafarabadi, R.; Sadeh, J.; Dehghan, M. Economic evaluation of commercial grid-connected photovoltaic systems in the Middle East based on experimental data: A case study in Iran. Sustain. Energy Technol. Assess. 2020, 37, 100581. [Google Scholar] [CrossRef]
  74. Global Petrol Price. Electricity Prices Around the World. 2020. Available online: https://www.globalpetrolprices.com/electricity_prices/ (accessed on 18 September 2020).
  75. Adefarati, T.; Obikoya, G.D. Techno-economic evaluation of a grid-connected microgrid system. Int. J. Green Energy 2019, 16, 1–21. [Google Scholar] [CrossRef]
  76. Herbazi, R.; Amechnoue, K.; Khouya, A.; Chahboun, A.; Diani, M.; Louzazni, M.; Addou, M. Performance evaluation and analysis of polycrystalline photovoltaic plant located in Northern Morocco. Int. J. Ambient. Energy 2019, 40, 1–28. [Google Scholar] [CrossRef]
Figure 1. Ethiopia’s power generation mix (2018–2019) [4].
Energies 14 03360 g001
Figure 2. Site layout of the study area [Google Map 2019 edition].
Energies 14 03360 g002
Figure 3. Schematic designation of the tools and methodological steps used in the study.
Energies 14 03360 g003
Figure 4. Monthly average analyzed, NASA, PVGIS, and PVWatts solar irradiation values for the site.
Energies 14 03360 g004
Figure 5. Calculated hourly solar radiation, kW h/m2.
Energies 14 03360 g005
Figure 6. Monthly average ambient temperature values for the investigated site.
Energies 14 03360 g006
Figure 7. Average daily load within the year.
Energies 14 03360 g007
Figure 8. General scheme of the joined grid-tied/off-grid solar power system.
Energies 14 03360 g008
Figure 9. Schematic representation of the grid-tied/islanded supply systems in HOMER Pro for the investigated area.
Energies 14 03360 g009
Figure 10. The monthly average electric production for grid/PV systems.
Energies 14 03360 g010
Figure 11. Comparison of the PV/battery’s COE with the grid’s COE.
Energies 14 03360 g011
Figure 12. Impact of the nominal discount rate and inflation rate on the NPC and COE for the study site.
Energies 14 03360 g012
Figure 13. Impact of PV capital cost change on the NPC and COE.
Energies 14 03360 g013
Figure 14. Effect of inverter efficiency change on the NPC and COE.
Energies 14 03360 g014
Figure 15. Impact of PV panel efficiency variation on the NPC and COE.
Energies 14 03360 g015
Figure 16. Impact of solar irradiance change on the NPC and RF.
Energies 14 03360 g016
Table 1. Economic viability gap (cost of energy (COE)) of solar PV microgrids from the grid in some countries.
Authors Years of PublicationCountrySolar PV System ConfigurationCountry Grid Tariff (COE)
(USD/kWh)
Reported COE (from Grid–Connected PV)
USD/kWh)
Viability Gap
(USD/kWh)
Imam et al. [24]2019Saudi ArabiaGrid-connected0.050.038−0.012
Li C et al. [34]2018ChinaGrid-connected0.080.073−0.007
Mekonnen et al. [35]2020EthiopiaGrid-connected0.040.0560.016
Bakhshi et al. [36]2017IranGrid-connected0.0350.0490.014
Ahsan S et al. [37]2018PakistanIslanded0.130.053−0.077
Owolabi et al. [19]2019NigeriaIslanded0.070.1280.058
Mukisa et al. [38]2019UgandaGrid-connected0.180.0575−0.1225
Saleh et al. [39]2020IraqIslanded0.050.1650.115
Samu et al. [40]2019KenyaGrid-connected0.210.174−0.036
Rezk et al. [41]2019EgyptIslanded0.040.060.02
Table 2. Cost and technical data of the PV panel.
ConstantsDescription
Type of PV panelCrystalline silicon
Nominal operational temperature47 °C
Temperature coefficient of power−0.40 °C
Efficiency at standard test conditions16.02%
Derating factor80%
Capital price798 USD/kW
Operation and maintenance price7 USD/kW/yr
Lifespan (Years)25
Table 3. Cost and technical data of the storage.
ConstantsDescription
ModelSurrette 6CS25P
Nominal voltage6 V
Nominal capacity1156 Ah
Minimum state of charge40%
Roundtrip efficiency80%
Lifespan throughput9645 kWh
Capital price899 USD
Replacement price698 USD
Operation and maintenance price8 USD/year
Table 4. Technical and economic data of the converter.
ParameterSpecification
Capital price648 USD/kW
Replacement price598 USD/kW
Operation and maintenance price5.5 USD/year
Efficiency95%
Lifespan (years)15
Table 5. Economic characteristics, yearly power generation and consumption of grid alone systems.
Grid
(kW)
NPCCOERFGrid Purchase (kWh/year)Load
(kWh/year)
80174,8880.070118,260118,260
Table 6. Financial features of the optimized grid/PV systems.
Grid
(kW)
PV
(kW)
Converter
(kW)
NPC
(USD)
COE
(USD/kWh)
RF
804525148,4090.058157.1
Table 7. Annual electricity generation and utilization of grid/PV systems in the site.
Grid Purchase (kWh/year)PV Production (kWh/year)Demand (kWh/year)Grid Sales (kWh/year)Entire Utilization
(kWh/year)
45,14280,485118,2604244122,504
Table 8. Comparison of the present system’s configuration with other studies.
LocationSystem Size (kWp)Optimization
Method
Average Irradiance
(kWh/m2/day)
COE (USD/kWh)
China (Beijing) [34]104HOMER4.450.073
Kenya (Maralal) [40]435RETScreen 6.290.174
Algeria (Ouargla) [69]1916Particle swarm optimization5.980.016
Saudi Arabia (Makkah) [70]1HOMER5.810.049
Hungary (Budapest) [71]40Genetic algorithm4.820.099
France (Grenoble) [72]1050HOMER3.980.083
Iran(Middle east) [73]120Analytical/PVsyst 5.780.048
Present system (Mekelle)40.17HOMER Pro6.150.058
Table 9. Financial features of the grid/PV/battery system.
Grid
(kW)
PV
(kW)
BatteryConverter (kW)NPC
(USD)
COE
(USD/kWh)
RF
8040620159,2410.06249.3
Table 10. PV/battery system report.
System ArchitectureAnnual PV Generation (kWh/year)Total Consumption
(kWh/year)
Excess
Electricity (kWh/year)
PV (kW)BatteryConverter (kW)
9585 Surr6CS25P42171,802118,26041,639
Table 11. Comparison of technical parameters.
Technical ParametersPVGISPVWattsHOMER
(with NASA Data)
HOMER
(with Measured)
Yearly average energy
generation (kWh/year)
79,14574,65077,84080,485
PV capacity (kW)45454545
Yield factor1752165517261787
Capacity factor2018.919.720.4
Publisher’s Note: MDPI stays neutral with regard to jurisdictional claims in published maps and institutional affiliations.

