Article

Seismic Design of Offshore Wind Turbines: Good, Bad and Unknowns

1
Department of Civil and Environmental Engineering, University of Surrey, Guildford GU2 7XH, UK
2
Structural Engineering Department, University of California, San Diego, CA 92093, USA
3
Sir Robert McAlpine Ltd., Hemel Hempstead HP2 7TR, UK
4
Department of Mechanical, Aerospace & Civil Engineering, University of Manchester, Manchester M13 9PL, UK
*
Author to whom correspondence should be addressed.
Submission received: 27 April 2021 / Revised: 29 May 2021 / Accepted: 8 June 2021 / Published: 12 June 2021
(This article belongs to the Special Issue Foundation Systems for Offshore Wind Turbines)

Abstract

:
Large scale offshore wind farms are relatively new infrastructures and are being deployed in regions prone to earthquakes. Offshore wind farms comprise of both offshore wind turbines (OWTs) and balance of plants (BOP) facilities, such as inter-array and export cables, grid connection etc. An OWT structure can be either grounded systems (rigidly anchored to the seabed) or floating systems (with tension legs or catenary cables). OWTs are dynamically-sensitive structures made of a long slender tower with a top-heavy mass, known as Nacelle, to which a heavy rotating mass (hub and blades) is attached. These structures, apart from the variable environmental wind and wave loads, may also be subjected to earthquake related hazards in seismic zones. The earthquake hazards that can affect offshore wind farm are fault displacement, seismic shaking, subsurface liquefaction, submarine landslides, tsunami effects and a combination thereof. Procedures for seismic designing OWTs are not explicitly mentioned in current codes of practice. The aim of the paper is to discuss the seismic related challenges in the analysis and design of offshore wind farms and wind turbine structures. Different types of grounded and floating systems are considered to evaluate the seismic related effects. However, emphasis is provided on Tension Leg Platform (TLP) type floating wind turbine. Future research needs are also identified.

1. Introduction

1.1. Climate Change, Offshore Wind Farm and Global Seismic Hazards

The next decade will see engineering efforts to achieve net-zero, a climate-neutral continent (the ambition of EU) and develop climate-smart cities. One way to achieve net-zero is carbonizing the energy/power sources and working towards an entirely clean energy system. As offshore wind is one of the most advanced technologies for producing carbon-neutral energy, offshore wind farms will be deployed in different regions, including those prone to earthquakes; however, there is limited track-record of long-term performance of offshore wind turbines (OWTs) under seismic effects. Figure 1 shows a global seismic hazard map in terms of peak ground acceleration (PGA) together with major offshore wind farm developments. Figure 2 shows a tsunami hazard map with recorded tsunami height.

1.2. Offshore Wind Turbine Systems and Seismic Hazards

Offshore wind turbine systems can be classified into two types: grounded and floating. The readers are referred to two recent textbooks [3,4] for further details on the different types of systems and main design considerations. Figure 3 shows a schematic diagram of the main mechanisms affecting an offshore wind turbine during an earthquake.
The figure also shows the most common foundation systems for OWTs. Based on this, the following considerations can be made from Figure 3:
  • Grounded systems (i.e., where the foundation is embedded to the ground) are typical for shallow waters. For such systems, strong motion is transmitted to the RNA through the embedded foundation. There exist different types of floating systems where a floater is anchored to the seabed through cables. For a floating system, earthquake motion shakes affect the embedded component of the foundation, that is the anchor. On the other hand, the cables transmit the part of the seismic motion to the floater and support structure mainly through compressional P-waves, which tend to pull the cables. Moreover, it can be argued that it is difficult to transmit motion due to the low mass of the cable as well damping offered by the water. In this sense, floating systems are better suited for seismic locations as they tend to mitigate the effect induced by the ground shaking.
  • Other major seismic hazard may arise from large fault movement. The effect of this hazard on floating offshore wind turbines is schematically shown in Figure 4a,b for catenary and tension leg platforms, respectively.
Earthquake hazards to a wind farm can be complex and it is considered useful to discuss further. Figure 5 shows a schematic of a wind farm with grounded systems.
A typical offshore wind farm comprises different systems, including a sub-station, inter-array cables, export cables and grid connection. Each of these components should be operational after earthquake seismic events and therefore it is often useful to take a holistic design approach. Notable hazards that may affect offshore wind turbines in seismic active regions include ground shaking, liquefaction, submarine landslides, tsunami and an appropriate combination thereof. Among all the effects, liquefaction has the potential to cause excessive tilting for monopile-supported wind turbines [6]. Table 1 lists typical hazards from the various potential seismic zones around the world.
Seismic hazards to an offshore wind farm are illustrated in Figure 6. The necessary steps in a seismic risk evaluation have been studied by several researchers [7,8,9,10,11,12,13,14,15] and briefly summarized below:
  • Identify seismic hazards at the site including cascading events.
  • Rupture of the cables or embedded anchoring for floating systems can occur due to the effect of large fault movements (i.e., for example, subduction fault). Figure 4a,b show schematic diagrams explaining the situation taking into consideration a catenary mooring system and a TLP system.
  • Ground shaking caused by inertial effects on the structure induces inertial bending moment on the foundation piles in a non-liquefiable subsurface. Soil layers with contrasting stiffness induce additional bending moments due to kinematic interaction.
  • The onset of liquefaction may elongate the natural vibration period of the whole structure due to increase in unsupported length of the pile. One of the significant risks is the tilting of the foundation due to liquefaction. The rate of liquefaction depends on the ground profile and type of input motion. The transient effects of liquefaction influences the bending moment in the piles, and thus need to be considered.
  • If there is a tsunami risk, the effect must be considered together with the ground shaking and liquefaction.
  • Earthquakes may cause submarine landslides, and the potential impact must be considered.
  • The effect of earthquake sequence such as foreshock–mainshock–aftershock need to be evaluated.

1.3. Loading Complexity of Offshore Wind Turbine Structure

In an offshore wind turbine, the design and analysis of the foundation is challenging due to complex load conditions arising from the environmental loads (i.e., wind, wave, currents) and seismic loads in seismically active regions. Figure 7 shows a schematic diagram of the environmental loads acting on a typical offshore wind turbine, which need to be carried by the foundations and transferred to the adjacent soil.
There are four main environmental loads (i) wind, (ii) wave, (iii) 1P (rotor frequency) and (iv) 2P/3P (blade passing frequency) loads whose waveform is also shown in Figure 7 for a monopile foundation. The salient characteristics of these loads are summarized as follows:
  • Wind and wave loads have varying amplitude and frequency. Figure 7 shows a schematic representation of the frequency of these loads together with the frequency intervals corresponding to the three possible design choices: Soft–Soft, Soft–Stiff and Stiff–Stiff.
  • Wind and the wave loads are random in both space and time, and can statistically be described through probability distributions.
  • Wave and wind load act in two different directions, which give rise to the so-called wind–wave misalignment.
  • 1P loading is caused by mass and aerodynamic imbalances of the rotor, while the forcing frequency equals the rotational frequency of the rotor.
  • The blade shadowing effect causes 2P/3P loading, wind shear (i.e., the change in wind speed with height above the ground) and rotational sampling of turbulence. Its frequency is two or three times the 1P frequency for two and three-bladed turbines, respectively.
As mentioned earlier, the mass and stiffness distribution, and the applied forcing frequencies make offshore wind turbines structures very sensitive to dynamic effects, such as resonance, vibrations, etc. for further discussions the interested reader is referred to [3,16]. Depending on the size of the turbine, the natural frequency of the turbine is in range 0.22–0.33 Hz, which corresponds to the so-called “soft–stiff” design.
The dynamic response of offshore wind turbines subjected to extreme loadings, such as those induced by earthquakes, is typically non-linear. Codes of practice for the seismic designing of OWTs, or guidelines for their certification are not available owing to the limited number of offshore wind farms constructed in seismic-active regions; however, as offshore wind farms are gradually developed around the world, the need for specific seismic design codes is increasing as seismic design procedures for conventional structures are not directly applicable to offshore wind turbines.
Due to a lack of specific guidelines and limited practice in the field, the seismic design of OWT structures is variable, piecemeal and borrowed from adopted methods for critical infrastructure design (e.g., nuclear reactors) or ordinary buildings. This paper reviews the main design issues encountered by practitioners involved in the deployment of offshore wind farms in earthquake-prone regions.

2. Main Challenges in Seismic Design of Offshore Wind Turbines

Following the work of [6,17], the main issues that must be addressed in the seismic design process of an offshore wind turbine are summarized as follows:
  • Definition of a return period (TR) considering that the typical design lifetime is 25 to 30 years as opposed to that of buildings and bridges, which can be substantially higher.
  • Assessment of various seismic hazards at the site.
  • Definition of ground motion intensity, typically in the form of a design response spectra.
  • Selection of strong ground motions for time–history analyses.
  • Definition of the criteria for the load combination of wind, wave, multi-directional earthquake and the control system.

2.1. Design Return Period

High-magnitude earthquakes have low probability of occurrence but high-risk events for offshore wind farms, given their increasing role in developing renewable power generation and energy supply. Typical return periods of large earthquakes may be greater than 500 years. Offshore wind turbines are currently designed for a lifespan up to 30 years [17]. Therefore, it is necessary to assess and manage the seismic risk within the design life of the structure.
Most existing standard of practices for ordinary structures use a 475-year return period. The design return period corresponds to a 10% probability of exceedance in 50 years [17], where the assumed lifespan of a typical structure is taken as 50 years. The 475-year return period has an approximately 5% probability of exceedance when the time window of 50 years is shortened to 25 years.
Depending on the requirements, such as lower OPEX cost, several limit states need to be verified [18]. It is worth noting that owing to the high costs in repairing and/or replacing the components of offshore wind turbines, the seismic design needs to ensure the structural integrity and functionality of the structure and other critical components, notably blades, gear boxes, etc.
Codes of practice often consider the economic impact through the possible consequences of failure. For example, Eurocode 8 [Part 1] [19] recommends two different levels, namely: ultimate limit state (ULS) and serviceability limit state (SLS) (a) ULS-no collapse representing 10% exceedance probability in 50 years (i.e., 475-year return period); (b) damage limitation—10% exceedance probability in 10 years (i.e., 95-year return period).
In designing ordinary structures, if a particular seismic code is adopted, it is assumed that the structure will be subjected to some form of damage during its lifetime to enable some dissipation of energy while allowing the safe evacuation of its occupants as offshore wind turbines are most of the time unmanned, the limit states used for ordinary and manned structures may lead to an overly conservative design and excessive costs. Therefore, customized requirements for offshore wind farms may be necessary and should be agreed in the contract. Table 2 provides a few examples of typical requirements. However, the list is by no means exhaustive, and further work is underway to describe these and bring out criteria for seismic design. When both the probability of exceedance and the lifetime of the structure are defined, it is possible to calculate the return period to be used in the seismic hazard analysis (SHA).
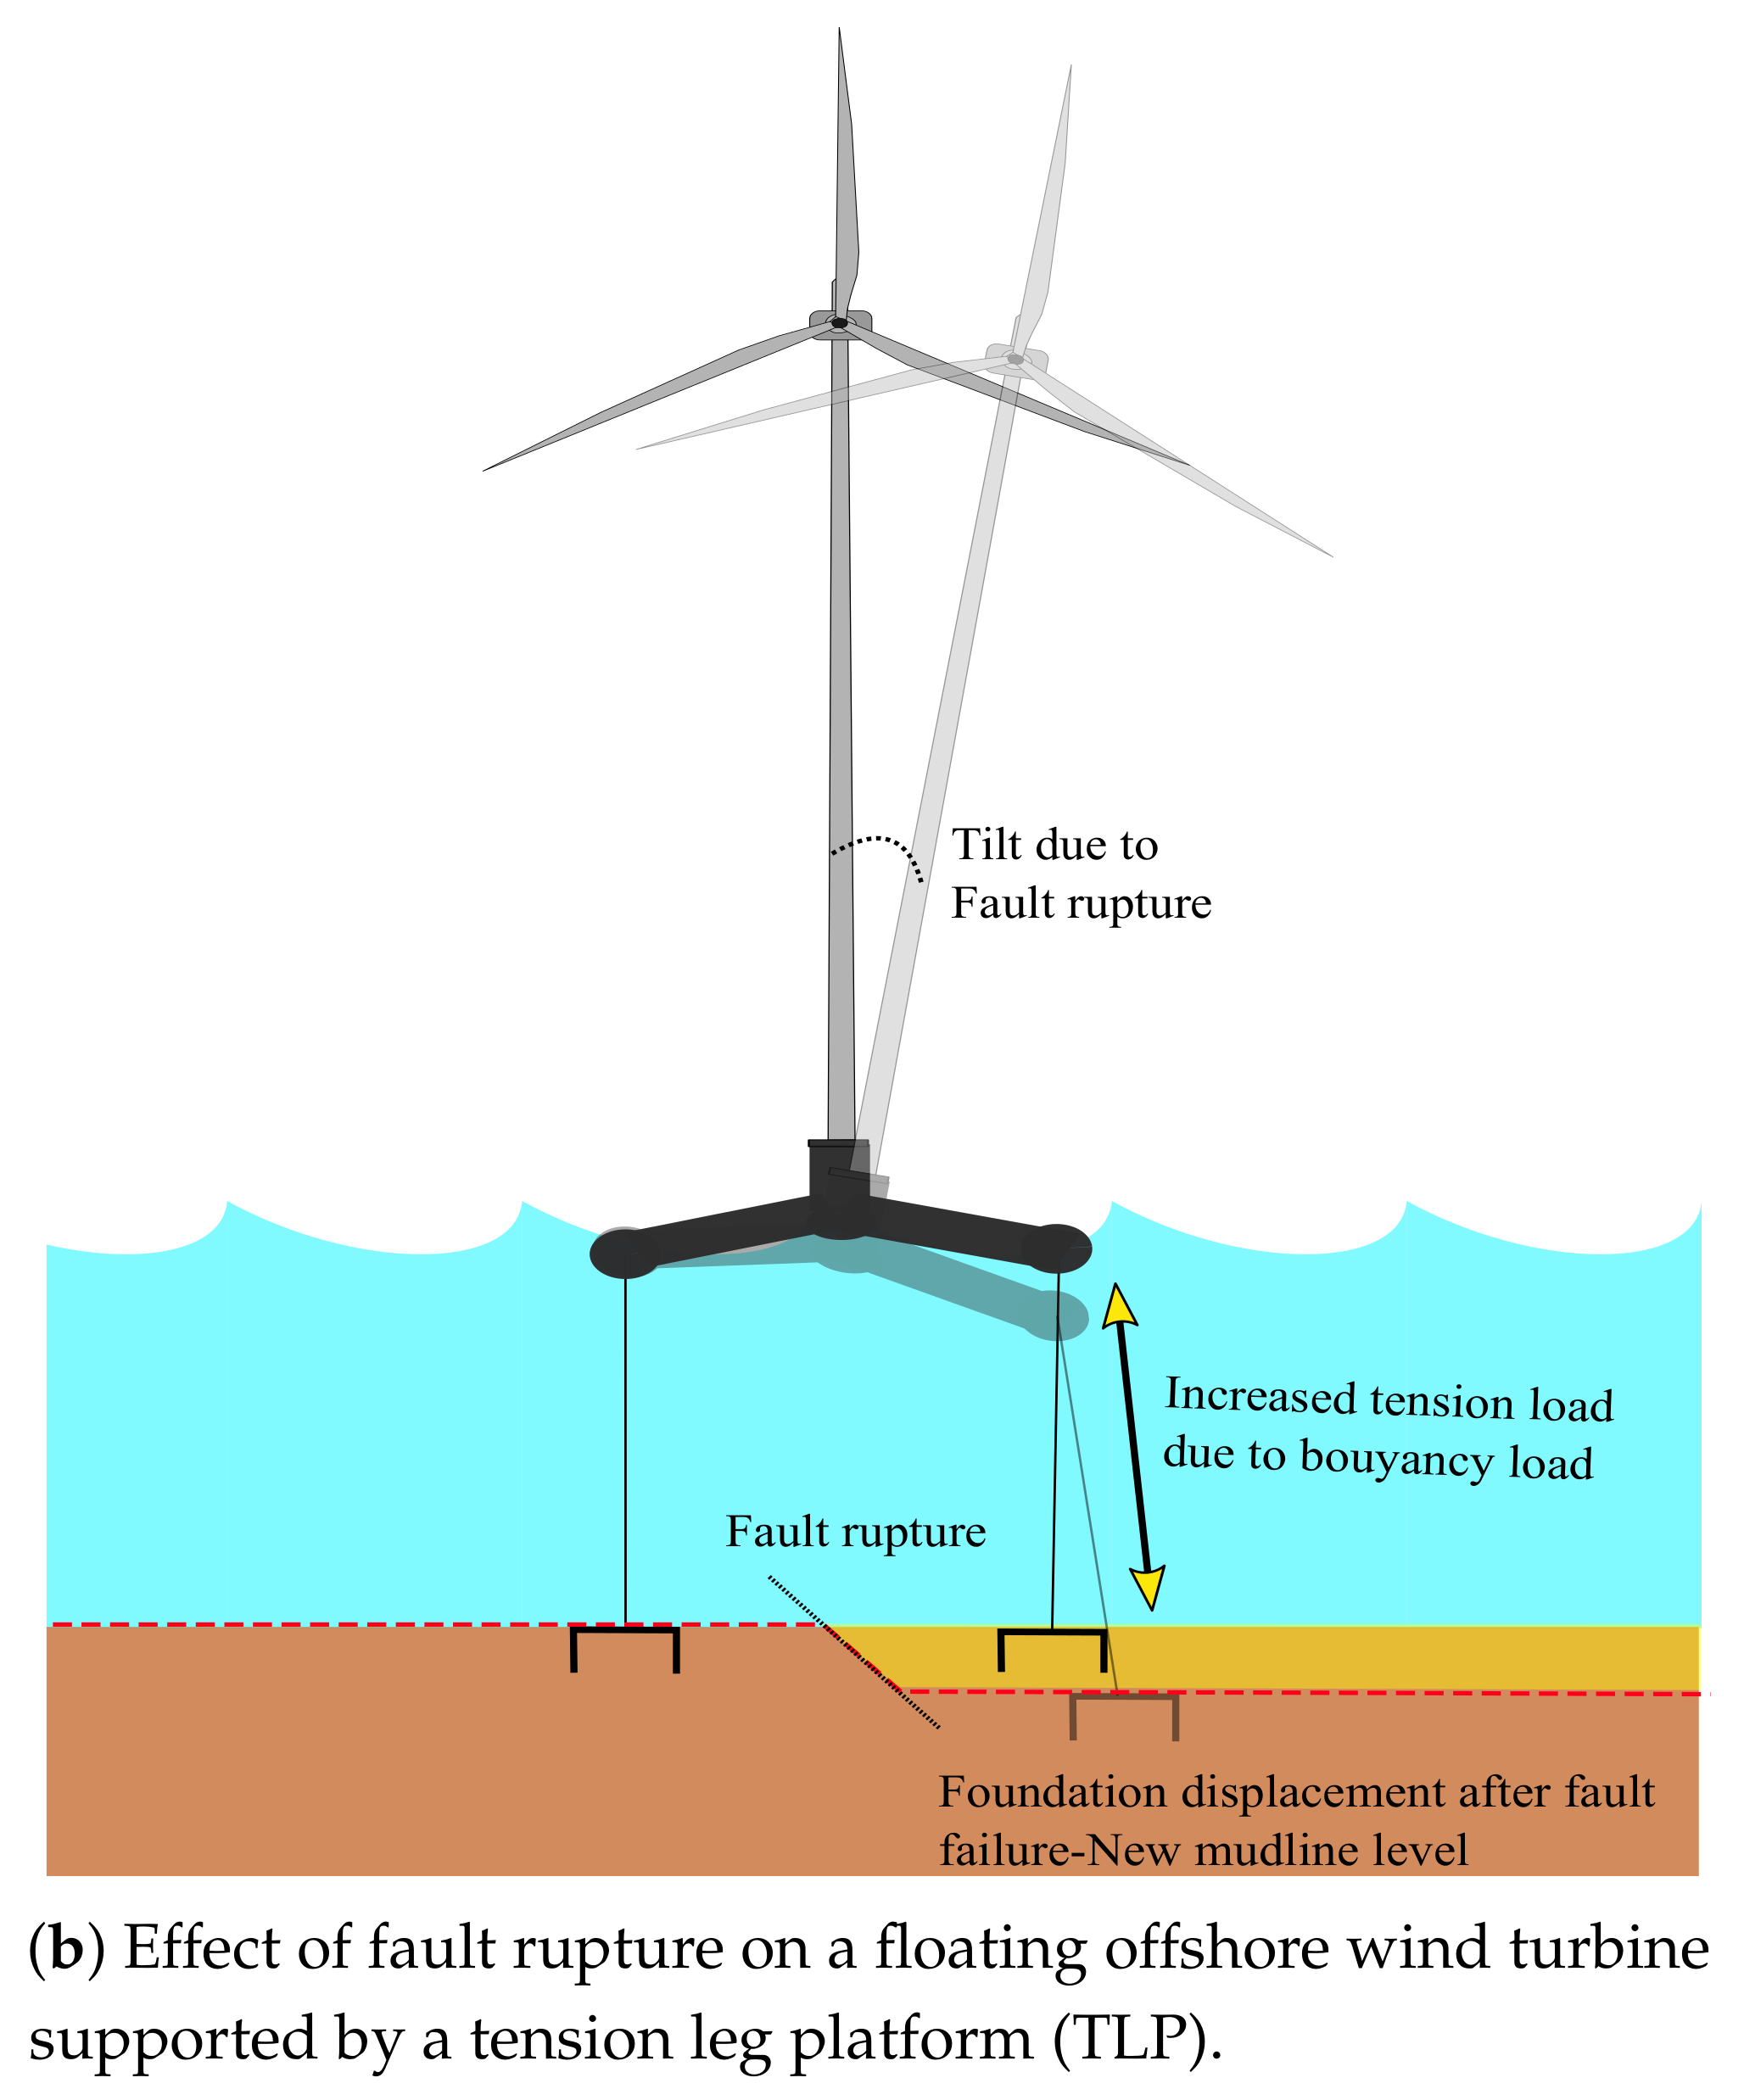
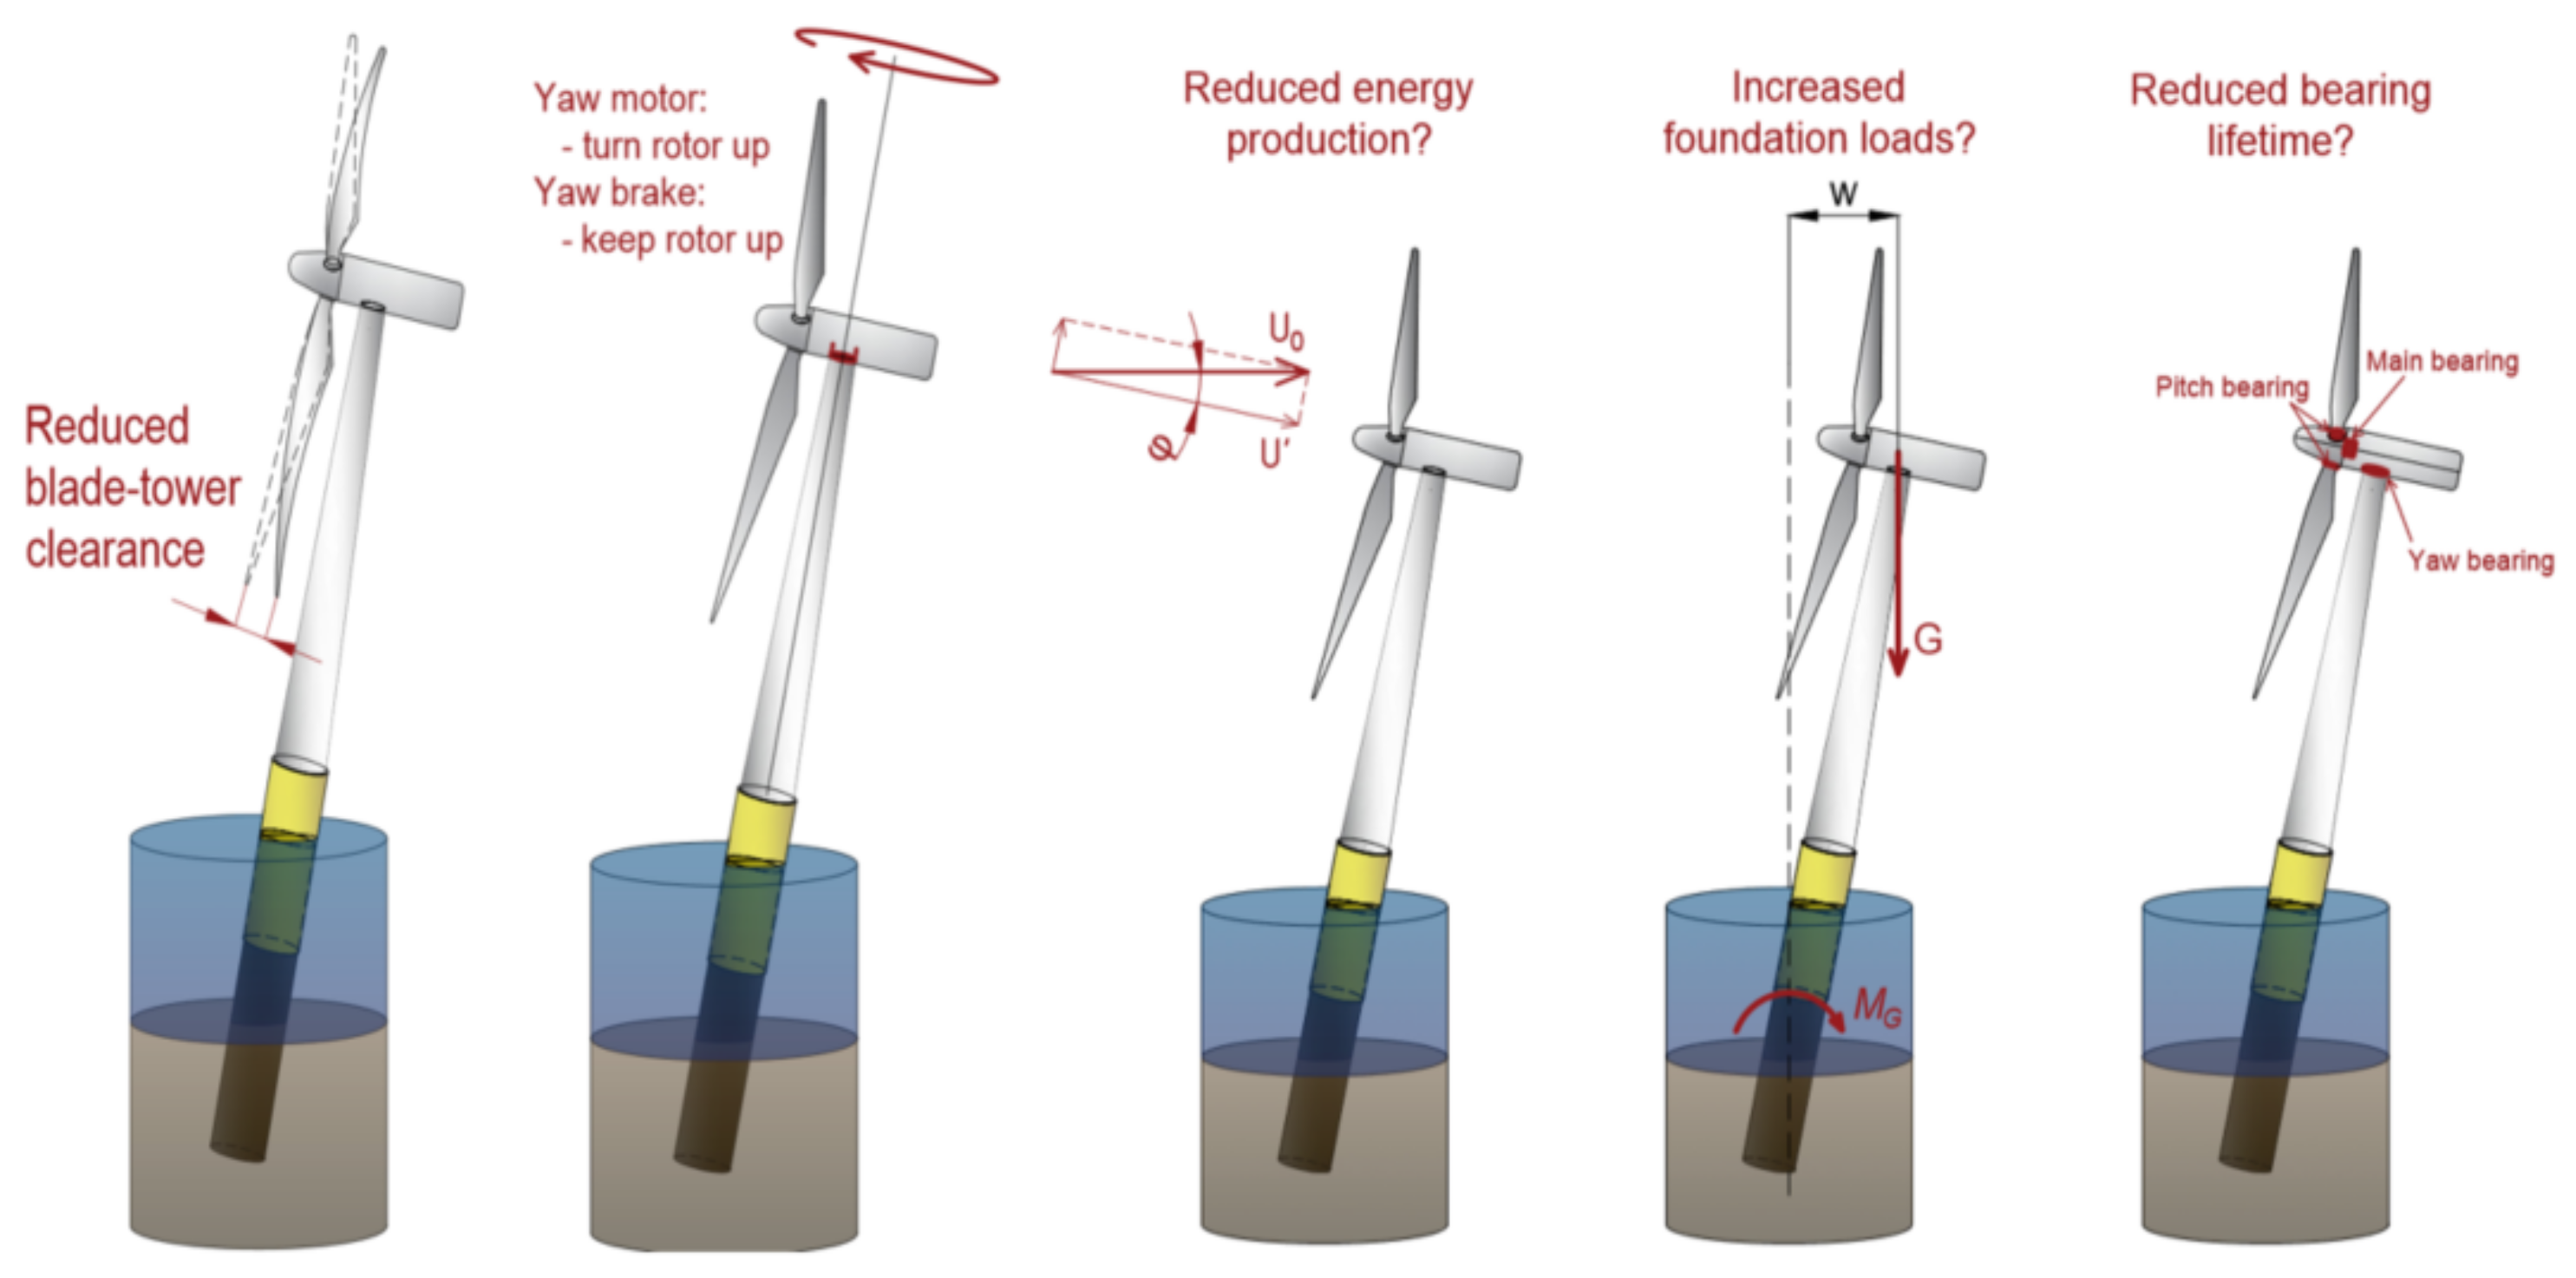
As most offshore wind turbine foundations consist of a large diameter steel pile, referred to as monopile, it is important to discuss the SLS criteria for this particular foundation type. One of the important design aspects of monopiles for offshore wind turbines is the allowable tilt permitted. The current allowable tilt is 0.5 to 0.75 degrees, and even post-seismic, this requirement must also be adhered to. It is of interest to highlight the possible reasons for stricter SLS and is shown schematically in Figure 8, and the readers are referred to Chapter 3 of the book [3] for further details. A larger tilt may reduce blade–tower collision, increased wear and tear of bearings and increased loads transmitted to the foundation.

2.2. Seismic Hazard Assessment

Seismic hazard assessment (SHA) determines the probability of exceedance of ground motion intensity parameter, often expressed in terms of peak-ground acceleration (PGA) or spectral acceleration (SA). Seismic hazard assessments can be classified into two categories: (i) probabilistic seismic hazard analysis (PSHA) and (ii) deterministic seismic hazard assessment (DSHA). Both procedures require similar inputs, i.e., compilation of seismic catalog, the definition of seismic source and ground motion models. These hazards also differ in some fundamental aspects, most importantly in the treatment of uncertainties and the characterization. Figure 9 shows the main steps of a typical PSHA; these are briefly discussed hereafter:
Step 1—Definition of seismic source model: this step consists of compiling an earthquake catalog that lists all known historical and instrumented earthquakes in the study region. The catalog is used to build the seismic source model that defines the spatial distribution of all the seismic sources that contribute to the hazard at the site.
Step 2—Definition of earthquake recurrence law: this defines the rate of earthquake occurrence for each seismic source. The Gutenberg–Richter (GR) recurrence law is often adopted for recurrence models. As the GR law may produce an unrealistically large earthquake, it is often truncated to the maximum possible magnitude that the seismic source can produce.
Step 3—Definition of ground-motion model: it consists of quantifying the earthquake’s intensity in terms of parameters of engineering interest, such as peak ground acceleration (PGA), spectral accelerations, etc. These are computed based on empirical ground-motion prediction equations (GMPEs), which are evaluated from regression analysis of a large set of records. Although different GMPEs have been developed and are available for regions of different seismicity, all provide the distribution of the ground motion parameter as a function of several independent variables such as earthquake size (e.g., magnitude), source to site distance, type of faulting and possibly geotechnical parameters that characterize the soil conditions at the site. Owing to the inherent randomness of the seismic process and epistemic uncertainty in the models, multiple GMPEs are normally used in a logic tree with appropriate weights.
Outputs—A typical PSHA is often presented through a suite of curves, known as seismic hazard curves, which represent the average annual rate of exceedance of a given ground motion intensity measure for different response periods. Since the earthquake occurrence is modeled as a Poisson process, the average annual rate, λ , can be expressed in terms of the probability of exceedance, P, and time period, t, such that
λ = l n ( 1 P ) t
from which it follows that a probability of exceedance of 10% (P = 0.1) in 50 years (T = 50) corresponds to an average annual rate of 0.002 or return period (which is its inverse, i.e., 1/ λ ) of approximately 500 years.
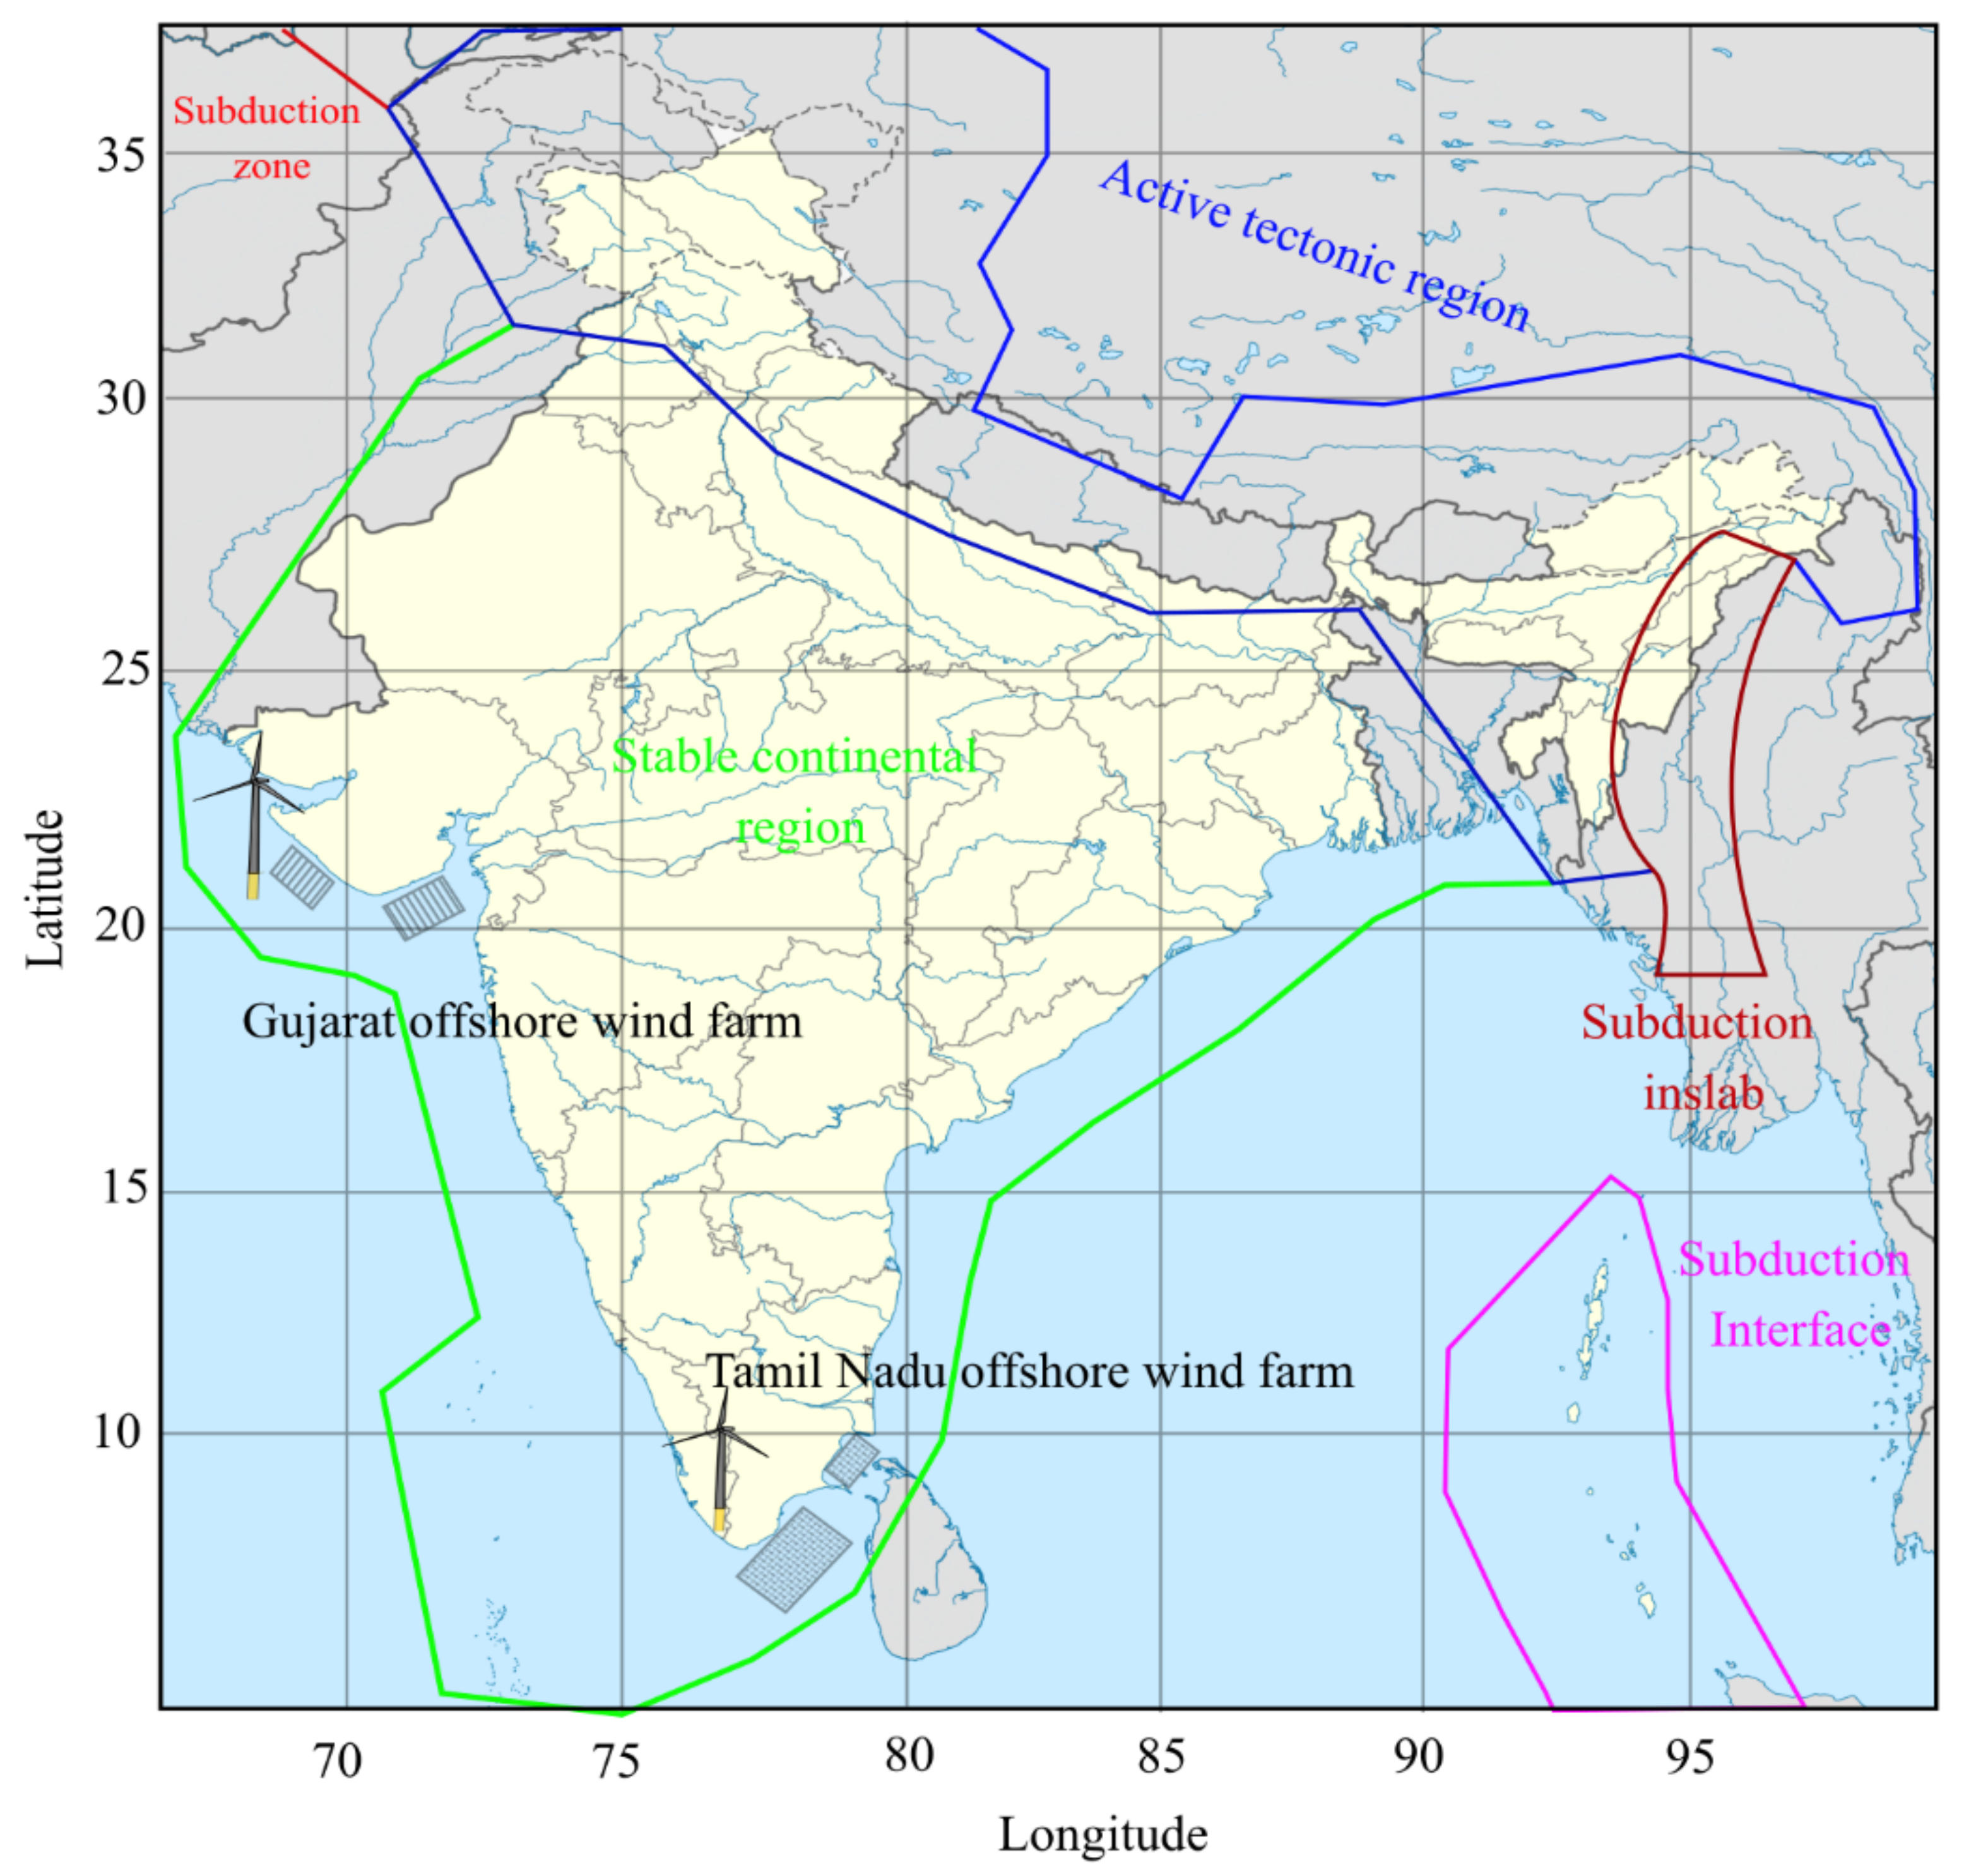
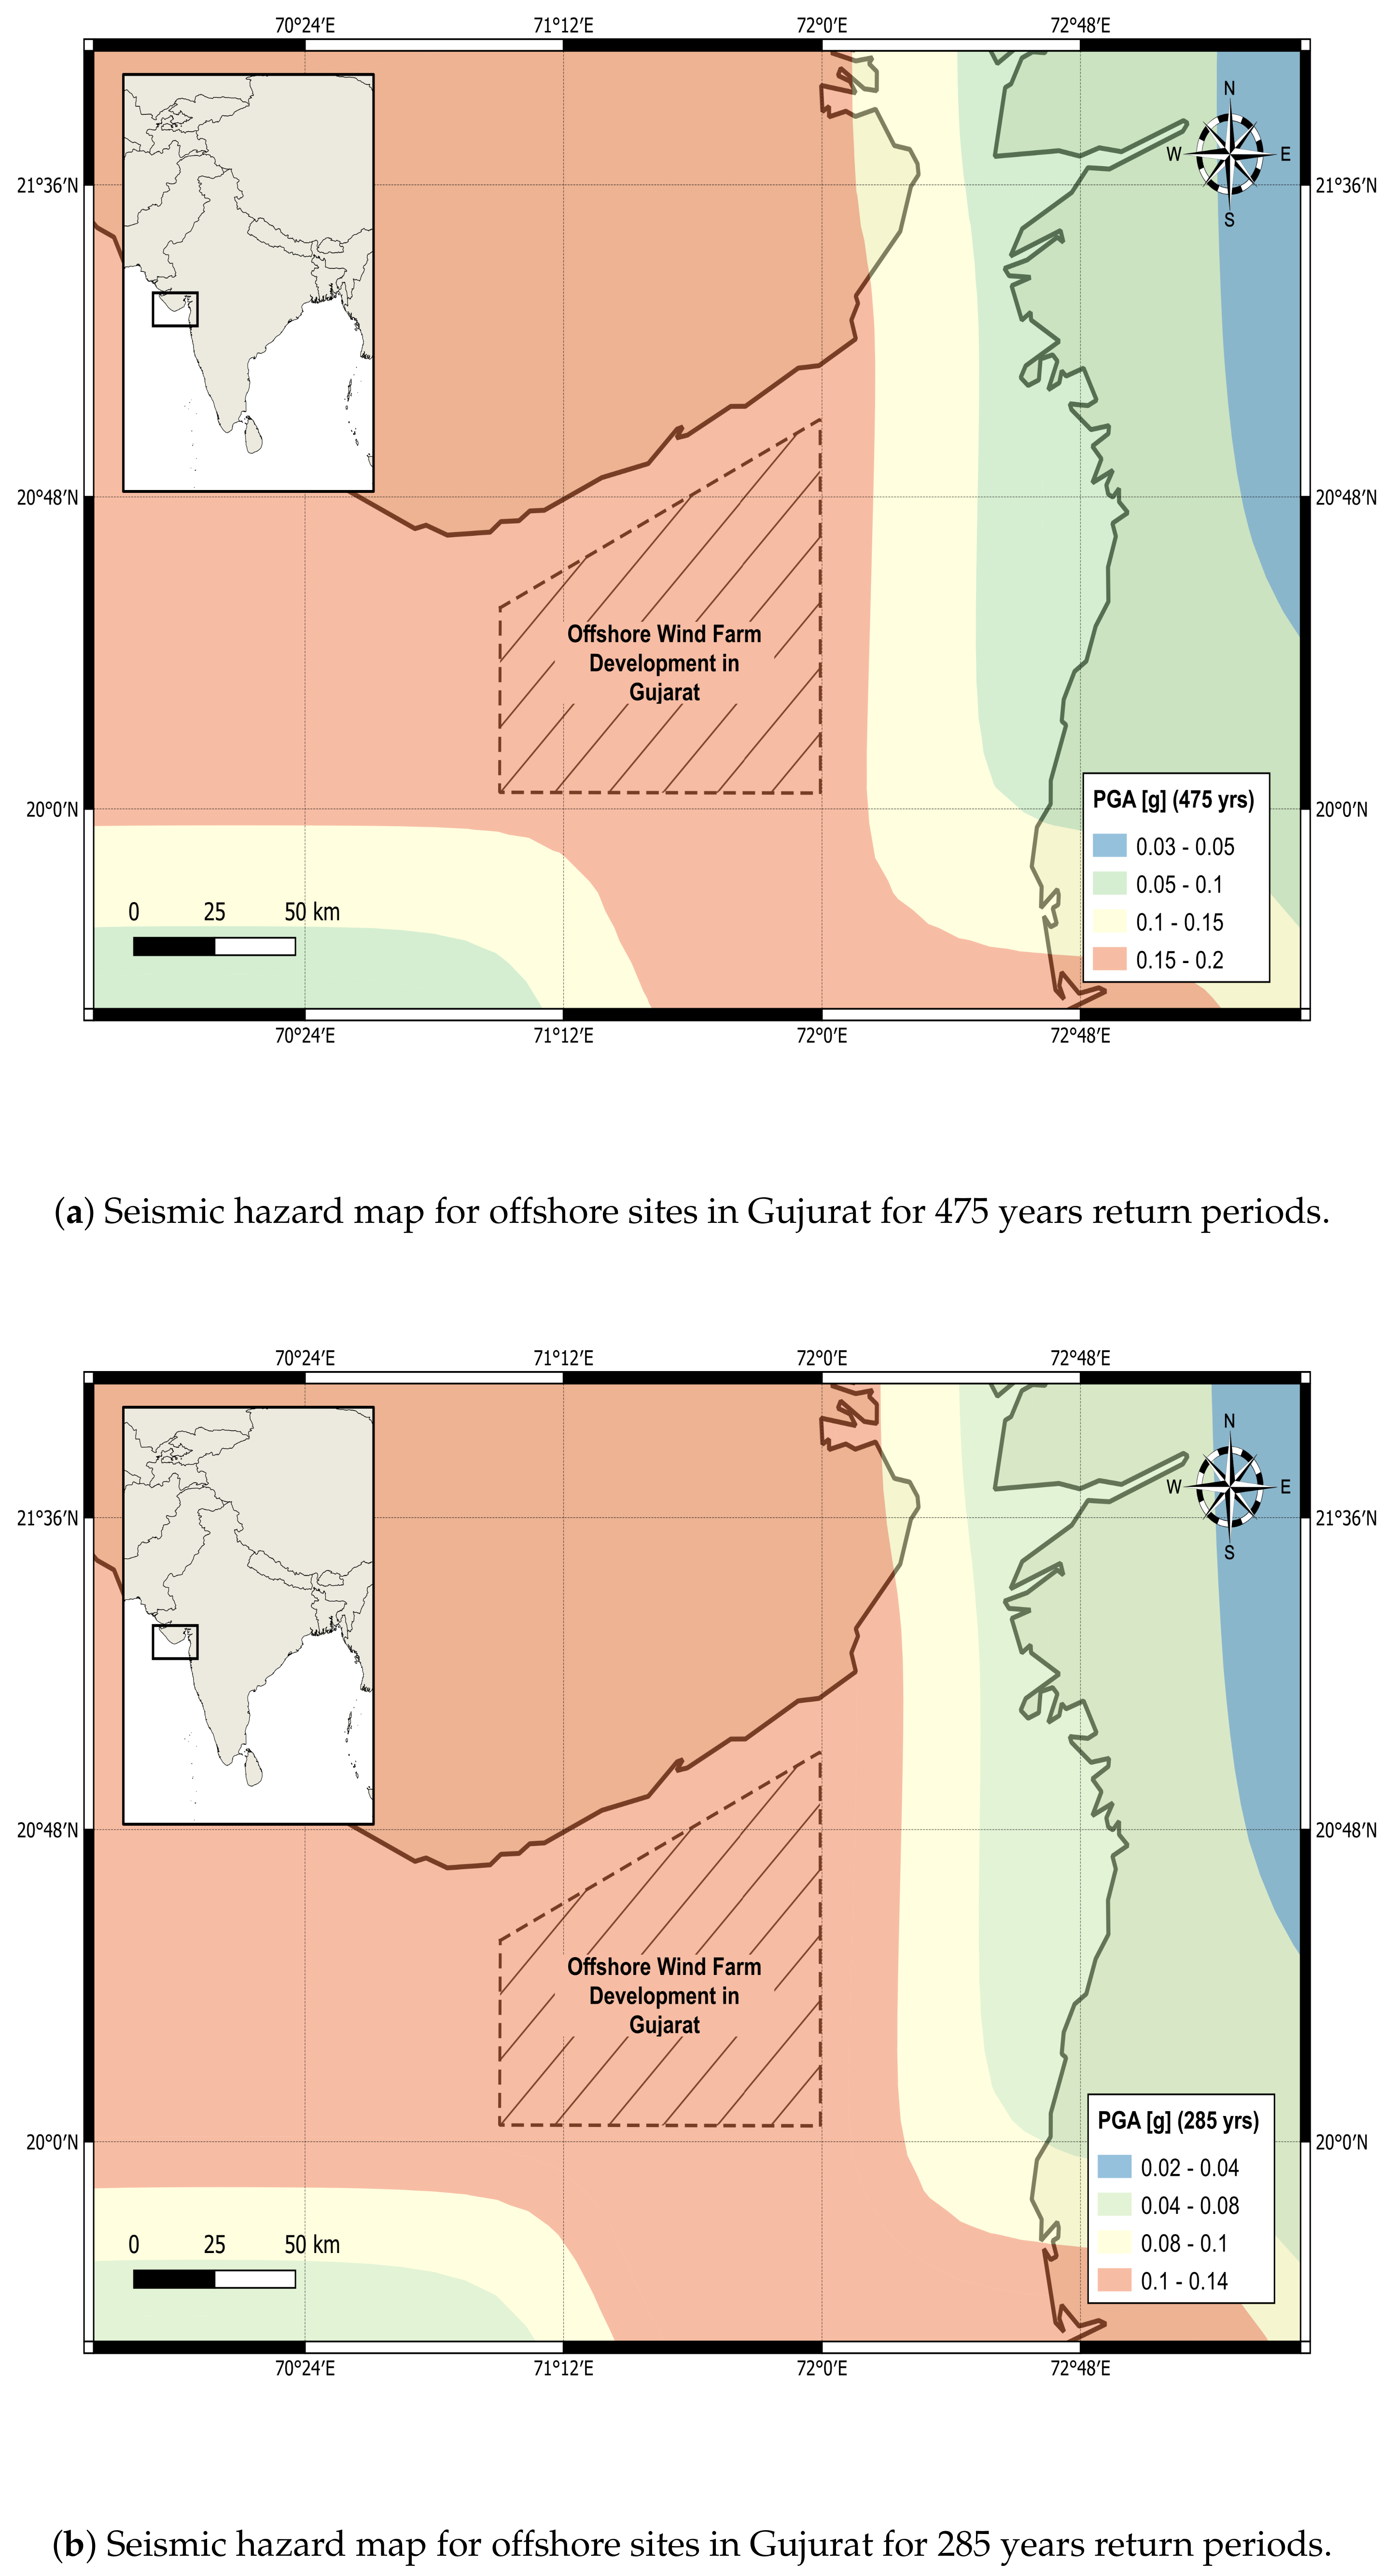
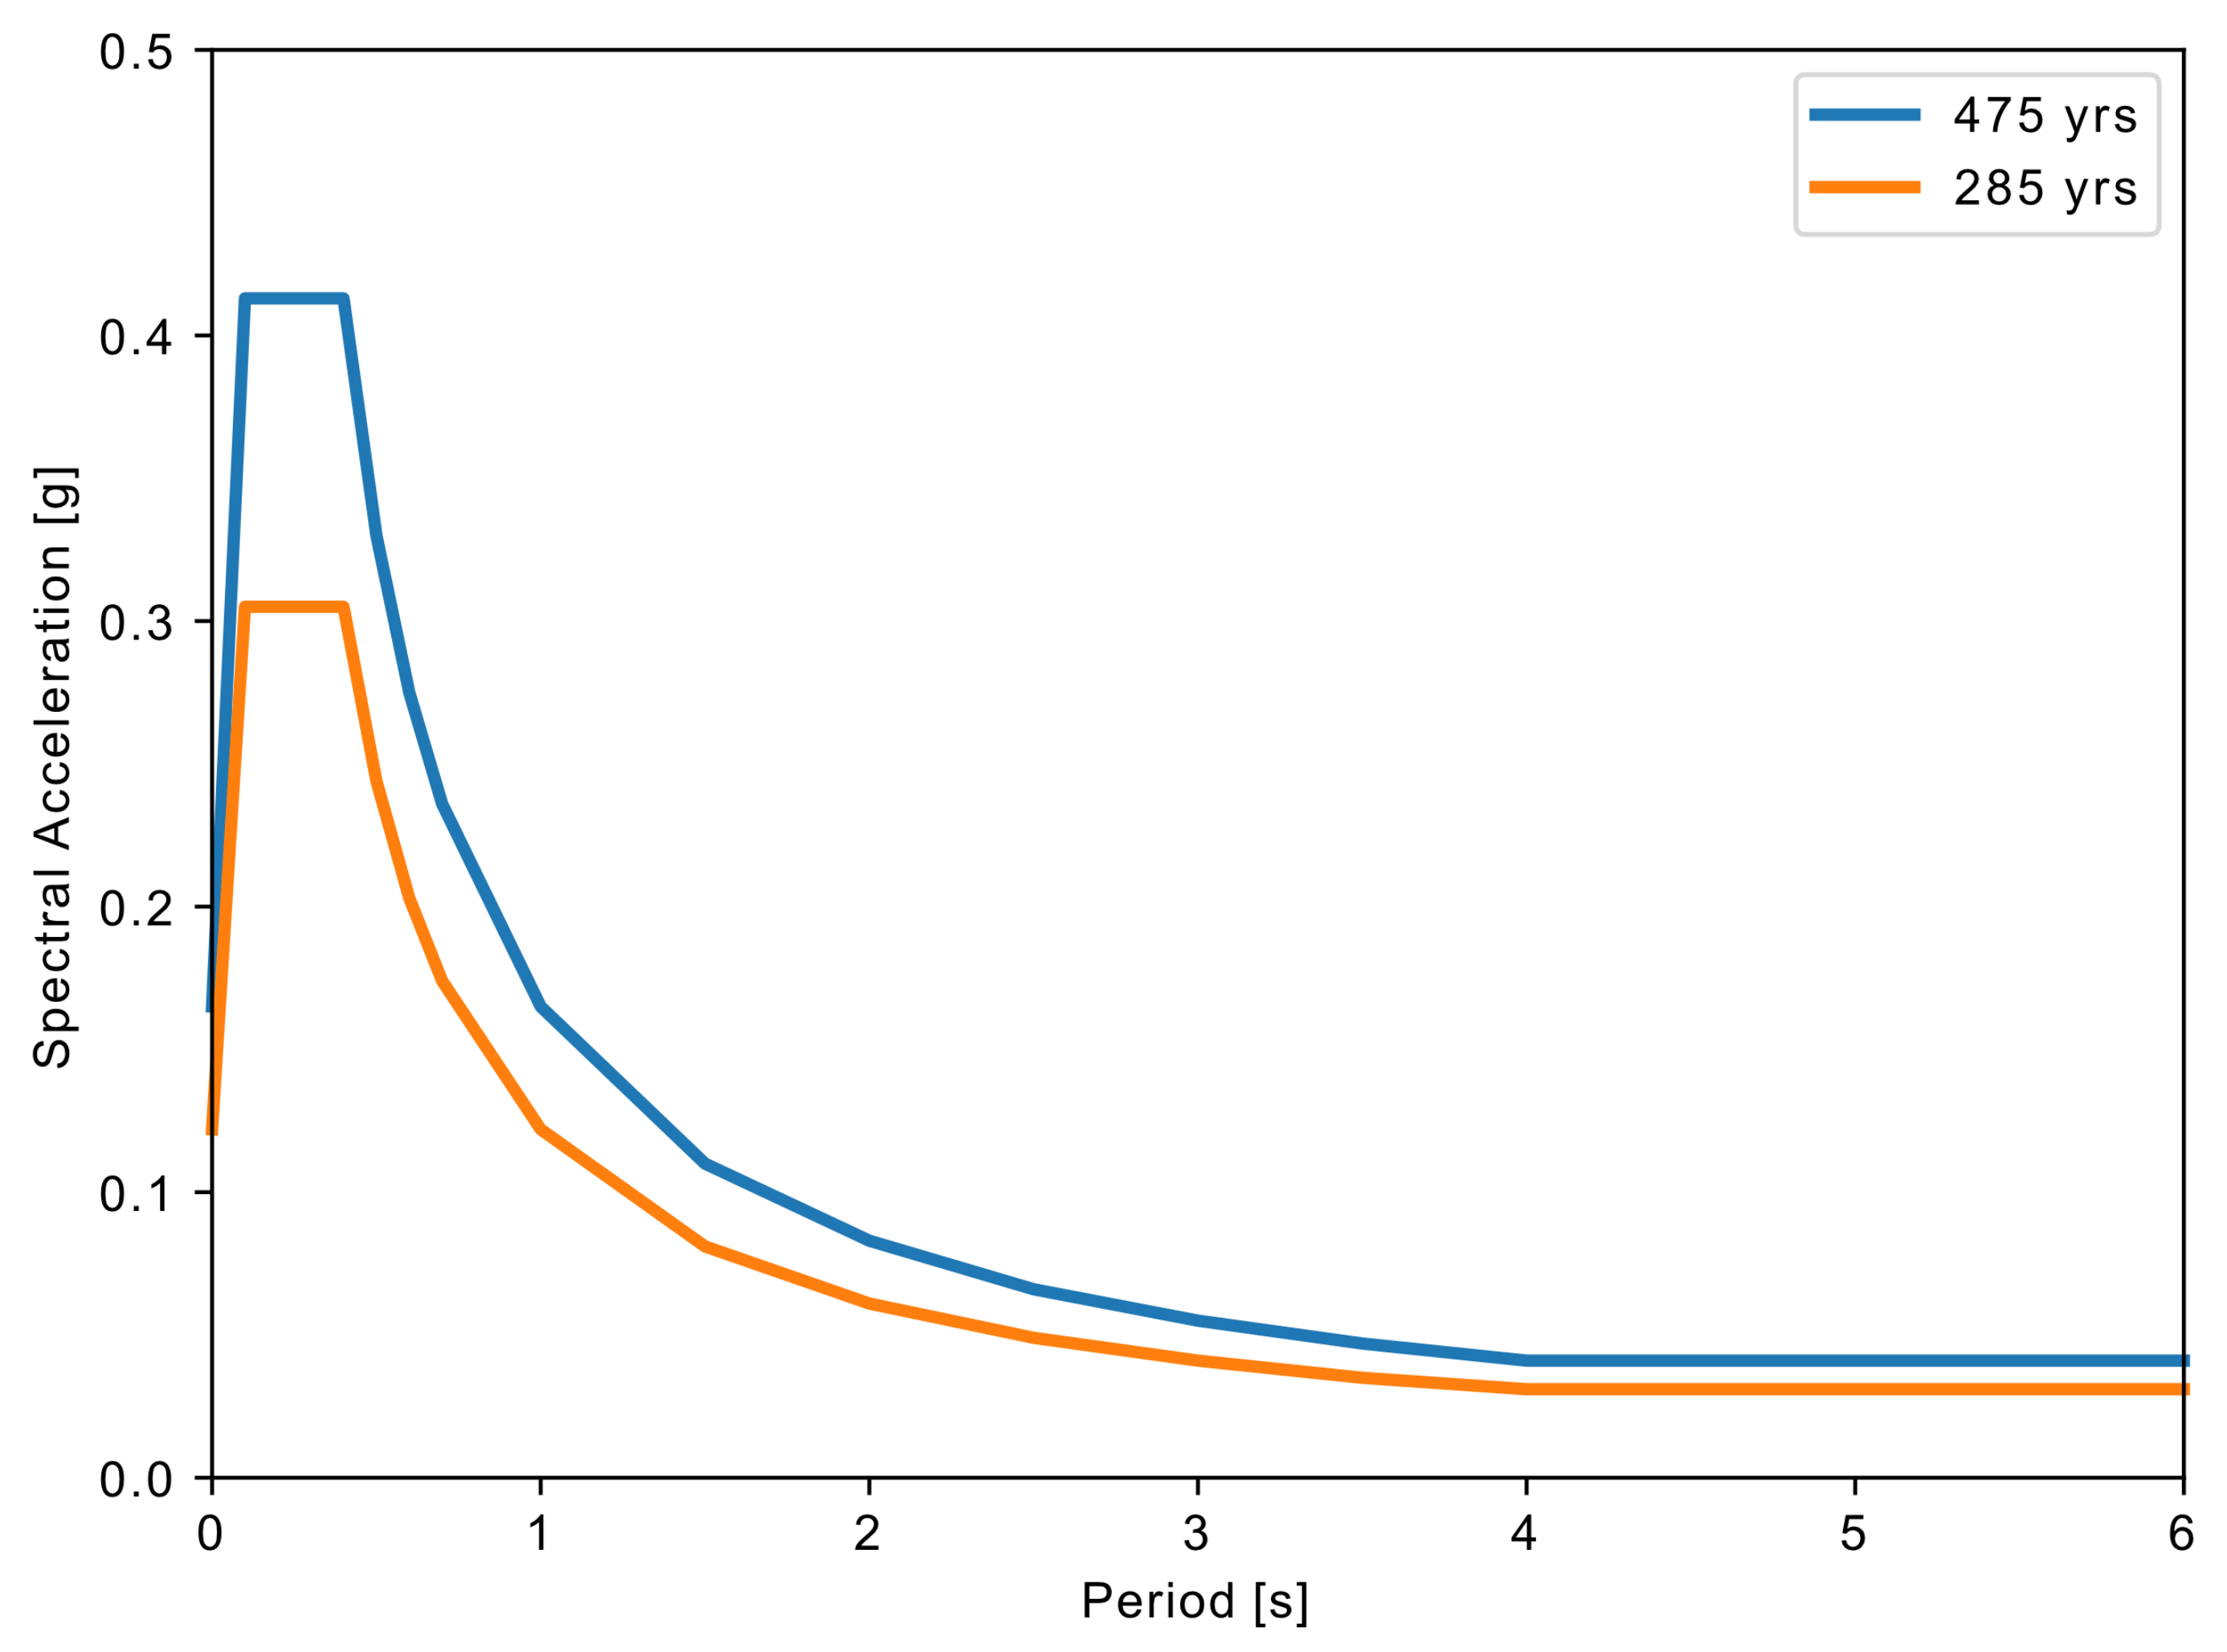
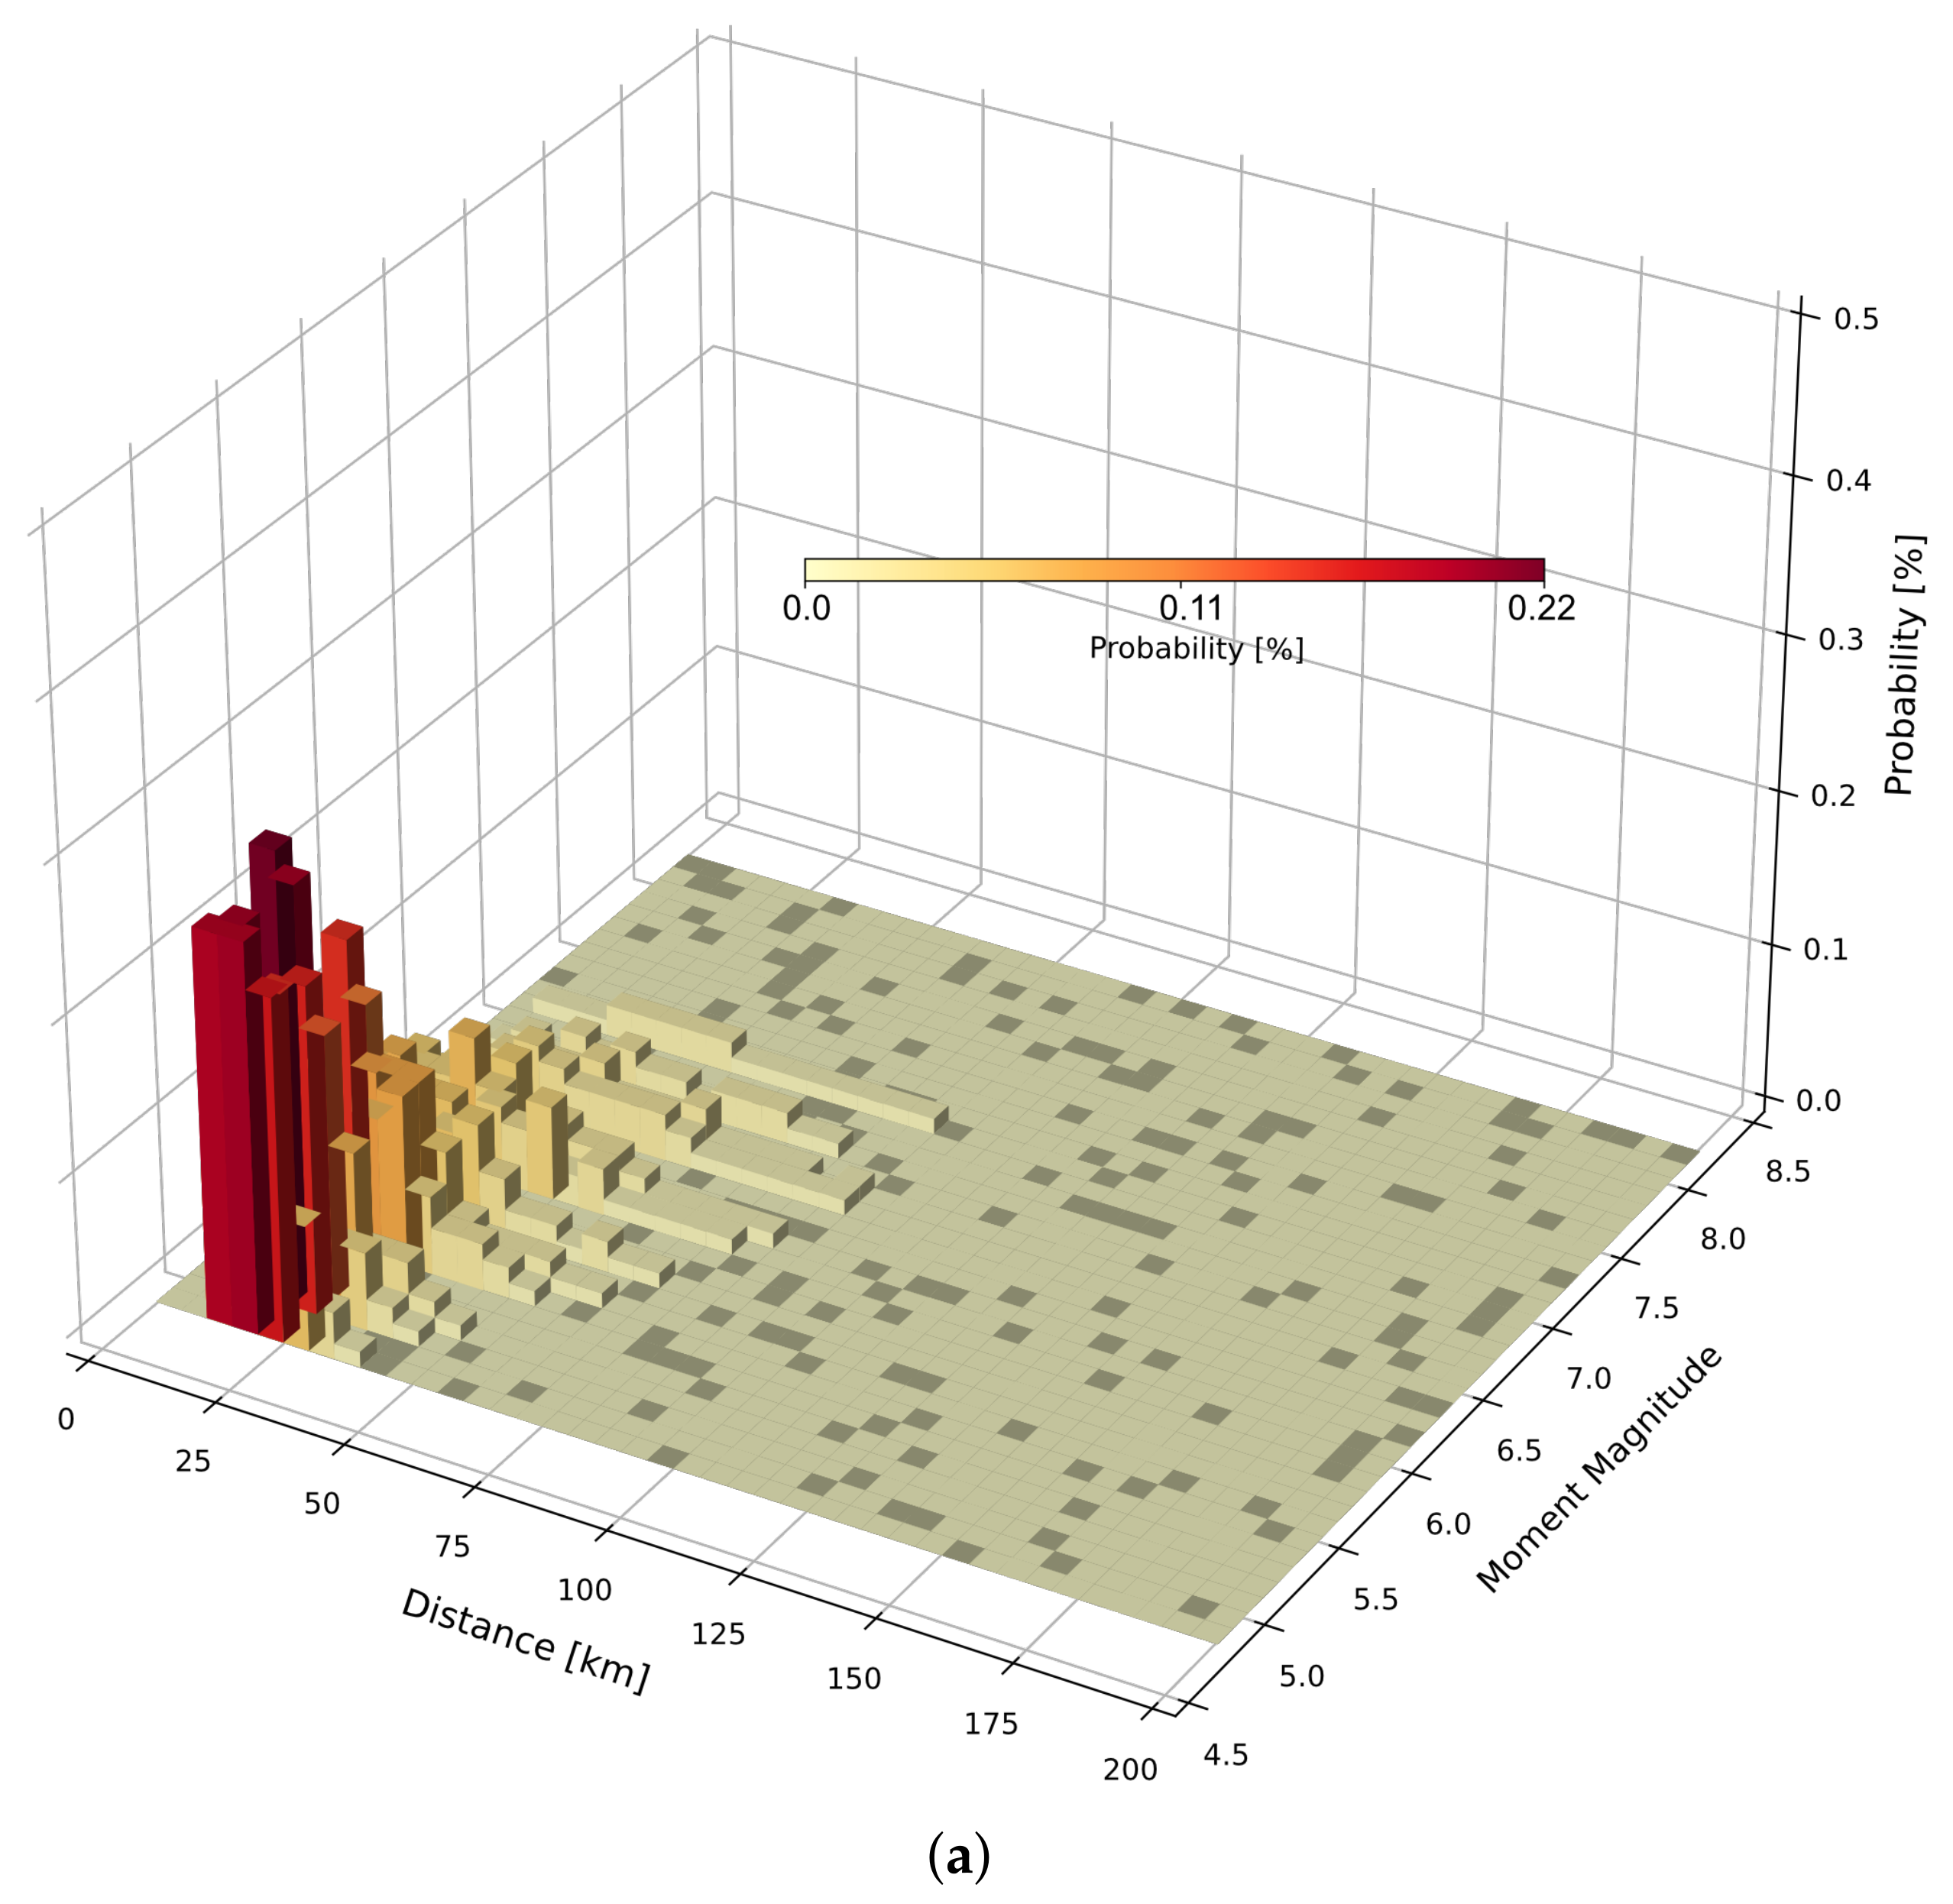
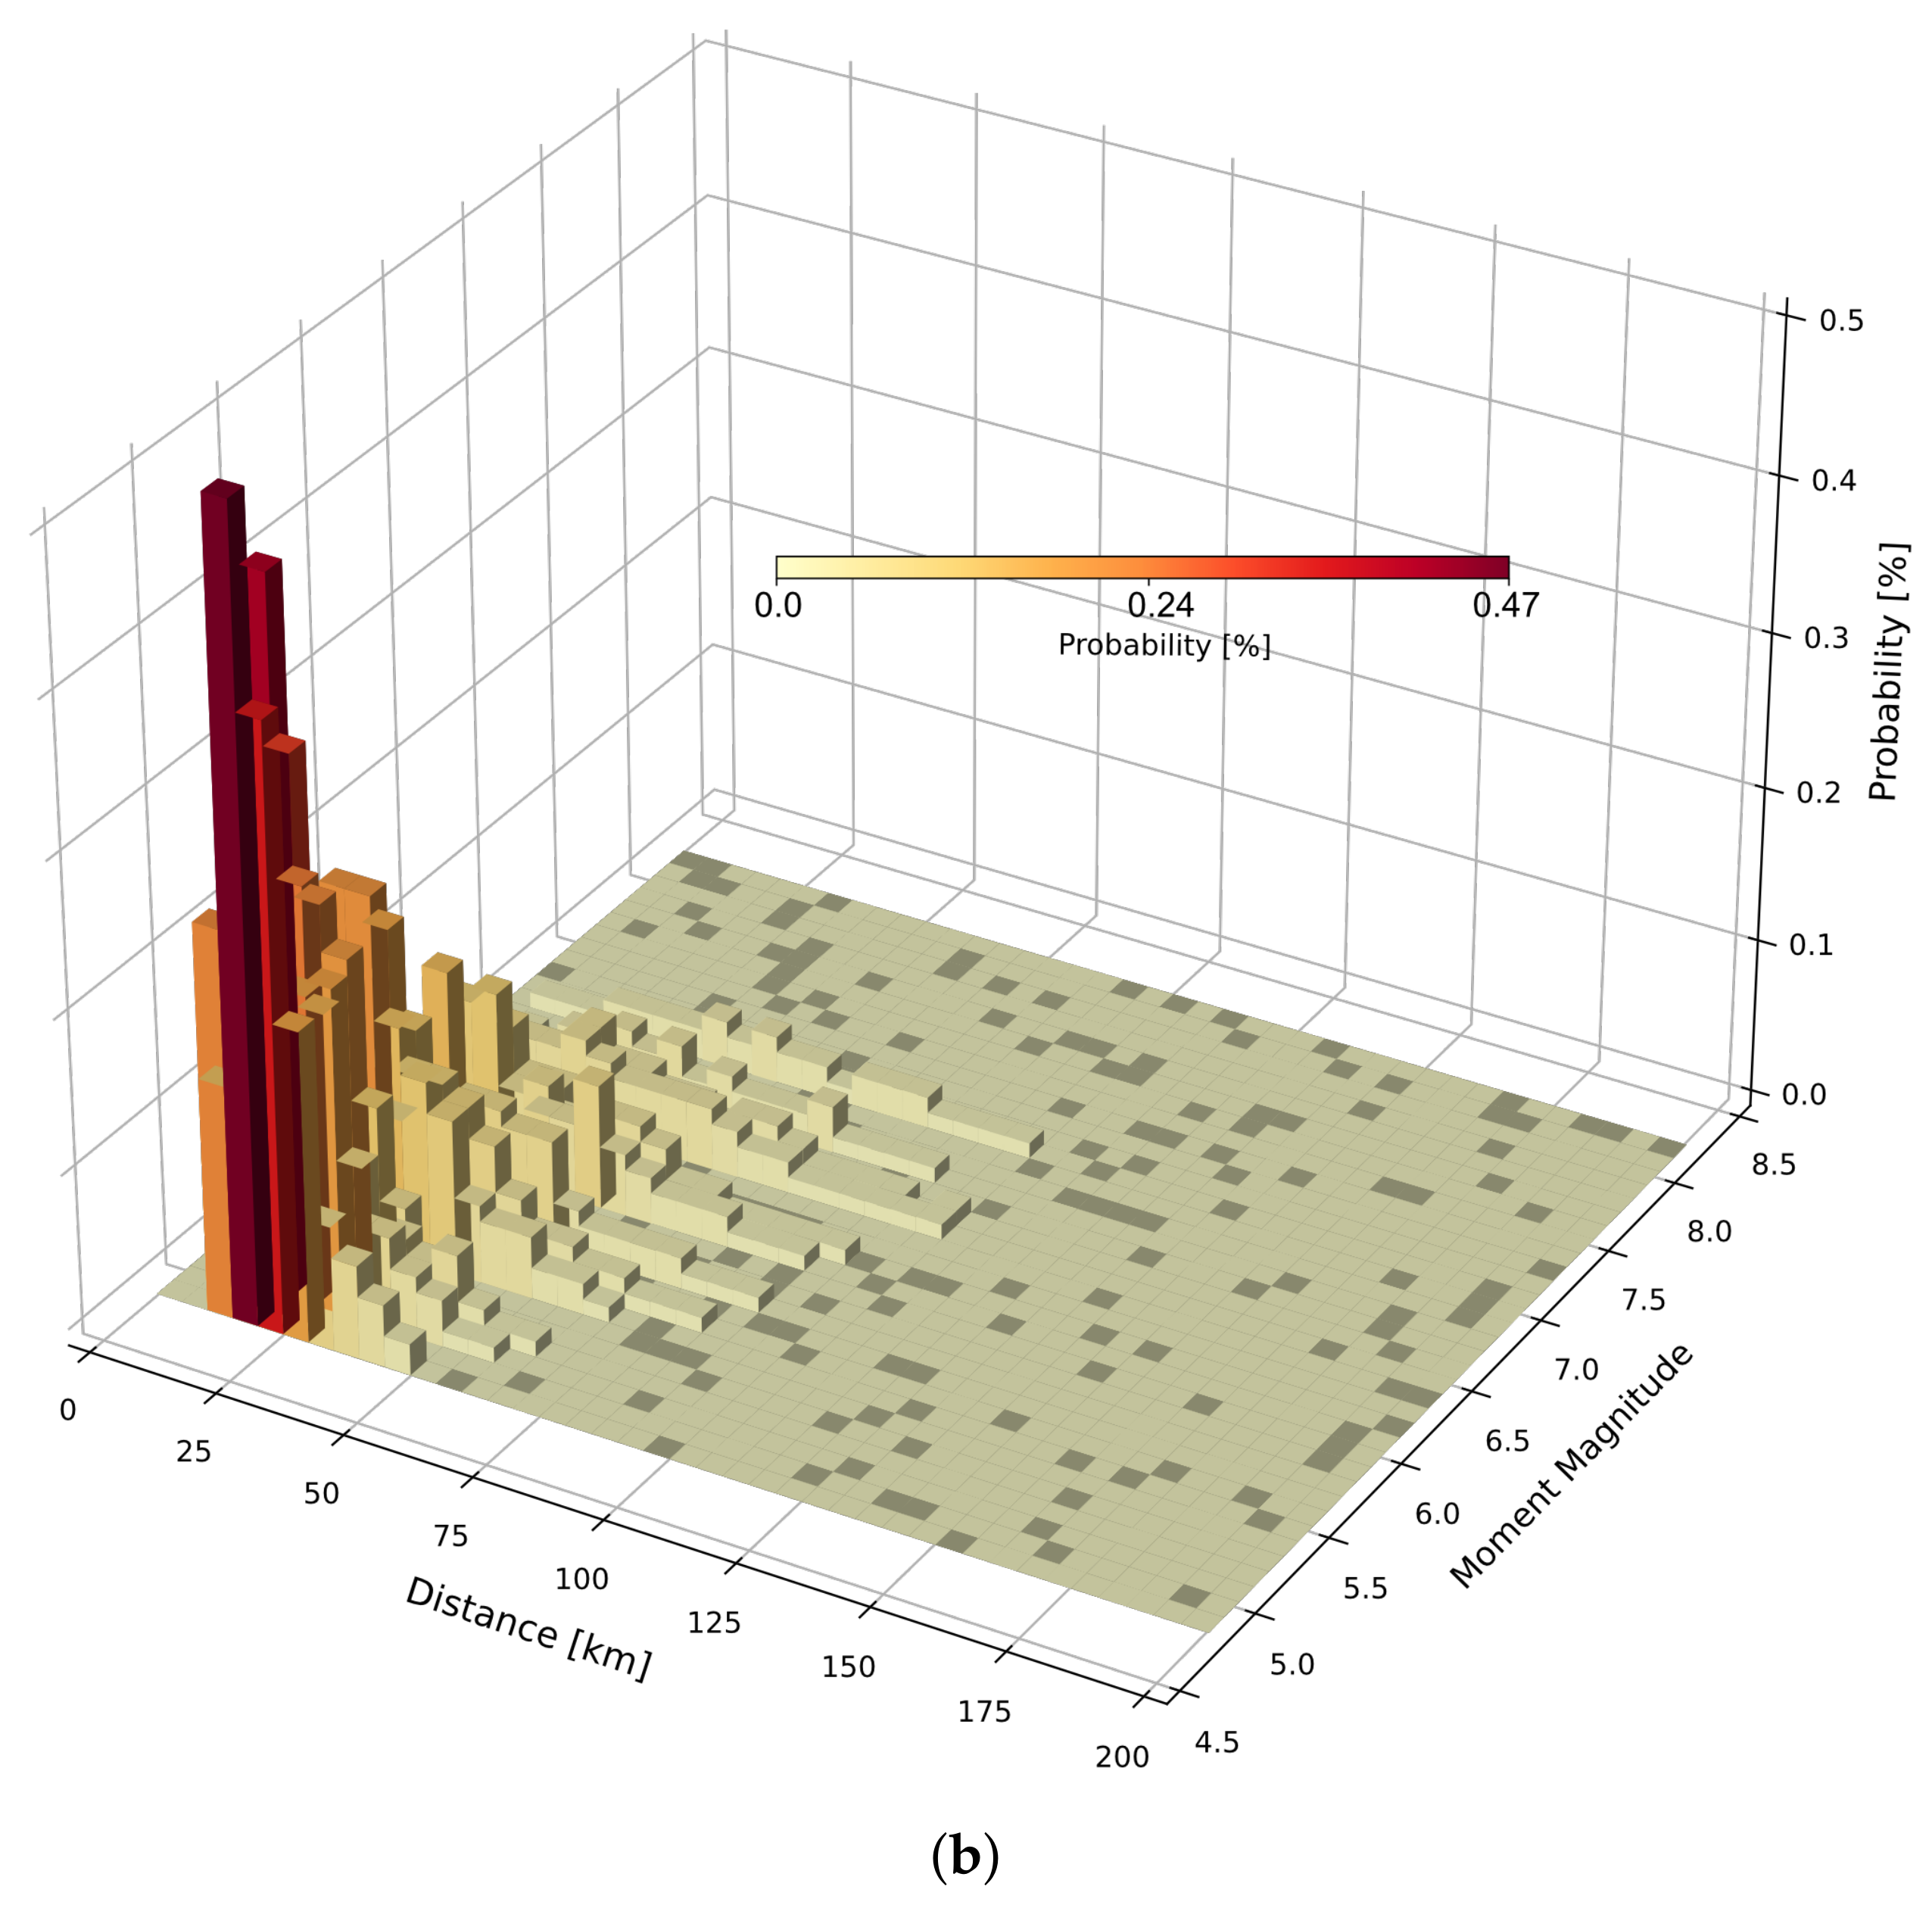
The main findings from a PSHA can be used to determine the spatial distribution of the hazard or compute the so-called uniform hazard spectrum (UHS). Since the PSHA “aggregates” various earthquake scenarios, the resulting hazard cannot be related with any real earthquake. The disaggregation analysis provides an artificial seismic scenario, expressed in terms of magnitude–distance–residual, which contributes the most to the hazard. Once the worst-case scenario is defined, it can be used in the selection of compatible ground-motion records required as input in time–response analyses. An example of PSHA analysis for an offshore site in India is provided in Appendix A.
The deterministic seismic hazard approach (DSHA) can be considered as a special case of the probabilistic seismic hazard assessment (PSHA). Specifically, in the DSHA the most damaging scenario is considered, the so-called the worst-case scenario, which is defined in terms of magnitude and source-to-site distance regardless of its frequency of occurrence. It is worth noting that both methodologies present limitations based on the simplifying assumptions they rely upon and the degree of subjectivity involved in the process.
Due to its simplicity when compared to the PSHA, the DSHA can be performed in the early stages of the project for feasibility studies and preliminary designs. From the collection of historic seismic events, it is possible to find the maximum magnitude and the minimum distance of the wind farm from active seismic faults. Subsequently, using ground motion prediction equations (GMPEs) suitable for the specific case study, the average expected intensity measurements and their variability can be ascertained. It is important to state that PSHA in low-to-moderate seismic regions may be challenging due to the paucity of strong motion data, especially offshore, and more detailed studies may have resulted in lower cost–benefit ratios.

2.3. Choosing the Response Spectra

The dynamic modal analysis with response spectrum is an accepted procedure used to evaluate the dynamic response of structures. In the context of offshore wind turbine design, there are broadly three types of response spectrum that can be used:
  • Response spectrum of a single record. It shows the maximum response acceleration of a family of single degree of freedom (SDOF) systems with different periods and given damping.
  • Uniform hazard spectra (UHS) are the main product of the PSHA and can be calculated for different return periods. This is a horizontal spectrum and not directional dependent. UHS is site-specific and does not take into account the energy dissipation due to allowable structural damage.
  • Code-based standard response spectra are provided by most building codes (e.g., EC8 or IBC) for both horizontal and vertical directions. To take into account different capacity to dissipate energies, that is the ductility of the structure, the spectra can be scaled using incorporate the so-called R factor.

2.4. Ground-Motion Selection for Time–History Analyses

Earthquake scenarios are defined by the seismotectonic features such as magnitude, distance, local site conditions and the type of fault mechanisms (e.g., strike-slip and normal fault). These parameters tend to affect the spectral content of the ground motion records. Two potential approaches are possible for scenario-based selection. If DSHA is used, it is required to define a design critical earthquake scenario for a given site considering the characteristics of the earthquake rupture of the identified fault. On the other hand, if PSHA analysis is performed, it must utilize the seismic disaggregation results from the PSHA. If multiple scenarios have high contributions to the hazard, multiple scenarios should be taken into consideration [22].
On the other hand, response spectrum matching methods aim to match both the ground motion intensity and frequency content of the accelerograms to the target spectrum. For spectrum matching, the target response spectrum is often the design code spectrum [23]. This selection method is based on the comparison of a candidate response spectrum with the target response spectrum. The matching is usually calculated using as a reference the differences between the spectral ordinates of the reference spectrum and the spectrum of the candidate ground motion. Such a difference is usually evaluated over a vibration period range. This period range should ideally cover the relevant vibration periods of the offshore wind turbine structure under scrutiny. In this regard, Eurocode 8 [19] suggest a range of 0.2 times to 2 times the first vibration period. Furthermore, EC8 suggests that the average spectrum of seven records needs to be larger than 90% of the target spectrum, which avoids underestimation. A further upper-bound criterion can also be implemented to avoid dispersion of the results.
Ideally, the target spectrum should be site-specific, and, therefore, the uniform hazard spectrum is desirable. It may be noted that different parts of the uniform hazard spectrum are governed by different earthquake scenarios. For example, moderate events at short distances tend to be dominant at shorter vibration periods, whereas large events at far distances tend to be more important for longer vibration periods. Furthermore, when UHS is used as the target spectrum, candidate records having similar spectral ordinates for the entire period range tend to be extreme.
A different approach for spectrum matching is the conditional mean spectrum (CMS) approach [24] which is a combination of scenario-based and spectral-matching methods. In this method, only the spectral acceleration for a given period is provided. All the results coming from the disaggregation are obtained from the conditional mean spectrum and used as a reference for spectral matching. To control the dispersion, confidence intervals are generally adopted around the conditional mean spectrum.
Practically, it is hard to find natural records that can match a specific target spectrum. There are a couple of possible solutions in such cases: (a) Natural records from real events can be scaled to reach the matching. This scaling factor should not be excessively high. Otherwise, unrealistic combinations of amplitude and frequency contents may be obtained; (b) time histories can be simulated to obtain stochastic ground motions matching the hazard spectrum.

2.5. Combination of Seismic Actions

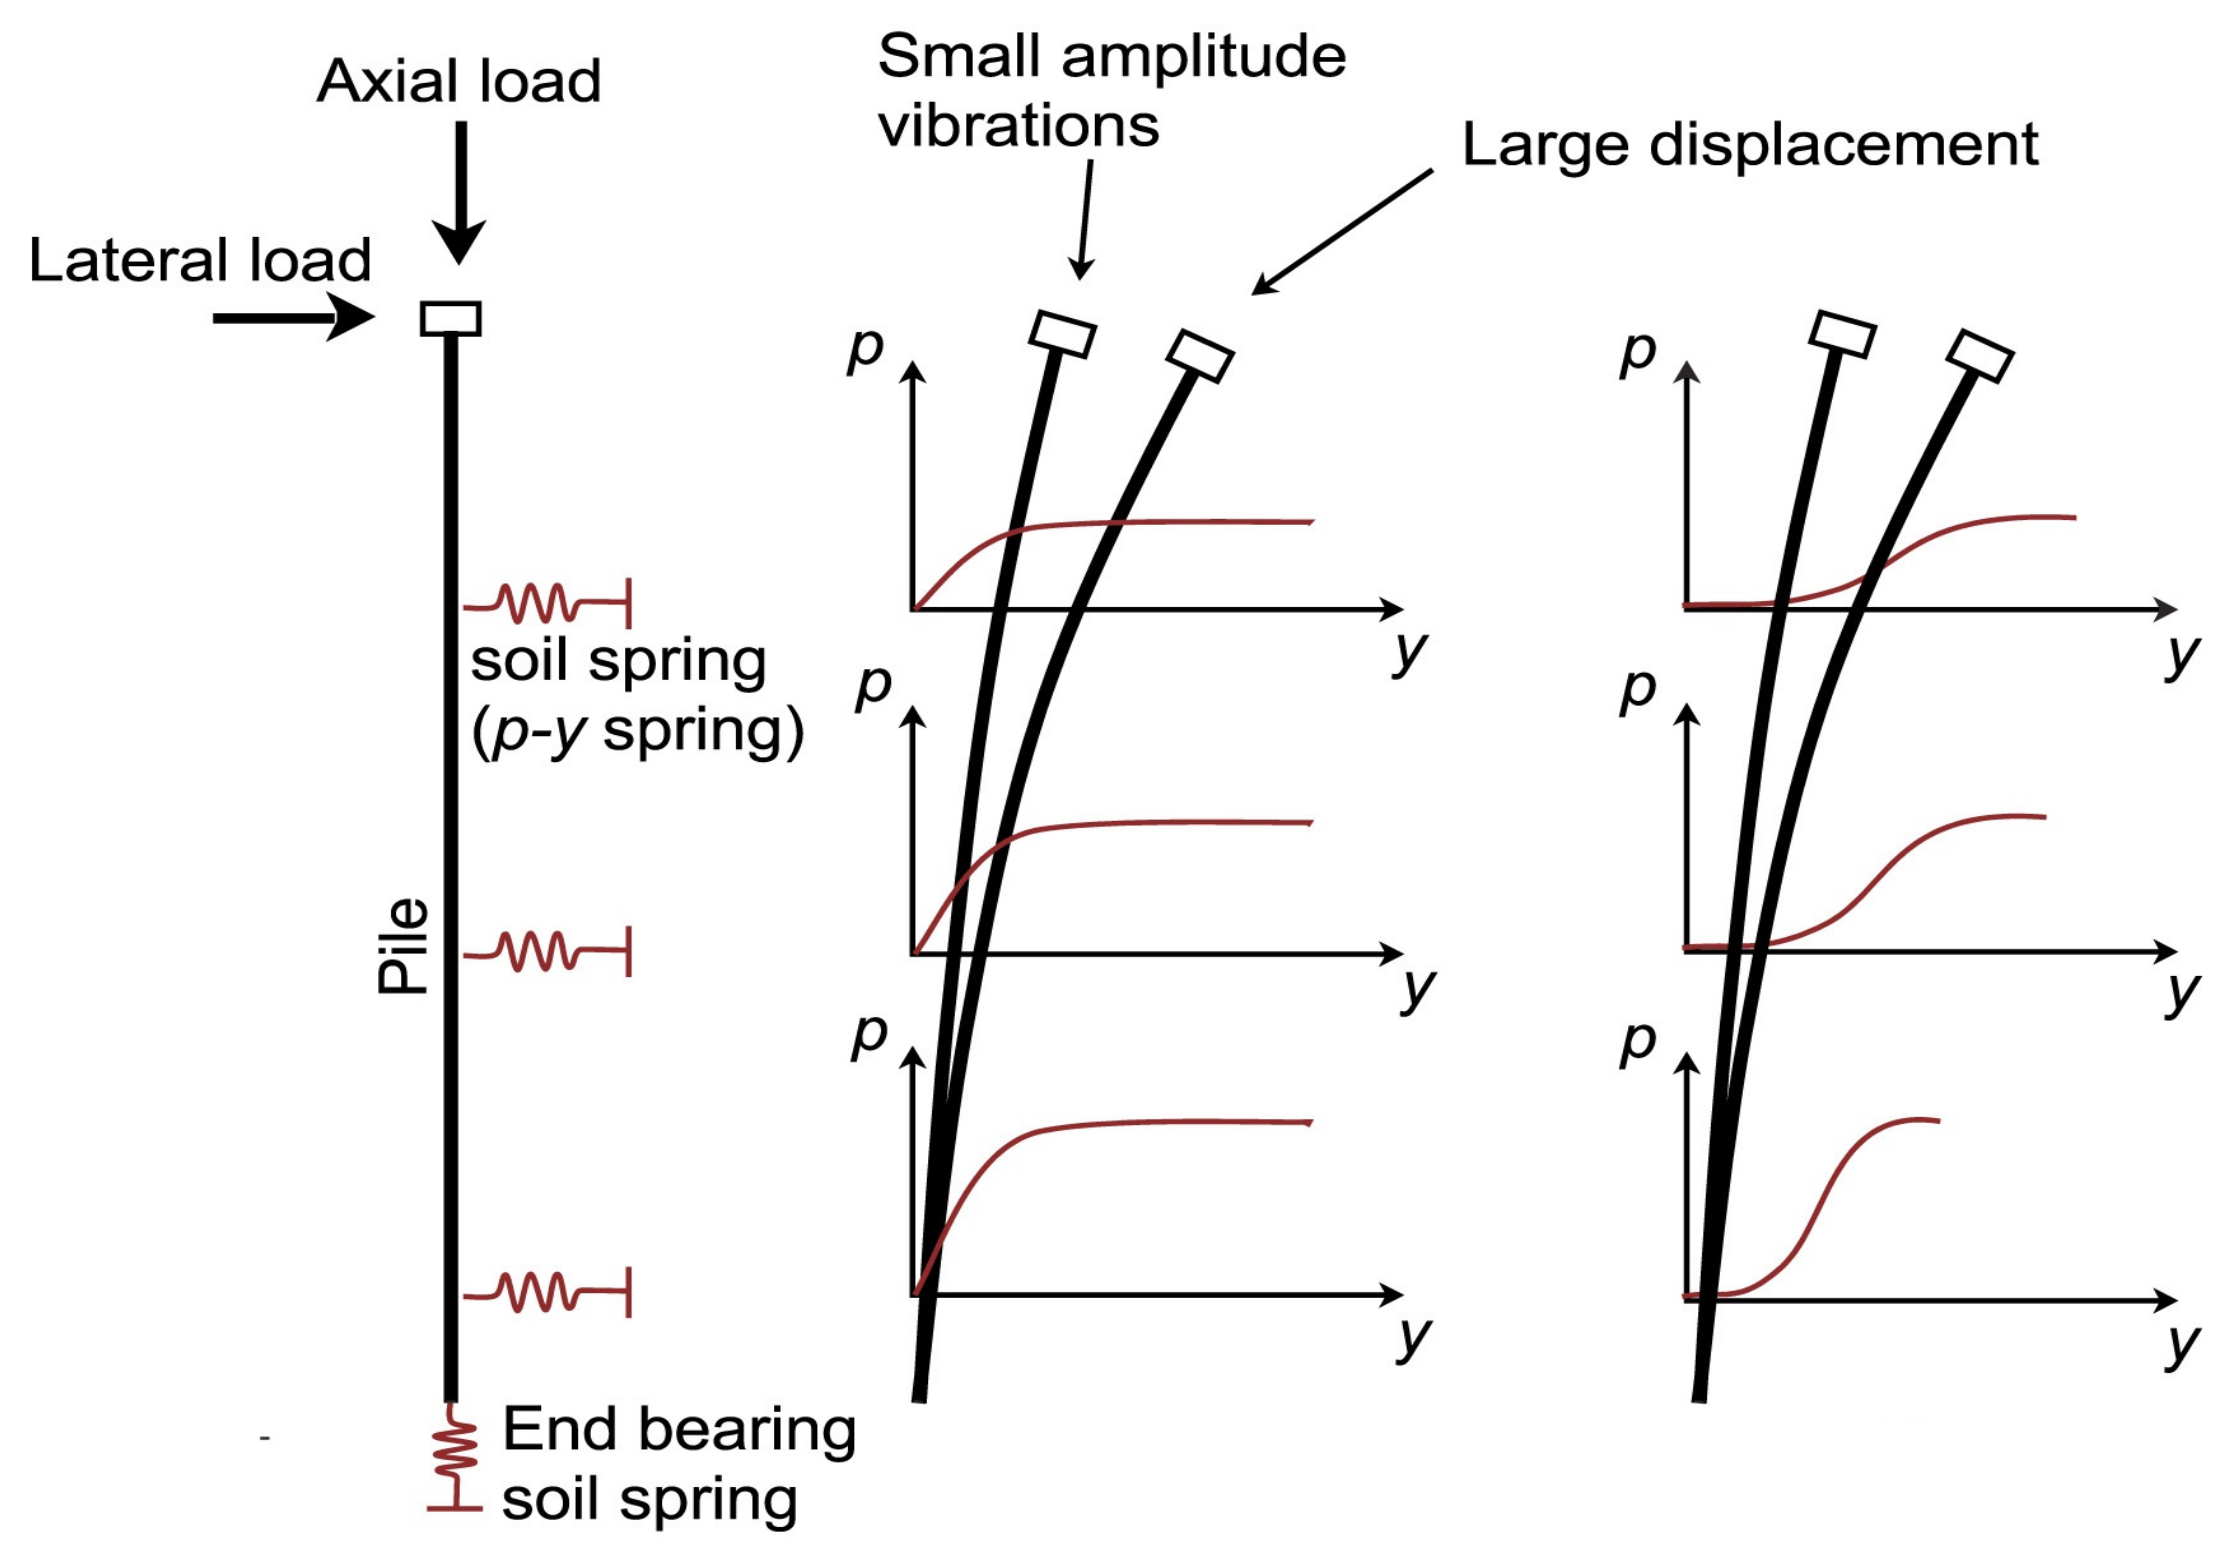
In practice, the beam on non-linear Winkler foundations (BNWF), also known as the p-y approach, is applied to model soil–structure interaction effect under seismic loading. Depending on the application of the earthquake input motion, two different types of analyses are possible. These are briefly discussed below.

2.5.1. Spatial Analysis

For spatial analysis, the ideal approach is to select seven earthquake events (i.e., 14 records comprising 7 pairs of strong motion recorded in two main directions of the instrument record station). These recorded data are applied to the structure along with the interchanging directions; hence, 14 separate analyses are possible. If the number of chosen events is larger or equal to seven, then the mean effects on the structure can also be considered; however, if the number is lower than seven, just the maximum effects should be considered (i.e., the envelope). If the record selection is not compliant with the bi-directional approach mentioned above (i.e., two-directional motions are not available), then similar data may be used identically in both directions, and suitable scaling factors may be adopted. Normally, there is no scaling in one direction, while the other direction is subjected to 30% of input motion. It is worth noting that this approach has an important as it ignores a possible phase difference of the ground motions in the two directions.

2.5.2. Planar Analysis (1-D Analysis)

In the planar model, two approaches may be used:
  • The strong seismic motion may be applied to the principal direction of OWT (i.e., along the direction of the predominant wind). It must also be assumed that wind and wave are collinear. The seismic motion may be scaled 1.4 times, which is essentially a square root of 2 considering two directions.
  • The strong seismic motion will be applied to the major principal direction of OWT (i.e., along the direction of the predominant wind). In a separate analysis, an additional component scaled to 30% may be applied in the minor principal direction. The response can be algebraically added. However, these methods are based on the superposition principle, which is strictly valid under the assumption of linearity.

3. Choice of p-y Curves for Analysis in Liquefiable Soils

In sites with layers prone to liquefaction, the most critical event for the seismic design of a monopile foundation is the occurrence of liquefaction since it is likely to cause severe permanent tilting of the turbine. In practice, the soil–structure interactions of piles in liquefiable soils is best modeled using a set of p-y curves that resemble the behavior of the liquefied soil as observed in laboratory testing (see Figure 10a). A bilinear stress–strain model (see Figure 10b) is proposed in [25] that was used by [26] to recommend a new family of p-y curves with a characteristic strain hardening behavior, also referred to as S-shape p-y curves [26]. A step-by-step method for constructing S-shaped p-y curves is given in [4,27]. The use of an appropriate p-y curves, which are consistent with the soil response as observed in laboratory testing, is paramount since the typical p-y curves for liquefied soils tends to significantly overestimate the initial stiffness of the curve, therefore leading to un-conservative approximation of foundation tilting and the response of overall system (see Figure 11).

4. Analysis of Monopile Supported Offshore Wind Turbines

For OWTs to remain operational post-earthquakes, several limit states are specified as detailed in Table 3. The readers are referred to Chapter 3 of the book [3] for further details.
Figure 12 shows stages of a schematic diagram of loading in the monopile type foundation, whereby six stages are identified corresponding to the required engineering calculations [28].
  • Stage I: represents the usual calculations necessary for non-seismic locations and a typical simplified loading diagram can be found in the article [29].
  • Stage II: represents the arrival of the seismic waves and the onset of the turbine’s control mechanism to reduce overall damage or OPEX cost. It is likely that a normal or emergency brake may be applied depending on whether the turbine is idling (not connected to the grid), parked or in power generation mode. The loading in this stage will comprise inertia load together with the braking load. To obtain a conservative estimate of the lateral and moment load at Stage 2, the braking and the inertia loads may be added to the loads applied in Stage I.
  • Stage III(a): In liquefiable deposits, when the earthquake progresses, the soil would progressively liquefy in a top-down fashion, and the load-carrying capacity of the foundation may reduce significantly. The enhanced flexibility of the pile due to the larger unsupported length caused by liquefaction may induce excessive tilting (SLS requirement) and in the worst cases permanent damage (ULS requirement) to the structure and/or foundation.
  • Stage III(b): If the soil is not prone to liquefaction, there may be a kinematic bending moment in layered deposits.
  • Stage IV: If there are submarine landslides, there may be extra lateral loads the foundation.
  • Stage V: In tsunami risk areas, there will be other different loads due to hydrodynamic loads.
The main task of the engineers is to combine the effect of earthquakes on the wind and wave loading, which is schematically shown in Figure 13.

5. Examples of Typical Analysis of Offshore Wind Turbine Systems

This section of the paper provides typical analysis of commonly used foundation systems. The readers of the paper are referred to [30,31,32,33] for seismic analysis of hybrid foundations.

5.1. Analysis of Two Types of Grounded System (Monopile and Jacket)

This section of the paper provides a comparative study between a jacket and a monopile supporting a 9.5 MW turbine for 18 m water depth at a high seismic zone. Figure 14 shows data of a soil profile from an offshore wind farm site (Changbin Wind Farm, Taiwan) following [34,35].
Table 4 and Table 5 provide the input data of the structure and foundation system.
Effective stress ground response analysis was carried out using the Cyclic 1D [36] and the unscaled Takatori record (1995 Kobe earthquake) to obtain ground displacements, which are then imposed on appropriate p-y curves to study the lateral response of the OWT-foundation system. The results of the analysis are shown in Table 6.
The following can be concluded from the study:
  • Monopiles may permanently tilt if the depth of liquefaction is sufficiently high. This foundation system experiences large moment demands at the pile head due to high RNA accelerations and large tower heights and unsupported length due to liquefaction.
  • Liquefaction reduces the moment carrying capacity of the monopile and magnitude of reduction depends on the depth of liquefaction.
  • Jacket structures transfer loads through push–pull action and as a result the piles experience axial load. When the soil liquefies (which is typically in the upper part) the topsoil does not offer shaft resistance (i.e., capacity is reduced) and the load is transferred to the lower part of the pile which may result in vertical settlement.
Typical deformed shapes of monopile and jacket structures during liquefaction are shown in Figure 15.

5.2. Seismic Analysis of TLP Type Offshore Wind Turbine

As mentioned before, among the different floating system TLP will have a higher response to seismic motion and therefore TLP is considered for a typical analysis. A TLP-type floating wind turbine employing a 5 MW turbine in a water depth of 70 m [37] was considered in this paper. As reported in [37], the span, width and height of the floater are 55 m, 4.4 m and 5.5 m, respectively. The mast height is 71.1 m, mast toe diameter is 5.59 m and mast upper diameter is 3.87 m. The tendon length is 34.5 m and tendon diameter is 90 mm. The total mass of rotor and nacelle is taken as 350,000 kg. A line sketch of all the components considered in the finite element modeling of the floating system in the finite element software ABAQUS is shown in Figure 16.

5.3. Seismic Response under Vertical and Horizontal Ground Motion

The tension legs are modeled as truss elements. The floater and mast are modeled as beam elements. The rotor mass is applied through a nodal mass element. Spring damper systems are implemented at the interface between mast and rotor and between sea bed and tension legs. The buoyant force is modeled as a uniformly distributed load acting upwards on the bottom surface of the floater. The damping generated at the interface between water and floater surface is modeled through two viscous dampers on either side of the mast. The pretension in the tension legs is achieved by introducing initial strain in the truss elements.
The Anchorage, Alaska Earthquake of 30 November 2018 was considered in this paper. The horizontal acceleration and rotation of the mast at rotor level for horizontal ground motion is shown in Figure 17, and in Figure 18 for vertical ground motion.
From Figure 17 and Figure 18, it is clear that the seismic response of TLP-type floating wind turbines are more sensitive to vertical ground motion than the horizontal ground motion. The overturning failure of the floating wind turbine under vertical ground motion is shown in Figure 19.

5.4. Effect of Fault Rupture on Seismic Response of Floating Wind Turbines

A special case of fault rupture where the foundation under one of the tension legs is displaced due to fault rupture is shown in Figure 4b. Two cases can occur due to the relative displacement of the foundation under one tension leg (i) loss of the pretension force in the tension leg, and (ii) additional tension in the tension leg due to the pull of the foundation under the tension leg. A comparison of the horizontal accelerations and rotation of the mast at rotor level are shown in Figure 20 and Figure 21.
From Figure 20 and Figure 21, it is clear that loss of pretension in the tension legs is more critical for seismic hazard of the floating wind turbines. It is assumed that the tension legs are linear elastic materials that can undertake infinite strains. A future study is focused on the modeling of the breakage of the tension legs under large amplitude ground motions.

6. Discussion and Conclusions

This section of the paper summarizes the engineering risk to different OWT foundation types in seismic regions and is summarized in Table 7.
The existing methods for seismic design of offshore wind structures are generally based on codes of practices proposed for ordinary buildings and critical structures, such as nuclear power plants. However, salient differences exist between wind turbine structures and the building and critical structures as the former have much shorter lifespan and are primarily unmanned. Hence, it is questionable whether the available seismic provisions should be extended to design wind structures in seismic areas. The entire design process is governed by the overall performance and safety of the wind turbine and its components (e.g., blades and gearboxes), whose failure may prompt extensive downtimes and expensive repairs. Considering the lifespan for which offshore wind turbines are normally designed, it is questionable whether a detailed PSHA is required to define the seismic hazard at the site.
Furthermore, the paucity of recorded strong ground motion data at offshore sites introduces different additional challenges and uncertainties in the estimation of seismic hazard. Learning from recent failures, such as the 2011 Fukushima Daiichi nuclear disaster, it is important to recognize that coastal and offshore infrastructure is prone to multiple seismic hazards, including ground shaking, tsunami and liquefaction, which may occur individually, or as a sequence of cascading events and whose effects need to be accounted for at the design stage.

Author Contributions

Conceptualization, S.B. (Subhamoy Bhattacharya); methodology, S.B. (Subhamoy Bhattacharya), G.P., D.L. and S.B. (Suryakanta Biswal); software, S.B. (Suryakanta Biswal) and M.A.; validation, S.A. and A.P.; investigation, H.K.M.; resources, D.L., G.P., H.K.M.; writing—original draft preparation, S.B. (Subhamoy Bhattacharya), S.B. (Suryakanta Biswal), M.A.; writing—review and editing, S.B. (Suryakanta Biswal), M.A.; visualization, D.L., M.A., S.A. and A.P. All authors have read and agreed to the published version of the manuscript.

Funding

This research received no external funding.

Institutional Review Board Statement

Not applicable.

Informed Consent Statement

Not applicable.

Data Availability Statement

Not applicable.

Acknowledgments

The authors would like to acknowledge the MSc student, Hajjar Sadak, who carried out an analysis that helped make it possible for us to draw conclusions.

Conflicts of Interest

The authors declare no conflict of interest.

Appendix A. Gujarat Seismic Hazard Analysis

Figure A1 shows the map of India with the potential location of offshore Gujarat on the west coast.
Figure A1. Major tectonic plates and potential offshore wind farm locations in India.
Energies 14 03496 g0a1
Figure A2 shows the distribution of peak ground acceleration obtained for two return periods: 475 years (corresponding to a probability of exceedance of 10% in 50 years, shown in Figure A2a) and 285 years (corresponding to a probability of exceedance of 10% in 30 years, shown in Figure A2b).
Figure A2. Seismic hazard map for Gujarat.
Energies 14 03496 g0a2
The peak ground acceleration was used to calculate the design response spectra according to the procedures prescribed by the Indian building code (IS 1893 Part 1, 2016). The design response spectra are shown in Figure A3.
Figure A3. Design response spectra for offshore sites in Gujurat obtained from the PSHA shown in Figure A2 for return periods 475 years and 285 years.
Energies 14 03496 g0a3
The results from the disaggregation analysis for Gujarat are shown in Figure A4.
Figure A4. Disaggregation of the seismic hazard for offshore sites in Gujurat at return periods of (a) 475 years, (b) 285 years.
Energies 14 03496 g0a4aEnergies 14 03496 g0a4b

References

  1. Pagani, M.; Garcia-Pelaez, J.; Gee, R.; Johnson, K.; Poggi, V.; Silva, V.; Simionato, M.; Styron, R.; Viganò, D.; Danciu, L.; et al. The 2018 version of the Global Earthquake Model: Hazard component. Earthq. Spectra 2020, 36, 226–251. [Google Scholar] [CrossRef]
  2. Cho, Y.S.; Kim, J.; Ha, T. Generation of tsunami hazard map. In Proceedings of the Twenty-First International Offshore and Polar Engineering Conference, International Society of Offshore and Polar Engineers, Maui, HI, USA, 19–24 June 2011. [Google Scholar]
  3. Bhattacharya, S. Design of Foundations for Offshore Wind Turbines, 1st ed.; John Wiley & Sons Ltd.: Chichester, UK, 2019. [Google Scholar]
  4. Bhattacharya, S.; Orense, R.P.; Lombardi, D. Seismic Design of Foundations: Concepts and Applications; ICE Publishing: London, UK, 2019. [Google Scholar]
  5. Aleem, M.; Demirci, H.; Bhattacharya, S. Lateral and Moment Resisting Capacity of Monopiles In Layered Soils. In Proceedings of the International Conference on Energy, Environment and Storage of Energy, Kayseri, Turkey, 19–21 November 2020. [Google Scholar]
  6. Kaynia, A.M. Seismic considerations in design of offshore wind turbines. Soil Dyn. Earthq. Eng. 2019, 124, 399–407. [Google Scholar] [CrossRef]
  7. Barari, A.; Bayat, M.; Saadati, M.; Ibsen, L.B.; Vabbersgaard, L.A. Transient analysis of monopile foundations partially embedded in liquefied soil. Geomech. Eng. 2015, 8, 257–282. [Google Scholar] [CrossRef]
  8. Goda, K.; Rossetto, T.; Mori, N.; Tesfamariam, S. Editorial: Mega Quakes: Cascading Earthquake Hazards and Compounding Risks. Front. Built Environ. 2018, 4, 8. [Google Scholar] [CrossRef] [Green Version]
  9. Ali, A.; De Risi, R.; Sextos, A.; Goda, K.; Chang, Z. Seismic vulnerability of offshore wind turbines to pulse and non-pulse records. Earthq. Eng. Struct. Dyn. 2020, 49, 24–50. [Google Scholar] [CrossRef]
  10. Esfeh, P.K.; Kaynia, A.M. Earthquake response of monopiles and caissons for Offshore Wind Turbines founded in liquefiable soil. Soil Dyn. Earthq. Eng. 2020, 136, 106213. [Google Scholar] [CrossRef]
  11. Haddad, A.; Barari, A.; Amini, R. The Remedial Performance of Suction Caisson Foundations for Offshore Wind Turbines under Seismically Induced Liquefaction in the Seabed: Shake Table Testing. Mar. Struct. 2021. Submitted. [Google Scholar]
  12. Ali, A.; De Risi, R.; Sextos, A. Seismic assessment of wind turbines: How crucial is rotor-nacelle-assembly numerical modeling? Soil Dyn. Earthq. Eng. 2021, 141, 106483. [Google Scholar] [CrossRef]
  13. Esfeh, P.K.; Govoni, L.; Kaynia, A.M. Seismic response of subsea structures on caissons and mudmats due to liquefaction. Mar. Struct. 2021, 78, 102972. [Google Scholar] [CrossRef]
  14. Patra, S.K.; Haldar, S. Seismic response of monopile supported offshore wind turbine in liquefiable soil. Structures 2021, 31, 248–265. [Google Scholar] [CrossRef]
  15. Patra, S.K.; Haldar, S. Response of Monopile Supported Offshore Wind Turbine in Liquefied Soil. In Geohazards; Latha Gali, M., Raghuveer Rao, P., Eds.; Springer: Singapore, 2021; pp. 367–382. [Google Scholar]
  16. Bhattacharya, S.; Cox, J.A.; Lombardi, D.; Wood, D.M. Dynamics of offshore wind turbines supported on two foundations. Proc. Inst. Civ. Eng. Geotech. Eng. 2013, 166, 159–169. [Google Scholar] [CrossRef] [Green Version]
  17. Bhattacharya, S.; De Risi, R.; Lombardi, D.; Ali, A.; Demirci, H.; Haldar, S. On the seismic analysis and design of offshore wind turbines. Soil Dyn. Earthq. Eng. 2021, 145, 106692. [Google Scholar] [CrossRef]
  18. Bhattacharya, S. Challenges in Design of Foundations for Offshore Wind Turbines. Eng. Technol. Ref. 2014, 1, 922. [Google Scholar] [CrossRef]
  19. Code, P. Eurocode 8: Design of Structures for Earthquake Resistance—Part 1: General Rules, Seismic Actions and Rules for Buildings; European Committee for Standardization: Brussels, Belgium, 2005. [Google Scholar]
  20. Cornell, B.Y.C.A. Owing to the uncertainty in the number, sizes, and locations of future earthquakes it is appropriate that engineers express seismic risk, as design winds or floods are, in terms of return periods (Blume, 1965; Newmark, 1967; Blume, Newmark and C). Bull. Seismol. Soc. Am. 1968, 58, 1583–1606. [Google Scholar]
  21. McGuire, R.K. Seismic hazard and risk analysis and zonation. Earthq. Eng. 2020, 247–284. [Google Scholar] [CrossRef]
  22. De Risi, R.; Bhattacharya, S.; Goda, K. Seismic performance assessment of monopile-supported offshore wind turbines using unscaled natural earthquake records. Soil Dyn. Earthq. Eng. 2018, 109, 154–172. [Google Scholar] [CrossRef]
  23. Iervolino, I.; Galasso, C.; Cosenza, E. REXEL: Computer aided record selection for code-based seismic structural analysis. Bull. Earthq. Eng. 2010, 8, 339–362. [Google Scholar] [CrossRef]
  24. Baker, J.W. Conditional Mean Spectrum: Tool for Ground-Motion Selection. J. Struct. Eng. 2011, 137, 322–331. [Google Scholar] [CrossRef]
  25. Lombardi, D.; Bhattacharya, S.; Muir Wood, D. Dynamic soil-structure interaction of monopile supported wind turbines in cohesive soil. Soil Dyn. Earthq. Eng. 2013, 49, 165–180. [Google Scholar] [CrossRef]
  26. Lombardi, D.; Dash, S.R.; Bhattacharya, S.; Ibraim, E.; Muirwood, D.; Taylor, C.A. Construction of simplified design p–y curves for liquefied soils. Geotechnique 2017, 67, 216–227. [Google Scholar] [CrossRef] [Green Version]
  27. Dash, S.; Rouholamin, M.; Lombardi, D.; Bhattacharya, S. A practical method for construction of p-y curves for liquefiable soils. Soil Dyn. Earthq. Eng. 2017, 97, 478–481. [Google Scholar] [CrossRef]
  28. Yang, C.B.; Wang, R.; Zhang, J.M. Seismic Analysis of Monopile Supported Offshore Wind Turbine. In IACGE 2018; American Society of Civil Engineers: Reston, VA, USA, 2019; pp. 261–269. [Google Scholar] [CrossRef]
  29. Jalbi, S.; Arany, L.; Salem, A.; Cui, L.; Bhattacharya, S. A method to predict the cyclic loading profiles (one-way or two-way) for monopile supported offshore wind turbines. Mar. Struct. 2019, 63, 65–83. [Google Scholar] [CrossRef] [Green Version]
  30. Li, X.; Zeng, X.; Yu, X.; Wang, X. Seismic response of a novel hybrid foundation for offshore wind turbine by geotechnical centrifuge modeling. Renew. Energy 2021, 172, 1404–1416. [Google Scholar] [CrossRef]
  31. Wang, X.; Yang, X.; Zeng, X. Seismic centrifuge modelling of suction bucket foundation for offshore wind turbine. Renew. Energy 2017, 114, 1013–1022. [Google Scholar] [CrossRef]
  32. Renjie, M.; Renjing, C.; Minghou, L.; Miao, L. Effect of ground motion directionality on seismic dynamic responses of monopile offshore wind turbines. Renew. Energy 2021, 175, 179–199. [Google Scholar] [CrossRef]
  33. Wang, X.; Zeng, X.; Li, X.; Li, J. Liquefaction characteristics of offshore wind turbine with hybrid monopile foundation via centrifuge modelling. Renew. Energy 2020, 145, 2358–2372. [Google Scholar] [CrossRef]
  34. Kuo, Y.; Lin, C.; Chai, J.; Chang, Y.; Tseng, Y. Case study of the ground motion analyses and seabed soil liquefaction potential of changbin offshore wind farm. J. Mar. Sci. Technol. 2019, 27, 448–462. [Google Scholar] [CrossRef]
  35. Han, W.C.; Lu, Y.W.; Lo, S.C. Seismic prediction of soil distribution for the Chang-Bin offshore wind farm in the Taiwan Strait. Interpretation 2020, 8, T727–T737. [Google Scholar] [CrossRef]
  36. Yang, Z.; Elgamal, A. Influence of Permeability on Liquefaction-Induced Shear Deformation. J. Eng. Mech. 2002, 128, 720–729. [Google Scholar] [CrossRef]
  37. Oguz, E.; Clelland, D.; Day, A.H.; Incecik, A.; López, J.A.; Sánchez, G.; Almeria, G.G. Experimental and numerical analysis of a TLP floating offshore wind turbine. Ocean Eng. 2018, 147, 591–605. [Google Scholar] [CrossRef] [Green Version]
Figure 1. Location of planned and proposed offshore wind farms with seismicity [1].
Energies 14 03496 g001
Figure 2. Worldwide spatial distribution of tsunami run-up heights. Darker (red) dots indicate recorded run-up heights in excess of 20 m [2].
Energies 14 03496 g002
Figure 3. Schematic of hazards due to the arrival of seismic waves for offshore wind turbine structures [5].
Energies 14 03496 g003
Figure 4. Effect of fault rupture on floating wind turbine system.
Energies 14 03496 g004aEnergies 14 03496 g004b
Figure 5. Schematic of typical facilities in an offshore wind farm.
Energies 14 03496 g005
Figure 6. Earthquake hazards to a wind farm.
Energies 14 03496 g006
Figure 7. Load complexity with the approximate number of cycles for 20 years assumed lifetime.
Energies 14 03496 g007
Figure 8. Design considerations governing the serviceability limit states (SLS) requirements for offshore wind turbine supported on a monopile foundation.
Energies 14 03496 g008
Figure 9. An overview of the steps involved in a typical probabilistic seismic hazard assessment (PSHA) [20,21] and corresponding outputs.
Energies 14 03496 g009
Figure 10. Post-liquefaction behavior of liquefiable soils.
Energies 14 03496 g010
Figure 11. Comparison of soil–structure interaction modeling using traditional p-y curves for liquefiable soils.
Energies 14 03496 g011
Figure 12. Main loading conditions to be considered for offshore wind turbines in regions prone to seismic events (modified from [17]).
Energies 14 03496 g012
Figure 13. Load combination (wind + wave + earthquake) for a typical offshore wind turbine sited in a seismic prone region.
Energies 14 03496 g013
Figure 14. Ground profile.
Energies 14 03496 g014
Figure 15. Typical deformed shapes of monopile and jacket structures during liquefaction.
Energies 14 03496 g015
Figure 16. Schematic of the finite element model used for the analysis of TLP wind turbine.
Energies 14 03496 g016
Figure 17. Seismic response of TLP floating wind turbine under horizontal ground acceleration.
Energies 14 03496 g017
Figure 18. Seismic response of TLP floating wind turbine under vertical ground acceleration.
Energies 14 03496 g018
Figure 19. Overturning failure of mast under vertical ground motion.
Energies 14 03496 g019
Figure 20. Comparison of maximum horizontal acceleration before and after fault rupture.
Energies 14 03496 g020
Figure 21. Comparison of rotation at tower top before and after fault rupture.
Energies 14 03496 g021
Table 1. Seismic hazards for potential seismic zones.
LocationSeismic Hazard
Offshore Western United States (California)High water depths and the required solution is floating technology. Seismically induced hazards include ground shaking, surface rupture, seabed liquefaction, submarine landslides and tsunami loading.
Offshore Eastern United States (Lake Eerie)The eastern United States is an intraplate region, and the region has a relatively low seismic hazard compared to the west coast. Temperature-induced stresses can be a potential hazard at this site.
Offshore Canada (Pacific)Offshore western Canada has the Cascadia subduction zone. Hazards include ground shaking, tsunami loading, seabed liquefaction, submarine landslides, basin effects and surface rupture.
Offshore IndiaFor the west coast, the significant seismic hazard (Gujarat) is ground shaking, For the southeast coast, (Tamil Nadu) major hazard is tsunami.
Offshore TaiwanHazards include ground shaking, surface rupture, seabed liquefaction, tsunami loading and submarine landslides.
Offshore South AmericaOffshore South America has the Chilean subduction zone and can experience large earthquakes. Hazards include ground shaking, tsunami loading, submarine landslides and seabed liquefaction.
Offshore JapanOffshore Japan has a subduction zone and can experience large earthquakes. Hazards include ground shaking, tsunami loading, seabed liquefaction and submarine landslides.
Offshore ItalyAdriatic Sea is located within the Adriatic plate. This is a continental crust by active compression and overridden by thrust belts on all sides. The region is prone to strong ground shaking, tsunami loading and liquefaction.
Offshore GreeceMost of the seismicity is concentrated in the southern part of the Adriatic plate and between the Aegean and African plates into the south-east of Crete and interpreted to be associated with the intracrustal graben system (Ptolemy and Pliny trenches). The region is prone to strong ground shaking, tsunami loading and liquefaction.
Table 2. Examples of offshore wind turbines with high consequences of failure where seismic design might need to be considered.
Factors Influencing Probability of ExceedanceTypical Example
Economic impactTilting of the whole wind turbines beyond repair, see Figure 8. The consequence of tilting is the loss of investment.
There is no tilt of the overall structure (SLS criteria satisfied—for example, less than 0.5 degrees), but the blade cracked.
If the blade needs replacement, this can be a huge unplanned cost and no power production for a substantial amount of time.
Large-scale wind farm in the coastal areas and no power production will have a national economic impact.
Impact on post-earthquake reliefLoss of power production could impact the rescue effort and recovery
Structural integrityLimit on blade deflection in order to not to hit the tower, see Figure 8. Tilting of the tower will enhance P-delta moment causing more fatigue damage leading to an early end of life.
Table 3. ULS and SLS criteria.
Limit StateTypical Criteria
ULS(i) Ground Failure (soil failure) around the foundation causing foundation collapse. Earthquake may cause seismic liquefaction in certain soils (loose to medium dense sandy soil) and degradation of stiffness in certain soils.
(ii) Foundation should remain elastic.
SLS(i) Permanent tilt at pile head <0.75 deg (these are typical for grounded systems).
(ii) RNA acceleration <0.2 to 0.4 g.
(iii) Acceptable pile head deformation.
FLS(i) Wind + wave loading imposes a large number of cycles during the operational life of the turbines.
(ii) Fatigue life needs to be quantified for a seismic event.
Table 4. Input data of the structures and the monopile foundation.
DescriptionMonopile
Turbine model in MW9.5
Hub height in meters105
Pile length in meters40
RNA mass in Tonnes495
Tower top diameter in meters4
Tower bottom diameter in meters8.8
Pile diameter in meters8
Pile thickness in mm90
Table 5. Input data of the structures and the jacket foundation.
DescriptionMonopile
Turbine model in MW9.5
Hub height in meters157
Pile length in meters20
RNA mass in Tonnes495
Tower top diameter in meters4
Tower bottom diameter in meters8.8
Jacket leg diameter in meters1.5
Jacket leg thickness in mm40
Jacket bracing diameter in meters1
Jacket bracing thickness in mm30
Pile diameter in meters1.5
Pile thickness in mm25
Table 6. Key results of the analysis.
MonopileJacket
Load Case No.Load Case DescriptionResidual Pile Head Displ. δ in mmPile Head Rotation θ in DegreesRNA Accel. (g)Residual Pile Head Displ. δ in mmPile Head Rotation θ in DegreesRNA Accel. (g)
1Operational condition (Wind+Wave)570.29N/A280.20N/A
2Seismic consideration (Wind+Wave+EQ), Pre-Liquefaction1200.570.75320.280.4
2Seismic consideration (Wind+Wave+EQ), Post-Liquefaction1280.680.77650.40.42
Table 7. Engineering risk to different foundation types for OWTs.
Foundation TypeEngineering Risk in Seismic Areas
(i) High moment demand on foundations due to inertia loading + emergency braking (if any).
Monopile(ii) Kinematic moments in layered soils.
(iii) Loss of lateral load/moment carrying capacity due to seabed liquefaction.
(i) Possible buckling of braces.
Jacket Foundation(ii) Stiff system can lead to high RNA acceleration.
(iii) Small diameter piles (as opposed to monopile foundations) are prone to buckling instability and P-delta effects.
CaissonsOverturning due to tsunami loading.
Floating SystemLess vulnerable to ground shaking and therefore applicable to high seismic regions with deeper waters. However, surface fault rupture can cause high tensile forces on cables.
Publisher’s Note: MDPI stays neutral with regard to jurisdictional claims in published maps and institutional affiliations.

