
Balancing Health, Economy and Climate Risk in a Multi-Crisis


1
Department of Management Science & Civil and Environmental Engineering, Waterloo Institute for Sustainable Energy, University of Waterloo, Waterloo, ON N2L 3G1, Canada
2
Department of Civil & Environmental Engineering, Waterloo Institute for Sustainable Energy, University of Waterloo, Waterloo, ON N2L 3G1, Canada
3
Institute for Advanced Sustainability Science, IASS, Berliner Str. 130, 14467 Potsdam, Germany
4
Potsdam Institute for Climate Impact Research (PIK), P.O. Box 60 12 03, 14412 Potsdam, Germany
*
Author to whom correspondence should be addressed.
Energies 2021, 14(14), 4067; https://0-doi-org.brum.beds.ac.uk/10.3390/en14144067
Submission received: 19 May 2021
/
Revised: 21 June 2021
/
Accepted: 22 June 2021
/
Published: 6 July 2021
(This article belongs to the Special Issue COVID-19 Crisis Implications on the Energy Sector and on the Environment)
Abstract
:In the presence of a global pandemic (COVID-19), the relentless pressure on global decision-makers is to ensure a balancing of health (reduce mortality impacts), economic goals (income for livelihood sustenance), and environmental sustainability (stabilize GHG emissions long term). The global energy supply system is a dominant contributor to the GHG burden and deeply embedded in the economy with its current share of 85%, use of fossil fuels has remained unchanged over 3 decades. A unique approach is presented to harmonizing the goals of human safety, economic development, and climate risk, respectively, through an operational tool that provides clear guidance to decision-makers in support of policy interventions for decarbonization. Improving climate change performance as an integral part of meeting human development goals allows the achievement of a country’s environmental, social, and economic well-being to be tracked and monitored. A primary contribution of this paper is to allow a transparent accounting of national performance highlighting the goals of enhancing human safety in concert with mitigation of climate risks. A measure of a country’s overall performance, combined as the Development and Climate Change Performance Index (DCI), is derived from two standardized indexes, the development index H and the Climate Change Performance Index CCPI. Data are analyzed for 55 countries comprising 65 percent of the world’s population. Through active management and monitoring, the proposed DCI can illustrate national performance to highlight a country’s current standing, rates of improvement over time, and a historical profile of progress of nations by bringing climate risk mitigation and economic well-being into better alignment.
1. Introduction
Will the drive for action on climate policy crumble in the face of social, economic, and political stress arising from the COVID-19 pandemic? The global pandemic has put enormous pressures on national budgets and rattled our collective sense of safety, security, and well-being. Prior to the pandemic, there was a steady build-up of populist anger against taxes and resentment over the inequitable impacts of economic burdens for mitigating the risk of climate threat. The convergence of an immediate threat to livelihood in the wake of a health crisis has the potential to undermine actions on mitigating the climate risk. Climate policy, built on the foundation of an unimpeachable scientific record, is at risk because the political trade-offs implicit in meeting the targets for GHG emissions from the energy system may be sacrificed with short term considerations triumphant over the long view.
The risk is real that permanent damage to Earth, with global temperatures rising above 2 °C will deliver misery on a large-scale at the planetary level: famines, floods, fires, tsunamis, mass migrations, violence, and irreparable damage to the ecosystem [1,2] with a recent update for the threat assessment at 1.5 °C [3,4]. A prescient comparative analysis of the threat of climate and COVID-19 risks, through the lens of an emergency, provides unique insights for managing health and safety risks in concert with climate risks [5] to enhance public welfare. The common underlying structure is the basis for risk management strategies for mitigation (reduce probability of damage), adaptation (limit damage), measures of resilience (timely interventions and recovery from damage), and good governance.
Given the complexity of global system dynamics, and the concept of ‘large-scale discontinuities’—or tipping points [6], our inability to predict, a priori, specific events at the relevant spatial and temporal scales points to the requirement for improving resilience [7] of the system with a focus on managing overall societal performance for managing risk and scarce resources.
We propose here an objective measure of performance to support a formulation that reconciles equitable human development—improving the life quality of every global citizen—with a global emissions profile that complies with the 2 °C-temperature guardrail as codified in the Paris Agreement. Our unique approach balances health and safety, economic performance, and the climate threat through an index that combines human development goals and climate change performance.
The Development and Climate Index (DCI) is created from two indices and standardized for comparison. The DCI, as formulated here, is an objective measure of levels of performance required to balance and reconcile equitable human development with a global GHG emissions profile. It is a tool for managing risk intended for guidance to decision-makers.
Over five generations, since the onset of the industrial revolution, the remarkable improvements to human wellbeing have come at a significant hidden cost arising from carbon emissions resulting in a destabilization of the bio-physical ecosystem. Historical progress, largely because of the energy sectors of massive use of fossil fuels has also contributed, paradoxically, to an unprecedented level of economic and safety but at an increasingly high cost of damage to the environment: deforestation, pollution of air, land, and water, and increasing stress on the health of the ecosystem resulting in extreme weather events, floods, famines, and ice cap melting linked to climate change. This externality is a debt to future generations, shown here to be more than five percent of the World economic product.
With the urgency to maintain global average temperature increase to well under 2 °C with aspirational targets at 1.5 °C above the pre-industrial level, 184 countries have joined to the 2015 Paris Agreement, committing each country to follow a plan to limit GHG emissions. The public policy challenge remains. How can we deliver on the linked objectives of healthy well-being, livelihood sufficiency, and mitigation of climate risk? For effective action on climate change, the population health and safety objectives together with income sustenance goals must be in sync with equitable human development. The DCI provides an objective, if comparative, scale of national performance for transparency in public discourse and as an operational tool for decision-making.
If every country pursues the narrowest objective of maximizing its own national economic outputs without paying heed to its environmental emissions performance, then we all lose collectively. However, the negative impacts are largest on the most vulnerable. The wide disparity of efforts and achievement in different jurisdictions points to the important need for quantifying the contribution of each country, place it in context, and establish an effective policy tool to guide future actions and commitments and address the challenge of economic inequality [8].
A transparent accounting of the national climate protection efforts is available through the Climate Change Performance Index (CCPI) highlighting the performance—from the best to the worst—of sixty countries responsible for greater than 90% of the emissions [9]. The CCPI illustrates the disparity of contributions amongst countries allowing pressure to be put on those countries that fail to live up to their commitments (Section 4).
After describing these indices of development and climate impact, Section 5 proposes a balanced combined measure of climate and development to reveal past performance, to compare it internationally, and to indicate a way forward. As detailed in Section 6, a vast literature on the measurement of human development and climate change has emerged over the past thirty years. However, these two fields of academic study and debate remain distinct with convergence remaining elusive and little attention granted to the problems that the two create together, namely, the paradigm of economic growth for human well-being that also in its mandated successes results in profound impacts on the resilience of the global environmental system. The Human Development Index was seminal, published annually since 1990, but it has attracted widespread critique. In Section 2 below, we provide an alternative free of arbitrary parameters embedded in the HDI.
2. The Calibrated Human Development Index H
Human development progress can be described in terms of length of life in good health, access to income, and capacity to grow through education [10]. Over the past 30 years, 1990–2019, the world has seen enormous improvements in key metrics of well-being: growth in life expectancy at birth by 12%; in schooling by 47% serving cultural enrichment; and economic well-being, with Gross National Income per capita (GNI) increasing by 84%. At first glance these percentages might suggest that increasing GNI is worth so much more than increasing life expectancy—but, to the contrary, they show that on the chosen balance of effort GNI was much easier to boost. The world population increased meanwhile by 45%—many more now living much better than at any time in history—placing heavy stress on nature. The consequential impacts of human development places a high demand on the extractive resource base of the environment; high enough to make it necessary to measure it reliably [11].
A calibrated variant of the UNDP’s Human Development Index is the Life Quality Index presented here [12,13]. The recently calibrated human development Index H [12], as the measure of well-being, is the weighted geometric mean of life expectancy L; national income per capita, G; and the index of education E. For the World there has been a steady growth in the expectation S of the years of schooling of the population (age < 25 years) age as well as the mean M of the years of schooling of the population (age > 25 years). The rate of growth of S is naturally higher than that of M, currently (1999–2020) [12] in proportion 0.625:0.325. Reflecting the evident balance of the growth of S and M worldwide, this yields for the present the education indicator E = 0.375S + 0.625M. Similar considerations of the World’s development growth-path trends in (L, G, S)-space [12] and normalization gives H = 0.0207L0.546G0.090E0.364. Development, as apparently preferred, achieved, and revealed by the diachronic changes to the component indices, is what defines the three exponents in H. The weighting parameters are derived from 20 years of statistical data based on development profiles of 185 countries 1997–2017 and projections to 2020. Columns a and b in Table 1 show the 2019 H-values and rankings of 55 countries based on data from the World Bank [14].
3. The Social Cost of Carbon (SCC)
Atmospheric carbon dioxide (CO2), a major greenhouse gas, has been released over five generations through the process of industrialization, placing a hidden cost, a negative externality, upon the world of the present and the future.
The SCC is a comprehensive monetary estimate of the net damage to the global climate change from one metric ton of (CO2) emissions [15]. According to the NAS, all changes to relevant variables (i.e., temperatures, CO2 concentrations, and income) are included, either explicitly or implicitly, in the estimate of the monetized damages. The comprehensive estimates of the damages include variations in net agricultural productivity, damage from increased flood risks, energy use, and nonmarket damages related to human health and services of the natural ecosystems to society. The increased contributions of CO2 emissions today will translate into adverse economic impacts for decades and centuries to come, emphasizing the need to address the challenge of inequities across generations [16].
The literature on (SCC), with foundational contributions by Nordhaus [17,18,19] provides a methodological basis for a quantification of the cost of carbon per tonne of CO2 emissions. The Nordhaus’ model and specific value to be chosen for the cost of carbon has been a subject of rigorous debate and analysis in the literature. The issues are related to the choice of discounting parameters [20,21], treatment of uncertainty and catastrophic risk [22,23,24] and consideration of non-market damages [23,25]. In the NAS assessments, the damages over time are converted into present value estimates through discounting. The present value of damages reflects society’s willingness to trade value in the future for value today. The results of the Integrated Assessment Modules (IAM) provide an estimate of USD 42 per metric ton of CO2 emissions (in 2007 USD at a discount rate of 3 percent). The imputed estimated benefit of a projected reduction of CO2 emissions by 1 million metric tons in 2020, would be USD 42 million [8].
The SCC is a measure of the long-term damage, and the benefit from reduction, of CO2 emissions. Environmental impacts are difficult to assess and highly uncertain, but real. The US Environmental Protection Agency [26] has estimated the SCC as ranging from 11 USD/t in 2015 to 95 USD/t in 2050 (in 2007 USD). The lower value is associated with a higher discount rate. A recent analysis of the views of experts [27] includes a summary of the rate of pure time preference and inequality aversion [28] resulting in a median value of SCC at USD 208 in 2020. (The highest value of SCC in USD per ton of CO2 for 2020 is USD 520 and the lowest USD 17 in the 95th percentile range). Using Nordhaus’ discounting parameters in the DICE model, according to the analysis by Hänsel et al. [27] implies an SCC of USD 82 in 2020 with the median expert path resulting in an SCC of USD 101.
With a discount rate of 2.5%, this study adopts an SCC value of 80 USD/t (2020 USD PPP) plus or minus 50%. Additionally, an analysis of a ‘scenario’ (Section 5.2 below) that could emerge through a series of global cascade of tipping points leading to a new, less habitable, ‘hothouse’ climate state is also documented [6,29].
Table 2 shows the account of atmospheric CO2 for the world, seven major contributing countries, and the rest of the world (TROW). Of the total CO2 emitted since 1750, row 5 in Table 2 [30], not all remains in the atmosphere. It contributes instead to acidification of the oceans, a serious environmental issue, but not directly to climate change. Moore and Braswell [31] estimate the half-life of atmospheric CO2 at 19 to 92 years; assuming here a 50 year half-life means that yearly about 1.4% disappears from the atmosphere, leaving some 98.6% to next year. Rows 7 and 8 show the resulting atmospheric CO2 burden remaining in tons per capita and in 2020 dollars per capita at 80 USD/t. If this externality is considered as a debt to future generations to be paid off over one generation (about 20 years, to year 2040) at 2.5%, then it results in the annual payments per capita in Row 9.
For 2018 the estimated annual emissions per country and per capita are shown in Rows 10–12. The seven high emitters contribute 53% to the total while their combined population is only one quarter of the world total. The total cost per capita and as a percentage of GNI are in Rows 13 and 14. Considered as a debt to future generations it is very significant.
The impacts of atmospheric CO2 are proportional to the SCC, chosen in Table 1 at USD 80 per tonne. Thus, if conditions were to arise such that the SCC increased to USD 520 per tonne, then the cost would be a catastrophic 33% of income worldwide, ranging as high as 70% for Russia and 43% for the USA.
4. The Climate Change Performance Index (CCPI)
The need for a measure of countries’ climate change performance comes from the understanding that the threat of climate change is an existential threat to life on Earth. Mitigation of the risk requires decisive actions to limit global temperature rise to 1.5 °C. The CCPI is monitoring tool for the analysis of countries’ climate protection performance.
As described in detail by Burck [9], the CCPI quantifies the climate protection performance of 50 plus countries that contribute approximately 90% of the global emissions. An explicit goal of the CCPI is to promote transparency and help shape the agenda of international climate politics. The tool allows cross-country comparisons of climate protection efforts and progress. The CCPI uses standardised criteria of measures for the main categories that include Greenhouse Gas Emissions (40% of the score), Renewable Energy (20%), Energy Use (20%), and Climate Policy (20%) [9]. The use of 14 indicators as part of the monitoring tool reflects the dynamics of policy changes, the levels, trends, and an assessment of the compatibility with the World temperature growth limit targets and the national 2030 emission targets. Columns d and e in Table 1 show the 2019 CCPI values and rankings of the countries studied by Burck [9].
5. The Combined Development and Climate Index (DCI)
An important challenge for democratic governance is to strike a balance between the requirements of human welfare—with immediate and short-term implications—and the long view required to ensure the resilience and health of the environment and the stability of the ecosystem. How can the indexes H and CCPI best be combined into one that reflects current human welfare and environmental protection performance? Which of the two is more important? Democratic governments are expected to act in the interest of the people. In the interpretation of this goal, however, governments tend to focus on current welfare as they see it—rather than that of distant hypothetical individuals. This intrinsic short-sightedness derives from that of the demands that citizens place on their governments. It is expected and largely accepted, as has been amply demonstrated in practice, resulting in a greater relevance and consequent greater weight on H that addresses the present state of society.
However, globally there is also an increasing awareness spreading that the present generation has an ethical obligation to leave the world in a condition suitable for countless generations in the future. This growing awareness and commitment to planning for a sustainable future translates into a compelling need for climate mitigation that will create pathways for development that takes into consideration a fuller account of the short-to-medium term support for a healthy environment. There is a moral imperative to place a greater weight on the CCPI than on H.
In summary, H is focused on the present while the CCPI addresses the future. In the event, then, these considerations lead to the conclusion that on balance the two indexes should be given equal weighting and averaged. There is a choice between an arithmetic and a geometric average. Arithmetic averaging is clearly preferable here, from the consideration that the interests of one generation and another are additive.
Noting that the variation of the CCPI is twice that of H, we first standardize both to zero mean and unit standard deviation, denoted by H* and C* before averaging them to form the equal-weight Development and Climate Index DCI shown in Column g in Table 1.
5.1. Additional Considerations to Enhance the DCI
The combined development and climate index include the crucial factors for economic prosperity, environmental quality, and social welfare. Depending on the relative weights, one or the other index would gain more importance. Given the long-lasting effects of climate change, the argument was made that the climate index should have greater weight than the development index. However, the process of assigning weights could be left to legitimate bodies of political decision making enriched by deliberative processes for stakeholder and public participation [32].
Beyond the factors that are included in the indices, two other major criteria for evaluating development programs need to be considered: resilience and distributional equity.
With respect to resilience, critical services must remain functional even when the system is under stress to preserve overall integrity [33]; when resilience is applied to climate change and sustainability, it is the focus on continuation of humane living conditions for current and future generations. Even when resilience does not specify the type of services and functions that need to be maintained or restored rapidly in an emergency (other than their criticality crucial for human societies), sustainability adds purpose to the services: resilient measures should be directed towards humane living conditions. Respecting the boundaries of natural ecosystems and resources, meeting basic needs of all human beings, and ensuring peaceful means of conflict resolution are all integral to resilience [34].
With respect to the development index, resilience adds a side condition to the equation. All input variables need to pass the test of being able to cope with stress situations. Of course, not all stress situations that are imaginable can be covered but a resilience approach would imply that several scenarios of stress situations (natural disasters, political conflicts, pandemics, or economic depressions) can be simulated as they impact on the performance of each variable. These scenarios will not change the index as such but would provide additional measures for making these variables more robust against unpleasant surprises.
With respect to equity and fairness, the issue is basically the distribution of benefits and risks within a given population. Both indices are based on aggregate data: in the extreme, the development index could increase because the richest elite enjoys a much higher quality of life: higher income and higher life expectancy [35,36,37], and higher educational benefits. One would overstress the index when an equity multiplier would be added to each factor. Yet, it is important to add distributional data on all three factors to get a complete picture. Providing policymaking with differentiated information on aggregate welfare, resilience and distributive equity would assist decision makers in making prudent judgments based on explicit weighting of each aspect [38].
To provide an understanding of the impacts of inequality on the overall well-being of populations, two measures are described: the ‘Life Equality Index’ (LEI) focuses on inequality within a country; and the ‘Inequality-adjusted Life Quality Index’ (ILQI) is more suitable for international comparisons of life quality [35,36,37] These objective indexes provide a dual function of integrating impacts on mortality arising from inequality and the measures of income inequality by using the Life Quality Index for sub-populations, focusing on the low-income segments, those below the medians of life expectancy at birth and income together. The Life Equality Index is a useful policy tool for interventions to address local inequality.
5.2. Tipping Points and Highly Uncertain Catastrophic Risks
Based on the IPCC reports, Lenton [6] discusses the greater likelihood of abrupt and irreversible changes in the climate system at lower global average temperatures. Our understanding of observed changes in major ecosystems, prediction of future tipping points and knowledge of existing carbon stores with the potential for releases of CO2 and methane remains incomplete. It is now recognized that the world’s remaining emissions budget for a 50 percent chance of staying within 1.5 °C of warming is only about 500 gigatonnes (Gt) of CO2 and, given the threat from permafrost emissions, methane releases from undersea hydrates and forests, the available carbon budget is drastically reduced [29,39].
Considering our fundamental inability to predict the probabilities and severity of damage that can arise from catastrophic outcomes, one approach is to invest in the strengthening of social infrastructure to enhance resilience. The DCI can provide some guidance. Our analysis of a “bad case scenario” that would put a USD 520 per tonne of CO2 for the SCC highlights the rankings, provides a measure of what could occur, and has probative value for decision-makers to re-direct public investment choices strategically.
6. Discussions
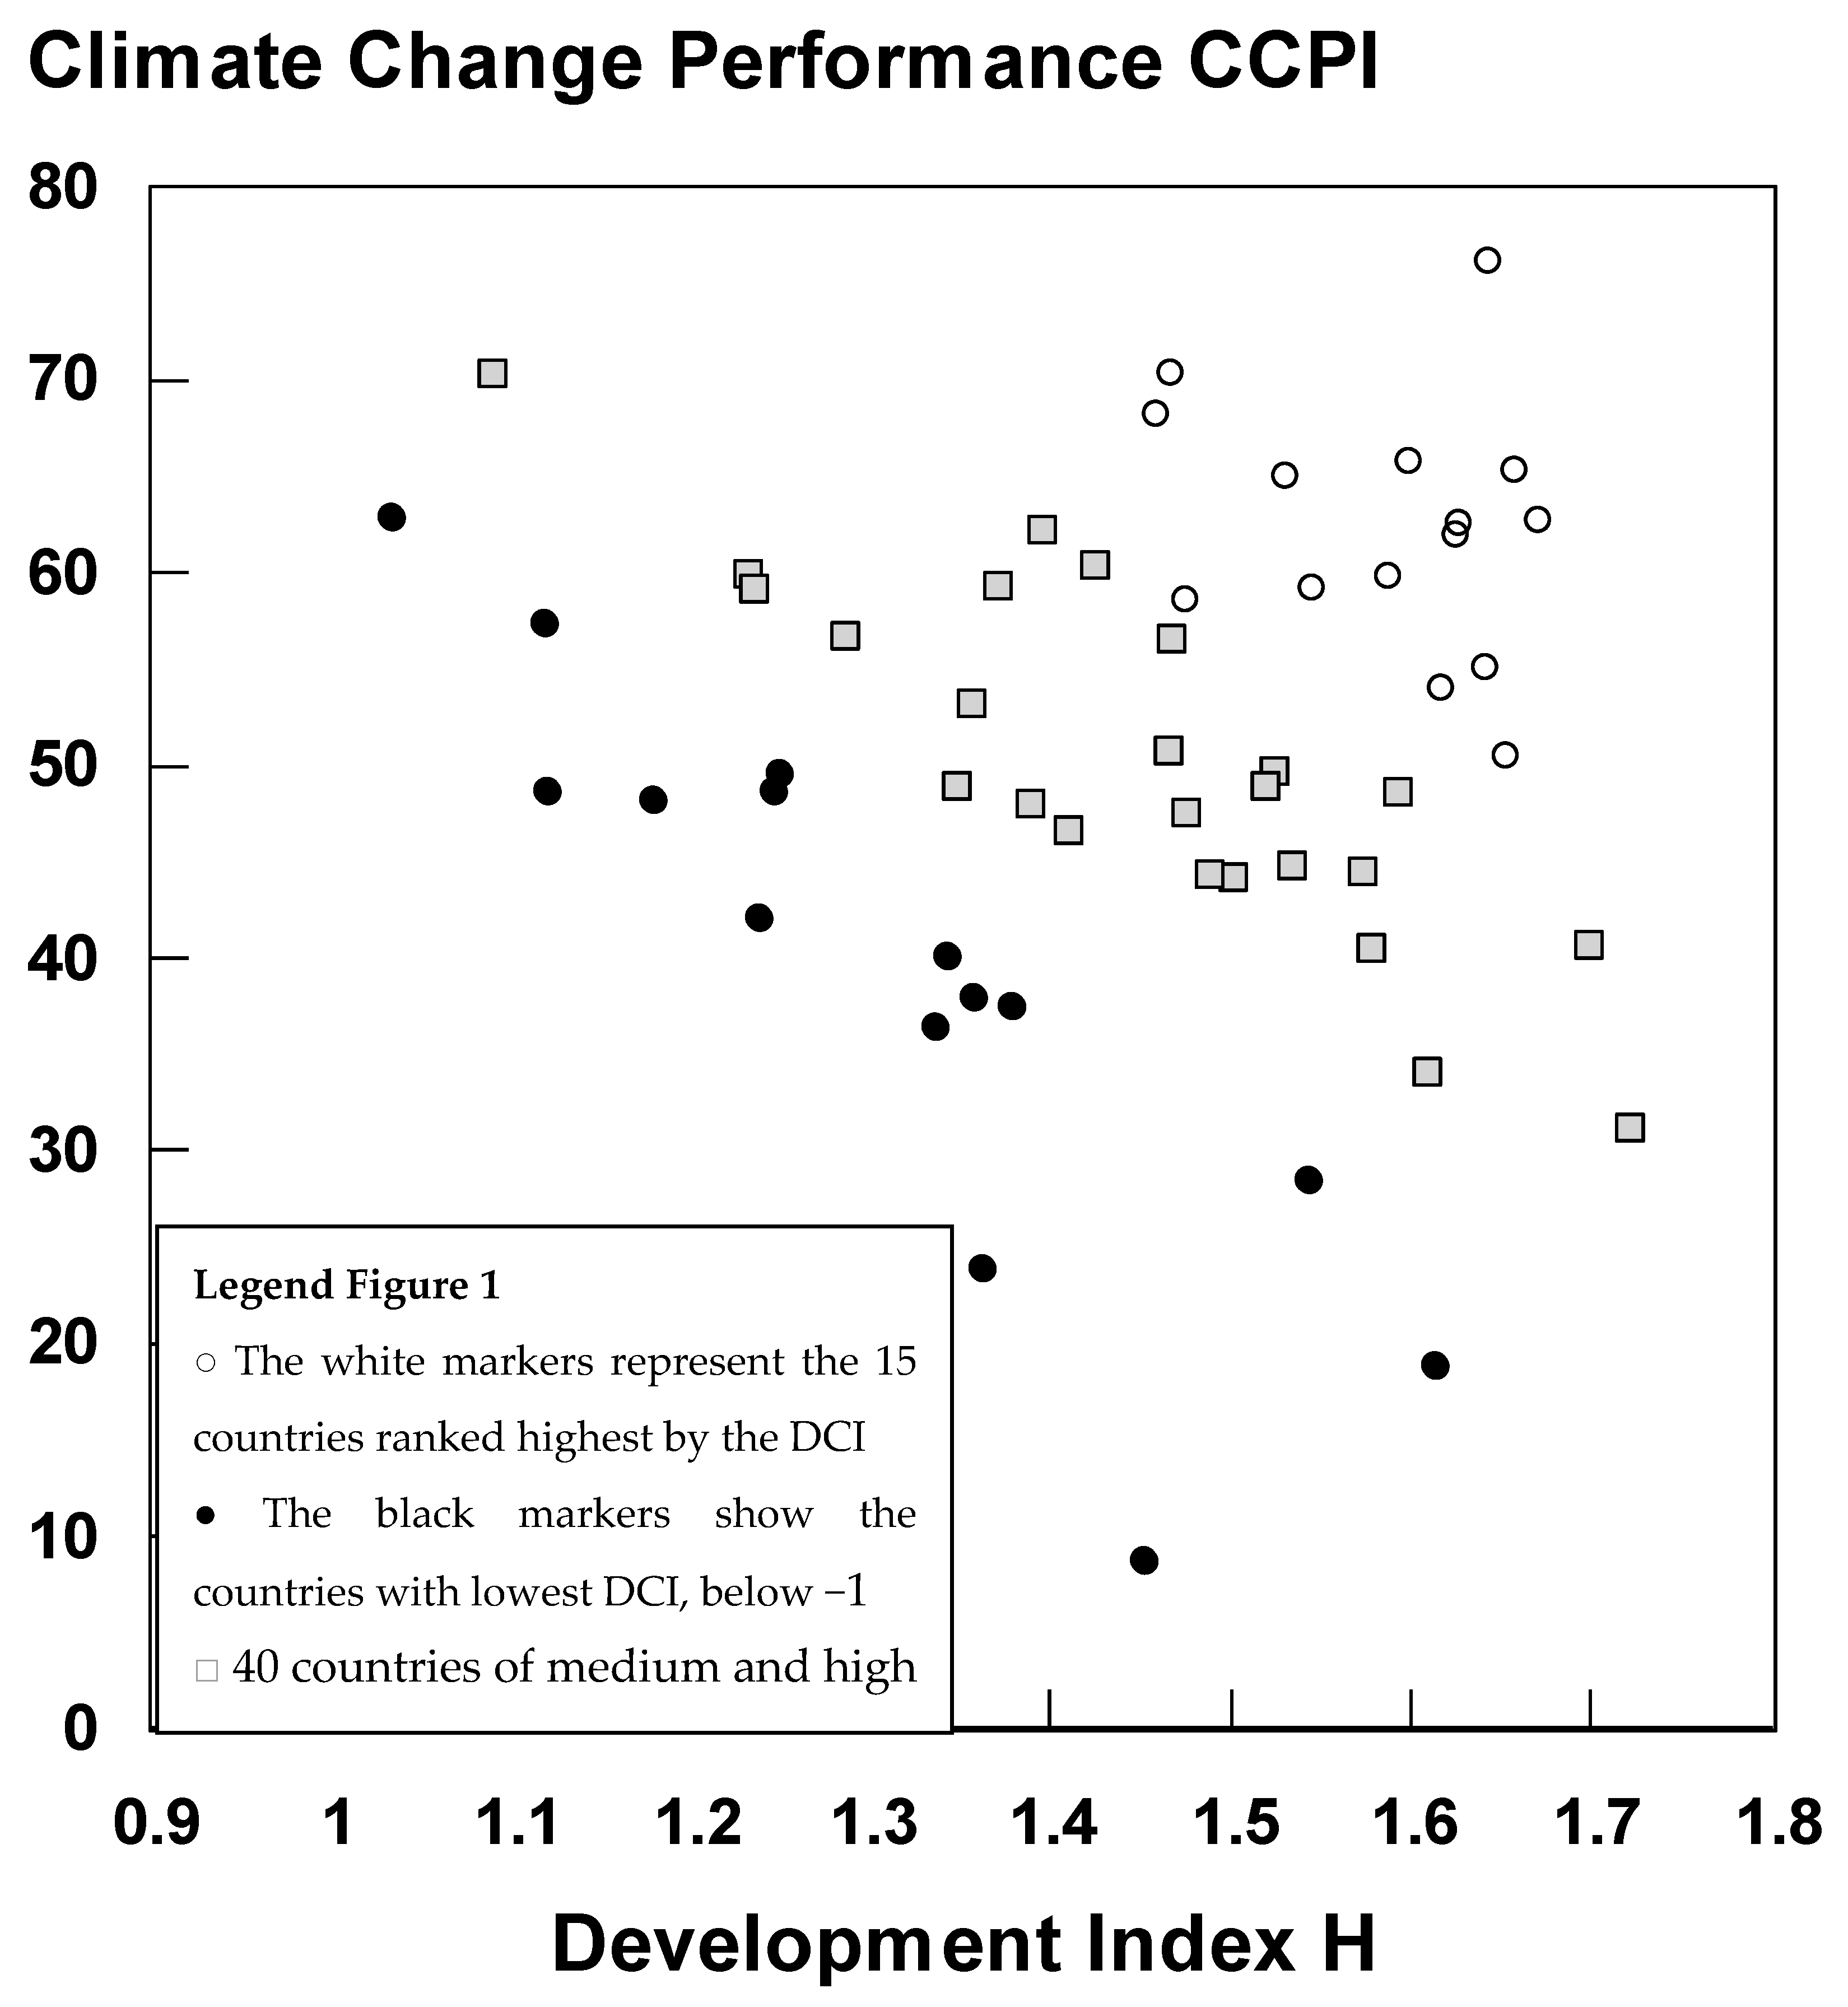
In Figure 1 the CCPI is plotted against the development index H, showing wide differences and no apparent relationship between the measures of human development and climate change performance. The white markers in Figure 1 represent the 15 countries ranked highest by the DCI, a relatively narrow cluster of European countries with H between 1.5 and 1.7 and CCPI from 58 to 77. The 15 black markers show the countries with lowest DCI, below–1. These countries are clearly distinct from the 40 countries of medium and high rank; their DCI range is narrow but their H and CCPI ranges are both very wide, many showing poor performance in development or climate change performance or both. There are some big outliers, notably developed countries that would be expected to show better climate change performance, together with other countries of high climate performance relative to their development.
Figure 1 also provides an illustrative view of possible actions policy makers may undertake to improve national performance given the current location of the country’s placement on the grid. One valuable insight that the composite index provides is the potential for charting directional improvements and the placement of relevant emphasis on human development and climate change interventions. For example, a country’s placement in the bottom right-hand quadrant would suggest a greater need for improvement on public allocations for climate risk interventions—moving upwards from a CCPI of 10–30 towards a CCPI of 60 and higher. Alternatively, a country’s placement in the top left-hand quadrant of Figure 1 would suggest interventions that would improve the development index H towards the right-hand direction from 1.1 to 1.5 and greater.
Table 2 shows that the atmospheric CO2 burden of the past and the present originates mostly with just a few large countries. The governments of these countries bear a major responsibility to their citizens and the world for a sound future development with attenuated climate impact. To the extent that a country is truly democratic, it behooves the citizens to see that their will to conserve our world for future generations is followed by government action, and to accept such action. This is considered further in Section 5.
Table 3 highlights the countries that in one way or another stand out from the rest, the top and bottom quintiles, rising or falling markedly in rank.
What actions do these indexes suggest? The required effort is indicated by our debt to future generations (Table 2, rows 13 and 14), an annual cost item against the performance of each country. This then becomes the basis for investment by that country in cleaner—non-carbon-based—solutions. Therefore, we provide a clear indicator, through the current emission profile of the country—its contribution to the negative externality, a spur for it to invest that amount for the betterment of the global environment.
As shown by the steady growth of Index H, there is a persistent, natural, and healthy attention paid to development. However, climate change, ignored for too long, will affect everyone in the future, perhaps for centuries [16,40]. For many it will be catastrophic [1,2,6]. It is no exaggeration to say that ‘we have sinned’—the past half dozen generations have freely disposed of our carbon waste into the air. No trifle: in value this externality averages almost USD 1000 per person per year, roughly six percent of the world economic product, harming our descendants. Considering this burden as a debt we owe to them; we must accept the ethical duty of compensation. There are some solutions.
In democracies the key actor is the consumer: the taxpayer. Governments must convince her that any climate levy will benefit her directly or through a better future for her offspring. Households can be compensated; one successful example is British Columbia’s carbon levy [41], popular with the public since the objective of lower taxes can be achieved through transfers to households and affected firms. Among the practical options to fulfill the commitments to the Paris agreement, a global carbon market has been identified as an option to reduce the cost by 79% compared with relying on local markets [41].
Another way is to invest the levy in a transparent way to stimulate climate-friendly action with considerations of equity at the core [42,43,44]. Managing the global energy transition through a “cap-and-invest” strategy is one practical approach.
Climate diplomacy can be viewed as investment of political capital to foster global change. The UNFCCC 2015 Paris Accord on climate change and continued high level commitments for national emissions targets and a focus on near-term deadlines has helped to reset the frame for achieving meaningful change. For plans to be implemented effectively, a credible source of financing and the requisite levels of capital to meet investment needs is critical. A large part of the climate change challenge can be met through a rapid transformation of the global energy system. One approach is to break down the global challenge into a “right-size” approach through national initiatives and sharing of best practices globally.
Reductions in carbon emissions need not conflict with the goals of development and an improved quality of life for all people. By 2050, the world population will exceed 9 billion with 2 to 3 billion in poverty. To meet the UN Sustainable Development Goal SDG1 of “No poverty” translates to a near doubling of global primary energy demand to a level of approximately 35–40 TW per year in the 2050–2060 timeframe [45]. Given the dominance of fossil fuels in the current energy supply mix, this would result in a doubling of GHG emissions, a pathway entirely inconsistent with the 2015 Paris Accord.
For a cleaner energy system, the investments requirements in the order of USD 69 trillion over the next 3 decades has been estimated by the IEA ‘Sustainable Development Scenario’ [45].
One favored approach to managing the financial challenge is a carbon tax as a revenue-generating instrument that would yield economic and environmental benefits. A carbon tax has clear limitations from the perspective of political acceptability at levels significantly higher than USD 80 per tonne of emissions and could elicit significant public backlash if the levels approach the USD 200 to USD 500 per tonne range.
An alternative integrated approach [46] for public acceptance and policy stability, is as follows: (i) a ‘Cap and Invest’ mechanism, (ii) an economy-wide tax on final consumption, and (iii) innovation in governance. These three complementary strategies form a coherent framework to raise substantial levels of public funding for investments dedicated to de-carbonization. Innovation in governance is identified as key part of the framework, implemented through an independent institution to build trust and to allow leverage of private sector capital to drive a global transition toward a sustainable energy future.
A government’s capacity to tax is the only source of revenues to provide services required by citizens as part of an implied social contract. The citizens’ consent is the binding glue of accountability between public officials and the expectations of the public. Once widespread acceptance of the threat of climate change and its impacts on future generations has been established through an open public dialogue, the citizen as taxpayer will have an ongoing interest in ensuring that taxes are used for the identified purpose. Thus, a tax on economy-wide consumption is one way to obtain the consent of all citizens to strengthen the base for political discourse and to address this important global challenge—how to decarbonize the economy rapidly. Use of fossil fuels and its impacts on the climate is a case of an intergenerational burden that requires broad social acceptance. The levy is a default mechanism of accountability to dictate action by public officials.
It makes sense for developed countries to support appropriate development at the national level for meeting its reduction targets through an economy-wide levy on consumption, the concept can then be advanced at the regional and global levels. An autonomous Global Energy Fund could serve in this way. Just as there is public acceptance of payments to international organizations such as the World Health Organization or to UNICEF for children’s wellbeing, it will accept expenditures that serve the health and wellbeing through climate action. It does not matter where in the world a tonne of CO2 emission is reduced.
Additionally, any allocation seen to benefit the taxpayer’s local economy while making environmentally beneficial options financially competitive would also be viewed favorably. None of the feasible options come easily. However, our moral obligation to the future of humankind is clear and compelling.
In addition to the results of comparing different countries and providing policies for improving on both indices, the effects on resilience and fairness need to be addressed through additional analysis as an integral part of an implementation strategy at the national level to support policymaking.
7. Conclusions
Climate change performance and human development trajectory, both fundamentally important measures of a country’s environmental, social, and economic well-being place competing demands on resources. Each is best viewed in the light of the other. A measure of country’s overall performance, combined as the Development and Climate Change Performance Index DCI, is derived here from two standardized indexes, the development index H, and the Climate Change Performance Index CCPI. Data are available for 55 countries comprising 65% of the world’s population.
The DCI (Table 1 and Table 3) shows which countries perform markedly better or worse than the rest when considering development and climate change performance together. These countries also cover the widest spectrum from low development with high climate change performance (e.g., Egypt) to the opposite (e.g., Saudi Arabia). In contrast, another quarter of the countries (all European) showing high performance on, and small differences between, both indices indicate a more equitable balance in addressing the needs of present and future populations.
The difference between the standardized indices (Column i in Table 1) suggests for each country in which direction policy change could lead to a balance more like other countries in the study. Table 2 shows that the atmospheric CO2 burden of the past and the present originates primarily with just a few large countries.
The governments of all countries jointly bear a major responsibility to humanity for a sound future development with attenuated climate impact. If the citizens feel a responsibility to leave the world a better place for the next generation in the state, we will wish for ourselves, then the annual economic burden might best be borne through carbon levies managed through a sovereign fund and in co-ordination with a global authority dedicated to climate remediation.
A unique contribution of this paper is to help bridge the gap between the domains of human safety, environmental externalities, and economic drivers: to render a transparent accounting of national performance through management, monitoring, and evaluation of the allocation of scarce resources towards mitigation of the threat of climate risks synchronous with human development goals.
Author Contributions
J.N.: conceptualization, writing original draft and primary role editing, revisions; social cost of carbon, validation of analysis; N.L.: data development, methodology and index, validation, O.R.: writing inputs, sustainability science & integration of perspectives; H.J.S. writing, editing and inputs on climate science and risk. All authors have read and agreed to the published version of the manuscript.
Funding
This research received no external funding.
Institutional Review Board Statement
Not applicable.
Informed Consent Statement
Not applicable.
Data Availability Statement
The data sources are as cited.
Conflicts of Interest
The authors declare no conflict of interest.
References
- Intergovernmental Panel on Climate Change (IPCC). Managing the Risks of Extreme Events and Disasters to Advance Climate Change Adaptation; Field, C.B., Barros, V., Stocker, T.F., Qin, D., Dokken, D.J., Ebi, K.L., Mastandrea, M.D., Mach, K.J., Plattner, G.-K., Allen, S.K., et al., Eds.; Cambridge University Press: Cambridge, UK, 2012. [Google Scholar]
- Intergovernmental Panel on Climate Change (IPCC). Climate Change 2014: Impacts, Adaptation, and Vulnerability; Contribution of Working Group II to the Fifth Assessment Report of the Intergovernmental Panel on Climate Change; Field, C.B., Barros, V.R., Dokken, D.J., Ebi, K.L., Mastandrea, M.D., Mach, K.J., Bilir, T.E., Chatterjee, M., et al., Eds.; Cambridge University Press: Cambridge, UK, 2014; pp. 1–32. [Google Scholar]
- Intergovernmental Panel on Climate Change (IPCC). Special Report on Global Warming of 1.5 °C; Masson-Delmotte, V., Allen, M.R., Broome, J., Cramer, W., Christ, R., Eds.; IPCC Secretariat: Geneva, Switzerland, 2018. [Google Scholar]
- World Meteorological Organization (WMO). Valuing Weather and Climate: Economic Assessment of Meteorological and Hydrological Services; WMO-No. 1153; WMO: Geneva, Switzerland, 2015; 308p. [Google Scholar]
- Vinke, K.; Gabrysch, S.; Paoletti, E.; Rockström, J.; Schellnhuber, H. Corona and the climate: A comparison of two emergencies. Glob. Sustain. 2020, 3, e25. [Google Scholar] [CrossRef]
- Lenton, T.M.; Rockström, J.; Gaffney, O.; Rahmstorf, S.; Richardson, K.; Steffen, W.; Schellnhuber, H.J. Climate tipping points—Too risky to bet against. Nature 2019, 575, 592–595. [Google Scholar] [CrossRef]
- Linkov, I.; Bridges, T.S.; Creutzig, F.; Decker, J.; Fox-Lent, C.; Kröger, W.; Lambert, J.H.; Levermann, A.; Montreuil, B.; Nathwani, J.; et al. Changing the resilience paradigm. Nat. Clim. Chang. 2014, 4, 407–409. [Google Scholar] [CrossRef]
- Diffenbaugh, N.; Burke, M. Global warming has increased global economic inequality. Proc. Natl. Acad. Sci. USA 2019, 116, 9808–9813. [Google Scholar] [CrossRef] [PubMed] [Green Version]
- Burck, J.; Marten, F.; Bals, C. Climate Change Performance Index: Background and Methodology; Germanwatch: Bonn, Germany, 2021. [Google Scholar]
- United Nations Development Programme (UNDP). Human Development Report 1990; Oxford University Press: Oxford, UK, 1990. [Google Scholar]
- United Nations Development Programme (UNDP). Human Development Data (1990–2018); UN: New York, NY, USA, 2019. [Google Scholar]
- Lind, N. A development of the Human Development Index. Soc. Indic. Res. 2019, 146, 409–423. [Google Scholar] [CrossRef]
- Nathwani, J.; Lind, N.; Pandey, M. Engineering Decisions for Life Quality; Springer: London, UK, 2009. [Google Scholar]
- The World Bank. World Bank Open Data; World Bank: Washington, DC, USA, 2018. [Google Scholar]
- National Academies of Sciences (NAS), Engineering and Medicine. Assessment of Approaches to Updating the Social Cost of Carbon; Phase 1 Report on a Near-Term Update; UN: New York, NY, USA, 2016. [Google Scholar]
- King, A.; Harrington, L. The Inequality of Climate Change from 1.5 to 2 °C of Global Warming. Geophys. Res. Lett. 2018, 45, 5030–5033. [Google Scholar] [CrossRef]
- Nordhaus, W. An Optimal Transition Path for Controlling Greenhouse Gases. Science 1992, 258, 1315–1319. [Google Scholar] [CrossRef]
- Nordhaus, W. Evolution of modeling of the economics of global warming: Changes in the DICE model, 1992–2017. Clim. Chang. 2018, 148, 623–640. [Google Scholar] [CrossRef] [Green Version]
- Nordhaus, W. Climate Change: The Ultimate Challenge for Economics. Am. Econ. Rev. 2019, 109, 1991–2014. [Google Scholar] [CrossRef]
- National Academies of Sciences (NAS), Engineering, and Medicine. Valuing Climate Damages: Updating Estimation of the Social Cost of Carbon Dioxide; The National Academies Press: Washington, DC, USA, 2017. [Google Scholar]
- Stern, N. The Economics of Climate Change; Cambridge University Press: Cambridge, UK, 2007. [Google Scholar]
- Crost, B.; Traeger, C. Optimal CO2 mitigation under damage risk valuation. Nat. Clim. Chang. 2014, 4, 631–636. [Google Scholar] [CrossRef]
- Daniel, K.; Litterman, R.; Wagner, G. Declining CO2 price paths. Proc. Natl. Acad. Sci. USA 2019, 116, 20886–20891. [Google Scholar] [CrossRef] [Green Version]
- Weitzman, M. On Modeling and Interpreting the Economics of Catastrophic Climate Change. Rev. Econ. Stat. 2009, 91, 1–19. [Google Scholar] [CrossRef]
- Sterner, T.; Persson, U. An Even Sterner Review: Introducing Relative Prices into the Discounting Debate. Rev. Environ. Econ. Policy 2008, 2, 61–76. [Google Scholar] [CrossRef] [Green Version]
- United States Environmental Protection Agency (USA EPA). Social Cost of Carbon; EPA Fact Sheet; US EPA: Washington, DC, USA, 2016.
- Hänsel, M.; Drupp, M.A.; Johansson, D.J.A.; Nesje, F.; Azar, C.; Freeman, M.C.; Groom, B.; Sterner, T. Climate economics support for the UN climate targets. Nat. Clim. Chang. 2020, 10, 781–789. [Google Scholar] [CrossRef]
- Drupp, M.; Freeman, M.; Groom, B.; Nesje, F. Discounting Disentangled. Am. Econ. J. Econ. Policy 2018, 10, 109–134. [Google Scholar] [CrossRef] [Green Version]
- Steffen, W.; Rockström, J.; Richardson, K.; Lenton, T.M.; Folke, C.; Liverman, D.; Summerhayes, C.P.; Barnosky, A.D.; Cornell, S.E.; Crucifix, M.; et al. Trajectories of the Earth System in the Anthropocene. Proc. Natl. Acad. Sci. USA 2018, 115, 8252–8259. [Google Scholar] [CrossRef] [Green Version]
- Carbon Dioxide Information Analysis Center (CDIAC). Global, Regional, and National Fossil Fuel CO2 Emissions; CDIAC: Canberra, Australia, 2018.
- Moore, B.; Braswell, B. The lifetime of excess atmospheric carbon dioxide. Glob. Biogeochem. Cycles 1994, 8, 23–38. [Google Scholar] [CrossRef] [Green Version]
- Renn, O.; Schweizer, P.-J. Inclusive Governance for Energy Policy Making: Conceptual Foundations, Applications, and Lessons Learned. In The Role of Public Participation in Energy Transitions; Renn, O., Ulmer, F., Decker, A., Eds.; Elsevier Academic Press: New York, NY, USA, 2020; pp. 39–79. [Google Scholar]
- Renn, O. The Call for Sustainable and Resilient Policies in the COVID-19 Crisis: How Can They Be Interpreted and Implemented? Sustainability 2020, 12, 6466. [Google Scholar] [CrossRef]
- Robertson, M. Sustainability Principles and Practice; Taylor & Francis Group: Boca Raton, FL, USA, 2017. [Google Scholar]
- Lind, N. Objective Inequality Indexes Joining Income with Life Expectancy Through the Life Quality Index of Sub-populations. Soc. Indic. Res. 2020. [Google Scholar] [CrossRef]
- World Inequality Report. World Inequality Report 2018, Table 2.4.1; World Inequality Lab: Paris, France, 2019. [Google Scholar]
- World Inequality Database. World Inequality Database 2018; WID: Paris, France, 2018. [Google Scholar]
- Lucas, P.; Wilting, H.; Hof, A.; van Vuuren, D. Allocating planetary boundaries to large economies: Distributional consequences of alternative perspectives on distributive fairness. Glob. Environ. Chang. 2020, 60, 102017. [Google Scholar] [CrossRef]
- Rogelj, J.; Forster, P.; Kriegler, E.; Smith, C.; Séférian, R. Estimating and tracking the remaining carbon budget for stringent climate targets. Nature 2019, 571, 335–342. [Google Scholar] [CrossRef] [PubMed] [Green Version]
- Hallegatte, S.; Rozenberg, J. Climate change through a poverty lens. Nat. Clim. Chang. 2017, 7, 250–256. [Google Scholar] [CrossRef]
- The Economist. The World Urgently Needs to Expand Its Use of Carbon Prices; The Economist Group: London, UK, 2020; pp. 56–59. [Google Scholar]
- Pandey, M.; Nathwani, J. Measurement of socio-economic inequality using the Life-Quality Index. Soc. Indic. Res. 1996, 39, 187–202. [Google Scholar] [CrossRef]
- Piketty, T.; Saez, E. Inequality in the long run. Science 2014, 344, 838–843. [Google Scholar] [CrossRef] [PubMed]
- Ravallion, M. Troubling trade-offs in the Human Development Index. J. Dev. Econ. 2012, 99, 201–209. [Google Scholar] [CrossRef] [Green Version]
- IEA. World Energy Outlook 2017; OECD/International Energy Agency: Paris, France, 2017; Available online: http://www.iea.org/weo2017/ (accessed on 21 February 2021).
- Nathwani, J.; Ng, A. Chapter 4 “A Cap and Invest” Strategy for Managing the Intergenerational Burdens of Financing Energy Transitions. In Handbook of Green Finance: Energy Security and Sustainable Development; Sachs, J., Thye, W.W., Yoshino, N., Taghizadeh-Hesary, F., Eds.; Springer: Tokyo, Japan, 2019; pp. 63–80. [Google Scholar]
Figure 1.
Climate Change Performance Index (CCPI) 2019 vs. Development Index H 2019 for the 55 countries in Table 1.
Figure 1.
Climate Change Performance Index (CCPI) 2019 vs. Development Index H 2019 for the 55 countries in Table 1.


Table 1.
Indexes and Ranks of 55 Countries in the study.
| a | b | c | d | e | f | g | h | i | j | |
|---|---|---|---|---|---|---|---|---|---|---|
| Country | H 2019 | H Rank | H* Stdd. | CCPI 2019 | CCPI Rank | C* Stdd. | DCI = H* + C* | DCI Rank | C*-H* | C*-H* Rank |
| Sweden | 1.633 | 7 | 1.080 | 76.28 | 1 | 1.932 | 3.013 | 1 | 0.852 | 16 |
| Switzerland | 1.670 | 4 | 1.298 | 65.42 | 6 | 1.116 | 2.414 | 2 | −0.182 | 28 |
| Norway | 1.697 | 2 | 1.452 | 62.80 | 9 | 0.919 | 2.372 | 3 | −0.533 | 36 |
| United Kingdom | 1.606 | 12 | 0.920 | 65.92 | 5 | 1.154 | 2.074 | 4 | 0.234 | 23 |
| Denmark | 1.643 | 6 | 1.136 | 61.96 | 12 | 0.856 | 1.992 | 5 | −0.279 | 32 |
| Finland | 1.602 | 13 | 0.898 | 62.61 | 10 | 0.905 | 1.803 | 6 | 0.008 | 25 |
| Lithuania | 1.476 | 28 | 0.155 | 70.47 | 3 | 1.496 | 1.651 | 7 | 1.340 | 9 |
| Luxembourg | 1.610 | 11 | 0.940 | 59.92 | 15 | 0.703 | 1.643 | 8 | −0.237 | 31 |
| Malta | 1.523 | 22 | 0.430 | 65.06 | 7 | 1.089 | 1.519 | 9 | 0.660 | 19 |
| Germany | 1.648 | 5 | 1.167 | 55.18 | 23 | 0.347 | 1.514 | 10 | −0.820 | 43 |
| Latvia | 1.450 | 31 | −0.001 | 68.31 | 4 | 1.333 | 1.333 | 11 | 1.334 | 10 |
| Netherlands | 1.630 | 9 | 1.062 | 54.11 | 24 | 0.267 | 1.328 | 12 | −0.795 | 42 |
| France | 1.563 | 18 | 0.664 | 59.30 | 17 | 0.657 | 1.321 | 13 | −0.008 | 26 |
| Italy | 1.519 | 23 | 0.404 | 58.69 | 19 | 0.611 | 1.015 | 14 | 0.206 | 24 |
| Belgium | 1.619 | 10 | 0.996 | 50.63 | 27 | 0.005 | 1.002 | 15 | −0.991 | 46 |
| Portugal | 1.443 | 32 | −0.042 | 60.54 | 13 | 0.750 | 0.708 | 16 | 0.792 | 17 |
| Austria | 1.591 | 16 | 0.829 | 48.78 | 32 | −0.134 | 0.695 | 17 | −0.963 | 45 |
| Croatia | 1.415 | 34 | −0.203 | 62.39 | 11 | 0.889 | 0.682 | 18 | 1.092 | 11 |
| Ireland | 1.688 | 3 | 1.401 | 40.84 | 44 | −0.730 | 0.671 | 19 | −2.131 | 51 |
| Slovakia | 1.473 | 29 | 0.136 | 56.61 | 22 | 0.454 | 0.590 | 20 | 0.319 | 21 |
| New Zealand | 1.599 | 14 | 0.879 | 44.61 | 40 | −0.447 | 0.432 | 21 | −1.326 | 48 |
| Czechia | 1.532 | 21 | 0.486 | 49.73 | 28 | −0.062 | 0.423 | 22 | −0.548 | 37 |
| Spain | 1.538 | 20 | 0.516 | 48.97 | 31 | −0.120 | 0.397 | 23 | −0.636 | 39 |
| Romania | 1.383 | 35 | −0.395 | 59.42 | 16 | 0.666 | 0.270 | 24 | 1.061 | 13 |
| Greece | 1.487 | 27 | 0.248 | 50.86 | 26 | 0.022 | 0.240 | 25 | −0.195 | 30 |
| Slovenia | 1.553 | 19 | 0.610 | 44.90 | 39 | −0.425 | 0.184 | 26 | −1.035 | 47 |
| Japan | 1.593 | 15 | 0.842 | 40.63 | 45 | −0.746 | 0.096 | 27 | −1.588 | 50 |
| Australia | 1.710 | 1 | 1.535 | 31.27 | 51 | −1.449 | 0.085 | 28 | −2.984 | 53 |
| Poland | 1.493 | 26 | 0.253 | 47.59 | 27 | −0.223 | 0.029 | 29 | −0.476 | 35 |
| Cyprus | 1.511 | 24 | 0.360 | 44.34 | 42 | −0.467 | −0.108 | 30 | −0.827 | 44 |
| Estonia | 1.501 | 25 | 0.302 | 44.37 | 41 | −0.465 | −0.163 | 31 | −0.767 | 40 |
| Belarus | 1.358 | 40 | −0.544 | 53.31 | 25 | 0.206 | −0.338 | 32 | 0.751 | 18 |
| Hungary | 1.433 | 33 | −0.100 | 46.79 | 38 | −0.283 | −0.383 | 33 | −0.184 | 29 |
| Mexico | 1.295 | 44 | −0.914 | 56.82 | 21 | 0.470 | −0.444 | 34 | 1.384 | 8 |
| Ukraine | 1.243 | 50 | −1.216 | 60.09 | 14 | 1.716 | −0.500 | 35 | 1.932 | 4 |
| Brazil | 1.247 | 49 | −1.164 | 59.29 | 18 | 0.656 | −0.538 | 36 | 1.849 | 5 |
| Argentina | 1.377 | 37 | −0.429 | 49.01 | 30 | −0.117 | −0.546 | 37 | 0.313 | 22 |
| Morocco | 1.089 | 54 | −2.126 | 70.48 | 2 | 1.496 | −0.630 | 38 | 3.623 | 1 |
| Korea(Rep, of) | 1.570 | 17 | 0.707 | 28.53 | 52 | −1.655 | −0.949 | 39 | −2.362 | 52 |
| China | 1.253 | 47 | −1.162 | 49.60 | 29 | −0.072 | −1.234 | 40 | 1.089 | 12 |
| Thailand | 1.263 | 46 | −1.104 | 48.71 | 33 | −0.139 | −1.243 | 41 | 0.965 | 14 |
| Armenia | 1.264 | 45 | −1.094 | 48.11 | 36 | −0.184 | −1.279 | 42 | 0.910 | 15 |
| United States | 1.630 | 8 | 1.062 | 18.82 | 54 | −2.385 | −1.323 | 43 | −3.447 | 55 |
| Egypt | 1.135 | 53 | −1.854 | 57.49 | 20 | 0.521 | −1.334 | 44 | 2.375 | 3 |
| Russia | 1.379 | 36 | −0.420 | 37..59 | 48 | −0.975 | −1.395 | 45 | −0.555 | 38 |
| Malaysia | 1.368 | 39 | −0.481 | 38.08 | 47 | −0.938 | −1.418 | 46 | −0.457 | 34 |
| Turkey | 1.334 | 43 | −0.681 | 40.22 | 46 | −0.777 | −1.458 | 47 | −0.096 | 27 |
| India | 1.040 | 55 | −2.416 | 62.93 | 8 | 0.929 | −1.487 | 48 | 3.348 | 2 |
| Bulgaria | 1.376 | 38 | −0.439 | 34.26 | 50 | −1.225 | −1.663 | 49 | −1.786 | 41 |
| Kazakhstan | 1.345 | 42 | −0.618 | 36.47 | 49 | −1.059 | −1.676 | 50 | −0.441 | 33 |
| Algeria | 1.250 | 48 | −1.178 | 42.10 | 43 | −0.636 | −1.814 | 51 | 0.542 | 20 |
| South Africa | 1.151 | 51 | −1.762 | 48.25 | 35 | −0.174 | −1.936 | 52 | 1.588 | 7 |
| Indonesia | 1.141 | 52 | −1.819 | 48.68 | 34 | −0.141 | −1.960 | 53 | 1.678 | 6 |
| Iran | 1.351 | 41 | −0.584 | 23.92 | 53 | −2.000 | −2.584 | 54 | −1.417 | 49 |
| Saudi Arabia | 1.456 | 30 | 0.038 | 8.82 | 55 | −3.136 | −3.098 | 55 | −3.174 | 54 |
Table 2.
Estimates of the Social Cost of Atmospheric CO2.
| 1 | Country | AUS | CDN | CHN | DEU | GBR | RUS | USA | TROW | World |
|---|---|---|---|---|---|---|---|---|---|---|
| 2 | Population 2020, M | 26 | 38 | 1405 | 83 | 67 | 147 | 331 | 5704 | 7800 |
| 3 | 2018 GNI, B$2017PPP | 1200 | 1790 | 21,152 | 4573 | 3036 | 3892 | 20,442 | 69,823 | 125,887 |
| 4 | 2018 GNI per capita, %2017PPP | 48,024 | 48,291 | 15,187 | 55,155 | 45,686 | 25,962 | 62,513 | 12,241 | 16,582 |
| 5 | (Total emitted 1751-2018,Mt:) | 17,782 | 32,518 | 210,201 | 91,300 | 77,449 | 100,720 | 404,769 | 677,077 | 116,1817 |
| 6 | remaining in atmosphere 2018, Mt | 12,527 | 21,204 | 171,476 | 47,934 | 33,076 | 71,955 | 241,583 | 466,933 | 1,066,727 |
| 7 | Ibid., t per capita | 488 | 555 | 122 | 577 | 495 | 491 | 731 | 82 | 137 |
| 8 | Ibid., $PPP total at $80/t: | 39,018 | 44,385 | 9764 | 46,133 | 39,613 | 39,248 | 58,476 | 6549 | 10,941 |
| 9 | Ibid., 30yr amortized at 2.5%pa, $/yr: | 1862 | 2122 | 467 | 2205 | 1894 | 1876 | 2795 | 313 | 523 |
| 10 | Annual 2018, Mt/yr | 420 | 568 | 10,065 | 759 | 379 | 1711 | 5416 | 17,254 | 36,573 |
| 11 | ibid., t/yr per capita: | 16 | 15 | 7 | 9 | 6 | 12 | 16 | 3 | 5 |
| 12 | Ibid., $PPP total at $80/t | 1309 | 1190 | 573 | 730 | 454 | 933 | 1311 | 242 | 375 |
| 13 | Total annual costper capita at $80/t | 3174 | 3311 | 1040 | 2936 | 2347 | 2809 | 4106 | 555 | 898 |
| 14 | Ibid., in % of 2017 GNI per capita: | 7% | 7% | 7% | 5% | 5% | 11% | 7% | 5% | 5% |
Table 3.
Countries most advancing and most falling back when ranked by the development and Climate Index (DCI).
Table 3.
Countries most advancing and most falling back when ranked by the development and Climate Index (DCI).
| Countries Advancing: | Countries Falling Back: | ||||||
|---|---|---|---|---|---|---|---|
| H Rank | DCI Rank | Rank Advance | H Rank | DCI Rank | Rank Fallback | ||
| Lithuania | 28 | 7 | 21 | United States | 8 | 43 | 31 |
| Latvia | 31 | 11 | 20 | Saudi Arabia | 30 | 55 | 26 |
| Portugal | 32 | 16 | 16 | Australia | 1 | 28 | 23 |
| Croatia | 34 | 18 | 16 | Korea (Rep, of) | 17 | 39 | 22 |
| Morocco | 54 | 38 | 16 | Ireland | 3 | 19 | 16 |
| Ukraine | 50 | 35 | 15 | Japan | 15 | 27 | 13 |
| Malta | 22 | 9 | 13 | Kazakhstan | 42 | 50 | 12 |
| Brazil | 49 | 36 | 10 | Iran | 41 | 54 | 11 |
| Romania | 35 | 24 | 16 | Bulgaria | 38 | 49 | 10 |
| Mexico | 44 | 34 | 10 | Russia | 36 | 45 | 9 |
| Italy | 23 | 14 | 9 | Malaysia | 39 | 46 | 4 |
Publisher’s Note: MDPI stays neutral with regard to jurisdictional claims in published maps and institutional affiliations. |
© 2021 by the authors. Licensee MDPI, Basel, Switzerland. This article is an open access article distributed under the terms and conditions of the Creative Commons Attribution (CC BY) license (https://creativecommons.org/licenses/by/4.0/).
Share and Cite
MDPI and ACS Style
Nathwani, J.; Lind, N.; Renn, O.; Schellnhuber, H.J. Balancing Health, Economy and Climate Risk in a Multi-Crisis. Energies 2021, 14, 4067. https://0-doi-org.brum.beds.ac.uk/10.3390/en14144067
AMA Style
Nathwani J, Lind N, Renn O, Schellnhuber HJ. Balancing Health, Economy and Climate Risk in a Multi-Crisis. Energies. 2021; 14(14):4067. https://0-doi-org.brum.beds.ac.uk/10.3390/en14144067
Chicago/Turabian StyleNathwani, Jatin, Niels Lind, Ortwin Renn, and Hans Joachim Schellnhuber. 2021. "Balancing Health, Economy and Climate Risk in a Multi-Crisis" Energies 14, no. 14: 4067. https://0-doi-org.brum.beds.ac.uk/10.3390/en14144067
Note that from the first issue of 2016, this journal uses article numbers instead of page numbers. See further details here.