
Modeling and Analysis of Heat Dissipation for Liquid Cooling Lithium-Ion Batteries
by
 , ,
, ,
Jiabin Duan
1, 
Jiapei Zhao
1,
Xinke Li
1,
Satyam Panchal
2 ,
,
Jinliang Yuan
1,* ,
,
Roydon Fraser
2 and
Michael Fowler
3
1
Faculty of Maritime and Transportation, Ningbo University, Ningbo 315211, China
2
Department of Mechanical and Mechatronics Engineering, University of Waterloo, 200 University Avenue West, Waterloo, ON N2L 3G1, Canada
3
Department of Chemical Engineering, University of Waterloo, 200 University Avenue West, Waterloo, ON N2L 3G1, Canada
*
Author to whom correspondence should be addressed.
Energies 2021, 14(14), 4187; https://0-doi-org.brum.beds.ac.uk/10.3390/en14144187
Submission received: 15 June 2021
/
Revised: 2 July 2021
/
Accepted: 9 July 2021
/
Published: 11 July 2021
Abstract
:To ensure optimum working conditions for lithium-ion batteries, a numerical study is carried out for three-dimensional temperature distribution of a battery liquid cooling system in this work. The effect of channel size and inlet boundary conditions are evaluated on the temperature field of the battery modules. Based on the thermal behavior of discharging battery obtained experimental measurements, two temperature control strategies are proposed and studied. The results show that the channel width of the cooling plates has a great influence on the maximum temperature in the battery module. It is also revealed that increasing inlet water flow rate can significantly improve the heat transfer capacity of the battery thermal management system, while the relationship between them is not proportional. Lowering the inlet temperature can reduce the maximum temperature predicted in the battery module significantly. However, this will also lead to additional energy consumed by the cooling system. It is also found that the Scheme 5 among various temperature control strategies can ensure the battery pack working in the best temperature range in different depths of discharge. Compared with the traditional one with a given flow rate, the parasitic energy consumption in Scheme 5 can be reduced by around 80%.
1. Introduction
The global energy demand continues to increase with the economy growth. At present, fossil fuels (e.g., oil, natural gas and coal) account for around 80% of the world’s energy consumption [1], which has caused serious environmental issues, e.g., global warming. Lithium-ion battery has been considered as the primary choice of clean power temperature due to its advantages, such as high energy density and long service life [2].
In the battery design process, Kukay et al. [3] improved the cyclic performance of the thick cathodes and reduced the charge transfer resistance in the electrode by adjusting the pH of the dispersion. Yamada [4] introduced an electrolyte design using the concept of concentrated electrolytes. Wei et al. [5] proposed a novel parameterization method to compensate for the noise-induced biases of model identification, which is very useful for evaluating state of charge and efficient utilization of a battery system. However, the lithium-ion batteries are sensitive to working temperature. The optimum operating temperature range is around 20–40 °C, and the temperature difference between the batteries in a battery pack should be controlled within 5 °C [6,7]. Extremely high or low working temperature not only increases attenuation rate of the lithium-ion batteries [8], but also results in a series of safety problems, such as thermal runway [9], electrolyte fire or explosions. Therefore, it is essential to employ a thermal management system during the charging and discharging process, particularly for big size battery packs.
At present, there are various thermal management approaches developed for the lithium-ion batteries including air cooling, phase change material cooling, heat pipe cooling and liquid cooling. Pesaran [10] proposed the air-cooling thermal management design, in which the air-cooling method with low energy density is studied, and the issues of using air as a cooling medium in battery module are observed, such as the limited heat dissipation capacity, large disturbance from external changing of air-flow rate and potential noise phenomena. Since the year 2000, when the phase change material (PCM) was first used for thermal management of the lithium-ion batteries [11], it has attracted much research attention on low thermal conductivity [12] and leakage issues [13]. In spite of the advantage of high latent heat of PCM, the PCM-based thermal management system is limited to laboratory-level characterization and has not been applied in real EV/HEV battery packs. The heat pipe technology works on the principle of evaporative heat transfer and has been widely used in heat storage systems. Wu et al. [14] first studied the thermal dissipation system of the lithium-ion battery based on the heat pipe technology in 2002 and compared thermal performance of natural convection, forced convection and heat pipe cooling methods during the battery discharging process. Their results show that the surface temperature of the battery can be reduced to around 32 °C by the heat pipe cooling method. A subsequent study [15] has also proved that the heat pipe cooling has a great potential being applied in BTMS. However, due to a small contact area between the battery and the heat pipe, as well as large volume requirement by the concerned system, it is not suitable to use this technology as the main heat dissipation method at present. Compared with the above cooling methods, liquid cooling is more efficient in terms of temperature control due to its high thermal capacity. Therefore, liquid cooling systems have been considered as a better choice for BTMS, especially for batteries with large energy densities.
Among the various liquid cooling methods, indirect-contact cooling is more practical than direct-contact one [16]. The cooling media (such as water, glycol, etc.) for indirect-contact cooling has a smaller viscosity and provides a larger flow rate for cooling. The indirect-contact cooling system consists of integrated channels and coolants in the cooling plates. The heat generated from the battery is transferred through a metal plate to the flowing coolant, which is then carried away via an electric pump. There have been many studies on the influence of the channel structures on the cooling performances or the battery temperature distribution [17,18], in which the main attention is focused on the optimum parameters identified for a specific cooling system [19,20]. Deng et al. [21] studied the influence on temperature distribution in a BTMS, in terms of the number of the channels, channel layout and inlet temperature of the snake-shaped cooling plates. It is predicted that the channel layout in the channel main flowing direction had the most effective cooling performance for the serpentine cooling plate, and it is found that this design could reduce the maximum temperature by 26 °C. Patil et al. [22] studied U-turn type microchannel cooling plate. It is found that the cooling plate has a better cooling performance with surface area coverage ratio = 0.75 and channel hydraulic diameter = 1.54 mm.
Zhang et al. [23] added flexible graphite between the battery and the liquid-cooled plate. It was found that the maximum temperature difference on the battery surface decreased from 7 °C to 2 °C, indicating that the use of the flexible graphite can significantly improve the temperature distribution uniformity within the battery pack. Huang et al. [24] found that both the inlet mass flow rate and temperature have a large influence on the temperature field in the battery pack. However, with an increase of the flow rate, the cooling capacity brought by a unit inlet flow rate was reduced. It was also found that the response time of the cooling system lagged behind the abrupt change of the inlet mass flow rate. The nonlinear correlation between the lagged time and the discharging ratio was proposed, which is helpful for the precise control of the BTMS.
Concerning the indirect-contact liquid cooling, it was also found that there were many factors affecting the performance of the cooling plates. In order to find an optimum combined parameter, a multi-objective optimization method for each individual parameter is needed. Patil et al. [25] proposed a method for a comprehensive evaluation of the liquid cooling BTMS. The multi-objective optimization using genetic algorithm was conducted, subjected to the constraints of operating conditions for optimum battery performance, and further determined the influence of the structural parameters on the heat dissipation performance through a sensitivity analysis. On this basis, a cooling system with a uniform temperature distribution and small energy consumption was developed by the multi-objective optimization approach. The effectiveness of the optimized design is verified by the heat dissipation experiments of the battery module.
Even though the liquid cooling system is the most feasible one for the batteries, there is still space for further improvement in terms of the cooling performance, energy saving and temperature control strategy during the discharging process. Therefore, in this work, the liquid cooling heat dissipation system of the lithium-ion batteries is analyzed and optimized through the orthogonal design approach with a matrix analysis. The orthogonal weight was obtained for each level and each factor appeared in the system evaluation indexes. Based on the identified weight factors, a closed-loop temperature control strategy for the BTMS is proposed and evaluated for a complete battery pack discharging process.
2. Modeling and Numerical Methodology
2.1. Arrangement and Geometry of the Batteries and Cooling Plates to Be Modeled
The thermal management strategy of the battery module consisting of six commercial rectangular lithium-ion battery cells is studied in this work. It is assumed that the battery acts as a uniform heat source in the study. The BTMS for this module is characterized by the liquid cooling approach with a mini-channel cooling plate. As shown in Figure 1, the six cells are arranged in two rows (each row with three cells aligned in parallel), separated by the cooling plate. The cooling plate is adhered to the largest side of the cell, which has the advantage of forming a large heat exchange area. Temperature monitoring points (Point-1 and Point-2 used in Section 3) are located in the center of the battery surface, as shown in Figure 1. The size of the single cell is 207 × 157 × 7 mm, while the size of the cooling plate is 471 × 207 × (H + 1) mm, where H is the height of the rectangular channel, as shown in the cross-sectional view shown in Figure 1.
The rectangular flow channels are used inside the liquid cooling plates, since the straight shape channel has the advantage of a low manufacture cost and low flow resistance compared to the other design channels. This is a suitable choice for the rectangular battery pack. The channel arrangement is mainly featured by the number and size, as well as the position of the channels within the cooling plates. For a liquid cooling plate with a similar size, Rao et al. [26] has found that the arrangement of the six channels can provide a better control of the temperature for the rectangular battery cells. Therefore, in this work, the same number of the channels (i.e., six) is adopted for the cooling plate. The cross-sectional size of the rectangular channels is featured by the parameters of width (L) and height (H), as shown in Figure 1. For the position of the channels within the plates, it is assumed that the six channels are evenly distributed horizontally. The distance between the top/bottom edge of each channel and the top/bottom surface of the cooling plate is fixed to 0.5 mm in this study. The weight of the battery module will not be significantly increased.
2.2. Mathematical Equations and Modeling Method for BTMS
2.2.1. The Governing Equations
For the fluid flow and heat transfer in BTMS, the conservations of mass, momentum and energy have to be satisfied. In this work, Reynolds number Re of the liquid flow in the straight channels is always smaller than 2300, thus the flow is in laminar. Heat transfer between the fluid and channel wall within the cooling plate is through the convection, while that within the channel walls and the battery cells is through thermal conduction.
The energy conservation equation for the battery cell is specified as follows [27]:
where ρb, Cb, λb and Vb are the density, specific heat capacity, thermal conductivity and volume of the battery, respectively,∇T is the temperature gradient, is the heat source per unit volume of the battery. In order to simplify the calculation, ρc, Cc and λc are kept as the constants. Similarly, the energy equation of the coolant is described as follows:
where ρc, Cc, λc and are the coolant density, specific heat capacity, thermal conductivity, temperature and velocity vector, respectively. Water is used as the cooling medium in this work.
The governing equations for the fluid flow are outlined as follows. The continuity equation reads:
where ρc is the density of the coolant, is the velocity of the coolant (in vector).
The momentum conservation equation for the laminar flow:
where P is the static pressure, is the stress tensor, and means the acceleration of gravity.
The stress tensor is given by:
where μ is the molecular viscosity.
To evaluate the effect of the mass flow rate, the Reynolds number are calculated as follows:
where is the kinematic viscosity of the coolant, d is the characteristic length given by:
2.2.2. Battery Heat Generation Model
In the battery discharging process, the heat is generated by the electrochemical reactions, and the polarization due to the terminal voltage difference of the battery, as well as transfer of the lithium-ions and electrons. This heat can be classified into the reversible and irreversible ones, usually estimated by the theoretical model proposed by Bernard [28] in 1985. In this paper, the actual heat generation rate of the battery cell under different state of charge (SOC) was taken from the experimental work carried out at the operating temperature of 25 °C [29], which was presented as a transient total heat source averaged as a uniform heat generation distributed in the battery cells. The battery is connected to the electrical loading box, which is further connected to the controller via the RS-232 cables. The controller can control the discharge process of the battery and collect the voltage and current data of the battery. The controller communicates with the computer 1 via the LabVIEW platform. Ten T-type thermocouples are attached to the battery surface. The data of the thermocouples is kept in the computer 2 through Keithley data acquisition system. In the experiments, the total heat generation rate of the battery is estimated by the conservation of heat flux. It should be mentioned that the experiments employed a well-known Moffat method [30] to analyze the uncertainty of the experimental results and theoretical predictions. In the experiments, the total heat generation rate of the battery was calculated by the conservation of heat flow as follows:
where qtotal is the total heat generation rate of the battery; qsen is the sensible heat of the battery; qc represents the heat exchange between the battery and the coolant; qenv represents the heat exchanged between the system and the environment.
qtotal = qsen + qc + qenv
This total heat generation rate is corelated by a polynomial fitting method, which is further compiled through the user defined function (UDF) in this work as the heat source term of the battery in ANSYS Fluent. The simulations are carried out on a desk-top computer with 6 Intel(R) Xeon(R) W-2133 CPU cores (@3.60 GHz) and a 16-GB memory in a 64-bit Windows operating system. The double precision pressure-based solver is adopted with the standard SIMPLE algorithm as its pressure–velocity coupling method. The second order upwind discretization scheme is used for the momentum equation. All user defined functions (UDFs) are compiled in the Dev-C++ software (Version 2 Copyright (C) 1989, 1991 Free Software Foundation, Inc. 675 Mass Ave, Cambridge, MA 02139, USA). In each simulation, 5 CPU cores are used in parallel and around 87% of the memory is consumed. Each simulation case takes about 4 h running time. In the experiment, the external surface of the battery module is wrapped by employing insulating cotton material. To keep the similar thermal conditions, an insulating boundary condition is implemented in the simulation work, and the heat generated by the battery is mainly carried away by the coolant.
2.2.3. Physical and Thermal Properties
In this work, the cooling plate is made of aluminum and the coolant is water. The physical and thermal parameters employed for the lithium-ion battery, cooling plate and water are shown in Table 1. Due to the small thickness of the battery, isotropic thermal conductivity is assumed for the battery for numerical simplicity. It is found that the error induced by this assumption is acceptable in this specific case. In the current simulations, the change of the properties with temperature is not considered because the temperature variation in the BTMS is considered small.
2.2.4. Initial and Boundary Conditions
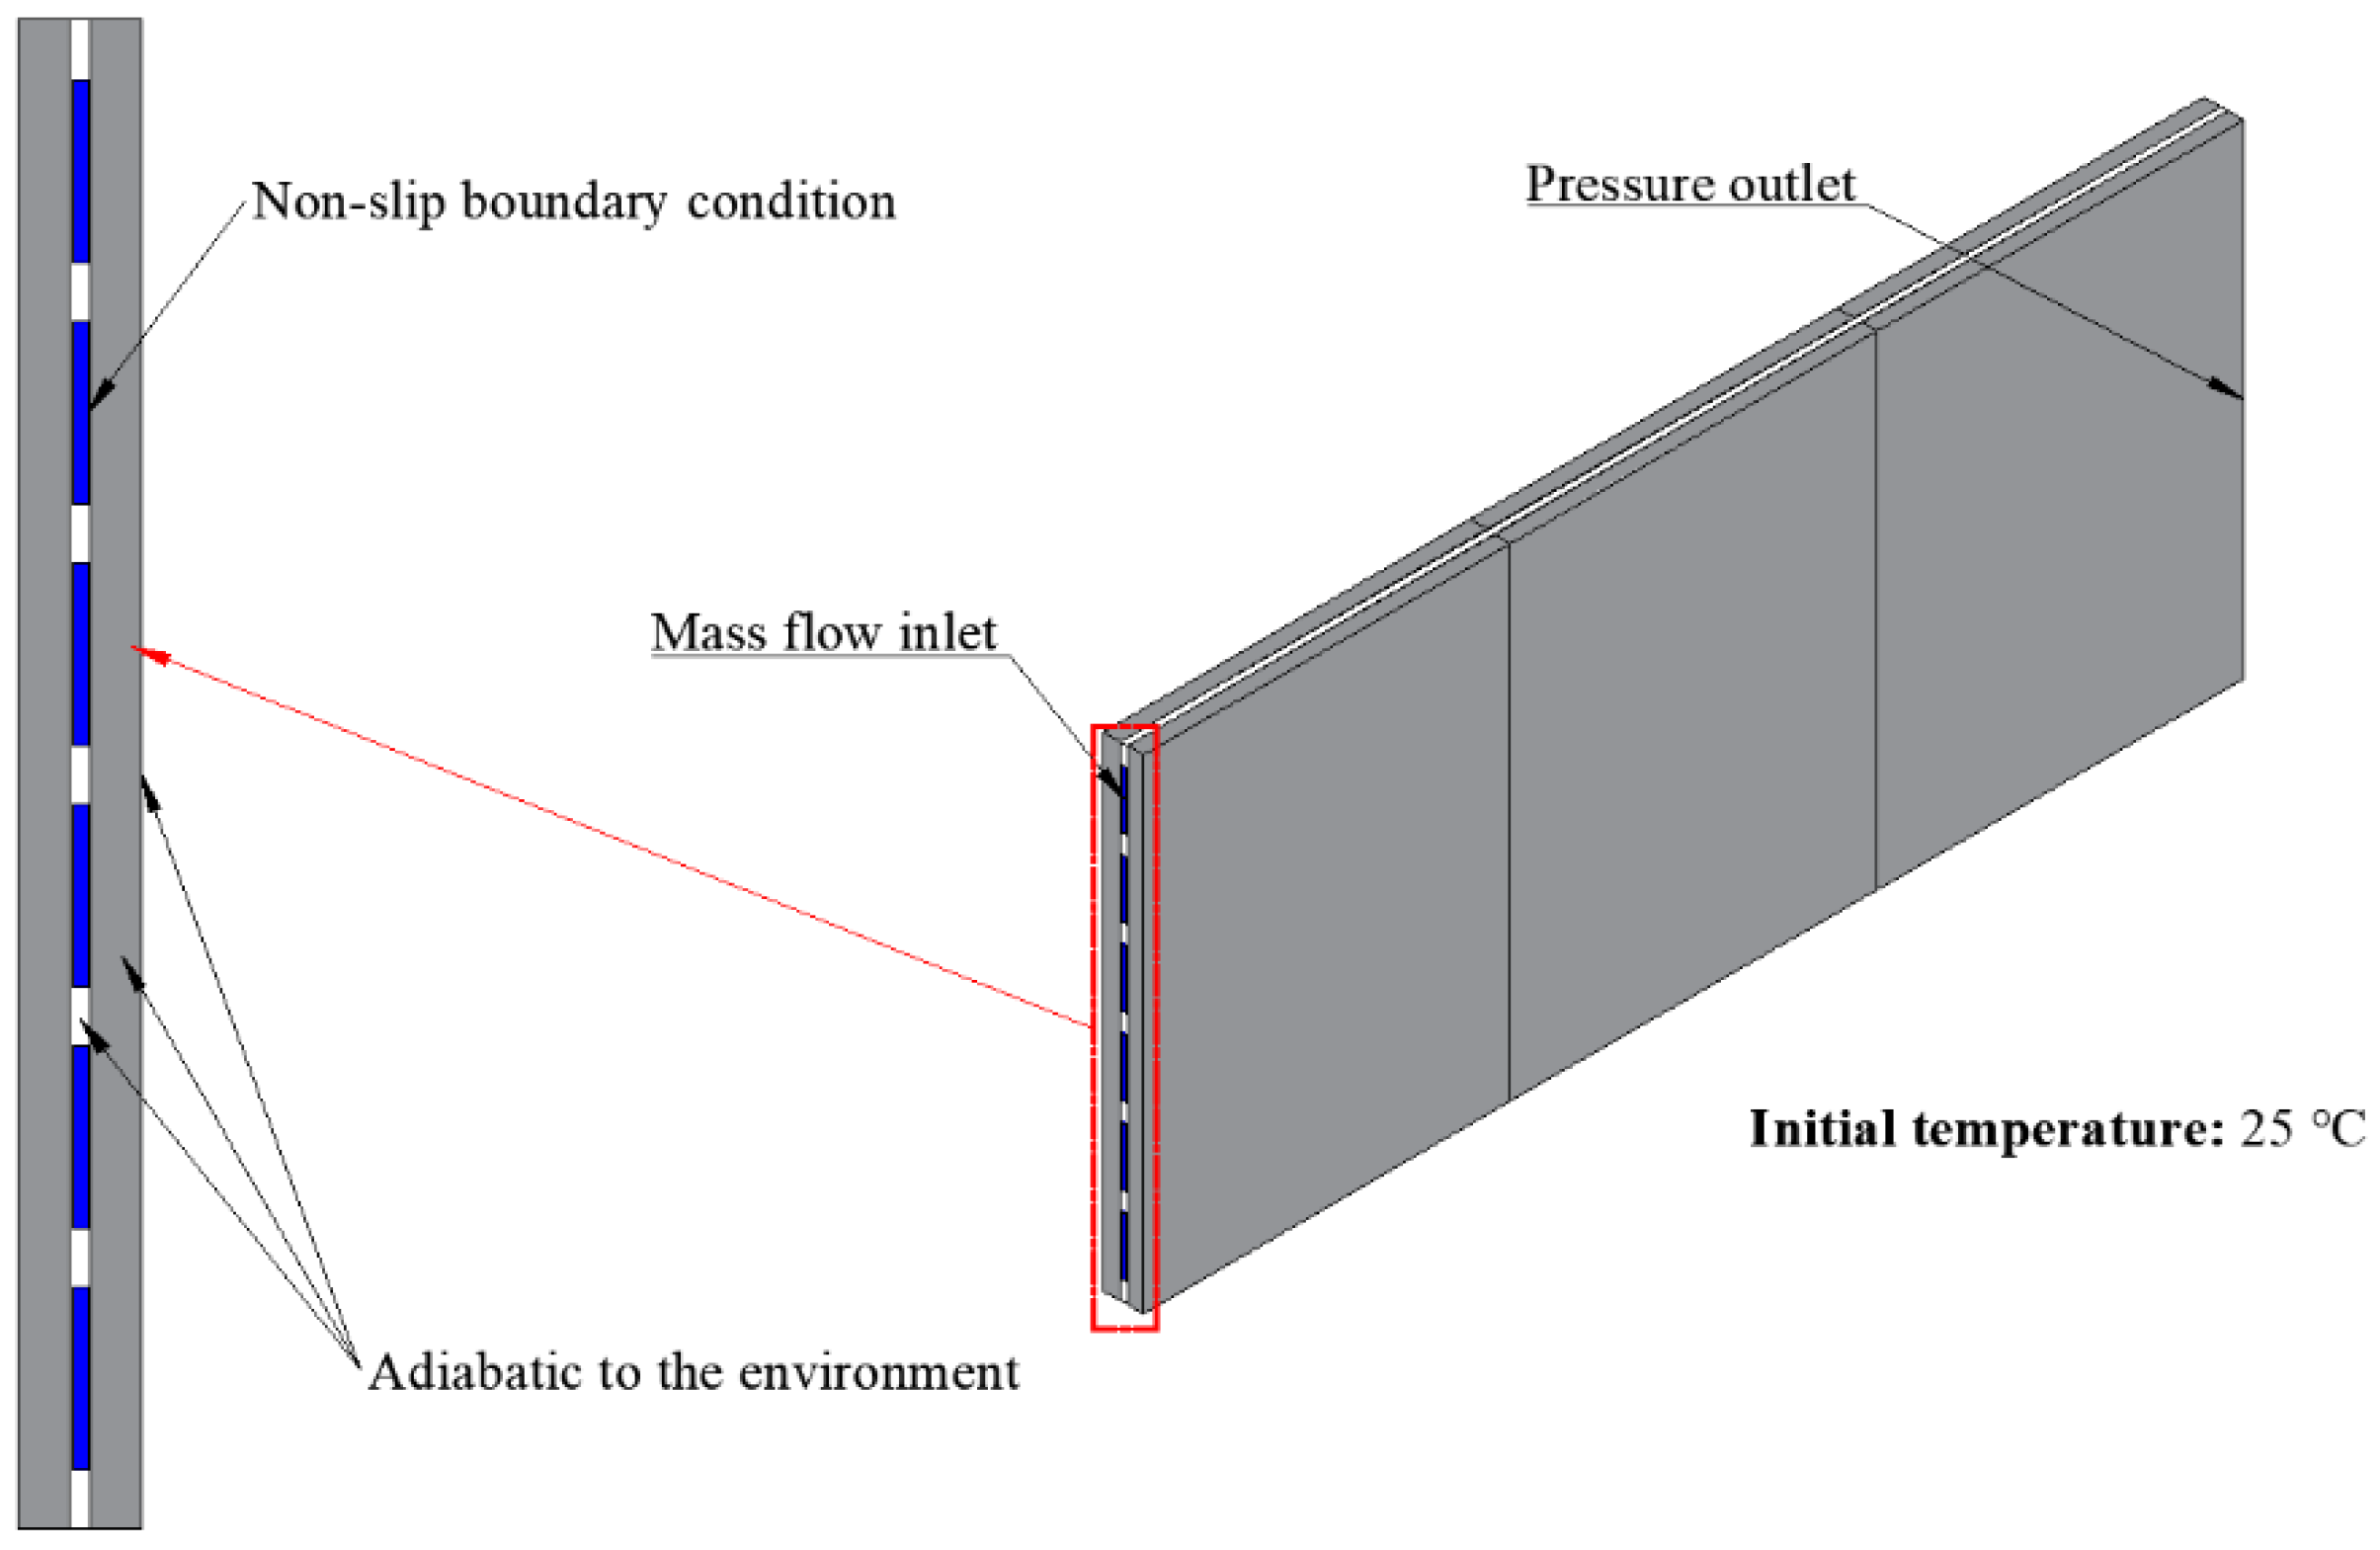
In order to solve the governing equation above, as shown in Figure 2, the initial and boundary conditions are applied as follows: the initial temperature of all computational zones was set to 25 °C. The inlet boundary condition for the cooling plate was the mass flow rate with a constant temperature, while the outlet one was the pressure outlet. In the orthogonal test below, the specific inlet mass flow rate will be given. The inner wall of the cooling plate was fixed by a non-slip boundary condition. The battery module is modelled to be thermally insulated from the external environment, i.e., the heat generated by the battery is carried away only by water, while the heat source term is implemented for the battery cells in the UDF.
2.2.5. Implementation Method and Validation of the Model
The commercial software ANSYS Fluent was used for the simulation in this work. The parameter settings applied in the simulation (such as model selection and meshing) are consistent with those presented elsewhere in the previous work [32]. In this paper, the liquid cooling method of the battery module is studied based on the findings from the previous study [32], in terms of the heat generation rate evaluated for the single battery. As the battery module is symmetric along the central plane of the cooling plate, only a half structure of the module is adopted as the calculation domain for the purpose to reduce the computation expenses.
To validate the thermal model prediction against the experimental data, a thermal contact resistance between the battery and the cooling plate surfaces is considered. In this work, the contact thermal resistance (R) is estimated as the heat exchange (qc) between the battery and the cooling plate obtained from the experiment and divided by the temperature difference (ΔT) between them. The thickness (δ) between the surfaces is assumed as 0.1 mm and the thermal conductivity (λ) 0.012 (W/m·K). By this treatment, it is found that the estimated thermal resistance is equal to the experimental one. As can be seen later, the above calculated properties of the materials can yield reasonable temperature predictions.
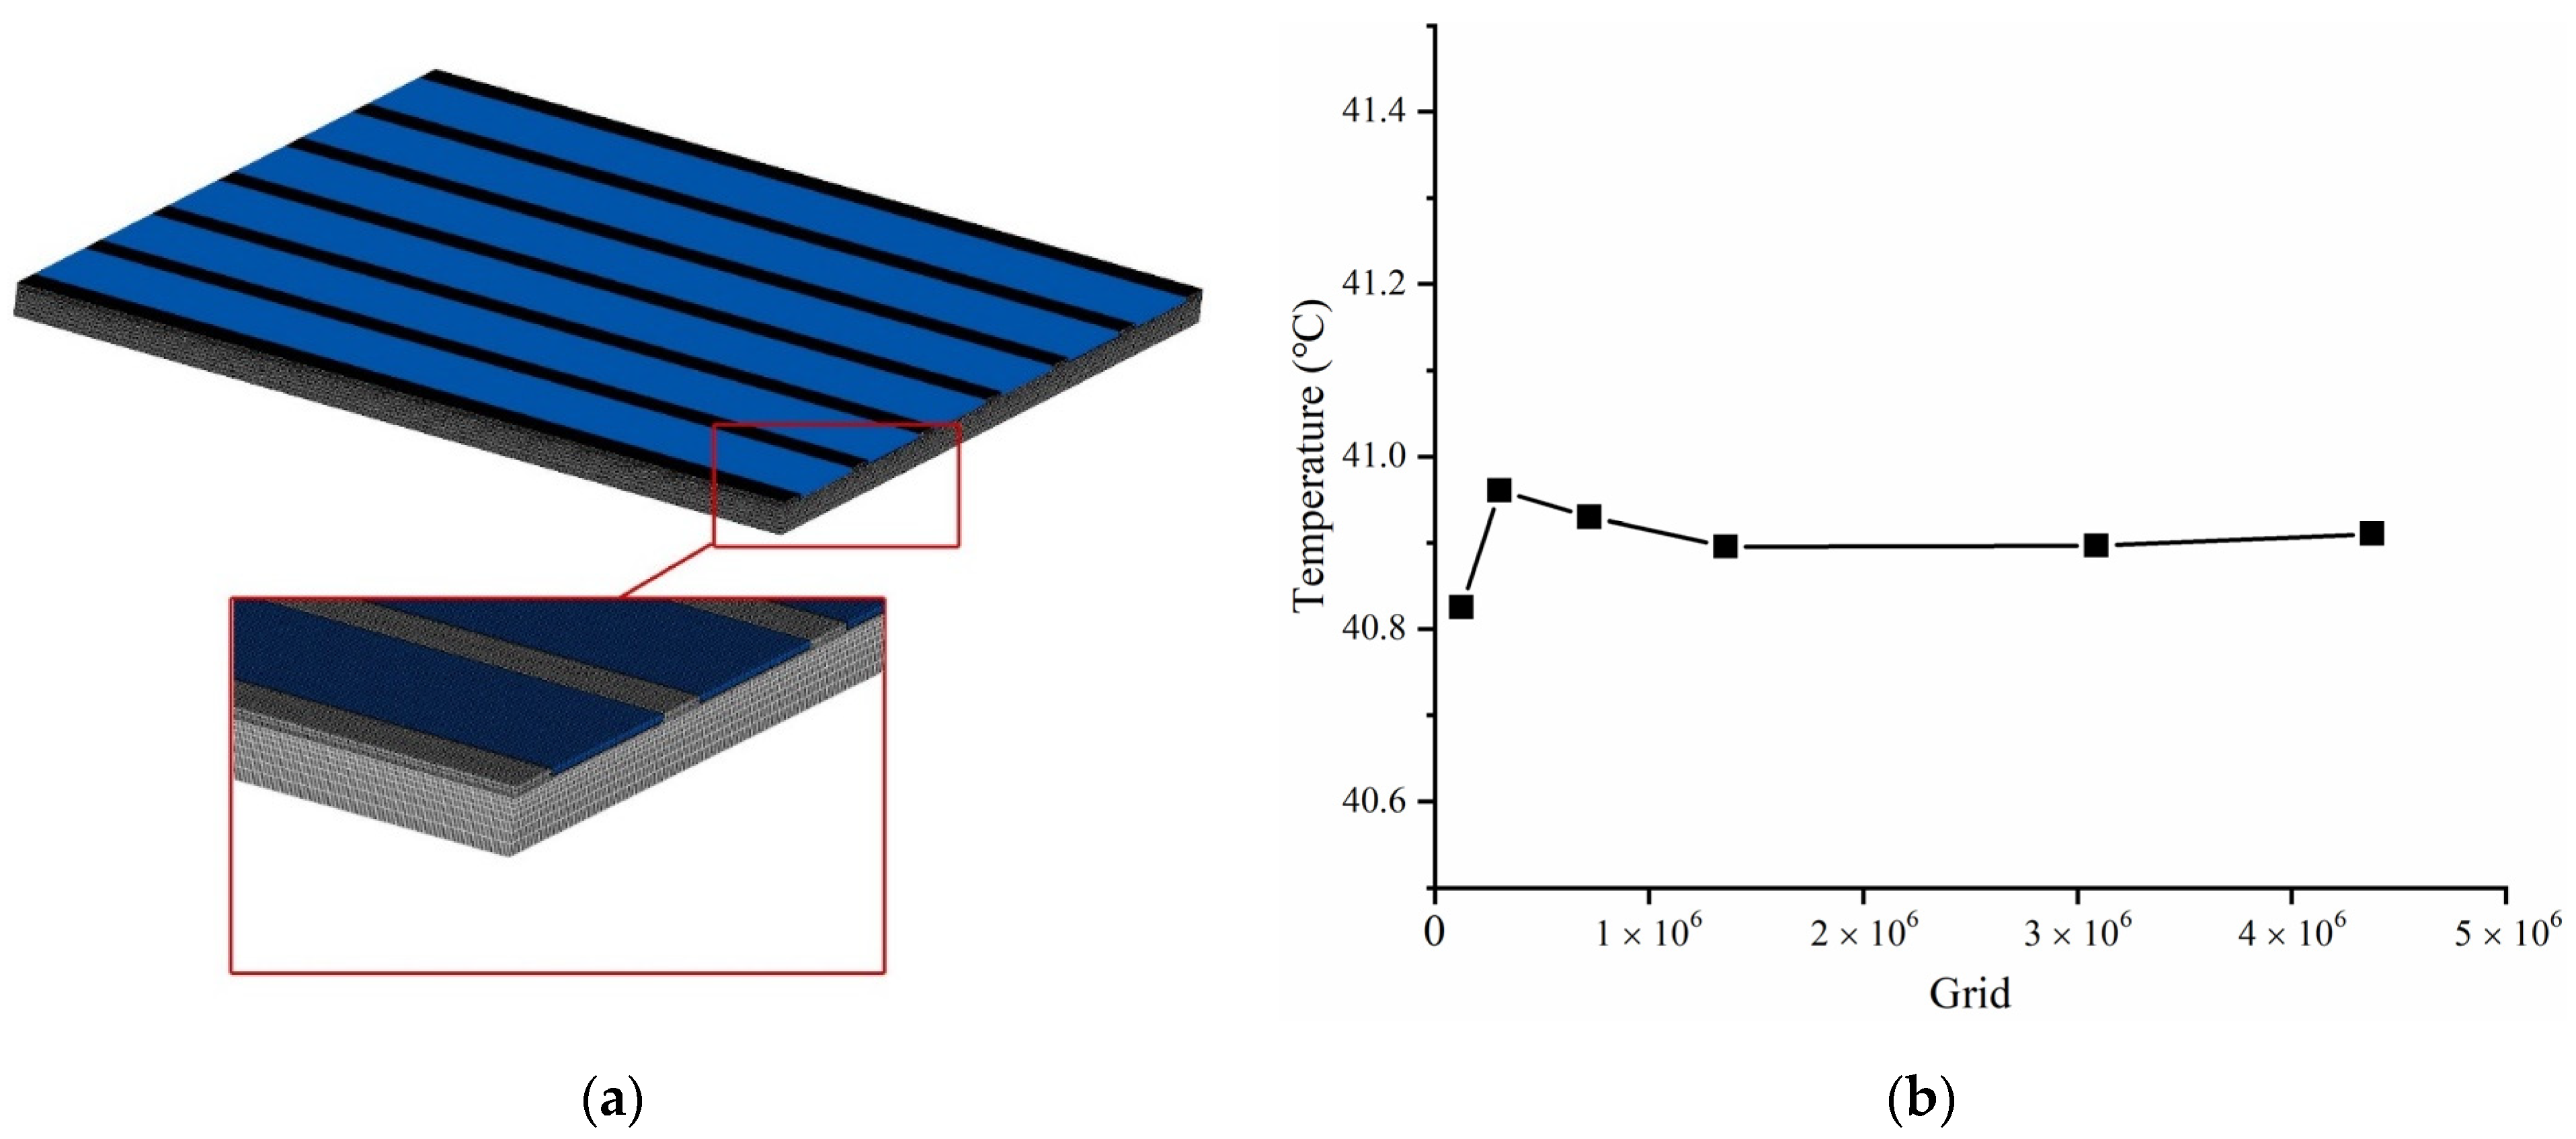
In this study, the geometric model of the battery module was established in SolidWorks and further imported into ANSYS MESHING for a mesh division. Hexahedral grids generated for the domains are highlighted in Figure 3a. It should be mentioned that the part colored with blue is for the fluid domain, while the ones with other colors are for the cooling plate and the batteries.
In order to evaluate the reliability of the model, a grid independence testing is carried out. The temperature at point-1, TPoint-1 is predicted for various grid numbers. It can be seen in Figure 3b that, when the number of the grids exceeds 1.5 million, the variation range of TPoint-1 is less than 1%, which can be considered that the simulation results are independent of the number of the employed grids. Considering the calculation accuracy and time expenses, the grid number ranging from 1.5 to 5 million is employed for various cases in the present simulations of the orthogonal tests. At the same time, skewness and orthogonal quality are also carried out to evaluate the quality of the meshing. The maximum skewness of the cases is less than 0.94 and the minimum value of orthogonal quality is more than 0.15, which are acceptable in ANSYS Fluent. The convergence criteria for both the energy and continuity equations are set to 10−6, which is also applied to the momentum equation. The time step for the transient calculation is 1 s. To validate the thermal model predictions, the surface temperature predicted for the lithium-ion batteries at 1 C, 2 C, 3 C and 4 C discharging rates were compared with the experimental data. As shown in Figure 4, the maximum difference between the experimental and the simulation results is less than 2%, indicating that the developed model can well predict the temperature distribution of the battery.
2.3. Orthogonal Design Method for BTMS and Its Matrix Analysis
In the design of BTMS, a large number of the calculations and experiments are usually required to study the influence of the specific factors on the certain indexes. In order to reduce the number of the required measurements and calculations, the method of orthogonal design is adopted. The purpose of the orthogonal design is to optimize the testing conditions and find out the best testing scheme. The core of the orthogonal design method is an orthogonal array composed of various factors at different levels.
For the heat dissipation ability of the mini-channel cooling plates, it can be clearly observed that the channel height (H), channel width (L), inlet water mass flow rate (V) and inlet water temperature (T) are the main factors influencing the temperature distribution of the battery modules. The channel height influences the size and weight of the BTMS and further the energy density of the battery pack. To consider this effect, four levels of the channel height values are selected between 0.5–2 mm for a further analysis. The other factors (e.g., L, V and T) are also selected from the perspective of the energy consumption and the heat dissipation capacity. The selected factors of the orthogonal design are shown in Table 2. The evaluation indexes of the BTMS in this work include: the maximum temperature (Tmax), temperature difference (ΔT) and pressure drop (ΔP) through the channels, as defined below.
Tmax = TPoint-2
ΔT = TPoint-2 − TPoint-1
As identified in Table 2, each factor has four levels. In order to reduce the number of the simulations, a combination of the concerned factors is obtained through L16 (44) orthogonal. The orthogonal design table and the corresponding evaluation indexes are presented in Table 3. It should be mentioned that columns 2–5 of this table represent the factors and levels, while columns 6–8 are the evaluation indexes, i.e., the maximum temperature, temperature difference and pressure drop.
It is also important to reasonably deal with the orthogonal testing results for obtaining the correct analysis and summary according to the processing results. There are two options observed in the existing analysis. The first option is a simple analytical process but complicated result. The other one is that the calculation process is complex and prone to limited errors. Therefore, the matrix analysis method [33] of the orthogonal design is adopted due to a fact that it is able to get quickly the primary and secondary order of the influencing factors through the design and calculations. The weight matrix of the design method can be obtained, which clearly reflects the significance of each individual factors from the evaluated indexes of the designs.
The weight matrix analysis method is used to optimize the selection of the multi-objective orthogonal design schemes. According to the orthogonal design scheme, a three-layer structure model needs to be established, which are the inspection index layer, the factor layer and the level layer, respectively. From the data of each layer, the corresponding matrix formula is further established. First of all, it is assumed that, for the inspection index layer, there are m factors in the orthogonal experiment, while each factor has n levels. The average value of the testing index at the j level of the i factor is specified as kij. If the value of the index is proportional to the expectation, i.e., the larger the index is, the more satisfied the expectation is. Let Kij = kij, otherwise Kij = 1/kij. The matrix is constructed as presented in Equation (12). Secondly, for the factor layer, the reciprocal of the sum of Ki1 to Kin is counted as Ni. There is . The matrix of Equation (13) is established. Then, for the establishment of the horizontal layer matrix, the range of the i factor is si, and . Equation (14) is constructed. Finally, the weight matrix of Equation (15) that affects the value of the testing index can be calculated.
In the above matrix, w1 = K11N1S1, where is the ratio of the indexed value for the first level to the sum for all the levels of the first factor; is the ratio of the range for the first factor to the sum of the all factors. The value of the product of these two can not only reflect the volatility of the level of the first factor, but also reflect the influence of each level of the first factor on the evaluation indexes under the investigation. The same is true for the other factors and levels, and the weight of the influence of the levels on the indexed value can be obtained by the calculation.
3. Results and Discussion
3.1. The Influence of Channel Size
Based on the orthogonal design method presented in the above Section 2.3, the influence of the channel size on the flow and heat transfer in the channel is presented and discussed in this section. Figure 5 shows the weight of the channel height H and width L at four different levels on the maximum temperature and temperature difference. In the above Figure, the vertical axis and the horizontal axis represent the weights and four levels varied with different factors. The black and red polylines represent the influence of the channel height and channel width, respectively. It can be observed in Figure 5a that as the channel width increases, the heat dissipation capacity of the cold plate is increased due to the increase of the effective heat exchange area between water and the battery. This finding is consistent with that of Jin [34]. As the height of the channel increases, the heat transfer between water and batteries is slightly weakened at smaller H and then strengthened as H increases. This predicted result may be due to the fact that, on the one hand, increasing the height can increase the wet perimeter and reduce the water velocity when the inlet flow rate is fixed. This slightly weakens the convective heat transfer performance through the channels. On the other hand, with the increasing of the channel height, the heat transfer area between the coolant and the cooling plate gradually increases and the enhanced heat transfer effect will exceed the effect of the decreasing flow velocity. In overall, it can be seen from Figure 5a that factor L has a greater influence on the maximum temperature of the battery module than factor H.
Figure 5b shows the influence of the channel height H and width L on the temperature difference. Under a fixed inlet flow rate, increasing channel height H is beneficial to reduce the temperature difference of the battery module. It is also seen that the orthogonal weight of L on the temperature difference are smaller than those of factor H from the vertical coefficient in Figure 5b. It can be seen in Figure 6 that a larger H results in a smaller pressure drop in the channel, while the trend for L is opposite. The pressure drop is an indicator of the parasitic power consumption needed by cooling the battery module. Therefore, compared to the channel height H, the channel width L has a stronger influence on the maximum temperature of the battery module, which means that the heat exchanging area (i.e., connecting to the battery cells) is the main influencing factor on the temperature field of the battery module. However, the orthogonal weight of the channel height on the temperature difference is three times bigger than that of the channel width. This means that increasing channel height or reducing flow velocity has a significant impact on the temperature difference of the battery module. Through the weight analysis, the impact of H and L on the battery module can be quantified.
3.2. The Influence of Inlet Temperature and Flow Rate
The inlet temperature and inlet flow velocity are very important for the heat dissipation of the battery module. A common approach to investigate the effect of the inlet water temperature and velocity on the performance of BTMS is by trying a series of specified inlet water temperature and velocity, and then checking whether these values can meet the requirements of the BTMS. Such an approach is straightforward to find the optimum values but is very time consuming, which may lead to a significant computational expense. Through the matrix analysis method employing the orthogonal design results, the influence of the levels on the evaluation index (i.e., orthogonal weight) can be easily identified. Based on the orthogonal weight analyzed, the factors and levels with bigger weights can be considered as being in higher priority in optimization of the BTMS designs. This can reduce the analysis time and computation resources required.
Figure 7 shows the impact of the orthogonal weights of the inlet temperature and inlet flow velocity on the battery maximum temperature and temperature difference. It can be found from Figure 7a that the weight of the inlet temperature on the maximum temperature decreases almost proportionally with the inlet temperature increasing. This suggests that a lower inlet temperature is favored to the heat dissipation in the battery module. However, it is found in Figure 7b that the weight of the inlet temperature on the temperature difference within the module fluctuates. An increased heat exchange rate is more beneficial to the battery heat dissipation. Although a lower inlet temperature can increase the heat dissipation, the parasitic energy consumption needed by the cooling water in the refrigeration system would be higher, which needs further to be balanced.
Figure 7 also shows that increasing inlet flow rate is beneficial to a reduction of both the maximum temperature and temperature difference, but the relationship is not linear. It can be seen from Equation (16) that for a given channel structure the heat transfer factor is mainly a function of the heat transfer coefficient and flow velocity, while the heat transfer capacity of the cooling plate is affected by both. The heat transfer factor (j) specified below is used to characterize the heat transfer capacity of the heat exchange equipment.
where St is the Stanton number, defined as the ratio of the actual heat transfer flux to the maximum heat transfer flux of the fluid, Pr is Prandtl number.
It is observed from the orthogonal weight shown in Figure 7 that for the straight channel the inlet water velocity has a greater influence on the temperature distributed in the battery module, followed by the inlet water temperature. The predicted results in Figure 6 shows that the inlet water temperature and velocity have the same trend of the influence on the pressure drop of the channel. As can be also seen in Figure 6, the influence weight of the pressure drop in the channel changes little at different inlet temperatures. Different inlet flow rates have a great influence on the pressure drop. Reducing the inlet flow rate may reduce the parasitic energy consumption of BTMS but will weaken the BTMS heat transfer capability. There must be a trade-off between these two parameters. According to the influence weight of the level for the factor, a more targeted choice may be adopted in the research on the thermal management strategy of the battery pack temperature field.
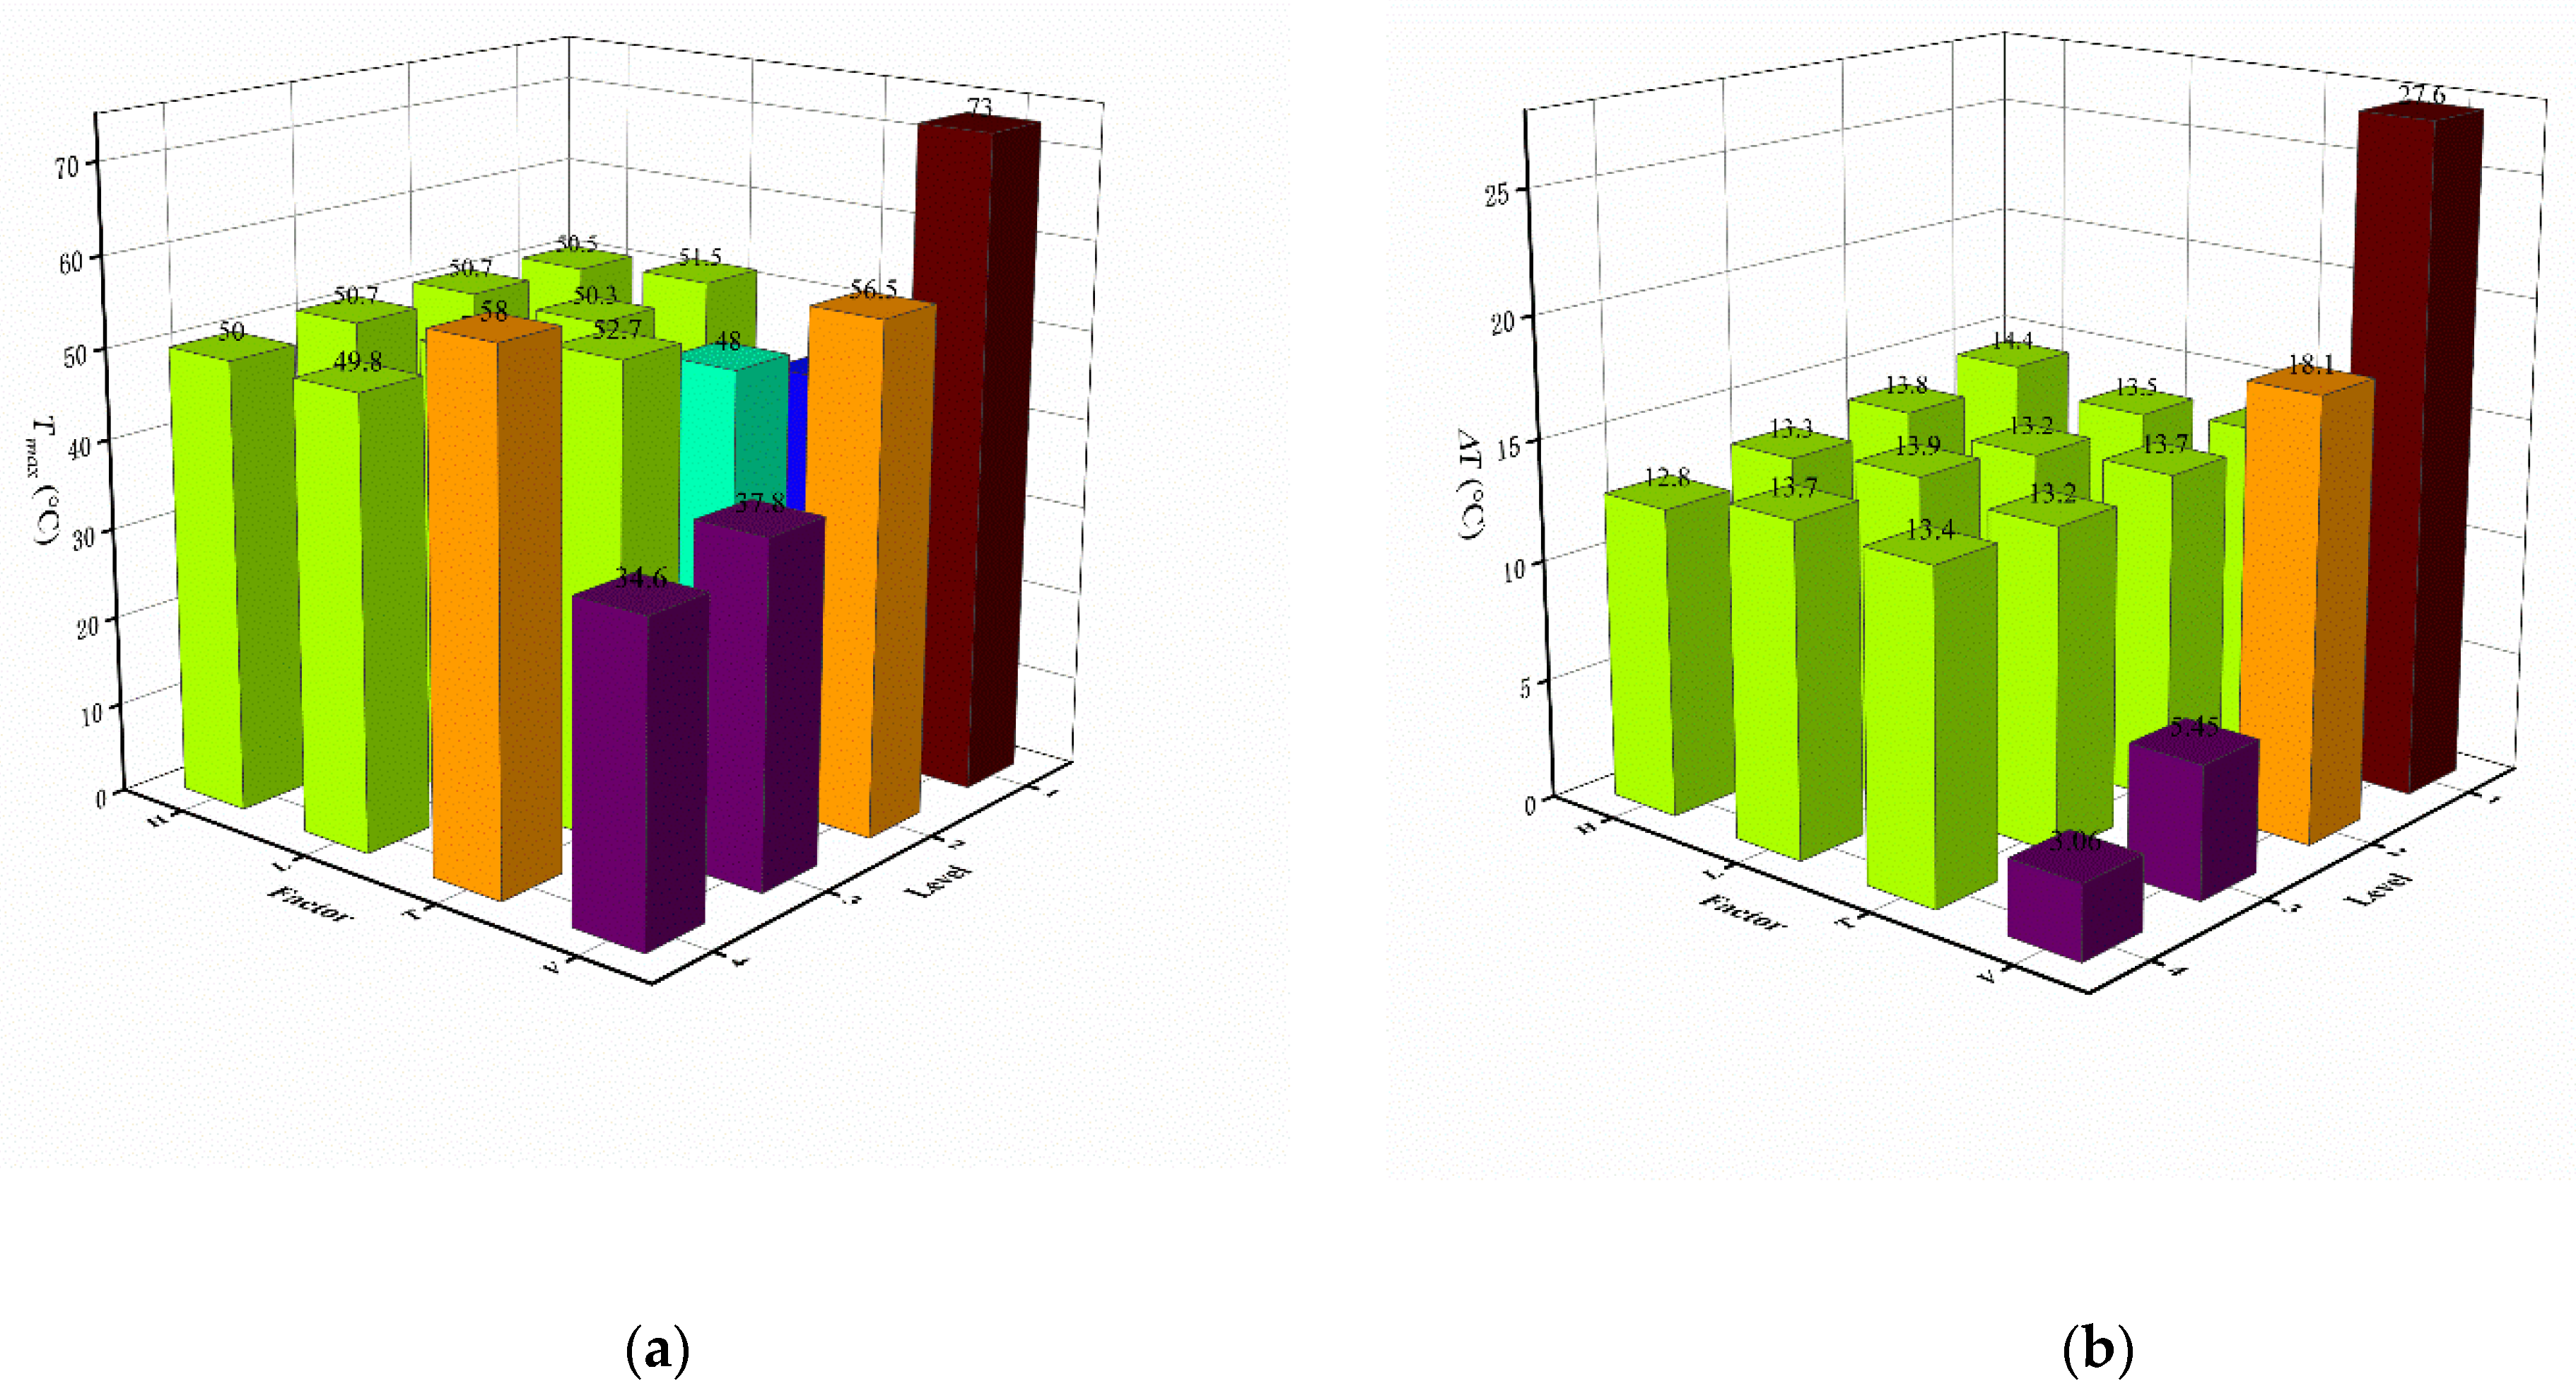
It can be seen from the above analysis that the inlet mass flow rate has the greatest influence on the temperature field of the battery module. The weight range of the influence on the maximum temperature is 0.1–0.24. The weight of level 4 to the temperature difference reaches 0.48. It can be found in Figure 8 that when the inlet flow rate is 0.01 kg/s, that is, when level 4 is used, the maximum temperature is 34.6 °C, while the temperature difference is 3.06 °C. In addition, when the inlet temperature is reduced from 35 °C to 20 °C, the maximum temperature of the module decreases from 58 °C to 43.1 °C, as shown in Figure 8a. Therefore, according to the above analysis, different temperature control strategies for the battery module will be developed by adjusting these two factors (T, V).
3.3. Evaluation of Various Temperature Control Strategies
From the above discussion, it can be found that different factors and their levels have different orthogonal weight values on the evaluation indexes of the BTMS. The inlet water velocity has a big impact on the indexes, followed by the inlet temperature. One important objective of the BTMS is to reduce the temperature difference and maintain the reasonable temperature range for the battery pack. Based on the findings outlined above and the heat generation characteristics of the battery, this section further explores different temperature control strategies and evaluate the effectiveness of these ones based on the safety and energy consumption.
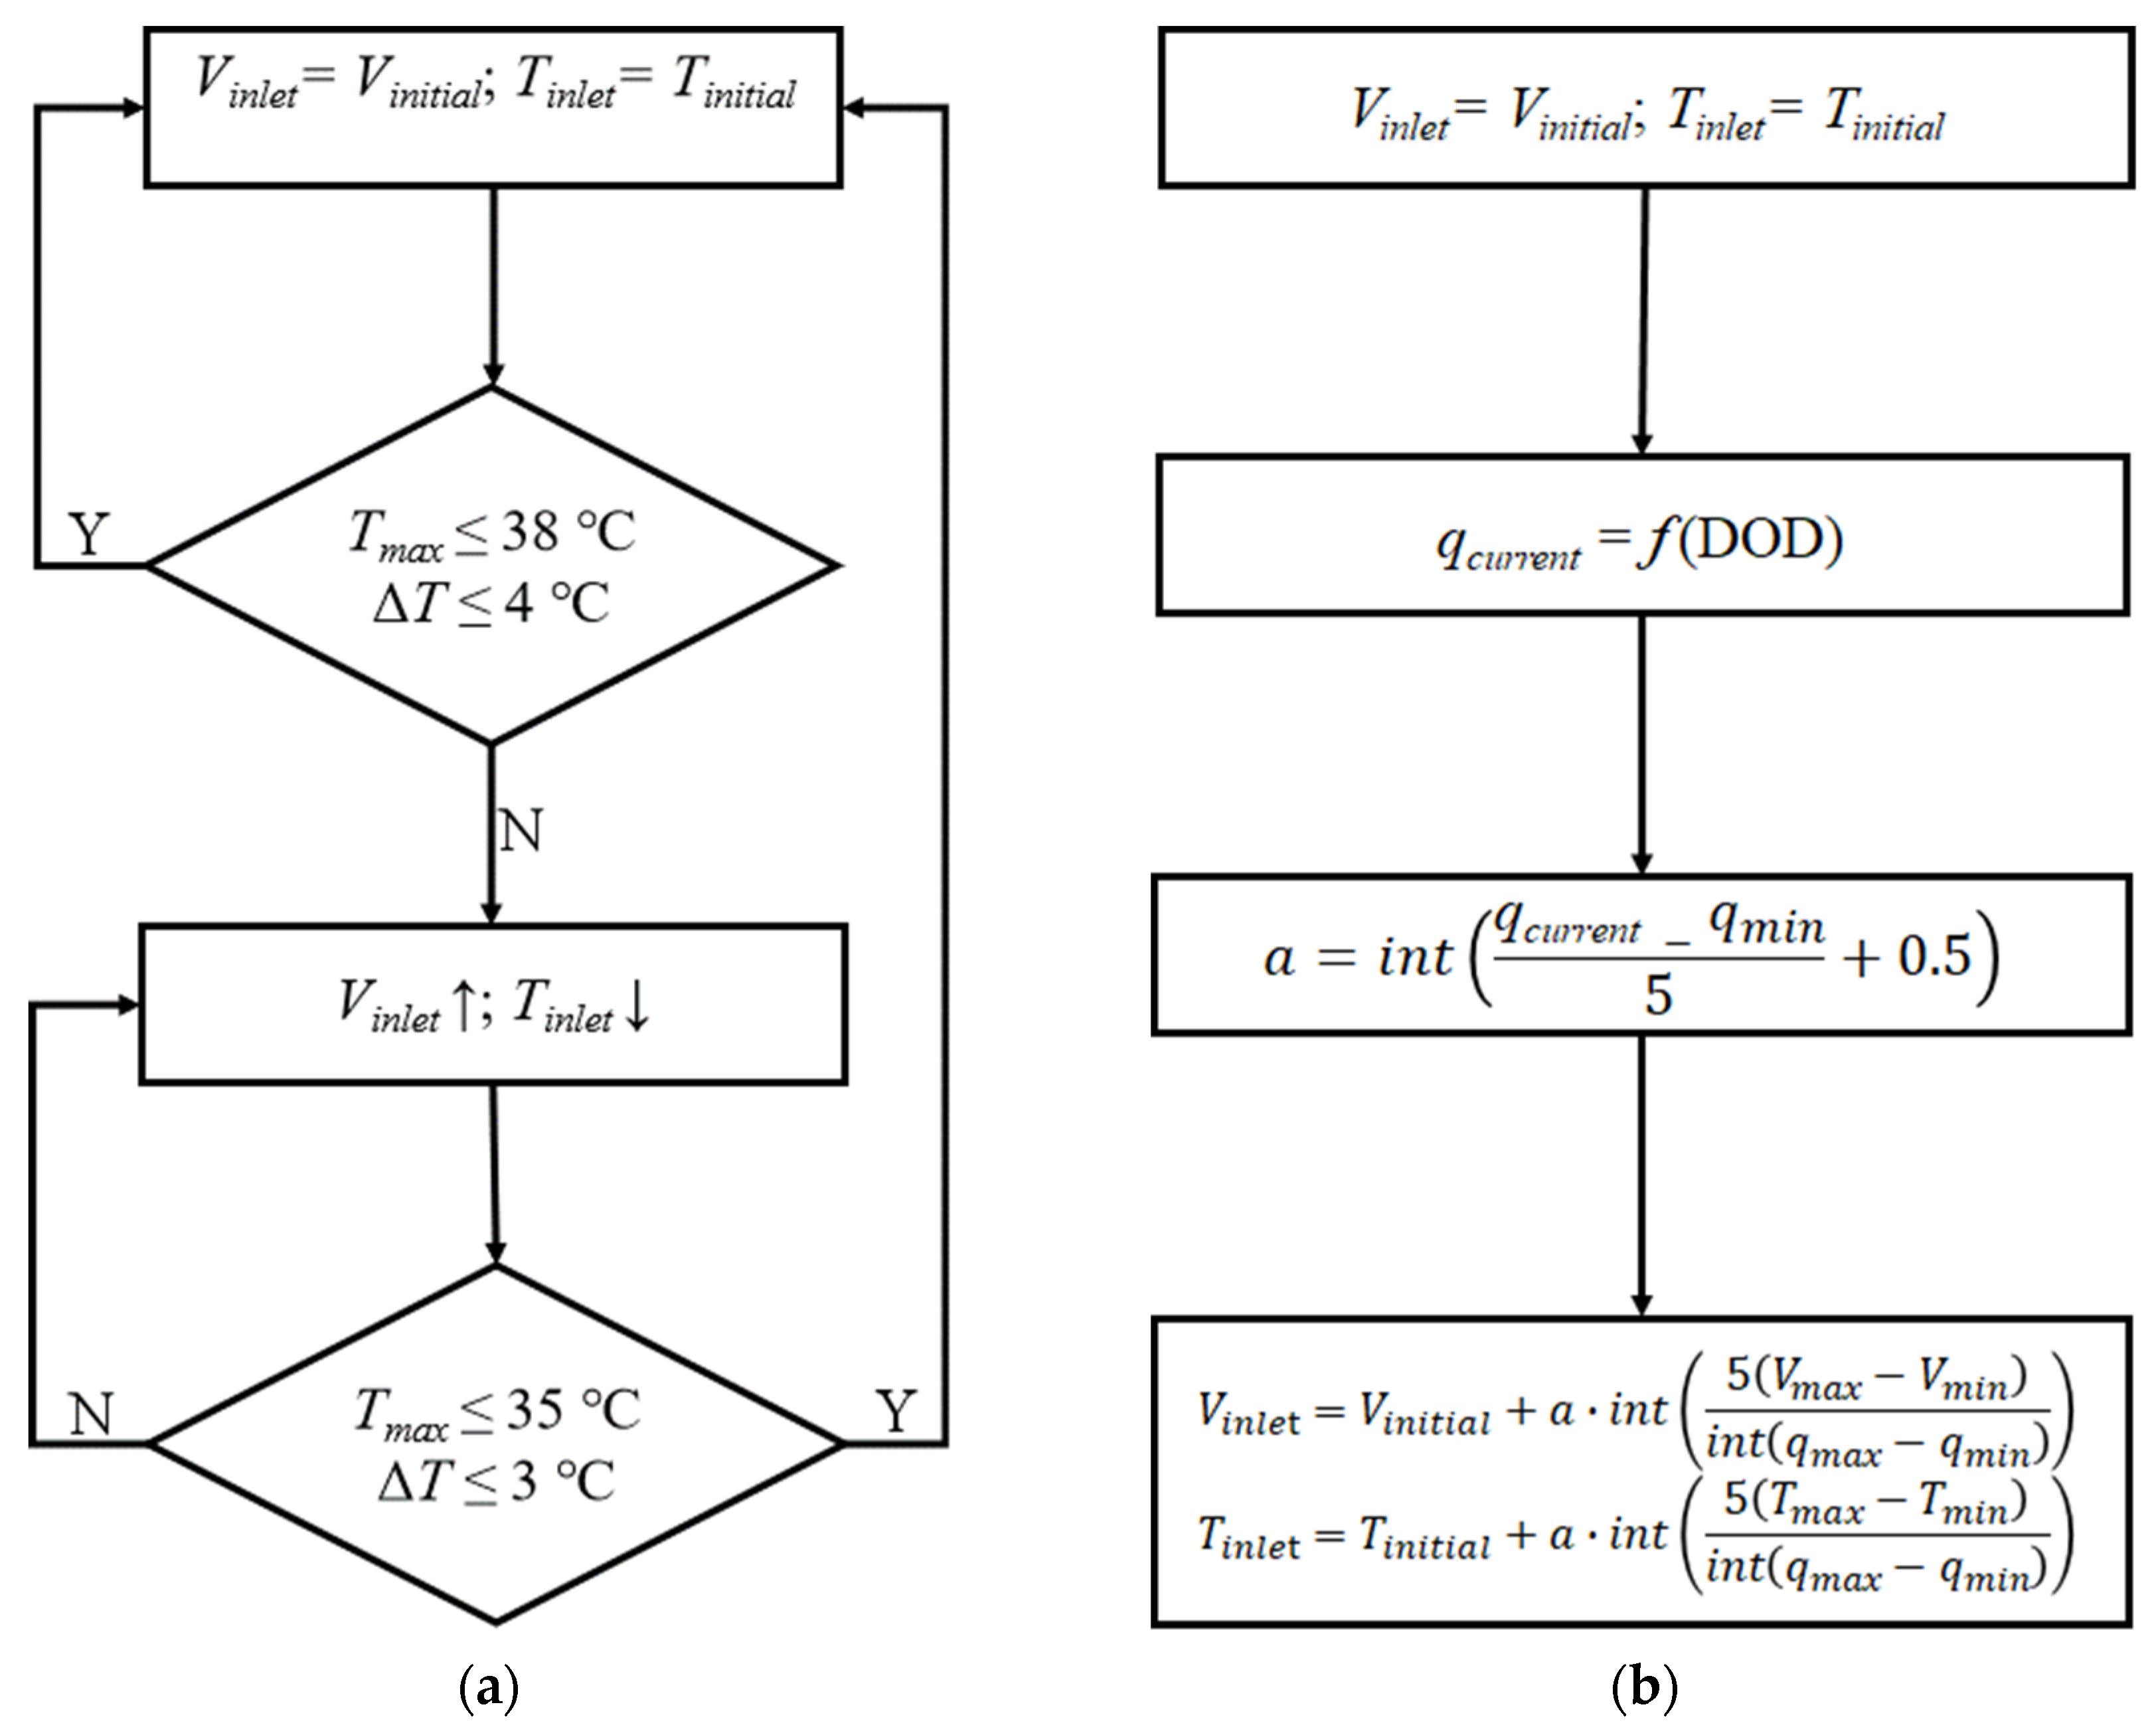
Based on the analysis presented in Section 3.1, the inlet temperature and inlet flow rate are varied for a purpose to identify the temperature control strategy, while the channel size is fixed as the channel height H = 2 mm and width L = 10 mm. Figure 9 shows the logistics of two different temperature control strategies.
The logistics of the strategy outlined in Figure 9a is to control the battery temperature by adjusting the inlet flow rate based on the maximum temperature and temperature difference monitored in the battery module. The temperature predicted for the battery surface center is used as the regulating parameter of the thermal management strategy. This temperature is usually lower than that at the anode and cathode regions for a battery, which means that there would be a delay on the response time of BTMS, especially for the high-rate discharging process. This strategy can ensure that the battery always operates in a reasonable temperature range. In the actual working process, the temperature data monitored by the thermocouples should be transmitted to the BMS, and then the BMS gives control instructions to the cooling system. It is noteworthy that in this process the delay of the information transfer may influence the variation of the inlet velocity. Therefore, setting the proper response on the temperature change is critical for this strategy. In this logistics, the required maximum temperature and temperature difference are 38 °C and 4 °C, respectively.
The logistics of the second strategy shown in Figure 9b is to control the battery temperature by simultaneously adjusting the inlet water temperature and velocity based on the battery heat generation characteristics. For every increase of the heat generation power by 5 W, the inlet velocity and temperature will be increased/decreased with a certain amount. Table 4 summarizes the parameters of the two strategies and the predicted results. It should be mentioned that columns 2–3 of Table 4 represent the inlet flow rate and the inlet temperature, while columns 3–4 provide information on whether the specific scheme meets the safety standards of the battery module. Scheme 1 simulates the temperature field in the inner cycle of BTMS. In Schemes 2–4, the temperature field under the constant inlet flow rate and inlet temperature is calculated, while Scheme 5 adopts Strategy (a), Scheme 6 to 8 adopt Strategy (b). The complete discharging process of the battery module under the ambient temperature of 25 °C is simulated.
To evaluate the energy consumption required by each scheme, a new parameter termed as the energy ratio (η) is defined in Equation (17). h is the ratio of energy consumption of a certain Scheme to that of Scheme 2. W is the energy consumption of the battery cooling system, as shown in Equation (18). It is composed of two parts, where the first part is the energy consumption by the external cooling system, while the other part is the energy consumption by the electric water pump. EER is the external cooling energy efficiency ratio. The ambient temperature is 25 °C. Meanwhile, different inlet flow rates and temperatures are combined as a smoothing jump function, as shown in Equation (19), where pi (i = 1–4) is a constant.
Table 4 shows that only Schemes 2, 5 and 6 meet the thermal safety requirements. At the same time, Schemes 5 and 6 can save around 80% and 76% of the energy consumption, respectively. In addition, it is found in Figure 10b that the Strategy (b) in Figure 9 plays a prominent role in maintaining the uniform temperature distribution in the cell module. However, the Strategy (b) has the risk that the heat generation rate of the batteries is likely to increase as the performance of the battery decades. This may increase the difficulty for the temperature control in Strategy (b). It can be seen from Figure 10 that both the maximum temperature and temperature difference of Scheme 5 meet the requirements of BTMS design through adopting Strategy (a). The temperature distribution of the battery module at different depths of discharge is shown in Figure 10c. Based on the above discussion, controlling the inlet flow rate of the cooling liquid is an effective and economic strategy to maintain a reasonable temperature distribution in the battery module.
4. Conclusions
In the charging and discharging process of lithium-ion batteries, heat is generated and significantly changes the temperature distribution in the battery modules and packs. In this work, a heat generation for the lithium-ion battery is modeled based on the experimental data. The heat transfer model coupled with liquid cooling method is further developed for a BTMS. The matrix analysis is conducted by employing the orthogonal design method for the cooling plate structure parameters and cooling strategies. The control strategies for the BTMS are evaluated in terms of the effectiveness, thermal safety and electric power requirement. Major conclusions are drawn as follows:
- (1)
- Thermal contact resistance between the direct contacting interface between the battery and cooling plate surfaces is significant and needs to be considered in the modelling of the temperature distribution.
- (2)
- For the rectangular channels in the cooling plates, the inlet flow rate has the most significant impact on the temperature distribution in the battery module. In addition, increasing channel height can effectively decrease the parasitic energy consumption of the BTMS.
- (3)
- Among the eight temperature control schemes, Scheme 5 adjusting the inlet flow rate can maintain a reasonable temperature distribution range in the module and has a lower energy consumption, which is considered as the better temperature control scheme for the specific BTMS in this work. In addition, for Strategy (a), the response time of BTMS is only affected by the temperature distribution, not by the discharging/charging time of the battery.
Author Contributions
Conceptualization, J.D. and X.L.; methodology, J.Z. and J.Y.; data curation, X.L.; experimental design and analysis of results, S.P. and R.F.; writing—original draft preparation, J.D. and M.F.; funding acquisition, J.Y. and J.Z. All authors have read and agreed to the published version of the manuscript.
Funding
This research was supported by National Natural Science Foundation of China (NSFC, 51779025), Zhejiang Provincial Natural Science Foundation of China (No. LGG19E060003), the Ningbo Major Special Projects of the Plan “Science and Technology Innovation 2025” (2019B10048).
Institutional Review Board Statement
Not applicable.
Informed Consent Statement
Not applicable.
Data Availability Statement
Data is contained within the article.
Conflicts of Interest
The authors declare no conflict of interest.
Nomenclature
| Variables | Greek Symbols | ||
| C | specific heat (J/kg·K) | δ | thickness (m) |
| d | the equivalent diameter of the channel (m) | molecular viscosity (kg/m·s) | |
| H | height of fluid channel (mm) | λ | thermal conductivity (W/m·K) |
| j | heat transfer factor | η | ratio of energy consumption of a certain Scheme to that of Scheme 2 |
| k | rate of temperature change | ||
| L | width of fluid channel (mm) | density (kg/m3) | |
| P | static pressure (Pa) | the stress tensor | |
| Pr | Prandtl number | ||
| ΔP | pressure drop (Pa) | Subscripts | |
| qc | heat exchange between the battery and the coolant (W) | b | battery |
| c | coolant | ||
| heat generation rate per unit volume (W/m3) | env | environment | |
| R | contact thermal resistance | max | maximum |
| Re | Reynolds number | sen | sensible |
| St | Stanton number | ||
| T | temperature (°C) | Acronyms | |
| t | time(s) | BMS | Battery management system |
| ΔT | temperature difference (°C) | BTMS | Battery thermal management system |
| velocity vector | CFD | Computational fluid dynamics | |
| V | mass flow rate (kg/s) | DOD | Depth of discharge |
| Vb | battery volume (m3) | EER | Energy efficiency ratio |
| EV | Electric vehicle | ||
| HEV | Hybrid electric vehicle | ||
| PCM | Phase change material | ||
| SOC | State of charge | ||
| UDF | User defined function | ||
References
- Alptekin, E. Emission, injection and combustion characteristics of biodiesel and oxygenated fuel blends in a common rail diesel engine. Energy 2017, 119, 44–52. [Google Scholar] [CrossRef]
- Kim, J.; Oh, J.; Lee, H. Review on battery thermal management system for electric vehicles. Appl. Therm. Eng 2019, 149, 192–212. [Google Scholar] [CrossRef]
- Kukay, A.; Sahore, R.; Parejiya, A.; Blake Hawley, W.; Li, J.; Wood, D.L. Aqueous Ni-rich-cathode dispersions processed with phosphoric acid for lithium-ion batteries with ultra-thick electrodes. J. Colloid Interface Sci. 2021, 581, 635–643. [Google Scholar] [CrossRef]
- Wei, Z.; Dong, G.; Zhang, X.; Pou, J.; Quan, Z.; He, H. Noise-Immune Model Identification and State-of-Charge Estimation for Lithium-Ion Battery Using Bilinear Parameterization. IEEE Trans. Ind. Electron 2021, 68, 312–323. [Google Scholar] [CrossRef]
- Yamada, Y. Concentrated battery electrolytes: Developing new functions by manipulating the coordination states. Bull. Chem. Soc. Jpn. 2020, 93, 109–118. [Google Scholar] [CrossRef]
- Qian, Z.; Li, Y.; Rao, Z. Thermal performance of lithium-ion battery thermal management system by using mini-channel cooling. Energy Convers. Manag. 2016, 126, 622–631. [Google Scholar] [CrossRef]
- Rao, Z.; Zhang, X. Investigation on thermal management performance of wedge-shaped microchannels for rectangular Li-ion batteries. Int. J. Energy Res. 2019, 43, 3876–3890. [Google Scholar] [CrossRef]
- Ramadass, P.; Haran, B.; White, R.; Popov, B.N. Capacity fade of Sony 18650 cells cycled at elevated temperatures: Part II. Capacity fade analysis. J. Power Sources 2002, 112, 614–620. [Google Scholar] [CrossRef] [Green Version]
- Liu, H.; Wei, Z.; He, W.; Zhao, J. Thermal issues about Li-ion batteries and recent progress in battery thermal management systems: A review. Energy Convers. Manag. 2017, 150, 304–330. [Google Scholar] [CrossRef]
- Pesaran, A.A.; Burch, S.; Keyser, M. An Approach for Designing Thermal Management Systems for Electric and Hybrid Vehicle Battery Packs. In Proceedings of the Fourth Vehicle Thermal Management Systems Conference and Exhibition; London, UK, 24–27 May 1999. Available online: http://www.doe.gov/bridge/home.html (accessed on 9 July 2021).
- Al Hallaj, S.; Selman, J.R. A Novel Thermal Management System for Electric Vehicle Batteries Using Phase-Change Material. J. Electrochem. Soc 2000, 147, 3231. [Google Scholar] [CrossRef]
- Choudhari, V.G.; Dhoble, A.S.; Panchal, S. Numerical analysis of different fin structures in phase change material module for battery thermal management system and its optimization. Int. J. Heat Mass Transf. 2020, 163, 120434. [Google Scholar] [CrossRef]
- Lv, P.; Liu, C.; Rao, Z. Review on clay mineral-based form-stable phase change materials: Preparation, characterization and applications. Renew. Sustain. Energy Rev. 2017, 68, 707–726. [Google Scholar] [CrossRef]
- Wu, M.S.; Liu, K.H.; Wang, Y.Y.; Wan, C.C. Heat dissipation design for lithium-ion batteries. J. Power Sources 2002, 109, 160–166. [Google Scholar] [CrossRef]
- Liang, J.; Gan, Y.; Li, Y. Investigation on the thermal performance of a battery thermal management system using heat pipe under different ambient temperatures. Energy Convers. Manag. 2018, 155, 1–9. [Google Scholar] [CrossRef]
- Jaguemont, J.; Van Mierlo, J. A comprehensive review of future thermal management systems for battery-electrified vehicles. J. Energy Storage 2020, 31, 101551. [Google Scholar] [CrossRef]
- Panchal, S.; Gudlanarva, K.; Tran, M.; Fraser, R. High Reynold’s Number Turbulent Model for Micro-Channel Cold Plate Using Reverse Engineering Approach for Water-Cooled Battery in Electric Vehicles. Energies 2020, 13, 1638. [Google Scholar] [CrossRef] [Green Version]
- Yang, Y.; Li, W.; Xu, X.; Tong, G. Heat dissipation analysis of different flow path for parallel liquid cooling battery thermal management system. Int. J. Energy Res. 2020, 44, 5165–5176. [Google Scholar] [CrossRef]
- Zhao, C.; Cao, W.; Dong, T.; Jiang, F. Thermal behavior study of discharging/charging cylindrical lithium-ion battery module cooled by channeled liquid flow. Int. J. Heat Mass Transf. 2018, 120, 751–762. [Google Scholar] [CrossRef]
- Xu, X.; Tong, G.; Li, R. Numerical study and optimizing on cold plate splitter for lithium battery thermal management system. Appl. Therm. Eng. 2020, 167, 114787. [Google Scholar] [CrossRef]
- Deng, T.; Zhang, G.; Ran, Y. Study on thermal management of rectangular Li-ion battery with serpentine-channel cold plate. Int. J. Heat Mass Transf. 2018, 125, 143–152. [Google Scholar] [CrossRef]
- Patil, M.S.; Seo, J.H.; Panchal, S.; Jee, S.W.; Lee, M.Y. Investigation on thermal performance of water-cooled Li-ion pouch cell and pack at high discharge rate with U-turn type microchannel cold plate. Int. J. Heat Mass Transf. 2020, 155, 119728. [Google Scholar] [CrossRef]
- Zhang, T.; Gao, Q.; Wang, G.; Gu, Y.; Wang, Y.; Bao, W.; Zhang, D. Investigation on the promotion of temperature uniformity for the designed battery pack with liquid flow in cooling process. Appl. Therm. Eng. 2017, 116, 655–662. [Google Scholar] [CrossRef]
- Huang, Y.; Wang, S.; Lu, Y.; Huang, R.; Yu, X. Study on a liquid cooled battery thermal management system pertaining to the transient regime. Appl. Therm. Eng. 2020, 180, 115793. [Google Scholar] [CrossRef]
- Patil, M.S.; Seo, J.H.; Panchal, S.; Lee, M.Y. Numerical study on sensitivity analysis of factors influencing liquid cooling with double cold-plate for lithium-ion pouch cell. Int. J. Energy Res. 2021, 45, 2533–2559. [Google Scholar] [CrossRef]
- Huo, Y.; Rao, Z.; Liu, X.; Zhao, J. Investigation of power battery thermal management by using mini-channel cold plate. Energy Convers. Manag. 2015, 89, 387–395. [Google Scholar] [CrossRef]
- Wang, F.; Cao, J.; Ling, Z.; Zhang, Z.; Fang, X. Experimental and simulative investigations on a phase change material nano-emulsion-based liquid cooling thermal management system for a lithium-ion battery pack. Energy 2020, 207, 118215. [Google Scholar] [CrossRef]
- Bernardi, D.; Pawlikowski, E.; Newman, J. A General Energy Balance for Battery Systems. J. Electrochem. Soc. 1985, 132, 5–12. [Google Scholar] [CrossRef] [Green Version]
- Panchal, S.; Dincer, I.; Agelin-Chaab, M.; Fraser, R.; Fowler, M. Experimental and theoretical investigations of heat generation rates for a water cooled LiFePO4 battery. Int. J. Heat Mass Transf. 2016, 101, 1093–1102. [Google Scholar] [CrossRef]
- Moffat, R.J. Describing the Uncertainties in Experimental Results. Exp. Therm. Fluid Sci. 1988, 1, 3–17. [Google Scholar] [CrossRef] [Green Version]
- Panchal, S.; Science, A. Experimental Investigation and Modeling of Lithium-Ion Battery Cells and Packs for Electric Vehicles. Ph.D. Thesis, Faculty of Engineering and Applied Science, University of Ontario Institute of Technology, Oshawa, ON, Canada, 2016. Available online: http://hdl.handle.net/10155/747 (accessed on 9 July 2021).
- Panchal, S.; Khasow, R.; Dincer, I.; Agelin-Chaab, M.; Fraser, R.; Fowler, M. Thermal design and simulation of mini-channel cold plate for water cooled large sized prismatic lithium-ion battery. Appl. Therm. Eng. 2017, 122, 80–90. [Google Scholar] [CrossRef]
- Zhou, Y. A Matrix Analysis of Orthogonal Design. Math. Pract. Theory 2009, 29, 202–207. (in Chinese). Available online: https://kns.cnki.net/kcms/detail/detail.aspx?dbcode=CJFD&dbname=CJFD2009&filename=SSJS200902033&v=uGgOHP8P%25mmd2FYysaiZRLyVk%25mmd2FzUxqHzvuZSmDhqAuE83FhFGqZnLR9pqyfkBcCOO4vLo (accessed on 9 July 2021).
- Jin, X.; Duan, X.; Jiang, W.; Wang, Y.; Zou, Y.; Lei, W.; Sun, L.; Ma, Z. Structural design of a composite board/heat pipe based on the coupled electro-chemical-thermal model in battery thermal management system. Energy 2021, 216, 119234. [Google Scholar] [CrossRef]
Figure 1.
Battery geometry to be modeled and enlarged view of marked cross-section A.

Figure 2.
Boundary conditions and initial conditions.

Figure 3.
Meshing for battery module: (a) generated meshes for the modelled domains; (b) grid independence testing performance.
Figure 3.
Meshing for battery module: (a) generated meshes for the modelled domains; (b) grid independence testing performance.

Figure 4.
Validation of predicted temperature with the measured one at various discharging rate.

Figure 5.
Influence of channel height H and width L on (a) maximum temperature and (b) temperature difference.
Figure 5.
Influence of channel height H and width L on (a) maximum temperature and (b) temperature difference.

Figure 6.
Influence of each factor on pressure drop.

Figure 7.
Influence of inlet temperature T and inlet mass flow rate V on (a) maximum temperature and (b) temperature difference.
Figure 7.
Influence of inlet temperature T and inlet mass flow rate V on (a) maximum temperature and (b) temperature difference.

Figure 8.
The comparison of factors in different levels on (a) maximum temperature and (b) temperature difference.
Figure 8.
The comparison of factors in different levels on (a) maximum temperature and (b) temperature difference.

Figure 9.
Temperature control strategy for (a) Scheme 5 and (b) Schemes 6–8.

Figure 10.
Influence of different temperature control strategy scheme on (a) maximum temperature; (b) temperature difference; (c) temperature distribution using Scheme 5.
Figure 10.
Influence of different temperature control strategy scheme on (a) maximum temperature; (b) temperature difference; (c) temperature distribution using Scheme 5.


Table 1.
Physical parameters of the battery module adapted from [31].
Table 1.
Physical parameters of the battery module adapted from [31].
| Material | ρ (kg/m3) | C (J/kg·K) | λ (W/m·K) | μ (kg/m·s) |
|---|---|---|---|---|
| Battery | 2092 | 678 | 18.2 | - |
| Water | 998.2 | 4128 | 0.6 | 0.001001 |
| Aluminum | 2719 | 871 | 202.4 | - |
Table 2.
Orthogonal design factors and levels.
| Level | Factors | |||
|---|---|---|---|---|
| H (mm) | L (mm) | V (kg/s) | T (°C) | |
| 1 | 0.5 | 10 | 0.0005 | 20 |
| 2 | 1.0 | 15 | 0.001 | 25 |
| 3 | 1.5 | 20 | 0.005 | 30 |
| 4 | 2.0 | 25 | 0.01 | 35 |
Table 3.
Orthogonal design and results.
| Number | Factor | Evaluation Index | |||||
|---|---|---|---|---|---|---|---|
| H | L | T | V | Tmax (°C) | ΔT (°C) | ΔP (Pa) | |
| 1 | 1 | 1 | 1 | 1 | 67.29 | 29.25 | 1770.11 |
| 2 | 1 | 2 | 2 | 2 | 54.36 | 19.21 | 3525.29 |
| 3 | 1 | 3 | 3 | 3 | 39.52 | 5.95 | 6776.63 |
| 4 | 1 | 4 | 4 | 4 | 40.78 | 3.36 | 12,198.85 |
| 5 | 2 | 1 | 2 | 3 | 36.00 | 5.18 | 1789.54 |
| 6 | 2 | 2 | 1 | 4 | 26.93 | 2.96 | 2129.14 |
| 7 | 2 | 3 | 4 | 1 | 81.08 | 28.39 | 166.21 |
| 8 | 2 | 4 | 3 | 2 | 58.76 | 18.62 | 265.14 |
| 9 | 3 | 1 | 3 | 4 | 38.64 | 2.80 | 924.58 |
| 10 | 3 | 2 | 4 | 3 | 45.83 | 5.16 | 391.45 |
| 11 | 3 | 3 | 1 | 2 | 48.55 | 17.94 | 99.27 |
| 12 | 3 | 4 | 2 | 1 | 69.77 | 27.31 | 39.52 |
| 13 | 4 | 1 | 4 | 2 | 64.21 | 16.81 | 84.95 |
| 14 | 4 | 2 | 3 | 1 | 73.97 | 25.57 | 29.93 |
| 15 | 4 | 3 | 2 | 4 | 31.99 | 3.13 | 348.67 |
| 16 | 4 | 4 | 1 | 3 | 29.98 | 5.49 | 149.66 |
Table 4.
Control strategy and predicted results.
| Scheme | Vinlet (kg/s) | Tinlet (°C) | Tmax < 40 (°C) | ΔT < 5 (°C) | η | Strategy |
|---|---|---|---|---|---|---|
| 1 | 0.01 | Tinlet = Toutlet | × | × | — | — |
| 2 | 0.01 | 25 | √ | √ | 100% | Constant |
| 3 | 0.005 | 25 | × | √ | 25% | Constant |
| 4 | 0.001 | 25 | × | × | 1% | Constant |
| 5 | 0.001–0.01 | 25 | √ | √ | 20% | Strategy (a) |
| 6 | 0.001–0.01 | 25 | √ | √ | 24% | Strategy (b) |
| 7 | 0.001–0.005 | 25 | × | × | 7% | Strategy (b) |
| 8 | 0.001–0.005 | 25–20 | √ | × | Strategy (b) |
Publisher’s Note: MDPI stays neutral with regard to jurisdictional claims in published maps and institutional affiliations. |
© 2021 by the authors. Licensee MDPI, Basel, Switzerland. This article is an open access article distributed under the terms and conditions of the Creative Commons Attribution (CC BY) license (https://creativecommons.org/licenses/by/4.0/).
Share and Cite
MDPI and ACS Style
Duan, J.; Zhao, J.; Li, X.; Panchal, S.; Yuan, J.; Fraser, R.; Fowler, M. Modeling and Analysis of Heat Dissipation for Liquid Cooling Lithium-Ion Batteries. Energies 2021, 14, 4187. https://0-doi-org.brum.beds.ac.uk/10.3390/en14144187
AMA Style
Duan J, Zhao J, Li X, Panchal S, Yuan J, Fraser R, Fowler M. Modeling and Analysis of Heat Dissipation for Liquid Cooling Lithium-Ion Batteries. Energies. 2021; 14(14):4187. https://0-doi-org.brum.beds.ac.uk/10.3390/en14144187
Chicago/Turabian StyleDuan, Jiabin, Jiapei Zhao, Xinke Li, Satyam Panchal, Jinliang Yuan, Roydon Fraser, and Michael Fowler. 2021. "Modeling and Analysis of Heat Dissipation for Liquid Cooling Lithium-Ion Batteries" Energies 14, no. 14: 4187. https://0-doi-org.brum.beds.ac.uk/10.3390/en14144187
Note that from the first issue of 2016, this journal uses article numbers instead of page numbers. See further details here.