
Hydrodynamics and Mass Transfer in a Concentric Internal Jet-Loop Airlift Bioreactor Equipped with a Deflector


Department of Process Engineering, Faculty of Mechanical Engineering, Czech Technical University in Prague, Technická 4, 160 00 Prague, Czech Republic
*
Author to whom correspondence should be addressed.
Energies 2021, 14(14), 4329; https://0-doi-org.brum.beds.ac.uk/10.3390/en14144329
Submission received: 31 May 2021
/
Revised: 9 July 2021
/
Accepted: 12 July 2021
/
Published: 18 July 2021
(This article belongs to the Special Issue Modeling, Optimization and Control in Algal Biotechnology)
Abstract
:The gas–liquid hydrodynamics and mass transfer were studied in a concentric tube internal jet-loop airlift reactor with a conical bottom. Comparing with a standard design, the gas separator was equipped with an adjustable deflector placed above the riser. The effect of riser superficial gas velocity uSGR on the total gas holdup εGT, homogenization time tH, and overall volumetric liquid-phase mass transfer coefficient kLa was investigated in a laboratory bioreactor, of 300 mm in inner diameter, in a two-phase air–water system and three-phase air–water–PVC–particle system with the volumetric solid fraction of 1% for various deflector clearances. The airlift was operated in the range of riser superficial gas velocity from 0.011 to 0.045 m/s. For the gas–liquid system, when reducing the deflector clearance, the total gas holdup decreased, the homogenization time increased twice compared to the highest deflector clearance tested, and the overall volumetric mass transfer coefficient slightly increased by 10–17%. The presence of a solid phase shortened the homogenization time, especially for lower uSGR and deflector clearance, and reduced the mass transfer coefficient by 15–35%. Compared to the gas–liquid system, the noticeable effect of deflector clearance was found for the kLa coefficient, which was found approx. 20–29% higher for the lowest tested deflector clearance.
1. Introduction
1.1. Algae Potential
Algae represent a wide group of aquatic photosynthetic organisms ranging from a single cell to multicellular structures. Two main groups called microalgae and macroalgae; therefore, are distinguished. The details regarding the bioactive compounds produced by macroalgae are presented by Lafarga et al. [1], and cultivation systems are discussed by Papacek et al. [2].
The microalgae produce lipids, polysaccharides, pigments (carotenoids), vitamins, and other biologically active substances having antioxidant, antibacterial, antitumor, antihypertensive, neuroprotective, anti-inflammatory, and immunostimulating effects [3]. Carotenoids such as β-carotene [4], astaxanthin [5], and lutein [6] are produced by microalgae. On the health market, the natural β-carotene produced by microalgae is valued more than that synthetically produced. Guedes et al. [4] reported that the price of microalgae β-carotene produced in the year 2011 reached 700 €/kg, more than twice compared with synthetically produced substances.
To produce 1 kg of biomass, the microalgae consumes 1.8 to 2 kg of CO2 [3]. Therefore, microalgae is a highly efficient system for CO2 fixation compared with agricultural crops or forests, due to much higher growth rates and a very short harvesting cycle [7]. The potential of microalgal CO2 sequestration was discussed for fuel gases generated by the power industry [8] or car vehicles [9]. Thanks to the high content of lipids and polysaccharides and high biomass yield connected with fast growth, microalgae have been considered as the third generation feedstock for biodiesel and bioethanol production [10]. The microalgae potential for biodiesel production was investigated in an airlift reactor and bubble column [11], or integrated with a wastewater treatment system [12]. The effect of CO2-enhanced gas on lipid production was investigated by Hosseini et al. [13].
1.2. Microalgae Cultivation
Microalgae have been cultivated in open or closed systems—photobioreactors. The three main types of closed systems used for microalgae cultivation are tubular, vertical column, and flat panel bioreactors. The advantages and disadvantages of the used systems and how to select the system most suitable for algae production are discussed in many papers [14,15,16,17,18].
The bubble column is the basic type of vertical column-based reactor that is traditionally used in the chemical industry in operations, accompanied by intensive mass and heat transfer between phases such as oxidation, chlorination, alkylation, polymerization, and hydrogenation. The heat transfer in a bubbled column was investigated in coalescent [19] and non-coalescent liquids [20] for various superficial velocities. The airlift reactors (ALRs) were derived from bubble columns to achieve a more homogeneous flow pattern [21]. The airlift reactors consist of two zones: (i) An aerated zone called a riser, in which gas is sparged into the liquid; and (ii) a no-aerated zone called a downcomer. The zones can be formed in one column (internal-loop airlift) by division of column volume by a draft tube or by splitting baffle. The liquid phase can be sparged inside the draft tube (central aeration) or outside the tube in the annulus (perimeter aeration, annulus sparged). Unlike this, in the external-loop reactors, the riser and the downcomer are two physically separated columns whose upper and bottom parts are connected. According to Assunção and Malcata [18], industrial production remains challenging due to the constraints given by classical cultivation systems. They discussed the various nonconventional designs and modifications of conventional geometries which have been tested in recent years. The conventional internal loop airlift concentric draft tube is integrated and is modified with a static mixer or baffle (airlift baffled draft tube) to improve mixing efficiency or mechanical stirrers are added inside the draft tube or air is directly sparged through the inner cylinder. Kaewpintong et al. [22] investigated the effect of geometry and operation parameters on the cultivation performance of Haematococcus pluvialis producing astaxanthin, an antioxidant carotenoid. The experiments were carried out in a bubble column and internal-loop ALR. The highest cultivation performance was found in the ALR with AD/AR of 3.2 for the lowest superficial gas velocity of 0.004 m/s. The higher aeration rate was found to be less effective, probably due to the higher cell sensitivity to shear stress caused by aeration. Ranjbar et al. [5] reported a higher production rate for astaxanthin in an internal-loop draft tube ALR compared to a bubble column. Chiu et al. [23] tested three types of photobioreactors: (i) Bubble column, (ii) internal airlift with a concentric tube, and (iii) internal airlift with a porous concentric tube for CO2 fixation. The internal airlift equipped with the porous concentric tube was found to be more efficient, reaching higher maximum biomass concentration and specific growth rate compared with the airlift with non-porous centric tube and bubble column. Hosseini et al. [11] analyzed the performance of bubble column and internal-loop airlift reactor with draught tube for biodiesel production. The higher biomass productivity was found in the bubble column. Unlike this, the higher lipid content leading to the higher lipid volumetric productivity was observed in the airlift reactor. Despite this finding, they considered the greater potential of bubble columns for large-scale biodiesel production.
It should be also noted that, besides cultivation, microalgae harvesting and dewatering [24] play an important role in the effective and sustainable production of microalgae biomass. Bělohlav and Jirout [25] developed a methodology for the design of harvesting and dewatering equipment that was based on the measured settling velocity and microalgae cell size. Acién et al. [26] analyzed costs of a real facility for the production of high-value microalgae biomass occurring in ten 3 m3 tubular photobioreactors operated in Almería (Spain). The microalgae were harvested by centrifugation and then dehydrated by freeze-drying. They reported a productivity of 90 t/(ha.year) and a production cost of 69 €/kg. Labor and depreciation were found to be the major items. The centrifugal pumps recirculating the microalgae culture consume over 53% approx. of the total electricity consumption. The air blowers are the second highest consumer, consuming 21% of electricity.
1.3. Internal-Loop Airlift Reactor
The advantages and limitations of airlift reactors adapted from the literature [8,15,17,18,21] are presented in Table 1. The simple design, no moving parts, and relatively low shear stress are the biggest advantages of airlift reactors. In general, increasing the aeration rate improves mixing and mass transfer, but on the other side, shear stress increases what can be a problem for some cells sensitive to stress [22].
Gas injected into the riser zone induces a highly turbulent flow and high gas holdup. The hydrodynamics is similar to bubble columns. The liquid is returned to the riser inlet through the downcomer. The downcomer hydrodynamics can be approximated by the plug flow model. Zhang et al. [21] note that the novel ideas in downcomer design enabling to control flow may allow utilizing the potential of airlift reactors. The riser and the downcomer are connected at the upper part by the degassing section and by the bottom section at the lower part. The flow regimes in these sections can be modeled as continuously stirred reactors. In the degassing zone, depending on the geometry and operating conditions, the gas or its part escapes from the circulating liquid. Heijnen et al. [27] defined three typical flow regimes in downcomers of internal-loop ALRs depending on the increasing superficial velocity: (i) No bubbles enter the downcomer and gas escapes from the free liquid surface (regime I); (ii) part of the bubbles, mainly small bubbles, is entrained into the downcomer by the down-flowing liquid (regime II); and (iii) complete gas recirculation into the riser (regime III). The role of the bottom section is often mispriced. Koide et al. [28] reported increasing circulating liquid flow with increasing bottom clearance with riser diameter within the range CB/DR ≤ ½. For a higher ratio, the flow was unchanged. Lu et al. [29] studied the hydrodynamics and mass transfer characteristics in concentric tube airlift, modified square airlift reactor, and square bubble column. They reported larger ε, slightly longer homogenization time, and larger kLa for the square airlift reactor compared to standard airlift. Zhang et al. [30] investigated the effect of conical bottom and funnel-shaped internal above the tubular riser on hydrodynamics experimentally and by CFD. Installing the internals, the gas holdup was enhanced by a maximum of 15%, and the turbulent kinetic energy can be reduced by a maximum of 7.8%, which can be promising for stress-sensitive biological processes. The published data on the measurement methods, hydrodynamic characteristics, and modeling of flow dynamics in airlift reactors were summarized by Zhang et al. [21].
1.4. Main Operational Parameters
1.4.1. Total Gas Holdup
The gas holdup represents the gas volume fraction occupied in the gassed batch:
where VG is the volume of the gas phase, Vbed is the total volume of a gassed batch. When the gas holdup is investigated in the gas–liquid–solid dispersion, the Vbed represents the sum of the volumes of the present phases.
The effect of superficial gas velocity uSG on gas holdup εG has been usually described by the power-law function [31]:
where uSG is the superficial gas velocity related to the column diameter (uSGC) or riser diameter (uSGR), and C and α are empirical constants depending on gas and liquid physical properties, hydrodynamic regime, and column geometry. The selected published correlations adapted from the literature [19,31,32,33,34,35] are presented in Table 2.
1.4.2. Homogenization Time
The homogenization time is one of the important parameters for the design of photobioreactors. Shorter homogenization time indicates intensive mixing and enables to reach a faster homogeneous concentration distribution. The homogenization time is defined as the time required to achieve a homogenous mixture after the injection of a tracer solution [15]. Sanchéz Mirón et al. [36] tested the correlation proposed by Bando et al. [37] in the draft tube airlift reactor of 0.193 m in reactor diameter. They found the tested correlation overpredicted the time for the column superficial gas velocity uSGC in the range from 0 to 0.01 m/s, where the mixing is most sensitive to aeration velocity. The selected published correlations for homogenization time adapted from the literature [29,37,38,39] are presented in Table 3.
1.4.3. Overall Volumetric Mass Transfer Coefficient kLa
The mass transfer is most frequently described by the overall volumetric mass transfer coefficient kLa. Koide et al. [40] investigated kLa coefficients in internal-loop ALRs and bubble columns of different sizes and gas distributor types for demineralized water and five Newtonian solutions and air as a gaseous phase. The kLa coefficient was found to be larger in ALR compared to the bubble column. Increasing DR/DD ratio, the kLa coefficient decreases. Gavrilescu and Tudose [41] investigated the effect of top and bottom clearance and AD/AR ratio on kLa coefficient in three concentric-tube ALRs of different scales (0.07, 2.50, and 5.20 m3) in non-coalescent Newtonian fluid (sodium sulfite solution). Gouveia et al. [35] investigated the effects of riser superficial gas velocity, bottom clearance, and top clearance on kLa coefficient in the air–water system using sulfite oxidation method in an internal-loop ALR of 6 dm3 volume with AD/AR = 0.63. Juraščík et al. [32] investigated kLa coefficients in three airlift reactors of different sizes (12 dm3, 40 dm3, and 195 dm3). Cerri et al. [42] investigated the effects of riser superficial gas velocity and physical properties (DL, υ, ρ, and σ) in three concentric tube ALRs of different sizes (2, 5, and 10 dm3) with cross-piece type sparger. The experimental data obtained for eight Newtonian fluids and five non-Newtonian fluids were fitted using a correlation type originally proposed by Akita and Yoshida [43] for bubble columns. The effect of superficial gas velocity uSG on the overall volumetric mass transfer coefficient kLa has been usually also described by the power-law function. The selected published correlations for kLa adapted from the literature [32,33,35,36,40,41,42,44,45] are presented in Table 4.
1.4.4. Effect of Solid Phase
Koide et al. [45] investigated the effect of column diameter, gas velocity, liquid properties, and size and concentration of gel particles in a conical draft tube ALR with a conical bottom. The solid phase concentration was varied in the range from 0 to 20 vol.%. They found the presence of gel particles reduced the values of the gas holdup and the overall volumetric mass transfer coefficient. The degree of reduction increased with increasing solid concentration and was independent of gel particle diameter in the range from 1.88 to 3.98 mm. Yang et al. [46] investigated the effect of superficial gas velocity and top clearance on hydrodynamics and mass transfer in the gas–liquid and gas–slurry system in internal loop airlift with draft tube (DD/DR = 140/280 mm) and perimeter aeration. The aluminum oxide particles with a diameter of 98.67 μm were used as the solid phase. The experiments were carried out at a volumetric solid loading of 0.5%. The effect of top clearance on the kLa coefficient was found when the superficial gas velocity was higher than 0.034 m/s. The increase of kLa coefficient in the gas–slurry system was approx. 8% for the superficial gas velocity higher than 0.034 m/s. Sastaravet et al. [47] investigated the effect of polypropylene particles of different shapes and solid loading on the bubble hydrodynamics and mass transfer in a bubble column and internal-loop airlift reactor with a splitting baffle. The enhancement of the kLa coefficient up to 38.5% was achieved in the airlift reactor when the solid particles were added. The solid particles shaped like cylinders and rings were found to be most effective for kLa enhancement.
1.5. Motivation
Based on the standard design, we designed a novel configuration of an internal jet-loop airlift reactor. The gas separator was equipped with an adjustable deflector placed above the riser. Installing the deflector, the fluctuation of the dispersion level should be stabilized in the gas separator and the contact time between liquid and gas bubbles should be prolonged. The conical airlift bottom was used for better flow direction in the bottom section and elimination of particle accumulation in a dead zone when the flat bottom is used. The preliminary results were presented in our previous work [48].
This work aims to study the effects of riser superficial gas velocity uSGR and deflector clearance CD above a riser on total gas holdup εGT, homogenization time tH, and overall volumetric liquid-phase mass transfer coefficient kLa in the two-phase gas–liquid system and three-phase gas–liquid–solid system in the range of riser superficial gas velocity up to 0.045 m/s.
2. Materials and Methods
2.1. Experimental Apparatus
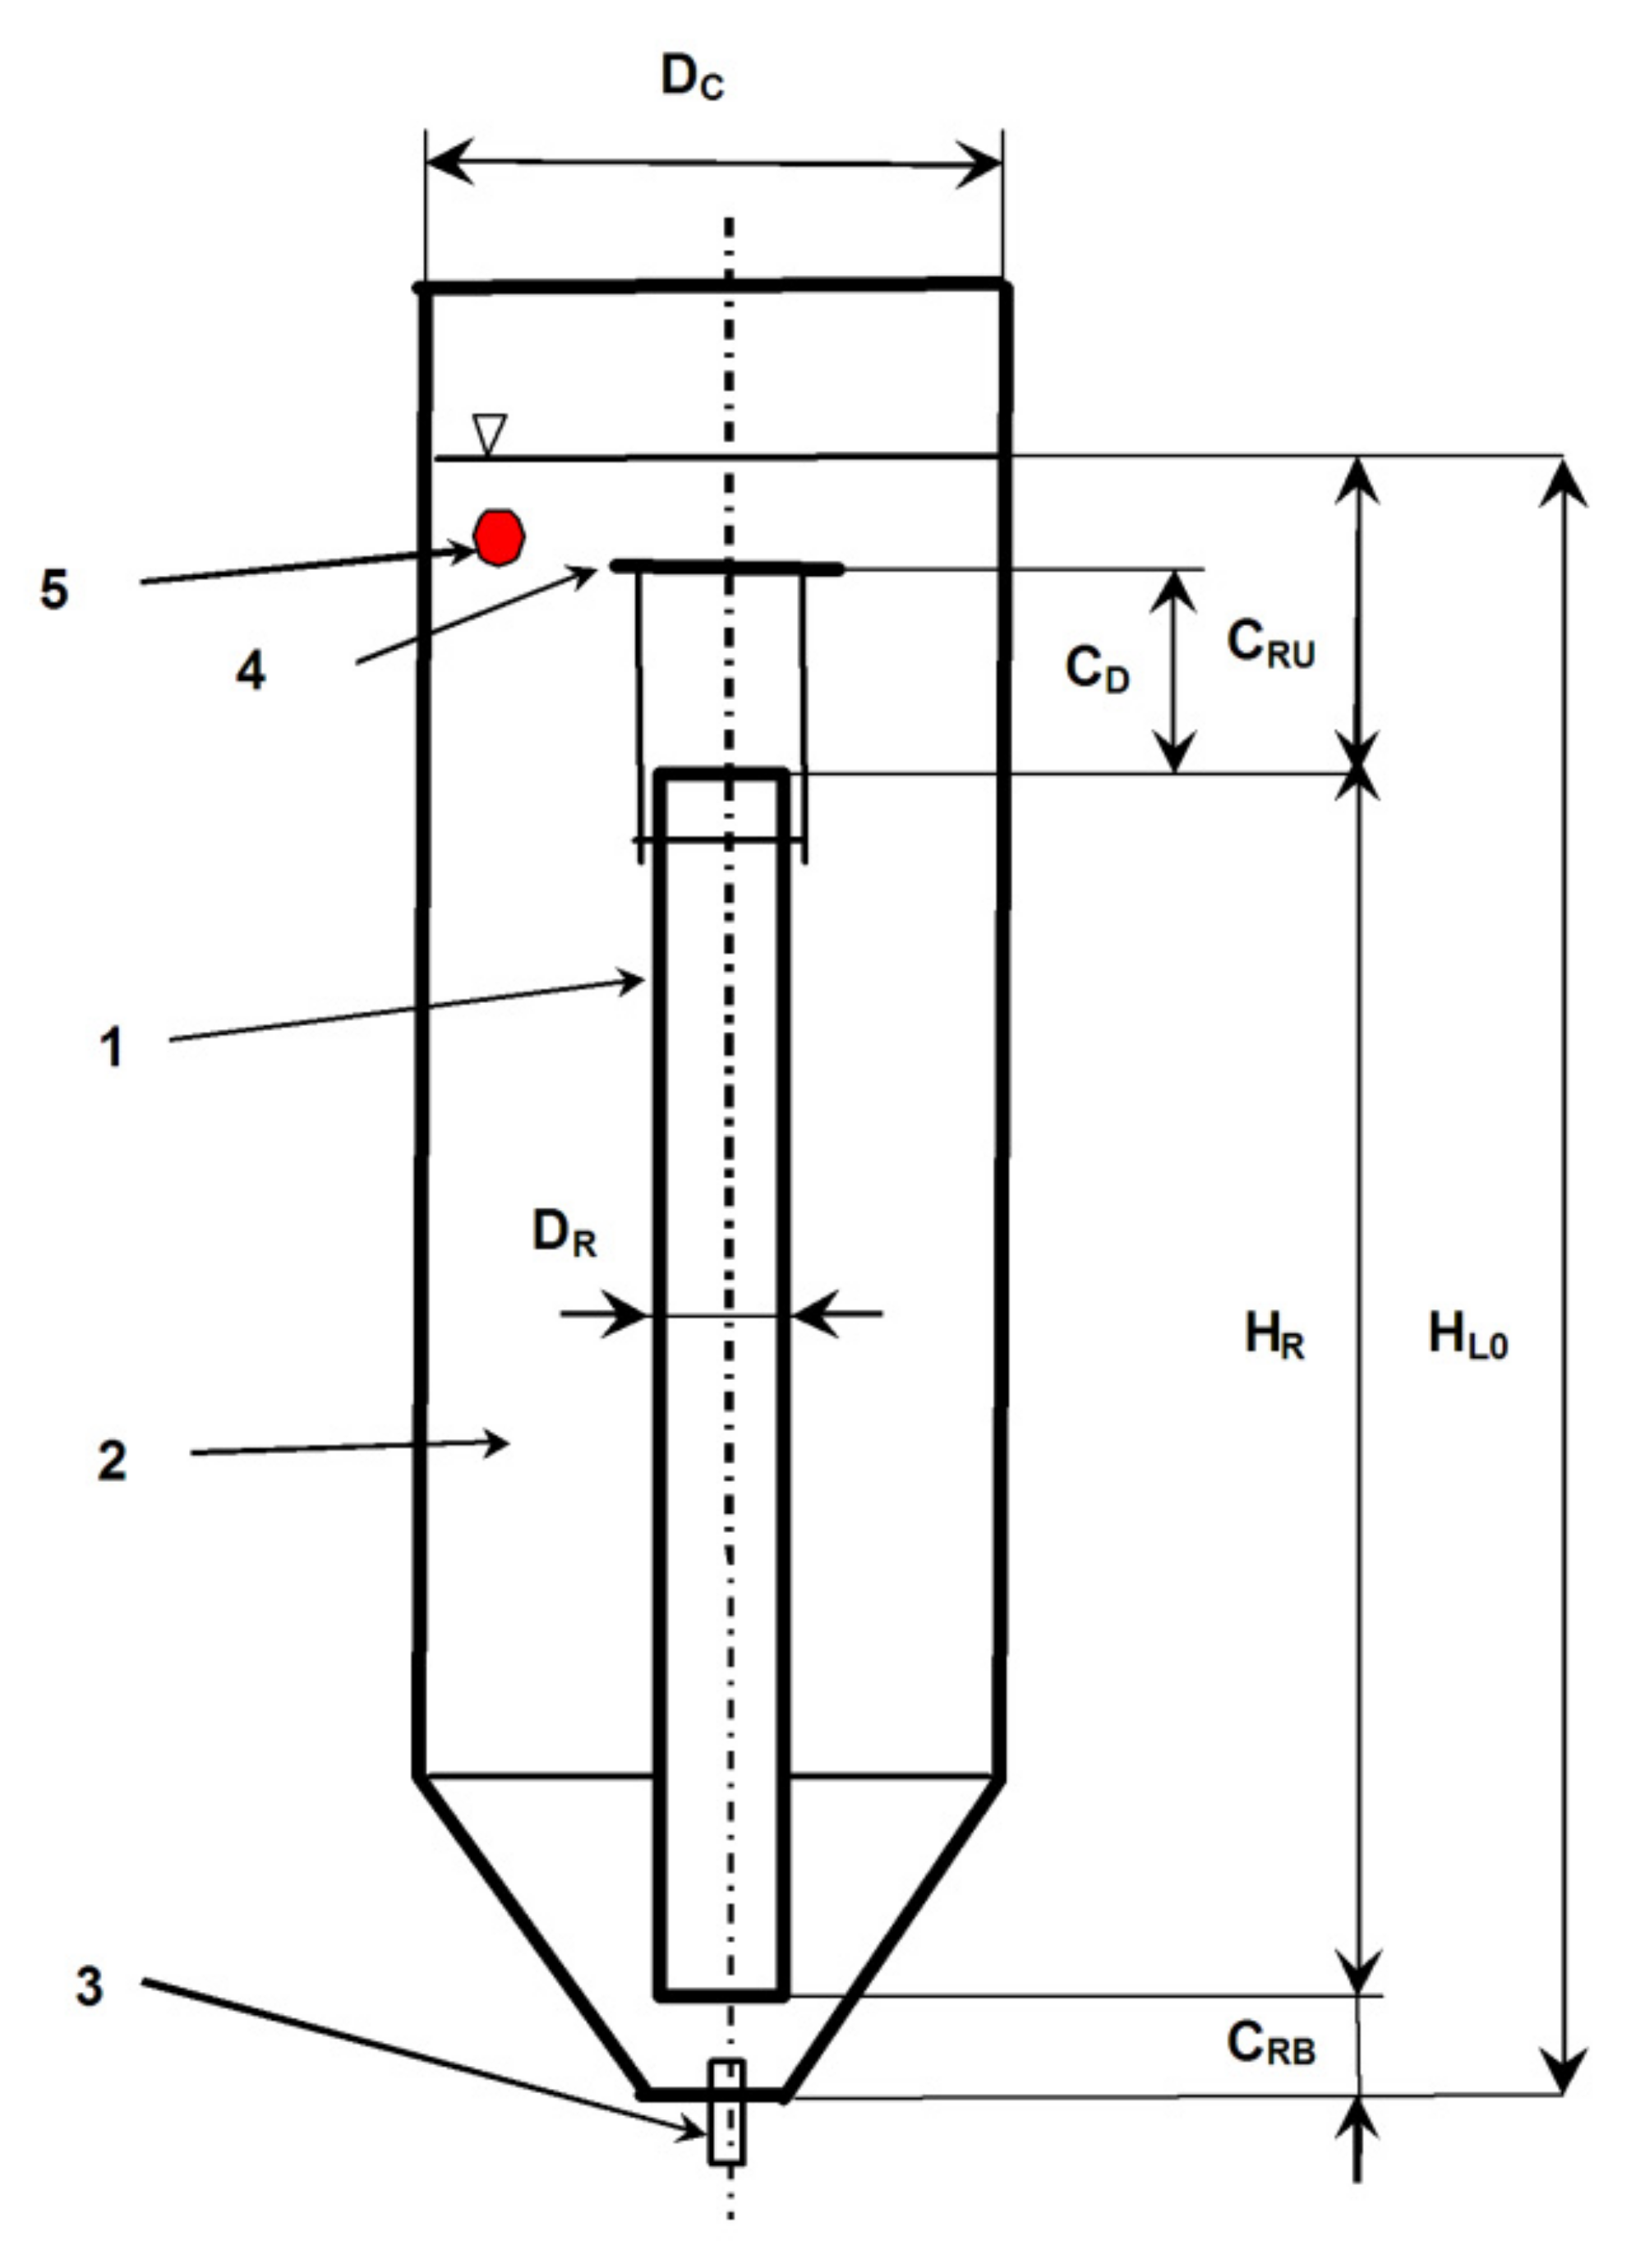
The experiments were carried out in a laboratory conical jet-loop airlift bioreactor of 300 mm inner diameter and volume of 62.5 dm3. The geometrical parameters are presented in Table 5. The tap water was used as a model liquid and the air was fed into the airlift reactor via a single nozzle having three orifices of 1 mm in hole diameter. The scheme of the experimental apparatus is depicted in Figure 1.
2.2. Experimental Conditions
The air–water system was used as a tested two-phase gas–liquid system. The extruded PVC rods of diameter 4 mm and length ranging from 2.5 to 4 mm were used as the model solid phase. The solid phase fraction used was 1% v/v. The air flow rate was in the range of riser superficial gas velocity uSGR from 0.011 to 0.045 m/s. The airlift was operated in regime I according to the classification given by Heijnen et al. [27]. The experimental conditions are summarized in Table 6.
2.3. Experimental Methods
2.3.1. Total Gas Holdup
The gas holdup was determined visually by the measurement of the difference between the non-aerated liquid level and the aerated liquid level. The overall gas holdup εGT was determined by measuring the bed height at a given superficial gas velocity as:
where HG+L+S is the gassed bed height, HL+S is the height of the liquid/suspension before aeration.
The effects of riser superficial gas velocity uSGR and deflector clearance CD on the measured total gas holdup εGT were correlated using the power-law function:
where is the dimensionless deflector clearance; CRU is the riser upper clearance; C, α and β are model parameters.
2.3.2. Homogenization Time
The homogenization time was measured by the decolorization technique [49] using 1M NaOH and 10% wt. H2SO4. Phenolphthalein was used as an indicator.
The effects of riser superficial gas velocity uSGR and deflector clearance CD on the measured homogenization time tH were correlated using the power-law function:
Alternatively, the experimental data were successfully correlated using a combined exponential- and power-law function:
2.3.3. Overall Volumetric Liquid-Phase Mass Transfer Coefficient kLa
The overall volumetric mass transfer coefficient kLa was determined using the unsteady dynamic method from the oxygen probe response curve [50]. The water was deoxygenated by nitrogen N2. Then the water was re-oxygenated by air. The time evolution of dissolved oxygen concentration was measured by an oxygen probe. Applying film theory, the oxygen transfer rate (OTR) between gas and liquid can be expressed in a given spot as follows:
where kL is the overall mass transfer coefficient related to liquid-phase side, SG is the gas-to-liquid interfacial area, cL is the mass concentration of dissolved oxygen in the liquid, is the mass concentration of dissolved oxygen in the liquid at saturation, a is the specific gas to liquid interfacial area. In practice, the product of kL and a, called volumetric mass transfer coefficient, has been evaluated due to the experimental difficulties of determination of kL and separately. Assuming that = const. in a given spot (i.e., the oxygen fraction in air bubbles in a given spot is practically stable during absorption), the following relation can be obtained by integration of Equation (3):
where t is the time, cL(t) is the dissolved oxygen concentration at time t, and cL (t = 0) is the initial dissolved oxygen concentration.
In this work, the response time of the oxygen probe was taken into account. The kLa coefficient was determined using the following relation [51]:
where is the response time of the oxygen probe. The dissolved oxygen concentration in the liquid was measured by an oxygen optiluminiscence probe FDO 925 (WTW Germany). The response time of this probe is 30 s. The oxygen probe was placed in the middle of the annulus and the measuring part was immersed 25 mm below the liquid level.
The kLa coefficient was obtained using Equation (5) by the fitting of the time course of dissolved oxygen concentration using nonlinear regression. For kLa determination, only part of the data record of cL (t) was used. The time dependence of dissolved oxygen was transformed into the time dependence of the relation ln( − cL (t)). The part of the record having a linear course of the time dependence of the relation ln( − cL (t)) was identified as relevant for kLa determination.
For kLa data correlation, the kLa value obtained at experimental temperature T has to be corrected to the reference temperature Tref [52]. The kLa value obtained at temperature T was corrected to the reference temperature T = 20 °C as follows [52]:
where (kLa)T is the mass transfer coefficient measured at temperature T, (kLa)20 is the mass transfer coefficient at reference temperature 20 °C, and C is the empirical temperature correction factor. Bewtra et al. [52] present factor C as 1.0192 and Nogaj and Hurwitz [53] presented the value 1.024 as the factor. It should be noted that this approach has been critically discussed [54]. Nevertheless, in this work, the measured values of the overall volumetric mass transfer coefficient were corrected onto 20 °C using this approach and the factor of 1.024.
The effects of riser superficial gas velocity uSGR and deflector clearance CD on the temperature corrected overall volumetric mass transfer coefficient kLa were correlated using the power-law function:
Alternatively, the experimental data were successfully correlated using a combined exponential- and power-law function:
2.3.4. Statistical Analysis
The effects of riser superficial gas velocity uSGR and deflector clearance CD on the properties investigated were analyzed statistically using hypothesis testing [55]. For this analysis, the power-law dependence is assumed. The statistical method of hypothesis testing can estimate whether the differences between the predicted power-law exponent αpred and the evaluated power-law exponent αcalc from the measured data are negligible. The testing characteristics t is calculated:
where yexp,i is the experimental value of an investigated property for the independent variable xi, C is the constant of proportionality of power-law function, sα is the standard deviation of a power-law exponent α, m is the number of experimental data items. If the absolute value of the calculated testing characteristics is less than the critical value of the t-distribution for (m − 2) degrees of freedom and significance level α, the difference between αcalc and αpred can be assumed statistically negligible. The significance level α = 0.05 [56] was used for the determination of the critical t-value. The t-distribution coefficient t(m−2),α is 4.3027 for four riser superficial gas velocities, and the significance level α = 0.05.
Three statistical parameters were used as evaluating parameters of the proposed correlations, which are computed as follows [57]:
- (i)
- average absolute error (AAE):
- (ii)
- average biased error (ABE):
- (iii)
- coefficient of determination (R2):where ypred,i is the property value predicted by proposed correlation, is the average of experimental property values. These three statistical criteria are employed to assess the applicability of proposed or tested correlations [58]. The average absolute error (AAE) measures the degree of closeness between the predicted and measured results [57]. A smaller value of AAE indicates higher accuracy of the proposed correlation [58]. The average biased error (ABE) indicates the degree of overestimation and underestimation of proposed or tested correlation [57]. The positive value of ABE indicates an overall overestimation, whereas a negative value of ABE indicates an overall underestimation [58]. The coefficient of determination (R2-value) is used to determine the degree of goodness and accuracy of proposed or tested correlation [57]. A higher R2-value indicates a better fitting quality of correlation used [58]. The proposed or tested correlation is considered the best fitting model if the AAE and ABE values tend to zero and R2-value is close to 1 [57].
3. Results
3.1. Total Gas Holdup
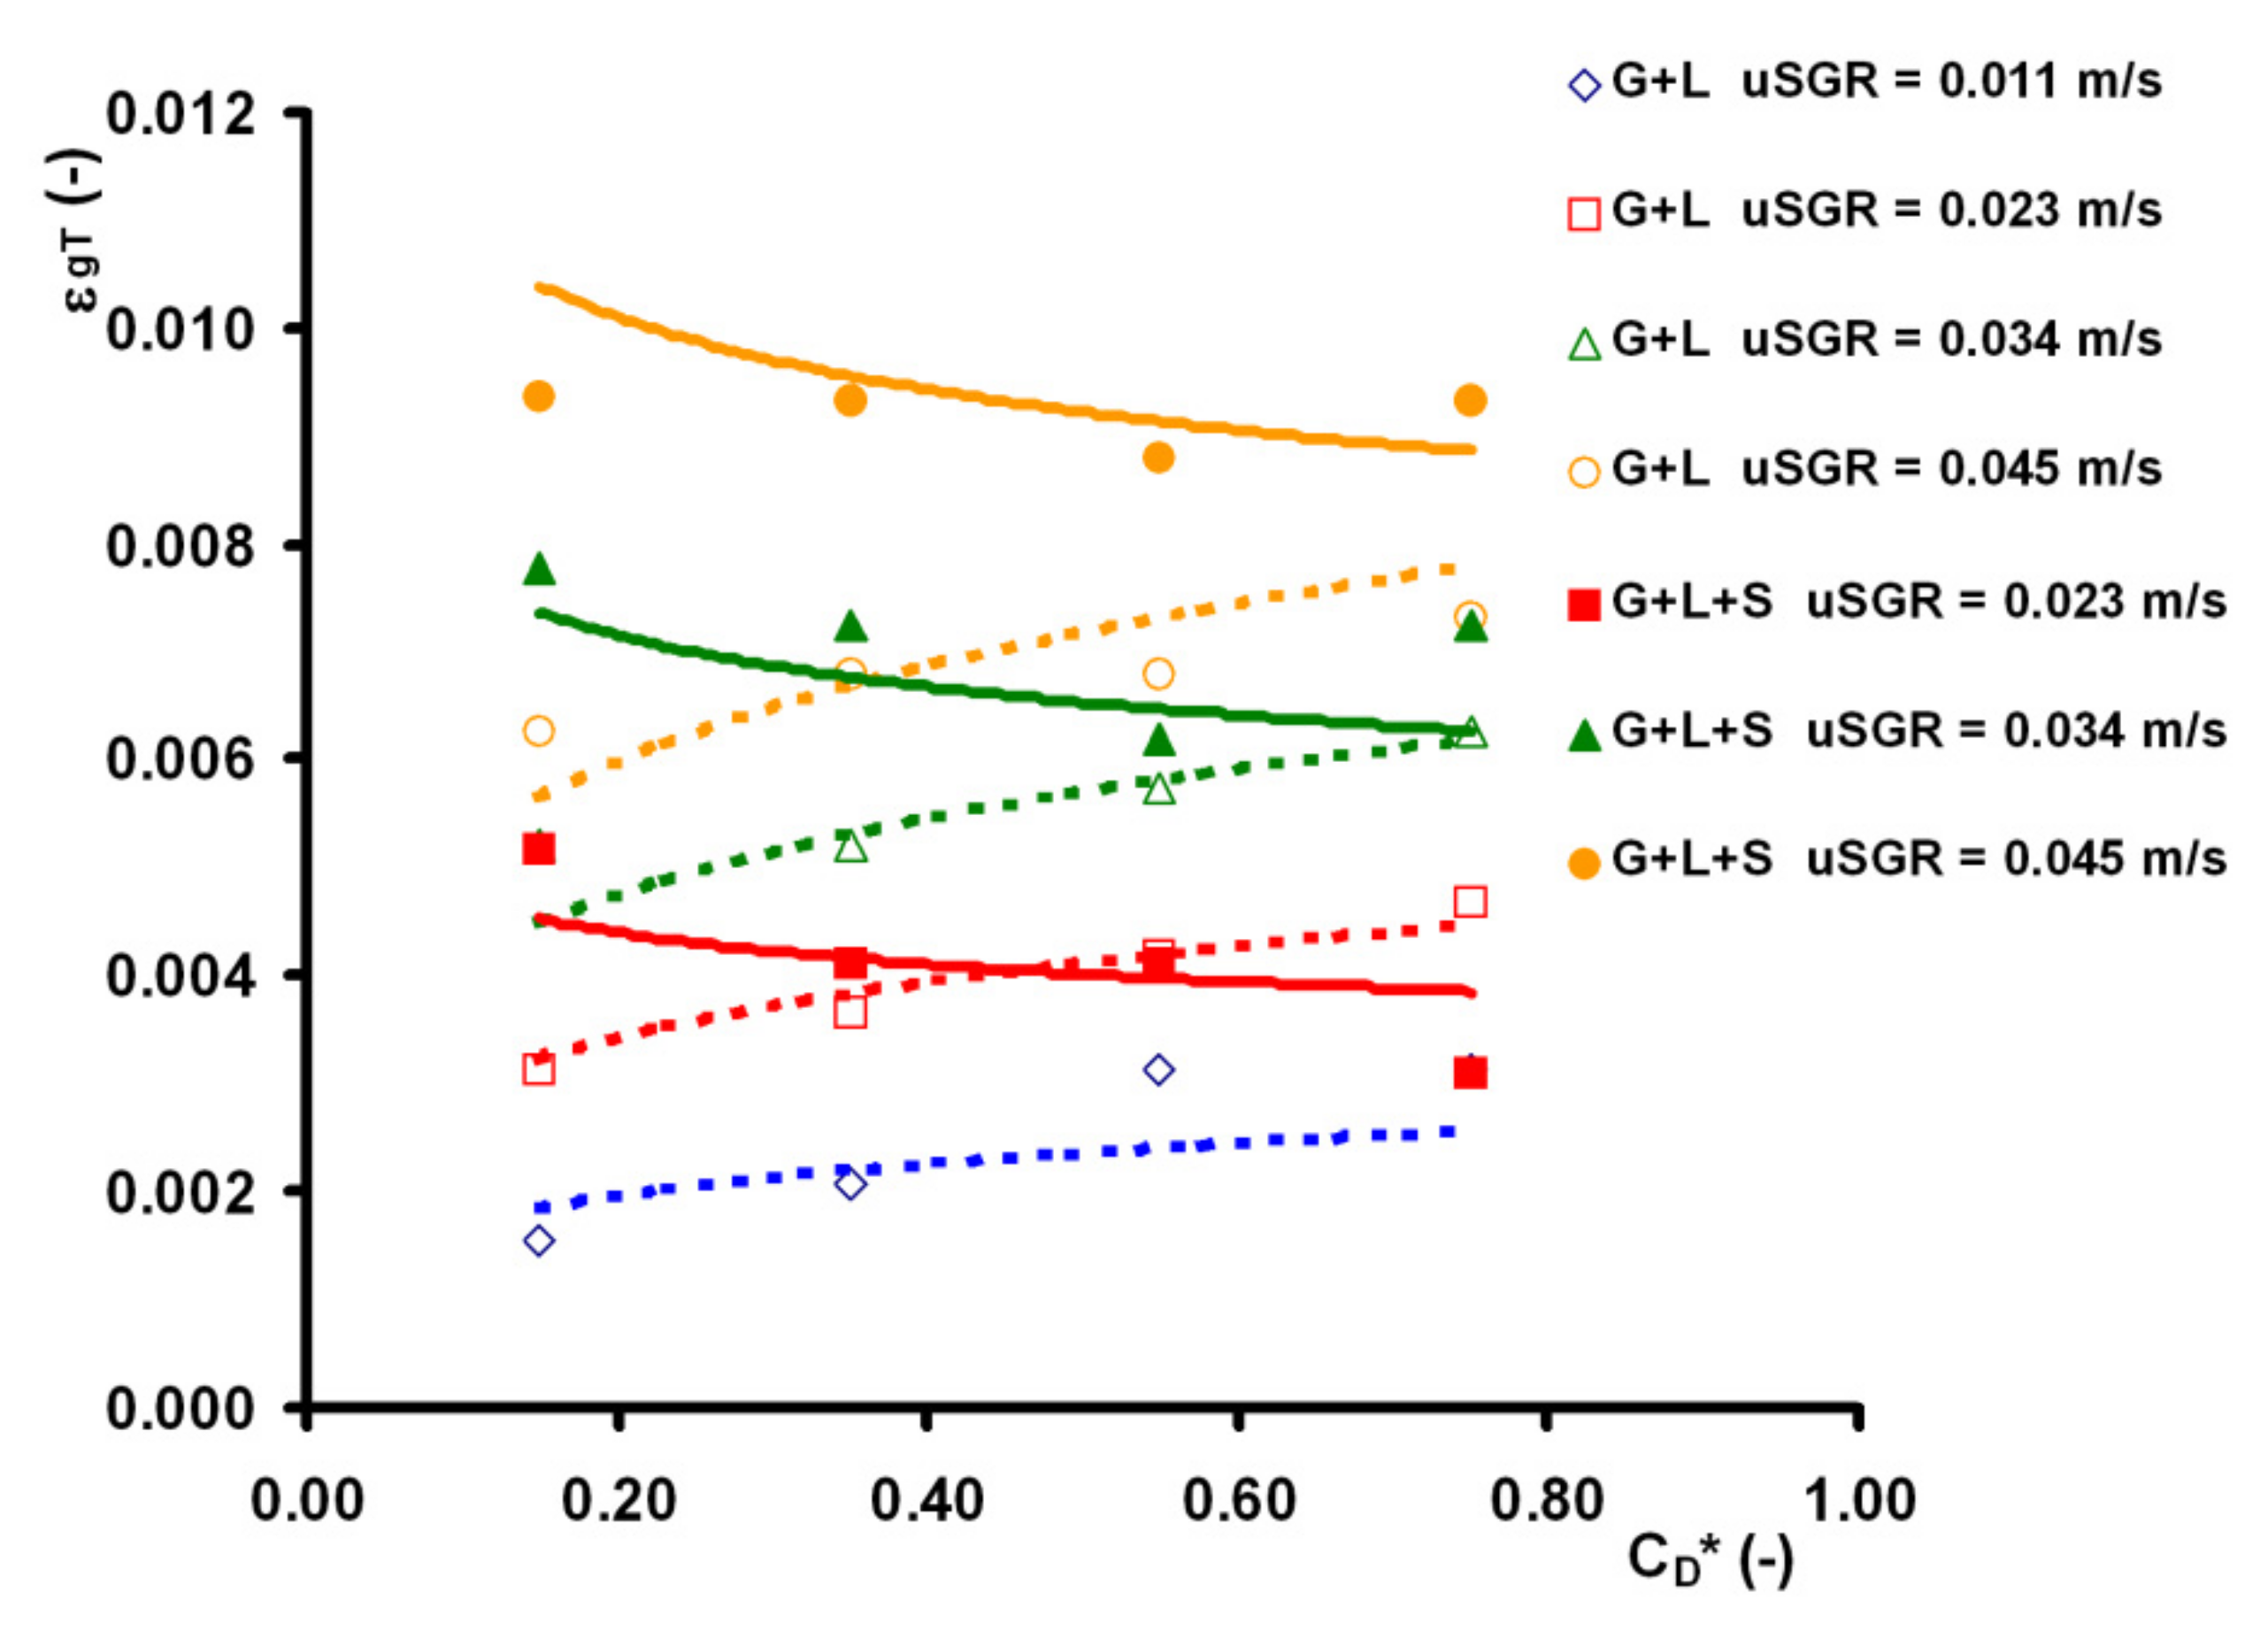
The measured values of total gas holdup are shown in Figure 2 as a function of dimensionless deflector clearance for the gas–liquid and gas–liquid–solid systems. For comparison, the values calculated using the proposed correlation (4) are shown also. For the gas–liquid–solid system, the riser superficial velocity of 0.011 m/s was insufficient to suspend all solid particles.
As was expected, reducing the deflector clearance, the total gas holdup decreases for the gas–liquid system. Unlike this, the weak effect of deflector clearance was observed for the gas–liquid–solid system, especially for higher uSGR. The higher gas holdup was observed for the lowest uSGR and the smallest deflector clearance. Competitive impingement between aeration, particle suspension, and flow restriction due to changing deflector clearance may result in this dissimilar behavior. It can be indicated by unconsolidated values of α-exponent and β-exponent (Table 7 and Table 8 in detail).
The values of the power law exponent for superficial gas velocity reported in the literature range usually in the range from 0.647 to 1.2 for the gas–liquid system. Analyzing overall data, the α-values of 0.802 and 1.187 were obtained for the gas–liquid system and gas–liquid–solid system, respectively. The applicability of the α-values of 0.8 and 1.2 for gas–liquid system and gas–liquid–solid system, respectively, was tested using the hypothesis test for each deflector clearance separately. The hypothesis testing was done for both the gas–liquid system and the gas–liquid–solid system. The hypothesis test results are presented in Table 7. For illustration, the average values of the calculated t values are presented here also. Except for = 0.75 in the gas–liquid system, the proposed α-values were statistically confirmed for both systems.
The effect of deflector clearance on total gas holdup was tested for each riser superficial gas velocity. In this case, the independence of total gas holdup of the deflector clearance was tested as the hypothesis, that is, εGT = B.()0 = const. (i.e., βpred = 0). The hypothesis test results are presented in Table 8. Statistically, the effect of deflector clearance can be neglected for the gas–liquid–solid system, and at higher uSGR in the gas–liquid system. Analyzing the overall data, the β-values of 0.205 and −0.125 were obtained for the gas–liquid system and gas–liquid–solid system, respectively. For the data correlation, the β-values of 0.2 and −0.1 were assumed for the gas–liquid system and gas–liquid–solid system, respectively.
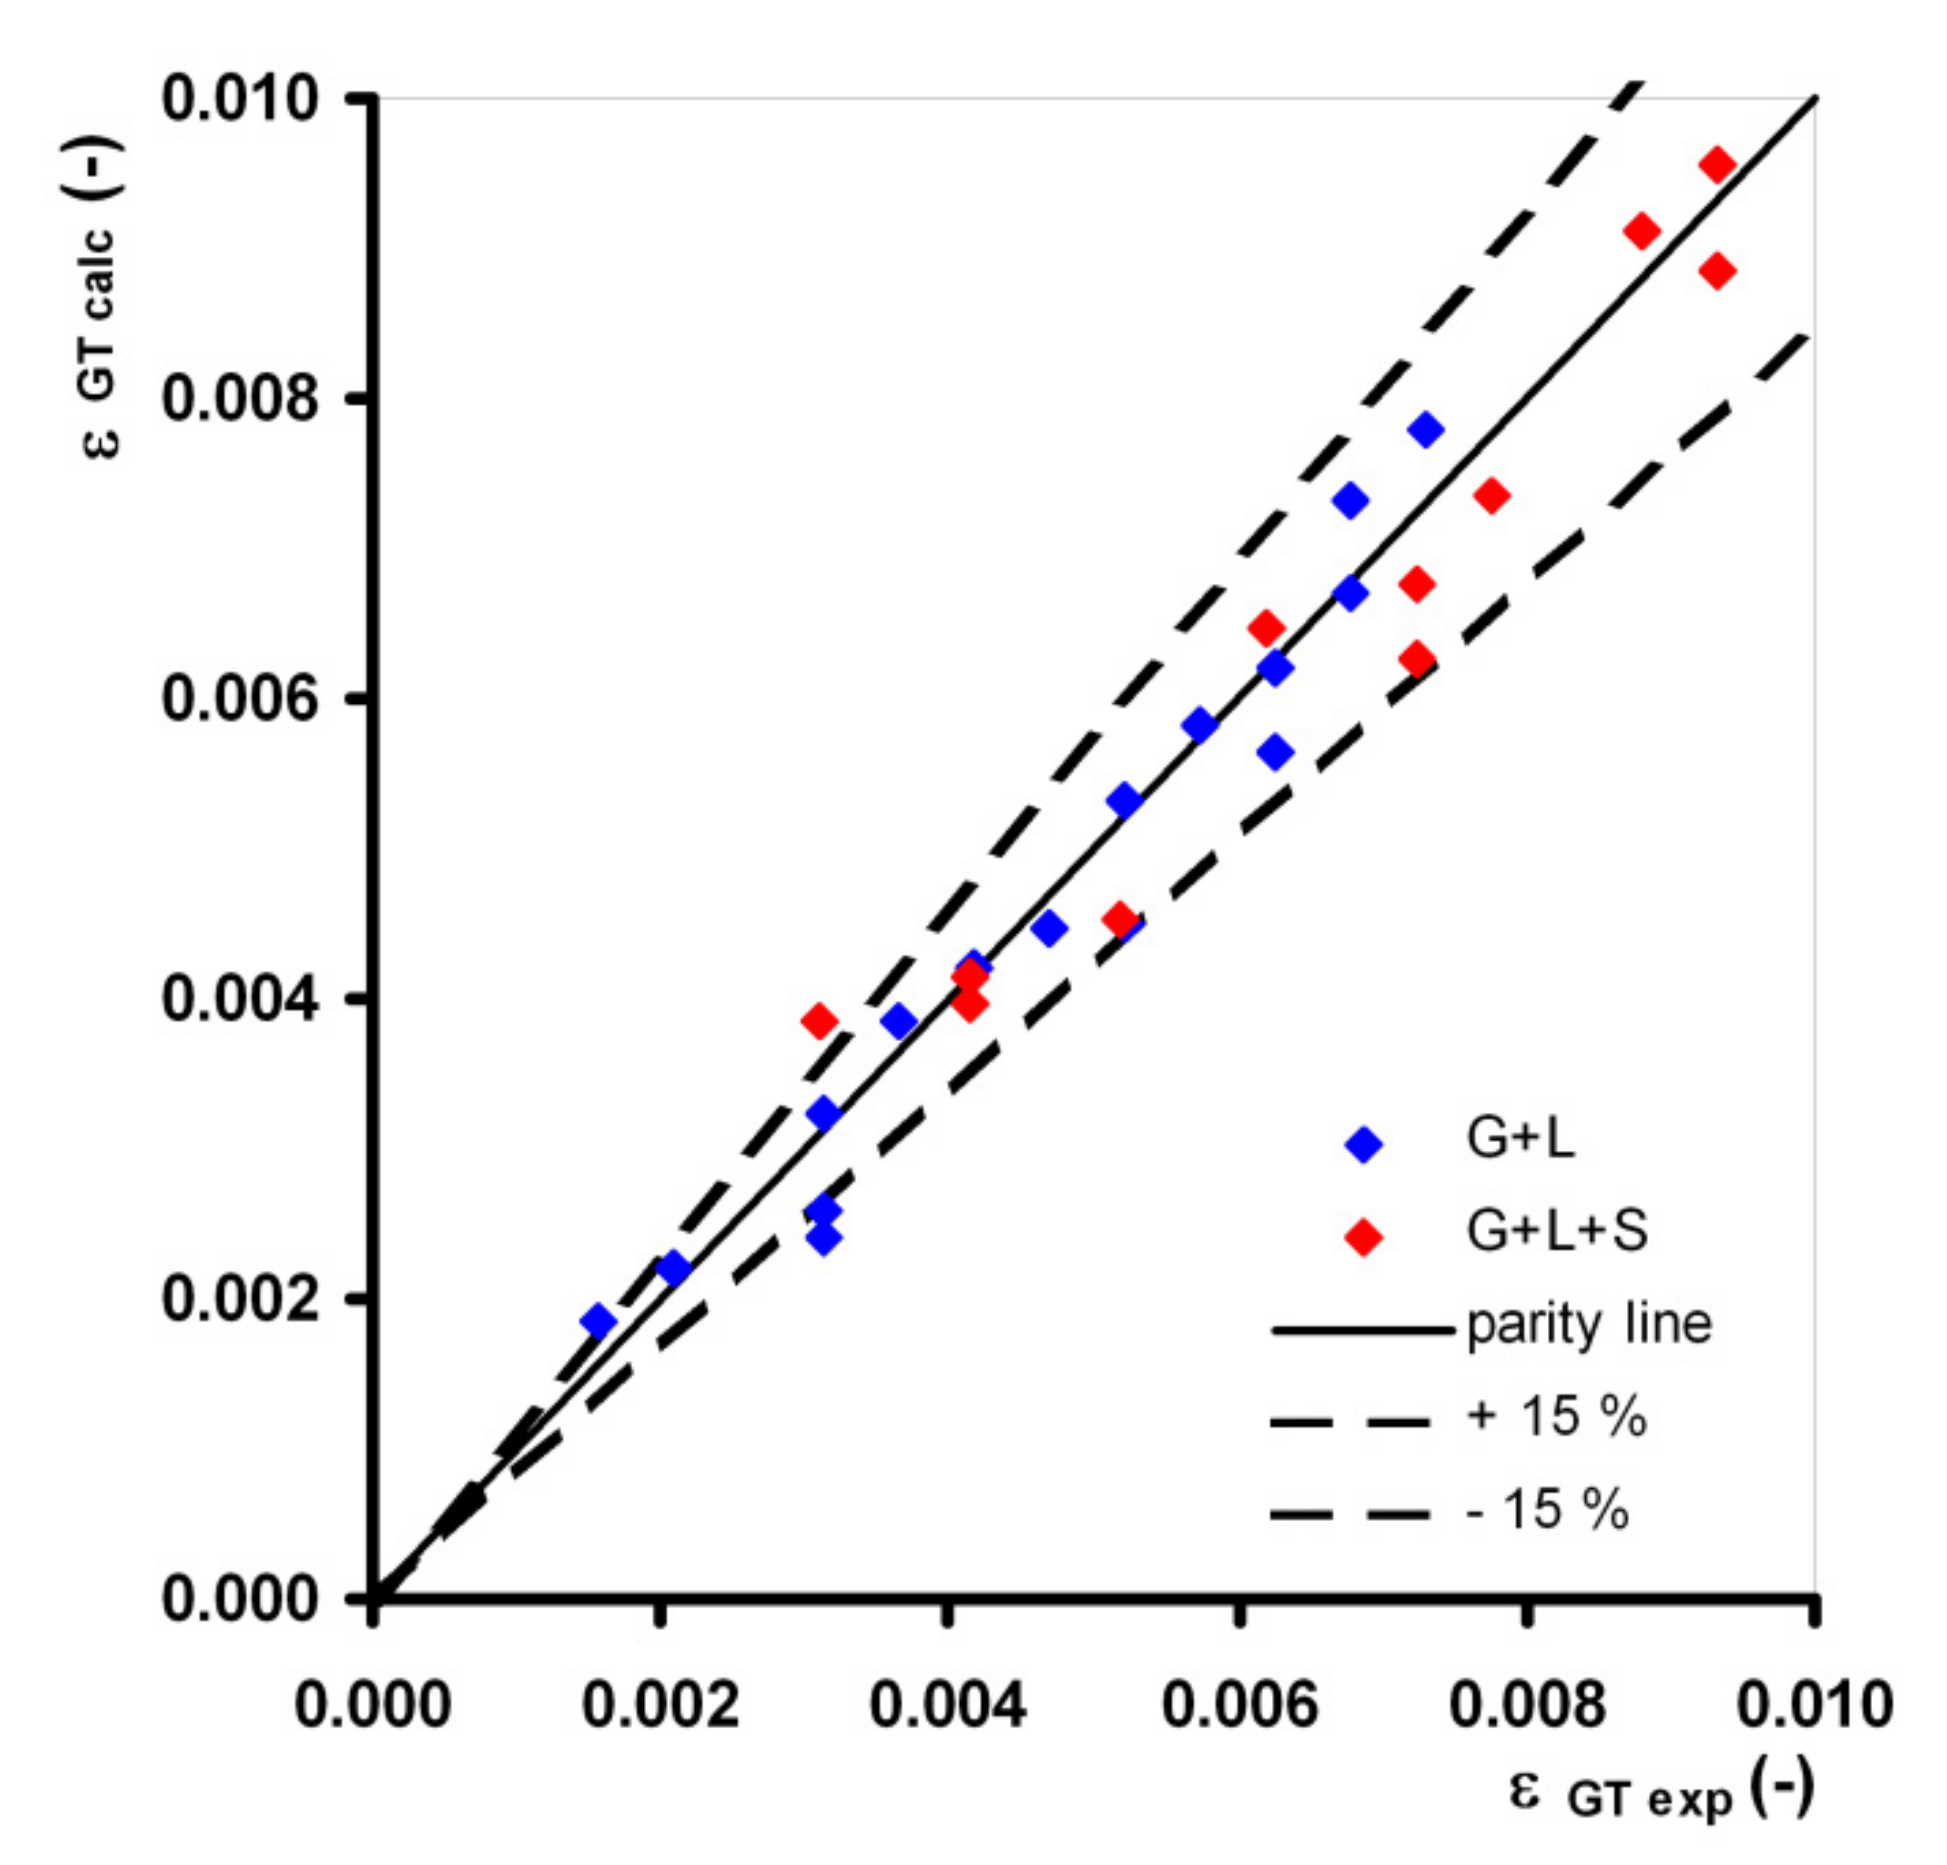
The evaluated parameters of the power-law correlation (4), coefficient of determination (R2), average absolute error (AAE), and average bias error (ABE) are presented in Table 9 for the gas–liquid and gas–liquid–solid system. The low negative ABE value indicates only a low overall underestimation of total gas holdup by the proposed correlation (4). The comparison of experimental data and the correlation given by Equation (4) is presented in Figure 3 for both systems. The lines representing the relative error of ±15% are shown also in Figure 3 for illustration.
3.2. Homogenization Time tH
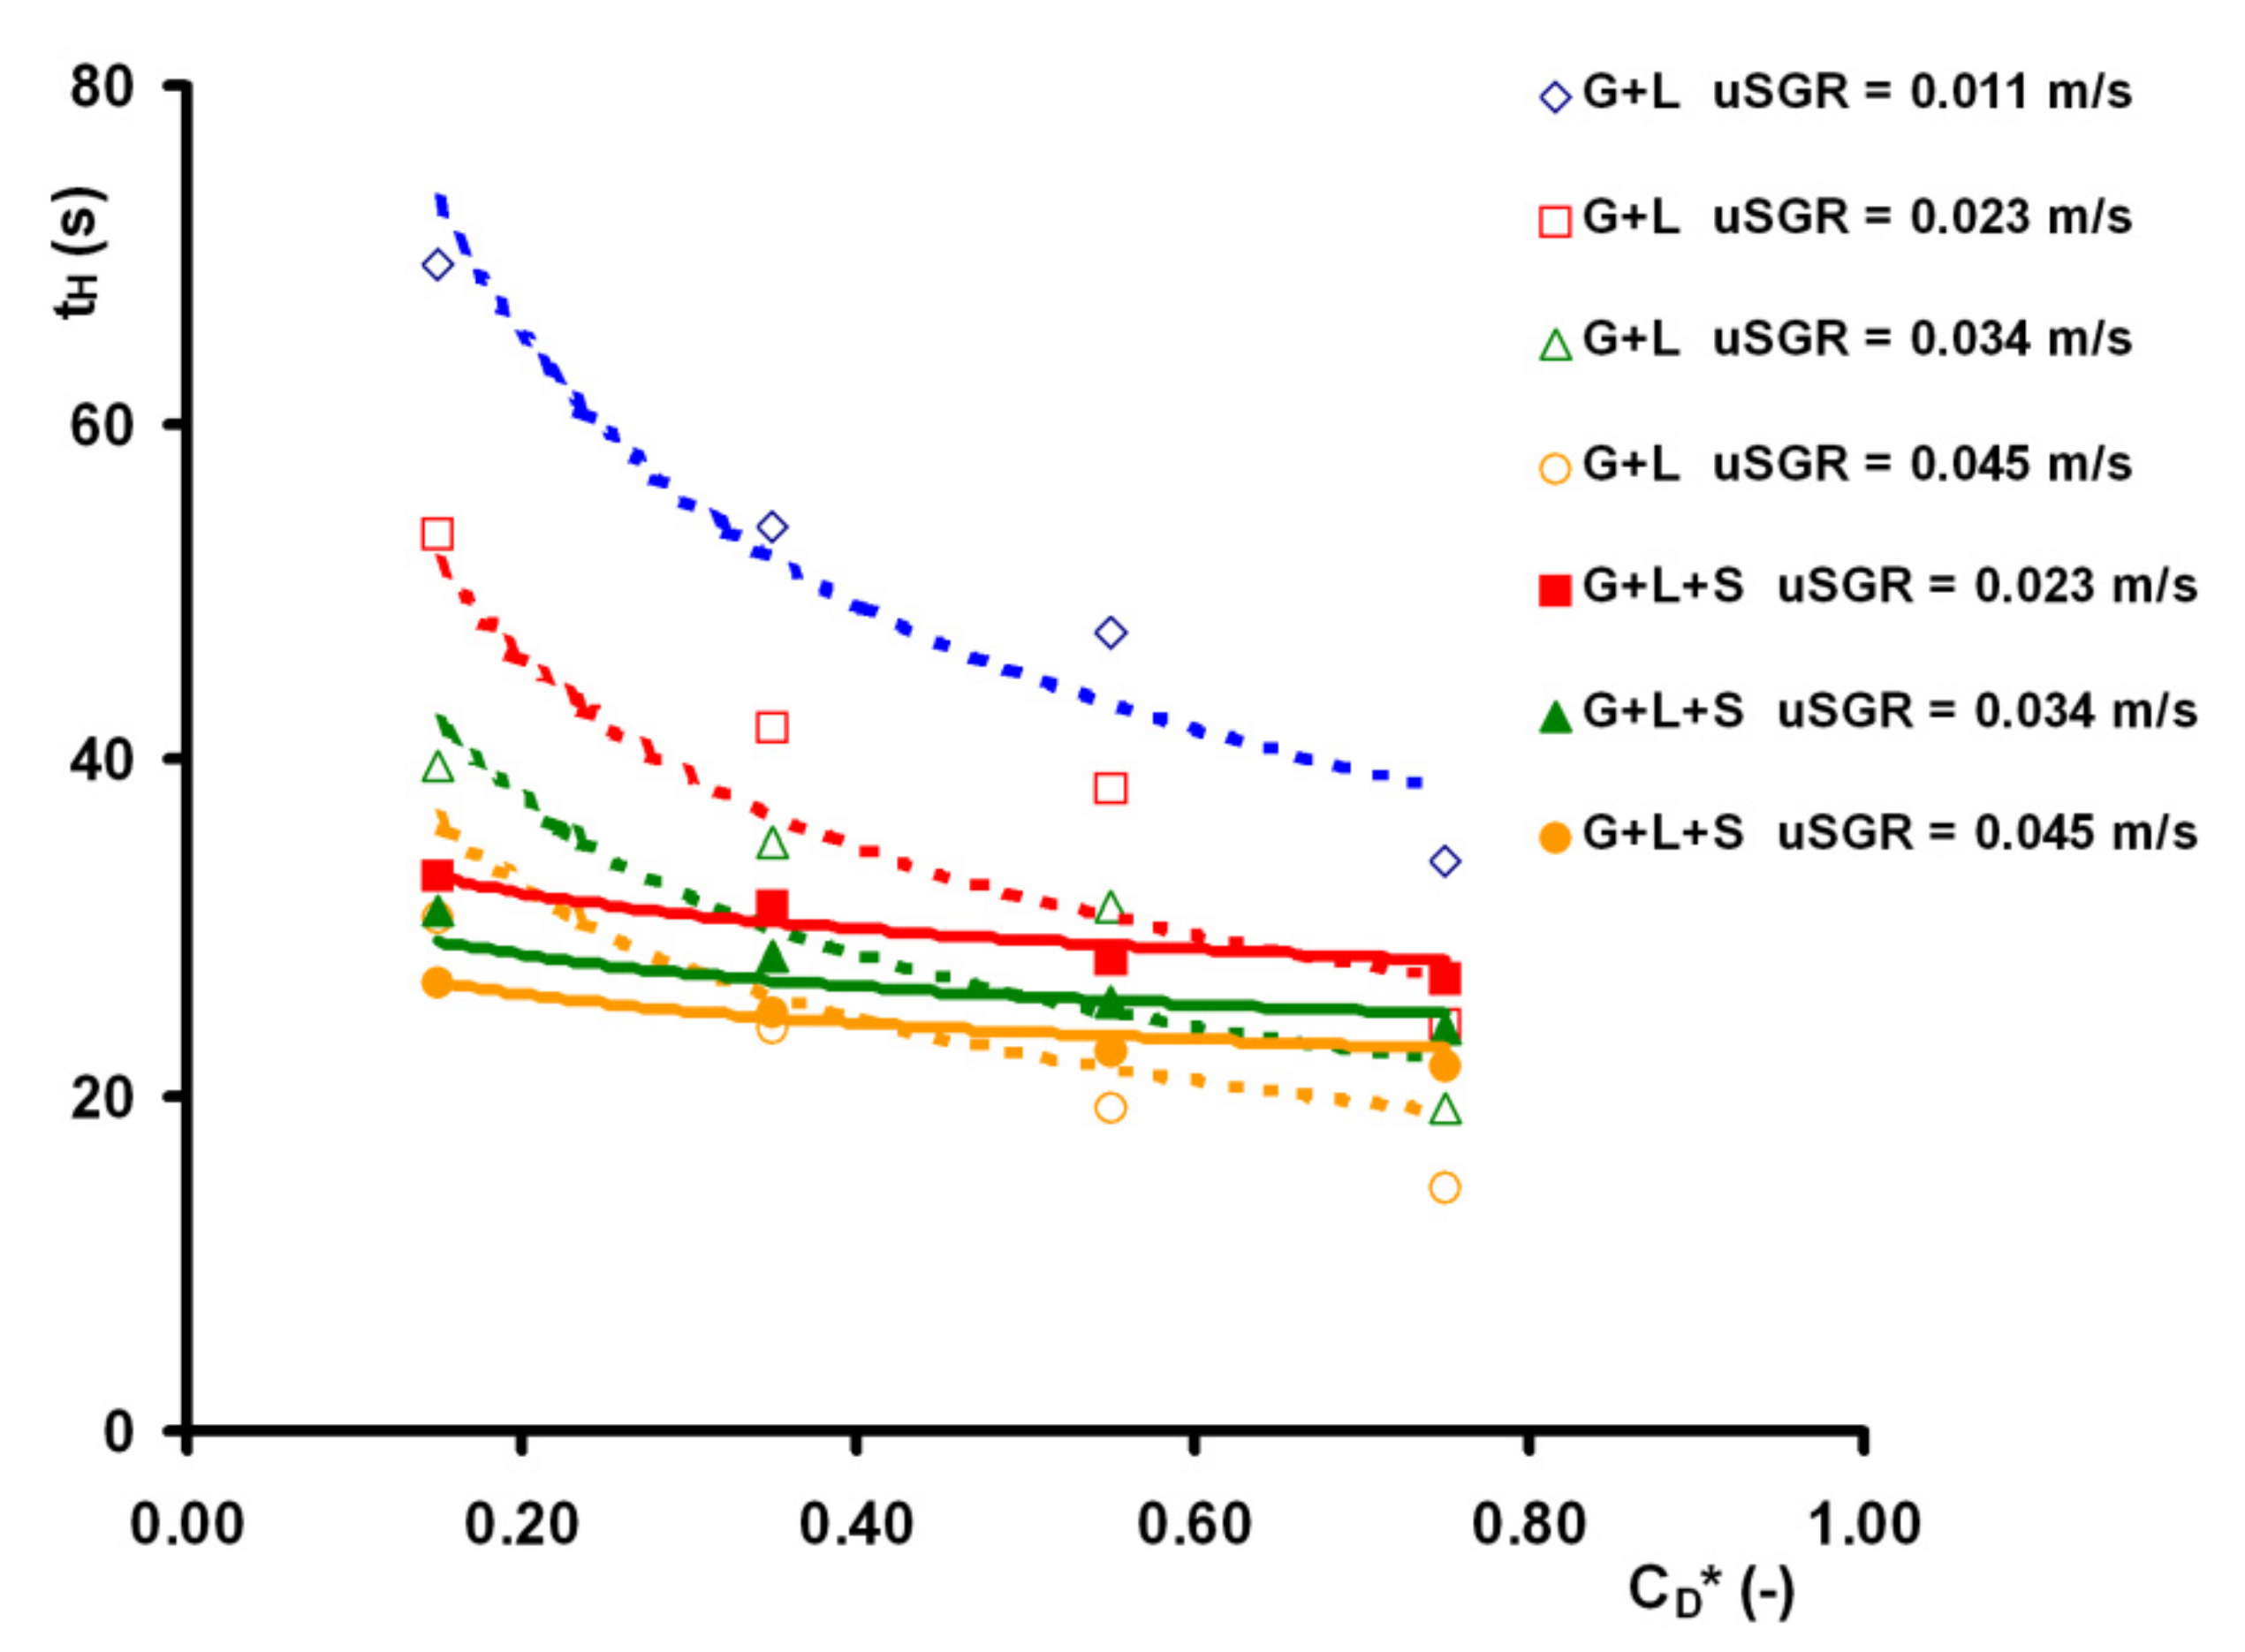
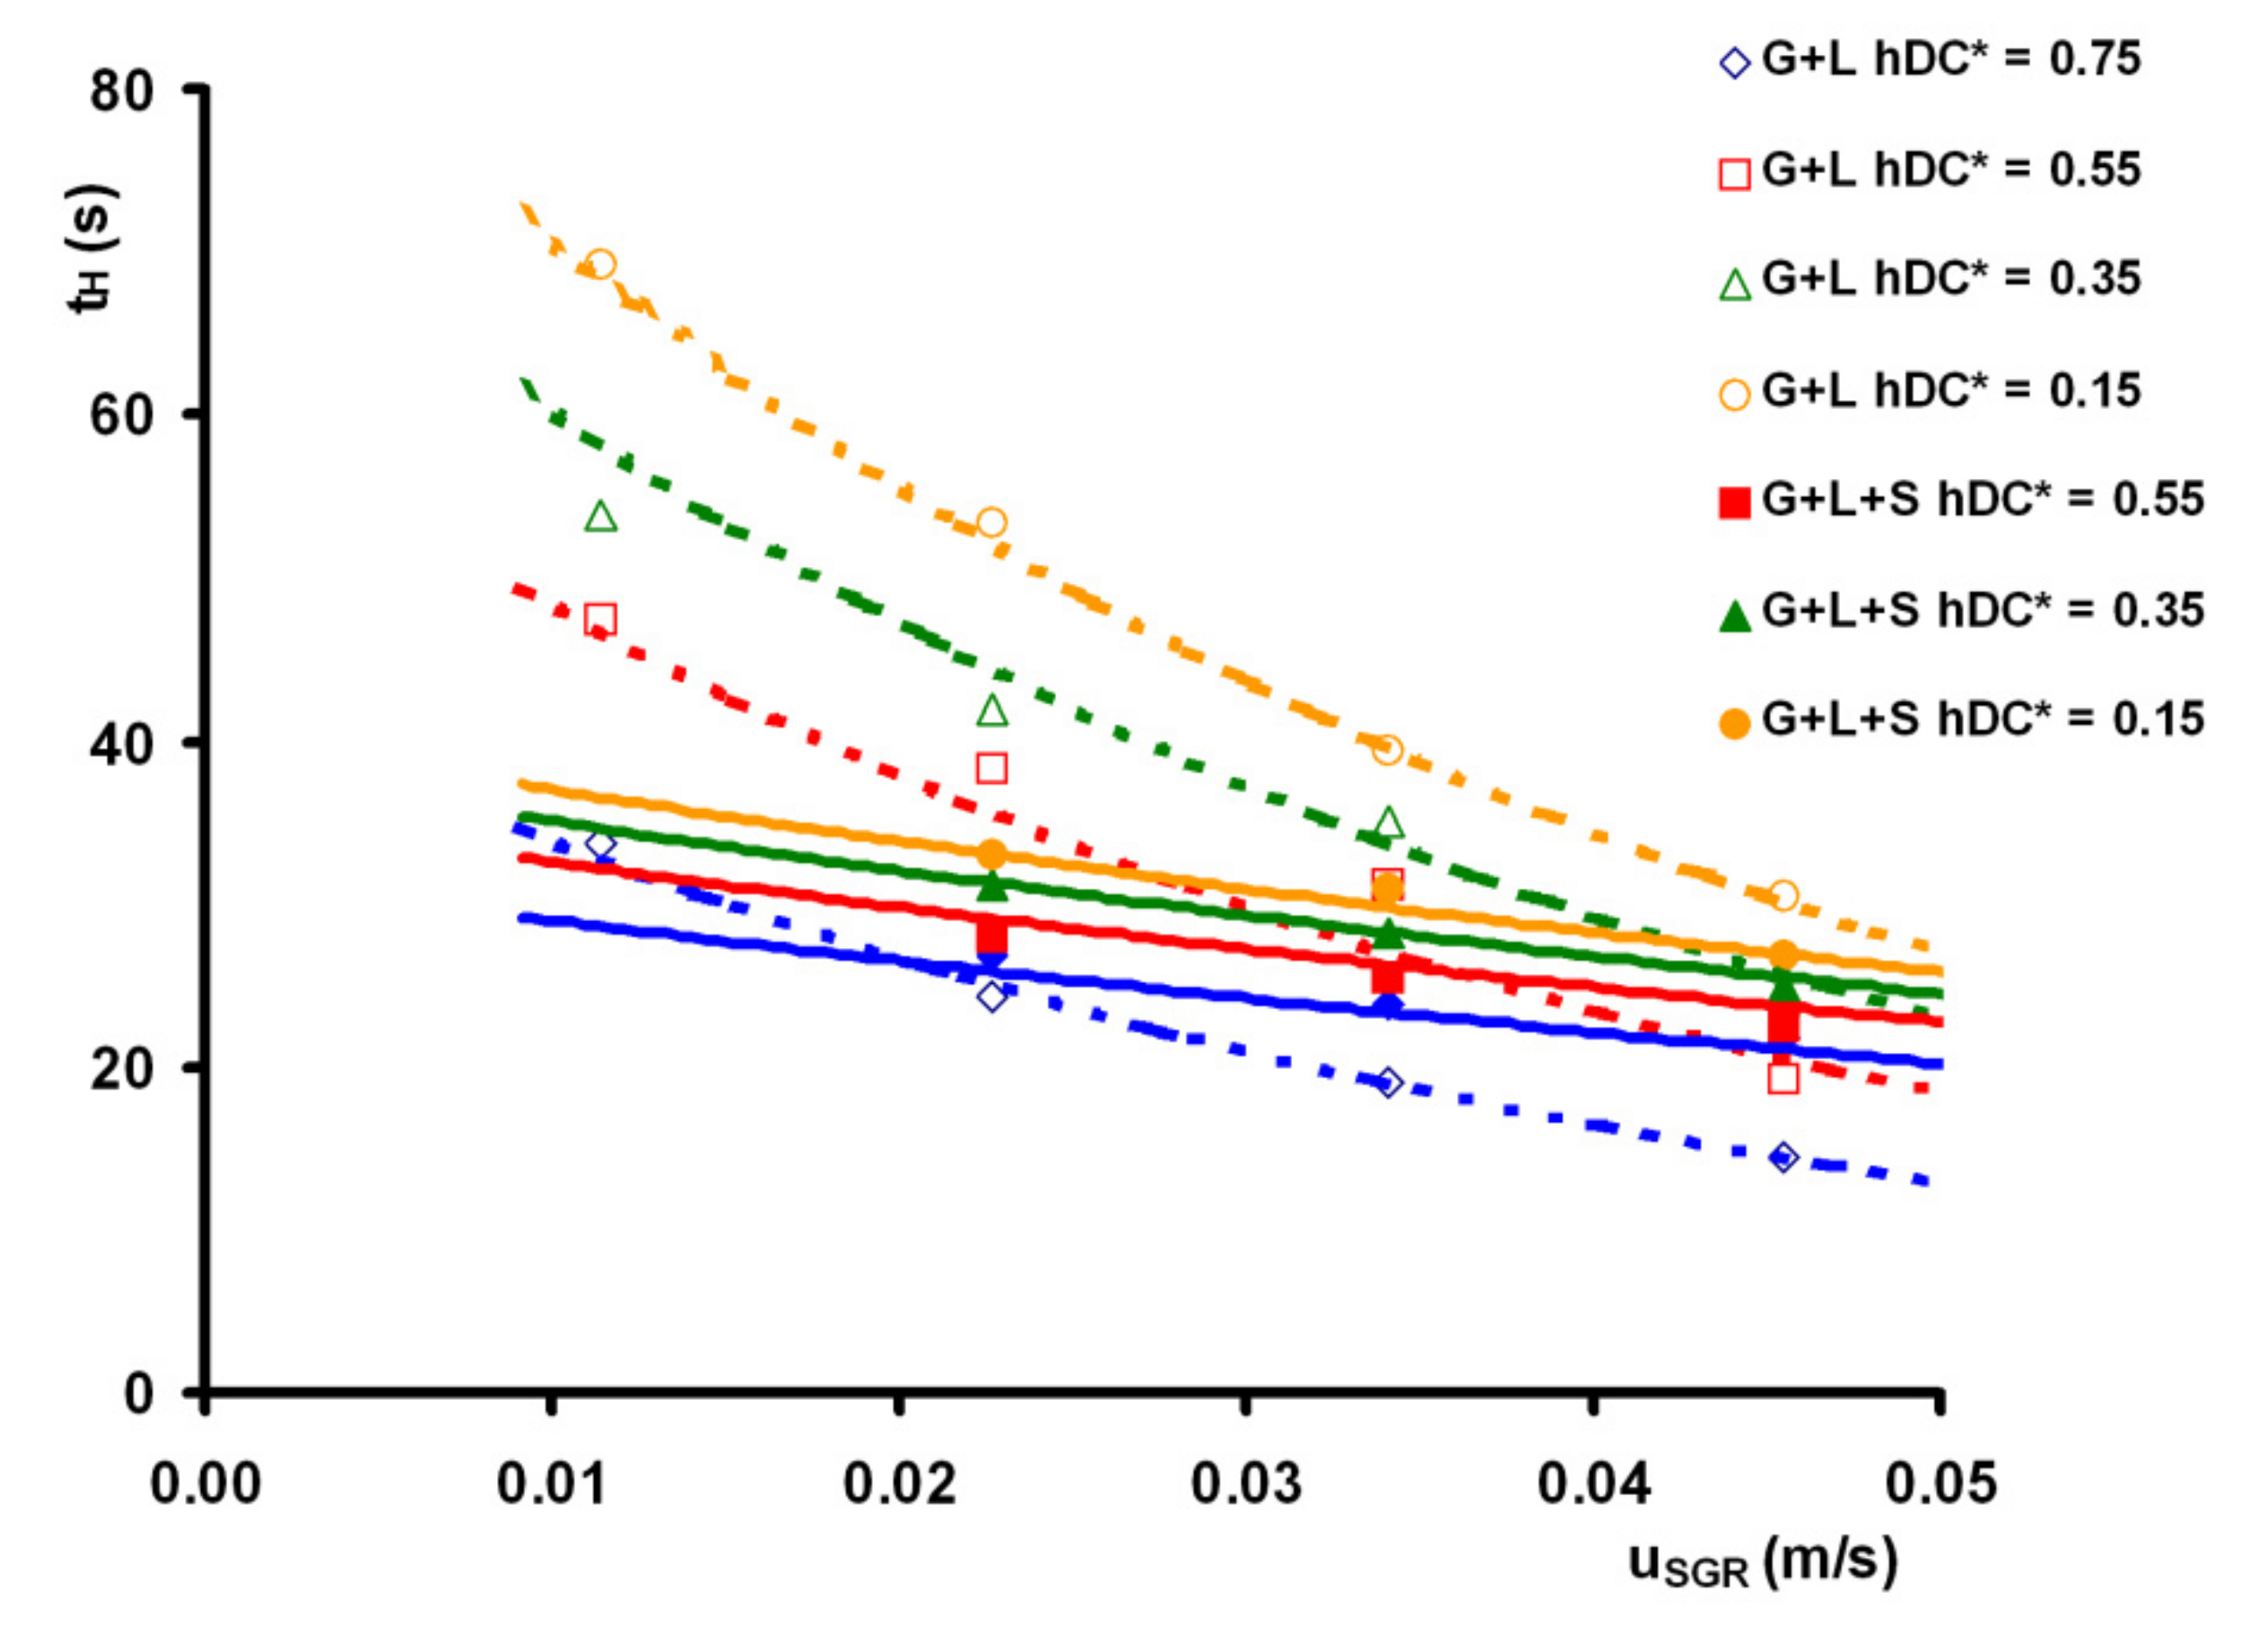
The measured values of homogenization time are shown in Figure 4 as a function of dimensionless deflector clearance for the gas–liquid and gas–liquid–solid systems. For comparison, the values calculated using the proposed correlation (6) are shown also.
For gas–liquid system, reducing the deflector clearance, the homogenization time increases significantly. Homogenization time for = 0.15 is approx. two times higher compared to = 0.75. For lower uSGR and lower CD, the presence of solid phase shortened the homogenization time. For the gas–liquid–solid system, the effect of deflector clearance is weaker compared to the gas–liquid system.
The values of the power law exponent for superficial gas velocity reported in the literature range usually in the range from −0.31 to −1.11 for the gas–liquid system. Analyzing overall data, the α-values of −0.575 and −0.306 were obtained for the gas–liquid system and gas–liquid–solid system, respectively. The applicability of the α-values of −0.5 and −0.3 for gas–liquid system and gas–liquid–solid system, respectively, was tested using the hypothesis test for each deflector clearance separately. The hypothesis test results are presented in Table 10. Except for = 0.75 in the gas–liquid–solid system, the proposed α-values were statistically confirmed for both systems.
Furthermore, the independence of homogenization time of the deflector clearance was tested as the hypothesis, that is, tH = B.()0 = const. (i.e., βpred = 0). The hypothesis test results are presented in Table 11. Statistically, the deflector clearance plays a role in the gas–liquid–solid system. Unlike this, the effect of deflector clearance can be neglected at lower uSGR in the gas–liquid system. However, the parity analysis shows that the deflector clearance should be taken into account. Analyzing the overall data, the β-values of −0.414 and −0.141 were obtained for the gas–liquid system and gas–liquid–solid system, respectively. For the data correlation, the β-values of −0.4 and −0.1 were assumed for the gas–liquid system and gas–liquid–solid system, respectively.
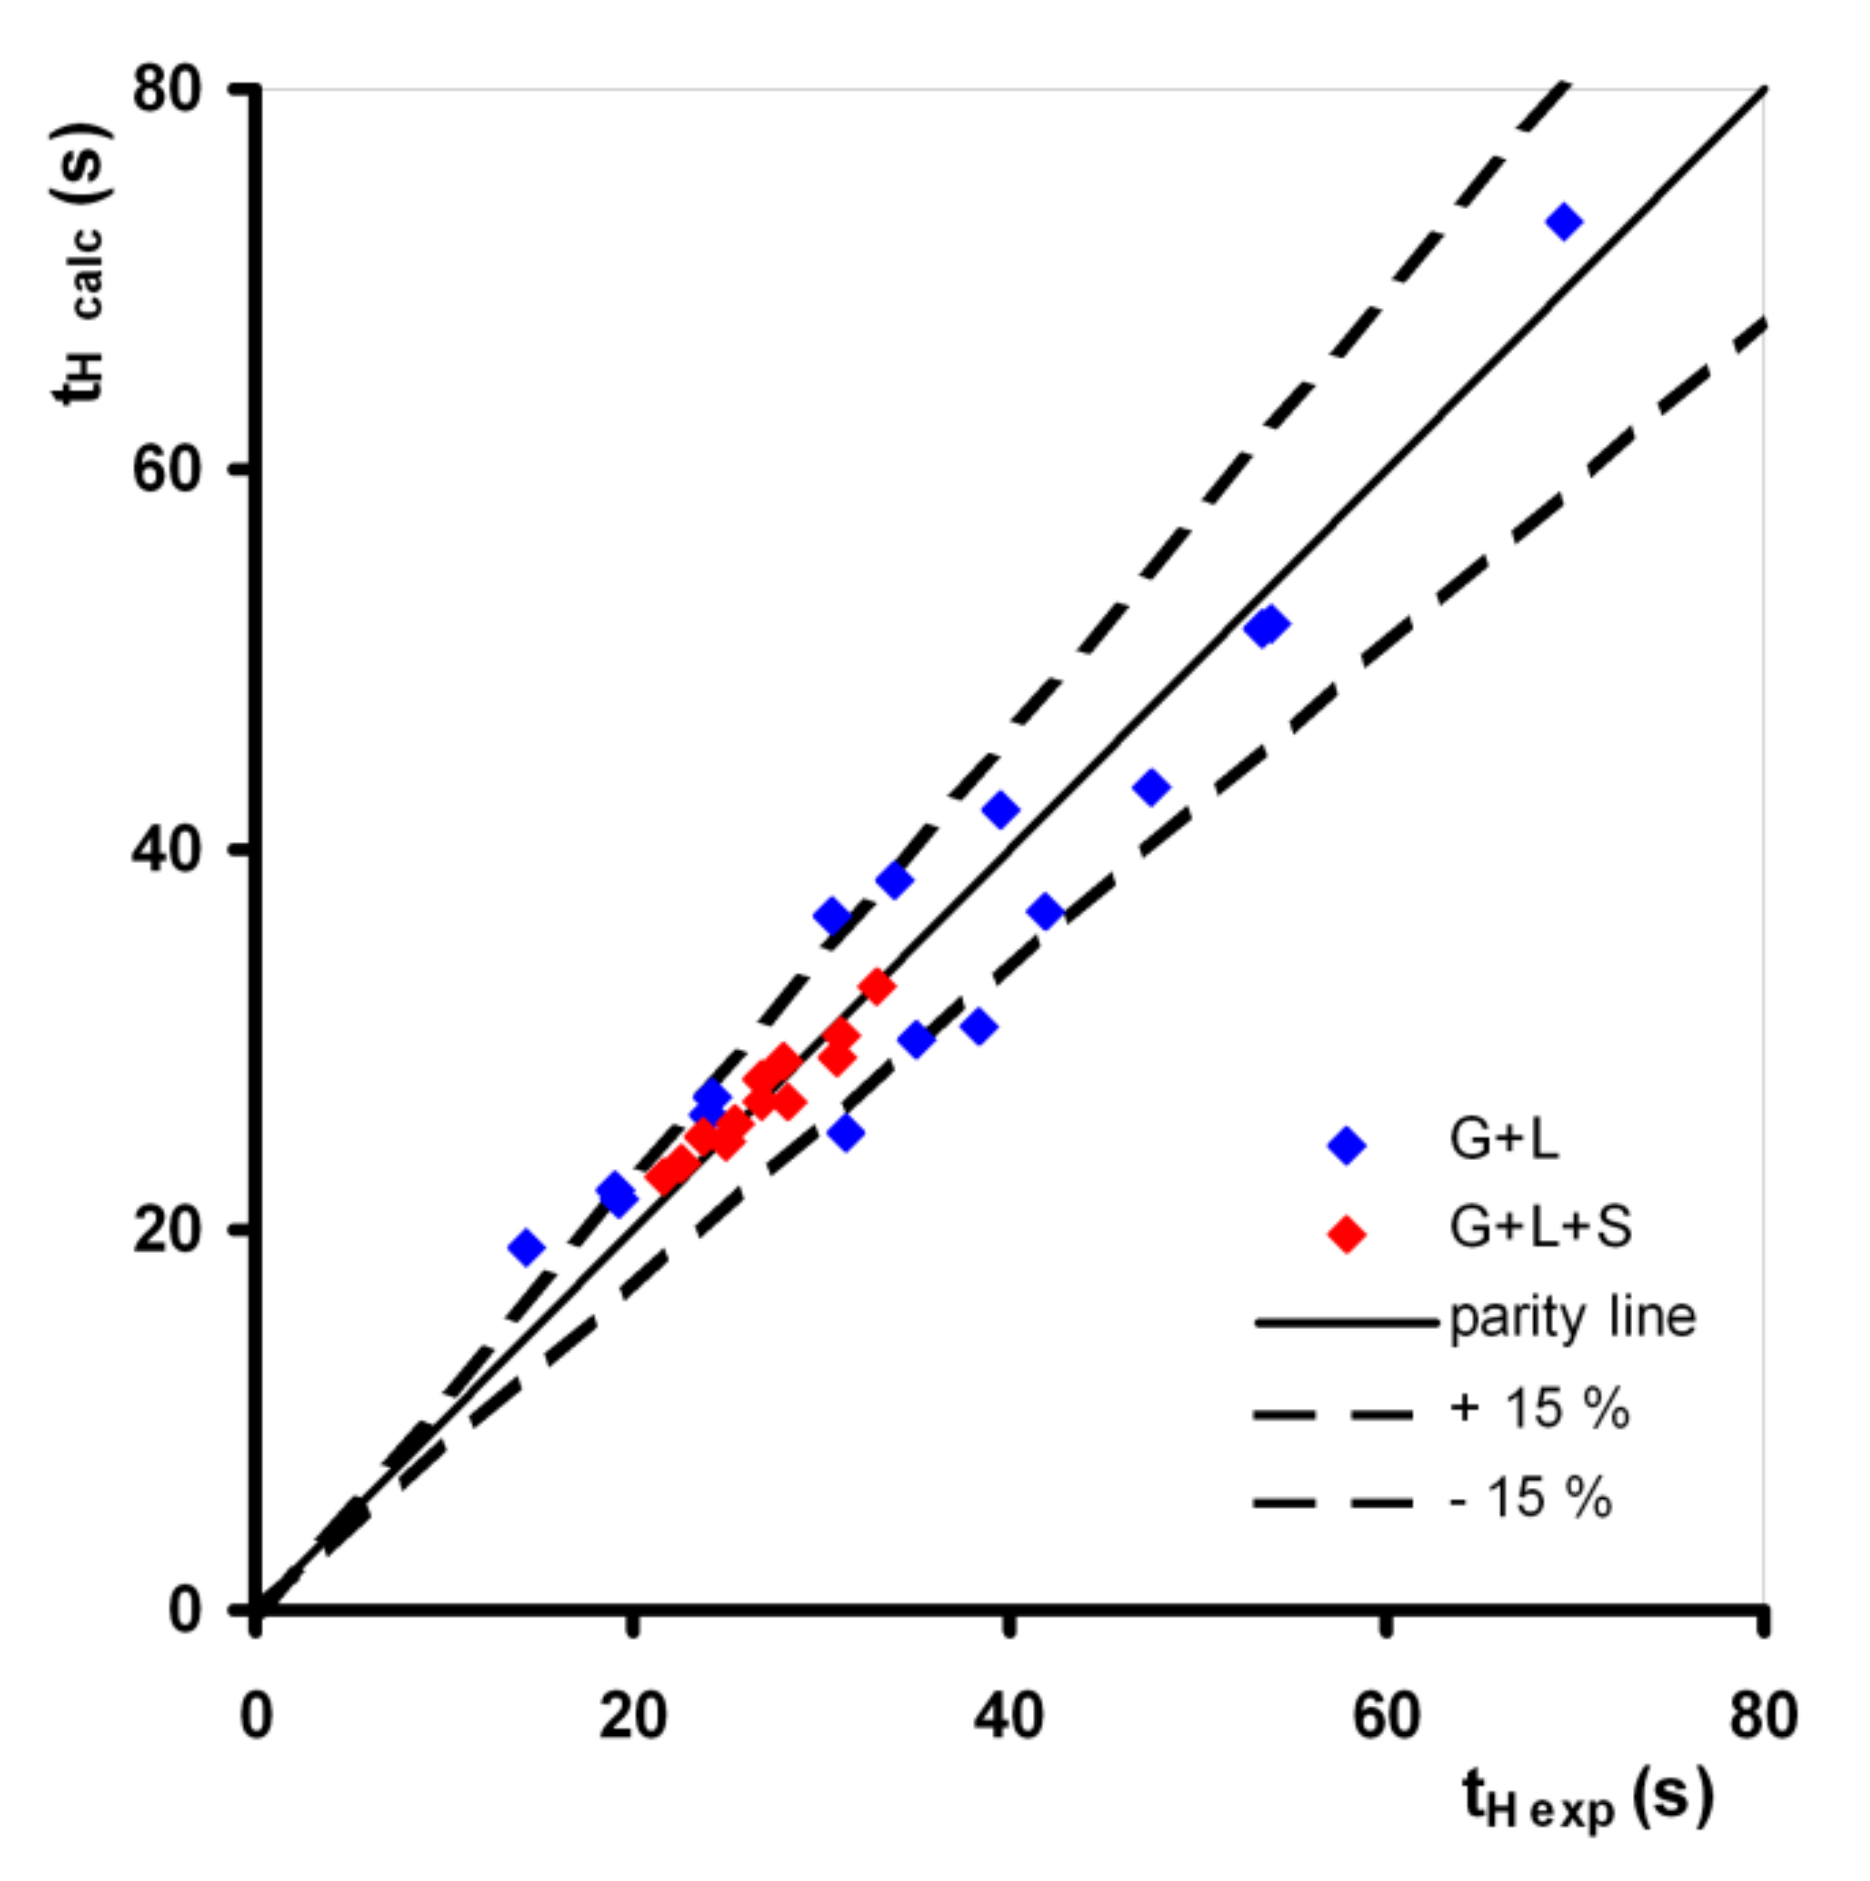
The evaluated parameters of the power-law correlation (6) and values of AAE, ABE, and R2 are presented in Table 12 for the gas–liquid and gas–liquid–solid systems. The positive ABE value, higher compared to the AAE value, indicates an overall overestimation of the experimental homogenization time by the proposed correlation (6), especially for the gas–liquid system. The comparison of experimental data and the correlation given by Equation (6) is presented in Figure 5 for both systems. The lines representing ±15% of the relative error are shown also in Figure 5 for illustration.
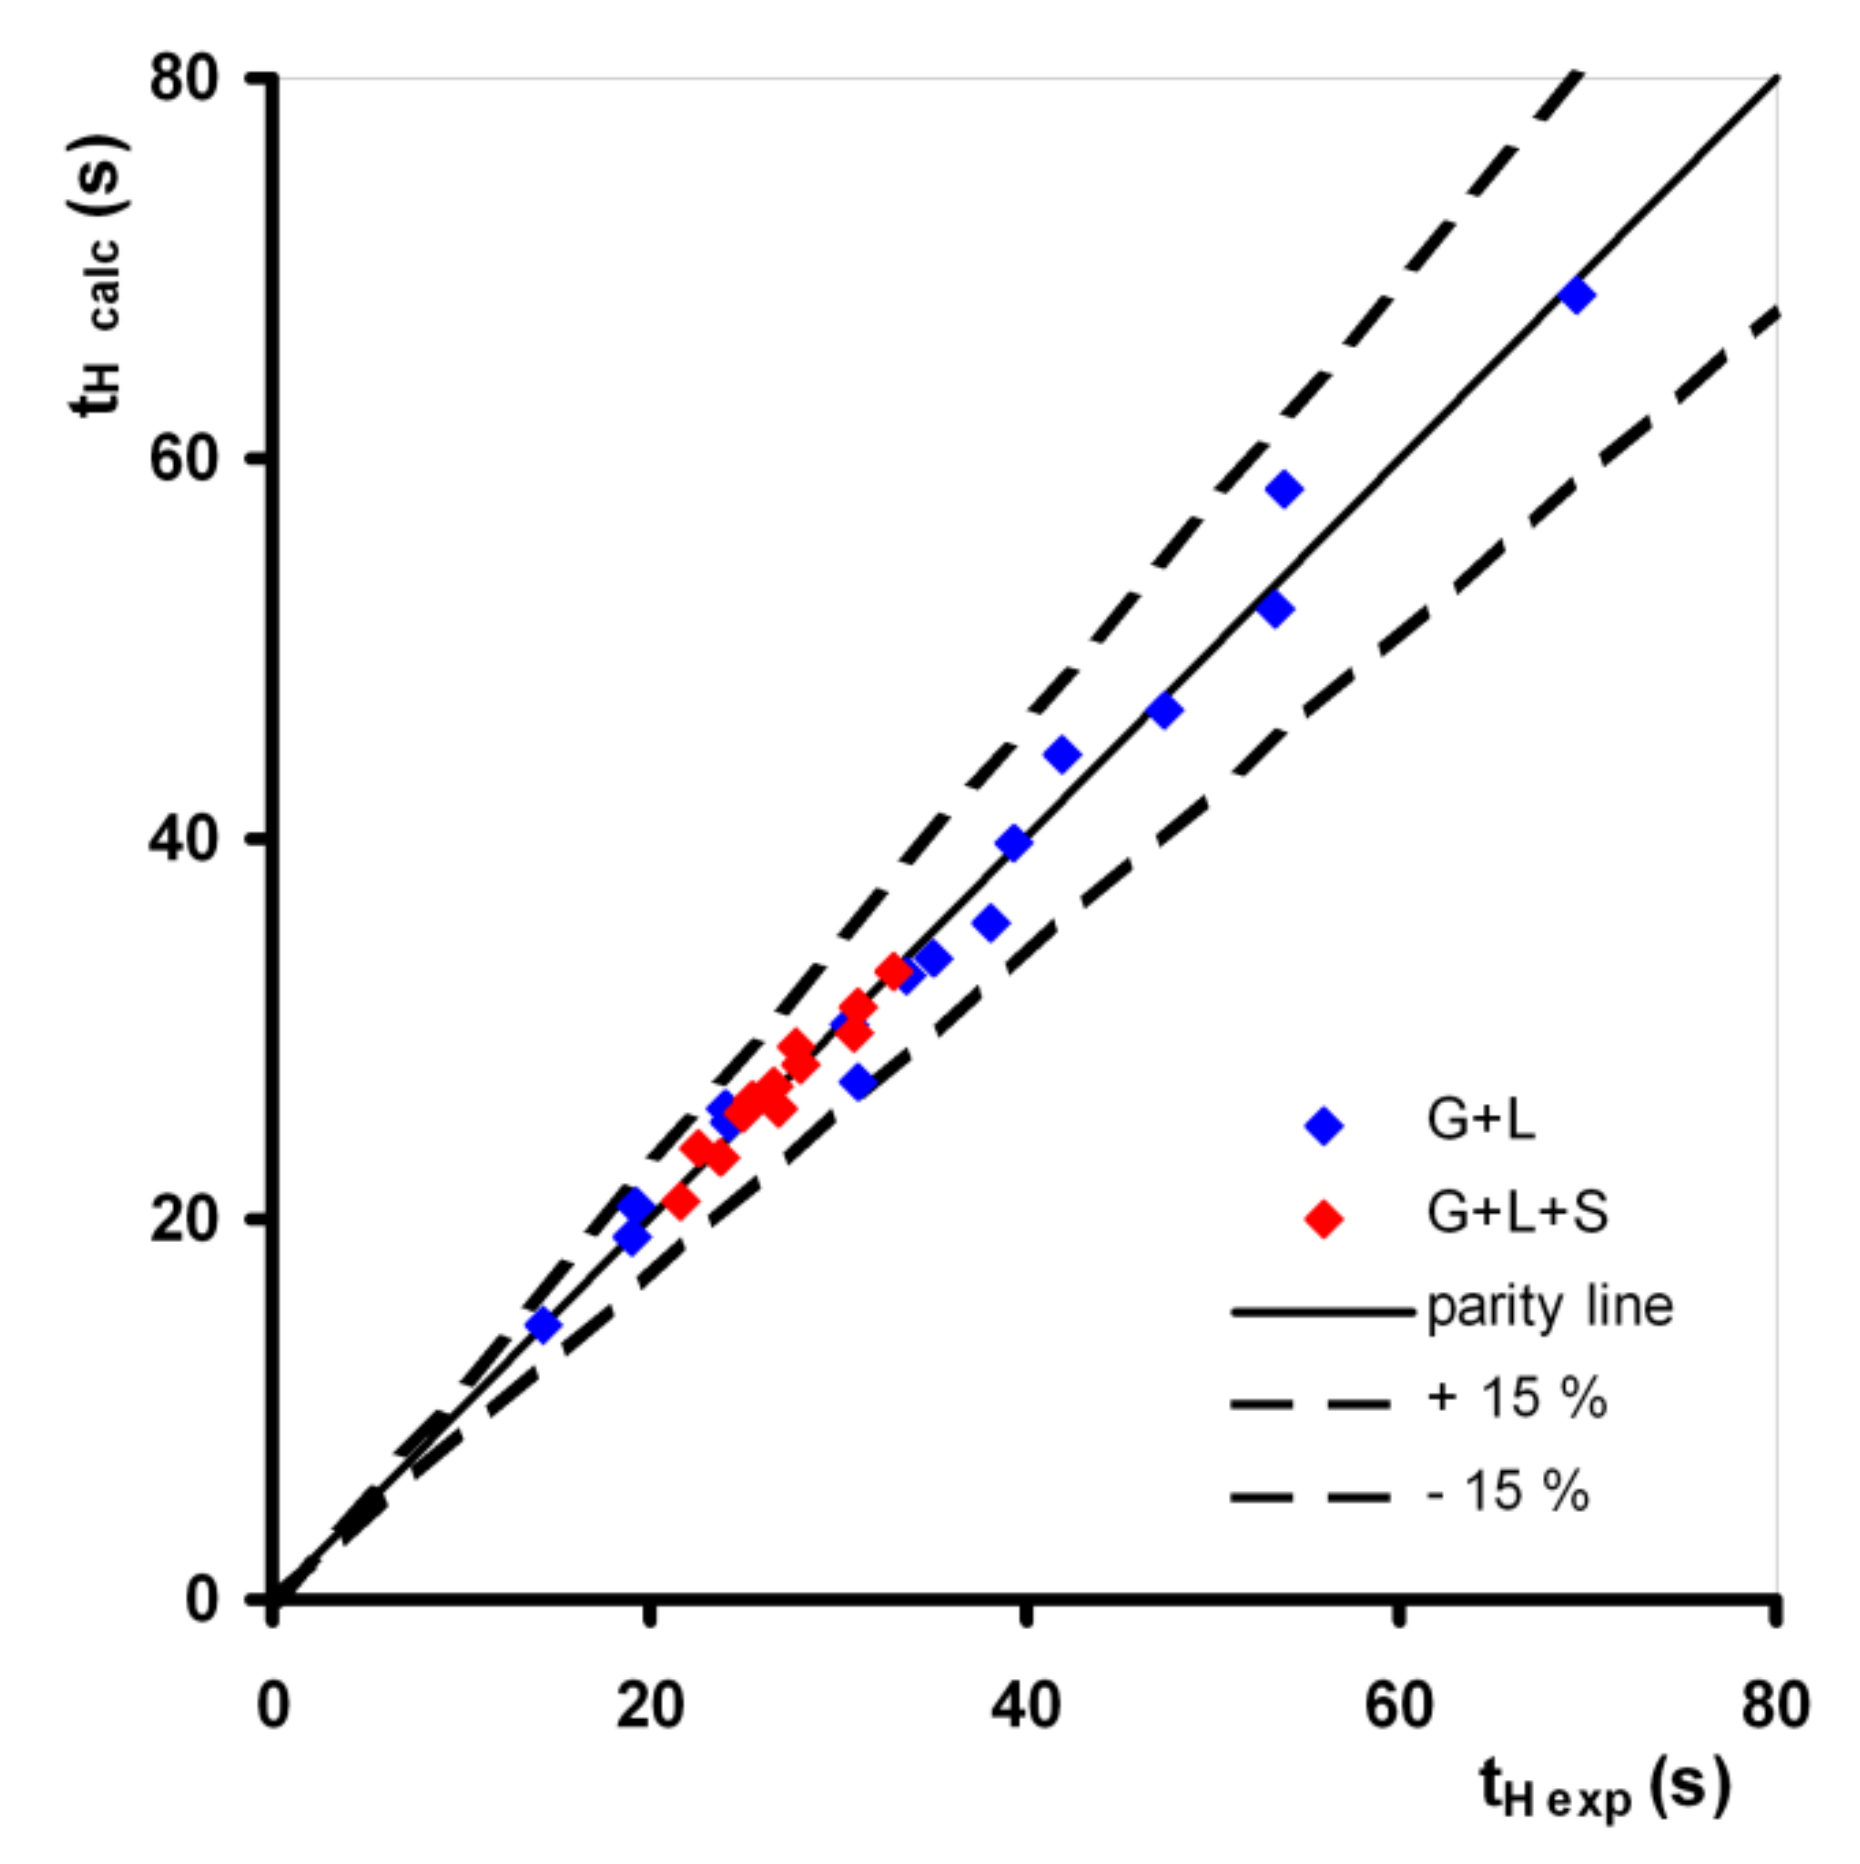
Alternatively, the experimental data were successfully correlated using a combined exponential and power-law function (7). The evaluated parameters of the power-law correlation (7), and values of AAE, ABE, and R2 are presented in Table 13 for the gas–liquid and gas–liquid–solid system. The three times lower AAE value indicates better predictability of homogenization time by correlation (7) compared to correlation (6) for the gas–liquid system. The slightly positive ABE value indicates a practically uniform estimation of the homogenization time by the proposed correlation (7). The comparison of measured values and values calculated using the proposed correlation (7) is shown in Figure 6 as a function of the riser superficial gas velocity for the gas–liquid and gas–liquid–solid systems.
3.3. Overall Volumetric Liquid-Phase Mass Transfer Coefficient kLa
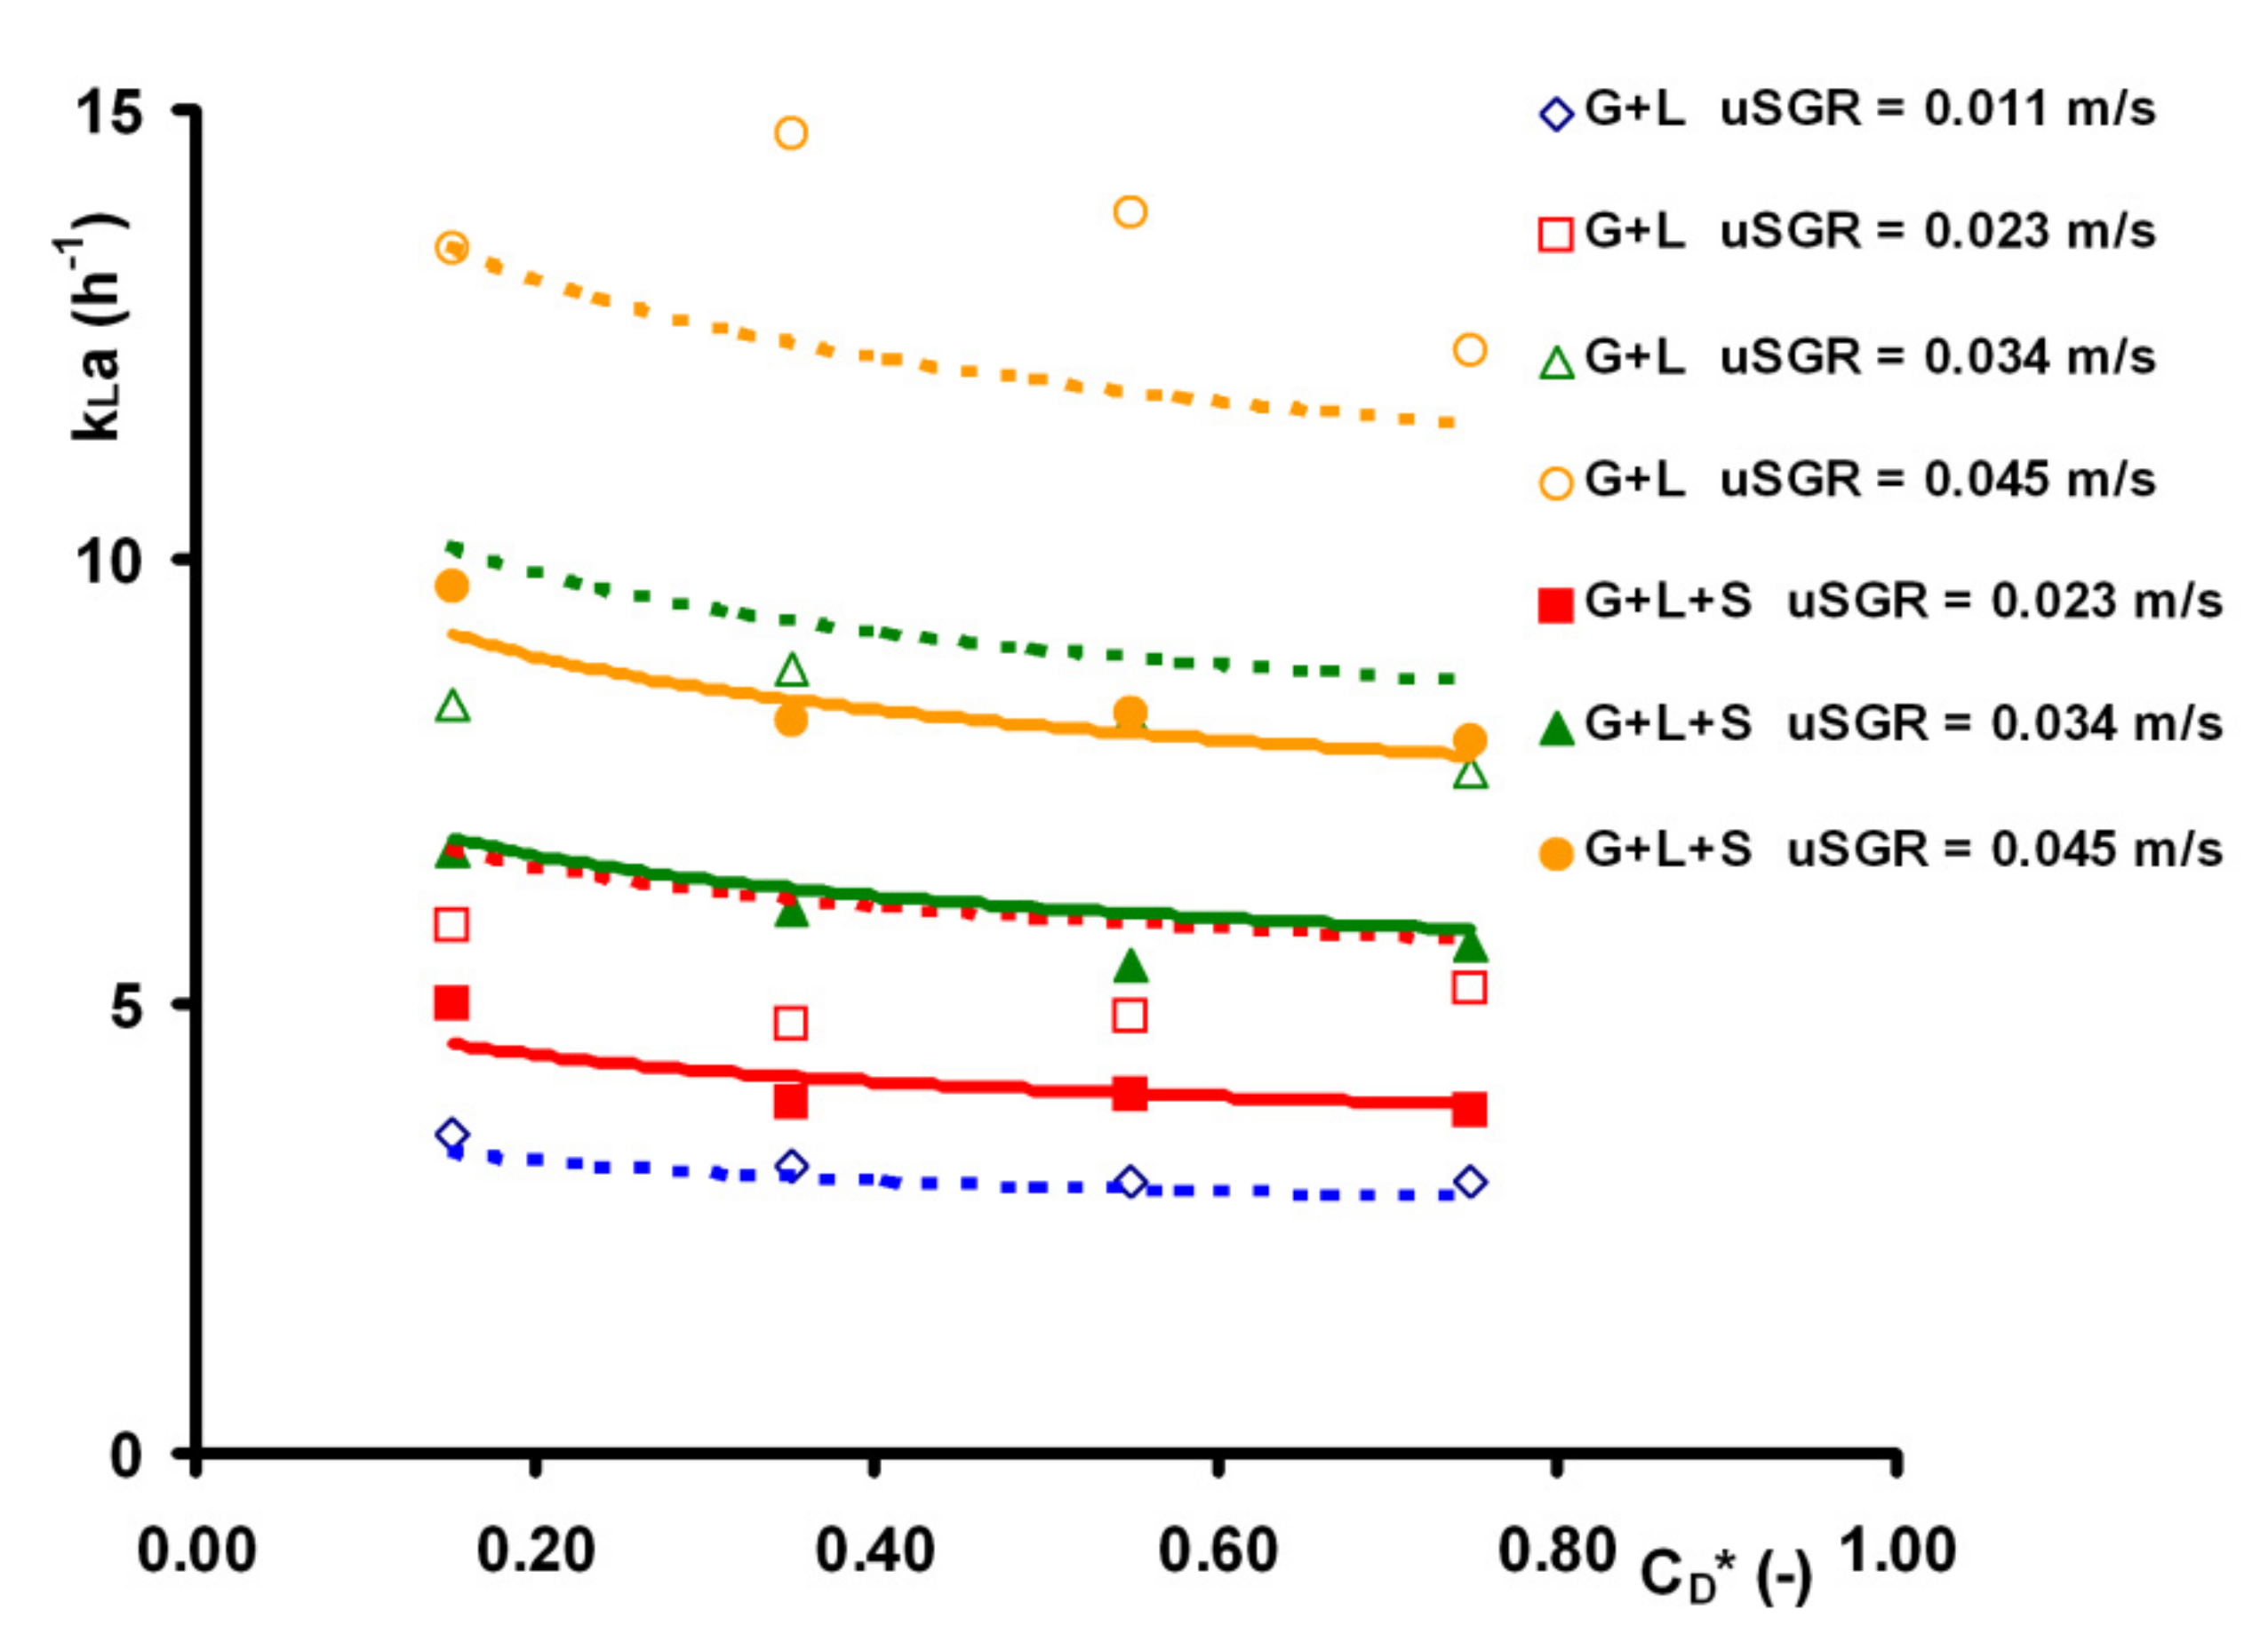
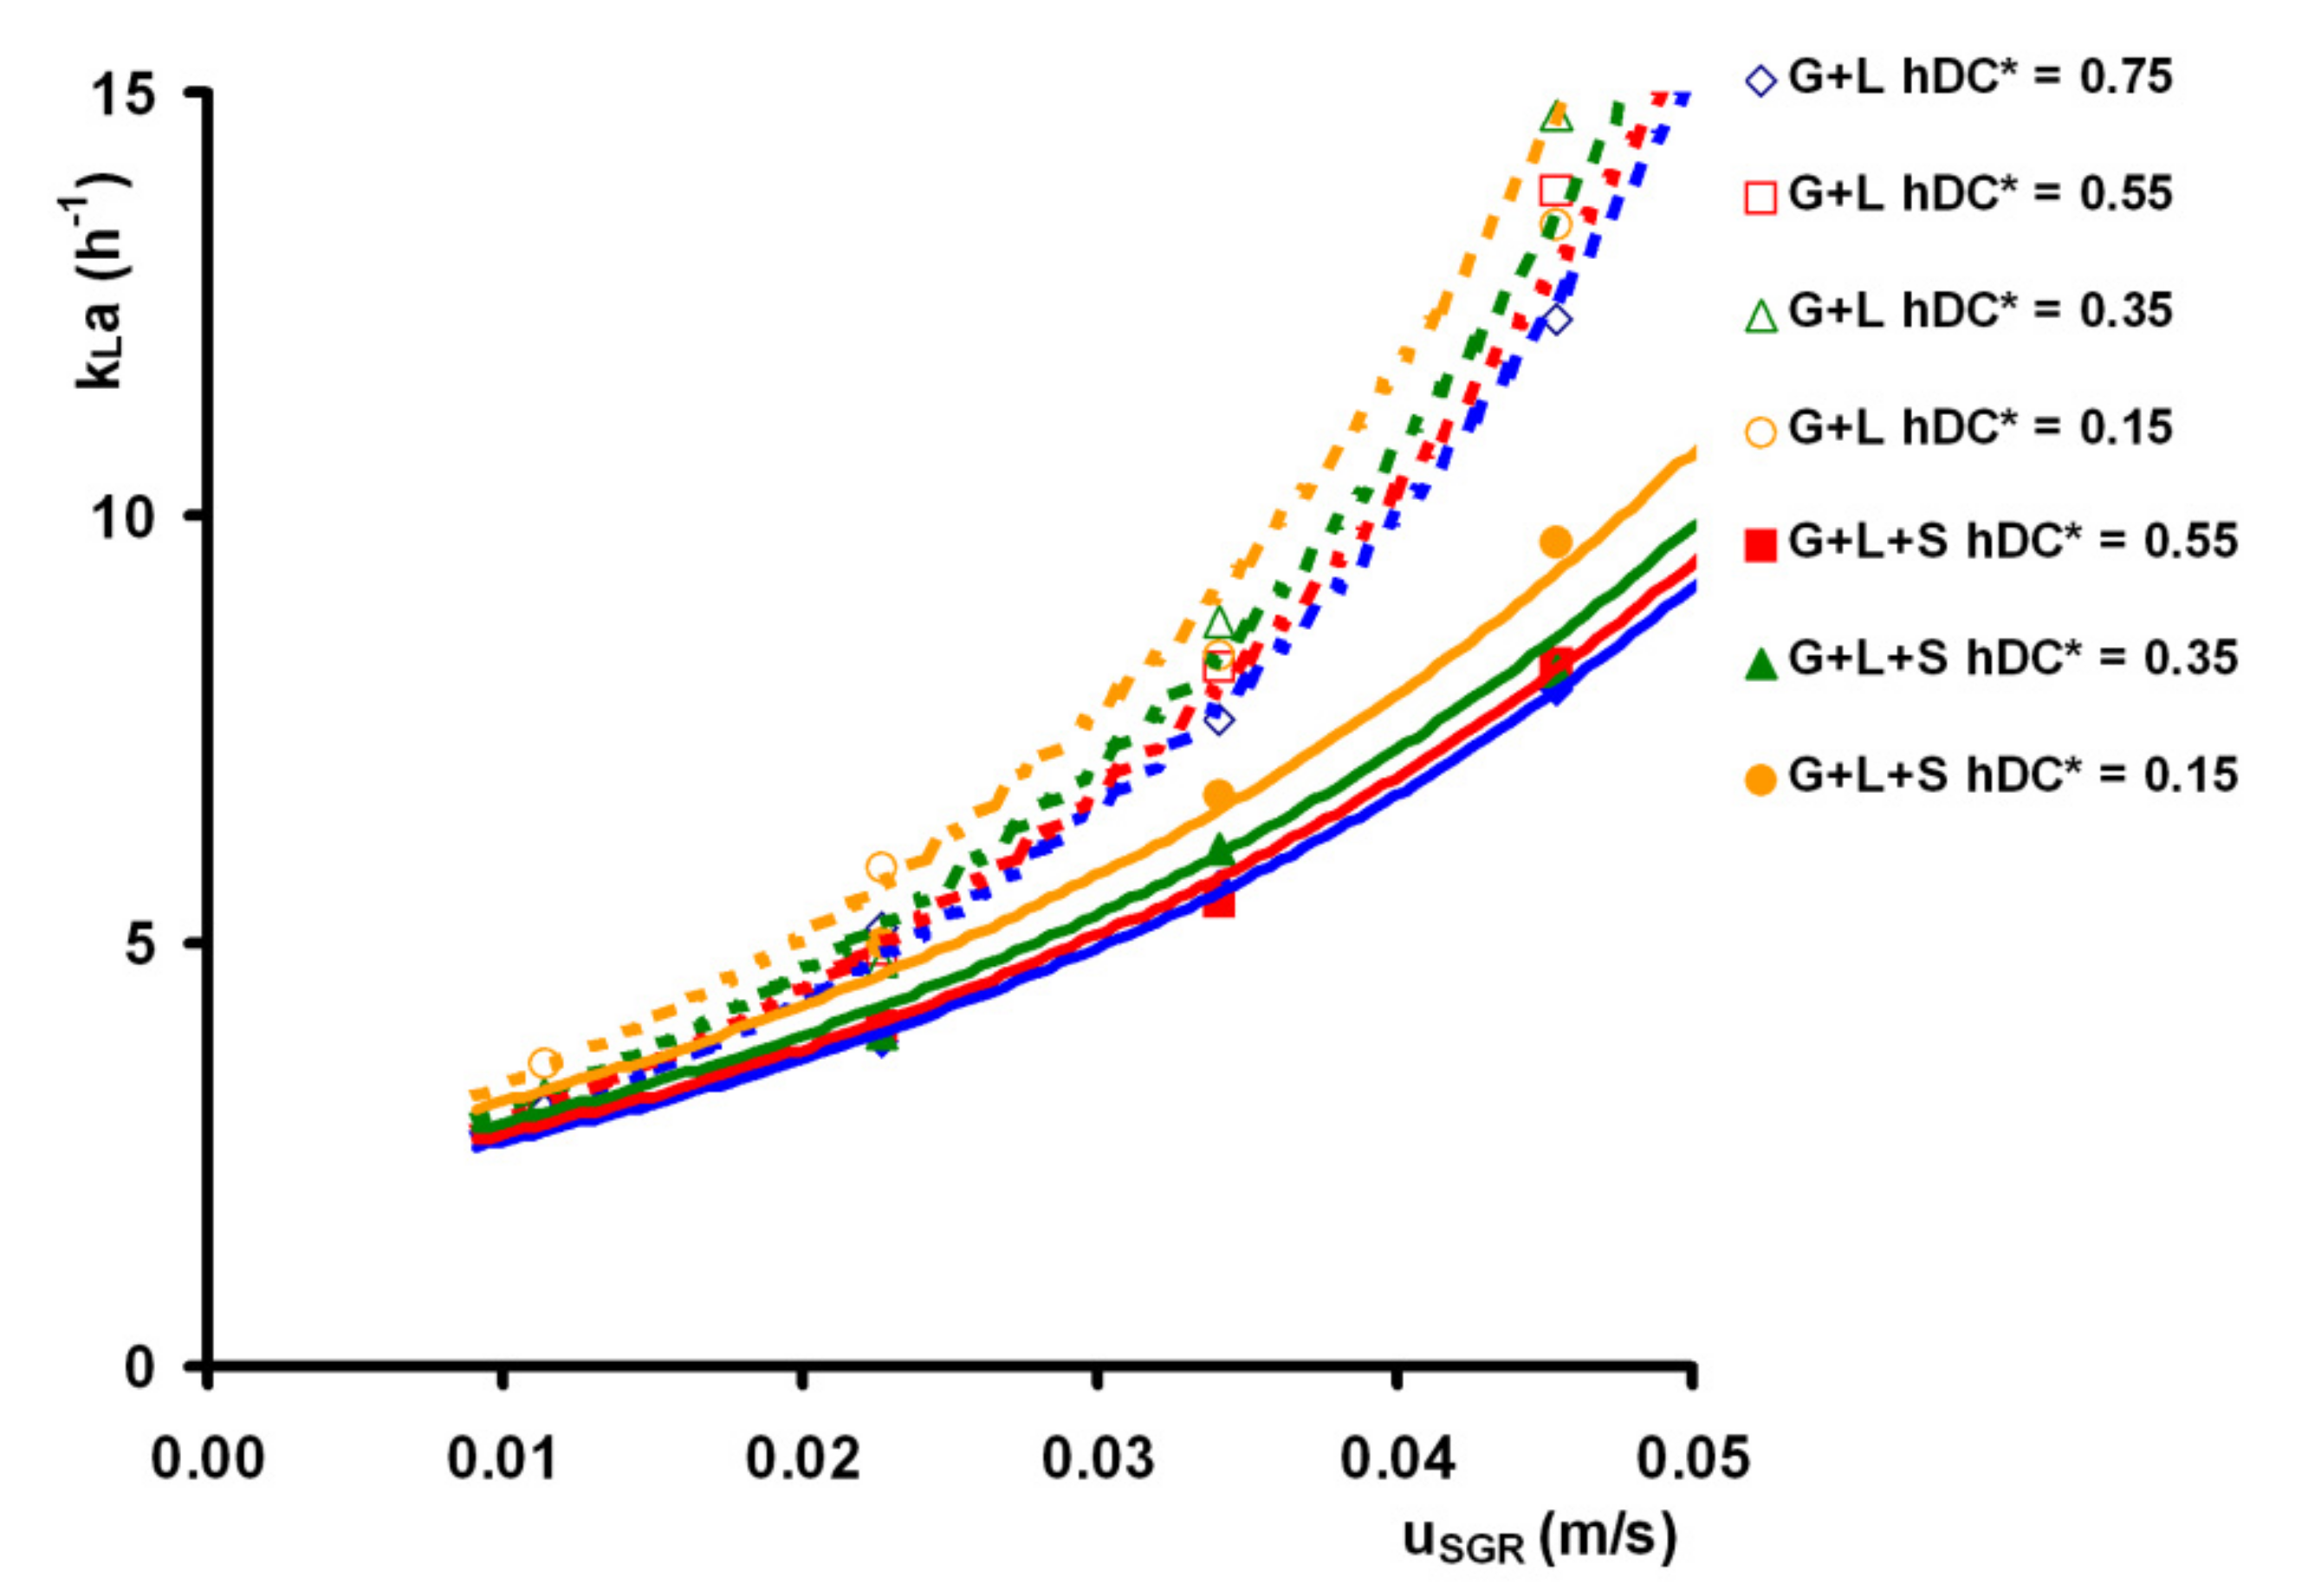
The values of the overall volumetric mass transfer coefficient corrected onto 20 °C are shown in Figure 8 as a function of dimensionless deflector clearance for the gas–liquid and gas–liquid–solid systems. For comparison, the values calculated using the proposed correlation (12) are shown also.
For the gas–liquid system, reducing the deflector clearance, the overall volumetric mass transfer coefficient slightly increases. Mass transfer coefficient for = 0.15 is approx. 10–17% higher than for = 0.75. The presence of solid phase reduced the mass transfer coefficient by 15–35%. In the gas–liquid–solid system, the effect of deflector clearance is more accentuated compared to the gas–liquid system. Mass transfer coefficient for = 0.15 is approx. 20–29% higher than for = 0.75.
The values of the power law exponent for superficial gas velocity reported in the literature range usually in the range from 0.642 to 1.12 for the gas–liquid system. Analyzing overall data, the α-values of 1.009 and 1.019 were obtained for the gas–liquid system and gas–liquid–solid system, respectively. The applicability of the α-values of 1 for the gas–liquid system and the gas–liquid–solid system was tested using a hypothesis test for each deflector clearance separately. The hypothesis test results are presented in Table 14. Except for = 0.35 in the gas–liquid–solid system, the proposed α-value was statistically confirmed for both systems.
The independence of the overall volumetric mass transfer coefficient of the deflector clearance was tested as the hypothesis, that is, kLa = B.()0 = const. (i.e., βpred = 0). The hypothesis test results are presented in Table 15. Statistically, the independence of deflector clearance was confirmed practically for all uSGR except the lowest uSGR of 0.011 m/s in the gas–liquid system. However, the parity analysis shows that the deflector clearance should be taken into account for both systems. Analyzing the overall data, the β-values of −0.072 and −0.134 were obtained for the gas–liquid system and gas–liquid–solid system, respectively. For the data correlation, the β-value of −0.1 was assumed for the gas–liquid system and the gas–liquid–solid system.
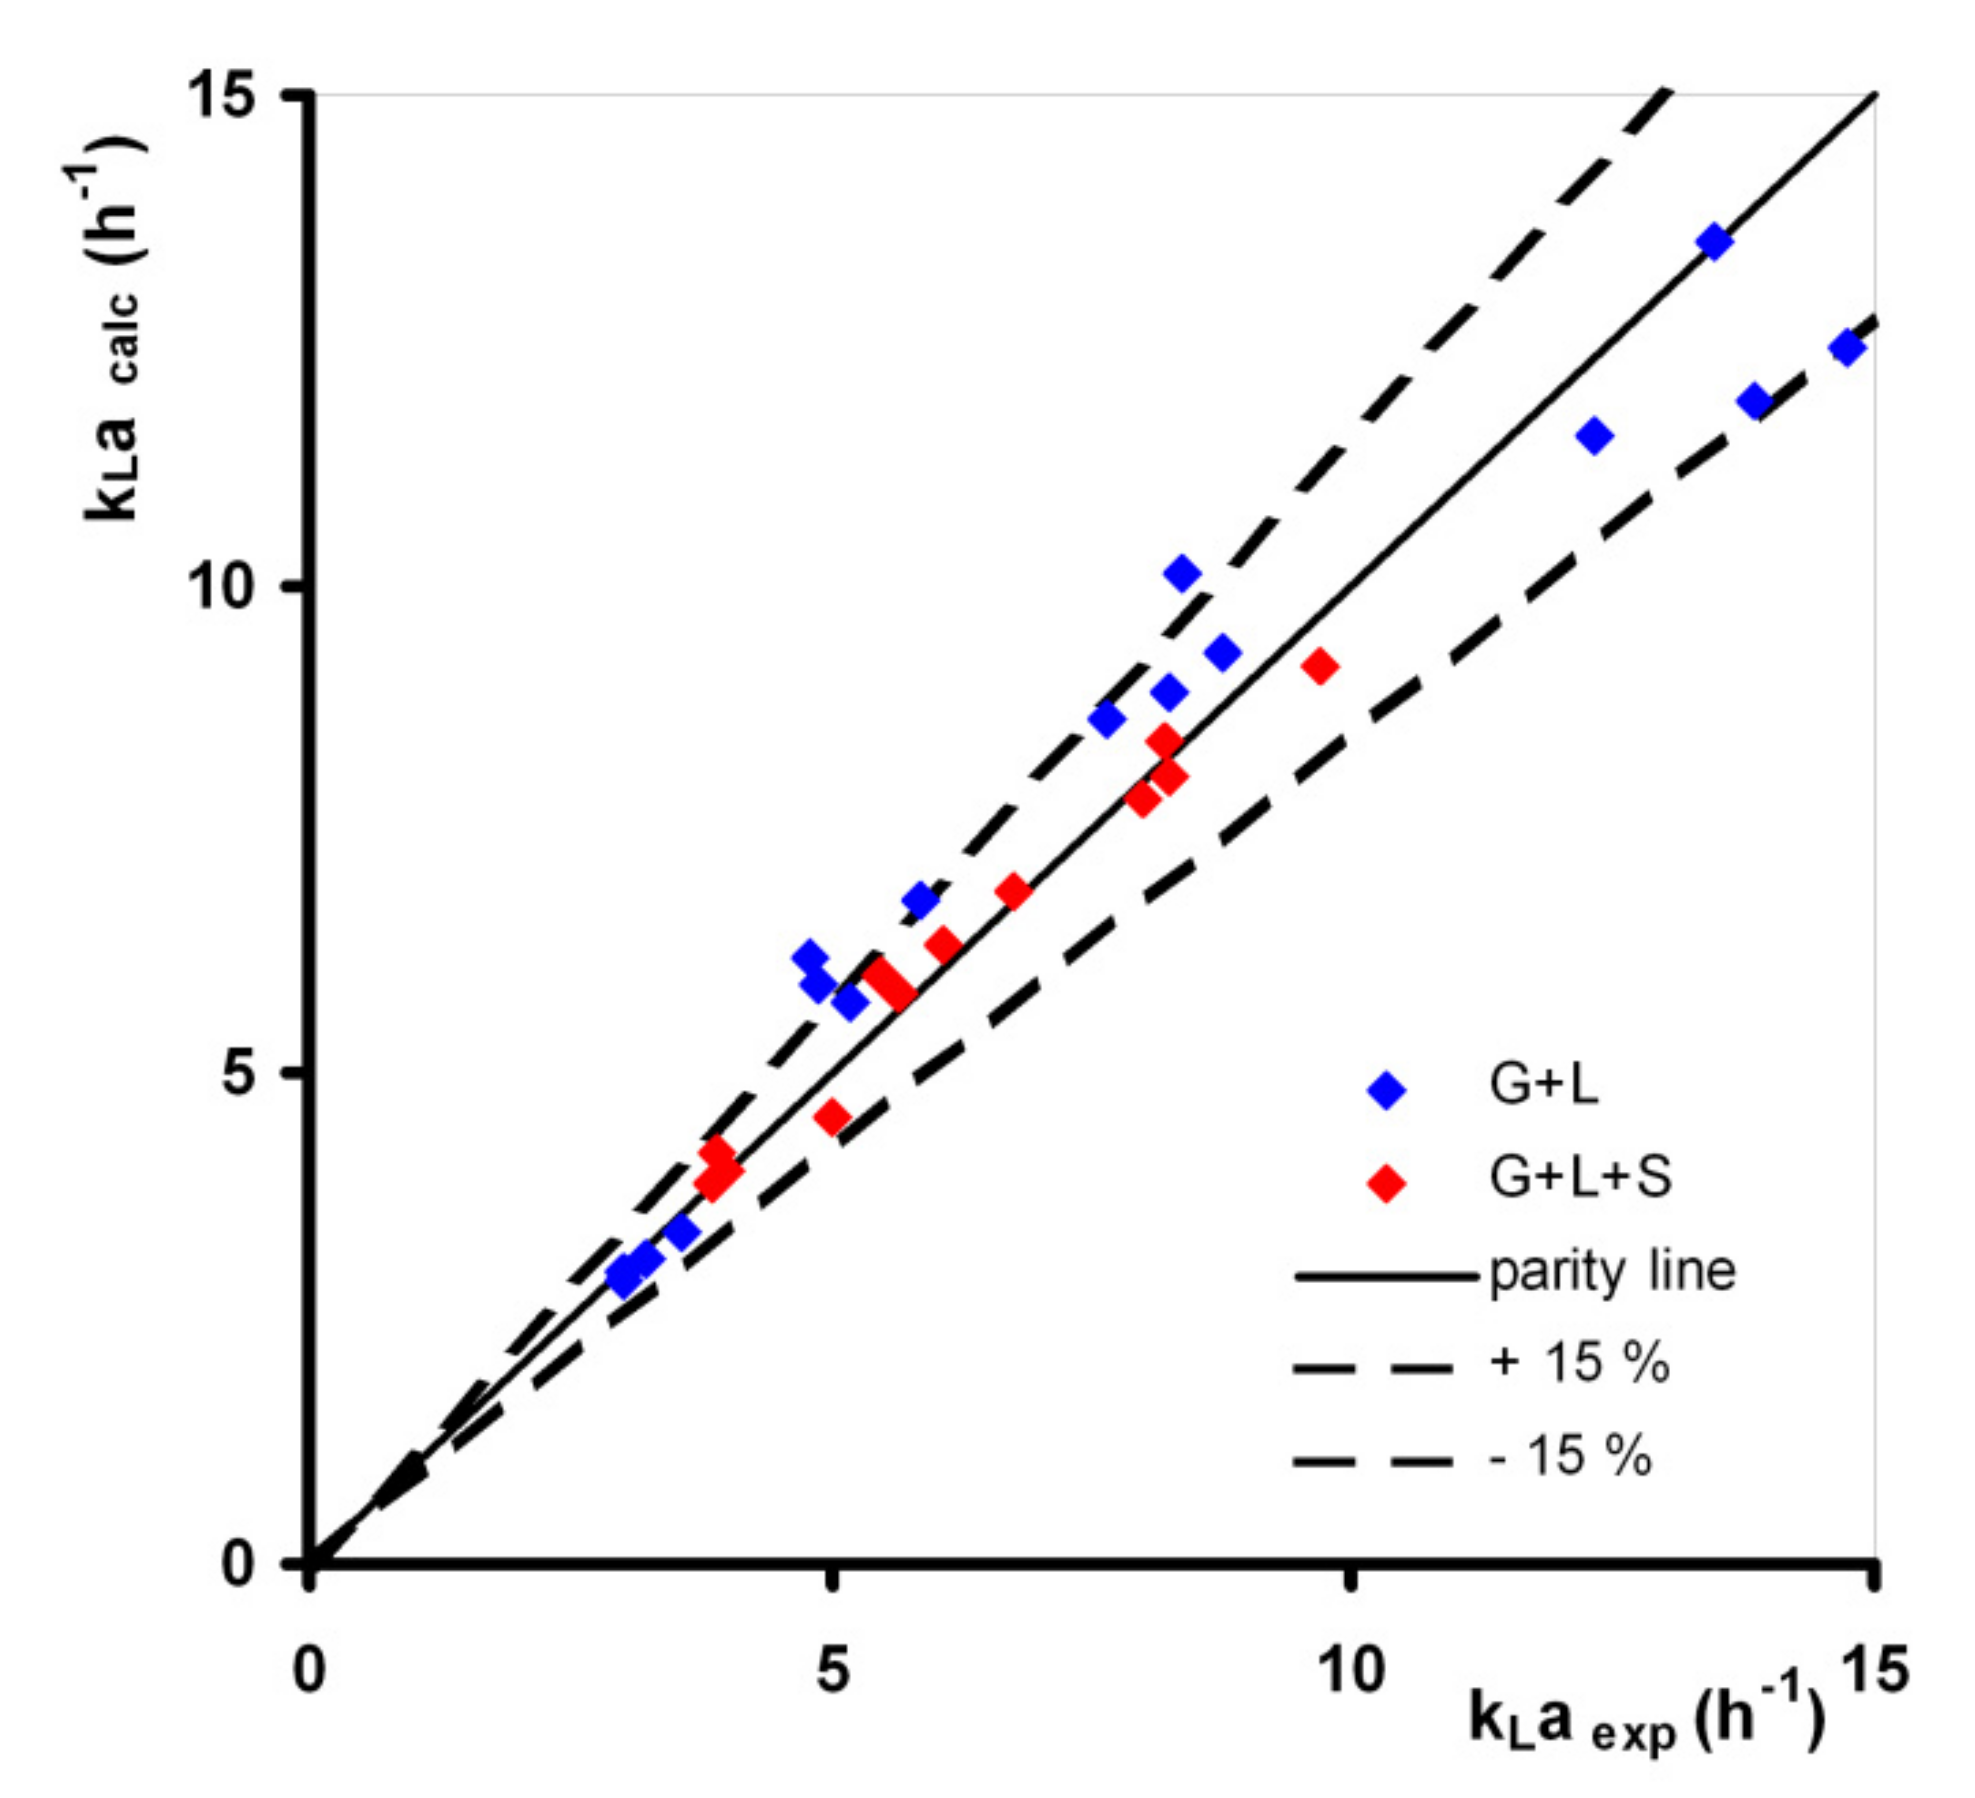
The evaluated parameters of the power-law correlation (12) and values of AAE, ABE, and R2 are presented in Table 16 for the gas–liquid and gas–liquid–solid systems. The positive ABE value, higher compared to the AAE value, indicates an overall overestimation of the experimental kLa coefficient by the proposed correlation (12), especially for the gas–liquid system. The comparison of experimental data and the correlation given by Equation (12) is presented in Figure 9 for both systems. The lines representing the relative error of ±15% are shown also in Figure 9 for illustration.
Alternatively, the experimental data were successfully correlated using a combined exponential and power-law function (13). The evaluated parameters of the power-law correlation (13) and values of AAE, ABE, and R2 are presented in Table 17 for the gas–liquid and gas–liquid–solid system. The approx. three times lower AAE value indicates better predictability of kLa coefficient by correlation (13) compared to correlation (12) for the gas–liquid system. The slightly positive ABE value indicates a practically uniform estimation of the kLa coefficient by the proposed correlation (13).
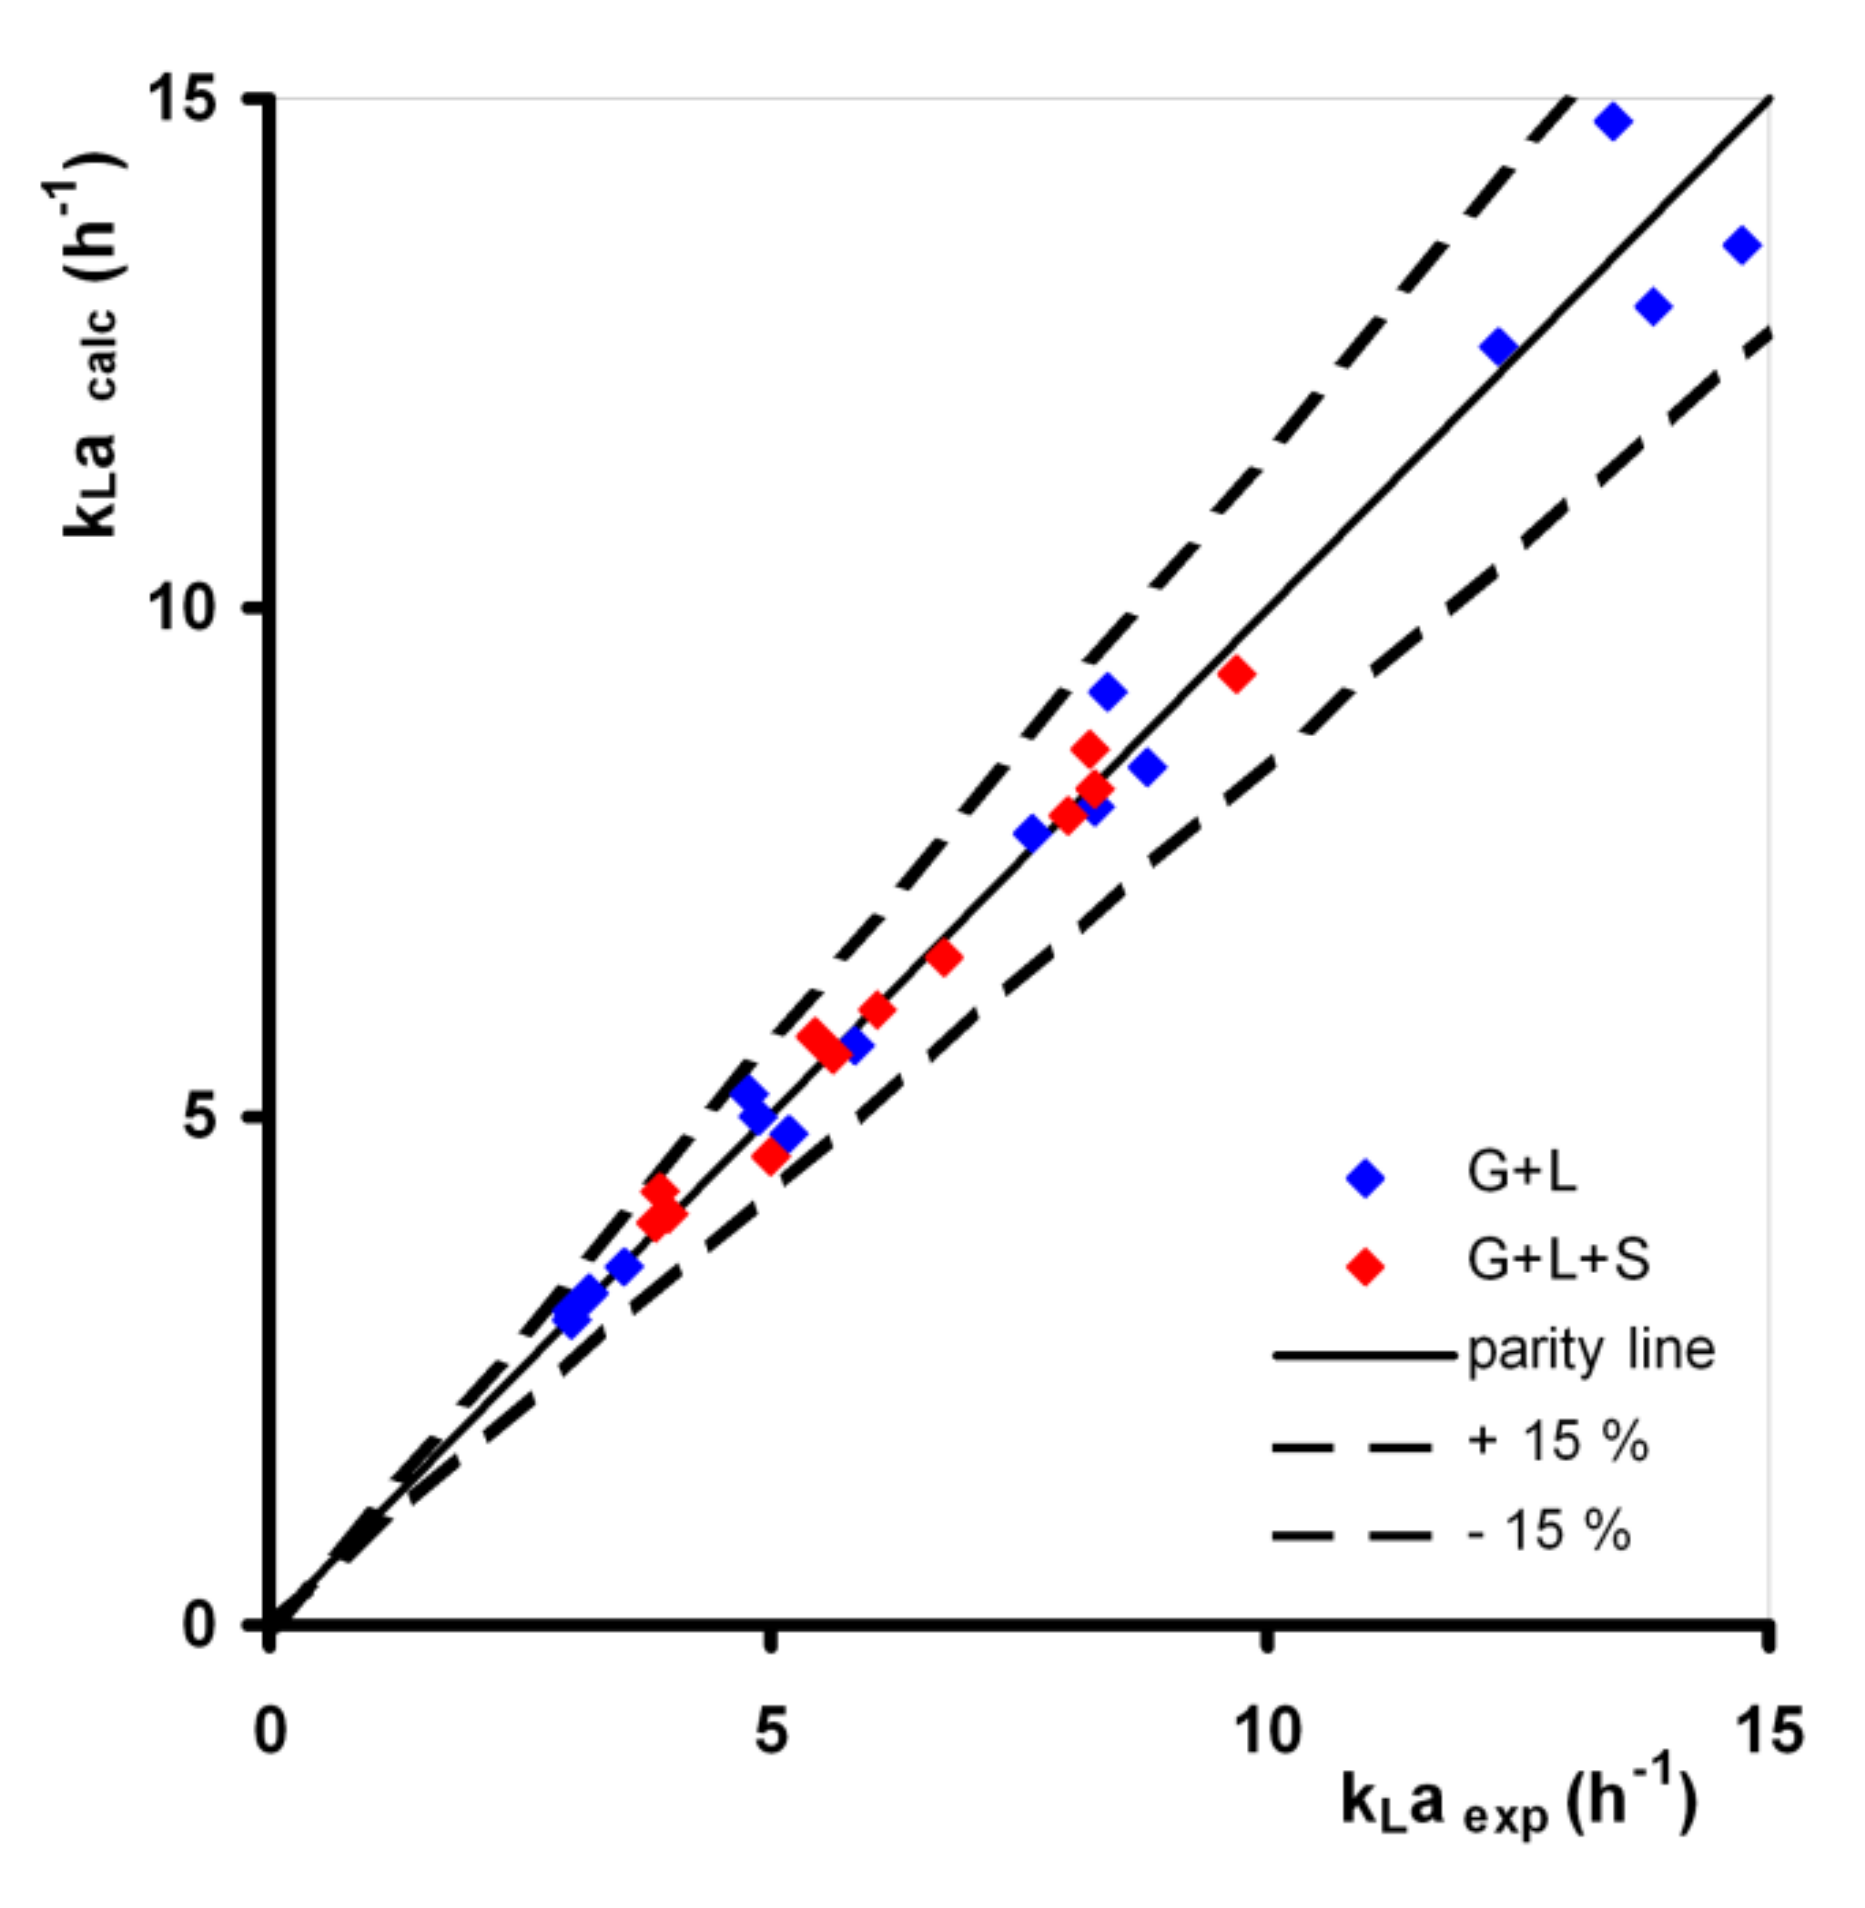
The comparison of measured values and values calculated using the proposed correlation (13) is shown in Figure 10 as a function of the riser superficial gas velocity for the gas–liquid and gas–liquid–solid systems. The comparison of experimental data and the correlation given by Equation (13) is presented in Figure 11 for both systems. The lines representing ±15% of the relative error are shown also in Figure 11 for illustration
4. Conclusions
The experiments were carried out in a laboratory conical jet-loop airlift bioreactor of 300 mm in inner diameter and volume of 62.5 dm3. As a novelty, the gas separator was equipped with an adjustable deflector placed above the riser compared with a standard design. The effects of riser superficial gas velocity uSGR on total gas holdup εGT, homogenization time tH, and overall volumetric liquid-phase mass transfer coefficient kLa were investigated in the two-phase air–water system and three-phase air–water–PVC particle system with the volumetric solid fraction of 1%. The airlift was operated in regime I according to the classification given by Heijnen et al. [27]. The experimental data were successfully correlated using a power-law function or using a combined exponential- and power-law function. The evaluated values of the power law exponent for superficial gas velocity were compared with the values reported in the literature for the gas–liquid system using the hypothesis testing method.
The following results were gained:
- Reducing the deflector clearance, the total gas holdup decreases for the gas–liquid system. Unlike this, the weak effect of deflector clearance was observed for the gas–liquid–solid system, especially for higher values of riser superficial gas velocity;
- For the gas–liquid system, when reducing deflector clearance, homogenization time increased twice compared to the highest deflector clearance tested. For the gas–liquid–solid system, the effect of deflector clearance is weaker compared to the gas–liquid system and the presence of solid phase shortens the homogenization time, especially for lower riser superficial gas velocity and deflector clearance;
- For the gas–liquid system, when reducing the deflector clearance, the overall volumetric mass transfer coefficient slightly increases by 10–17%. The presence of solid phase reduced the mass transfer coefficient by 15–35%. In the gas–liquid–solid system, the effect of deflector clearance is more accentuated compared to the gas–liquid system. The mass transfer coefficient for the lowest tested deflector clearance was approx. 20–29% higher than for the highest tested deflector clearance.
- The airlift reactors equipped with internals placed in the gas separation section may be a promising novel airlift reactor design, as reported by Zhang et al. [30].
The future research will be focused on the overall gas-to-liquid heat transfer investigation.
Author Contributions
Methodology, R.Š. and J.D.; validation, J.D. and R.Š.; investigation, J.D.; data curation, J.D. and R.Š.; writing—original draft preparation, review and editing, R.Š.; visualization, R.Š.; supervision, R.Š. Both authors have read and agreed to the published version of the manuscript.
Funding
This research and the APC were funded and supported by the MINISTRY OF EDUCATION, YOUTH AND SPORTS OF THE CZECH REPUBLIC, grant number OP RDE CZ.02.1.01/0.0/0.0/16_019/0000753 Research centre for low-carbon energy technologies.
Conflicts of Interest
The authors declare no conflict of interest.
Nomenclature
| AAE | average absolute error | % |
| ABE | average bias error | % |
| AC | column cross-section area | m2 |
| AD | downcomer cross-section area | m2 |
| AR | riser cross-section area | m2 |
| Bo | Bond number; Bo = g⋅ρL⋅Dchar2/σ | - |
| BR | bottom spatial ratio; B = CRB/DR | - |
| cL | mass concentration of liquid dissolved oxygen | kg/m3 |
| mass concentration of dissolved oxygen in liquid at saturation | kg/m3 | |
| C | temperature correction factor in Equation (11) | - |
| C | constant of proportionality in Equation (4) | (m/s)-α |
| C | constant of proportionality in Equation (6) | s⋅(m/s)-α |
| C | constant of proportionality in Equation (7) | s |
| C | constant of proportionality in Equation (12) | h−1⋅(m/s)-α |
| C | constant of proportionality in Equation (13) | h−1 |
| CD | deflector clearance | m |
| CRB | riser bottom clearance | m |
| CRU | riser upper clearance | m |
| dh | hole diameter (in gas distributor) | m |
| DC | column inner diameter | m |
| Dchar | characteristic diameter (DR or DC) | m |
| DD | downcomer inner diameter | m |
| DL | diffusivity coefficient of gas in liquid | m2/s |
| DR | riser inner diameter | m |
| DS | gas separator inner diameter | m |
| DT | draft tube inner diameter | m |
| Fr | Froude number; Fr = uSG/(g⋅Dchar)0.5 | - |
| g | gravity acceleration | m/s2 |
| Ga | Galilei number; Ga = g⋅ρL2⋅Dchar3/μL2 | - |
| HL0 | liquid filling height | m |
| HG+L | height of gas–liquid dispersion | m |
| HG+L+S | height of gas–liquid–solid dispersion | m |
| HR | riser height | m |
| kLa | overall volumetric liquid-phase mass transfer coefficient | s−1 |
| Mo | Morton number; Mo = g⋅μL4/(ρL⋅σL3) | - |
| OTR | oxygen transfer rate | kg/(m3.s) |
| R | downcomer resistance flow ratio; R = AD/AR | - |
| R2 | coefficient of determination | - |
| SG | gas-to-liquid interfacial area | m2 |
| Sc | Schmidt number; Sc = μL/(ρL⋅DL) | - |
| Sh | Sherwood number; Sh = kLa⋅Dchar2/DL | - |
| t | time | s |
| T | temperature | °C |
| TR | top spatial ratio; T = CRU/DR + 1 | - |
| uSG | superficial gas velocity (for riser or column) | m/s |
| uSGC | column superficial gas velocity (based on the column cross-section); /AC | m/s |
| uSGR | riser superficial gas velocity (based on the riser cross-section); /AR | m/s |
| V | volume | m3 |
| gas volumetric flowrate | m3/s | |
| Y | gas separator ratio; Y = (CRU + DR)/DS | - |
Greek Letters
| α | power-law exponent in Equations (4), (6), and (12) | - |
| α | power-law exponent in Equations (7) and (13) | s/m |
| α | significance level | - |
| β | power-law exponent in Equations (4), (6), (7), (12), and (13) | - |
| ε | gas hold up | - |
| φS | volumetric solid fraction | - |
| μL | dynamic viscosity of liquid | Pa.s |
| υ | kinematic viscosity | m2/s |
| ρ | density | kg/m3 |
| σ | surface tension | N/m |
| τ | response time of oxygen probe | s |
Indexes
| B | bottom |
| C | column |
| calc | calculated |
| D | downcomer |
| G | gas phase |
| L | liquid phase |
| pred | predicted |
| R | riser |
| S | gas separator |
| S | solid phase |
| T | draft tube |
| T | total |
| U | upper |
Abbreviation
| ALR | airlift reactor |
References
- Lafarga, T.; Acién-Fernández, F.G.; Garcia-Vaquero, M. Bioactive peptides and carbohydrates from seaweed for food applications: Natural occurrence, isolation, purification, and identification. Algal Res. 2020, 48, 101909. [Google Scholar] [CrossRef]
- Papacek, S.; Petera, K.; Masaló, I.; Oca, J. Modeling and optimization of flow pattern in tanks for seaweed culture. In Proceedings of the Aquaculture Europe 2017: Cooperation for Growth—Abstracts EA2017, Dubrovnik, Croatia, 7–20 October 2017; European Aquaculture Society: Oostende, Belgium, 2017; p. 874. [Google Scholar]
- Dolganyuk, V.; Belova, D.; Babich, D.; Prosekov, A.; Ivanova, S.; Katserov, D.; Patyukov, N.; Sukhikh, S. Microalgae: A Promising Source of Valuable Bioproducts. Biomolecules 2020, 10, 1153. [Google Scholar] [CrossRef] [PubMed]
- Guedes, A.C.; Amaro, H.M.; Malcata, F.X. Microalgae as Sources of Carotenoids. Mar. Drugs 2011, 9, 625–644. [Google Scholar] [CrossRef] [PubMed]
- Ranjbar, R.; Inoue, R.; Katsuda, T.; Yamaji, H.; Katoh, S. High efficiency production of astaxanthin in an airlift photobioreactor. J. Biosci. Bioeng. 2008, 106, 204–207. [Google Scholar] [CrossRef]
- Lakshmidevi, R.; Gandhi, N.N.; Muthukumar, K. Enhanced biomass and lutein production by mixotrophic cultivation of Scenedesmus sp. using crude glycerol in airlift photobioreactor. Biochem. Eng. J. 2020, 161, 107684. [Google Scholar] [CrossRef]
- Lage, S.; Gojkovic, Z.; Funk, C.; Gentili, F.G. Algal Biomass from wastewater and flue gases as a source of bioenergy. Energies 2018, 11, 664. [Google Scholar] [CrossRef] [Green Version]
- Zhang, X. Microalgae Removal of CO2 from Flue Gas; IEA Clean Coal Centre: London, UK, 2015; ISBN 9789290295723. [Google Scholar]
- Arroyo, C.A.; Contreras, J.L.; Zeifert, B.; Ramírez, C.C. CO2 capture of the gas emission using a catalytic converter and airlift bioreactors with the microalga Scenedesmus dimorphus. Appl. Sci. 2019, 9, 3212. [Google Scholar] [CrossRef] [Green Version]
- Saad, M.G.; Dosoky, N.S.; Zoromba, M.S.; Shafik, H.M. Algal Biofuels: Current Status and Key Challenges. Energies 2019, 12, 1920. [Google Scholar] [CrossRef] [Green Version]
- Hosseini, N.S.; Shang, H.; Ross, G.M.; Scott, J.A. Comparative analysis of top-lit bubble column and gas-lift bioreactors for microalgae-sourced biodiesel production. Energy Convers. Manag. 2016, 130, 230–239. [Google Scholar] [CrossRef]
- SundaRajan, P.; Gopinath, K.P.; Greetham, D.; Antonysamy, A.J. A review on cleaner production of biofuel feedstock from integrated CO2 sequestration and wastewater treatment system. J. Clean. Prod. 2019, 210, 445–458. [Google Scholar] [CrossRef]
- Hosseini, N.S.; Shang, H.; Ross, G.M.; Scott, J.A. Microalgae cultivation in a novel top-lit gas-lift open bioreactor. Bioresour. Technol. 2015, 192, 432–440. [Google Scholar] [CrossRef]
- Alami, A.H.; Alasad, S.; Ali, M.; Alshamsi, M. Investigating algae for CO2 capture and accumulation and simultaneous production of biomass for biodiesel production. Sci. Total Environ. 2021, 759, 143529. [Google Scholar] [CrossRef] [PubMed]
- Ugwu, C.U.; Aoyagi, H.; Uchiyama, H. Photobioreactors for mass cultivation of algae. Bioresour. Technol. 2008, 99, 4021–4028. [Google Scholar] [CrossRef] [PubMed]
- Singh, R.N.; Sharma, S. Development of suitable photobioreactor for algae production—A review. Renew. Sustain. Energy Rev. 2012, 16, 2347–2353. [Google Scholar] [CrossRef]
- Chew, K.W.; Chia, S.R.; Show, P.L.; Yap, Y.J.; Ling, T.C.; Chang, J.-S. Effects of water culture medium, cultivation systems and growth modes for microalgae cultivation: A review. J. Taiwan Inst. Chem. Eng. 2018, 91, 332–344. [Google Scholar] [CrossRef]
- Assunção, J.; Malcata, F.X. Enclosed “non-conventional” photobioreactors for microalga production: A review. Algal Res. 2020, 52, 102107. [Google Scholar] [CrossRef]
- Žižka, M.; Šulc, R.; Ditl, P. Heat transfer between gas and liquid in a bubble column. Chem. Eng. Trans. 2017, 57, 1261–1266. [Google Scholar] [CrossRef]
- Žižka, M.; Šulc, R.; Ditl, P. Heat transfer between gas and non-coalescent liquid in a bubble column. Chem. Eng. Trans. 2019, 74, 1057–1062. [Google Scholar] [CrossRef]
- Zhang, T.; Wei, C.; Feng, C.; Ren, Y.; Wu, H.; Preis, S. Advances in characteristics analysis, measurement methods and modeling of flow dynamics in airlift reactors. Chem. Eng. Process. Process Intensif. 2019, 144, 107633. [Google Scholar] [CrossRef]
- Kaewpintong, K.; Shotipruk, A.; Powtongsook, S.; Pavasant, P. Photoautotrophic high-density cultivation of vegetative cells of Haematococcus pluvialis in airlift bioreactor. Bioresour. Technol. 2007, 98, 288–295. [Google Scholar] [CrossRef]
- Chiu, S.-Y.; Tsai, M.-T.; Kao, C.-Y.; Ong, S.-C.; Lin, C.-S. The airlift photobioreactors with flow patterning for high-density cultures of microalgae and carbon dioxide removal. Eng. Life Sci. 2009, 9, 254–260. [Google Scholar] [CrossRef]
- Hladíková, M.; Šulc, R. Selection of a separation method used for harvesting of microalgae from aqueous solution. Chem. Eng. Trans. 2021, 86, 157–162. [Google Scholar] [CrossRef]
- Belohlav, V.; Jirout, T. Design methodology of industrial equipment for microalgae biomass primary harvesting and dewatering. Chem. Eng. Trans. 2019, 76, 919–924. [Google Scholar] [CrossRef]
- Acién, F.G.; Fernández, J.M.; Magán, J.J.; Molina, E. Production cost of a real microalgae production plant and strategies to reduce it. Biotechnol. Adv. 2012, 30, 1344–1353. [Google Scholar] [CrossRef] [PubMed]
- Heijnen, J.J.; Hols, J.; van der Lans, R.G.J.M.; van Leeuwen, H.L.J.M.; Mulder, A.; Weltevrede, R. A simple hydrodynamic model for the liquid circulation velocity in a full-scale two- and three-phase internal airlift reactor operating in the gas recirculation regime. Chem. Eng. Sci. 1997, 52, 2527–2540. [Google Scholar] [CrossRef]
- Koide, K.; Kimura, M.; Nitta, H.; Kawabata, H. Liquid circulation in bubble column with draught tube. J. Chem. Eng. Jpn. 1988, 21, 393–399. [Google Scholar] [CrossRef] [Green Version]
- Lu, X.P.; Ding, J.; Wang, Y.R.; Shi, J. Comparison of the hydrodynamics and mass transfer characteristics of a modified square airlift reactor with common airlift reactors. Chem. Eng. Sci. 2000, 55, 2257–2263. [Google Scholar] [CrossRef]
- Zhang, T.; Wei, C.; Feng, C.; Zhu, J. A novel airlift reactor enhanced by funnel internals and hydrodynamics prediction by the CFD method. Bioresour. Technol. 2012, 104, 600–607. [Google Scholar] [CrossRef]
- Chisti, M.Y. Airlift Bioreactors; Elsevier: London, UK, 1989; ISBN 1851663207. [Google Scholar]
- Juraščík, M.; Blažej, M.; Annus, J.; Markoš, J. Experimental measurements of volumetric mass transfer coefficient by the dynamic pressure-step method in internal loop airlift reactors of different scale. Chem. Eng. J. 2006, 125, 81–87. [Google Scholar] [CrossRef]
- Albijanić, B.; Havran, V.; Petrović, D.L.; Durić, M.; Tekić, M.N. Hydrodynamics and mass transfer in a draft tube airlift reactor with dilute alcohol solutions. AIChE J. 2007, 53, 2897–2904. [Google Scholar] [CrossRef]
- Gavrilescu, M.; Tudose, R.Z. Concentric-tube airlift bioreactors. Part I: Effects of geometry on gas holdup. Bioprocess Eng. 1998, 19, 37–44. [Google Scholar] [CrossRef]
- Gouveia, E.R.; Hokka, C.O.; Badino, A.C. The effects of geometry and operational conditions on gas holdup, liquid circulation and mass transfer in an airlift reactor. Braz. J. Chem. Eng. 2003, 20, 363–374. [Google Scholar] [CrossRef]
- Miron, A.S.; Camacho, F.G.; Gomez, A.C.; Grima, E.M.; Chisti, Y. Bubble-column and airlift photobioreactors for algal culture. AIChE J. 2000, 46, 1872–1887. [Google Scholar] [CrossRef]
- Bando, Y.; Hayakawa, H.; Nishimura, M. Effects of the equipment dimensions on liquid mixing time of bubble column with draft tube. J. Chem. Eng. Jpn. 1998, 28, 225–227. [Google Scholar] [CrossRef] [Green Version]
- Gavrilescu, M.; Tudose, R.Z. Modeling mixing parameters in concentric-tube airlift bioreactors. Part I: Mixing time. Bioprocess Eng. 1999, 20, 423–428. [Google Scholar] [CrossRef]
- Petrović, D.L.; Pošarac, D.; Duduković, A. Prediction of mixing time in airlift reactors. Chem. Eng. Commun. 1995, 133, 1–9. [Google Scholar] [CrossRef]
- Koide, K.; Kurematsu, K.; Iwamoto, S.; Iwata, Y.; Horibe, K. Gas holdup and volumetric liquid-phase mass-transfer coefficient in bubble column with draught tube and with gas dispersion into tube. J. Chem. Eng. Jpn. 1983, 16, 413–419. [Google Scholar] [CrossRef] [Green Version]
- Gavrilescu, M.; Tudose, R.Z. Concentric-tube airlift bioreactors. Part III: Effects of geometry on mass transfer. Bioprocess Eng. 1998, 19, 175–178. [Google Scholar] [CrossRef]
- Cerri, M.O.; Badino, A.C. Oxygen transfer in three scales of concentric tube airlift bioreactors. Biochem. Eng. J. 2010, 51, 40–47. [Google Scholar] [CrossRef]
- Akita, K.; Yoshida, F. Gas holdup and volumetric mass-transfer coefficient in bubble columns—Effects of liquid properties. Ind. Eng. Chem. Process Des. Dev. 1973, 12, 76–80. [Google Scholar] [CrossRef]
- Luo, L.; Liu, F.; Xu, Y.; Yuan, J. Hydrodynamics and mass transfer characteristics in an internal loop airlift reactor with different spargers. Chem. Eng. J. 2011, 175, 494–504. [Google Scholar] [CrossRef]
- Koide, K.; Shibata, K.; Ito, H.; Kim, S.Y.; Ohtaguchi, K. Gas holdup and volumetric liquid-phase mass-transfer coefficient in a gel-particle suspended bubble column with draught tube. J. Chem. Eng. Jpn. 1992, 25, 11–16. [Google Scholar] [CrossRef] [Green Version]
- Yang, T.; Geng, S.; Yang, C.; Huang, Q. Hydrodynamics and mass transfer in an internal airlift slurry reactor for process intensification. Chem. Eng. Sci. 2018, 184, 126–133. [Google Scholar] [CrossRef]
- Sastaravet, P.; Bun, S.; Wongwailikhit, K.; Chawaloesphonsiya, N.; Fujii, M.; Painmanakul, P. Relative effect of additional solid media on bubble hydrodynamics in bubble column and airlift reactors towards mass transfer enhancement. Processes 2020, 8, 713. [Google Scholar] [CrossRef]
- Šulc, R.; Dymák, J. Hydrodynamics and mass transfer in conical internal jet-loop airlift bioreactor equipped with a deflector. In Proceedings of the 26th European Biomass Conference and Exhibition, Copenhagen, Denmark, 14–17 May 2018; ETA-Florence Renewable Energies: Florence, Italy, 2018. ISBN 9788889407189. [Google Scholar] [CrossRef]
- Kabátek, J.; Ditl, P.; Novák, V. Helax—A new type of static mixer—Operation characteristics and comparison with other types. Chem. Eng. Process. 1989, 25, 59–64. [Google Scholar] [CrossRef]
- Merchuk, J.C.; Yona, S.; Siegel, M.H.; Zvi, A.B. On the First-order approximation to the response of dissolved oxygen electrodes for dynamic kLa estimation. Biotechnol. Bioeng. 1990, 35, 1161–1163. [Google Scholar] [CrossRef]
- Sardeing, R.; Aubin, J.; Xuereb, C. Gas–liquid Mass Transfer: A comparison of down- and up-pumping axial flow impellers with radial turbines. Chem. Eng. Res. Des. 2004, 82, 1589–1596. [Google Scholar] [CrossRef] [Green Version]
- Bewtra, J.K.; Nicholas, W.R.; Polkowski, L.B. Effect of temperature on oxygen transfer in water. Water Res. 1970, 4, 115–123. [Google Scholar] [CrossRef]
- Nogaj, R.J.; Hurwitz, E. Determination of aerator efficiency under process conditions. In Proceedings of the Engineering Bulletin of Purdue University, 18th Industrial Waste Conference, West Lafayette, IL, USA, 30 April–2 May 1963; Purdue Univ.: West Lafayette, IL, USA, 1963; pp. 674–684. [Google Scholar]
- Lee, J. Development of a model to determine mass transfer coefficient and oxygen solubility in bioreactors. Heliyon 2017, 3, e00248. [Google Scholar] [CrossRef] [Green Version]
- Bowerman, B.L.; O’Connell, R.T. Applied Statistics: Improving Business Processes; Richard D. Irwin: Homewood, IL, USA, 1997; ISBN 025619386X. [Google Scholar]
- Qian, X. Statistical Analysis and Evaluation of the Advanced Biomass and Natural Gas Co-Combustion Performance. Ph.D. Thesis, Morgan State University, Baltimore, MD, USA, May 2019. [Google Scholar]
- Qian, X.; Lee, S.; Soto, A.-M.; Chen, G. Regression Model to Predict the Higher Heating Value of Poultry Waste from Proximate Analysis. Resources 2018, 7, 39. [Google Scholar] [CrossRef] [Green Version]
- Eboh, F.C.; Ahlström, P.; Richards, T. Estimating the specific chemical exergy of municipal solid waste. Energy Sci. Eng. 2016, 4, 217–231. [Google Scholar] [CrossRef] [Green Version]
Figure 1.
Scheme of the experimental apparatus: (1) Riser, (2) downcomer, (3) sparger, (4) deflector, (5) oxygen probe.
Figure 1.
Scheme of the experimental apparatus: (1) Riser, (2) downcomer, (3) sparger, (4) deflector, (5) oxygen probe.

Figure 2.
Total gas holdup GT: Effect of dimensionless deflector clearance: Gas–liquid system (empty symbols), gas–liquid–solid system (full symbols), correlation (4) for gas–liquid system (dotted line), correlation (4) for gas–liquid–solid system (full line).
Figure 2.
Total gas holdup GT: Effect of dimensionless deflector clearance: Gas–liquid system (empty symbols), gas–liquid–solid system (full symbols), correlation (4) for gas–liquid system (dotted line), correlation (4) for gas–liquid–solid system (full line).

Figure 3.
Total gas holdup αGT: Comparison of experimental and calculated data using (4)—parity plot.
Figure 3.
Total gas holdup αGT: Comparison of experimental and calculated data using (4)—parity plot.

Figure 4.
Homogenization time tH: Effect of dimensionless deflector clearance: Gas–liquid system (empty symbols), gas–liquid–solid system (full symbols), correlation (6) for gas–liquid system (dotted line), correlation (6) for gas–liquid–solid system (full line).
Figure 4.
Homogenization time tH: Effect of dimensionless deflector clearance: Gas–liquid system (empty symbols), gas–liquid–solid system (full symbols), correlation (6) for gas–liquid system (dotted line), correlation (6) for gas–liquid–solid system (full line).

Figure 5.
Homogenization time tH: Comparison of experimental and calculated data using (6)—parity plot.
Figure 5.
Homogenization time tH: Comparison of experimental and calculated data using (6)—parity plot.

Figure 6.
Homogenization time tH: Effect of riser superficial gas velocity: Gas–liquid system (empty symbols), gas–liquid–solid system (full symbols), correlation (7) for gas–liquid system (dotted line), correlation (7) for gas–liquid–solid system (full line).
Figure 6.
Homogenization time tH: Effect of riser superficial gas velocity: Gas–liquid system (empty symbols), gas–liquid–solid system (full symbols), correlation (7) for gas–liquid system (dotted line), correlation (7) for gas–liquid–solid system (full line).

Figure 7.
Homogenization time tH: Comparison of experimental and calculated data using (7)—parity plot.
Figure 7.
Homogenization time tH: Comparison of experimental and calculated data using (7)—parity plot.

Figure 8.
Overall volumetric mass transfer coefficient kLa: Effect of dimensionless deflector clearance: Gas–liquid system (empty symbols), gas–liquid–solid system (full symbols), correlation (12) for gas–liquid system (dotted line), correlation (12) for gas–liquid–solid system (full line).
Figure 8.
Overall volumetric mass transfer coefficient kLa: Effect of dimensionless deflector clearance: Gas–liquid system (empty symbols), gas–liquid–solid system (full symbols), correlation (12) for gas–liquid system (dotted line), correlation (12) for gas–liquid–solid system (full line).

Figure 9.
Overall volumetric mass transfer coefficient kLa: Comparison of experimental and calculated data using (12)–parity plot.
Figure 9.
Overall volumetric mass transfer coefficient kLa: Comparison of experimental and calculated data using (12)–parity plot.

Figure 10.
Overall volumetric mass transfer coefficient kLa: Effect of riser superficial gas velocity: Gas–liquid system (empty symbols), gas–liquid–solid system (full symbols), correlation (13) for gas–liquid system (dotted line), correlation (13) for gas–liquid–solid system (full line).
Figure 10.
Overall volumetric mass transfer coefficient kLa: Effect of riser superficial gas velocity: Gas–liquid system (empty symbols), gas–liquid–solid system (full symbols), correlation (13) for gas–liquid system (dotted line), correlation (13) for gas–liquid–solid system (full line).

Figure 11.
Overall volumetric mass transfer coefficient kLa: Comparison of experimental and calculated data using (13)—parity plot.
Figure 11.
Overall volumetric mass transfer coefficient kLa: Comparison of experimental and calculated data using (13)—parity plot.


| Advantages | Limitations |
|---|---|
| Simple design. | Compressed gas required. |
| No moving parts. | Small illumination surface area. |
| Good mixing due to circular mixing pattern. | Scale-up process is difficult. |
| Intensive mass transfer. | Decrease of illumination surface during scale-up. |
| Low shear stress. | Increasing light path with increasing column diameter. |
| Efficient light penetration and utilization. | Insufficient turbulence creation through airlift operation. |
| Exposure to light/dark cycles. | Risk of high shear stress on an algae culture. |
| High biomass concentration. | Restricted working volume by oxygen removal capability of airlift process. |
| Good photosynthetic efficiency. | Photo-inhibition problems. |
| Low built area ⟶ High areal production. | |
| Low fouling. |
| Source | Correlation |
|---|---|
| Lu et al. [29] | Concentric tube ALR. DD = 0.188 m, AR/AD = 0.695 and 1.38. Gas distribution: Single nozzle. Air–water system. |
| εGT = 0.035 × uSGC0.647 × (AR/AD)−0.085 | |
| 0.02 < uSGC (m/s) < 0.1 | |
| Square airlift with concentric tube; W = 0.167 m; AR/AD = 0.695 and 1.38. Gas distribution: Single nozzle. Air–water system. | |
| εGT = 0.046 × uSGC0.58 × (AR/AD)−0.072 | |
| 0.02 < uSGC (m/s) < 0.1 | |
| Chisti [31] | Concentric tube ALR Gas distribution: Perforated plate (40 holes, dh = 1 mm) Air–liquid system. Liquids: Water, salt solution. |
| ε = 1.488 × uSGC0.892; bubble flow, perforated plate. | |
| ε = 0.371 × uSGC0.430; coalesced bubble flow, perforated plate. | |
| Juraščík et al. [32] | Concentric tube ALR. Gas distribution: Perforated plate. Air–water system. ALR1: V = 12 dm3, DC = 0.108 m, AD/AR = 1.23; ALR2: V = 40 dm3, DC = 0.157 m, AD/AR = 0.95; ALR3: V = 195 dm3, DC = 0.294 m, AD/AR = 1.01; |
| εGT = 0.999 × uSGR2/3 × (1+AD/AR)−1; V = 12 dm3 | |
| εGT = 0.946 × uSGR2/3 × (1+AD/AR)−1; V = 40 dm3 | |
| εGT = 1.060 × uSGR2/3 × (1+AD/AR)−1; V = 195 dm3 | |
| uSGC ≤ 0.065 m/s | |
| Albijanić et al. [33] | Concentric-tube ALR with spherical bottom, DD = DC = 106 mm, DR/DC = 0.51. Gas distribution: Single orifice (dh = 4 mm). Air–liquid system; Liquids: Water, an aqueous solution of methanol, ethanol, n-propanol, isopropanol, and n-butanol (1 wt %). |
| 0.0025 < uSGC (m/s) < 0.05 | |
| εGT = 1.65 × uSGC0.97 × [1 + (−dσ/dcA)0.20]1.52 | |
| cA—alcohol concentration (wt %) (dσ/dcA)—surface tension gradient | |
| Gavrilescu and Tudose [34] | Concentric tube airlift; DR = 0.1 ÷ 0.6 m. Dchar = DR. Gas distribution: Perforated plate sparger (100 × dh = 2 mm), multiring sparger (dh = 3.5 mm). Air–water system. |
| εGT = 3 × FrR1.2 × B−0.13 × Y−0.2 × T−0.6 × R−0.16 | |
| 5⋅10−3 < FrR < 110·10−3, 0.5 < B < 3.8, 0.333 < Y < 1.267, 1 < T < 3.8, 0.1 < R < 0.9, AD/AR ≥ 1, uSGR ≤ 0.11 m/s | |
| B—bottom spatial ratio (B = CRB/DR) R—downcomer resistance flow ratio (R = AD/AR) T—top spatial ratio (T = CRU/DR + 1) Y—gas separator ratio (Y = (CRU + DR)/DS) | |
| Gouveia et al. [35] | Concentric-draft tube ALR, annulus-sparged ALR; AD/AR = 0.63. DC = 0.100 m; DD = DT = 0.080 m, Dchar = DRekv (riser equivalent diameter). Gas distribution: Ring with 35 holes (dh = 0.7 mm). Air–water system. |
| εGT = 1.32 × FrR0.77 × B0.39 × T0.08 | |
| 0.0126 < uSGR (m/s) < 0.0440 |
| Source | Correlation |
|---|---|
| Lu et al. [29] | Concentric tube ALR; DD = 0.188 m, AR/AD = 0.695 and 1.38. Gas distribution: Single nozzle. Air–water system. |
| tH (s) = 45.70 × uSGC−0.377 × (AR/AD)−0.319 | |
| 0.02 < uSGC (m/s) < 0.1 | |
| Square airlift with concentric tube; W = 0.167 m; AR/AD = 0.695 and 1.38. Gas distribution: Single nozzle. Air–water system. | |
| tH (s) = 53.15 × uSGC−0.377 × (AR/AD)−0.269 | |
| 0.02 < uSGC (m/s) < 0.1 | |
| Bando et al. [37] | Concentric tube airlift; DC(m)/DT(m) = 0.164/0.094; 0.300/0.164; 0.500/0.300. Gas distribution: perforated plate (dh = 3 mm). Air–water system. |
| tH (s) = C × uSGC−0.5 × DC1.4 × (HG+L/DC)1.2 × (DT/DC)−1.4 × (1 − DT/DC)−1.1 | |
| C = 2.2 for draft tube sparged ALR or C = 2.6 for annulus sparged ALR; 0.114 ≤ DC ≤ 0.50 m; 5 ≤ HG+L/DC ≤ 40; 0.4 ≤ DT/DC ≤ 0.8. | |
| Gavrilescu and Tudose [38] | Concentric draft tube ALR; DR = 0.1 ÷ 0.6 m. Dchar = DR. Gas distribution: Perforated plate sparger (100 × dh = 2 mm), multiring sparger (dh = 3.5 mm). Air–water system. |
| a) bubble and transition flow regime (uSGR < 0.08 m/s) | |
| tH (s) = 4.6 × R−0.47 × B−1.10 × T−0.64 × FrR −1.11 | |
| b) churn-turbulent regime (uSGR > 0.08 m/s) | |
| tH (s) = 4.6 × R−0.47 × B0.8T × FrR −1.11 | |
| Petrović et al. [39] | Concentric tube ALR; DC = 0.2 m, DT = 0.080, 0.1, and 0.15 m. Air–water system. |
| tH (s) = 53.5 × uSGC−0.31 × (HT/DC)0.12 × VR0.19 × VD0.50 × VS−0.26 | |
| uSGC (m/s) < 0.08 |
Table 4.
Overall volumetric mass transfer coefficient kLa—selected published correlations; adapted from [32,33,35,36,40,41,42,44,45].
| Source | Correlation |
|---|---|
| Juraščík et al. [32] | Concentric tube ALR. ALR1: V = 12 dm3, DC = 0.108 m, AD/AR = 1.23; ALR2: V = 40 dm3, DC = 0.157 m, AD/AR = 0.95; ALR3: V = 195 dm3, DC = 0.294 m, AD/AR = 1.01; Gas distribution: Perforated plate. Air–water system. |
| kLa (s−1) = 0.473εGT1.2; V = 12 dm3 | |
| kLa (s−1) = 0.524εGT1.2; V = 40 dm3 | |
| kLa (s−1) = 0.541εGT1.2; V = 195 dm3 | |
| kLa (s−1) = 0.401uSGR0.8 × (1 + AD/AR)−1; V = 12 dm3 | |
| kLa (s−1) = 0.428uSGR0.8 × (1 + AD/AR)−1; V = 40 dm3 | |
| kLa (s−1) = 0.506uSGR0.8 × (1 + AD/AR)−1; V = 195 dm3 | |
| uSGC ≤ 0.065 m/s | |
| Albijanić et al. [33] | Concentric- tube ALR with spherical bottom, DD = DC = 106 mm, DR = DT, DR/DC = 0.51; Dchar = DC. Gas distribution: Single orifice (dh = 4 mm). Air–liquid system; Liquids: Water, an aqueous solution of methanol, ethanol, n-propanol, isopropanol, and n-butanol (1 wt. %). |
| 0.0025 < uSGC (m/s) < 0.05 | |
| kLa (s−1) = 0.028 × uSGC0.77 × [1 + (−dσ/dcA)0.15]0.71 | |
| cA—alcohol concentration (wt %) (dσ/dcA)—surface tension gradient | |
| Sanchez Miron et al. [36] | Concentric draft tube ALR; DC = DD = 193 mm, DR = DT = 144 mm. Gas distribution: Cross-piece type sparger (13 holes, dh = 0.5 mm). Air–liquid system. Liquids: Tap water, seawater. uSGC (m/s) < 0.03 |
| kLa (s−1) = 0.641/(uSGC−0.935 − 1) for tap water | |
| kLa (s−1) = 0.865/(uSGC−0.964 − 1) for sea water | |
| Luo et al. [44] | Concentric tube ALR; DR = DC = 0.284 m, DD = DT = 0.07 m, CTB = 0.040 m. Annulus sparged ALR. Gas distribution: Two-orifice nozzle (dh = 2.6 mm), 4-orifice nozzle (1.84 mm), O-ring distributor (63 holes, dh = 1 mm). Air–water system. |
| kLa (s−1) = 0.2557uSGC0.8496; 2-orifice nozzle | |
| kLa (s−1) = 0.4661uSGC0.8496; 4-orifice nozzle | |
| kLa (s−1) = 0.2557uSGC0.8496; O-ring nozzle | |
| 0.0007 ≤ uSGC (m/s) ≤ 0.00281 | |
| Gouveia et al. [35] | Concentric-draft tube ALR, annulus-sparged ALR; AD/AR = 0.63. DC = 0.100 m; DD = DT = 0.080 m, Dchar = DRekv (riser equivalent diameter). Gas distribution: Ring with 35 holes (dh = 0.7 mm). Air–water system. |
| ShR = 7.16 × 10⁶ × FrR1.121 × B0.201 × T0.410 | |
| 0.0126 < uSGR (m/s) < 0.0440; 40 < kLa (h−1) < 250 | |
| Koide et al. [40] | Concentric draft tube ALR with flat bottom, DD = DC, DR = DT, Dchar = DC. Gas distributors: Single nozzle, perforated plate, porous glass plate Air–liquid system, liquid: Water, an aqueous solution of glycerol, glycol, BaCl2, NaSO4, Na2SO3. |
| 0.021 ≤ uSGC (m/s) ≤ 0.15; 0.1 ≤ DD ≤ 0.3 m; 0.06 ≤ DR ≤ 0.19 m | |
| ShC = 0.477⋅× εGT1.36 × Sc0.5 × GaC0.257 × BoC0.873 × (DT/DC)−0.542 | |
| 369 ≤ Sc ≤ 56,800; 1,360 ≤ BoC ≤ 12,200; 2.27⋅108 ≤ GaC ≤ 3.32⋅1011; 0.471 ≤ DT/DC ≤ 0.743; 0.037 ≤ εGT ≤ 0.21 | |
| Gavrilescu and Tudose [41] | Concentric-draught tube ALR. DR = 0.1 ÷ 0.6 m. Gas distribution: Perforated plate sparger (100 × dh = 2 mm), multiring sparger (dh = 3.5 mm). Air-water system. |
| ShR = 1.204⋅106 × FrR0.9 × GaR0.01 × T−0.18 × B−0.1 × Y−1.70 × R−0.18 | |
| 5⋅10−3 < FrR < 110⋅10−3, 9⋅106 < GaR < 3⋅109, 0.5 < B < 3.8, 0.333 < Y < 1.267, 1 < T < 3.8, 0.1 < R < 0.9, AD/AR ≥ 1, uSGR ≤ 0.11 m/s | |
| Cerri et al. [42] | Concentric tube airlift with flat bottom, DD = DC, DR = DT, Dchar = DR. DR/DC = 0.6; 1.68 ≤ AD/AR ≤ 1.84; V = 2, 5, and 10 dm3. Gas distribution: Cross-piece type sparger (dh = 0.5 mm) Air–liquid system. Liquids: Newtonian fluids (water, aqueous solutions of glycerol) and non-Newtonian fluids (aqueous solutions of xanthan gum). |
| ShR = 4.6 × 10⁻⁵ × FrR0.642 × Sc0.779 × GaR0.673 × BoR0.245 × εGT0.2 | |
| 4.921 < ShR < 256,768; 0.011 < FrR < 0.143; 297 < Sc < 27,544; 410 < BoR < 1.510; 1.4⋅107 < GaR < 1.8⋅1010; 0.009 < εGT < 0.170 | |
| Koide et al. [45] | Concentric draft tube ALR with conical bottom, DD = DC, DR = DT, Dchar = DC. Gas distributor: Perforated plate. Air–liquid system, liquid: Water, an aqueous solution of glycerol, glycol, BaCl2, NaSO4. |
| 0.021 ≤ uSGC (m/s) ≤ 0.15; 0.1 ≤ DD ≤ 0.3 m; 0.06 ≤ DR ≤ 0.19 m; | |
| ShC = 4.04⋅× εGT1.34 × Sc0.5 × GaC0.260 × BoC0.670⋅× (DT/DC)−0.047 × (1 + 2.00φS1.30)−1 | |
| 371 ≤ Sc ≤ 55,200; 2,660 ≤ BoC ≤ 12,200; 2.35⋅108 ≤ GaC ≤ 3.29⋅1011; 1.69⋅10−11 ≤ Mo ≤ 6.67⋅10−7; 0.471 ≤ DT/DC ≤ 0.743; 0.0379 ≤ εGT ≤ 0.224; 0 ≤ φS (v/v) ≤ 0.20 |
Table 5.
Concentric jet-loop airlift bioreactor: Geometrical characteristics.
| Parameter | Symbol | This Work |
|---|---|---|
| downcomer diameter | DD (mm) | 300 |
| riser diameter | DR (mm) | 66 |
| gas separator diameter | DS (mm) | 300 |
| riser height | HR (mm) | 720 |
| riser bottom clearance | CRB (mm) | 70 |
| riser upper clearance | CRU (mm) | 200 |
| deflector clearance | CD (mm) | 30, 70, 110, 150 |
| unaerated liquid height | HL (mm) | 960 |
| unaerated liquid volume | VL (m3) | 0.0625 |
Table 6.
Concentric jet-loop airlift bioreactor: Experimental conditions.
| Phase | Properties |
|---|---|
| Gas phase | air (T = 25 ± 2 °C); uSGR = 0.011; 0.023; 0.034; 0.045 m/s |
| Liquid phase | tap water (T = 25 ± 2 °C) |
| Solid phase | extruded PVC rods (Ø 4 mm × L = (2.5 ÷ 4) mm; ρ = 1 287 kg/m3); 1% v/v |
Table 7.
Total gas holdup εGT: Results of the hypothesis testing-effect of riser superficial velocity uSGR for deflector clearance = const.
Table 7.
Total gas holdup εGT: Results of the hypothesis testing-effect of riser superficial velocity uSGR for deflector clearance = const.
| Gas–Liquid System | Gas–Liquid–Solid System | |||
|---|---|---|---|---|
| Hypothesis Testing | Relation: εGT = BR·(uSGR)α αcalc (-) | Hypothesis 1: εGT = BH·(uSGR)0.8 t-Characteristics | Relation: εGT = BR·(uSGR)α αcalc (-) | Hypothesis 1: εGT = BH·(uSGR)0.8 t-Characteristics |
| = 0.75 | 0.621 | 9.7 (not acceptable) | 1.616 | 1.2 (acceptable) |
| = 0.55 | 0.567 | 4.1 (acceptable) | 1.085 | 2 (acceptable) |
| = 0.35 | 0.850 | 2.9 (acceptable) | 1.188 | 0.1 (acceptable) |
| = 0.15 | 1.032 | 4 (acceptable) | 0.861 | 3.5 (acceptable) |
| Overall data analysis | 0.802 | --- | 1.187 | --- |
1 Critical t-distribution t2,0.05 = 4.3027.
Table 8.
Total gas holdup εGT: Results of the hypothesis testing-effect of deflector clearance CD on superficial gas velocity uSGR = const.
Table 8.
Total gas holdup εGT: Results of the hypothesis testing-effect of deflector clearance CD on superficial gas velocity uSGR = const.
| Gas–Liquid System | Gas–Liquid–Solid System | |||
|---|---|---|---|---|
| Hypothesis Testing | Relation: εGT = BR·()β βcalc (-) | Hypothesis 1: εGT = BH·()0 t-Characteristics | Relation: εGT = BR·()β βcalc (-) | Hypothesis 1: εGT = BH·()0 t-Characteristics |
| uSGR = 0.011 m/s | 0.468 | 5.5 (not acceptable) | --- | --- |
| uSGR = 0.023 m/s | 0.246 | 8.2 (not acceptable) | −0.275 | 3.3 (acceptable) |
| uSGR = 0.034 m/s | 0.107 | 2.3 (acceptable) | −0.083 | 1.1 (acceptable) |
| uSGR = 0.045 m/s | 0.085 | 4.1 (acceptable) | −0.017 | 0.6 (acceptable) |
| Overall data analysis | 0.205 | --- | −0.125 | --- |
1 Critical t-distribution t2,0.05 = 4.3027.
Table 9.
Total gas holdup εGT: Evaluated parameters of correlation (4).
| System | C 1 ((m/s)-α) | α (-) | β (-) | R2 (-) | AAE (%) | ABE (%) |
|---|---|---|---|---|---|---|
| Gas–liquid | 0.098 ± 0.002 | 0.8 | 0.2 | 0.948 | 7.81 | −1 |
| Gas–liquid–solid | 0.351 ± 0.008 | 1.2 | −0.1 | 0.930 | 7.74 | −0.1 |
1εGT (-), uSGR (m/s), (-).
Table 10.
Homogenization time tH: Results of the hypothesis testing for effect of riser superficial velocity uSGR for deflector clearance = const.
Table 10.
Homogenization time tH: Results of the hypothesis testing for effect of riser superficial velocity uSGR for deflector clearance = const.
| Gas–Liquid System | Gas–Liquid–Solid System | |||
|---|---|---|---|---|
| Hypothesis Testing | Relation: tH = BR·(uSGR)α αcalc (-) | Hypothesis 1: tH = BH·(uSGR)0.8 t-Characteristics | Relation: tH = BR·(uSGR)α αcalc (-) | Hypothesis 1: tH = BH·(uSGR)0.8 t-Characteristics |
| = 0.75 | −0.595 | 1.4 (acceptable) | −0.306 | 16 (not acceptable) |
| = 0.55 | −0.589 | 0.5 (acceptable) | −0.303 | 0.1 (acceptable) |
| = 0.35 | −0.537 | 0.3 (acceptable) | −0.318 | 0.4 (acceptable) |
| = 0.15 | −0.579 | 0.9 (acceptable) | −0.296 | 0.04 (acceptable) |
| Overall data analysis | −0.575 | --- | −0.306 | --- |
1 Critical t-distribution t2,0.05 = 4.3027.
Table 11.
Homogenization time tH: Results of the hypothesis testing for effect of deflector clearance CD on superficial gas velocity uSGR = const.
Table 11.
Homogenization time tH: Results of the hypothesis testing for effect of deflector clearance CD on superficial gas velocity uSGR = const.
| Gas–Liquid System | Gas–Liquid–Solid System | |||
|---|---|---|---|---|
| Hypothesis Testing | Relation: tH = BR·()β βcalc (-) | Hypothesis 1: tH = BH·()0 t-Characteristics | Relation: tH = BR·()β βcalc (-) | Hypothesis 1: tH = BH·()0 t-Characteristics |
| uSGR = 0.011 m/s | −0.404 | 4.2 (acceptable) | --- | --- |
| uSGR = 0.023 m/s | −0.427 | 3 (acceptable) | −0.132 | 5.1 (not acceptable) |
| uSGR = 0.034 m/s | −0.382 | 2.2 (acceptable) | −0.160 | 7.9 (not acceptable) |
| uSGR = 0.045 m/s | −0.442 | 5.1 (not acceptable) | −0.132 | 6.6 (not acceptable) |
| Overall data analysis | −0.414 | --- | −0.141 | --- |
1 Critical t-distribution t2,0.05 = 4.3027.
Table 12.
Homogenization time tH: Evaluated parameters of correlation (6).
| System | C 1 (s⋅(m/s)-α) | α (-) | β (-) | R2 (-) | AAE (%) | ABE (%) |
|---|---|---|---|---|---|---|
| Gas–liquid | 3.640 ± 0.105 | −0.5 | −0.4 | 0.91 | 13 | 2.72 |
| Gas–liquid–solid | 8.746 ± 0.094 | −0.3 | −0.1 | 0.917 | 3 | 0.44 |
1tH (s), uSGR (m/s), (-).
Table 13.
Homogenization time tH: Evaluated parameters of correlation (7).
| System | C 1 (s) | α (s/m) | β (-) | R2 (-) | AAE (%) | ABE (%) |
|---|---|---|---|---|---|---|
| Gas–liquid | 99.3 ± 1.3 | −24 | 0.6 | 0.981 | 4.13 | 0.1 |
| Gas–liquid–solid | 41.8 ± 0.4 | −9 | 0.2 | 0.952 | 2.4 | 0.15 |
1tH (s), uSGR (m/s), (-).
Table 14.
Overall volumetric mass transfer coefficient kLa: Results of the hypothesis testing-effect of riser superficial velocity uSGR for deflector clearance = const.
Table 14.
Overall volumetric mass transfer coefficient kLa: Results of the hypothesis testing-effect of riser superficial velocity uSGR for deflector clearance = const.
| Gas–Liquid System | Gas–Liquid–Solid System | |||
|---|---|---|---|---|
| Hypothesis Testing | Relation: kLa = BR·(uSGR)α αcalc (-) | Hypothesis 1: kLa = BH·(uSGR)0.8 t-Characteristics | Relation: kLa = BR·(uSGR)α αcalc (-) | Hypothesis 1: kLa = BH·(uSGR)0.8 t-Characteristics |
| = 0.75 | 0.973 | 0.2 (acceptable) | 1.045 | 0.7 (acceptable) |
| = 0.55 | 1.069 | 0.4 (acceptable) | 1.027 | 0.1 (acceptable) |
| = 0.35 | 1.075 | 0.4 (acceptable) | 1.064 | 4.4 (not acceptable) |
| = 0.15 | 0.917 | 0.7 (acceptable) | 0.941 | 0.4 (acceptable) |
| Overall data analysis | 1.009 | --- | 1.019 | --- |
1 Critical t-distribution t2,0.05 = 4.3027.
Table 15.
Overall volumetric mass transfer coefficient kLa: Results of the hypothesis testing-effect of deflector clearance CD on superficial gas velocity uSGR = const.
Table 15.
Overall volumetric mass transfer coefficient kLa: Results of the hypothesis testing-effect of deflector clearance CD on superficial gas velocity uSGR = const.
| Gas–Liquid System | Gas–Liquid–Solid System | |||
|---|---|---|---|---|
| Hypothesis Testing | Relation: kLa = BR·()β βcalc (-) | Hypothesis 1: kLa = BH·()0 t-Characteristics | Relation: kLa = BR·()β βcalc (-) | Hypothesis 1: kLa = BH·()0 t-Characteristics |
| uSGR = 0.011 m/s | −0.108 | 6.3 (not acceptable) | --- | --- |
| uSGR = 0.023 m/s | −0.091 | 1.3 (acceptable) | −0.159 | 3.1 (acceptable) |
| uSGR = 0.034 m/s | −0.049 | 1 (acceptable) | −0.125 | 4 (acceptable) |
| uSGR = 0.045 m/s | −0.039 | 0.5 (acceptable) | −0.118 | 3.7 (acceptable) |
| Overall data analysis | −0.072 | --- | −0.134 | --- |
1 Critical t-distribution t2,0.05 = 4.3027.
Table 16.
Overall volumetric mass transfer coefficient kLa: Evaluated parameters of correlation (12).
Table 16.
Overall volumetric mass transfer coefficient kLa: Evaluated parameters of correlation (12).
| System | C 1 (h−1⋅(m/s)-α) | α (-) | β (-) | R2 (-) | AAE (%) | ABE (%) |
|---|---|---|---|---|---|---|
| Gas–liquid | 246 ± 8.3 | 1 | −0.1 | 0.923 | 11.2 | 4.7 |
| Gas–liquid–solid | 166.6 ± 2.4 | 1 | −0.1 | 0.974 | 4.14 | 1 |
1kLa (h−1), uSGR (m/s), (-).
Table 17.
Overall volumetric mass transfer coefficient kLa: Evaluated parameters of correlation (13).
Table 17.
Overall volumetric mass transfer coefficient kLa: Evaluated parameters of correlation (13).
| System | C 1 (h−1) | α (s/m) | β (-) | R2 (-) | AAE (%) | ABE (%) |
|---|---|---|---|---|---|---|
| Gas–liquid | 1.81 ± 0.03 | 42 | −0.1 | 0.979 | 4.5 | 0.4 |
| Gas–liquid–solid | 1.89 ± 0.02 | 31 | −0.1 | 0.984 | 3.2 | 0.6 |
1kLa (h−1), uSGR (m/s), (-).
Publisher’s Note: MDPI stays neutral with regard to jurisdictional claims in published maps and institutional affiliations. |
© 2021 by the authors. Licensee MDPI, Basel, Switzerland. This article is an open access article distributed under the terms and conditions of the Creative Commons Attribution (CC BY) license (https://creativecommons.org/licenses/by/4.0/).
Share and Cite
MDPI and ACS Style
Šulc, R.; Dymák, J. Hydrodynamics and Mass Transfer in a Concentric Internal Jet-Loop Airlift Bioreactor Equipped with a Deflector. Energies 2021, 14, 4329. https://0-doi-org.brum.beds.ac.uk/10.3390/en14144329
AMA Style
Šulc R, Dymák J. Hydrodynamics and Mass Transfer in a Concentric Internal Jet-Loop Airlift Bioreactor Equipped with a Deflector. Energies. 2021; 14(14):4329. https://0-doi-org.brum.beds.ac.uk/10.3390/en14144329
Chicago/Turabian StyleŠulc, Radek, and Jan Dymák. 2021. "Hydrodynamics and Mass Transfer in a Concentric Internal Jet-Loop Airlift Bioreactor Equipped with a Deflector" Energies 14, no. 14: 4329. https://0-doi-org.brum.beds.ac.uk/10.3390/en14144329
Note that from the first issue of 2016, this journal uses article numbers instead of page numbers. See further details here.