
Study on Adsorption Properties of Modified Corn Cob Activated Carbon for Mercury Ion

1
College of Engineering, Northeast Agriculture University, Harbin 150030, China
2
CAS Key Laboratory of Renewable Energy, Guangzhou Institute of Energy Conversion, Guangzhou 510640, China
3
Key Laboratory of Environmental and Applied Microbiology, Environmental Microbiology Key Laboratory of Sichuan Province, Chengdu Institute of Biology, Chinese Academy of Sciences, Chengdu 610041, China
4
College of Agricultural Engineering and Food Science, Shandong University of Technology, Zibo 255000, China
*
Author to whom correspondence should be addressed.
Energies 2021, 14(15), 4483; https://0-doi-org.brum.beds.ac.uk/10.3390/en14154483
Submission received: 22 June 2021
/
Revised: 16 July 2021
/
Accepted: 19 July 2021
/
Published: 24 July 2021
(This article belongs to the Special Issue Energy Systems and Applications in Agriculture)
Abstract
:In this study, corn cob was used as raw material and modified methods employing KOH and KMnO4 were used to prepare activated carbon with high adsorption capacity for mercury ions. Experiments on the effects of different influencing factors on the adsorption of mercury ions were undertaken. The results showed that when modified with KOH, the optimal adsorption time was 120 min, the optimum pH was 4; when modified with KMnO4, the optimal adsorption time was 60 min, the optimal pH was 3, and the optimal amount of adsorbent and the initial concentration were both 0.40 g/L and 100 mg/L under both modified conditions. The adsorption process conforms to the pseudo-second-order kinetic model and Langmuir model. Scanning electron microscopy and energy-dispersive X-ray spectroscopy (SEM-EDS), Fourier transform infrared spectroscopy (FTIR), X-ray photoelectron spectroscopy (XPS) and Zeta potential characterization results showed that the adsorption process is mainly physical adsorption, surface complexation and ion exchange.
1. Introduction
In recent years, with the development of industrialization and the discharge of various wastes, a large amount of mercury-containing wastewater has been discharged into soil, rivers, lakes, oceans and other water bodies, causing serious soil and water pollution [1,2,3,4]. However, because mercury is difficult to degrade in the environment and has high fluidity, it will flow into animals and plants through soil and water, and enter the human body through the food chain, seriously endangering human life and ecological safety [5]. The main symptom of mercury poisoning is damage to the nervous system and this can lead to death in severe cases. Therefore, mercury pollution has become a serious threat to human life and safety [6].
Corn is one of the most productive food crops in China, and its output is increasing year by year [7]. The corn cob is the part of corn after threshing treatment, which accounts for about 0.21 of the weight of the corn. The treatments of corn cob are mainly landfill, incineration and other methods [8]. These treatment methods not only fail to rationally use resources, they cause waste, and may also pollute the environment. Biomass had the advantages of high carbon content, easy activation and low degradation rate [9,10]. Activated carbon products prepared with biomass not only have the characteristics of high purity, high specific surface area, and good adsorption effect, but also realize the recycling of carbon and are green and environmentally friendly [11,12,13,14]. The gradual scarcity of non-renewable energy has made the use of low-cost and huge reserves of biomass resources as raw materials for the preparation of activated carbon gradually gain widespread popularity [15,16].
At present, the commonly used methods to remove mercury ions in wastewater include chemical precipitation, flocculation, ion exchange, and adsorption using activated carbon [17,18]. Activated carbon is a kind of porous material processed by a special process with carbon atoms as the main component [19,20]. Activated carbon has the characteristics of well-developed pores, large specific surface area, low price, strong adsorption capacity, extensive raw material sources, safety and environmental protection, not reacting easily with acids or alkalis, insoluble in water and organic solvents, renewable and recyclable [21]. However, due to limited resources for preparing activated carbon, leading to high cost, this limits the large-scale application of activated carbon. Therefore, it is necessary to find suitable and low-cost raw materials for the preparation of activated carbon. Sajjadi et al. used pistachio wood waste to prepare activated carbon, using ammonium nitrate as a new activator. The mercury ion adsorption effect was significantly higher than commercial activated carbon, and the preparation cost was lower [22]; Hsu et al. found that copper/sulfur co-impregnated activated carbon exhibited greater Hg(II) adsorption than both raw activated carbon and sulfur-impregnated activated carbon at an initial Hg(II) concentration of higher than 8000 ng/L [23]. Yagmur et al. used oleaster fruit as a substrate and KOH and ZnCl2 to prepare activated carbon, and found that the two play key roles in producing activated carbon with fairly different properties [24].
Using corn cob as raw material, the effects of activation temperature, activation time, the KOH to carbon ratio on a specific surface area and mercury ion adsorption capacity of activated carbon were explored by single factor experiment and orthogonal experiment, and the best preparation process was selected. The mercury ion adsorption performance of the prepared activated carbon under different factors such as initial concentration of mercury ions, amount of adsorbent added, pH, adsorption time, and interference of metal ions were investigated using a variety of characterization methods such as scanning electron microscopy and energy-dispersive X-ray spectroscopy (SEM-EDS), BET, Fourier transform infrared spectroscopy (FTIR), X-ray photoelectron spectroscopy (XPS), Zeta potential, etc., The analysis of the characterization results of activated carbon before and after raw material modification and mercury ion adsorption was carried out.
2. Materials and Methods
2.1. Materials and Reagents
Corn cobs were collected from the experimental base of Xiangyang farm of Northeast Agricultural University. The corn cobs were crushed to 80 mesh, washed with deionized water and anhydrous ethanol, dried to constant weight at 105 °C, and sterilized for use. Potassium hydroxide, 1000 mg/L mercury ion standard solution, cadmium nitrate, lead nitrate, copper nitrate, nickel nitrate, zinc nitrate were purchased from Shanghai Macklin Biochemical Co., Ltd. (Shanghai, China). Potassium permanganate was purchased from Guangzhou Chemical Reagent Factory. Hydrochloric acid was purchased from Shenzhen Chemical Reagent Technology Co., Ltd. (Shenzhen, China). Sodium hydroxide was purchased from Shanghai Acmec Biochemical Technology Co., Ltd. (Shanghai, China).
2.2. Preparation of Activated Carbon
2.2.1. Single Factor Experimental Design
The dried biomass materials were heated with nitrogen in a tubular furnace. The heating rate was 10 °C/min, and the carbonization temperature was 500 °C for 1 h. After the biochar was cooled to room temperature, it was then taken out, cleaned with ultrapure water, and dried in 105 °C oven to constant weight to obtain corn cob carbon (CCC). Under the conditions of different activation time, activation temperature and alkali–carbon ratio, KOH and CCC were evenly mixed according to the set mass and heated with nitrogen in a tubular furnace. Firstly, KOH was heated to 400 °C at 10 °C/min for 30 min, and then heated for a period of time at the same heating rate to the experimental set temperature. After the activation experiment, the activated carbon was reduced to room temperature. In order to remove the KOH and other impurities that were not completely reacted and washing with ultrapure water, 1 mol/L hydrochloric acid and absolute ethanol to neutral. KOH modified corn cob activated carbon (CCAC) was prepared by putting the sample into a 105 °C oven until constant weight.
2.2.2. Orthogonal Experimental Design
The orthogonal experiment was designed by orthogonal test table L9(33). Taking the mercury ion adsorption capacity and specific surface area of activated carbon as analysis indexes, the range method and variance method were used to analyze the primary and secondary relationship of different influencing factors so as to determine the best experimental combination KOH modified corn cob activated carbon preparation methods (CCAC).
2.3. Experiment on KMnO4 Modified Activated Carbon
A certain amount of CCAC was mixed with different concentrations of KMnO4 solution (0.02–0.18 mol/L). After soaking at room temperature for 12 h, it was dried in a 105 °C oven. The it was washed with ultrapure water (the pH of the washing liquid is neutral), and placed it in a drying box to constant weight. Finally, the KMnO4 modified corn cob activated carbon (CKAC) was optimized by a mercury ion adsorption experiment.
2.4. Characterization of Activated Carbon
SEM and EDS are often used to analyze the micro morphology of various samples and to analyze the elements qualitatively and quantitatively. In this experiment, the conductive adhesive was glued on the sample table, a small amount of samples was smeared on the conductive adhesive, and the gold spraying treatment was carried out. Then the surface characteristics and different elemental compositions of activated carbon were explored by SEM (SEM SU-70) and EDS. The BET parameters of activated carbon were measured and analyzed by specific surface area and a porosity analyzer (ASAP 2460). Before the experiment, the samples were degassed at 200 °C for 12 h, and the nitrogen adsorption/desorption isotherm was measured. The BET method was used to calculate the parameters of specific surface area, pore volume and pore size. FTIR was used to analyze the chemical composition of organic or inorganic samples qualitatively, as well as the characteristic vibration frequencies of functional groups or chemical bonds. Before the experiment, the completely dried activated carbon sample was mixed with KBr at a certain mass ratio and pressed into thin sheets under a certain pressure. This experiment used Nicolet iS50 to determine the groups contained in the sample. XPS was used to clarify the element composition and molecular structure of the material. The sample preparation process of this experiment was as follows: cut the double-sided tape into small pieces, paste the sample on one side, and paste the aluminum foil on the other side. After the samples were compressed into tablets, ESCALAB 250Xi was finally used for testing. The measurement conditions were Al Kα rays, the scanning range was 1300~0 eV, and the carbon C 1s peak (284.60 eV) was used for correction. The 40 mL ultrapure water was put into a 150 mL beaker, and 10 mg of well ground sample was added. Then, the pH of the sample was adjusted to 2–6 with 0.10 mol/L HCl and 0.10 mol/L NaOH, respectively. The Zeta potential of the sample was measured by a nano ZS Mastersizer 2000E.
2.5. Mercury Ion Adsorption Experiment
(1) Effect of adsorption time on mercury ion adsorption
We put 50 mL of 100 mg/L mercury ion solution into 10 different conical flasks, then added 0.40 g/L activated carbon, respectively. The adsorption experiment was carried out in a constant temperature oscillation water bath. The experiment temperature was 30 °C and the oscillation rate was 150 r/min. The adsorption time was set to 15–1440 min. After adsorption, solid–liquid separation was carried out, and the liquid phase was collected to test the concentration of mercury ion to determine the best adsorption time.
(2) Effect of adsorbent dosage on mercury ion adsorption
We took 50 mL solution with initial concentration of mercury ion of 100 mg/L into five different 100 mL conical flasks, then added 0.20–1.00 g/L activated carbon respectively. The adsorption experiment was carried out in a constant temperature oscillation water bath. The experiment temperature was 30 °C and the oscillation rate was 150 r/min. After adsorption, solid–liquid separation was carried out, and the liquid phase was collected to test the concentration of mercury ion to determine the dosage of adsorbent.
(3) Effect of initial concentration on mercury ion adsorption
We took 50 mL solution with initial concentration of mercury ion of 40, 60, 80, 100, 120 mg/L into five different 100 mL conical flasks, then added 0.40 g/L activated carbon, respectively. The adsorption experiment was carried out in a constant temperature oscillation water bath. The experimental temperature was 30 °C and the oscillation rate was 150 r/min. After adsorption, the solid-liquid separation was carried out, and the liquid phase was collected to test the concentration of mercury ion to determine the optimal initial concentration of mercury ion.
(4) Effect of pH on mercury ion adsorption
We put 50 mL of 100 mg/L mercury ion solution into five different conical flasks, and then added 0.40 g/L activated carbon. The experiment was carried out in a constant temperature oscillating water bath. The experimental temperature was 30 °C, and the oscillation rate was 150 r/min. We used 0.10 mol/L hydrochloric acid and 0.10 mol/L NaOH to adjust the pH to 2, 3, 4, 5 and 6, respectively. After adsorption, the solid-liquid separation was carried out, and the liquid phase was collected to test the mercury ion concentration to determine the optimal pH value.
(5) Effect of interfering ions on mercury adsorption
In order to study the interference of single cation on mercury ion adsorption, 5 mL of Cd2+, Pb2+, Cu2+, Zn2+, Ni2+ with initial concentration of 1.00 g/L were added into five different 50 mL volumetric flasks respectively, and then 5 mL of mercury ion solution with initial concentration of 1.00 g/L was added respectively. The solution after constant volume was added into five different conical flasks, and then 0.40 g/L activated biochar was added respectively. The solution was placed in a constant temperature oscillation water bath for adsorption experiment. The temperature was 30 °C, and the oscillation rate was 150 r/min. After adsorption, the solid–liquid separation was carried out, and the liquid phase was collected to test the concentration of metal cations.
In order to simulate the actual wastewater situation better, the interference of various cations on mercury ion adsorption was explored. We added 5 mL Hg2+, Cd2+, Pb2+, Cu2+, Zn2+, Ni2+ with initial concentration of 1.00 g/L to a 50 mL constant volume bottle for constant volume. We added the constant volume solution to a 100 mL conical flask, and added 0.40 g/L activated biochar. Then we put the solution in a constant temperature oscillating water bath for adsorption experiment. The temperature was 30 °C, and the oscillation rate was 150 r/min. After adsorption, the solid–liquid separation was carried out, and the liquid phase was collected to test the concentration of metal cations.
The adsorption capacity and removal rate of mercury ion were calculated by the following formulas, respectively [25].
- qe—adsorption capacity of activated carbon for metal ions, mg/g
- R—removal rate of metal ions by biochar, %
- C0—initial concentration of metal ions, mg/L
- Ce—residual concentration of metal ions, mg/L
- V—volume of solution, L
- m—mass of activated carbon, g
2.6. Adsorption Kinetics
The study of adsorption kinetics was based on the measurement and description of adsorption rate and adsorption process, and then qualitative analysis of adsorption type, quantitative calculation of adsorption equilibrium time, etc., and finally we explored the adsorption mechanism of adsorbent for pollutants. We took 50 mL of a solution with an initial concentration of 100 mg/L of mercury ions, set the time range of the adsorption experiment to 15–360 min, and added 0.02 g of activated carbon to different experimental groups. The experiment temperature was set to 30 °C. After experiment was completed, the sample was taken out to filter the solid, the concentration of mercury ions in the liquid was measured, and qe and qt were calculated to complete the fitting of the adsorption kinetic equation. In this experiment, the pseudo-first- and –second-order kinetic models, Elovich model and intra particle diffusion model were used.
(1) Pseudo-first-order kinetic model
The pseudo-first-order kinetics is understood as that the mass transfer resistance in the particle had a great influence on the adsorption process at the beginning of the adsorption reaction, which was dominated by the monolayer adsorption by boundary diffusion. The equation can be expressed as [26]:
- qt—the adsorption capacity of activated carbon to mercury ions at t, mg/g
- k1—the reaction rate constant of the pseudo-first-order kinetics, 1/min
(2) Pseudo-second-order adsorption kinetic model
The pseudo-second-order adsorption kinetic model assumed that there is a chemical reaction between the adsorbent and the adsorbate, and the adsorption rate is related to the chemical adsorption, which might include the gain, loss or sharing of electrons. The equation can be expressed as [27]:
- k2—the reaction rate constant of the pseudo-second-order kinetics, g/(mg·min)
(3) Elovich model
The Elovich model generally describes the adsorption behavior of heterogeneous solid surface, and the rate of the adsorption process will decrease exponentially with the increase of adsorbent adsorption capacity. The equation can be expressed as:
- α/β—parameters of Elovich model
(4) Intra-particle diffusion model
There are three assumptions in the intra-particle diffusion model, that the liquid film diffusion resistance can be ignored or only affected in a very short time; the diffusion direction of adsorbate is random and the concentration does not change with the position of the particles; the internal diffusion coefficient is constant and does not change with time and position. The equation is as follows [26]:
- kid—Intra particle diffusion rate constant, (mg/(g·min−1/2))
- C—Constants related to the thickness of the boundary layer
2.7. Adsorption Isotherm
The adsorption characteristics of activated carbon for heavy metal ions could be expressed through adsorption isotherms, which played an important role in exploring adsorption mechanisms and practical applications. This experiment used the Langmuir isotherm model and Freundlich isotherm model to explore the adsorption mechanism. We prepared 50 mL mercury ion solutions with different concentrations (20, 40, 60, 80, 100, 120 mg/L) and placed them in 100 mL conical flasks. The addition of activated carbon was 0.40 g/L, the adsorption time was 24 h, the temperature was 30 °C, and the oscillation rate was 150 r/min. After the experiment, we took out the sample, filtered the solid, measured the concentration of mercury ion in the liquid, and calculated the value of qe.
(1) Langmuir adsorption isotherm model
The derivation and establishment of the Langmuir adsorption isotherm model are based on the following four assumptions: adsorption is a single molecular layer, and no other molecular cover exists; the possibility of adsorption sites being used is the same; the surface of the adsorbent is the same; the possibility of molecules attached to a certain location is not related to whether the adjacent space has been occupied by other molecules. The equation can be expressed as [28]:
- qm—the maximum theoretical adsorption amount of mercury ions adsorbed by activated carbon, mg/g
- KL—Langmuir isotherm adsorption rate constant, L/mg
(2) Freundlich adsorption isotherm model
The Freundlich adsorption isotherm equation is derived from the Langmuir adsorption isotherm equation, which is an empirical equation. It is assumed that the adsorption sites on the adsorbent surface are unevenly distributed and have different energies, and the adsorption process is mainly multi-layer adsorption, which is mainly suitable for physical adsorption. The equation can be expressed as follows [29]:
- KF—Freundlich isotherm adsorption equation constant
- nF—Freundlich adsorption intensity
3. Results and Discussion
3.1. Single Factor Experiment
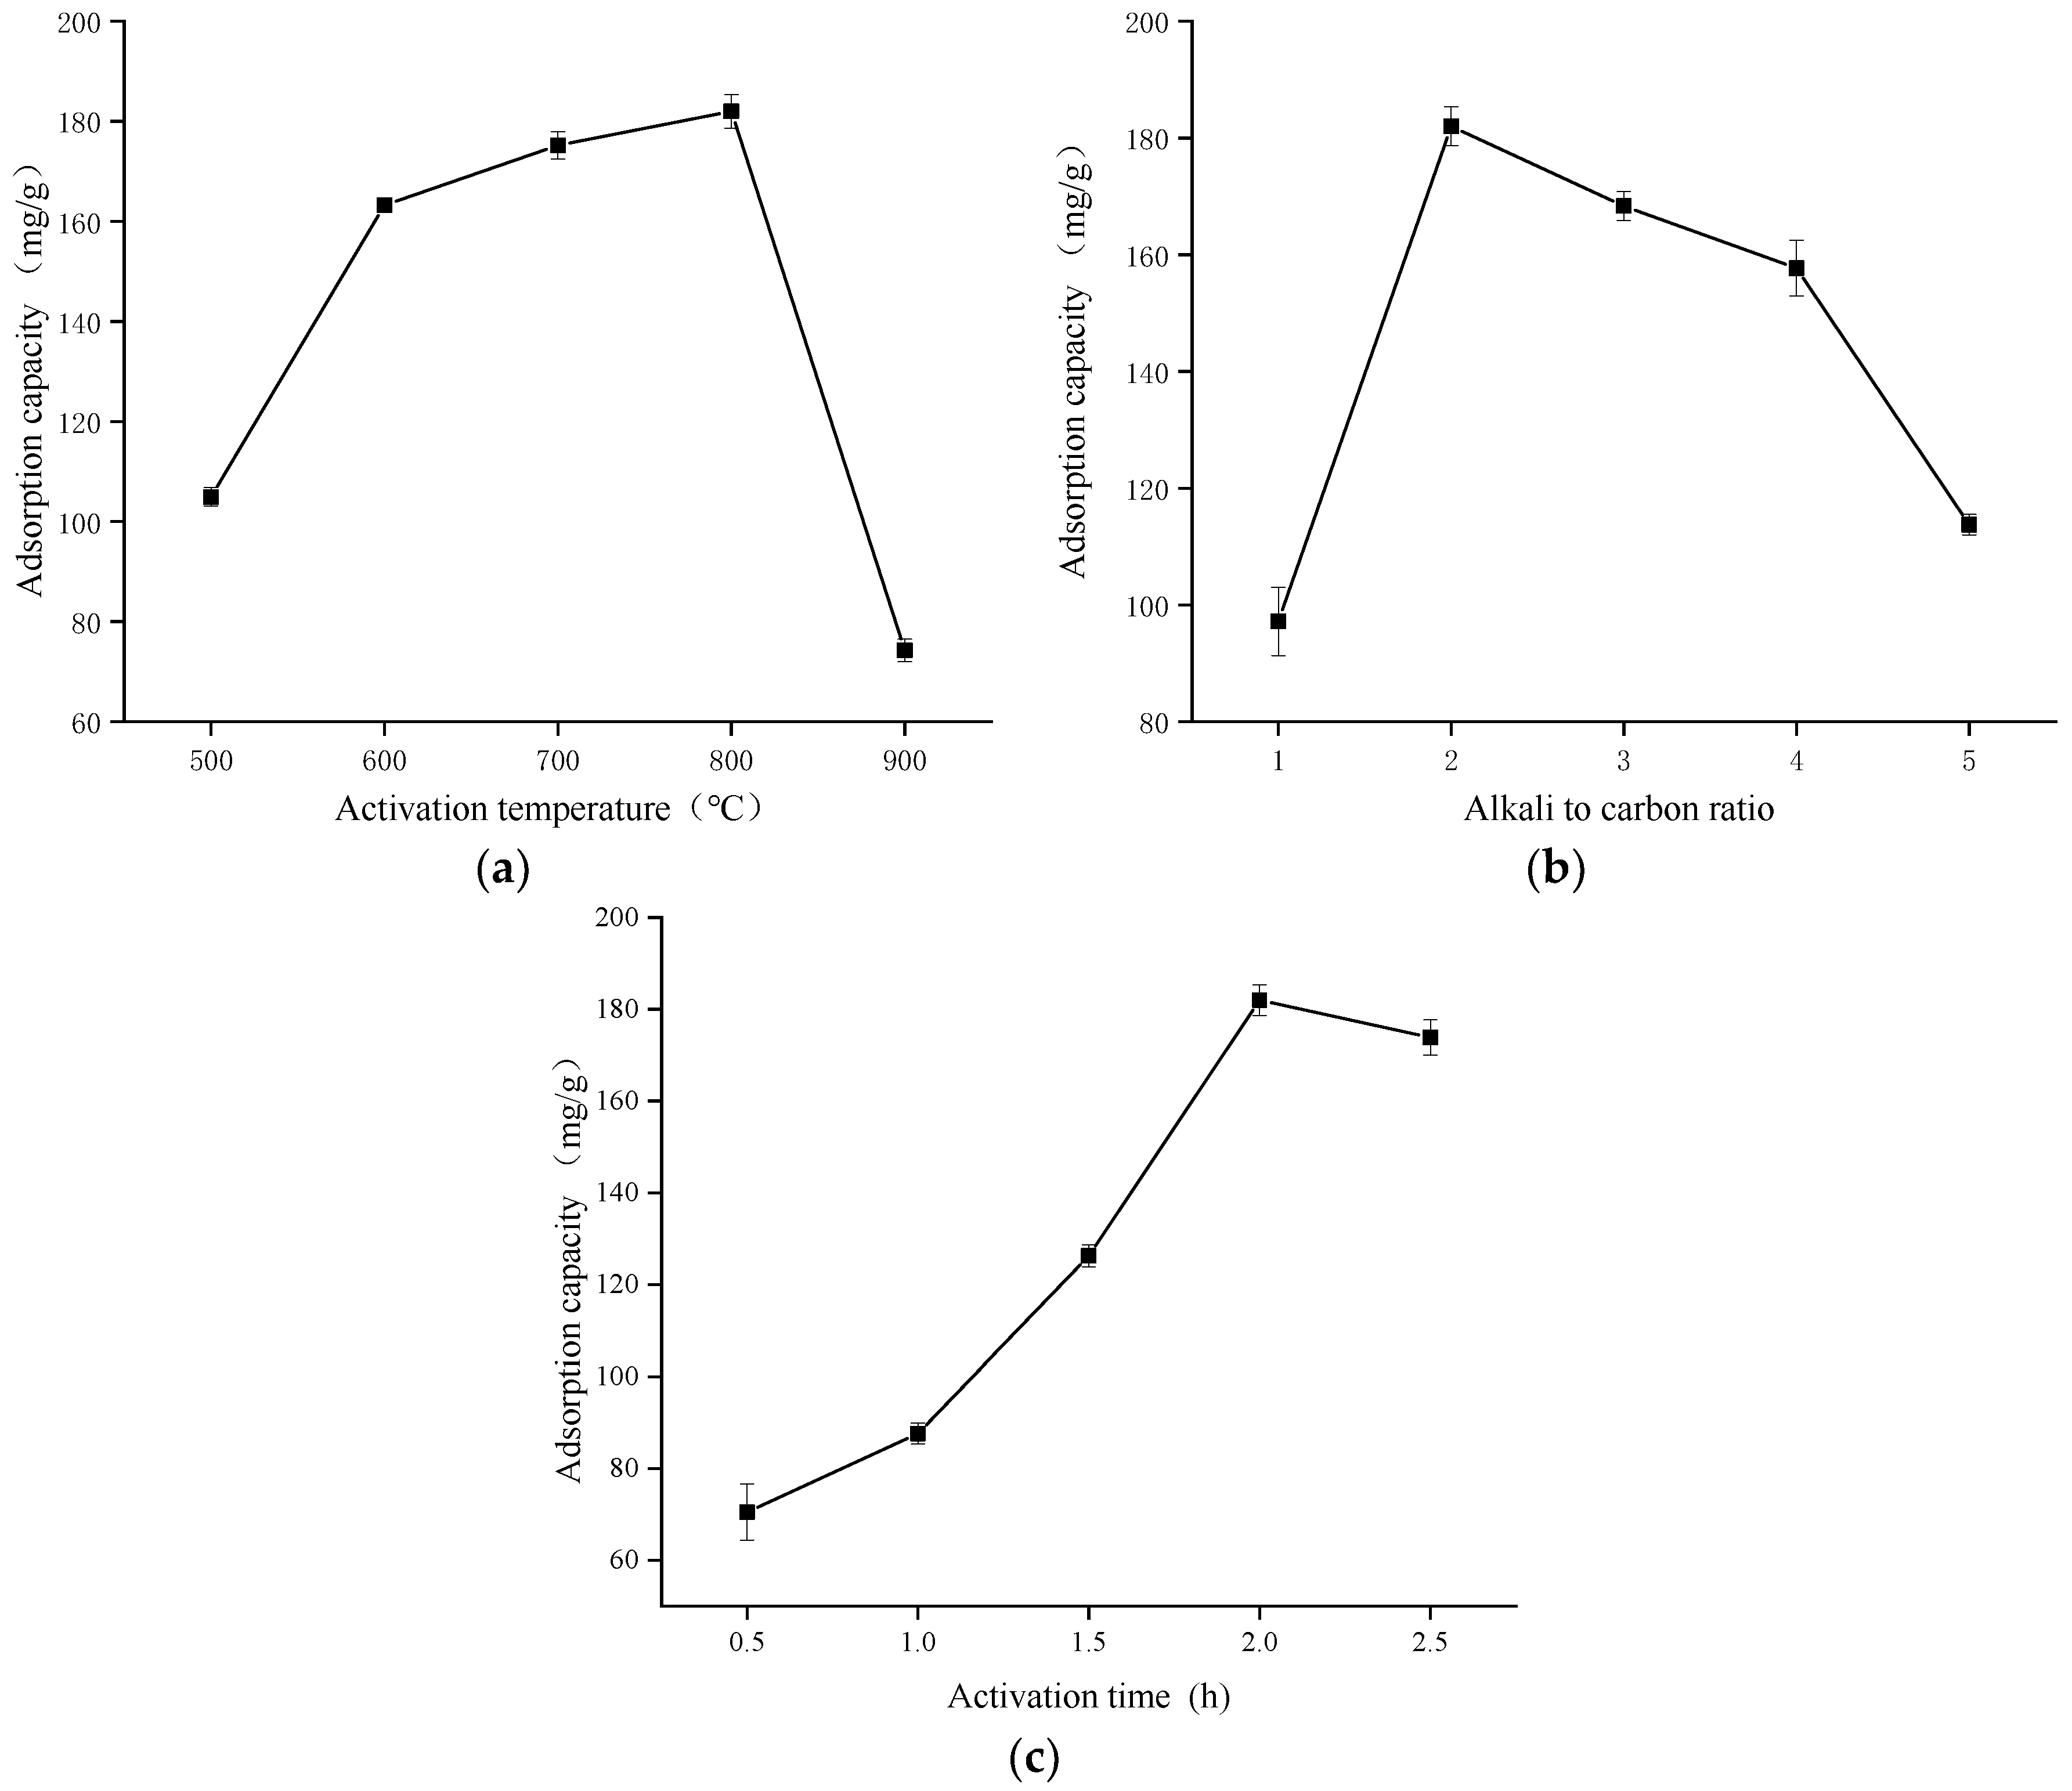
3.1.1. Effect of Activation Temperature
Figure 1a shows the effect of activation temperature on the adsorption of mercury ions by corn cob activated carbon. It can be seen from the figure that with the increase of activation temperature, the adsorption capacity of corn cob activated carbon gradually increased. When the activation temperature was 800 °C, the adsorption capacity of mercury ions reached 180.02 mg/g. This was because in the process of heating, the carbon materials gradually decomposed and the reaction rate increased. The corrosion and pore-forming ability of KOH on the activated carbon was enhanced, which promoted the development of the pore structure, produced a large number of micropores and mesopores, and gradually increased the adsorption capacity.
When the activation temperature exceeds 800 °C, the pore structure of the activated carbon will be destroyed and the specific surface area of the activated carbon will be reduced, resulting in the decrease of mercury ion adsorption [30].
3.1.2. Effect of Alkali–Carbon Ratio
It can be seen from Figure 1b that when the KOH carbon ratio of corn cob activated carbon was less than 2:1, the mercury ion adsorption capacity increases continuously. This is because with the increase of KOH ratio, the pore structure and adsorption sites of activated carbon increased continuously, and the specific surface area increased continuously, which promoted the adsorption process. When the KOH to carbon ratio is 2:1, it reached the optimal alkali to carbon ratio, and the adsorption capacity of mercury ion was 180.02 mg/g. When the KOH carbon ratio was higher than the optimal ratio, the adsorption capacity of mercury ions will be significantly reduced. The reason was that the excess activator will destroy the pore structure which has been formed, and have a negative impact on the adsorption process, resulting in the reduction of mercury ion adsorption.
3.1.3. Effect of Activation Time
It can be seen from Figure 1c that with the increase of activation time, the adsorption capacity of corn cob activated carbon and mercury ion first increased and then decreased. When the activation time of CCAC was 2 h, the adsorption capacity of mercury ions reached the maximum value of 182.02 mg/g. This was because with the increase of activation time, KOH gradually eroded the carbon skeleton of raw materials, and more oxygen-containing functional groups and new pore structures were formed in the activated carbon, which further improved the activation degree and increased the adsorption capacity. When the activation time exceeded the optimal activation time, the activated carbon was eroded excessively, and the number of pore structures destroyed was greater than the number of newly formed pores, resulting in the decrease of adsorption capacity.
3.2. Orthogonal Experiment
The orthogonal experiment of KOH modified corn cob activated carbon was used to clarify the changes of mercury ion adsorption capacity, specific surface area of activated carbon under the influence of different activation time, activation temperature and alkali carbon ratio. The results of the orthogonal experiment and extreme value analysis are shown in Table 1 and Table 2.
According to the range analysis results of the mercury ion adsorption capacity, the order of influence degree from large to small was activation temperature, KOH carbon ratio and activation time, which was B > C > A. According to the comparison of K values, the best preparation conditions were as follows: activation time was 2 h, activation temperature was 800 °C, KOH carbon ratio was 2.5:1, which was B2C3A3. According to the range analysis results of specific surface area of activated carbon, the order of influence degree from large to small was KOH carbon ratio, activation time and activation temperature, which was C > A > B. According to the size of K value, the best preparation conditions were as follows: activation time was 2 h, activation temperature was 800 °C, KOH carbon ratio was 2.5:1, which was C3A3B2, and the best preparation conditions were the same. Since there was no such combination in the orthogonal experiment, the mercury ion adsorption capacity and specific surface area of the combination were 184.76 mg/g and 2797.75 m2/g, respectively, which were higher than those of the orthogonal experiment group. The results showed that the scheme was the best preparation scheme, and the activated carbon prepared by this process was named CCAC.
3.3. Adsorption Experiment of Activated Carbon Modified by KMnO4
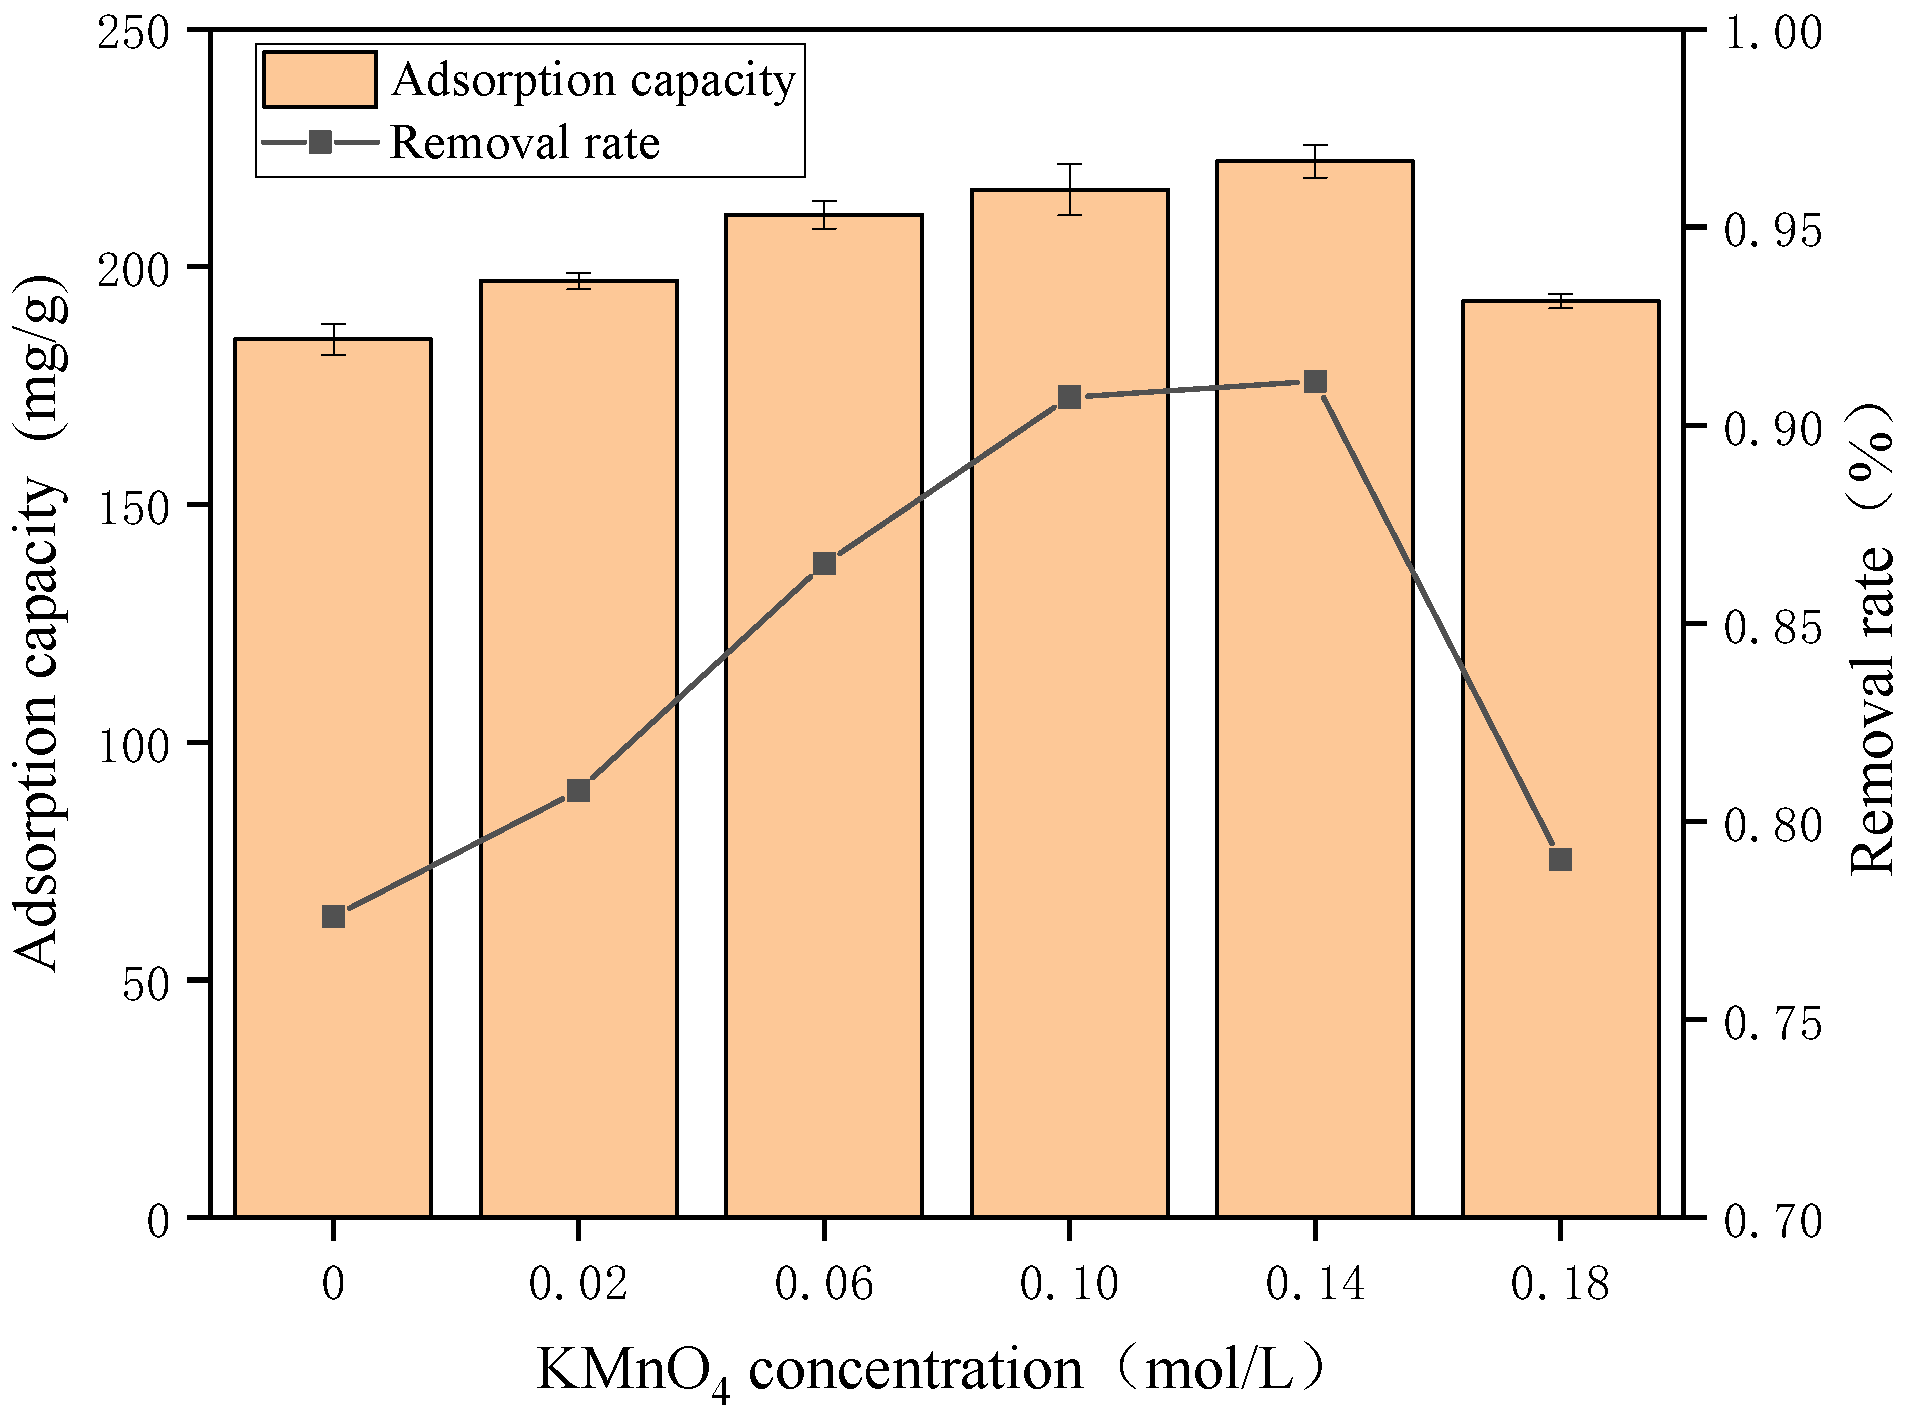
It can be seen from Figure 2 that the adsorption capacity of activated carbon modified by KOH and KMnO4 was higher than that of CCAC. This was because KMnO4 increased the number of oxygen-containing functional groups on the surface of activated carbon, and mercury ion reacted with oxygen-containing functional groups. The optimal KMnO4 concentration of CKAC was 0.14 mol/L, the maximum adsorption capacity was 222.22 mg/g, and the removal rate of mercury ion was 88.89%, which was 14.99% higher than that of activated carbon without KMnO4 modification. When the concentration of KMnO4 was higher than the optimal concentration, the adsorption capacity decreased. This may be because of the strong oxidation of KMnO4 made some original adsorption sites disappear. It may also be because excessive KMnO4 covered the original adsorption sites, resulting in the reduction of the adsorption capacity of mercury ions.
3.4. Adsorption Experiments
3.4.1. The Effect of Adsorption Time
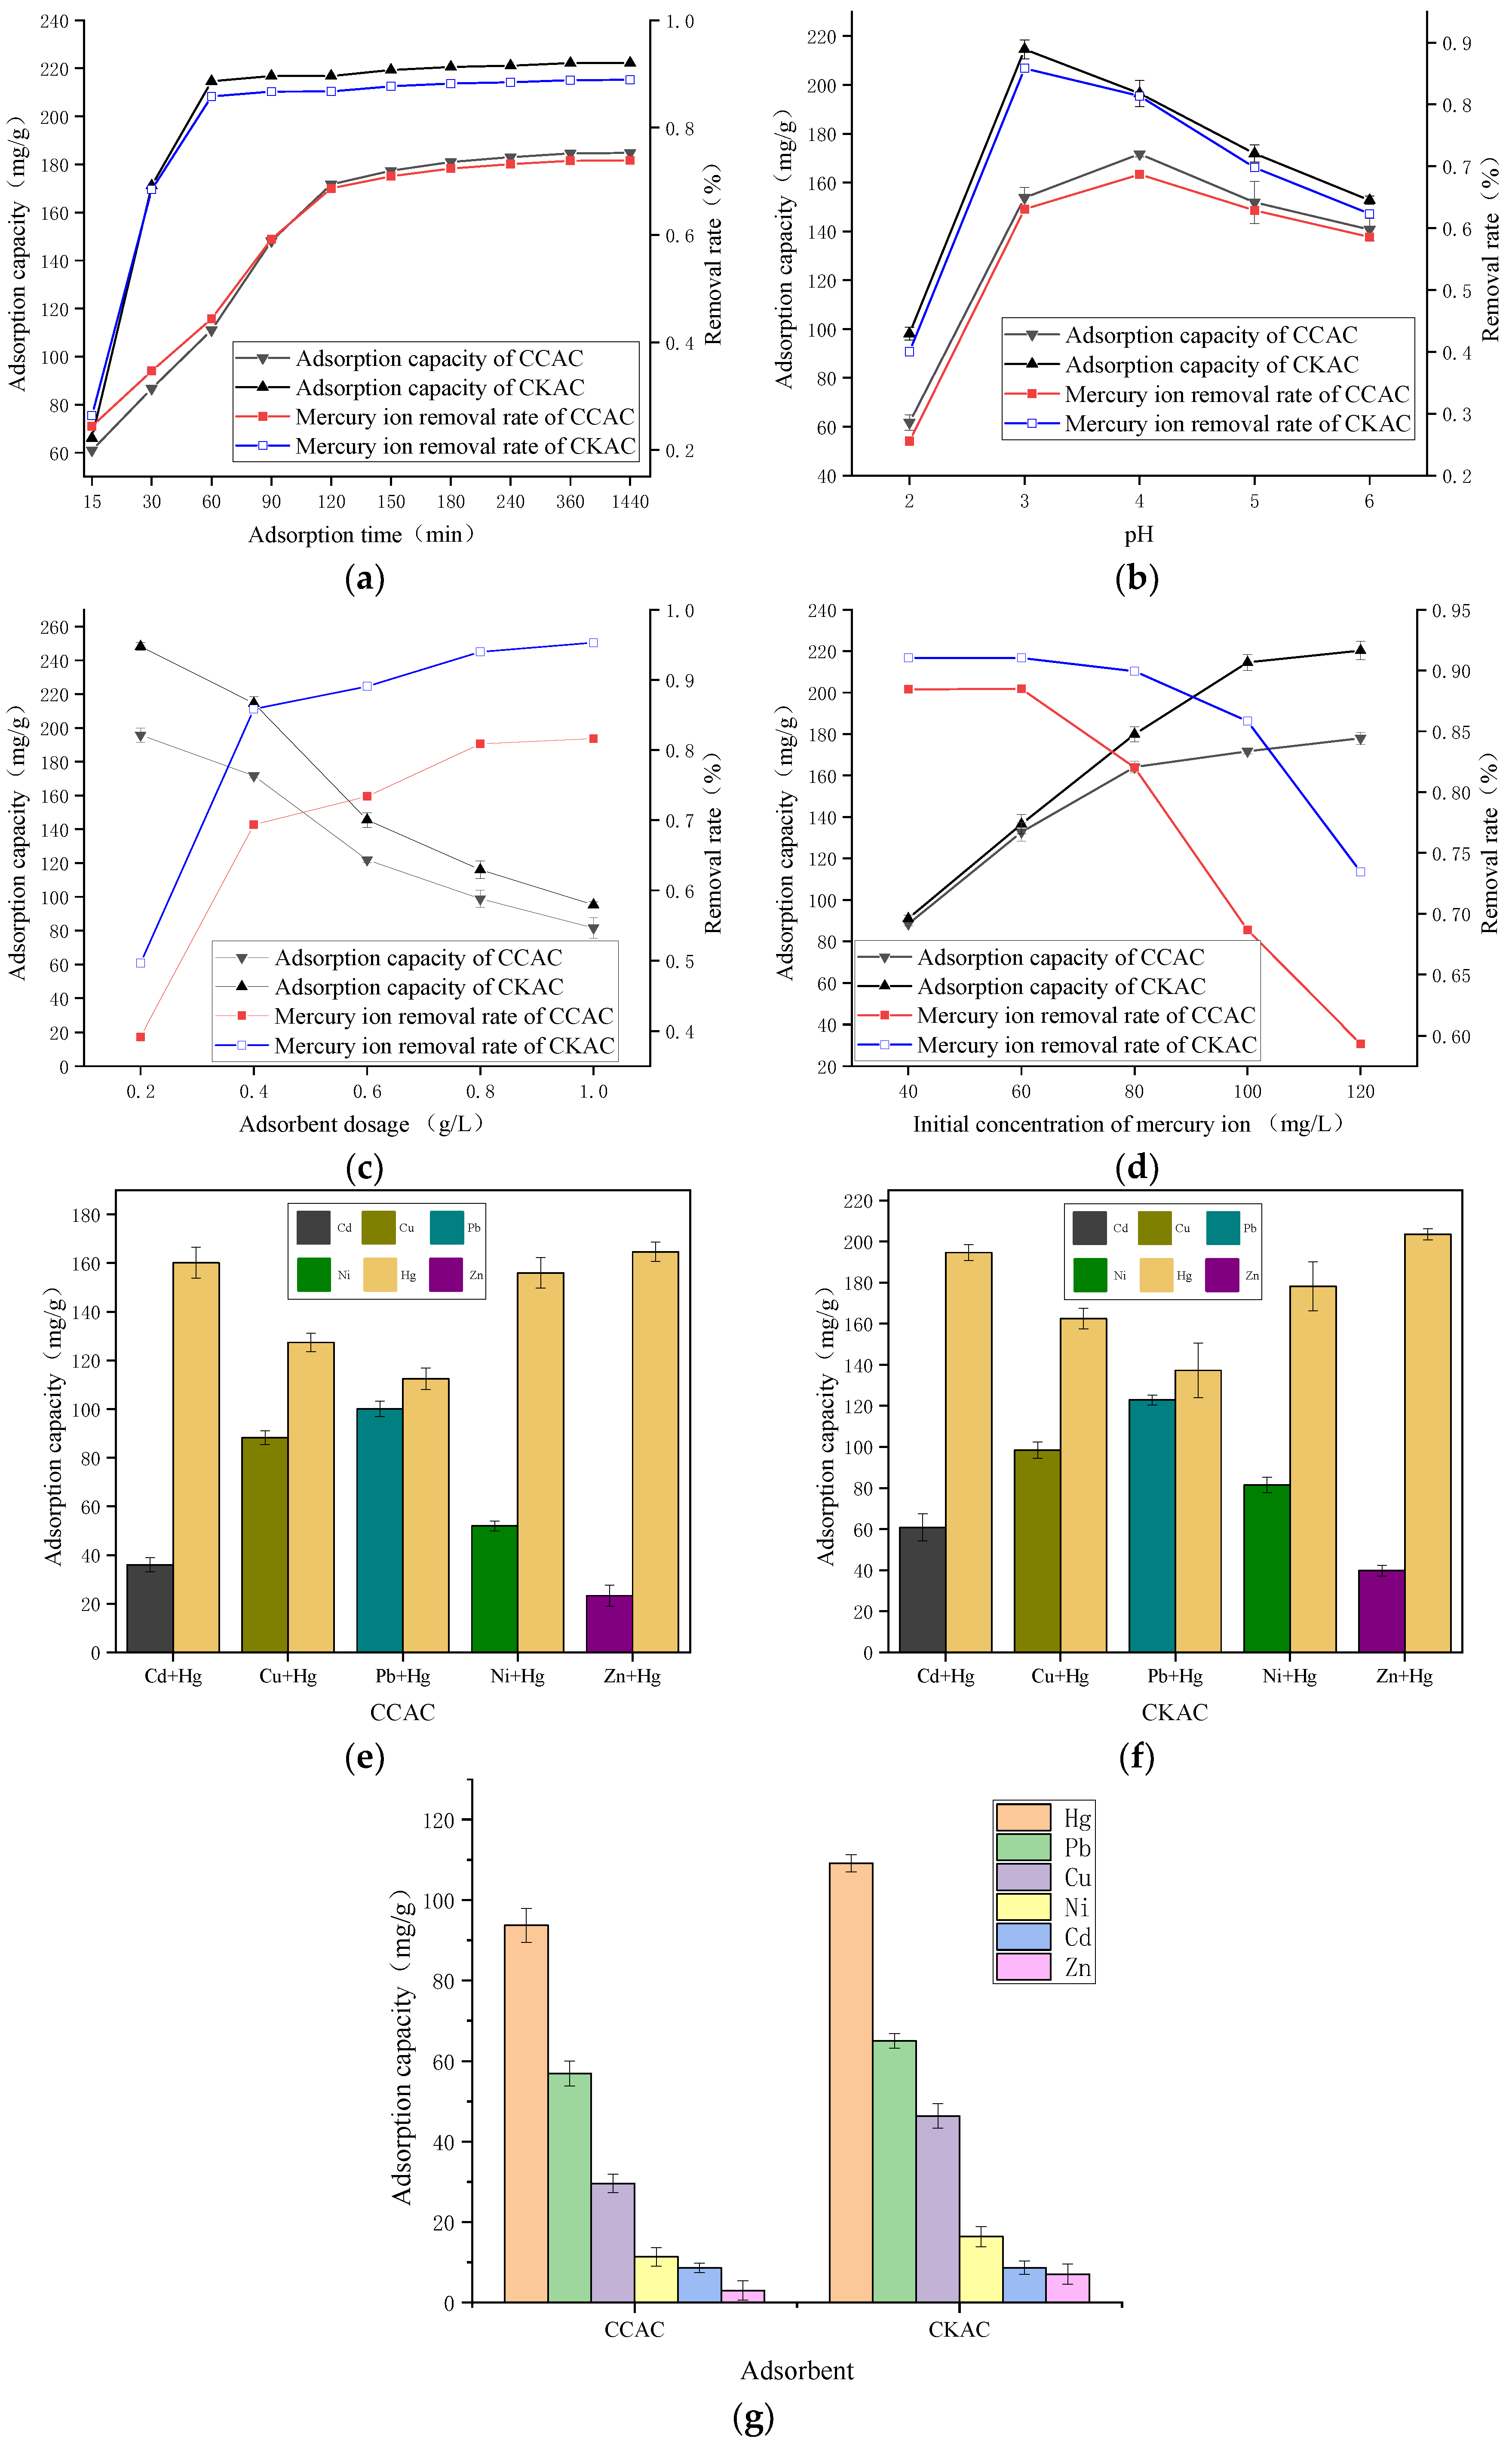
It can be seen from Figure 3a that the initial stage of adsorption (0–120 min) was the rapid adsorption stage, and the adsorption capacity and removal rate of activated carbon for mercury ions increased rapidly. At this time, the mass transfer effect in the solution was the largest, and the adsorption rate of mercury ions was also faster. When the adsorption reaction reached 120–1440 min, the adsorption rate decreased, and finally reached the dynamic adsorption equilibrium. At equilibrium, the maximum adsorption capacity of CCAC, CKAC reached 184.76 mg/g, 222.22 mg/g, respectively, and the maximum removal rates were 73.91%, 88.89%, respectively. It can be seen that the two activated carbon had strong adsorption capacity, and the adsorption capacity of CKAC was higher than that of CCAC. At this stage, the adsorption sites on the surface of biochar were occupied by mercury ions, and the repulsion between adsorbates hindered the adsorption process. According to the experimental data, in order to take into account the adsorption rate and economic benefits, the adsorption times of CCAC, CKAC were 120 min and 60 min, respectively.
3.4.2. The Effect of pH
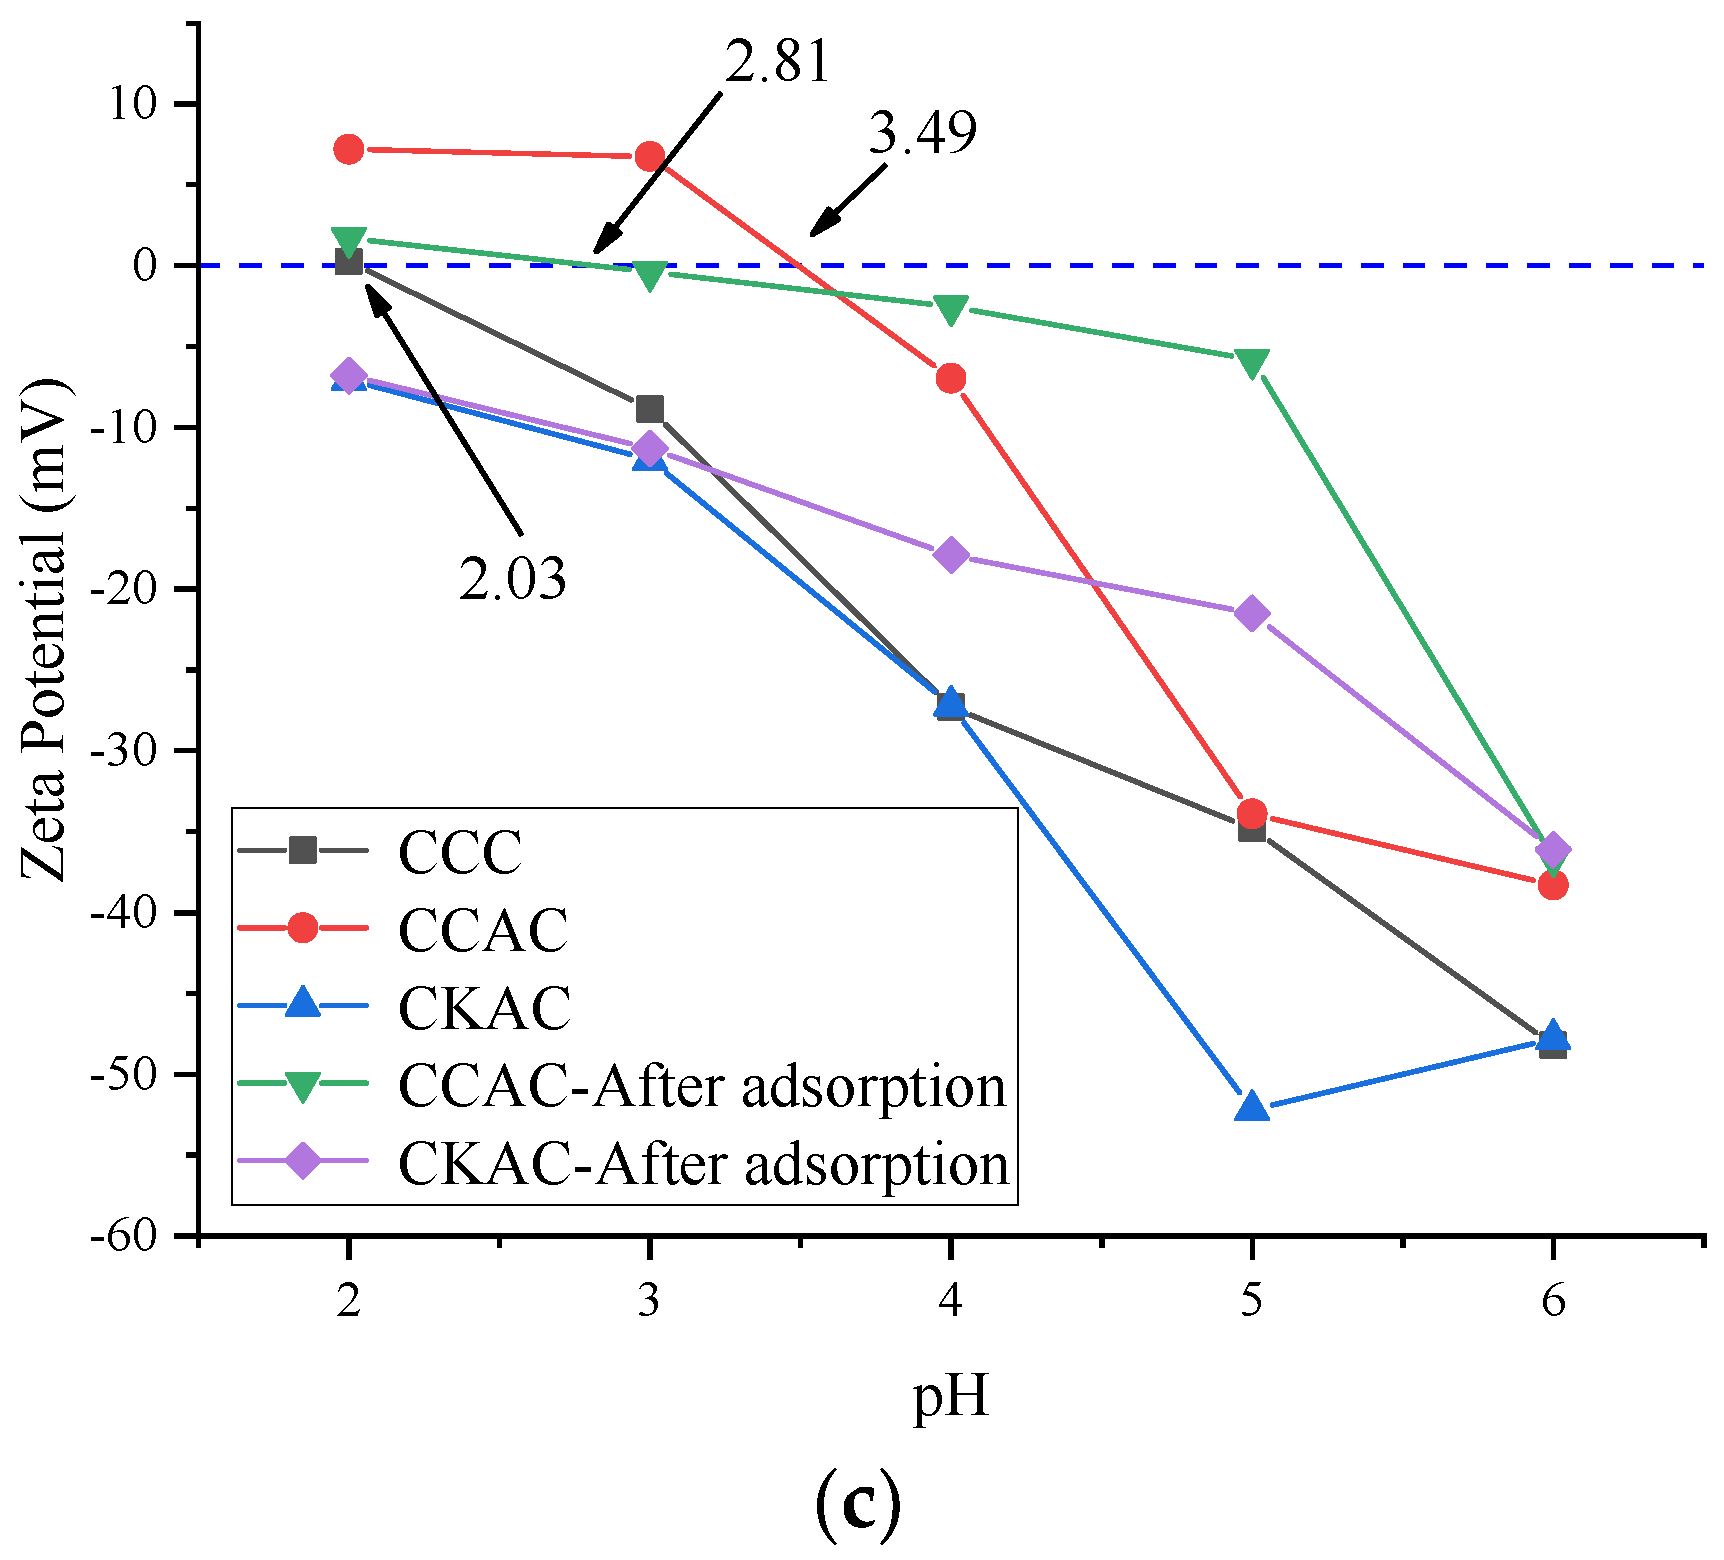
It can be seen from Figure 3b that the adsorption capacity of the two activated carbons was weak at pH < 2. The reason was that the adsorption environment was more acidic, and hydrogen ions occupied the adsorption sites, which made the surface of biochar positively charged. Mercury ions need to compete with hydrogen ions in the adsorption process, resulting in low adsorption capacity of mercury ions. When pH reached 3–4, the adsorption capacity of activated carbon for mercury increased gradually. The results showed that the pHPZC of CKAC was less than 2, and the pHPZC of CCAC was equal to 3.49. When pH of CKAC and CCAC was 3 and 4, respectively, the adsorption of mercury ions reached the maximum, which was consistent with the characterization of Zeta potential of activated carbon. The maximum adsorption capacity of CKAC was 214.58 mg/g, and the maximum adsorption capacity of CCAC was 171.69 mg/g. When the pH was too high, mercury ions will precipitate, which will reduce the adsorption effect of activated carbon. Therefore, the subsequent adsorption experiments of CKAC and CCAC were carried out with pH of 3 and 4.
3.4.3. The Effect of Adsorbent Dosage
It can be seen from Figure 3c that when the adsorbent dosage of CCAC and CKAC was 0.20 g/L, the maximum adsorption capacity was 195.77 mg/g and 248.22 mg/g, respectively. Subsequently, the adsorption capacity decreased with the increase of adsorbent dosage, but the removal rate of mercury ions increased gradually. When the adsorbent dosage was 1.00 g/L, the removal rates of CCAC were 81.63% and 95.30%, respectively. This was because the addition of activated carbon provided more adsorption sites for mercury ion. When the dosage of adsorbent was more than 0.40 g/L, the rising rate of mercury removal became slow, but with the addition of adsorbent, a large number of adsorption sites on the surface of adsorbent were not utilized, resulting in the decrease of adsorption capacity. Considering the experimental results and economic efficiency, 0.40 g/L activated carbon was selected in the experiment.
3.4.4. The Effect of Initial Concentration
From Figure 3d, when the initial concentration of mercury ion was small, the removal rates of mercury ions by CCAC and CKAC were 88.45% and 91.04%. This was due to the low initial concentration of mercury ions, and the number of adsorption sites on activated carbon was enough to adsorb these mercury ions. When the initial concentration of mercury ions increased from 40 mg/L to 100 mg/L, the adsorption capacity of activated carbon for mercury ions increased rapidly. The reason was that mercury ions would occupy the adsorption sites on activated carbon rapidly during the increase of concentration. When the initial concentration was 120 mg/L, the number of adsorption sites was limited, which was not enough to adsorb them completely. Therefore, the change of adsorption capacity was very small at higher concentration, but the removal rate of mercury ion will continue to decrease, which was below 59.32% and 73.43%, respectively. For the effectiveness of mercury ion treatment, 100 mg/L was selected as the initial concentration of mercury ion.
3.4.5. The Effect of Heavy Metal Ion Interference
The Effect of Single Heavy Metal Ion Interference
It can be seen from Figure 3e,f, that the adsorption effect of mercury ion in each group of experiments was better than that of other metal ions, indicating that the activated carbon had good selectivity for mercury adsorption. However, each metal ion had different effects on the adsorption of mercury ions, and the degree of influence from large to small was as follows: Pb2+ > Cu2+ > Ni2+ > Cd2+ > Zn2+. Since the water and ion radius of Pb2+ is smaller than that of other ions, the ability of Pb2+ to compete for adsorption sites is higher than other ions, and the stronger the repulsive force to other metal ions after adsorption, so Pb2+ have the greatest impact on Hg2+ adsorption. The results showed that the different metal ions in the solution have different competitive adsorption effects. The smaller the radius of hydrated ion, the stronger the affinity and the better the adsorption effect.
The Effect of Various Heavy Metal Ion Interference
It can be seen from Figure 3g that compared with the binary adsorption system, the adsorption capacity of activated carbon for each metal ion was reduced, and the competitiveness of metal ions was the same as that of the binary adsorption system. This may be because the number of adsorption sites was not enough to completely adsorb it, and there was fierce competition among a variety of metal ions. The adsorption capacity of activated carbon for mercury ions was higher than that of other metal ions, indicating that they have good selectivity for mercury ions.
3.5. Adsorption Kinetics
In this paper, the data of CCAC and CKAC at different adsorption times were used for kinetic analysis by using pseudo-first-order and pseudo-second-order kinetic models, the Elovich model and the intra particle diffusion model, respectively. The linear fitting results and parameters of the four adsorption kinetic equations are shown in Figure 4 and Table 3.
According to Table 3, the fitting results of the pseudo-second-order kinetic model were better than those of the other three models. R2 was 0.9917 and 0.9908, and the actual adsorption capacity obtained through the experiment was compared with the fitting result. The theoretical adsorption capacity was close, which could more truly reflect the adsorption process of activated carbon to mercury ions. This showed that mercury ions have good stability during the adsorption process. The reaction process was related to the adsorption rate and the reaction was irreversible. The adsorption of mercury ions by activated carbon was mainly chemical adsorption.
3.6. Adsorption Isotherm
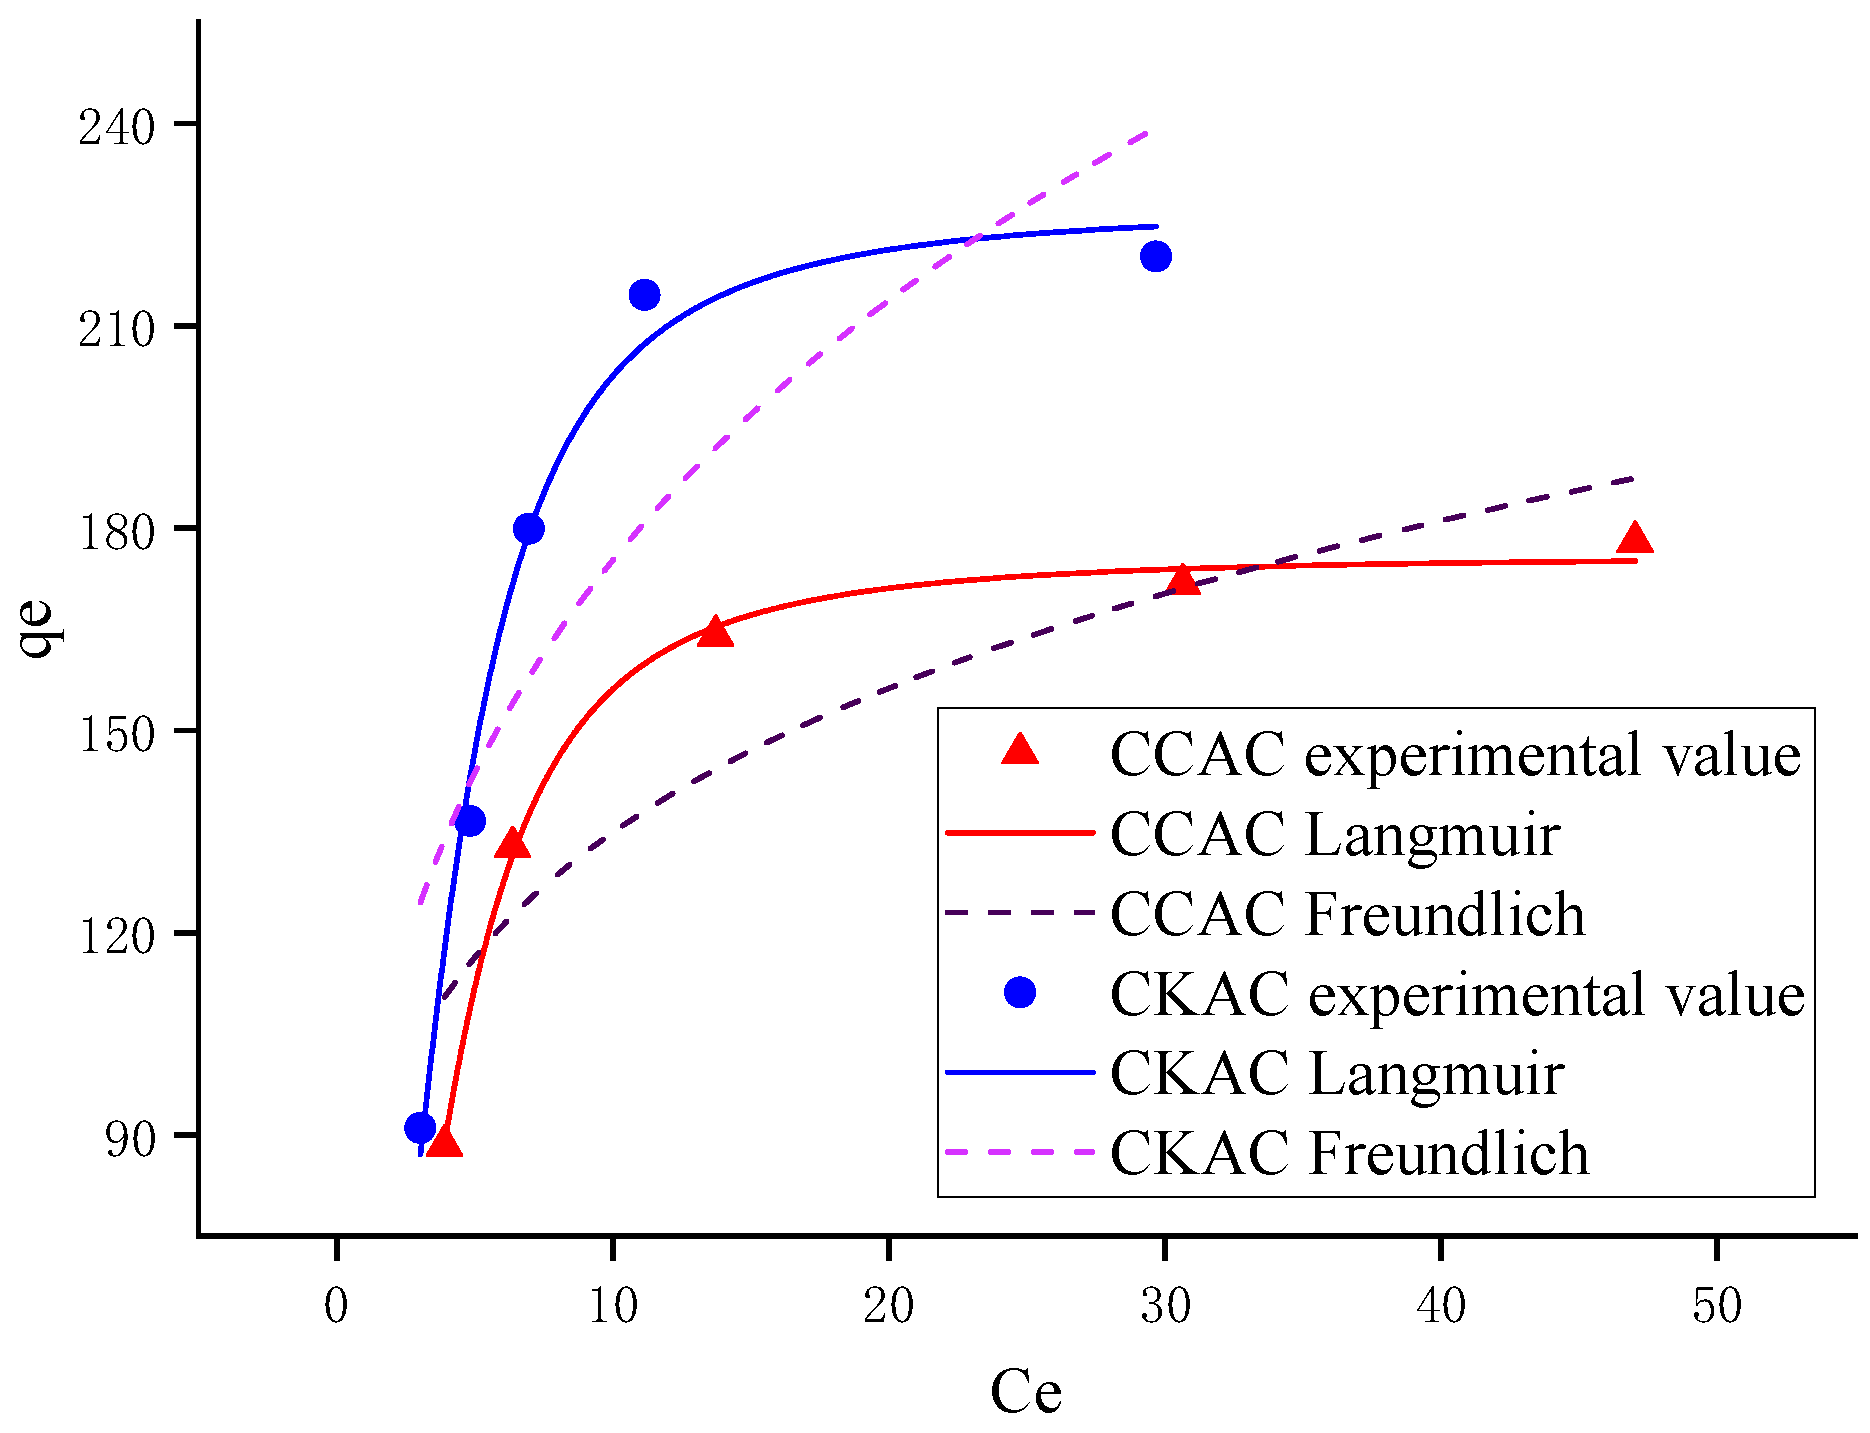
The Langmuir and Freundlich isotherm models were used to fit the adsorption process of mercury ions by CCAC and CKAC. The curve fitting results and parameters are shown in Figure 5 and Table 4.
It can be seen from the above table that the correlation coefficients R2 fitted by the Langmuir adsorption isotherms of the two kinds of activated carbon were 0.9939 and 0.9781, respectively, which were all larger than the coefficients fitted by Freundlich. The Langmuir model was used to fit the maximum adsorption of mercury ions by activated carbon to 175.88 mg/g and 227.32 mg/g, which were equivalent to the actual adsorption value. Therefore, it can be explained that the adsorption of mercury ions by the activated carbon was mainly the chemical adsorption on the monolayer.
3.7. Characterization of Activated Carbon
3.7.1. Scanning Electron Microscopy (SEM) Analysis
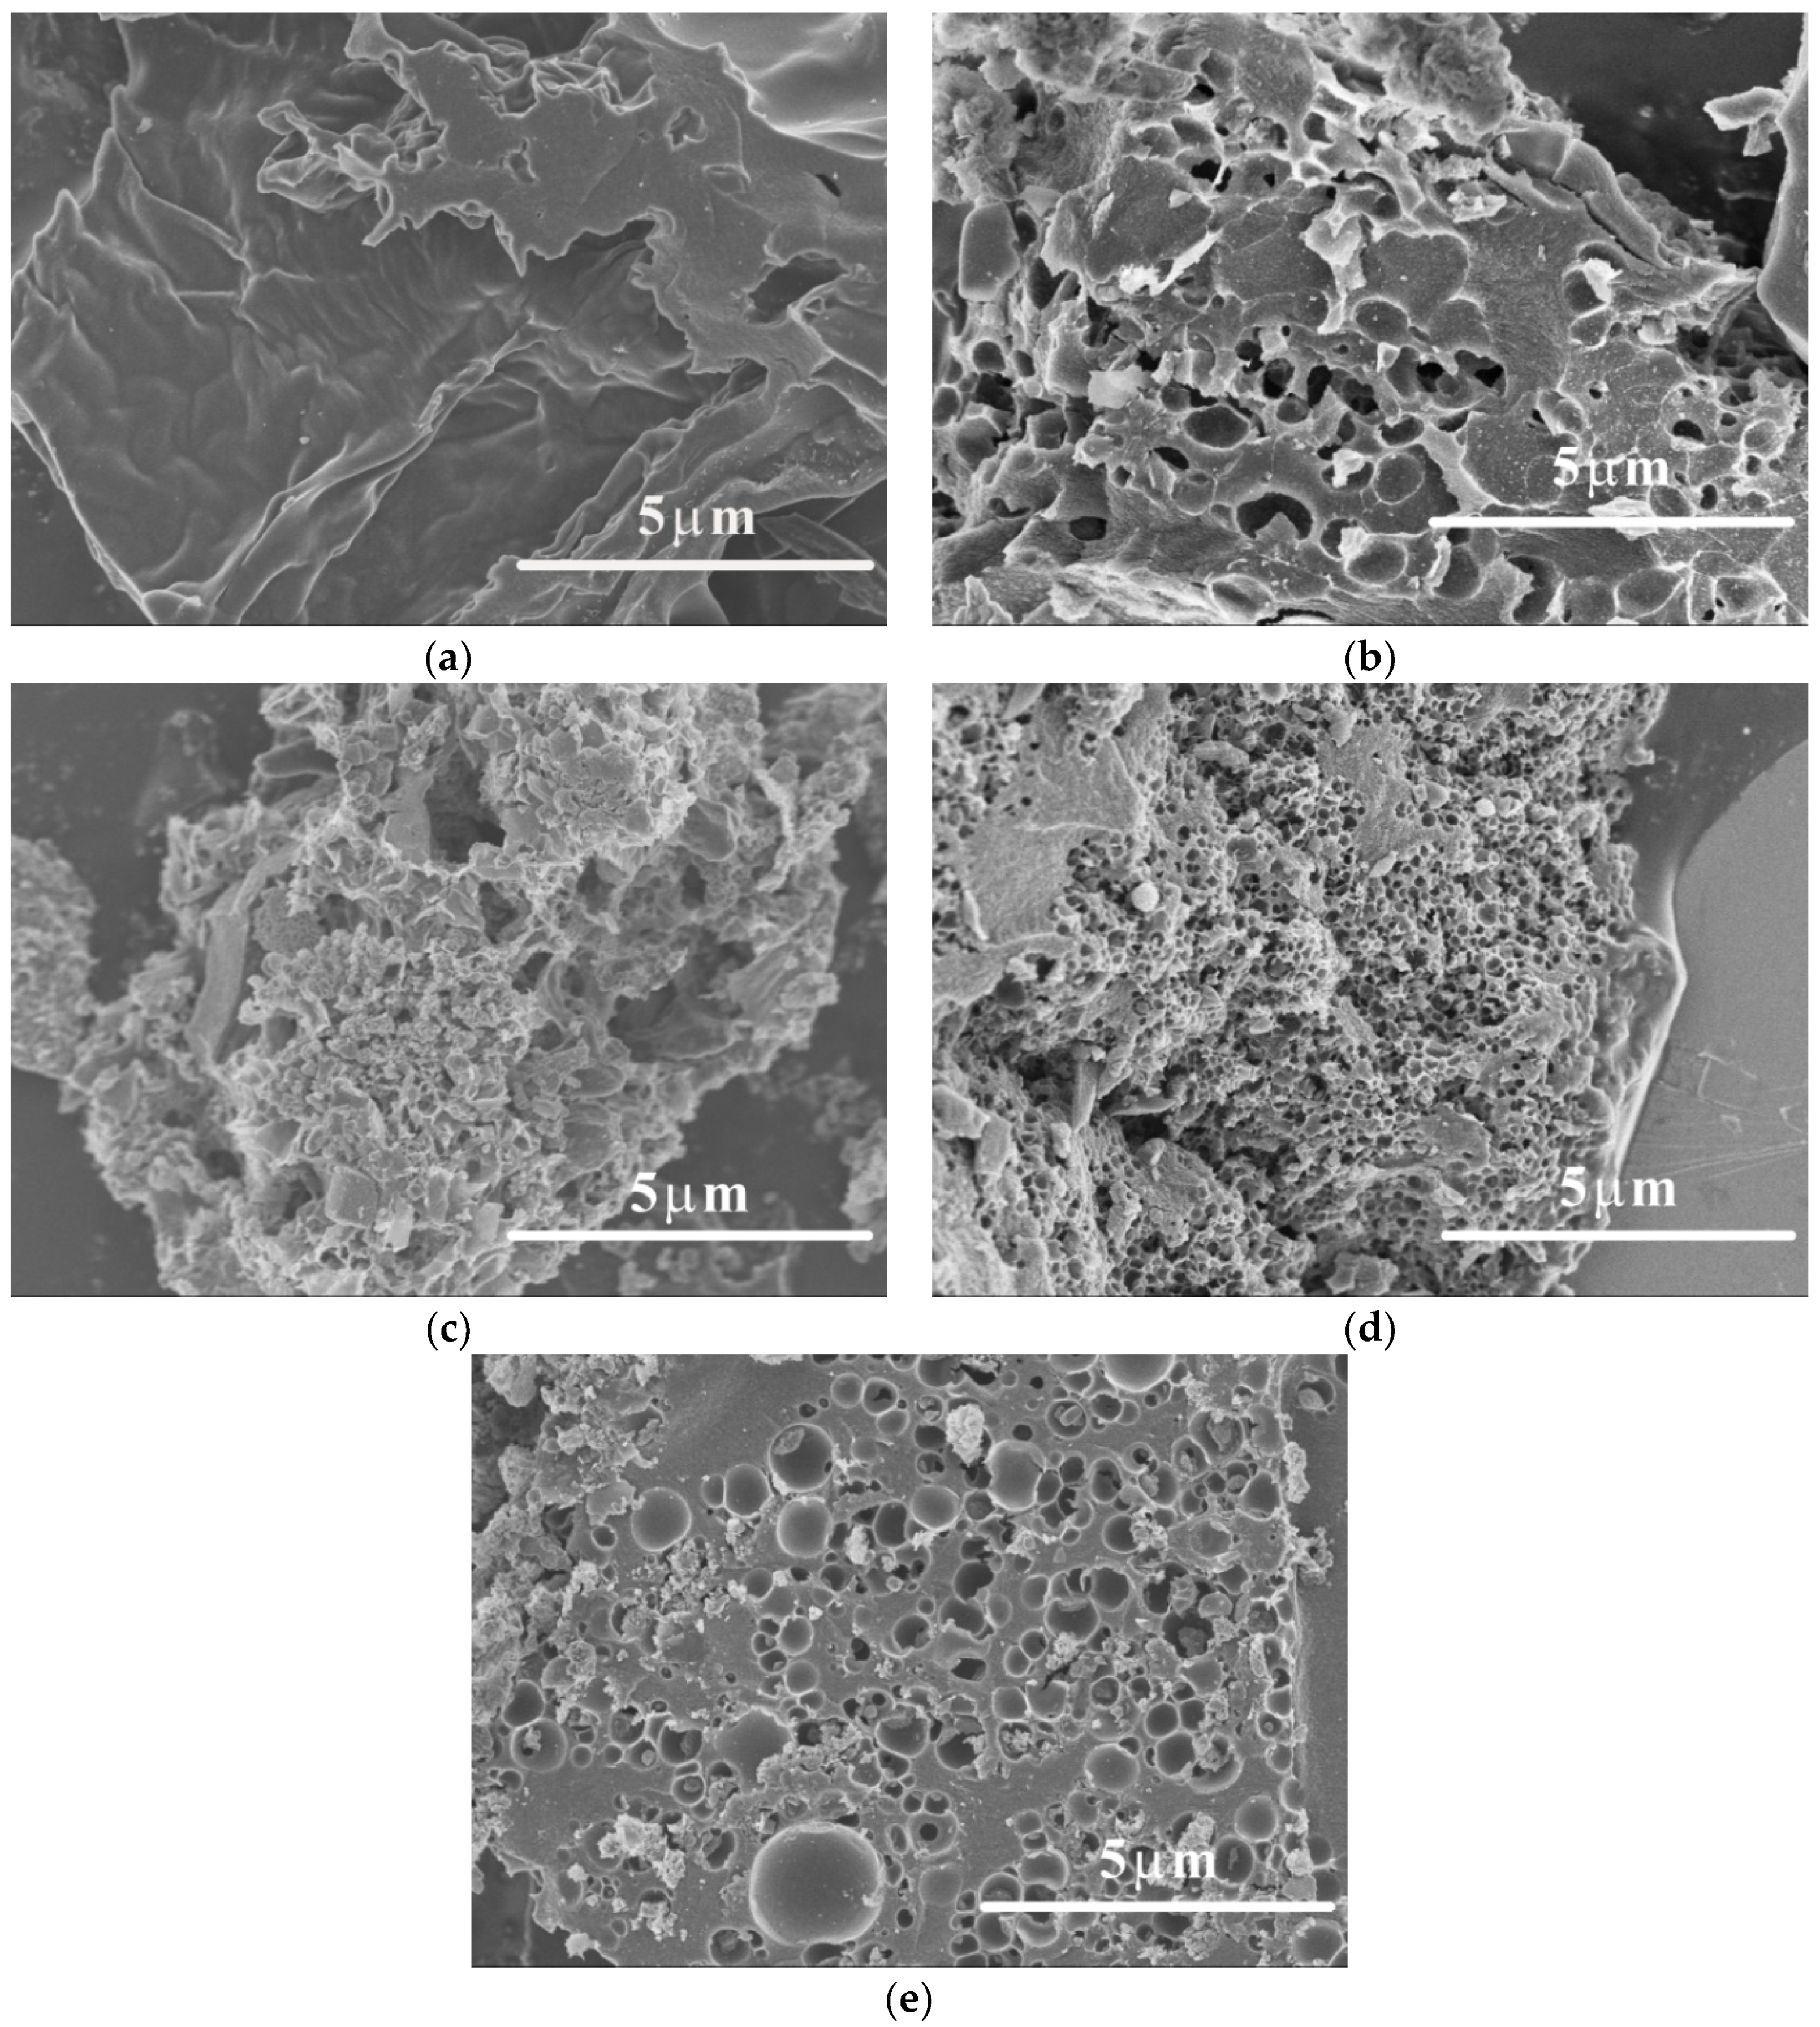
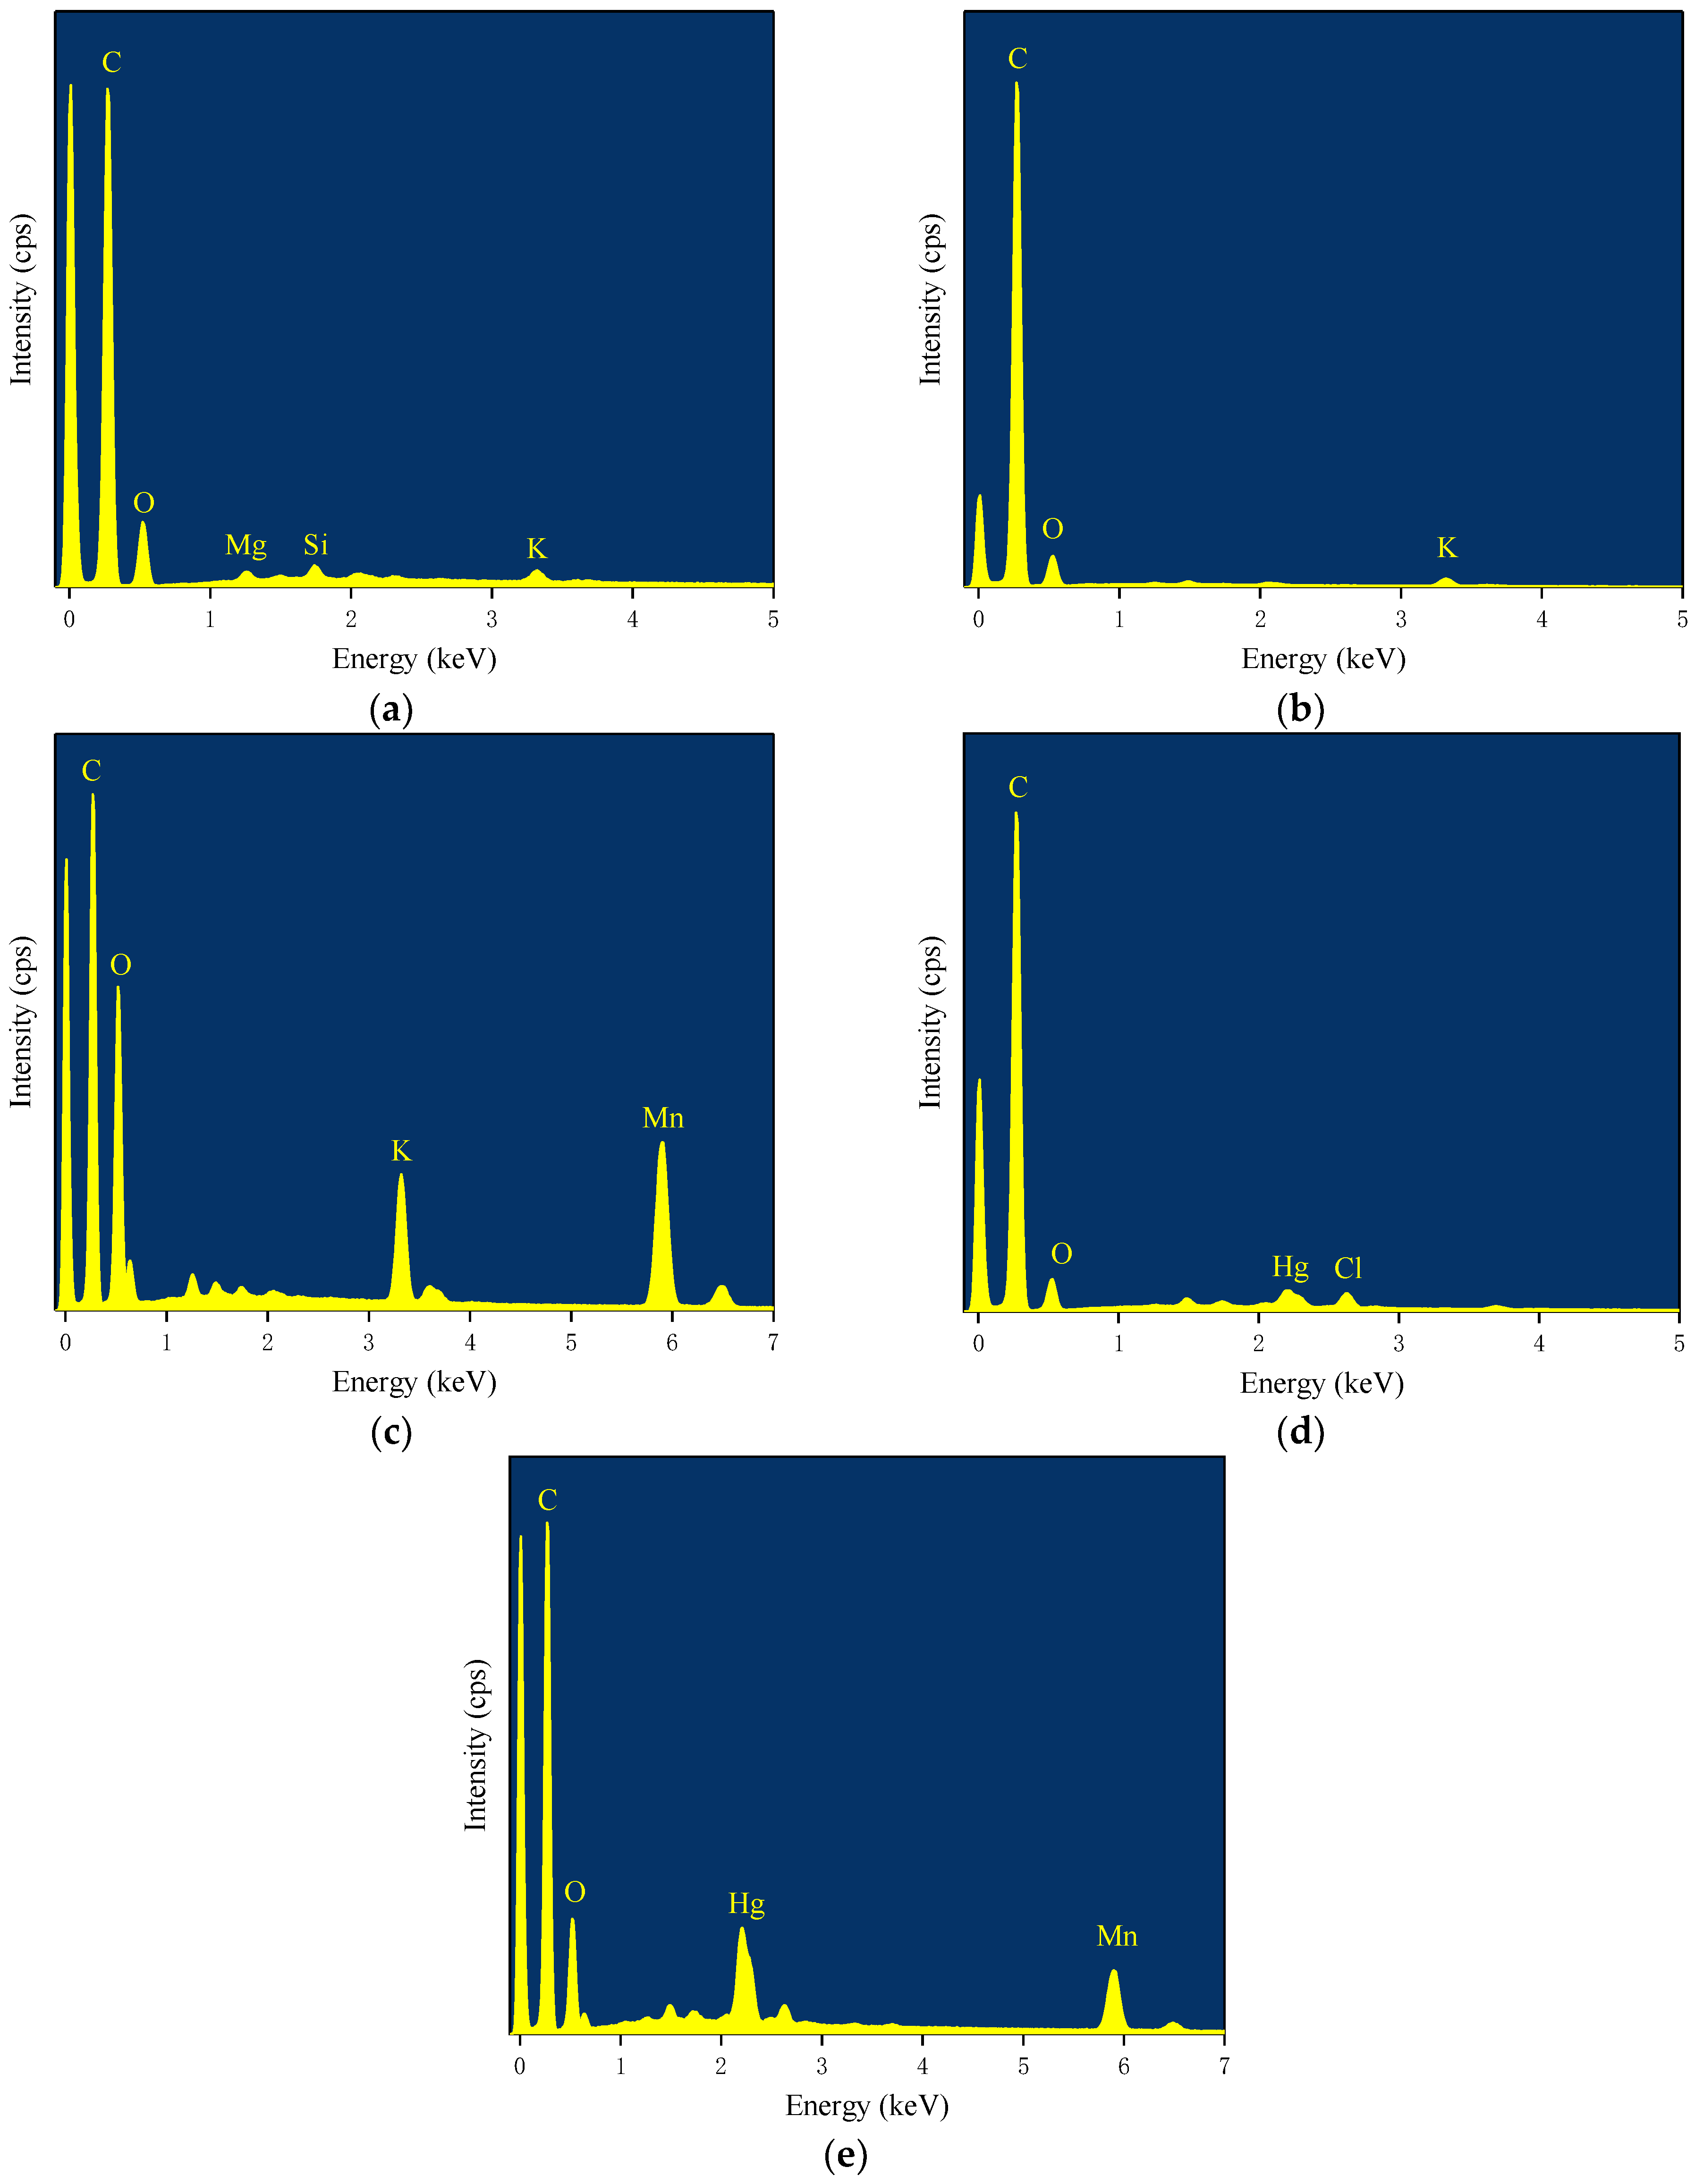
In the SEM of unmodified corn cob biochar shown in Figure 6a the surface of the biochar is smooth and there is no obvious pore structure. From the EDS diagram Figure 7a, it can be seen that C and O were the main element components of biochar, and there were still small amounts of Mg, Si, K elements. It can be seen from the SEM pictures in Figure 6b that there were a lot of pore structures on the surface of activated carbon modified by KOH. This was because during the activation process the carbon material reacted with KOH, and the carbon surface was eroded, which increased the specific surface area of activated carbon and provided a large number of adsorption sites for mercury ion adsorption [31]. It can be seen from the SEM images of Figure 6c that CKAC reacted with KMnO4 solution in the modification process, and the manganese oxides formed adhered to the surface of activated carbon. Although these manganese oxides will cover the original pores, a large number of oxygen-containing functional groups will be formed on the surface of modified activated carbon, which will play an important role in the adsorption process and enhanced the adsorption capacity of activated carbon. It can be seen from the EDS diagram in Figure 7b that the main elements of KOH modified activated carbon are C, O and a small amount of K; while in Figure 7c it can be seen that the main elements of KOH+KMnO4 modified activated carbon were C, O, K and Mn. Among them, the proportion of O increased significantly, which further indicated that KMnO4 could increase the number of oxygen-containing functional groups on the surface of activated carbon. It can be seen from Figure 6d,e that after adsorption of mercury ions by activated carbon, white substances will appear on the activated carbon and adhere to the carbon surface. It can be found from the EDS spectrum in Figure 7d,e that the main components of CCAC were C, O and Hg, while the main components of CKAC were C, O, Hg and Mn, which further indicated that mercury ion was adsorbed by activated carbon. The content of C increased, while the content of O and Mn decreased. This might be due to the reaction of functional groups containing O and Mn during the mercury ion adsorption process, which involved the release of O and Mn. Moreover, the amount of other elements on the activated carbon decreased, which might be due to the ion exchange between mercury and other elements in the adsorption process. In addition, there were Cl on the surface of CCAC, which may be due to the formation of compounds with Hg and attachment to the activated carbon.
3.7.2. BET Analysis
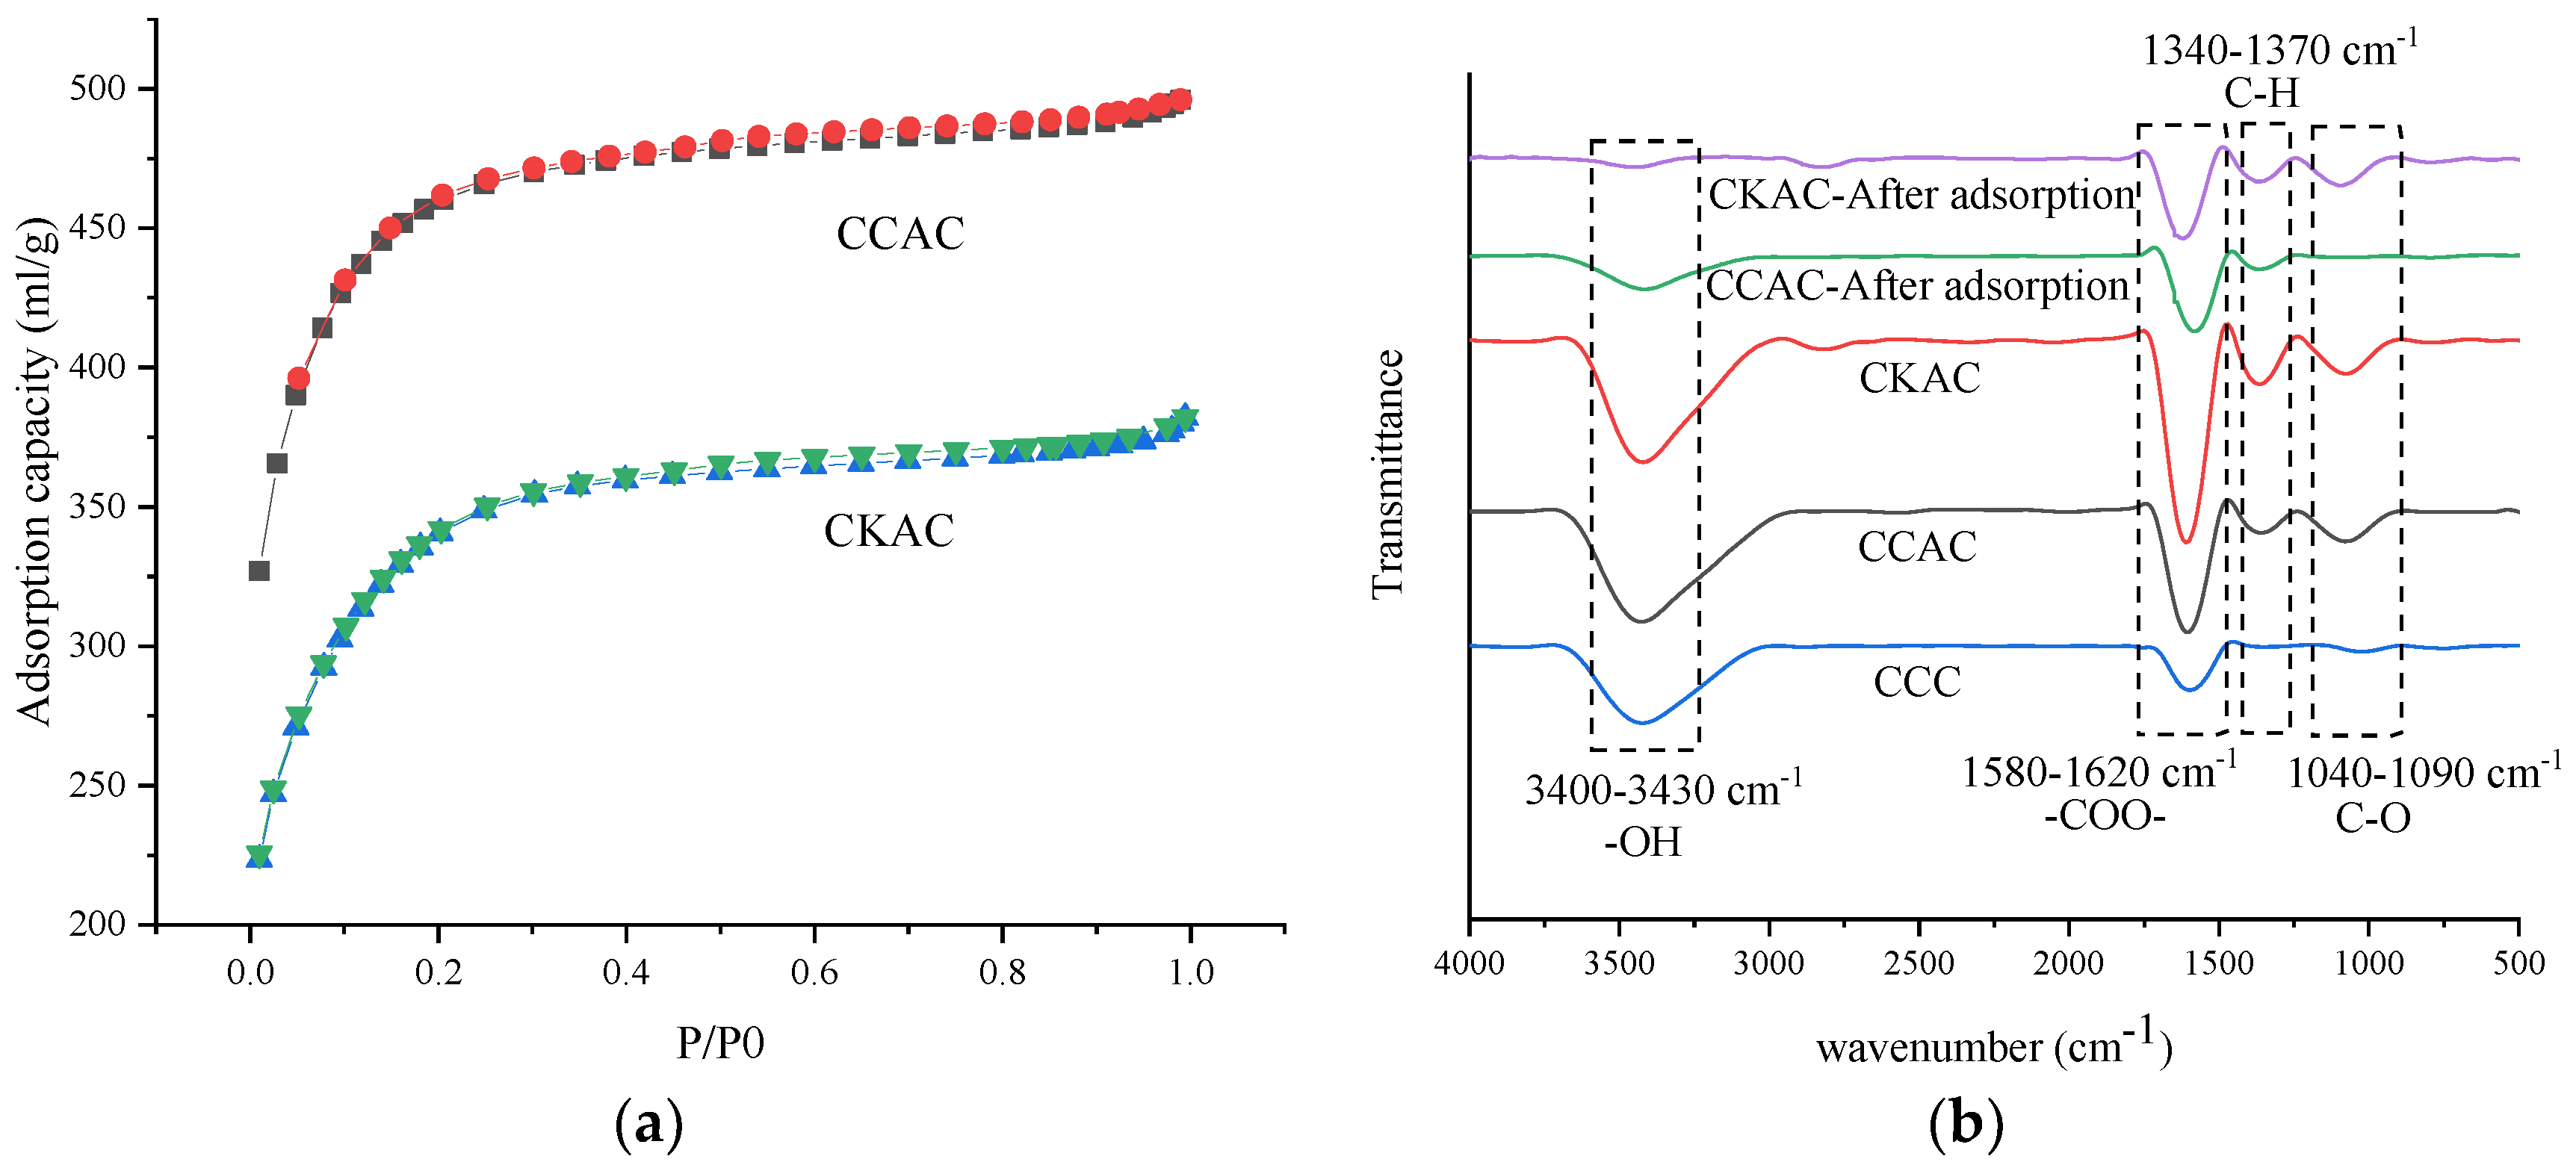
It could be seen from Table 5 that the specific surface area of the biochar obtained after the corn cob was carbonized at 500 °C is relatively small, which was only 11.16 m2/g, and the total pore volume was 0.003 cm3/g. The specific surface area value of activated carbon after KOH activation was obvious, reaching 2797.75 m2/g, and the proportion of micropores was extremely large, which played an important role in the adsorption [32]. At the same time, the pore volume of CCAC also increased to 1.36 cm3/g. The increase in pore volume could provide more adsorption sites and promote the adsorption of mercury ions. The specific surface area, pore volume and micropores of the activated carbon modified by potassium permanganate were reduced compared to CCAC. This was because the manganese oxide formed during the modification process was attached to the surface of the activated carbon, causing pore blockages. As seen in Figure 8a, both activated carbons belonged to the type I adsorption isotherm. The N2 adsorption and desorption curves of CCAC increased rapidly in the low pressure region (P/P0 = 0–0.05), during which monolayer adsorption was mainly carried out in micropores, indicating that there were a large number of microporous structures in both activated carbons. However, the rate of increase of CKAC was slower than that of CCAC, indicating that the number of micropores was relatively small. As was seen from Table 5, the specific surface area of CCAC and CKAC decreased by 418.60 m2/g and 319.90 m2/g, respectively, and the micropore area decreased by 2216.28 m2/g and 156.96 m2/g, respectively, through comparison before and after adsorption. It can be seen that the specific surface area and micropore area of CCAC decreased more obviously, indicating that the specific surface area and micropore played an important role in the adsorption of mercury ions, and the total pore volume and micropore volume also decreased to different degrees. Through the above data analysis, it can be inferred that mercury ions were adsorbed to the outer surface and the pore surface of KOH modified activated carbon. However, the specific surface area and micropore area of CKAC decreased slightly. The modification of KMnO4 has covered some original pore structures, and the adsorption of mercury ions may be mainly caused by the oxygen-containing functional groups on the surface.
3.7.3. Fourier Transform Infrared (FTIR) Analysis
From Figure 8b, the characteristic peak at 3420 cm−1 was caused by the stretching vibration of the hydroxyl (-OH) on the surface of the activated carbon [33]. The characteristic peaks at 1600 cm−1 were the stretching vibration peaks of the carbonyl group (-C=O) and the carboxyl group (-COO-). The activated carbon modified by KOH and KOH + KMnO4 showed new characteristic peaks at 1340 cm−1 and 1030 cm−1, respectively. Among them, the characteristic peaks at 1340 cm−1 and 1390 cm−1 corresponded to the bending vibration of the C–H bond. The characteristic peaks at 1030 cm−1 and 1040 cm−1 were caused by the stretching vibration of the C–O bond [34]. The analysis results showed that the modification methods of KOH and KOH+KMnO4 enriched the types of oxygen-containing functional groups on the surface of activated carbon, and the existence of these functional groups could improve the adsorption capacity of activated carbon for mercury ions. After adsorption, the positions of the characteristic peaks of -OH shifted to 3400 cm−1 and 3430 cm−1, and the intensity of the peaks became weaker, indicating that -OH played an important role in the adsorption of mercury ions. The -C=O peak position shifted to 1580 cm−1 and 1620 cm−1, which might be caused by the reaction of -C=O with mercury ions. The position of the C–H peak shifted from 1340 cm−1 and 1390 cm−1 to 1360 cm−1 and 1370 cm−1, which meant that C–H promoted the adsorption of mercury ions to a certain extent. The position of the characteristic C–O peak was shifted to 1090 cm−1. It is speculated that the C–O bond was involved in the adsorption process of mercury ions.
3.7.4. Zeta Potential Analysis
As was shown in Figure 8c, the pHPZC of CCC and CCAC were 2.03 and 3.49, respectively. When the pH of the solution was less than pHPZC, ions on the surface of the carbon material will protonate and become positively charged. At this time, ions on the surface of the carbon material will repel each other with the positively charged mercury ions in the solution, resulting in a low adsorption capacity of activated carbon. When the pH of the solution was more than pHPZC, the surface of the carbon material was negatively charged. At this time, the activated carbon and mercury ions in the solution attracted each other to promote the adsorption. However, in the pH range of 2 to 6, Zeta potential value of CKAC was always less than 0, indicating that the pHPZC of the activated carbons was less than 2, indicating that CKAC could adapt to a wider pH range, and the adsorption of mercury ions was easier.
3.7.5. X-ray Photoelectron Spectroscopy (XPS) Analysis
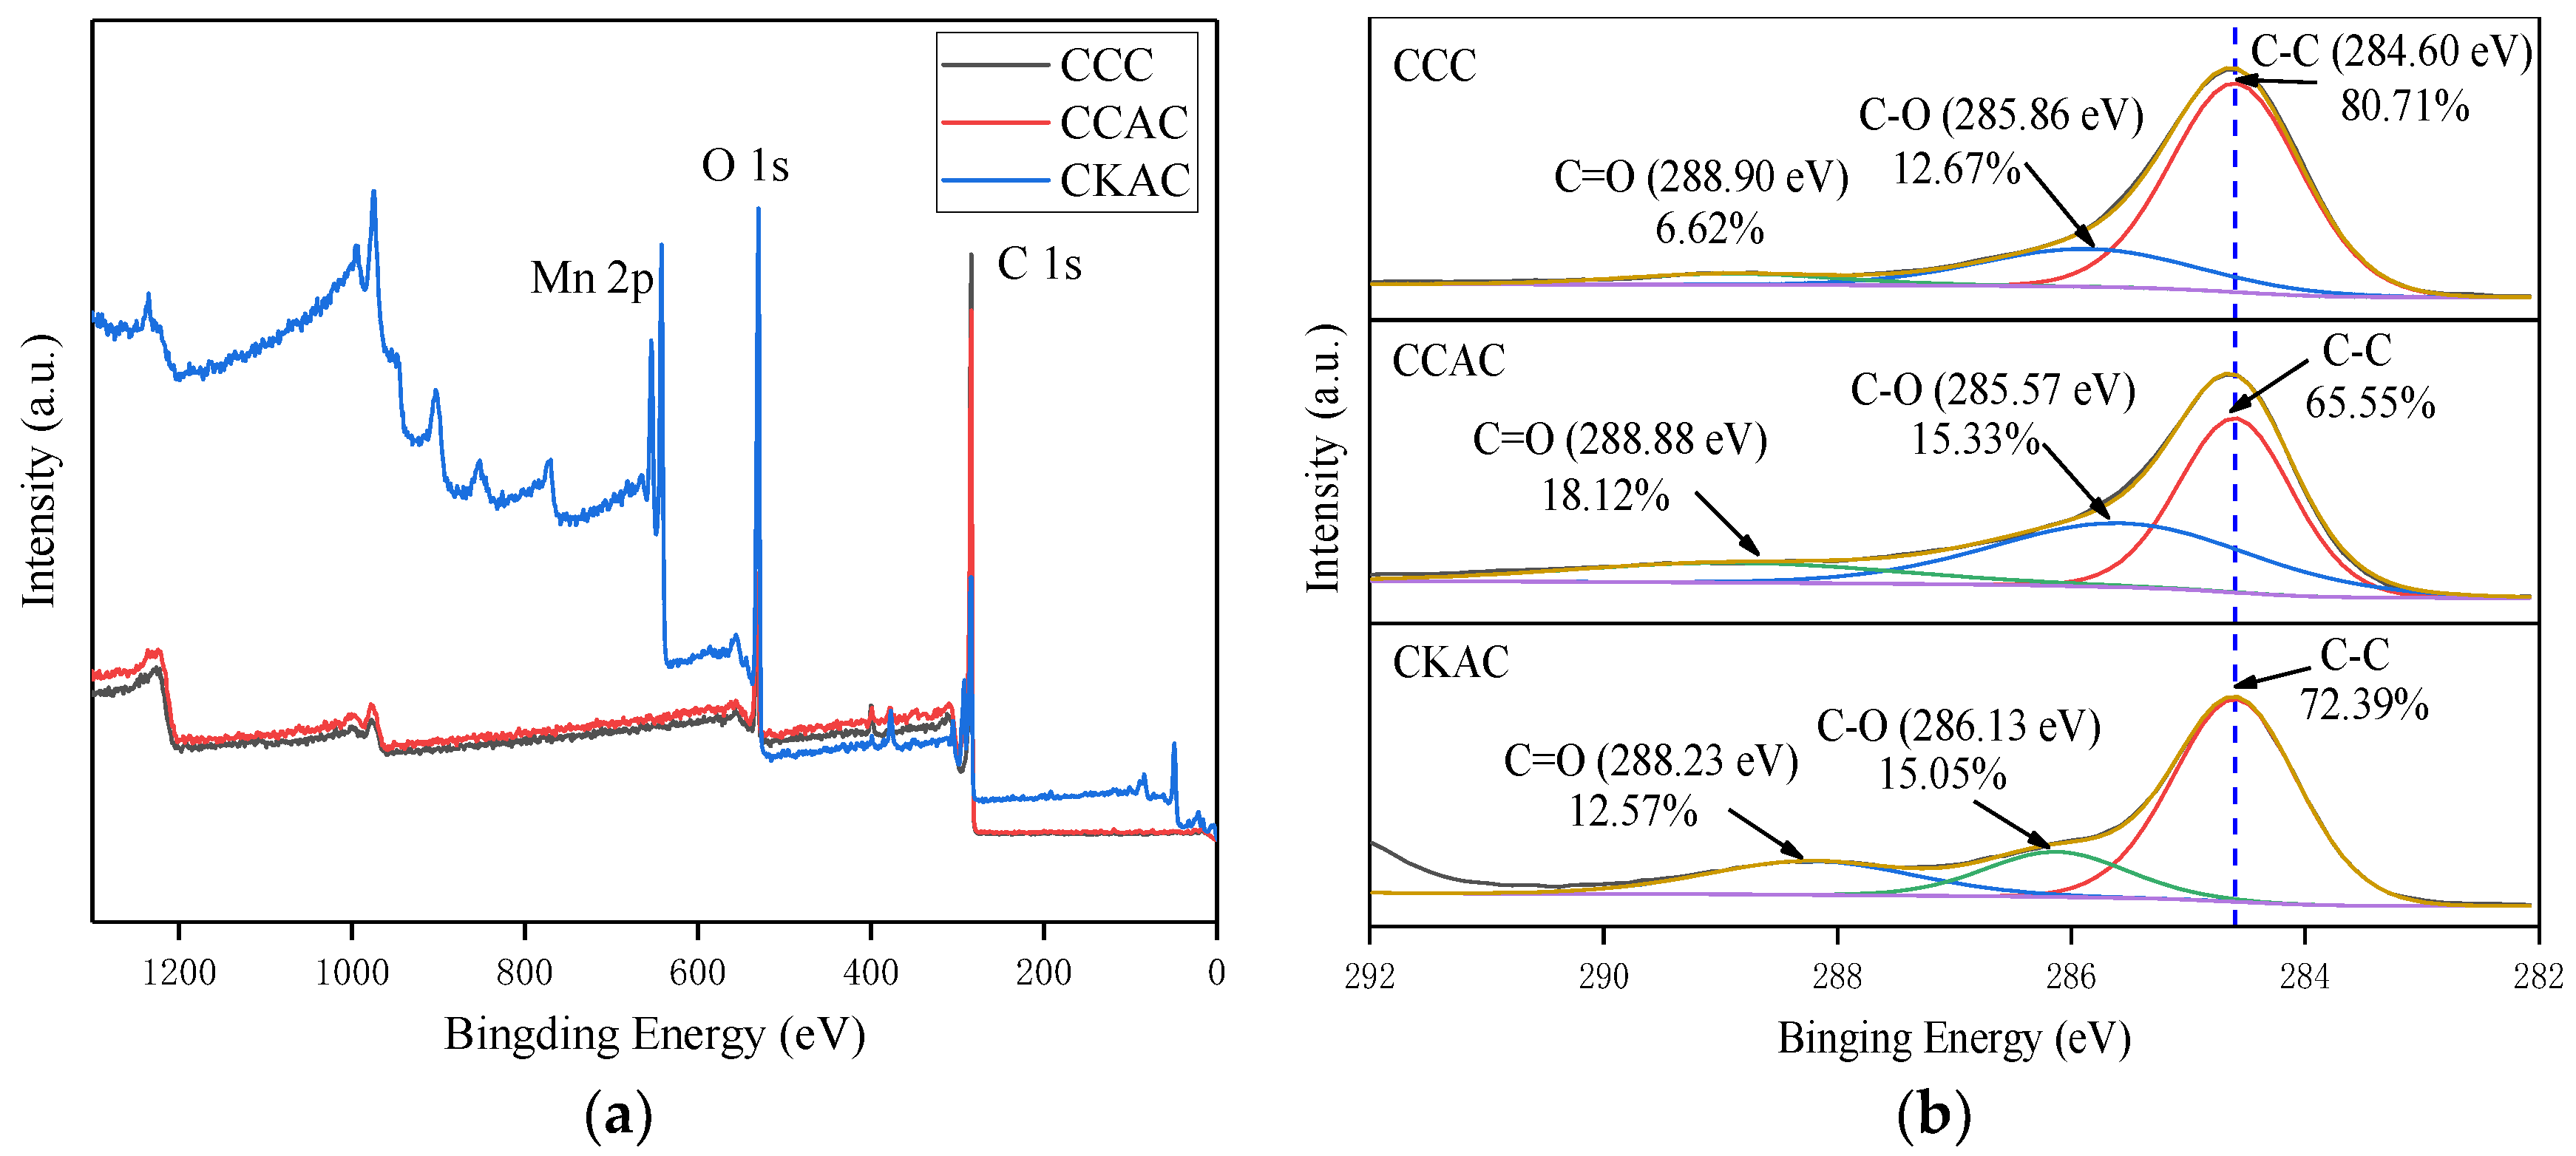
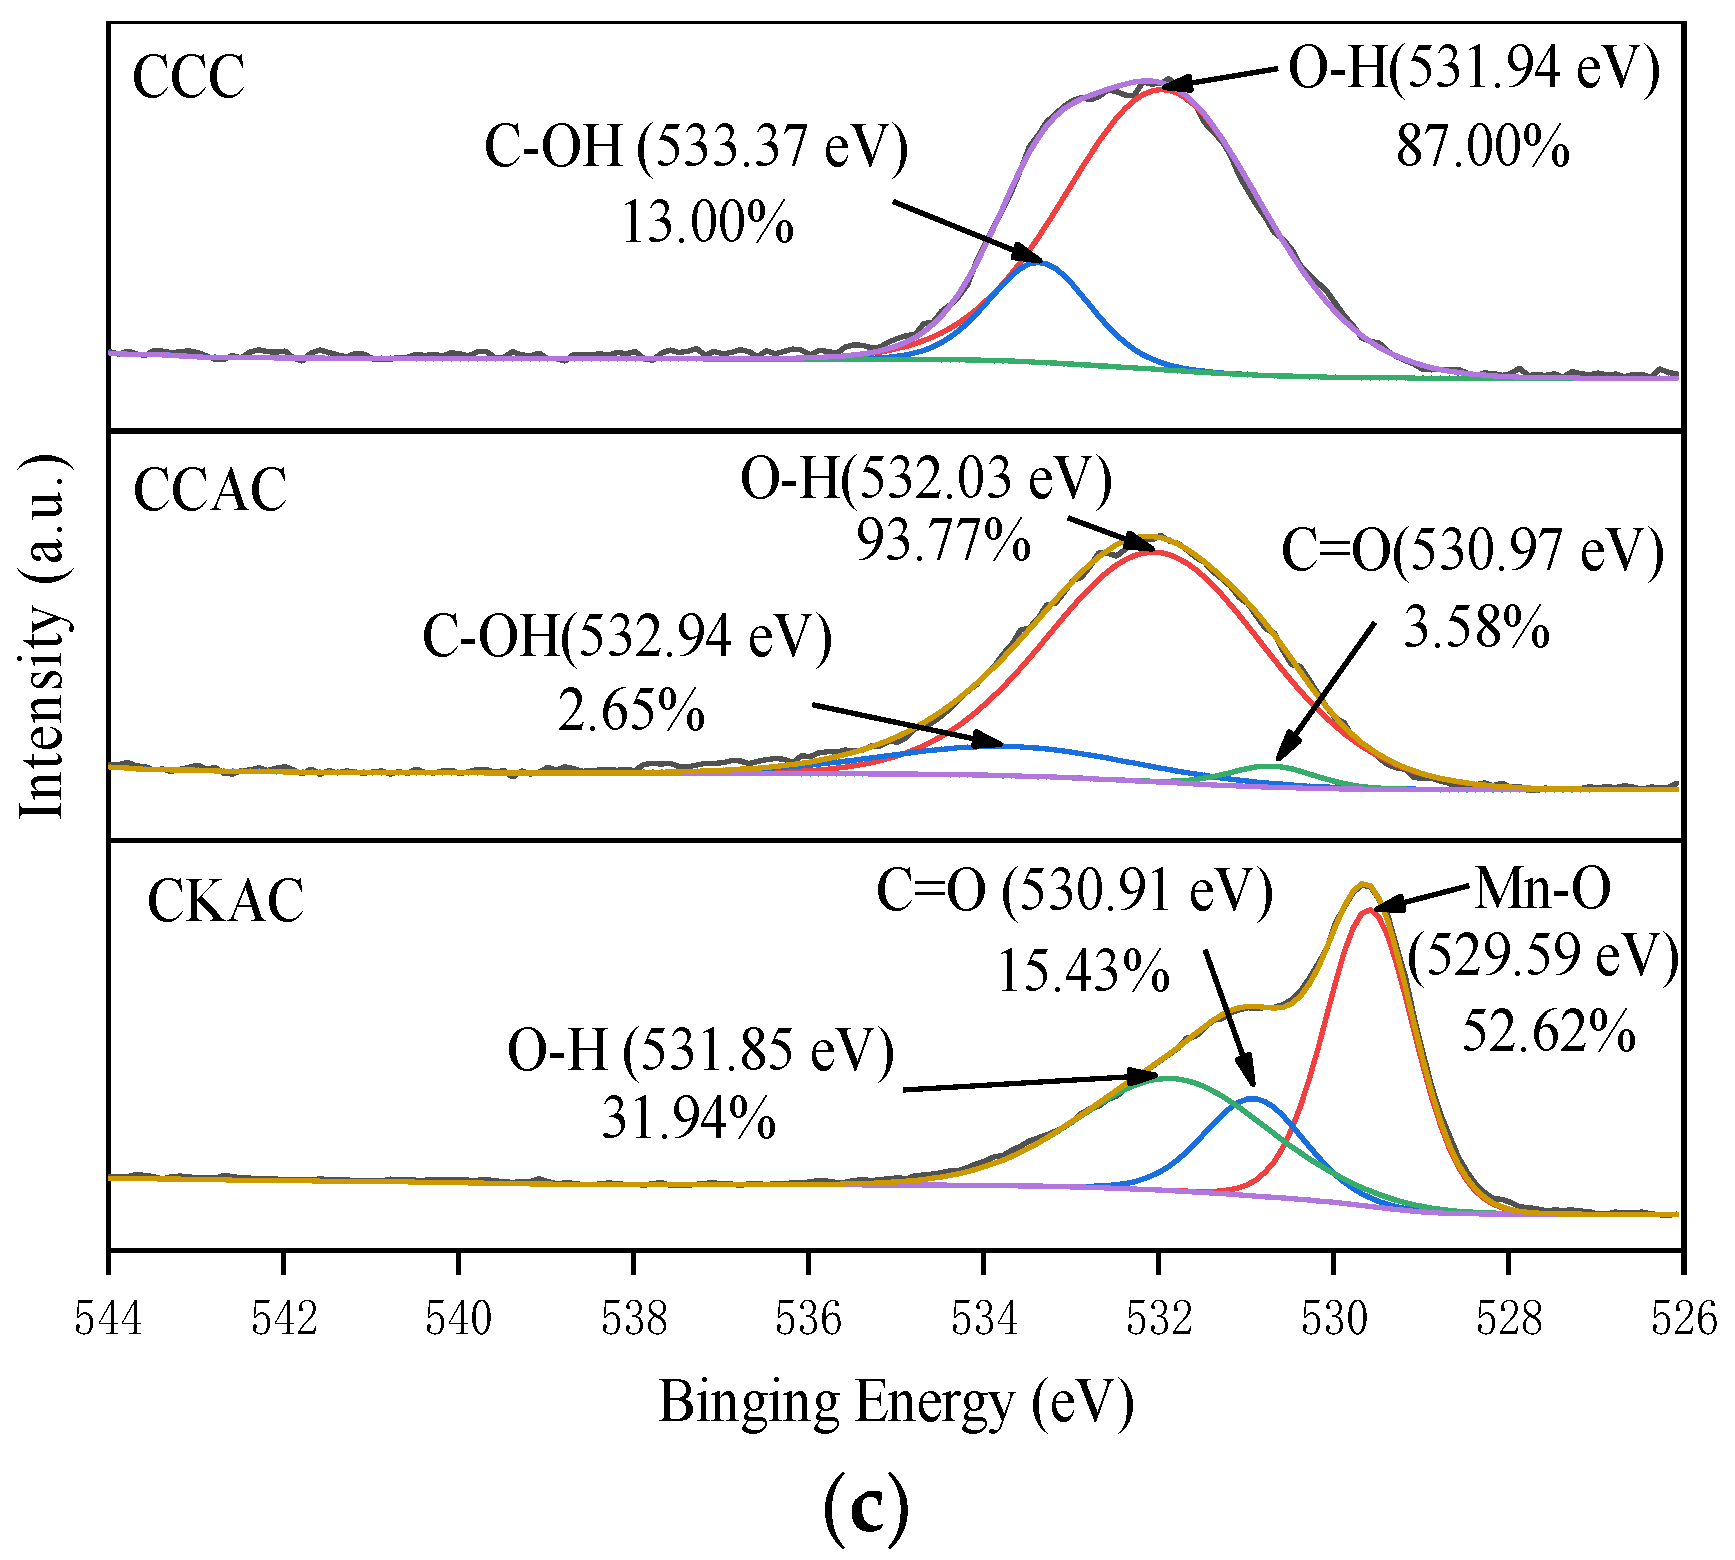
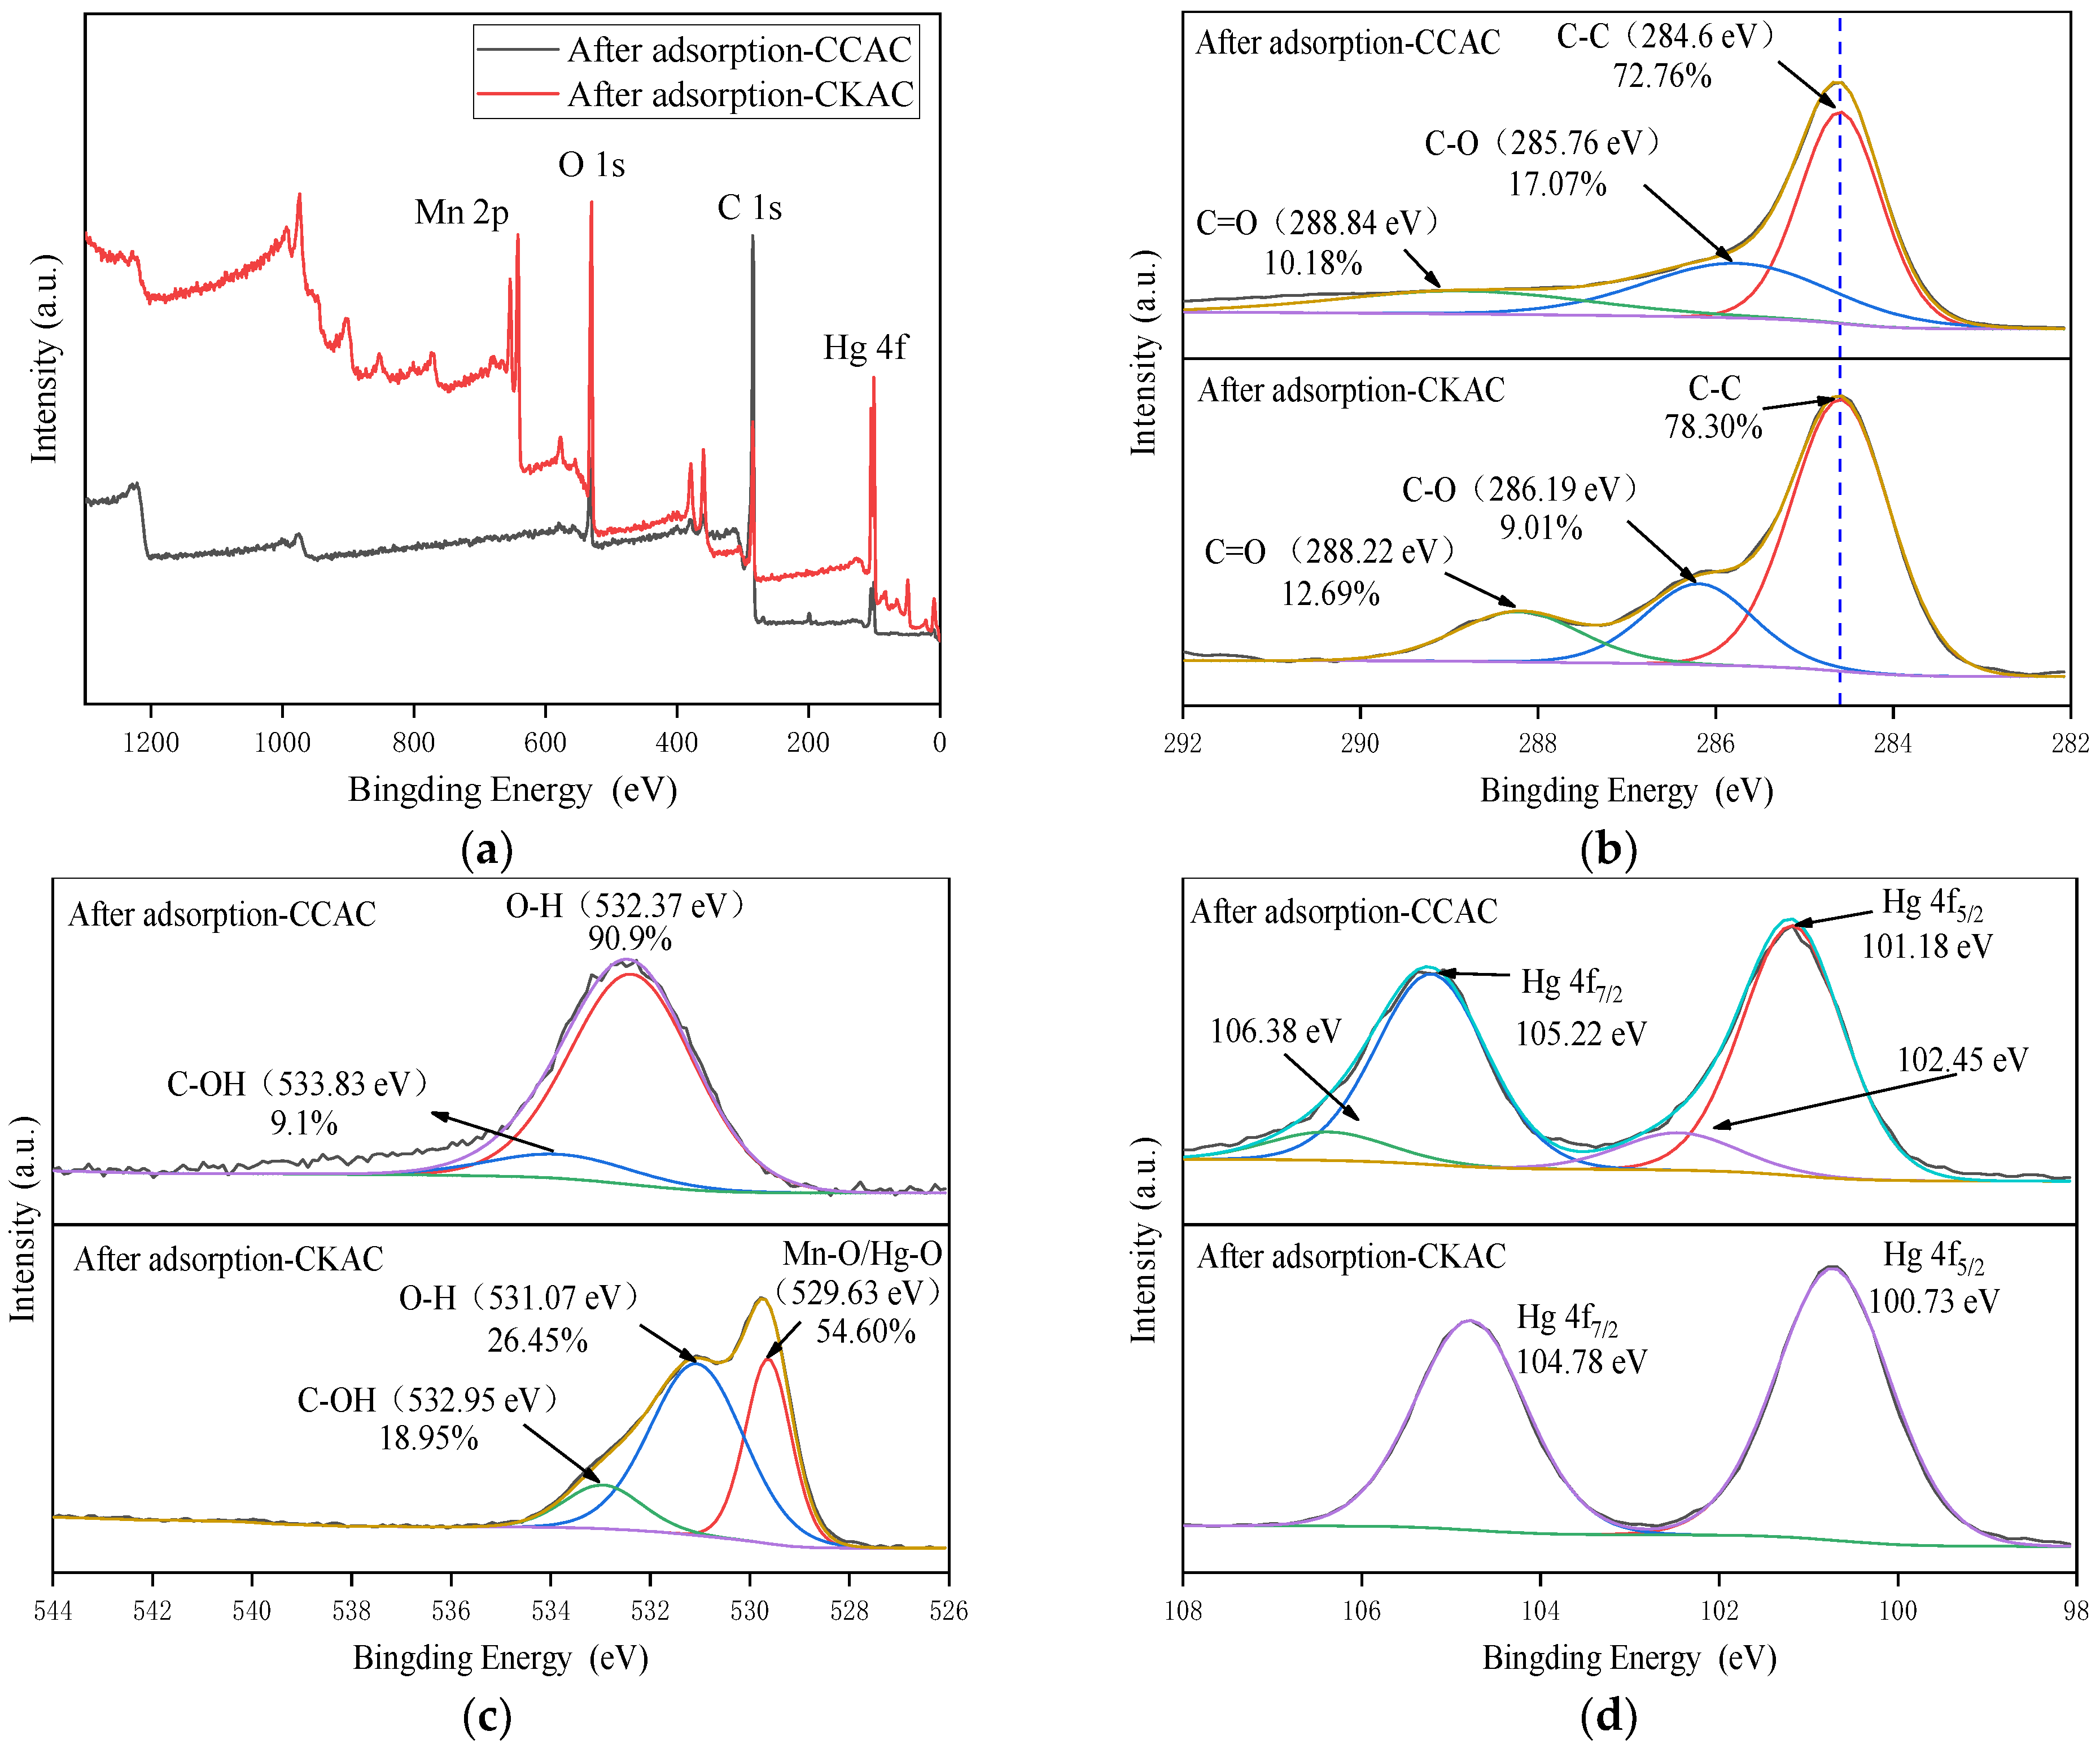
Figure 9a shows the XPS full spectrum of biochar before and after modification. It can be seen that the main elements of biochar before and after modification by KOH were C and O. The main elements modified by KOH + KMnO4 were C, O and Mn. Figure 9b shows the C 1s spectra of corn cob carbon before and after modification, respectively. It can be seen from the figure that C mainly exists in the form of C–C, C–O and C=O. The C–C ratio of unmodified biochar was 80.71% and 83.73%, respectively. However, the proportion of C–C in the modified activated carbon decreased, and the proportion of C–O and C=O increased, indicating that during the modification process, the original C–C was transformed into C–O or C=O and other oxygen-containing functional groups through chemical reactions. Figure 9c shows the O 1s spectra of corn cob carbon before and after modification, respectively. It can be seen that the O element in the modified activated carbon mainly existed in the form of O–H and C–OH, and a few existed in the form of C=O. In the XPS spectra of CKAC which is shown in Figure 9c there are characteristic peaks (Mn-O) formed by metal and O and oxygen at 529.59 eV, indicating that manganese oxide was attached to the surface of activated carbon, which was consistent with the results of EDS spectra. Compared with the full spectrum before adsorption, in Figure 10, the contents of O 1s and Mn 2p in XPS decreased after adsorption of mercury ions, which might be due to the reaction of mercury ions with the chemical bonds of O and Mn during the adsorption process, and the emergence of a new Hg 4f peak in Figure 10d, which meant that mercury ions were successfully adsorbed on activated carbon. The intensity of the O–H peak decreased from 97.77% to 18.95%, which indicated that the adsorption of mercury ions consumed a lot of O–H in modified activated carbon. At the same time, the position of the characteristic peak formed by metal oxide and O before adsorption shifted from 529.59 eV to 529.63 eV, and the peak area increased from 52.62% to 54.60%, indicating that Hg–O was formed on the surface of activated carbon after the adsorption of mercury ion. The new peak of Hg 4f was fitted by peak software. The peak of Hg 4f7/2 was in the range of 98–103 eV, and the peak of Hg 4f5/2 was in the range of 103–108 eV. Four groups of characteristic peaks were obtained by fitting, which were located at 100.78–101.18 eV, 102.45–102.79 eV, 105.02–105.22 eV and 106.38–106.77 eV, respectively. The two peaks in the range of 100.78–101.18 eV and 105.02–105.22 eV indicated that mercury existed on the surface of the material in the form of monovalent or divalent mercury ions, which may be in the form of HgCl or HgCl2, which was consistent with the characterization results of EDS. Two peaks in the range of 102.45–102.79 eV and 106.38–106.77 eV indicate that mercury was complexed by functional groups on the material in the form of divalent ions to form Hg–O bonds, which was consistent with the results of O 1s.
3.8. Comparison with Other Adsorbents
Table 6 compares the adsorption capacity of various adsorbents for mercury ions. By comparison, the maximum adsorption capacity of activated carbon prepared from corncobs is relatively better. The structural characteristics of various adsorbents, as well as the dosage and pH of the adsorbents under the optimal adsorption conditions, are shown in Table 6.
4. Conclusions
In this study, corn cob was used as raw material to prepare an activated carbon adsorbent with low cost and strong adsorption capacity by means of carbonization and chemical modification. SEM-EDS, FTIR, XPS and other methods were used to characterize the activated carbon before and after modification and adsorption. The results show that the modification method of KOH and KMnO4 can improve the specific surface area and the number of oxygen-containing functional groups, and increase the number of adsorption sites, so as to improve the adsorption capacity of activated carbon for mercury ions. The maximum adsorption capacity of CCAC and CKAC are 184.76 mg/g and 222.22 mg/g, respectively. The adsorption process is in accordance with the Langmuir isotherm and pseudo-second-order kinetic model, which indicates that the adsorption process is dominated by chemical adsorption.
Author Contributions
Conceptualization, B.Q.; Investigation, X.X.; Project administration, X.L. and W.Y.; Supervision, H.Z.; Writing—original draft, Y.L. All authors have read and agreed to the published version of the manuscript.
Funding
This research received no external funding.
Acknowledgments
The authors are grateful for the support of National Key R&D Program of China (2019YFD1100603) and Heilongjiang Province Science and Technology Plan, Provincial Academy Science and Technology Cooperation Project (YS20B01).
Conflicts of Interest
The authors declare no conflict of interest.
References
- Liu, Z.; Sun, Y.; Xu, X.; Meng, X.; Qu, J.; Wang, Z.; Liu, C.; Qu, B. Preparation, characterization and application of activated carbon from corn cob by KOH activation for removal of Hg(II) from aqueous solution. Bioresour. Technol. 2020, 306, 123154. [Google Scholar] [CrossRef]
- Li, G.; Bai, X.; Li, H.; Lu, Z.; Zhou, Y.; Wang, Y.; Cao, J.; Huang, Z. Nutrients removal and biomass production from anaerobic digested effluent by microalgae: A review. Int. J. Agric. Biol. Eng. 2019, 12, 8–13. [Google Scholar] [CrossRef] [Green Version]
- Zhao, J.; Wu, E.; Zhang, B.; Bai, X.; Lei, P.; Qiao, X.; Li, Y.-F.; Li, B.; Wu, G.; Gao, Y. Pollution characteristics and ecological risks associated with heavy metals in the Fuyang river system in North China. Environ. Pollut. 2021, 281, 116994. [Google Scholar] [CrossRef]
- Li, G.; Zhang, J.; Li, H.; Hu, R.; Yao, X.; Liu, Y.; Zhou, Y.; Lyu, T. Towards high-quality biodiesel production from microalgae using original and anaerobically-digested livestock wastewater. Chemosphere 2021, 273, 128578. [Google Scholar] [CrossRef]
- Melnyk, L.J.; Lin, J.; Kusnierz, D.H.; Pugh, K.; Durant, J.T.; Suarez-Soto, R.J.; Venkatapathy, R.; Sundaravadivelu, D.; Morris, A.; Lazorchak, J.M.; et al. Risks from mercury in anadromous fish collected from Penobscot River, Maine. Sci. Total Environ. 2021, 781, 146691. [Google Scholar] [CrossRef]
- Kadam, A.R.; Nair, G.B.; Dhoble, S.J. Insights into the extraction of mercury from fluorescent lamps: A review. J. Environ. Chem. Eng. 2019, 7, 103279. [Google Scholar] [CrossRef]
- Wang, S.; Huang, X.; Zhang, Y.; Yin, C.; Richel, A. The effect of corn straw return on corn production in Northeast China: An integrated regional evaluation with meta-analysis and system dynamics. Resour. Conserv. Recycl. 2021, 167, 105402. [Google Scholar] [CrossRef]
- Yang, X.; Cheng, L.; Huang, X.; Zhang, Y.; Yin, C.; Lebailly, P. Incentive mechanism to promote corn stalk return sustainably in Henan, China. Sci. Total Environ. 2020, 738, 139775. [Google Scholar] [CrossRef]
- Vassilev, S.V.; Vassileva, C.G.; Vassilev, V.S. Advantages and disadvantages of composition and properties of biomass in comparison with coal: An overview. Fuel 2015, 158, 330–350. [Google Scholar] [CrossRef]
- Li, G.; Ji, F.; Bai, X.; Zhou, Y.; Dong, R.; Huang, Z. Comparative study on thermal cracking characteristics and bio-oil production from different microalgae using Py-GC/MS. Int. J. Agric. Biol. Eng. 2019, 12, 208–213. [Google Scholar] [CrossRef]
- Ajay, K.M.; Dinesh, M.N.; Byatarayappa, G.; Radhika, M.G.; Kathyayini, N.; Vijeth, H. Electrochemical investigations on low cost KOH activated carbon derived from orange-peel and polyaniline for hybrid supercapacitors. Inorg. Chem. Commun. 2021, 127, 108523. [Google Scholar] [CrossRef]
- Han, Z.; Yu, H.; Li, C.; Zhou, S. Mulch-assisted ambient-air synthesis of oxygen-rich activated carbon for hydrogen storage: A combined experimental and theoretical case study. Appl. Surf. Sci. 2021, 544, 148963. [Google Scholar] [CrossRef]
- Juan, Z.; Kaixuan, F.; Pingping, W.; Yue, Z.; Yongke, Z. Enhancement of the adsorption of bilirubin on activated carbon via modification. Results Mater. 2021, 9, 100172. [Google Scholar] [CrossRef]
- Narvekar, A.A.; Fernandes, J.B.; Naik, S.P.; Tilve, S.G. Development of glycerol based carbon having enhanced surface area and capacitance obtained by KOH induced thermochemical activation. Mater. Chem. Phys. 2021, 261, 124238. [Google Scholar] [CrossRef]
- Li, G.; Bai, X.; Huo, S.; Huang, Z. Fast pyrolysis of LERDADEs for renewable biofuels. IET Renew. Power Gener. 2020, 14, 959–967. [Google Scholar] [CrossRef]
- Li, G.; Lu, Z.; Zhang, J.; Li, H.; Zhou, Y.; Mohammed Ibrahim Zayan, A.; Huang, Z. Life cycle assessment of biofuel production from microalgae cultivated in anaerobic digested wastewater. Int. J. Agric. Biol. Eng. 2020, 13, 241–246. [Google Scholar] [CrossRef] [Green Version]
- Shrestha, R.; Ban, S.; Devkota, S.; Sharma, S.; Joshi, R.; Tiwari, A.P.; Kim, H.Y.; Joshi, M.K. Technological trends in heavy metals removal from industrial wastewater: A review. J. Environ. Chem. Eng. 2021, 9, 105688. [Google Scholar] [CrossRef]
- Yumak, T. Surface characteristics and electrochemical properties of activated carbon obtained from different parts of Pinus pinaster. Colloids Surf. A Physicochem. Eng. Asp. 2021, 625, 126982. [Google Scholar] [CrossRef]
- Feng, C.; Chen, Y.-A.; Yu, C.-P.; Hou, C.-H. Highly porous activated carbon with multi-channeled structure derived from loofa sponge as a capacitive electrode material for the deionization of brackish water. Chemosphere 2018, 208, 285–293. [Google Scholar] [CrossRef] [PubMed]
- Sun, Y.; Zhang, Z.Z.; Sun, Y.M.; Yang, G.X. One-pot pyrolysis route to Fe-N-Doped carbon nanosheets with outstanding electrochemical performance as cathode materials for microbial fuel cell. Int. J. Agric. Biol. Eng. 2020, 13, 207–214. [Google Scholar] [CrossRef]
- Oginni, O.; Singh, K.; Oporto, G.; Dawson-Andoh, B.; McDonald, L.; Sabolsky, E. Influence of one-step and two-step KOH activation on activated carbon characteristics. Bioresour. Technol. Rep. 2019, 7, 100266. [Google Scholar] [CrossRef]
- Sajjadi, S.-A.; Mohammadzadeh, A.; Tran, H.N.; Anastopoulos, I.; Dotto, G.L.; Lopičić, Z.R.; Sivamani, S.; Rahmani-Sani, A.; Ivanets, A.; Hosseini-Bandegharaei, A. Efficient mercury removal from wastewater by pistachio wood wastes-derived activated carbon prepared by chemical activation using a novel activating agent. J. Environ. Manag. 2018, 223, 1001–1009. [Google Scholar] [CrossRef] [PubMed]
- Hsu, C.-J.; Xiao, Y.-Z.; Hsi, H.-C. Simultaneous aqueous Hg(II) adsorption and gaseous Hg0 re-emission inhibition from SFGD wastewater by using Cu and S co-impregnated activated carbon. Chemosphere 2021, 263, 127966. [Google Scholar] [CrossRef] [PubMed]
- Yagmur, E.; Gokce, Y.; Tekin, S.; Semerci, N.I.; Aktas, Z. Characteristics and comparison of activated carbons prepared from oleaster (Elaeagnus angustifolia L.) fruit using KOH and ZnCl2. Fuel 2020, 267, 117232. [Google Scholar] [CrossRef]
- Zakaria, R.; Jamalluddin, N.A.; Abu Bakar, M.Z. Effect of impregnation ratio and activation temperature on the yield and adsorption performance of mangrove based activated carbon for methylene blue removal. Results Mater. 2021, 10, 100183. [Google Scholar] [CrossRef]
- Medhat, A.; El-Maghrabi, H.H.; Abdelghany, A.; Abdel Menem, N.M.; Raynaud, P.; Moustafa, Y.M.; Elsayed, M.A.; Nada, A.A. Efficiently activated carbons from corn cob for methylene blue adsorption. Appl. Surf. Sci. Adv. 2021, 3, 100037. [Google Scholar] [CrossRef]
- Kharrazi, S.M.; Soleimani, M.; Jokar, M.; Richards, T.; Pettersson, A.; Mirghaffari, N. Pretreatment of lignocellulosic waste as a precursor for synthesis of high porous activated carbon and its application for Pb (II) and Cr (VI) adsorption from aqueous solutions. Int. J. Biol. Macromol. 2021, 180, 299–310. [Google Scholar] [CrossRef]
- Tran, T.H.; Le, H.H.; Pham, T.H.; Nguyen, D.T.; La, D.D.; Chang, S.W.; Lee, S.M.; Chung, W.J.; Nguyen, D.D. Comparative study on methylene blue adsorption behavior of coffee husk-derived activated carbon materials prepared using hydrothermal and soaking methods. J. Environ. Chem. Eng. 2021, 9, 105362. [Google Scholar] [CrossRef]
- Kharrazi, S.M.; Mirghaffari, N.; Dastgerdi, M.M.; Soleimani, M. A novel post-modification of powdered activated carbon prepared from lignocellulosic waste through thermal tension treatment to enhance the porosity and heavy metals adsorption. Powder Technol. 2020, 366, 358–368. [Google Scholar] [CrossRef]
- Wang, J.; Lei, S.; Liang, L. Preparation of porous activated carbon from semi-coke by high temperature activation with KOH for the high-efficiency adsorption of aqueous tetracycline. Appl. Surf. Sci. 2020, 530, 147187. [Google Scholar] [CrossRef]
- Cheng, H.; Ye, G.; Wang, X.; Su, C.; Zhang, W.; Yao, F.; Wang, Y.; Jiao, Y.; Huang, H.; Ye, D. Micro-mesoporous carbon fabricated by Phanerochaete chrysosporium pretreatment coupling with chemical activation: Promoting effect and toluene adsorption performance. J. Environ. Chem. Eng. 2021, 9, 105054. [Google Scholar] [CrossRef]
- Su, C.; Guo, Y.; Yu, L.; Zou, J.; Zeng, Z.; Li, L. Insight into specific surface area, microporosity and N, P co-doping of porous carbon materials in the acetone adsorption. Mater. Chem. Phys. 2021, 258, 123930. [Google Scholar] [CrossRef]
- Altalhi, A.A.; Mohammed, E.A.; Morsy, S.S.M.; Negm, N.A.; Farag, A.A. Catalyzed production of different grade biofuels using metal ions modified activated carbon of cellulosic wastes. Fuel 2021, 295, 120646. [Google Scholar] [CrossRef]
- Sellaoui, L.; Silva, L.F.O.; Badawi, M.; Ali, J.; Favarin, N.; Dotto, G.L.; Erto, A.; Chen, Z. Adsorption of ketoprofen and 2- nitrophenol on activated carbon prepared from winery wastes: A combined experimental and theoretical study. J. Mol. Liq. 2021, 333, 115906. [Google Scholar] [CrossRef]
- Hadavifar, M.; Bahramifar, N.; Younesi, H.; Li, Q. Adsorption of mercury ions from synthetic and real wastewater aqueous solution by functionalized multi-walled carbon nanotube with both amino and thiolated groups. Chem. Eng. J. 2014, 237, 217–228. [Google Scholar] [CrossRef] [Green Version]
- Kazemi, F.; Younesi, H.; Ghoreyshi, A.A.; Bahramifar, N.; Heidari, A. Thiol-incorporated activated carbon derived from fir wood sawdust as an efficient adsorbent for the removal of mercury ion: Batch and fixed-bed column studies. Process Saf. Environ. Prot. 2016, 100, 22–35. [Google Scholar] [CrossRef]
- Asasian, N.; Kaghazchi, T.; Soleimani, M. Elimination of mercury by adsorption onto activated carbon prepared from the biomass material. J. Ind. Eng. Chem. 2012, 18, 283–289. [Google Scholar] [CrossRef]
Figure 1.
Influence of activation temperature (a), alkali-carbon ratio (b), activation time (c) on mercury ion adsorption.
Figure 1.
Influence of activation temperature (a), alkali-carbon ratio (b), activation time (c) on mercury ion adsorption.

Figure 2.
Influence of KMnO4 concentration on mercury ion adsorption.

Figure 3.
Effect of adsorption time (a), pH (b), adsorbent dosage (c), initial concentration (d), single ion interference (e,f), multiple ion interference (g) on the adsorption capacity and removal rate.
Figure 3.
Effect of adsorption time (a), pH (b), adsorbent dosage (c), initial concentration (d), single ion interference (e,f), multiple ion interference (g) on the adsorption capacity and removal rate.

Figure 4.
Pseudo-first-order model (a), pseudo-second-order model (b), Elovich model (c), and intraparticle diffusion model (d) for mercury ion adsorption on CCAC, CKAC.
Figure 4.
Pseudo-first-order model (a), pseudo-second-order model (b), Elovich model (c), and intraparticle diffusion model (d) for mercury ion adsorption on CCAC, CKAC.

Figure 5.
Langmuir, Freundlich isotherm model for mercury ion adsorption on CCAC, CKAC.

Figure 6.
Scanning electron microscope (SEM) image of corn cob carbon (CCC) (a), CCAC (b), CKAC (c), CCAC after adsorption of mercury ions (d), CKAC after adsorption of mercury ions (e).
Figure 6.
Scanning electron microscope (SEM) image of corn cob carbon (CCC) (a), CCAC (b), CKAC (c), CCAC after adsorption of mercury ions (d), CKAC after adsorption of mercury ions (e).

Figure 7.
Energy-dispersive X-ray spectroscopy (EDS (image of CCC (a), CCAC (b), CKAC (c), CCAC after adsorption of mercury ions (d), CKAC after adsorption of mercury ions (e).
Figure 7.
Energy-dispersive X-ray spectroscopy (EDS (image of CCC (a), CCAC (b), CKAC (c), CCAC after adsorption of mercury ions (d), CKAC after adsorption of mercury ions (e).

Figure 8.
Nitrogen adsorption−desorption isotherm (a), Fourier transform infrared (FTIR) spectra (b), Zeta potential (c) of corn cob activated carbon before and after modification and before and after adsorption.
Figure 8.
Nitrogen adsorption−desorption isotherm (a), Fourier transform infrared (FTIR) spectra (b), Zeta potential (c) of corn cob activated carbon before and after modification and before and after adsorption.


Figure 9.
X-ray photoelectron spectroscopy (XPS) spectra of survey (a), C 1s (b), O 1s (c) of CCC, CCAC, CKAC.
Figure 9.
X-ray photoelectron spectroscopy (XPS) spectra of survey (a), C 1s (b), O 1s (c) of CCC, CCAC, CKAC.


Figure 10.
XPS spectra of survey (a), C 1s (b), O 1s (c), Hg 4f (d) of CCAC, CKAC after adsorption of mercury ions.
Figure 10.
XPS spectra of survey (a), C 1s (b), O 1s (c), Hg 4f (d) of CCAC, CKAC after adsorption of mercury ions.


Table 1.
Orthogonal experimental results of corn cob activated carbon (CCAC) modified by potassium hydroxide.
Table 1.
Orthogonal experimental results of corn cob activated carbon (CCAC) modified by potassium hydroxide.
| Activation Time (h) | Activation Temperature (°C) | Alkali-Carbon Ratio | Adsorption Capacity (mg/g) | Specific Surface Area (m2/g) | |
|---|---|---|---|---|---|
| A | B | C | |||
| 1 | 1 | 750 | 1.5:1 | 104.61 | 1539.76 |
| 2 | 1 | 800 | 2.0:1 | 168.21 | 1927.48 |
| 3 | 1 | 850 | 2.5:1 | 54.48 | 1567.00 |
| 4 | 1.5 | 850 | 1.5:1 | 140.22 | 1753.69 |
| 5 | 1.5 | 750 | 2.0:1 | 60.69 | 1910.83 |
| 6 | 1.5 | 800 | 2.5:1 | 126.22 | 2551.00 |
| 7 | 2 | 800 | 1.5:1 | 61.96 | 1831.84 |
| 8 | 2 | 850 | 2.0:1 | 89.17 | 1993.16 |
| 9 | 2 | 750 | 2.5:1 | 183.36 | 2509.61 |
Table 2.
Extreme value analysis of CCAC modified by potassium hydroxide.
| Adsorption Capacity (mg/g) | Specific Surface Area (m2/g) | |||||
|---|---|---|---|---|---|---|
| A | B | C | A | B | C | |
| K1 | 327.30 | 348.66 | 306.79 | 5034.24 | 5960.20 | 5125.29 |
| K2 | 327.13 | 356.39 | 318.07 | 6215.52 | 6310.32 | 5831.47 |
| K3 | 334.49 | 283.87 | 364.06 | 6334.61 | 5313.85 | 6627.61 |
| k′1 | 109.10 | 116.22 | 102.26 | 1678.08 | 1986.73 | 1708.43 |
| k′2 | 109.04 | 118.80 | 106.02 | 2071.84 | 2103.44 | 1943.82 |
| k′3 | 111.50 | 94.62 | 121.35 | 2111.54 | 1771.28 | 2209.20 |
| R | 2.45 | 24.17 | 19.09 | 433.46 | 332.16 | 500.77 |
Table 3.
The fitting parameters of adsorption kinetics.
| Model | Parameter | Value | |
|---|---|---|---|
| CCAC | CKAC | ||
| pseudo-first-order | k1 (min−1) | 0.013 | 0.019 |
| qe (mg/g) | 110.03 | 61.94 | |
| R2 | 0.8838 | 0.8956 | |
| pseudo-second-order | k2 (g/(mg·min)) | 0.00013 | 0.00029 |
| qe (mg/g) | 208.77 | 235.77 | |
| R2 | 0.9917 | 0.9908 | |
| Elovich | α (g/(mg·min)) | −59.39 | 4.05 |
| β (mg/g) | 44.79 | 42.18 | |
| R2 | 0.9269 | 0.6494 | |
| intra-particle diffusion | kid (mg/(g·min−1/2)) | 8.85 | 7.46 |
| R2 | 0.7946 | 0.4130 | |
Table 4.
The fitting parameters of the adsorption isotherm.
| Model | Parameter | Value | |
|---|---|---|---|
| CCAC | CKAC | ||
| Langmuir | KL (L/mg) | 0.05 | 0.06 |
| qm (mg/g) | 175.88 | 227.32 | |
| R2 | 0.9939 | 0.9781 | |
| Freundlich | KF (mg/g) | 82.67 | 90.54 |
| 1/n | 0.21 | 0.29 | |
| R2 | 0.7403 | 0.6502 | |
Table 5.
The BET parameters of activated carbon.
| Sample | SBET (m2/g) | Smic (m2/g) | Vtot (cm3/g) | Vmic (cm3/g) | Vmic/Vtot (%) |
|---|---|---|---|---|---|
| CCC | 11.16 | 10.08 | 0.003 | 0.0002 | 6.67% |
| CCAC | 2797.75 | 2551.15 | 1.36 | 1.16 | 85.29% |
| CKAC | 1212.93 | 360.71 | 0.59 | 0.16 | 27.12% |
| CCAC after adsorption | 2379.15 | 334.87 | 1.20 | 0.14 | 11.67% |
| CKAC after adsorption | 893.03 | 203.75 | 0.49 | 0.13 | 26.53% |
Table 6.
Adsorption capacity of different adsorbents.
| Adsorbent | Surface Area (m2/g) | m/Vadsorbant (g/L) | pH | qm (mg/g) | Reference |
|---|---|---|---|---|---|
| Modified multiwall carbon nanotube | - | 0.4 | 6 | 84.66 | [35] |
| Thiol-incorporated activated carbon-based fir wood | 1162 | 0.5 | 6 | 129 | [36] |
| Mix-ZC activated carbon | 1492.4 | 2 | 8 | 147.1 | [37] |
| pistachio wood wastes activated carbon | 1448 | 2.5 | 7 | 201.09 | [22] |
| KOH modified corn cob activated carbon | 2797.75 | 0.4 | 4 | 184.76 | this study |
| KMnO4 modified corn cob activated carbon | 1212.93 | 0.4 | 3 | 222.22 | this study |
Publisher’s Note: MDPI stays neutral with regard to jurisdictional claims in published maps and institutional affiliations. |
© 2021 by the authors. Licensee MDPI, Basel, Switzerland. This article is an open access article distributed under the terms and conditions of the Creative Commons Attribution (CC BY) license (https://creativecommons.org/licenses/by/4.0/).
Share and Cite
MDPI and ACS Style
Liu, Y.; Xu, X.; Qu, B.; Liu, X.; Yi, W.; Zhang, H. Study on Adsorption Properties of Modified Corn Cob Activated Carbon for Mercury Ion. Energies 2021, 14, 4483. https://0-doi-org.brum.beds.ac.uk/10.3390/en14154483
AMA Style
Liu Y, Xu X, Qu B, Liu X, Yi W, Zhang H. Study on Adsorption Properties of Modified Corn Cob Activated Carbon for Mercury Ion. Energies. 2021; 14(15):4483. https://0-doi-org.brum.beds.ac.uk/10.3390/en14154483
Chicago/Turabian StyleLiu, Yuyingnan, Xinrui Xu, Bin Qu, Xiaofeng Liu, Weiming Yi, and Hongqiong Zhang. 2021. "Study on Adsorption Properties of Modified Corn Cob Activated Carbon for Mercury Ion" Energies 14, no. 15: 4483. https://0-doi-org.brum.beds.ac.uk/10.3390/en14154483
Note that from the first issue of 2016, this journal uses article numbers instead of page numbers. See further details here.