Article

Bio-Crude Production Improvement during Hydrothermal Liquefaction of Biopulp by Simultaneous Application of Alkali Catalysts and Aqueous Phase Recirculation

by
Komeil Kohansal
1,
Kamaldeep Sharma
1,
Saqib Sohail Toor
1,
Eliana Lozano Sanchez
1,
Joscha Zimmermann
2,
Lasse Aistrup Rosendahl
1 and
Thomas Helmer Pedersen
1,*
1
Department of Energy Technology, Aalborg University, Pontoppidanstræde 111, 9220 Aalborg, Denmark
2
Institute of Catalysis Research and Technology (IKFT), Karlsruhe Institute of Technology (KIT), Hermann-von-Helmholtz-Platz 1, 76344 Eggenstein-Leopoldshafen, Germany
*
Author to whom correspondence should be addressed.
Submission received: 9 July 2021 / Revised: 20 July 2021 / Accepted: 23 July 2021 / Published: 25 July 2021
(This article belongs to the Special Issue HTL Biocrude Production, Optimization, and Upgrading)

Abstract

:
This study focuses on the valorization of the organic fraction of municipal solid waste (biopulp) by hydrothermal liquefaction. Thereby, homogeneous alkali catalysts (KOH, NaOH, K2CO3, and Na2CO3) and a residual aqueous phase recirculation methodology were mutually employed to enhance the bio-crude yield and energy efficiency of a sub-critical hydrothermal conversion (350 °C, 15–20 Mpa, 15 min). Interestingly, single recirculation of the concentrated aqueous phase positively increased the bio-crude yield in all cases, while the higher heating value (HHV) of the bio-crudes slightly dropped. Compared to the non-catalytic experiment, K2CO3 and Na2CO3 effectively increased the bio-crude yield by 14 and 7.3%, respectively. However, KOH and NaOH showed a negative variation in the bio-crude yield. The highest bio-crude yield (37.5 wt.%) and energy recovery (ER) (59.4%) were achieved when K2CO3 and concentrated aqueous phase recirculation were simultaneously applied to the process. The inorganics distribution results obtained by ICP reveal the tendency of the alkali elements to settle into the aqueous phase, which, if recovered, can potentially boost the circularity of the HTL process. Therefore, wise selection of the alkali catalyst along with aqueous phase recirculation assists hydrothermal liquefaction in green biofuel production and environmentally friendly valorization of biopulp.

1. Introduction

In recent decades, urbanization and increasing population density in urban areas have resulted in a surge in municipal solid waste (MSW) generation [1]. Whereas the nowadays global MSW production capacity is approximately 2.01 billion tons per year (2016), predicted by the World Bank Group, this number is estimated to increase further by 70% to 3.40 billion metric tons by 2030 [2,3,4]. On the other hand, waste treatment facilities have not progressed at the same pace, and henceforth their lack of capacity can lead to catastrophic environmental issues. Depending on the region, around 28–58% of the produced MSW by most countries consists of organic waste [5]. Thus far, this type of residue has been viewed as the bothersome part of MSW that can hamper the usage of recycling technologies, but, at the same time, it represents a sustainable source of carbon exploitable for liquid fuels and nutrients for agriculture. The organic fraction of MSW contains a considerable moisture content, making valorization techniques such as incineration cost-prohibitive. Moreover, being exposed to non-biodegradable materials such as polymers, it is often contaminated by a significant amount of macro- and microplastics that can inevitably restrict the landfilling applications [6]. Thus far, composting has been employed to treat the organic fraction of MSW; however, low energy recovery (ER) rates as well as the increased risk of microplastic contamination are the major drawbacks of this technology [7]. Nonetheless, its potential for the production of biofuels and value-added products should not be neglected. Therefore, an effective and seamless system capable of valorizing the residual fraction into a drop-in fuel with a minimum negative impact on the ecosystem is highly demanded.
As a newly oriented technique, the “Ecogi” process can effectively terminate the emerged consequences of incorporating non-biodegradable substances with the organic fraction of MSW [8]. Ecogi, as a mechanical pretreatment facility, is able to segregate the organic fraction of household sorted MSW, resulting in a homogeneous paste called “biopulp” and a reject fraction mainly composed of non-biodegradables. The non-biodegradable materials are then sent to the recycling facilities, while the sorted organic slurry can potentially be applied to various biological, chemical, and thermochemical technologies [1,9]. Among them, hydrothermal liquefaction (HTL) has been proven as a promising technology generating advanced biofuels regardless of the moisture content of the biomass [10]. As a thermochemical technique, HTL offers a value-added bio-product with more than 75% of the heating value compared to conventional petroleum (HHV: 32 to 38 MJ/kg) and a relatively low oxygen content [11,12,13]. Sub-critical HTL can hydrothermally convert bio-polymeric structures to hydrophobic compounds at 280–370 °C and 10 to 35 MPa [14,15]. This operational condition lowers the water dielectric constant and generates H+ and OH-, which highlights the role of water as a suitable solvent and catalyst simultaneously [16]. Therefore, the integration of Ecogi and HTL processes potentially guarantees the sustainability of the low-cost feedstock and facilitates a circular economy by valorizing organic waste to bio-crude, having a high carbon efficiency and ER. Despite the advantages, HTL technology still possesses some bottlenecks, namely, low yields of bio-crude, high loading of valuable light water-soluble organics, and hazardous inorganic substances in the aqueous phase [17]. In this regard, several pathways have been suggested such as the utilization of homogeneous catalysts as well as aqueous phase recirculation [18,19,20,21,22].
Previously, homogeneous catalysts have widely been used for the valorization of different biomasses due to their potential impact on the bio-crude quantity and quality. Jindal and Jha et al. [20] investigated catalytic sub-critical HTL (280 °C) in which different alkali catalysts were introduced to the reactor. Thereby, K2CO3 demonstrated the highest efficiency for the production of bio-crude (34.9 wt.%). Posmanik et al. [23] evaluated the effect of an acidic (H3PO4) and a basic (NaOH) homogeneous catalyst on HTL of a carbohydrate-rich food waste and dairy manure digestate at 300 °C for 60 min. It has been revealed that, unlike manure, utilization of an alkali catalyst decreases the bio-crude yield obtained from HTL of food waste. Additionally, it has been asserted that the structural differences between feedstocks may govern the catalytic reaction pathways. As a feedstock-flexible technology, HTL is highly dependent on the chemical and biochemical features of each biomass as they affect the physical, chemical, and thermochemical properties of bio-crude. Being a protein and lipid-rich biomass, the effect of different alkali catalysts on the HTL process of biopulp or its counterparts has barely been discussed. However, the selectivity and specific role of alkali catalysts while operating the catalytic HTL of the organic fraction of MSW are still unknown.
As a co-product of the HTL process, the organic and nutrient-loaded aqueous phase is among the challenges that have not been addressed appropriately, particularly while treating wet biomass. Depending on the feedstock type, the aqueous phase contains a considerable amount of water-soluble organics and inorganics, amplifying substantial downstream water treatment requirements. Recently, some researchers have reported aqueous phase recirculation as an advantageous method to recapture the hydrophilic light organics and enhance the economy of the process by reducing the need for effluent water treatment. Klemmer et al. [21] investigated the effect of aqueous phase recirculation in continuous sub-critical HTL. A remarkable improvement in bio-crude yield was reported, noticeably after the first recirculation run, whereas the HHV of the product was reduced. Deniel et al. [22] studied the HTL of blackcurrant pomace, where the contaminated aqueous phase was recirculated in a consecutive set of experiments. As a result, the bio-crude yield enhancement dominated the HHV drop, leading to a significant improvement in ER. Avoiding the dry matter content variation, aqueous phase recirculation has usually been conducted during the hydrothermal treatment of dried biomass that clouds the commercial processability, owing to a required strict pre-drying procedure. Furthermore, alkali catalysts and aqueous phase recirculation have mainly been studied individually, and there is no study considering both factors and their interaction. Thus, the impact of alkali catalysts on HTL products during aqueous phase recirculation is still undiscovered. Pedersen et al. [24] aimed at a glycerol-assisted hydrothermal treatment of aspen wood in supercritical water conditions assisted by an alkali catalyst and aqueous phase recirculation. However, due to the significant bio-crude yield variation throughout different mass balances, the effect of aqueous phase recirculation was not identified. Moreover, the affinity of alkali elements in being recycled along with the water phase caused a substantial load of inorganics in the resulting bio-products. Therefore, aqueous phase recirculation might enhance not only the bio-crude production efficiency but also alkali element recovery, which, overall, could have a significant impact on attaining a circular economy, and on resource recycling.
This study, at the first stage, investigated the role of different alkali catalysts in controlling the yield and quality of all HTL products. Secondly, it demonstrates a novel and practical pathway to recirculate the residual HTL aqueous phase by-product while treating the wet biomass to enhance the carbon efficiency and ER. Thirdly, the simultaneous effect of the concentrated aqueous phase recirculation and different alkali catalysts on the bio-liquids was investigated. Thereafter, different properties of the HTL products, including the inorganic element distribution, were thoroughly studied to monitor the possibility of recovering the homogeneous alkali catalysts. Finally, the trade-off between utilizing alkali catalysts and aqueous phase recirculation was economically assessed to explore the potential of the suggested methods for large-scale industrial application in the coming future.

2. Materials and Methods

2.1. Feedstock Characterization

The pretreated MSW (biopulp) was collected from Gemidan Ecogi A/S (Hjallerup, Denmark). The source segregated organic fraction of MSW, obtained from households, was initially mechanically treated (Ecogi process) [8]. All the alkali catalysts including potassium carbonate (K2CO3), sodium carbonate (Na2CO3), potassium hydroxide (KOH), and sodium hydroxide (NaOH) (all ≥99% purity) were supplied by Sigma-Aldrich (Saint Louis, MO, USA). DCM was chosen as the extractor solvent (99.9% purity) and purchased from VWR.
The ash content of the biomass was determined via an electric muffle furnace (Protherm Furnaces, Ankara, Turkey), in which 1 g of the dried biomass was placed in a porcelain crucible and held at 775 °C for 3 h under atmospheric conditions, complying with ASTM-D482. The calorific value of the biomass was estimated through a bomb calorimeter instrument (IKA 2000, Staufen im Breisgau, Germany) following ASTM-D482. The moisture content (MC) was determined through a Kern (Frankfurt am Main, Germany) MLS moisture analyzer at 120 °C (around 45 min). Furthermore, fixed carbon (FC) and volatile matter (VM) were analyzed using thermogravimetric analysis (TGA) equipped with a simultaneous thermal analyzer (STA) (PerkinElmer, Waltham, MA, USA). By doing so, 0.1 g of the sample was thermally degraded (25 to 775 °C, 75 min) under an inert atmosphere (N2) at 10 K/min. A CHNS analyzer instrument (Perkin Elmer, 2400 Series II- ASTM D5291) operating in CHN mode was employed to perform the elemental analysis of the biomass. The instrument calibration was performed using acetanilide (Sigma Aldrich, puriss. p.a., ≥99.5%) as the standard. In order to detect the concentration of each inorganic element in the biomass, an inductively coupled plasma atomic emission spectroscopy (ICP-AES) technique was utilized according to the procedure that is comprehensively elaborated elsewhere [25]. The biochemical analysis of the biomass was carried out by employing a Soxhlet extraction of crude fats (CF) at the first step. After operating the petroleum ether-aided Soxhlet extraction for 24 h, the lipid content of the biopulp was determined. Afterward, the crude protein (CP) content was calculated by multiplication of the nitrogen content of the biomass (obtained from the elemental analysis) by a 6.25 factor [26]. The carbohydrate content of the biomass was derived from Equation (1), in which the combustibles are destined as the summation of FC and VM. The identification of different constituents of the carbohydrate is out of the scope of this study.
Carbohydrate (%) = Combustibles (%) − (CF + CP) (%)

2.2. HTL Procedure

The HTL experiments were performed in two parallel operating 12 cm3 stainless steel reactors. Micro-batch HTL reactors ensure the flexibility of the process and ease conducting the screening experiments in comparison to large-sized macro- and pilot-scale reactors. In the first cycle, the reactors were operated simultaneously to duplicate each experiment. However, due to the limited quantity of the concentrated aqueous phase, the second cycle experiments were carried out in a single reactor. In a typical non-catalytic experiment, each reactor was charged with 8 g of the biopulp (around 1.22 g of dry ash-free matter), whereas in the catalytic experiments, 2 wt.% (wet basis, approximately 10 wt.% dry basis) of the catalyst was added to the reactor as well [27]. The residual oxygen was then vented out by purging around 2 MPa of inert gas (N2—99.9% of purity), and the reactors were fully sealed. The sealed reactors were then connected to a mechanical agitator and submerged into a preheated silica-free sand bath (SBL-2D, Techne, Minneapolis, MN, USA) and held at 350 °C (15–20 Mpa) [28]. The mechanical agitator uniformly mixed the reactor contents by a frequency of 450 min−1 for 15 min. Afterward, the reactors were quenched in an ambient temperature water bath.
The primary steps involved in the HTL product discharge are demonstrated in Figure S1. The total weight of the produced gases was calculated by weighing the reactor before and after gas sampling and venting off. Afterward, the aqueous phase, along with traces of the solid residue, was poured into a vial without the intervention of any solvent. As reported by Watson et al. [29], dichloromethane (DCM) associates with high ER and low energy consumption ratios when extracting HTL-obtained products, regardless of the feedstock. Thus, the extraction of the bio-crude phase was carried out using around 25 cm3 of DCM, by which the micro-batch reactors were carefully rinsed. Thereafter, the aqueous phase was filtered through a 5–13 µm filter paper. Using the same filter paper, the solid–oil–DCM mixture was filtered as well. The filtered solid phase was then dried at 105 °C for 24 h. The filtered mixture was poured into a separating funnel, and then we let the residual water phase be gravitationally separated. Finally, the bio-crude–solvent mixture was transferred to a Büchi R210 vacuum rotary evaporator (New Castle, DE, USA) operating at 60 °C under 50 KPa pressure for 30 min. All products were stored adequately for further analyses.
To maintain the moisture content of the aqueous phase as the initial slurry (83.1 wt.%) during the operation of the second cycles, the aqueous phase derived from the first HTL cycle (both reactors) was concentrated using the vacuum rotary evaporator (Büchi R210) at 65 °C with a gradual decrement in the pressure to 6 KPa. The reason behind the stepwise reduction in the pressure was to avoid the emergence of a thick foam layer, probably caused by the abundance of the volatile nitrogenous compounds (e.g., ammonia), which could thoroughly interrupt the evaporation of water. Hereupon, the issue was accordingly addressed by adding 0.05 g of n-Octanol as an anti-foaming agent to the aqueous phase sample under evaporation. Afterward, while loading the reactors, 1 g of the biomass was replaced with the same amount of concentrated (named concentrate) aqueous phase (concentrate to biomass ratio of 1:7 on wet basis). The second cycle HTL operation was carried out following the aforementioned procedure.

2.3. Product Characterization

The boiling point distribution of the bio-crude samples was estimated by thermogravimetric analysis using a DSC/TGA system (SDT 650, Discovery, New York, NY, USA). The instrument was set to increase the temperature to 775 °C at 10 K/min, isothermally heating at 775 °C for 30 min under a N2 atmosphere [30]. By this means, the moisture, FC, and VM of the bio-crude samples were evaluated. The elemental compositions of the individual solid residues and bio-crudes were investigated via an elemental analyzer (Perkin Elmer, 2400 Series II, CHNS/O) following ASTM D5291 (operating in CHN mode). Carbon, hydrogen, and nitrogen were directly measured, whereas the oxygen content was calculated using Equation (2). To report the results, the measured values were then normalized.
O (wt.%) = 100 − (C + H + N) (wt.%) − Ash (wt.%)
Due to the limited quantity, the HHV of bio-crude and solid residue samples was measured through Equation (3) [31].
HHVdaf (MJ/kg) = (0.335) C + (1.423) H − (0.154) O − (0.145) N
The chemical composition of the first and second cycle bio-crudes was investigated through a Varian gas chromatograph-mass spectrometer (GC-MS) (Thermo Scentific, Waltham, MA, USA, Trace 1300 and ISQ-ID, respectively) equipped with a CP-9036 capillary column following a procedure reported elsewhere [32]. The separated organic compounds were identified using the NIST database. The water content of the concentrated aqueous phase samples was measured using a Karl Fischer titration (Titroline 7500 KF) instrument. Total organic carbon (TOC) and total nitrogen (TN) were, respectively, identified using LCK386 and LCK138 reagent vials co-operating with a spectrophotometer (Hach and Lange, Loveland, CO, USA, DE3900). Moreover, the pH of each sample was determined with a pH meter (WTW 3210). All the gas samples were assessed in terms of composition utilizing a GC-2010 gas chromatograph (Shimadzu Inc., Kyoto, Japan) and a barrier ionization discharge detector (GC-BID) concerning the ASTM-4128 procedure. Similarly, the inorganic concentration of the aqueous phase and the solid residue was assessed through the aforementioned ICP instrument following the same procedure. The equations to calculate bio-crude and solid residue production yield and ER, carbon, and nitrogen recoveries (ER, CR, and NR, respectively) are shown below [33,34]. WP, WF, HHVP, HHVF, CR, NR, CP, and NP stand for product weight, feedstock weight, product higher heating value (HHV), feedstock HHV, carbon recovery, nitrogen recovery, carbon percentage in product, and nitrogen percentage in product, respectively. WCAq.p and WNAq.p represent the weight of carbon in the aqueous phase, and the weight of nitrogen in the aqueous phase.
Production   yield   ( % ) = W P W F × 100
ER   ( % ) = HHV P HHV F × biocrude   yield
CR   ( % ) = C P W P C F W F + WC Aq . p × 100
NR   ( % ) = N P W P N F W F + WN Aq . p × 100
WC Aq . p   ( g ) = TOC   ( kg m 3 ) × Aqueous   phase   ( m 3 )

2.4. Financial Evaluation Method

The minimum fuel selling price (MFSP) was estimated for four different scenarios that evaluate the impact of adding a catalyst (K2CO3) and incorporating recirculation of the concentrated aqueous phase, separately and combined, in comparison to the base case without a catalyst or recirculation. It should be noted that due to the lab-scale experimental data, the estimated MFSP might not be accurate. Hence, this section merely analogizes the effect of the above-mentioned methods on the economy of the process. The evaluation was performed for a plant size of 100 dry tons/day using a total installed cost of USD 22 million for the HTL plant without aqueous phase treatment, assuming an identical cost to that reported for a sewage sludge plant of this size in [35]. This value was updated to 2018 euros using the Chemical Engineering Plant Cost Index (CEPCI) and a factor of 0.85 EUR/USD. The total capital investment was estimated based on this value using the SCENT methodology described by De jong et al., and the same CAPEX was used for the four scenarios [36]. In the scenarios with recirculation, the cost of evaporation was included as an addition to the OPEX, using a cost of 2 EUR/m3 based on the estimates for mechanical vapor recompression reported in [37]. The fixed operational costs correspond to 8% of the fixed capital investment.
Regarding the variable OPEX, the prices of the pretreated MSW (biopulp) and the catalyst were 130 DKK/wet ton and 15.5 DKK/kg (converted to euros using a factor of 0.13 EUR/DKK), respectively. The cost for the final disposal of the HTL solids and the aqueous phase was assumed at 133 EUR/ton and 4.2 EUR/m3, respectively, when no recirculation was performed. In the scenarios with recirculation, the overall cost of aqueous phase treatment increased to 6 EUR/m3 based on the evaporation cost explained before. The cost of utilities was estimated based on the energy balance of the base case following the procedure described in [38], with electricity costs of 47 EUR/MWh and 50 EUR/MWh for heating. The MFSP was estimated by means of present value analysis (NPV) with a 10% discount rate, straight line depreciation, and a project lifetime of 25 years.

3. Results

3.1. Feedstock Characterization

Table 1 indicates the ultimate, proximate, and biochemical composition of the biopulp. Containing more than 19.2% of crude fats along with 49.3% of carbohydrates, biopulp can potentially be considered as a promising biomass in HTL. In terms of thermochemical properties, the as-received biopulp contained 83.1% of moisture and 1.6% of ash (wet basis equals 9.7% dry basis), which indeed leaves the dried matter content to be around 15 wt.%. This value is recognized to be in the range of the most favorable dry matter concentrations by many HTL optimization studies [15,39]. Therefore, the biomass was subjected to be utilized as the initial form as supplied by the company without any pre-drying or pretreatment. Table 1 also exhibits the elemental analysis and HHV results.
As presented in Table 2, the total measured inorganics through ICP turned out to be around 22.3% of the total ash of the biomass. As it was elaborated by another study, this difference resulted from the missing oxygen and inorganic carbon in anions such as sulfates, oxides, carbonates, and phosphate bonded with the subjected inorganic elements [13]. Based on the results, phosphorous turned out to have a considerable concentration in the biomass. To attain the goal of a circular economy, the recovery of phosphorous from the HTL products is crucial, which requires monitoring the distribution of the element during the HTL process.

3.2. HTL Experiments

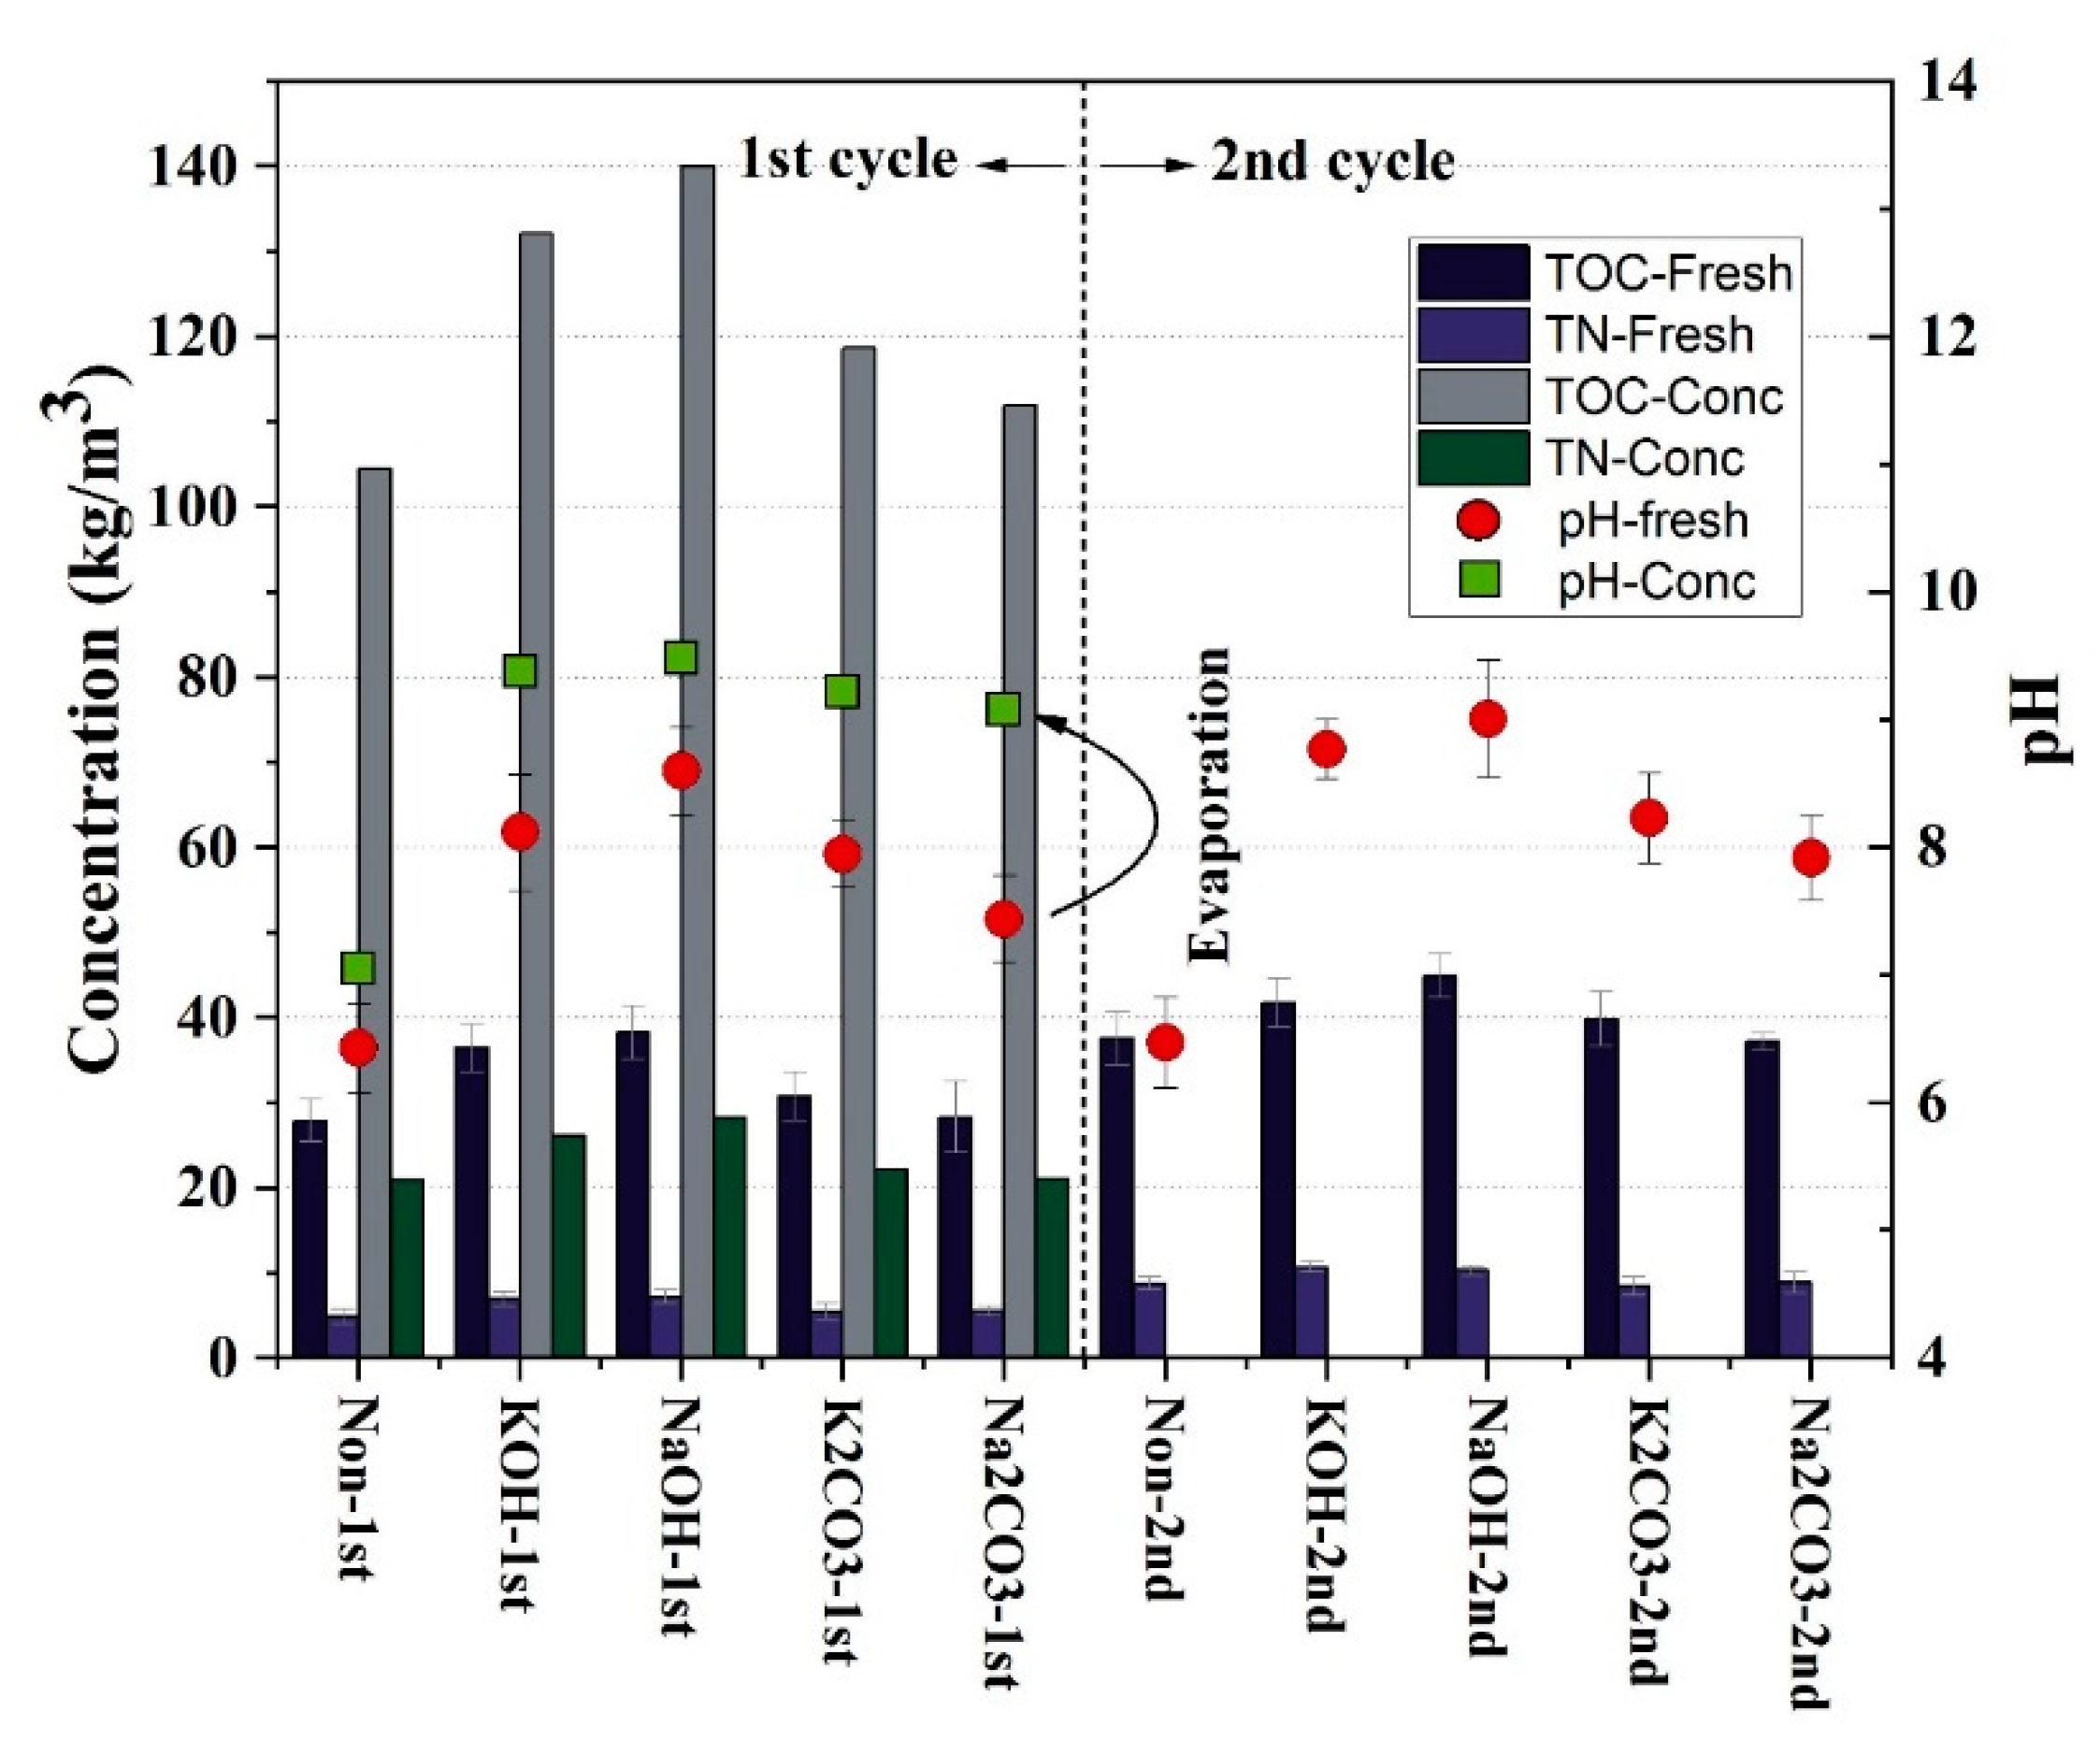
3.2.1. Effect of Catalysts and Concentrate Recirculation on HTL Products

The impact of different alkali catalysts (KOH, NaOH, K2CO3, and Na2CO3) on the HTL of the biopulp was investigated at 350 °C with 15 min of residence time [27]. The baseline experiment (non-catalytic-1st), which was conducted with no catalyst or recirculation, yielded 30.6 wt.% of bio-crude. As depicted in Figure 1, alkali hydroxides (KOH and NaOH) did not positively affect the bio-crude yield, whereas the alkali carbonates (K2CO3 and Na2CO3) enhanced the bio-crude yield, inevitably. In this regard, K2CO3- and Na2CO3-assisted experiments obtained 35.0 and 32.9 wt.% of bio-crude yield, respectively. However, the addition of the KOH catalyst had a negligible effect on the bio-crude yield (31.3 wt.%), whereas the presence of NaOH negatively affected the bio-crude yield (26.3 wt.%). Therefore, considering the reactivity in bio-crude production, the catalysts can be ordered as K2CO3 ˃ Na2CO3 ˃ KOH ˃ NaOH. Alkali carbonates tend to produce hydroxides and bicarbonates in an HTL medium. Acting as a secondary catalyst, bicarbonate facilitates the hydrolysis, defragmentation, and depolymerization of cellulose and hemicellulose compounds through cleavage of the glycoside bonds [40,41]. As reported elsewhere, alkali carbonates result in the formation of bio-crude intermediates such as monosaccharides, which further undergo degradation through dehydration, cyclization, decomposition, decarboxylation, etc. [18].
As mentioned before, since the biopulp was subjected to be utilized as it was received, the recirculation of the fresh aqueous phase could be problematic in terms of the dry matter content. As reported by Yin et al. [42], the low dry matter content in the HTL medium shifted the product’s equilibrium to the gas and aqueous phase instead of bio-crude. Specifically, by changing the biomass/water ratio from 0.25 to 2, the bio-crude yield dramatically decreased from around 50 wt.% to less than 5 wt.%, which reveals the sensitivity of the process to the dry matter content of the feedstock slurry. Therefore, to overcome such obstacles, this study attempted to keep the dry matter content steady in all the “cycle 2” experiments. Accordingly, the concentrated aqueous phase containing the same dry matter content of the biomass was recovered in the process. Therefore, the dry matter content was kept the same in all cases (1.18 g). Figure 1 displays the bio-crude and solid residue yield variation caused by the concentrated aqueous phase recirculation. It was found that in all cases, compared to the first cycle, the bio-crude yield was increased. The observed yield trend is in agreement with the results reported in previously accomplished research [21,22]. Deniel et al. [22], for instance, reported a 5 wt.% increment in favor of aqueous phase recirculation during the HTL of blackcurrant pomace. Herein, although the highest bio-crude yield was achieved in K2CO3-2nd (37.5 wt.%), the increment (4.52 wt.%) in the non-catalytic tests was significant. The possibility of recovering the alkali catalyst investigated through aqueous phase recirculation is discussed later. As reported by Kim and Um et al. [43], the high loading of the alkali catalyst (higher pH) in the HTL medium can cause a significant reduction in the bio-crude yield, resulting from the higher solubility of polar compounds and the inability of DCM to extract the newly formed substances. These are likely the explanation for the lower bio-crude enhancement (after recirculation) rate in the unadjusted catalytic cases. Zhu et al. [44] proposed that recirculation of the concentrated water phase is likely able to expose the non-polar bio-crude components to the certain polar organic compounds recycled through the aqueous phase. Therefore, they might be involved in forming new bio-crude-range molecules through condensation and repolymerization reactions.
Extrapolated by bio-crude, the solid residue yield followed an opposite trend, as visualized in Figure 1. In comparison to the non-catalytic-1st test, the presence of alkali catalysts resulted in a significant pH elevation, which can ultimately hinder the solid yield production by suppressing the dehydration and polymerization of the monomers that were found to be unaffected in the reference test. Moreover, the higher pH decreased the repolymerization and condensation of the intermediate compounds, leading to less char formation [45]. Interestingly, even though hydroxide alkali catalysts were found to be ineffective in bio-crude production (see Figure 1), the yield of solid residues was decreased when NaOH or KOH were introduced to the HTL reactor. The possible explanation, as confirmed by Zhu et al. [44], is the ability of these catalysts to concentrate hydrogen and hydroxide ions in the reaction medium, which can trigger further decomposition and hydrolysis of the solid residue molecules. The single recirculation of the concentrated aqueous phase negatively affected the solid yield. The decreasing trend is more significant in the catalytic cases, where the catalyst could assist in degrading the untreated carbohydrate content of the solid residue. Hence, both alkali carbonates and hydroxides showed the same impact on the solid residue yield, which is likely due to the further increased pH caused by the additional catalyst dosage in the HTL medium. A study carried out by Kaur et al. [18] confirmed the impact of a higher dosage of alkali catalysts (KOH and K2CO3) on the conversion rate of a lignocellulosic biomass. In the non-catalytic test, on the other hand, it seems that the recirculation itself did not vary the extent of the hydrolysis of the solid residue compounds, as no significant variation in the solid residue yield was observed. As shown in Table 3, the highest solid residue reduction was observed using K2CO3 as the alkali catalyst, while in the non-catalytic experiment, a negligible variation was observed. Table 2 also represents the tendency of biomass ash to concentrate in the solid phase. It was found that 34.1 to 69.0 wt.% of the obtained solid residue was occupied by inorganic salts.
Figure 2 represents the different properties of the aqueous phase samples. The aqueous phase obtained from the non-catalytic experiment was slightly acidic (pH: 6.4), while catalytic experiments produced basic (pH: 7.4 to 8.6) aqueous phases. In addition to the alkali catalysts, the basic aqueous phase can result from the produced ammonia during the reaction. In fact, in the protein-rich feedstocks, the hydrolysis of the protein macromolecules and deamination of the subsequent intermediates release NH3 into the reaction medium, intensifying the basic pH values. All the alkali catalysts increased the pH value of the medium, while the elevation was more significant in the cases of NaOH and KOH. The highest TN was found in the aqueous phases obtained from KOH (7.0 kg/m3)- and NaOH-assisted (7.3 kg/m3) experiments. The presence of alkali hydroxides which caused the higher pH likely resulted from the acceleration of the deamination reaction and, subsequently, the higher production of ammonia. The hypothesis can be supported by the fact that KOH-1st showed a NH4+-N level of 3.2 kg/m3, while non-catalytic-1st and K2CO3-1st, respectively, revealed 1.9 and 2.4 kg/m3 of ammonium. In line with the aqueous phase distribution (see Figure 2), the highest TOC of the first cycle experiments was achieved in the NaOH-assisted test (38.3 kg/m3). Similarly, KOH yielded a very close value (36.7 kg/m3) for TOC. On the other hand, the aqueous phases obtained from Na2CO3-1st and K2CO3-1st possessed a lower amount of organic carbon. One reason is likely the acceleration of deoxygenation (e.g., decarboxylation) reactions in the presence of alkali carbonates [46]. The above-mentioned catalysts can reduce the hydrophilicity of the degraded organics by extracting the polar organics in the form of gas (CO and CO2) and shift the non-polar molecules to the bio-crude phase.
Along with single recirculation of the concentrated aqueous phase, an increase in all aqueous phases’ yield was observed. The reason is likely the enrichment of the water phase with organics recovered by the recirculated phase [22]. The co-operation of Na2CO3 with the recirculation method caused a sharp increase in the aqueous phase yield of 20.2 wt.%. The high organic intake in the aqueous phase achieved in Na2CO3-2nd is the reason behind the low bio-crude yield enhancement. In a relatively similar trend, the TN and TOC values in all experiments were increased upon recycling. However, closely followed by KOH-2nd, NaOH-2nd exhibited the highest TOC (44.9 kg/m3) and TN (41.8 kg/m3) values. Except for the non-catalytic tests, the basicity of all recirculation experiments was significantly increased, which is due to the extra loading of the catalyst (fresh catalyst and the catalyst in the aqueous phase) on a non-adjusted basis.
The gas composition achieved from all experiments is depicted in Figure S2. The compositions were normalized by excluding the initially loaded nitrogen. As it was mentioned previously, the higher activity of the alkali carbonate catalysts and generation of secondary catalysts increased the overall gas yield in comparison to the reference test, while the alkali hydroxide catalysts did not show any increasing trend. Looking at this from the composition point of view, utilization of K2CO3 and Na2CO3 resulted in a higher share of H2, whereas CO was reduced considerably. This is likely caused by the catalyzed water–gas shift (WGS) reaction. The generated hydrogen gas acts as a reducing agent and thereby favors a hydrogenation reaction, subsequently saturating the unsaturated bonds of bio-crude [40]. Although the increase in the volume percentage of H2 in the case of K2CO3 is merely 3.1 v.%, due to the fact that the hydrogenation reaction medium consumes the produced H2 and shifts it to the bio-crude phase (higher H/C ratio), the acceleration of the water–gas shift reaction is likely to be more significant, as it can be observed in the final gas composition [18].

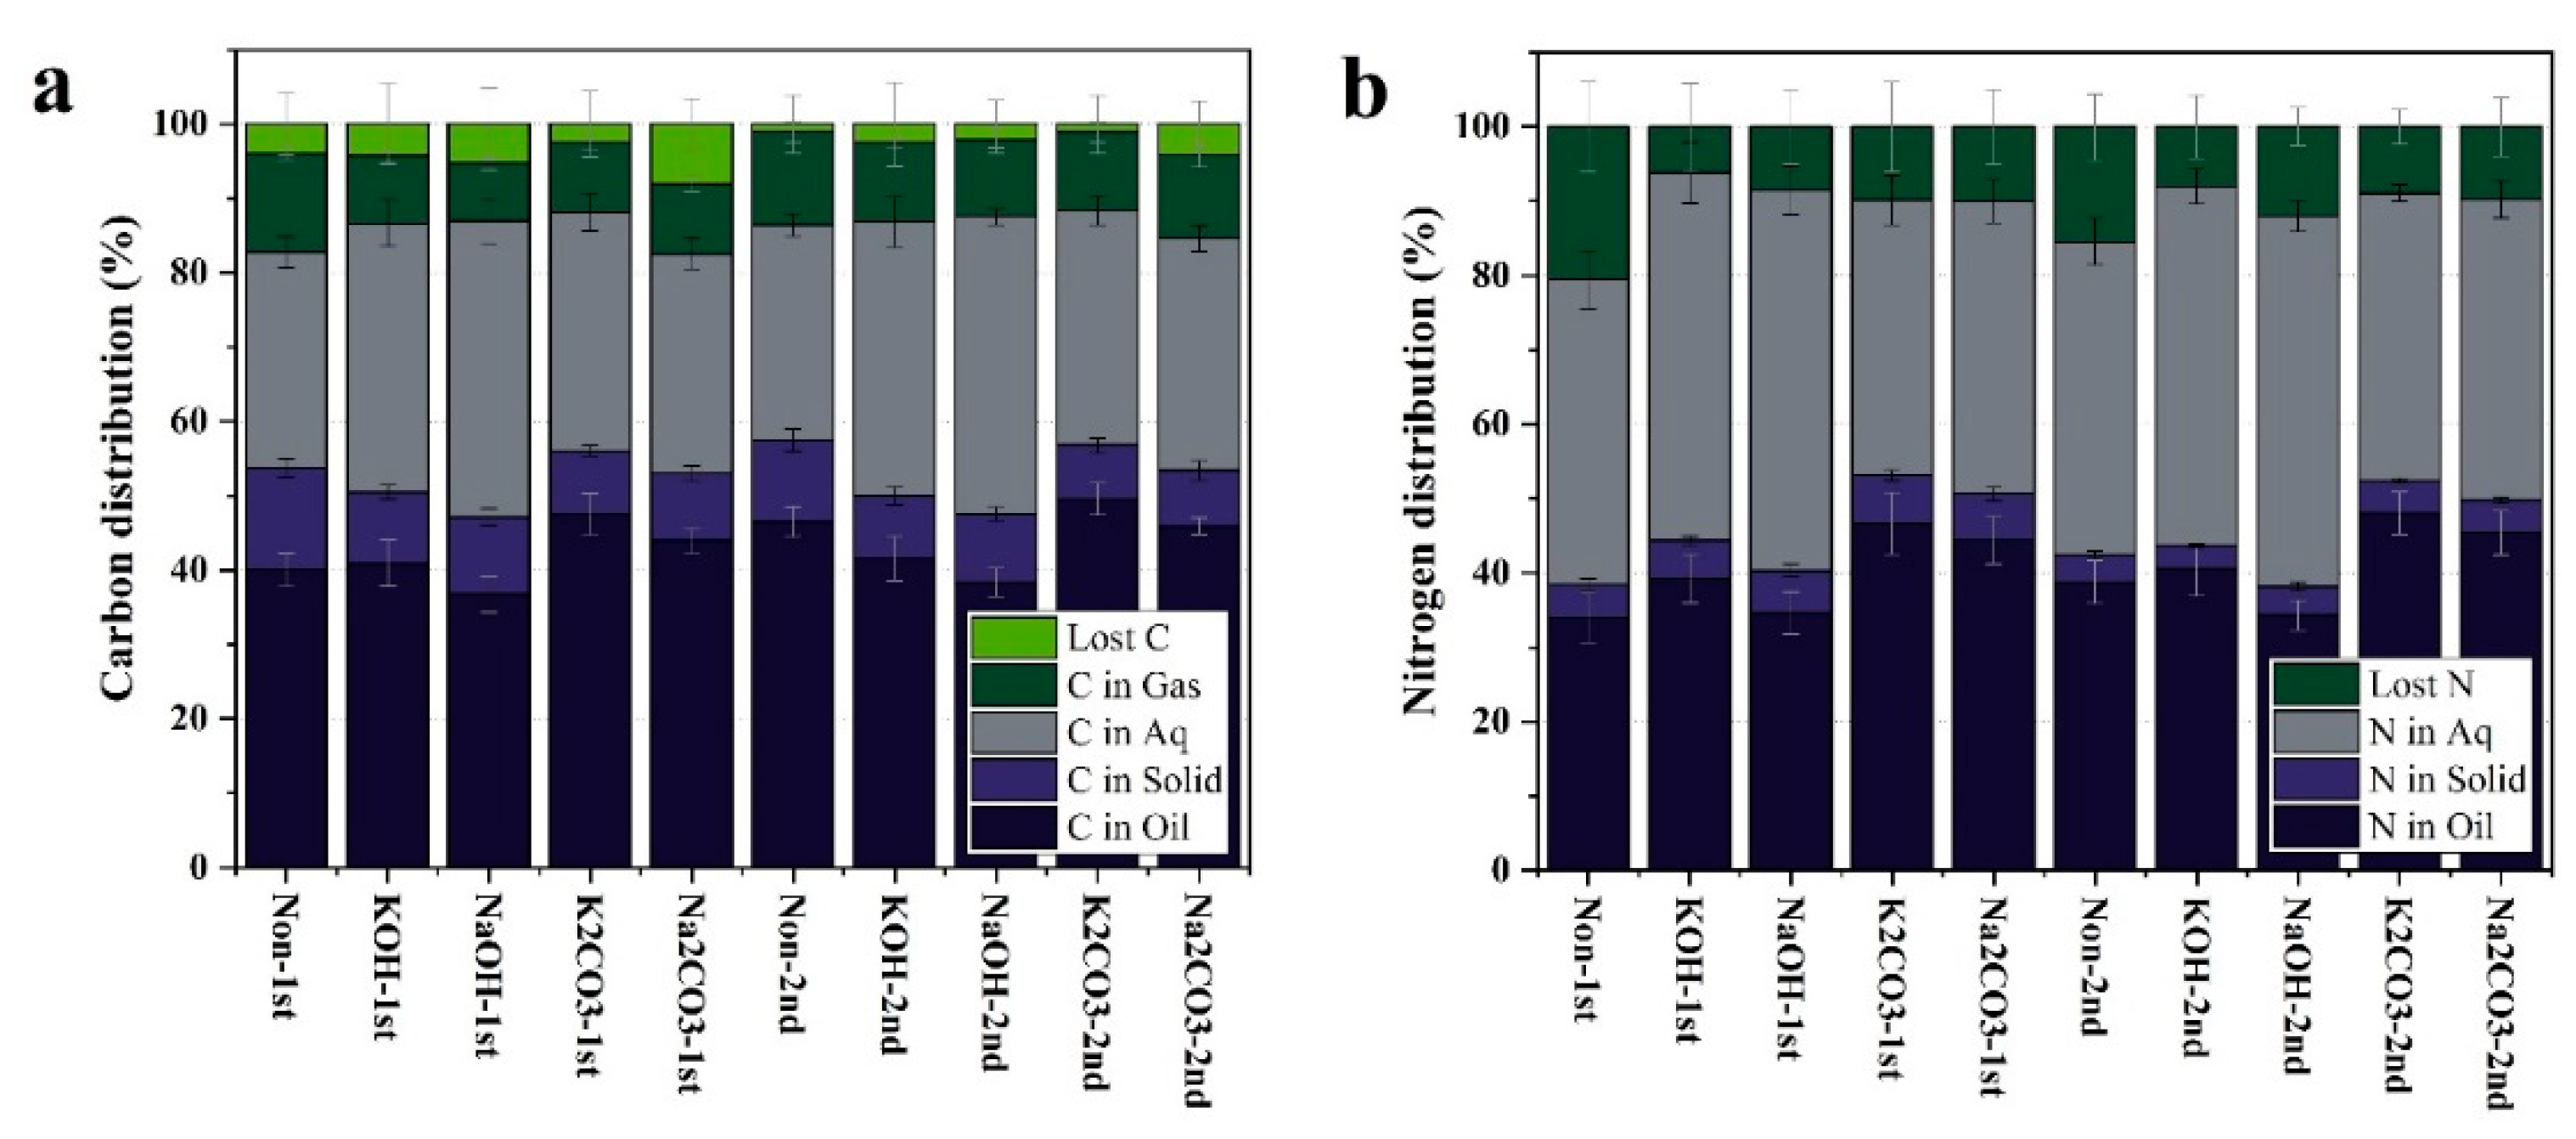
3.2.2. Carbon and Nitrogen Distribution

Figure 3a displays the distribution of carbon among different HTL products. The carbon and nitrogen recoveries were calculated based on the C and N contents in the obtained products divided by the total input of C or N. As it can be observed, the lost N is always higher than the lost C value in all cases. This is likely due to the production of nitrogenous gases during the HTL process and the inability of the employed GC instrument to monitor them. The first five experiments present the first cycle experiments with different alkali catalysts. As it can be seen, the bio-crude phase contained the highest share of carbon, followed by the aqueous phase. With the introduction of the alkali carbonates, the carbon share in the bio-crude phase substantially increased (7.5 and 3.9% for K2CO3 and Na2CO3, respectively) compared to the non-catalytic experiment, while KOH resulted in a slight enhancement in the carbon recovery in bio-crude (0.9%). Contrarily, the addition of the NaOH catalyst led to a decrease of 3.3% in the bio-crude phase carbon recovery. Similarly, the same trend is observed in Figure 3b, where the highest N recovery in the bio-crude was achieved in the presence of K2CO3 (46.6%). The reason is likely the Maillard reaction in which the monosaccharide intermediates react with the amino acids and produce bio-crude-range N-heteroatomic compounds [47]. As visualized in Figure 2, the presence of alkali catalysts increased the amount of water-soluble organics, and thus the C recovery in the aqueous phase was increased. Likewise, the highest N recovery in the aqueous phase was obtained while using the catalysts, namely, alkali hydroxides. Utilizing NaOH as the catalyst, the aqueous phase contained 51.2% of the total nitrogen, closely followed by KOH that transferred 49.5% of the nitrogen to the water phase. Figure S2 depicts a relatively constant C recovery in the gaseous phase throughout all the experiments, with a slight reduction in the presence of NaOH. Overall, with around 29.0 to 39.8% of the carbon content in the aqueous phase, it is thus of paramount importance to devise a complementary method in which not only the necessity of intense water treatment can be eliminated but also the residual carbon in the aqueous phase can be reused to increase the bio-crude yield.
In this regard, an aqueous phase recovery approach was designed in this study in which the aqueous phase was firstly subjected to a vacuum evaporator, and the concentrated phase was then recycled to the next subsequent experiment. The migration of carbon and nitrogen into the different HTL products was affected by the concentrated aqueous phase recirculation, which is evidenced in Figure 3a,b. Herein, not only the input carbon and nitrogen from the biomass but also the organic elements from the aqueous phase were also taken into account as the input material. In the case of non-catalytic experiments, in comparison to the results obtained from the first cycle, the carbonaceous substances were mainly shifted to the bio-crude phase (38.4 to 49.6%) and the aqueous phase (29.0 to 40.0%) during the second cycle experiments. As shown in Figure 3a, with the enhancement in all the cases, the recovery of the concentrated water phase proves to be a beneficial way to recover the carbon in the bio-crude, regardless of the catalyst. Albeit the highest C recovery was achieved in the presence of K2CO3 (49.6%), the most significant C recovery enhancement (6.5%) was observed in the non-catalytic condition. Reasonably, it can be concluded that the efficiency of aqueous phase recirculation in the non-catalytic run was higher than the catalytic counterparts, which is likely related to the accumulation of the alkali catalysts taking place in the non-adjusted catalytic HTL medium. In this regard, apart from the non-catalytic and K2CO3-assisted experiment, the abundance of the catalyst in the reaction medium effectively generated light polar organics, which were unrecoverable through the solvent extraction and thus accommodated in the aqueous phase. As with carbon, nitrogen was mainly distributed in the bio-crude (34.3 to 48.0%) and the aqueous phase (38.7 to 49.7%). As it was discussed earlier, the aqueous phase recirculation resulted in transferring nitrogenous compounds to the bio-crude phase. Figure 3b shows a slight increase in the N recovery in the bio-crude after the recirculation process. Similarly, the nitrogen content of the aqueous phase was increased as well. The nitrogen content of the aqueous phase obtained from the non-catalytic experiments was relatively constant. In this perspective, the non-catalytic experiments seemed to perform better by having 38.8% (lowest amount) of the total nitrogen in the bio-crude phase.

3.3. Characterization of Bio-Crude

3.3.1. Elemental Analysis

As it was mentioned earlier, the presence of the alkali salts catalyzed the WGS reaction and assisted in the generation of CO2 and H2. Table 2 elucidates the H/C ratio of the non-catalytic-1st bio-crude that is 1.60, whereas all the catalytic bio-crudes showed slightly higher values, led by the K2CO3-1st bio-crude (H/C: 1.64) that resulted from the acceleration of the decarboxylation and hydrogenation reactions, along with the suppression of dehydration in the presence of alkali catalysts. Considering the elemental analyses, in all cases, the addition of an alkali catalyst resulted in a lower oxygen content in the bio-crude. Acting as the secondary catalyst, the regenerated bicarbonate ion is likely to react with the hydroxyl group of the biomass and further trigger decarboxylation and decarbonylation reactions [48]. As shown in Figure 4, the O/C ratio of the bio-crude derived from the catalytic runs is less than the value related to the bio-crude achieved from the non-catalytic test. The mentioned observation can potentially verify the reactivity of the secondary catalysts in the promotion of deoxygenation reactions [44,49]. On the other hand, protein compounds were decomposed into amino acids, amines, and nitro-cyclic compounds under basic conditions [50,51]. This phenomenon can be verified by the fact that in all catalytic experiments, the nitrogen content of the bio-crude samples increased. For instance, the N/C ratio of the bio-crude from the non-catalytic-1st experiment was 0.045, while this number was increased to 0.064 and 0.065 for bio-crudes obtained by Na2CO3-1st and K2CO3-1st, respectively. Concerning the bio-crude quality, it was revealed that all the alkali catalysts negligibly increased the HHV. As reported in Table 2, the non-catalytic bio-crude represented an HHV of 36.2 MJ/kg, while the HHV of the K2CO3-1st bio-crude was calculated to be 37.5 MJ/kg. As the HHV variation is not significant, the ER closely followed the bio-crude yield. Therefore, the highest ER was found in the bio-crude obtained using the K2CO3 catalyst.
By proceeding with the recirculation experiments and exposure of the bio-crude-range molecules to the polar heteroatomic compounds recycled along with the aqueous phase, acylation and condensation reactions took place. As shown in Figure 4, the bio-crudes produced in the succeeding recirculation experiments had higher N/C values than those from the non-recirculated tests. A concurrent increasing trend was observed for the nitrogen content of the bio-crude, regardless of the presence and type of the catalyst. For instance, the N/C ratio in the non-catalytic and K2CO3 recirculation sets varied by 31.1% and 12.3%, respectively. An explanation is the formation of amides resulting from the reaction of fatty acids with primary and secondary amines. The formed amides are less soluble in the alkaline aqueous phase (than their nitrogen-containing constituent) condition and therefore end up in the bio-crude phase [52]. On the other hand, the evaporation of the surplus water and subsequent elevation in the pH in the catalytic-driven aqueous phase shifted the NH3/NH4+ equilibrium toward ammonia, which resulted in its removal from the medium [53]. However, in the non-catalytic experiment, the pH variation was not significant, and therefore the nitrogen removal (see Figure S3) was inferior. This can clearly explain the highest nitrogen content increment (28.6%) in the bio-crude obtained from the non-catalytic experiments (Table 2) compared to all the catalytic-driven bio-crudes. The high nitrogen content of the bio-crude intensifies downstream hydrodenitrogenation requirements. However, the actual effect of the N increment along with aqueous phase recirculation on the subsequent bio-crude refinery is still undiscovered and needs to be investigated.
Following the results provided by Zhu et al., the recirculation of the concentrated aqueous phase suppressed H/C and had no significant effect on the O/C ratio [44]. As reported in Table 2, with the recirculation of the aqueous phase, the HHV of the bio-crude samples slightly decreased, which is likely due to the repolymerization of the light polar heteroatomic compounds with the bio-crude molecules and the formation of lipophilic compounds. However, dominated by the bio-crude yield, the ER was enhanced after recirculation as the highest ER (59.4%) was achieved in the K2CO3-2nd experiment. To better elucidate the mentioned observation on the overall impact of water phase recirculation on bio-crude properties, conducting full recirculation is required, which remains to be conducted in future studies.

3.3.2. TG Analysis

The thermal behavior of all bio-crude samples was evaluated through thermogravimetric (TG) analysis. Based on previous studies, TGA was performed from 25 to 775 °C under an inert atmosphere [54]. Overall, 78 to 86% of the organics were volatilized before 400 °C, revealing the gasoline-, diesel-, jet fuel-, and marine fuel-loaded nature of the bio-crude. As a comparison, Aierzhati et al. [55] reported approximately 78 and 90% of weight loss under the same atmosphere for bio-crude obtained from the HTL of food waste in pilot- and lab-scale apparatuses, respectively. Furthermore, as it was presented by Shah et al. [33], the sewage sludge-driven bio-crude corresponded to 65% of volatilization before 400 °C. The presented curves indicate that using alkali catalysts is favorable to producing more volatile bio-crudes, which can be beneficial for the commercialization of technology by assigning less expensive separation and refining post-processes. Taking K2CO3-1st as an example, the volatile fraction of the bio-crude was increased by around 8% compared to the bio-crude obtained from non-catalytic-1st. As evidenced in Figure S4, the volatile (vaporizing between 25 and 180 °C) content of the bio-crude was increased with the recycling experiments. While in the first cycle experiments, the light organics removal (25–180 °C) was around 15 to 25%, it increased to 20 to 25% by proceeding with recirculation. The potential explanation could be the enrichment of the bio-crude with the low-boiling point light polar organics that were conjugated to the polar functional groups [44]. When heated to 400 °C, the weight loss level of C2-derived bio-crudes was slightly higher than that of the C1 experiments. For instance, for K2CO3-2nd, around 83.5% of the mass of the bio-crude was volatilized before 400 °C, whereas this changed to 88% when proceeding with the single aqueous phase recirculation. Moreover, the residue (fixed carbon) after 775 °C was less in the case of C2 experiments (9 to 12%) as compared to C1 (12 to 18%). Generally, the boiling point distribution of the bio-crude samples derived from C2 was shifted to the lower ranges, meaning that upon recirculation of the aqueous phase, the bio-crude tends to contain lower molecular weight compounds. This can subsequently decrease the temperature of the thermal degradation process.

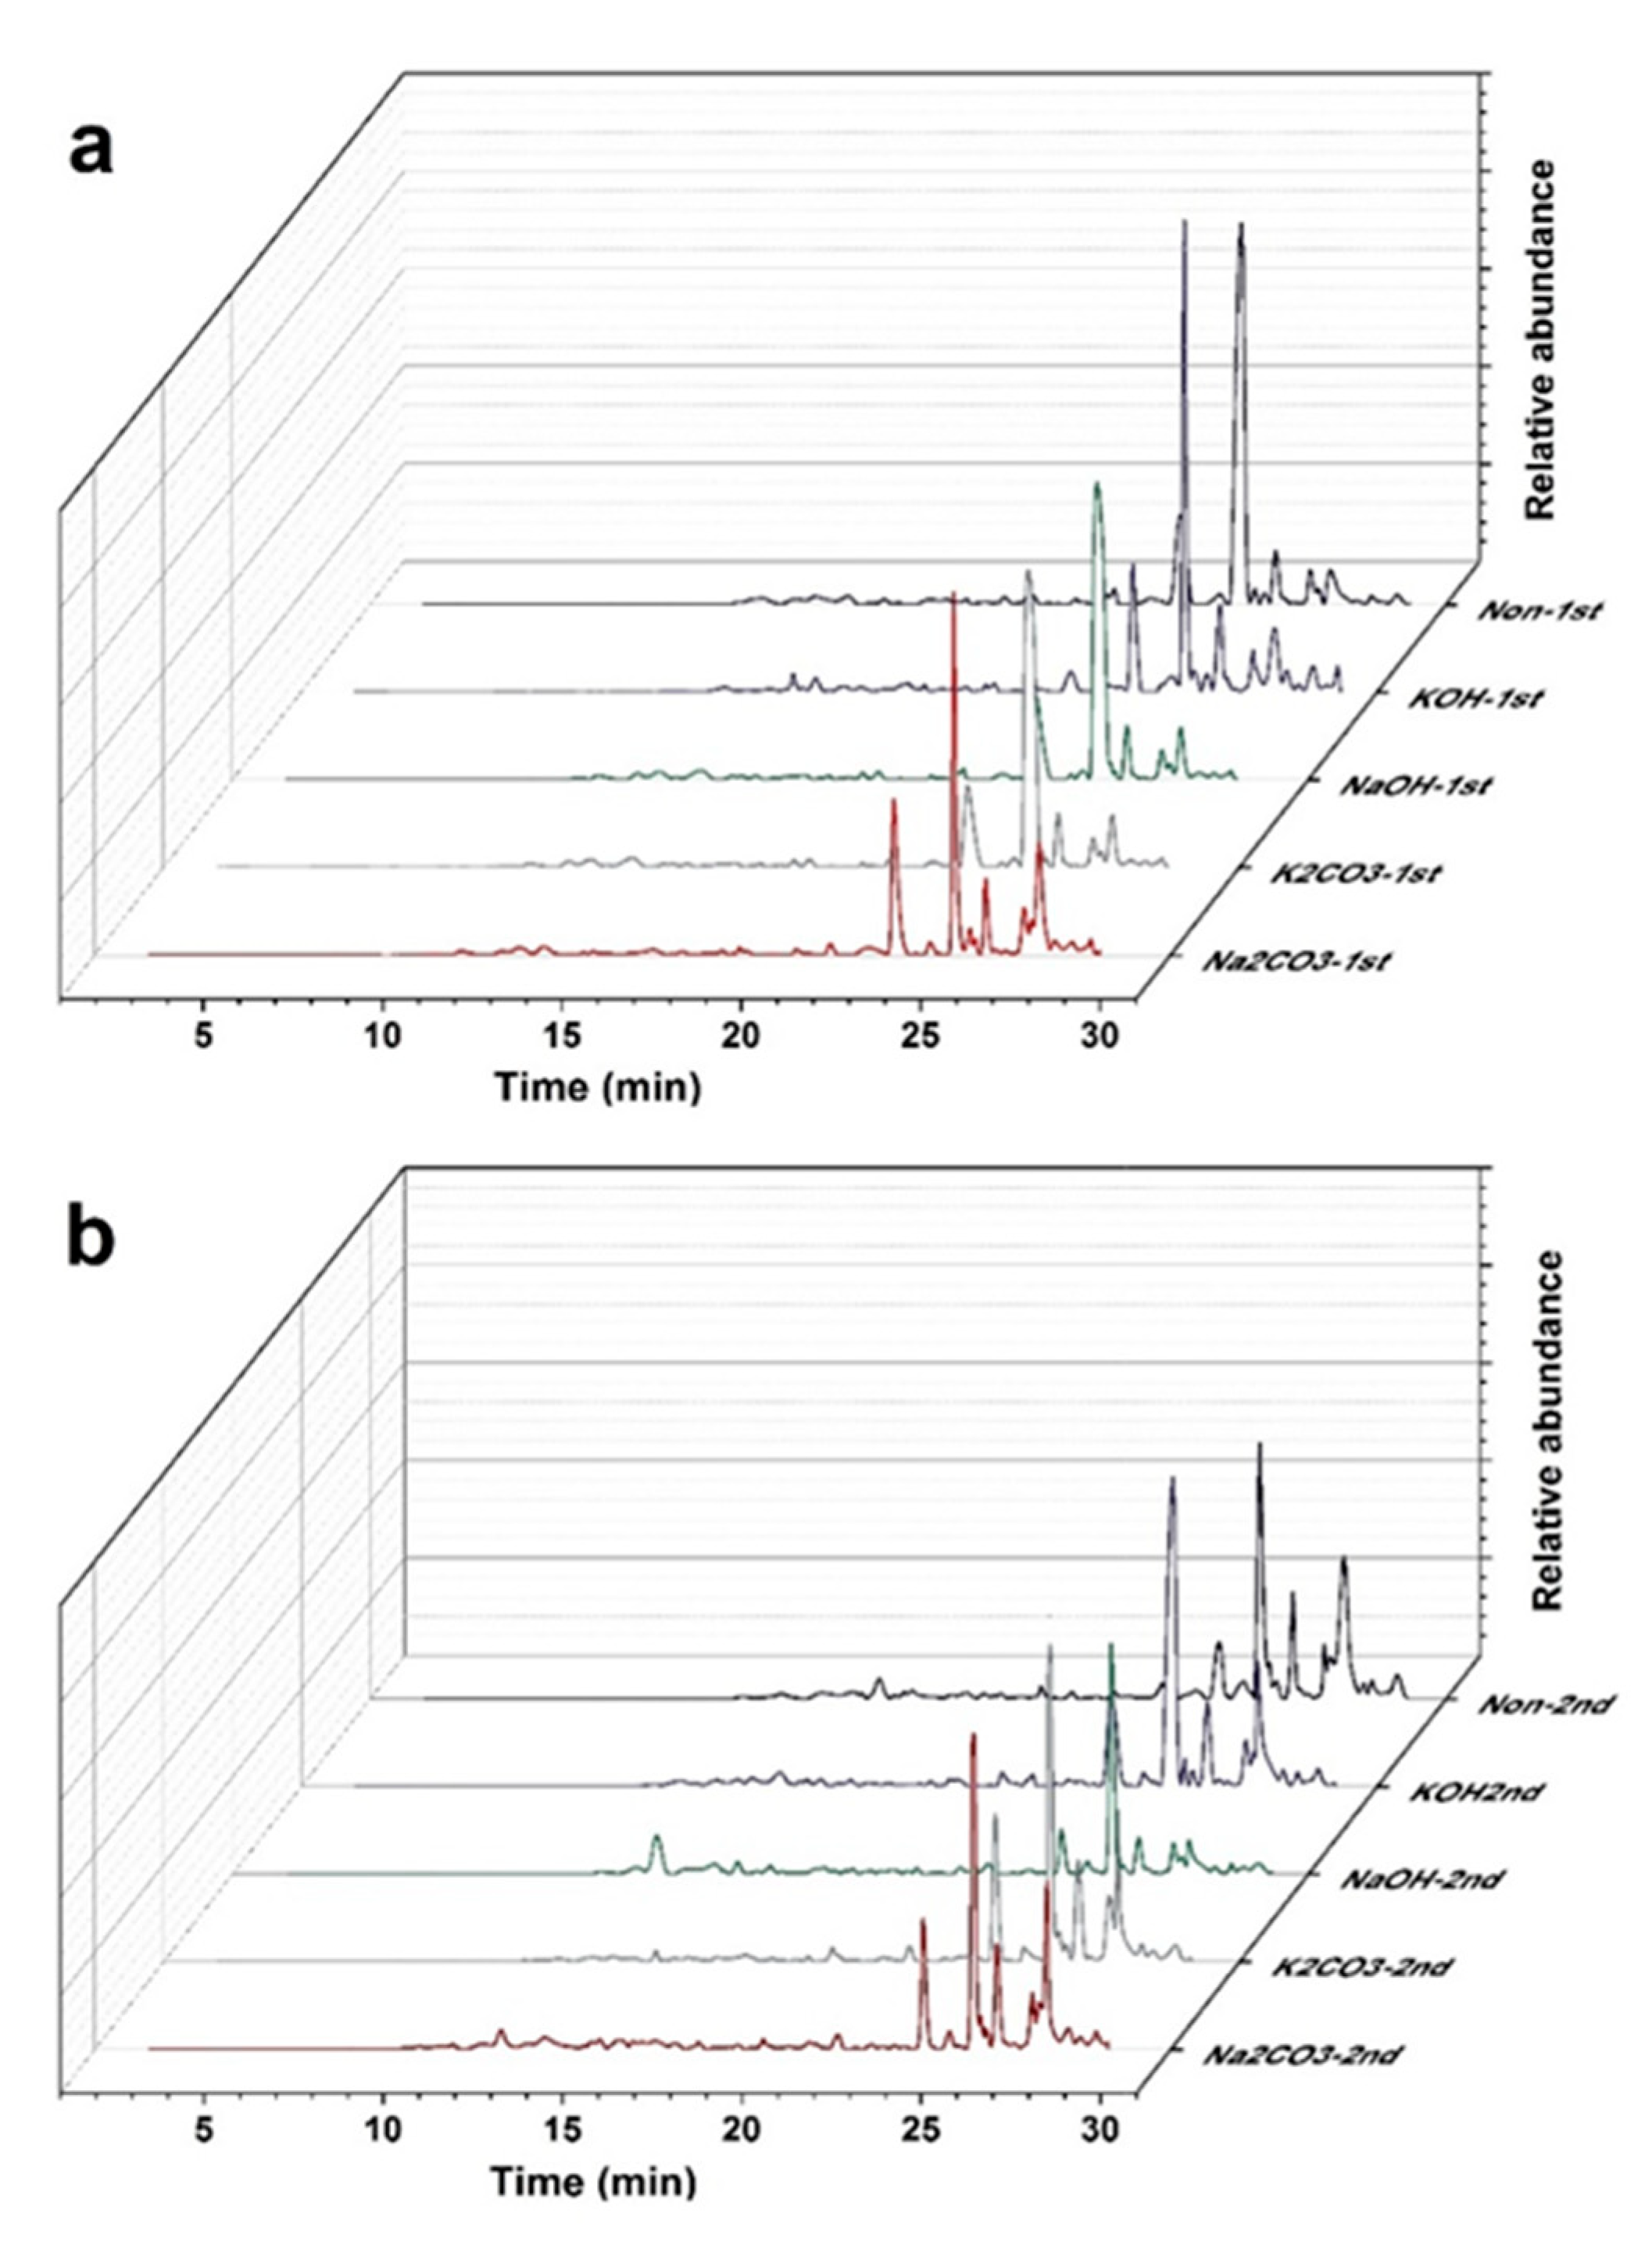
3.3.3. GC-MS Analysis

According to the TGA results, the GC-MS detected around 78 to 83% of the organic compounds present in the bio-crude with a boiling point of less than 300 °C. To better evaluate the chemical composition of the significant compounds, the substances with a 0.5 relative peak area or above were taken into consideration. Hence, 76.7 to 79.5% of the detected chemicals were ultimately classified into four categories, as depicted in Figure S5. As the most abundant category, the carboxylic acid compounds likely originated from the hydrolysis of the crude fat and esters present in the biomass. Regarding the chromatograms shown in Figure 5 and Table S1, n-Hexadecanoic acid (RT: 23.78) and vaccenic acid (RT: 25.31) were the major carboxylic acids with the highest relative peak areas (non-cat-1st). On the other hand, the addition of alkali catalysts (especially carbonate counterparts) resulted in the acceleration of the decarboxylation reaction, which ultimately produced alkane and alkene compounds that were recognized as hydrocarbons. These data support the results presented in Figure S2, where the addition of K2CO3 and Na2CO3 led to higher CO2 production. Taking the K2CO3-1st case as an example, due to the decarboxylation reaction of the fatty acids, some long-chain hydrocarbons, i.e., undecane (12.05), 1-Methyl-3-(2-methyl-1-propenyl)-cyclopentane (RT:13.42), and 1,5,5-Trimethyl-6-methylene-cyclohexene (RT:15.27), appeared. The higher concentration of hydrocarbons might promote the heating value and ignition quality of the fuel.
As recirculation was carried out, the condensation and repolymerization reactions of the light polar oxygenates exposed to the concentrated aqueous phase resulted in increased oxygen-containing compounds in the bio-crude phase regardless of the catalyst. Upon recirculation, the recovered polar short-chain primary/secondary amines (by the concentrated aqueous phase), which originated from the decarboxylation reaction of the amino acids, could react with long-chain carboxylic acids and esters to form bio-crude-range amides. Another explanation can be the higher solubility of oxygenated compounds in the aqueous phase, peculiarly in the high-pH media. This can clearly explain the consistent decreasing trends of carboxylic acid compounds in all catalytic and non-catalytic cases. Moreover, the generation of amides conversely brings forth the higher organic nitrogenous molecules. Comparing the bio-crudes derived from the K2CO3-1st and K2CO3-2nd cycles, the relative peak area of fatty acid amides such as N,N-Dimethyldodecanamide (RT: 26.28), 9-Octadecenamide (RT: 27.21), and N,N-dimethyl, 9-Octadecenamide (RT:27.77) was substantially increased. Moreover, the total peak area percentage of nitrogenous compounds was raised from 23.5 to 29.3, confirming the significant occurrence of amide and nitro-cyclic compound formation after recirculation of the aqueous phase. The aforementioned trend applies to the non-catalytic and carbonate alkali-assisted experiments, whereas the nitrous compounds did not noticeably increase when hydroxides were used. As it was mentioned by Lu et al., the amino acids derived from the hydrolysis of proteins can further react with monosaccharides, forming cyclic nitrous compounds through the Maillard reaction [56]. Albeit the addition of alkali catalysts did not significantly vary the formation of heterocyclic compounds, substances such as pyridine, indole, and quinolone derivatives were also identified. The alarming increment in the nitrous compounds can potentially cloud the future of aqueous phase recirculation for nitrogen-containing feedstocks. However, further studies revealing the features of the ultimate upgraded oil are required.

3.3.4. Inorganic Element Distribution

Table 4 represents the concentration of the inorganic elements found in the aqueous phase and solid residue obtained from every HTL experiment. As it was mentioned previously, the detected inorganics in the solid phase contributed to 17.7 to 37.8% of the ash content, while the remaining ash content was probably the undetected oxygen in the structures of SO42−, PO43−, O2, CO32−, etc. [33]. The distribution of the detected inorganics is shown in Figure S6. To calculate the quantity of individual inorganic elements in the solid residue phase, the concentration of each element was multiplied by the corresponding ash weight. On the other hand, the volume of each aqueous phase sample was multiplied by the measured concentration of the inorganic element. After that, the amounts of bio-crude inorganics were calculated by the difference. Based on the reported results, except for K, Na, and S, the rest of the elements were predominantly concentrated in the solid residue phase (51.9 to 75.6% of total output ash). The aqueous phase possessed the second highest inorganic load (22.6 to 40.1% of total output ash), followed by bio-crude. The output ash distribution data are presented in Figure S6. Apart from KOH, the addition of other alkali catalysts did not have a remarkable effect on the ash content of the bio-crudes, while the aqueous phase was considerably affected. In agreement with the precedent studies, alkali elements primarily accumulated in the aqueous phase (˃80%), which verifies the selective distribution of K and Na [56]. Thereby, Na and K can be recovered along with organic substances during aqueous phase recirculation experiments and imbedded into the bio-crude, to some extent, in the subsequent cycles [24]. As visualized in Figure S6, after the single recirculation in the presence of KOH and NaOH, the bio-crude samples possessed a small fraction (1.5 to 5.0%) of the alkali element that will intensify in the following recirculation cycles. Therefore, catalyst adjustment prior to each cycle seems to be pivotal.
The major proportion of P present in the biomass was recovered in the solid phase in all cases. With the introduction of the alkali catalysts, the concentration of multivalent metal ions (e.g., Ca2+, Al3+, Fe2+/3+) in the solid phase increased, which led to the higher concentration of P in the form of phosphate salts in the same phase [57,58]. Based on the results presented in Table 4, the molar ratio of Ca/P in the solid residue is 1.3 to 2.4, which, in most cases, meets the required amount of Ca to form hydroxyapatite. As it was reported by Dai et al. [59], the formation of (Ca5(PO4)3(OH)) is highly pH-dependent; thus, in the higher pH media (catalytic experiments), Ca was majorly precipitated in the solid phase, while in the non-catalytic test (pH < 7), some traces of calcium were found in the aqueous phase. The recovery of the concentrated aqueous phase did not affect the distribution of Ca and P considerably. Summarily, the inorganics distribution suggests HTL as a promising approach, in which the inorganic elements can selectively be concentrated in different phases that pave the way to the nutrient recovery of biomass.

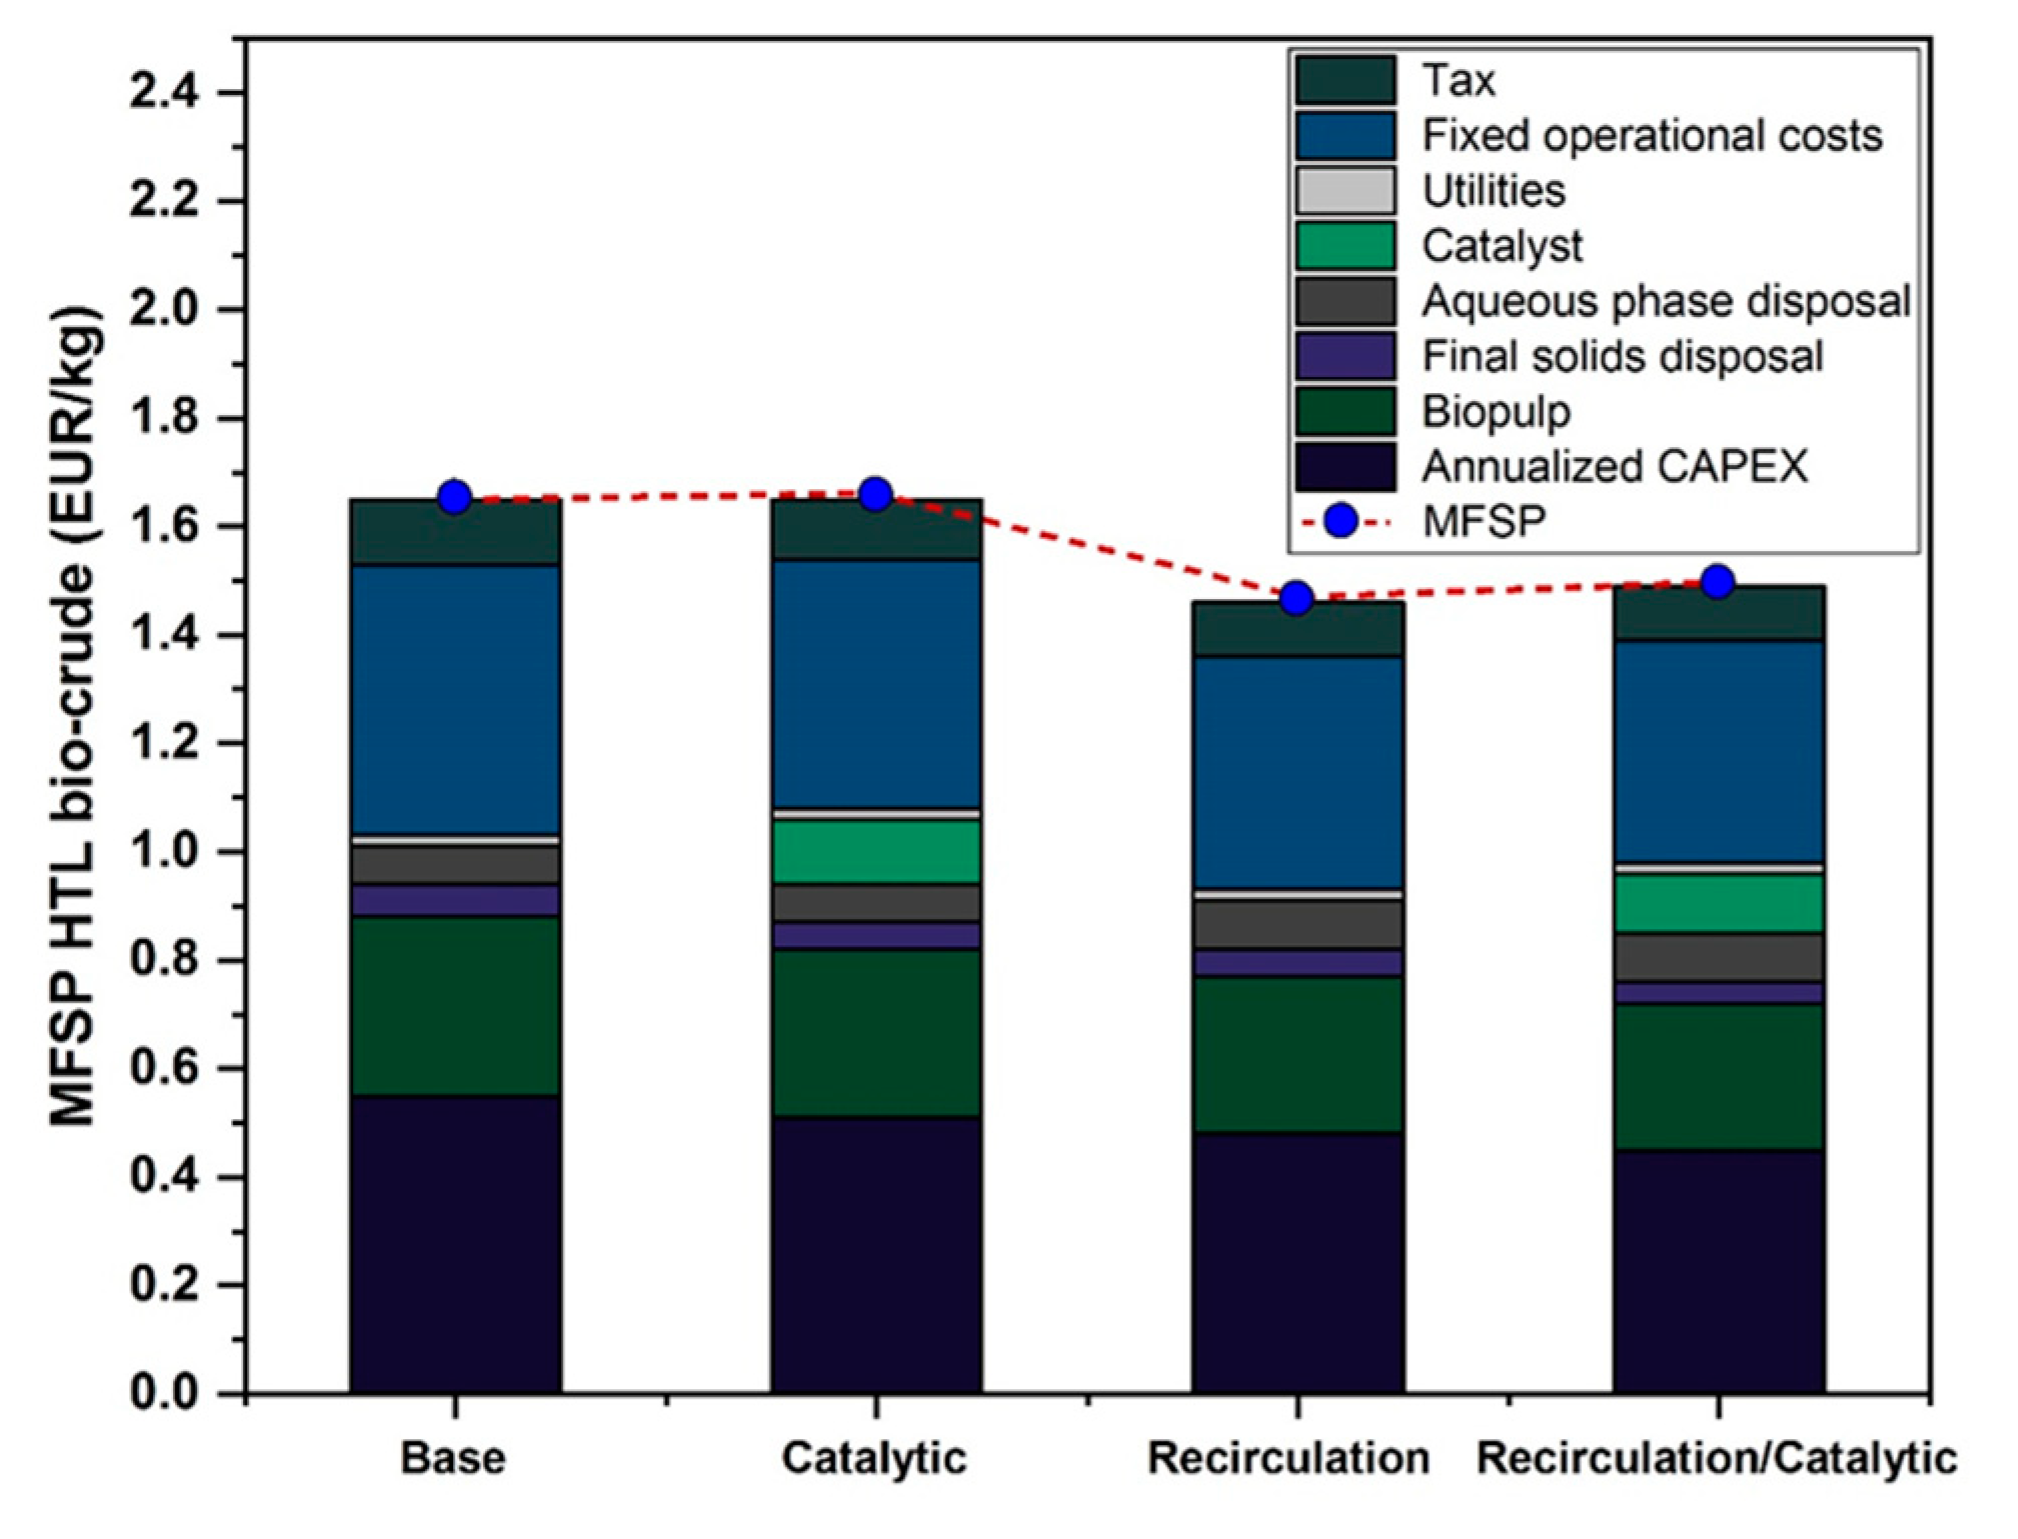
3.4. Economic Analysis

The results of the cost estimation are summarized in Figure 6 for the four evaluated scenarios. Overall, the analysis indicates that the addition of catalysts has no impact on the MFSP of the HTL bio-crude, as the positive impact of a higher bio-crude yield is counterbalanced by the additional expense of the catalyst. This is observed in both scenarios with and without recirculation. However, in the scenarios with recirculation, the MFSP decreased by 11%. This is explained by the higher increase in the yield in the third scenario (14.7% higher than the base case) compared to the one with the catalyst (7.3% higher than the base case) and the relatively low expense estimated for the inclusion of aqueous phase recirculation compared to the addition of the catalyst. Notwithstanding, due to the high solubility of alkali catalysts (see ICP results), recirculation of the aqueous phase aided by catalyst adjustment prior to each cycle can reduce fresh catalyst usage without any negative effect on the process. This can likely decrease the MFSP of the final bio-crude and promote the economy of the process.

4. Conclusions

In this study, the effect of four different alkali catalysts (KOH, NaOH, K2CO3, and Na2CO3) along with recirculation of the concentrated aqueous phase on the hydrothermal liquefaction of biopulp was studied. The main findings are presented below:
  • Non-catalytic HTL yielded 30.7 wt.% of bio-crude (ER: 47.9%).
  • While NaOH and KOH did not show a positive impact on the quantity of the bio-crude, all catalysts increased the HHV and ER of the bio-crude, and K2CO3 resulted in the bio-crude with the highest ER (57.2%).
  • Evaporation of the aqueous phase successfully removed 83.0% of the surplus water along with 14.8 to 25.3% of the total nitrogen of the water phase.
  • Aqueous phase recirculation showed a positive impact on bio-crude yield regardless of the catalyst, while incorporating it with an alkali catalyst could determine the enhancement magnitude. The highest bio-crude yield (37.5 wt.%) and ER (59.4%) were achieved when simultaneously using K2CO3 and single aqueous phase recirculation.
  • The high concentration of potassium (87.5 to 96.7%) and sodium (73.0 to 92.0%) in the aqueous phase after catalytic HTL envisaged a great potential in the recycling of the alkali elements to the next cycle. On the other hand, unaddressed catalyst adjustment resulted in a higher value of Na and/or K in the bio-crude obtained from the second cycle.
  • Catalytic HTL (cycle 1) allowed phosphorous to selectively precipitate in the solid residue, which opens up the possibility of nutrient recovery in a highly concentrated phase.
  • Catalytic HTL did not positively impact the economy of the process, while recirculation of the aqueous phase decreased the MFSP by around 11% due to the higher bio-crude yields.

Supplementary Materials

The following are available online at https://0-www-mdpi-com.brum.beds.ac.uk/article/10.3390/en14154492/s1, Figure S1. The schematic plot of HTL, concentration, and separation processes; Figure S2. Gas yield and composition; Figure S3. Total nitrogen loss during concentration of aqueous phase; Figure S4. Thermogravimetric curves of the bio-crudes obtained in different experiments; Figure S5. Categorized GC-MS analysis results for the bio-crude samples achieved from recirculation set of experiments (“C” indicates cycle); Figure S6. Inorganic elements distribution during HTL process. Table S1. The major organic compounds (relative peak area > 1%) identified in bio-crude obtained at first and second cycles non-catalytic and K2-CO3 catlytic experiments.

Author Contributions

K.K.: conceptualization, data curation, formal analysis, investigation, methodology, roles/writing—original draft, visualization, writing—review and editing; K.S.: investigation, formal analysis, methodology, writing—review and editing; S.S.T.: methodology, writing—review and editing; E.L.S.: investigation, data curation, writing—review and editing; J.Z.: formal analysis, writing—review and editing; L.A.R.: conceptualization, funding acquisition, project administration; T.H.P.: conceptualization, funding acquisition, investigation, project administration, resources, supervision, validation, writing—review and editing. All authors have read and agreed to the published version of the manuscript.

Funding

This project has received funding from the European Union’s Horizon 2020 research and innovation program under grant no. 818413 (NextGenRoadFuel).

Institutional Review Board Statement

Not applicable.

Informed Consent Statement

Not applicable.

Data Availability Statement

Not applicable.

Conflicts of Interest

The authors declare no conflict of interest. The funding agency had no role in the design of the study, writing of the manuscript, or decision to publish the results.

References

  1. European Environment Agency. Managing Municipal Solid Waste—A Review Of Achievements in 32 European Countries; Office for Official Publication of the European Communities: Luxembourg, 2013. [CrossRef]
  2. Chattopadhyay, S.; Dutta, A.K.; Ray, S. Municipal solid waste management in Kolkata, India—A review. Waste Manag. 2009, 29, 1449–1458. [Google Scholar] [CrossRef]
  3. Kaza, S.; Yao, L.; Bhada-Tata, P.; Van Woerden, F. What a Waste 2.0.: A Global Snapshot of Solid Management to 2050; World Bank Publications: Washington, DC, USA, 2018. [Google Scholar]
  4. Okoro-Shekwaga, C.K.; Ross, A.; Camargo-Valero, M.A. Enhancing bioenergy production from food waste by in situ biomethanation: Effect of the hydrogen injection point. Food Energy Secur. 2021, e288. [Google Scholar] [CrossRef]
  5. Sharma, K.D.; Jain, S. Municipal solid waste generation, composition, and management: The global scenario. Soc. Responsib. J. 2020, 16, 917–948. [Google Scholar] [CrossRef]
  6. He, P.; Chen, L.; Shao, L.; Zhang, H.; Lü, F. Municipal solid waste (MSW) landfill: A source of microplastics?—Evidence of microplastics in landfill leachate. Water Res. 2019, 159, 38–45. [Google Scholar] [CrossRef]
  7. Farrell, M.; Jones, D. Critical evaluation of municipal solid waste composting and potential compost markets. Bioresour. Technol. 2009, 100, 4301–4310. [Google Scholar] [CrossRef]
  8. Borja, R. Biogas Production. Compr. Biotechnol. 2011, 2, 785–798. [Google Scholar] [CrossRef]
  9. Sipra, A.T.; Gao, N.; Sarwar, H. Municipal solid waste (MSW) pyrolysis for bio-fuel production: A review of effects of MSW components and catalysts. Fuel Process. Technol. 2018, 175, 131–147. [Google Scholar] [CrossRef]
  10. Raikova, S.; Smith-Baedorf, H.; Bransgrove, R.; Barlow, O.; Santomauro, F.; Wagner, J.L.; Allen, M.J.; Bryan, C.G.; Sapsford, D.; Chuck, C.J. Assessing hydrothermal liquefaction for the production of bio-oil and enhanced metal recovery from microalgae cultivated on acid mine drainage. Fuel Process. Technol. 2016, 142, 219–227. [Google Scholar] [CrossRef] [Green Version]
  11. Katakojwala, R.; Kopperi, H.; Kumar, S.; Mohan, S.V. Hydrothermal liquefaction of biogenic municipal solid waste under reduced H2 atmosphere in biorefinery format. Bioresour. Technol. 2020, 310, 123369. [Google Scholar] [CrossRef] [PubMed]
  12. Chen, W.-T.; Zhang, Y.; Lee, T.H.; Wu, Z.; Si, B.; Lee, C.-F.F.; Lin, A.; Sharma, B.K. Renewable diesel blendstocks produced by hydrothermal liquefaction of wet biowaste. Nat. Sustain. 2018, 1, 702–710. [Google Scholar] [CrossRef]
  13. Shah, A.A.; Toor, S.S.; Seehar, T.H.; Sadetmahaleh, K.K.; Pedersen, T.H.; Nielsen, A.H.; Rosendahl, L.A. Bio-crude production through co-hydrothermal processing of swine manure with sewage sludge to enhance pumpability. Fuel 2021, 288, 119407. [Google Scholar] [CrossRef]
  14. Zhao, B.; Wang, H.; Hu, Y.; Gao, J.; Zhao, G.; Ray, M.B.; Xu, C.C. Hydrothermal Co-Liquefaction of Lignite and Lignocellulosic Biomass with the Addition of Formic Acid: Study on Product Distribution, Characteristics, and Synergistic Effects. Ind. Eng. Chem. Res. 2020, 59, 21663–21675. [Google Scholar] [CrossRef]
  15. Kohansal, K.; Tavasoli, A.; Bozorg, A. Using a hybrid-like supported catalyst to improve green fuel production through hydrothermal liquefaction of Scenedesmus obliquus microalgae. Bioresour. Technol. 2019, 277, 136–147. [Google Scholar] [CrossRef]
  16. Gollakota, A.; Kishore, N.; Gu, S. A review on hydrothermal liquefaction of biomass. Renew. Sustain. Energy Rev. 2018, 81, 1378–1392. [Google Scholar] [CrossRef]
  17. Jindal, M.K.; Jha, M.K. Hydrothermal liquefaction of wood: A critical review. Rev. Chem. Eng. 2016, 32, 459–488. [Google Scholar] [CrossRef]
  18. Kaur, R.; Biswas, B.; Kumar, J.; Jha, M.K.; Bhaskar, T. Catalytic hydrothermal liquefaction of castor residue to bio-oil: Effect of alkali catalysts and optimization study. Ind. Crop. Prod. 2020, 149, 112359. [Google Scholar] [CrossRef]
  19. Koley, S.; Khadase, M.S.; Mathimani, T.; Raheman, H.; Mallick, N. Catalytic and non-catalytic hydrothermal processing of Scenedesmus obliquus biomass for bio-crude production – A sustainable energy perspective. Energy Convers. Manag. 2018, 163, 111–121. [Google Scholar] [CrossRef]
  20. Jindal, M.; Jha, M. Catalytic Hydrothermal Liquefaction of Waste Furniture Sawdust to Bio-oil. Indian Chem. Eng. 2015, 58, 157–171. [Google Scholar] [CrossRef]
  21. Klemmer, M.; Madsen, R.B.; Houlberg, K.; Mørup, A.J.; Christensen, P.S.; Becker, J.; Glasius, M.; Iversen, B.B. Effect of Aqueous Phase Recycling in Continuous Hydrothermal Liquefaction. Ind. Eng. Chem. Res. 2016, 55, 12317–12325. [Google Scholar] [CrossRef]
  22. Déniel, M.; Haarlemmer, G.; Roubaud, A.; Weiss-Hortala, E.; Fages, J. Bio-oil Production from Food Processing Residues: Improving the Bio-oil Yield and Quality by Aqueous Phase Recycle in Hydrothermal Liquefaction of Blackcurrant (Ribes nigrum L.) Pomace. Energy Fuels 2016, 30, 4895–4904. [Google Scholar] [CrossRef] [Green Version]
  23. Posmanik, R.; Martinez, C.M.; Cantero-Tubilla, B.; Cantero, D.; Sills, D.; Cocero, M.J.; Tester, J.W. Acid and Alkali Catalyzed Hydrothermal Liquefaction of Dairy Manure Digestate and Food Waste. ACS Sustain. Chem. Eng. 2017, 6, 2724–2732. [Google Scholar] [CrossRef]
  24. Pedersen, T.; Grigoras, I.; Hoffmann, J.; Toor, S.; Daraban, I.; Jensen, C.; Iversen, S.; Madsen, R.; Glasius, M.; Arturi, K.R.; et al. Continuous hydrothermal co-liquefaction of aspen wood and glycerol with water phase recirculation. Appl. Energy 2016, 162, 1034–1041. [Google Scholar] [CrossRef] [Green Version]
  25. Conti, F.; Toor, S.S.; Pedersen, T.H.; Seehar, T.H.; Nielsen, A.H.; Rosendahl, L.A. Valorization of animal and human wastes through hydrothermal liquefaction for biocrude production and simultaneous recovery of nutrients. Energy Convers. Manag. 2020, 216, 112925. [Google Scholar] [CrossRef]
  26. Mariotti, F.; Tomé, D.; Mirand, P.P. Converting Nitrogen into Protein—Beyond 6.25 and Jones’ Factors. Crit. Rev. Food Sci. Nutr. 2008, 48, 177–184. [Google Scholar] [CrossRef] [PubMed]
  27. Kohansal, S.K.; Toor, K.; Sharma, R.; Chand, L.; Rosendahl, T.H. Pedersen, Hydrothermal liquefaction of pre-treated municipal solid waste (biopulp) with recirculation of concentrated aqueous phase. Biomass and Bioenergy 2021, 148, 106032. [Google Scholar] [CrossRef]
  28. Aierzhati, A.; Stablein, M.J.; Wu, N.E.; Kuo, C.-T.; Si, B.; Kang, X.; Zhang, Y. Experimental and model enhancement of food waste hydrothermal liquefaction with combined effects of biochemical composition and reaction conditions. Bioresour. Technol. 2019, 284, 139–147. [Google Scholar] [CrossRef]
  29. Watson, J.; Lu, J.; de Souza, R.; Si, B.; Zhang, Y.; Liu, Z. Effects of the extraction solvents in hydrothermal liquefaction processes: Biocrude oil quality and energy conversion efficiency. Energy 2019, 167, 189–197. [Google Scholar] [CrossRef]
  30. Seehar, T.H.; Toor, S.S.; Shah, A.A.; Nielsen, A.H.; Pedersen, T.H.; Rosendahl, L.A. Catalytic hydrothermal liquefaction of contaminated construction wood waste for biocrude production and investigation of fate of heavy metals. Fuel Process. Technol. 2021, 212, 106621. [Google Scholar] [CrossRef]
  31. Taghipour, A.; Hornung, U.; Ramirez, J.A.; Brown, R.J.; Rainey, T.J. Aqueous phase recycling in catalytic hydrothermal liquefaction for algal biomass and the effect on elemental accumulation and energy efficiency. J. Clean. Prod. 2021, 289, 125582. [Google Scholar] [CrossRef]
  32. Conti, F.; Toor, S.S.; Pedersen, T.H.; Nielsen, A.H.; Rosendahl, L.A. Biocrude production and nutrients recovery through hydrothermal liquefaction of wastewater irrigated willow. Biomass Bioenergy 2018, 118, 24–31. [Google Scholar] [CrossRef]
  33. Shah, A.A.; Toor, S.S.; Seehar, T.H.; Nielsen, R.S.; Nielsen, A.H.; Pedersen, T.H.; Rosendahl, L.A. Bio-Crude Production through Aqueous Phase Recycling of Hydrothermal Liquefaction of Sewage Sludge. Energies 2020, 13, 493. [Google Scholar] [CrossRef] [Green Version]
  34. Jensen, C.U.; Rosendahl, L.; Olofsson, G. Impact of nitrogenous alkaline agent on continuous HTL of lignocellulosic biomass and biocrude upgrading. Fuel Process. Technol. 2017, 159, 376–385. [Google Scholar] [CrossRef]
  35. Snowden-Swan, L.J.; Zhu, Y.; Jones, S.B.; Elliott, D.C.; Schmidt, A.J.; Hallen, R.T.; Billing, J.; Hart, T.R.; Fox, S.P.; Maupin, G.D. Hydrothermal Liquefaction and Upgrading of Municipal Wastewater Treatment Plant Sludge: A Preliminary Techno-Economic Analysis, Rev.1; Pacific Northwest National Laboratory: Richland, WA, USA, 2016. [CrossRef]
  36. De Jong, S.A. Green Horizons: On the Production Costs, Climate Impact and Future Supply of Renewable Jet Fuels. Ph.D. Thesis, Utrecht University, Utrecht, The Netherlands, 2018. [Google Scholar]
  37. Ghaffour, N.; Missimer, T.M.; Amy, G.L. Technical review and evaluation of the economics of water desalination: Current and future challenges for better water supply sustainability. Desalination 2013, 309, 197–207. [Google Scholar] [CrossRef] [Green Version]
  38. Lozano, E.; Pedersen, T.; Rosendahl, L. Modeling of thermochemically liquefied biomass products and heat of formation for process energy assessment. Appl. Energy 2019, 254, 113654. [Google Scholar] [CrossRef]
  39. Wei, X.; Jie, D. Optimization to Hydrothermal Liquefaction of Low Lipid Content Microalgae Spirulina sp. Using Response Surface Methodology. J. Chem. 2018, 2018, 1–9. [Google Scholar] [CrossRef] [Green Version]
  40. Elliott, D.C.; Hallen, R.T.; Sealock, L.J. Aqueous catalyst systems for the water-gas shift reaction. 2. Mechanism of basic catalysis. Ind. Eng. Chem. Prod. Res. Dev. 1983, 22, 431–435. [Google Scholar] [CrossRef]
  41. Karagöz, S.; Bhaskar, T.; Muto, A.; Sakata, Y.; Oshiki, T.; Kishimoto, T. Low-temperature catalytic hydrothermal treatment of wood biomass: Analysis of liquid products. Chem. Eng. J. 2005, 108, 127–137. [Google Scholar] [CrossRef]
  42. Yin, S.; Dolan, R.; Harris, M.; Tan, Z. Subcritical hydrothermal liquefaction of cattle manure to bio-oil: Effects of conversion parameters on bio-oil yield and characterization of bio-oil. Bioresour. Technol. 2010, 101, 3657–3664. [Google Scholar] [CrossRef] [PubMed]
  43. Kim, S.J.; Um, B.H. Biocrude production from Korean native kenaf through subcritical hydrothermal liquefaction under mild alkaline catalytic conditions. Ind. Crop. Prod. 2020, 145, 112001. [Google Scholar] [CrossRef]
  44. Zhu, Z.; Rosendahl, L.; Toor, S.S.; Yu, D.; Chen, G. Hydrothermal liquefaction of barley straw to bio-crude oil: Effects of reaction temperature and aqueous phase recirculation. Appl. Energy 2015, 137, 183–192. [Google Scholar] [CrossRef]
  45. Zhu, Z.; Toor, S.S.; Rosendahl, L.; Yu, D.; Chen, G. Influence of alkali catalyst on product yield and properties via hydrothermal liquefaction of barley straw. Energy 2015, 80, 284–292. [Google Scholar] [CrossRef]
  46. Hardi, F.; Furusjö, E.; Kirtania, K.; Imai, A.; Umeki, K.; Yoshikawa, K. Catalytic hydrothermal liquefaction of biomass with K2CO3 for production of gasification feedstock. Biofuels 2018, 12, 149–160. [Google Scholar] [CrossRef]
  47. Kruse, A.; Maniam, A.P.; Spieler, F. Influence of Proteins on the Hydrothermal Gasification and Liquefaction of Biomass. 2. Model Compounds. Ind. Eng. Chem. Res. 2007, 46, 87–96. [Google Scholar] [CrossRef]
  48. Onwudili, J.; Williams, P.T. Hydrothermal reactions of sodium formate and sodium acetate as model intermediate products of the sodium hydroxide-promoted hydrothermal gasification of biomass. Green Chem. 2010, 12, 2214–2224. [Google Scholar] [CrossRef]
  49. Hao, B.; Xu, D.; Jiang, G.; Sabri, T.A.; Jing, Z.; Guo, Y. Chemical reactions in the hydrothermal liquefaction of biomass and in the catalytic hydrogenation upgrading of biocrude. Green Chem. 2021, 23, 1562–1583. [Google Scholar] [CrossRef]
  50. Fan, Y.; Hornung, U.; Dahmen, N.; Kruse, A. Hydrothermal liquefaction of protein-containing biomass: Study of model compounds for Maillard reactions. Biomass Convers. Biorefinery 2018, 8, 909–923. [Google Scholar] [CrossRef]
  51. Sun, Y.; Frenkel-Pinter, M.; Liotta, C.L.; Grover, M.A. The pH dependent mechanisms of non-enzymatic peptide bond cleavage reactions. Phys. Chem. Chem. Phys. 2019, 22, 107–113. [Google Scholar] [CrossRef]
  52. Zimmermann, J.; Raffelt, K.; Dahmen, N. Sequential Hydrothermal Processing of Sewage Sludge to Produce Low Nitrogen Biocrude. Processes 2021, 9, 491. [Google Scholar] [CrossRef]
  53. Rezagama, P.A.; Hibbaan, M.; Budihardjo, M.A. Ammonia-Nitrogen (NH3-N) and Ammonium-Nitrogen (NH4+-N) Equi-librium on The Process of Removing Nitrogen By Using Tubular Plastic Media. J. Mater. Environ. Sci. 2017, 8, 4915–4922. [Google Scholar]
  54. Bayat, H.; Cheng, F.; Dehghanizadeh, M.; Soliz, N.; Brewer, C.E.; Jena, U. Hydrothermal liquefaction of food waste: Bio-crude oil Characterization, Mass and Energy Balance. In Proceedings of the 2019 ASABE Annual International Meeting, Boston, MA, USA, 7–10 July 2019. [Google Scholar] [CrossRef]
  55. Aierzhati, A.; Watson, J.; Si, B.; Stablein, M.; Wang, T.; Zhang, Y. Development of a mobile, pilot scale hydrothermal liquefaction reactor: Food waste conversion product analysis and techno-economic assessment. Energy Convers. Manag. X 2021, 10, 100076. [Google Scholar] [CrossRef]
  56. Lu, J.; Zhang, J.; Zhu, Z.; Zhang, Y.; Zhao, Y.; Li, R.; Watson, J.; Li, B.; Liu, Z. Simultaneous production of biocrude oil and recovery of nutrients and metals from human feces via hydrothermal liquefaction. Energy Convers. Manag. 2017, 134, 340–346. [Google Scholar] [CrossRef] [Green Version]
  57. Ovsyannikova, E.; Kruse, A.; Becker, G.C. Feedstock-Dependent Phosphate Recovery in a Pilot-Scale Hydrothermal Liquefaction Bio-Crude Production. Energies 2020, 13, 379. [Google Scholar] [CrossRef] [Green Version]
  58. Deng, Y.; Zhang, T.; Clark, J.; Aminabhavi, T.; Kruse, A.; Tsang, D.C.W.; Sharma, B.K.; Zhang, F.; Ren, H. Mechanisms and modelling of phosphorus solid–liquid transformation during the hydrothermal processing of swine manure. Green Chem. 2020, 22, 5628–5638. [Google Scholar] [CrossRef]
  59. Dai, L.; Tan, F.; Wu, B.; He, M.; Wang, W.; Tang, X.; Hu, Q.; Zhang, M. Immobilization of phosphorus in cow manure during hydrothermal carbonization. J. Environ. Manag. 2015, 157, 49–53. [Google Scholar] [CrossRef] [PubMed]
Figure 1. Distribution of HTL products and ER of bio-crude.
Energies 14 04492 g001
Figure 2. TOC, TN, and pH values of the fresh and concentrated aqueous phase.
Energies 14 04492 g002
Figure 3. (a) Carbon and (b) nitrogen distribution among different HTL products.
Energies 14 04492 g003
Figure 4. Van Krevelen 3D scatter plot of bio-crude, solid residue, and biomass samples.
Energies 14 04492 g004
Figure 5. GC-MS analysis results of (a) first cycle- and (b) second cycle-driven bio-crudes.
Energies 14 04492 g005
Figure 6. Effect of K2CO3 addition and aqueous phase recirculation on the final MFSP.
Energies 14 04492 g006
Table 1. Ultimate, proximate, and biochemical composition analysis of the biomass.
Analysis NameValue
Ultimate Analysis (wt.%)
C52.3 ± 0.5
H7.1 ± 0.2
N3.5 ± 0.1
O a37.1 ± 0.7
HHV (MJ/kg)23.2 ± 0.02
Proximate analysis (wt.%)
Moisture83.1
Ash9.7
Volatile matter b71.9
Fixed carbon b18.4
Biochemical analysis (wt.%)
Crude fats19.2
Crude proteins21.8
Carbohydrate a49.3
a Calculated by Equation (1); b dry basis.
Table 2. Inorganic element distribution in the biomass.
Inorganic ElementConcentrationRelative Concentration
Unit(µg/g Biopulp)(%) a
K285.942.96
Na493.630.86
Mg83.075.11
Ca721.607.47
Al94.670.98
Fe42.500.44
Mn2.900.03
P234.742.43
S85.970.89
Si105.291.09
Sr2.900.03
Total2153.2122.29
a Based on the concentration of each element versus total ash weight.
Table 3. Ultimate analysis, ash content, production yield, and ER of bio-crude and solid residue samples.
SampleElemental AnalysisO/CH/CN/CAshHHVdafYieldER
CHNO
Unitwt.%wt.%wt.%wt.% a---% bMJ/kg cwt.% d%
Oil-Non-1st73.86 ± 0.239.82 ± 0.123.36 ± 0.1812.96 ± 0.530.131.600.0450.4936.2330.6647.88
Oil-KOH-1st75.13 ± 0.4510.03 ± 0.074.37 ± 0.3110.47 ± 0.830.101.600.0584.3037.2031.2550.10
Oil-NaOH-1st74.44 ± 0.2010.10 ± 0.104.25 ± 0.2611.21 ± 0.560.111.630.0571.1236.9726.3041.91
Oil-K2CO3-1st75.73 ± 0.6510.34 ± 0.084.90 ± 0.149.03 ± 0.870.091.640.0651.5437.9834.9657.24
Oil-Na2CO3-1st74.32 ± 0.3310.24 ± 0.244.76 ± 0.2810.68 ± 0.770.111.650.0641.5837.1332.9152.68
Oil-Non-2nd73.10 ± 0.589.53 ± 0.254.32 ± 0.2313.05 ± 1.130.141.560.0591.6635.4135.1853.70
Oil-KOH-2nd74.65 ± 0.309.90 ± 0.174.59 ± 0.1310.86 ± 0.600.111.590.0617.6036.7631.2649.53
Oil-NaOH-2nd74.34 ± 0.429.73 ± 0.244.23 ± 0.0711.70 ± 0.730.121.570.0574.0636.3328.1944.15
Oil-K2CO3-2nd74.00 ± 0.4110.08 ± 0.185.43 ± 0.0910.49 ± 0.680.111.630.0733.7836.7337.5159.39
Oil-Na2CO3-2nd73.38 ± 0.2210.3 ± 0.095.00 ± 0.1411.32 ± 0.450.121.680.0682.8336.7733.4152.95
Solid-Non-1st57.12 ± 0.173.40 ± 0.131.22 ± 0.2038.26 ± 0.500.500.710.02134.0517.9012.599.71
Solid-KOH-1st51.98 ± 0.454.72 ± 0.311.85 ± 0.2141.45 ± 0.970.601.090.03659.2317.489.747.34
Solid-NaOH-1st51.64 ± 0.534.32 ± 0.221.90 ± 0.0742.14 ± 0.820.611.000.03756.4916.6810.537.57
Solid-K2CO3-1st48.49 ± 0.364.74 ± 0.172.45 ± 0.1844.32 ± 0.710.691.170.05058.9615.819.516.48
Solid-Na2CO3-1st49.77 ± 0.784.89 ± 0.092.26 ± 0.3043.08 ± 1.170.651.180.04558.0116.679.907.11
Solid-Non-2nd54.99 ± 0.513.67 ± 0.111.55 ± 0.1239.79 ± 0.740.540.800.02837.5417.2912.329.18
Solid-KOH-2nd50.10 ± 0.375.21 ± 0.201.89 ± 0.0842.80 ± 0.650.641.240.03770.0817.339.076.76
Solid-NaOH-2nd52.14 ± 0.124.37 ± 0.052.17 ± 0.1341.32 ± 0.300.591.000.04165.8617.019.787.17
Solid-K2CO3-2nd46.03 ± 0.394.82 ± 0.152.77 ± 0.1446.38 ± 0.680.761.260.06069.0314.738.475.38
Solid-Na2CO3-2nd47.80 ± 0.445.34 ± 0.112.32 ± 0.1044.54 ± 0.650.701.340.04867.7016.429.006.39
a Calculated by difference; b based on the corresponding product; c calculated by Equation (3); d DAF basis.
Table 4. ICP results of solid residue and aqueous phase samples obtained from HTL.
Test NameMgAlCaCuFeKMnNaPSSiSr
Unit%%%%%%%%%%%%
Solid-Non-1st1.051.847.95<0.141.150.640.040.472.860.701.010.03
Solid-KOH-1st0.771.247.99<0.141.075.020.031.814.640.301.530.02
Solid-NaOH-1st0.971.7110.46<0.140.790.500.048.732.910.260.560.03
Solid-K2CO3-1st0.901.199.03<0.141.241.150.040.763.560.371.640.03
Solid-Na2CO3-1st1.071.6310.20<0.141.240.450.047.694.090.462.660.03
Solid-Non-2nd0.821.216.59<0.143.000.400.040.393.930.651.06<0.01
Solid-KOH-2nd0.821.289.26<0.140.885.090.031.863.240.322.220.03
Solid-NaOH-2nd1.412.2710.90<0.141.360.810.0516.73.300.340.660.04
Solid-K2CO3-2nd0.760.907.81<0.140.601.580.031.43.16<0.142.160.03
Solid-Na2CO3-2nd1.391.2511.90<0.140.860.340.043.243.940.500.470.04
Unitµg/cm3µg/cm3µg/cm3µg/cm3µg/cm3µg/cm3µg/cm3µg/cm3µg/cm3µg/cm3µg/cm3µg/cm3
Aq.p-Non-1st68.6<101480NF<102180<101530<107676<10
Aq.p -KOH-1st49.1NF74.6NF<1012.300<101640<20114114<10
Aq.p -NaOH-1st21.2NF19.7NF<102490<1010.590<20126126<10
Aq.p -K2CO3-1st43.4NF120.8NF<1012.900<10152074.9121121<10
Aq.p -Na2CO3-1st42.7NF77.5NF<102200<107498<20120120<10
Aq.p -Non-2nd75.7NF1498NF<103410<102665<208282<10
Aq.p -KOH-2nd32.9NF649NF<1013.900<10338537.5117117<10
Aq.p -NaOH-2nd8.6NF24.5NFNF3050<1016.630115.7171171<10
Aq.p -K2CO3-2nd36.7NF128.10NF<1021.200<102596<20143143<10
Aq.p -Na2CO3-2nd21.1NF28.9NF<103280<1013.220<20110110<10
Publisher’s Note: MDPI stays neutral with regard to jurisdictional claims in published maps and institutional affiliations.

