Article

A Stake-Out Prototype System Based on GNSS-RTK Technology for Implementing Accurate Vehicle Reliability and Performance Tests

Department of Innovation Engineering, University of Salento, 73100 Lecce, Italy
*
Author to whom correspondence should be addressed.
Submission received: 11 June 2021 / Revised: 2 August 2021 / Accepted: 6 August 2021 / Published: 10 August 2021

Abstract

:
There are many car tests regulated by European and international standards and carried out on tracks to assess vehicle performance. The test preparation phase usually consists of placing road cones on the track with a specific configuration defined by the considered standard; this phase is performed by human operators using imprecise and slow methods, mainly due to the large required distances. In this paper, a new geolocation stake-out system based on GNSS RTK technology was realized and tested, supported by a Matlab-based software application to allow the user to quickly and precisely locate the on-track points on which to position the road cones. The realized stake-out system, innovative and very simple to use, produced negligible average errors (i.e., 2.4–2.9 cm) on the distance between the staked-out points according to the reference standards (distance percentage error 0.29–0.47%). Furthermore, the measured average angular error was also found to be very low, in the range 0.04–0.18°. Finally, ISO 3888-1 and ISO 3888-2 test configurations were reproduced on the proving ground of the Porsche Technical Center by utilizing the realized stake-out system to perform a double lane-change maneuver on car prototypes.

1. Introduction

Global navigation satellite system (GNSS) receivers supporting real-time kinematic (RTK) technology are widely used in several engineering applications when a high positioning accuracy is required. The RTK is a positioning method based on carrier wave phase measurements involving two receivers: the rover, which position has to be measured, and the base station fixed at a point with known coordinates. Both the rover and base station antennas receive the same satellite signals. The RTK technique involves the measurement of the carrier phase of the satellite signal, which is then subject to some sophisticated statistical methods to align the phase of these signals to eliminate the majority of normal global positioning system (GPS)-type errors. In this method, the base receiver remains stationary over the known point and is attached to a radio transmitter. The base receiver measurements and coordinates are transmitted to the rover receiver through the communication (radio) link. The built-in software in a rover receiver combines and processes the GPS measurements collected at both the base and the rover receivers to obtain the rover coordinates.
GNSS RTK technology allows centimeter-level positioning accuracy in ideal conditions, namely, complete satellite visibility and low geometric dilution of precision (GDOP, satellite geometry effect on positional measurement precision) values. For this reason, it is often used in any application where high positioning accuracy is needed, for example for controlling self-driving vehicles, because if their position and the road lane position are always known with high precision, the vehicle can be controlled more safely.
This research work focuses on implementing and testing a measuring system to carry out more accurately and quickly the preparatory phase of vehicle tests on an automotive proving ground; these tests are performed to evaluate vehicle performances, such as vehicle dynamics and road holding. Therefore, the main innovation of the proposed work is the development of a custom stake out system, exploiting the devices and technologies available at the Nardò Technical Center for preparing personalized or standard automotive tests. Indeed, most vehicle tests are ruled by European or international standards and consist of sets of points defining a particular path that the vehicle must follow made visible on the track employing road cones. These standards require respect for the established point configuration and, in particular, the relative distances between the points with an allowed error less than a few centimeters. There are many kinds of standard tests to verify the performance of different vehicle elements, such as suspension or anti-lock braking system (ABS), for example, by performing the double lane change maneuver regulated by the ISO 3888-1 standard [1]. The standard ISO 3888-1 establishes the relative positions of 22 points on which to place road cones (Figure 1) to constitute three lanes, whose widths depend on the vehicle’s width [2]. There are several ways to perform the test; one of these is to enter at a speed of about 80 km/h in the first lane and try to keep the throttle position as constant as possible throughout the test. At the end of the first lane, the driver swerves to enter the second lane and then swerves again to enter the final lane. The driver performing the test must follow the path indicated by the cones without hitting them. Typically, the test is carried out at different starting speeds to assess vehicle dynamics, road holding ability, or the performance of different vehicle elements, such as the electronic stability control (ESC) system on a low-friction surface, as reported in [3].
Furthermore, instead of standard tests, engineers can decide to perform custom vehicle tests by positioning at will a set of points to reproduce everyday road situations. The test preparation phase is usually carried out with inaccurate methods, determining the distance between points using a measuring wheel, thus requiring a long period of time due to the great spatial distance (>100 m). The realized sensor-based stake-out system allows these inefficiencies to be overcome, making the tests’ preparatory phase more efficient. The characterization of the developed stake-out system demonstrated its suitability to automate the preparation phase of road cones for automotive testing in compliance with the reference standards; we consider this content another contribution of the proposed manuscript. Furthermore, a lightweight and efficient solar harvesting system was developed, optionally equipping the proposed geolocalization device for extending its energy autonomy when used in outdoor environments. To our knowledge, the proposed paper represents the first application of GNSS RTK technology for preparing standard or not automotive tests.
The article structure is as follows: later, an overview of the main application of GNSS RTK technology and geolocalization field are discussed; moreover, the architecture and functionalities of the designed stake out system are presented, which allow the user to physically and accurately locate a set of points on the proving ground, according to the test configuration arranged on the Earth’s coordinate system. Section 2 introduces the structure of the developed geolocation device that integrates a GNSS RTK receiver providing real-time positioning data with centimeter accuracy. Afterwards, the Matlab-based application to place the set of points on a terrestrial coordinate system is presented. Section 3 shows the experimental results related to the precision and accuracy of the used GNSS RTK receiver as well as to distance errors performed in stake-out field trials. Finally, Section 4 reports the discussion of the obtained results.

Geolocalization Applications of GNSS RTK Technology: Architecture and Functionalities of Designed Stake out System

GNSS RTK technology is used in many fields requiring centimeter positioning accuracy, such as the automotive, agriculture, civil engineering fields, etc. Therefore, GNSS RTK technology in these fields has been investigated in many scientific articles [4,5,6,7]. In the automotive field, GNSS RTK positioning has proven to be useful in self-driving vehicles. Autonomous driving requires detecting the lane and external obstacles such as other vehicles or barriers, generally performed with high accuracy by vision systems, radar sensors, etc. In [8], the authors analyzed autonomous driving methods that, instead of relying only on detecting external objects and lanes, consider the vehicle instantaneous position pinpointed with centimeter accuracy through the GNSS RTK system. The proposed self-driving vehicle is equipped with a global positioning system (GPS) receiver, a radio receiving data corrections from a base station, and a laser radar sensor for detecting obstacles ahead. Moreover, the system takes information about lanes and parking positions via an internet connection, derived from driving tests carried out manually at low speed.
Self-driving vehicles using GNSS RTK technology can be helpful in agriculture applications. In [9], the authors developed an autonomous driving system based on single-frequency GNSS RTK for a variable-speed sprayer to spray orchards with pesticide or insecticide poisoning. Therefore, the self-driving sprayers avoid human intervention during phytosanitary treatments, potentially harmful to operator health. The vehicle’s track is provided by a path generation algorithm, which defines it based on positions acquired by the GNSS RTK sensor. The sprayer vehicle is equipped with a GNSS receiver, a control board, and an LTE communication module.
The GNSS RTK is also used in teleoperated industrial machines, for example, in remotely controlled robots. In [10], Saponara et al. developed a teleoperated robot for accurately geolocate images acquired through stereoscopic cameras and allows a 3D reconstruction of the surrounding environment. The system includes onboard a positioning system based on the RTK technique using a GNSS receiver; the images are transmitted in real-time to the operator that controls the robot remotely. The approach can be used in works that would be dangerous if performed by humans, such as painting or waste removal, where accurate knowledge of the robot position is required. In [11], a system based on a LiDAR sensor and a GNSS receiver for the vineyard reconstruction based on GNSS RTK technology was presented. The LiDAR sensor and the GNSS antenna were mounted on the vehicle’s front. Through the integration of the LiDAR sensor’s positioning information taken from the GNSS receiver in RTK mode with the distance information obtained from the laser impacts, the 3D structure of the vineyard is realized.
The developed stake-out system can be used for other possible applications related to the design and inspection of the electrical energy distribution plants, for example, to precisely detect some faults and damages in cable ducts. In addition, the developed device can be used during the design phase of gas/oil transportation pipelines for fixing the strategic points’ coordinates related to the pipeline path in outdoor environments, given its portability and easy manageability. Furthermore, the designed device can be used for inspection tasks with centimeter accuracy for fault detection in energy production plants to better coordinate and manage the repair technical team, i.e., in very extended-area photovoltaic plants to precisely detect the position of damaged components. In these contexts, in [12], Muhammad et al. proposed a new approach for the cooperative monitoring of energy production plants (e.g., photovoltaic plats) using unmanned aerial vehicles (UAVs). In particular, they employed a compact drone equipped with a thermographic camera for detecting defects on PV modules framed by the camera, recording their positions by using an onboard GNSS RTK receiver. Moreover, AUVs can be used to determine the health status of mechanical components of energy production systems, such as the blades of wind generators, thanks to visual inspection techniques, and provide immediate feedback on the defect position using GNSS RTK positioning data [13].
In [14], the authors presented an autonomous ground vehicle (AGV) to detect, locate, and identify buried pipelines and cable ducts in harsh environments. The device is equipped with a pipe locator system for determining the buried pipeline, as well as a GPS module for recording its coordinates every 10 s, allowing it to reconstruct its path. Similarly, in [15], the authors introduced an autonomous surface vehicle (ASV) to localize and identifying offshore wind turbines and related submarine cable ducts. The developed device used both GPS RTK technology and IMUs to determine the vehicle position, representing the reference for 3D Lidar and Multibeam echosounder (MBES) sonar scanning, thus improving the positioning accuracy. The carried tests demonstrated a positional error equal to 0.07 m on real data. Cantieri et al. proposed a novel architecture based on UAVs and UGVs to safely inspect the high-voltage pylons [16]. Both the device typologies are equipped with a low-cost GPS-RTK module for precisely determining the vehicle position and an embedded Full-HD camera for monitoring the pylon conditions.
This research work proposes a stake-out system that uses a geolocation device to physically locate points on a track (Figure 1) through high-accuracy positioning data provided by a GNSS RTK receiver, specifically the VBOX 3iSR, which is a GNSS-aided inertial navigation system (INS) capable of working in RTK mode [17]. The VBOX 3iSR is manufactured by Racelogic Inc. company (Buckingham, UK) and is available in the Porsche Technical Center. The developed geolocation device supports the user to locate pre-established geographical points on the ground with centimeter accuracy. The VBOX 3iSR INS has a slightly worse horizontal positioning accuracy than previously mentioned commercial products but has a greater positioning data rate; in fact, it was developed for vehicle tests in which a high positioning data rate is required to track a car moving fast instead of extremely high positioning accuracy. Figure 2 shows the schematic representation of the stake-out system with the geolocation device acting as a rover, namely, a portable pole with various elements and sensors: the VBOX 3iSR INS as GNSS RTK receiver, a compass to establish the direction to follow according to on-tablet indications provided by the field survey software, a GNSS antenna on the pole top, a radio modem, a battery, and a bubble to guarantee the device verticality during operation. The field survey software is FieldGenius (developed by MicroSurvey Inc. company, West Kelowna, BC, Canada), which uses the positioning data from the VBOX 3iSR INS, with centimeter-level accuracy, to provide the user indications to reach the target points. The VBOX 3iSR INS receives corrections through radio communication from the base station available in the Nardò Technical Center and manufactured by Genesys Inc. [18] (Daly City, CA, USA). Both the VBOX 3iSR and the Genesys base station are described in Section 2.1. Therefore, a private base station was employed, covering the whole surface of the proving ground and independent of any GNSS station network (e.g., EUREF GNSS stations). The Genesys base station works with the WGS84 Cartesian geodetic reference system, mostly used in automotive test centers being compatible with Google Earth, unlike EUREF GNSS stations using the ETRS89 geodetic Cartesian reference system.
Before locating the set of points constituting the vehicle test on the track through the geolocation device, each point has to be located in an Earth coordinate system. Points are initially defined in a Cartesian reference system; then, a coordinates transformation from the latter to the Earth coordinate system is necessary (Figure 3). A software app (called Matlab Mapbox because it uses Mapbox website satellite maps) was developed that, starting from points defined in a Cartesian reference system, the axes origin position on the Earth surface, and the y-axis orientation concerning the cardinal north, provides a text file containing the set of points defined in the Universal Transverse Mercator (UTM) coordinate system (Figure 4). As detailed in Section 2.2, the developed application requires inserting the location UTM zone where the stake-out operations are carried out (for our tests, UTM zone equal to 33 related to the south of Italy). After, the points in UTM coordinates are imported into FieldGenius by uploading the Mapbox app text file; as FieldGenius requires the points defined on a plane Earth reference system, the UTM coordinates were chosen. Moreover, the transverse projection of UTM coordinate system performs a transformation from a geodetic reference system to a plane one, and vice versa, without altering distances and angles.
FieldGenius software guides the user sequentially to the points, providing indications related to the distance required to reach each one in the north and east directions (Figure 5a); the compass aids the user to follow the FieldGenius indications. Once the target point has been reached, the user checks the pole verticality using the bubble and marks the point with a cone (Figure 5b). This operation is repeated for all the points of the test configuration (Figure 5c).

2. Materials and Methods

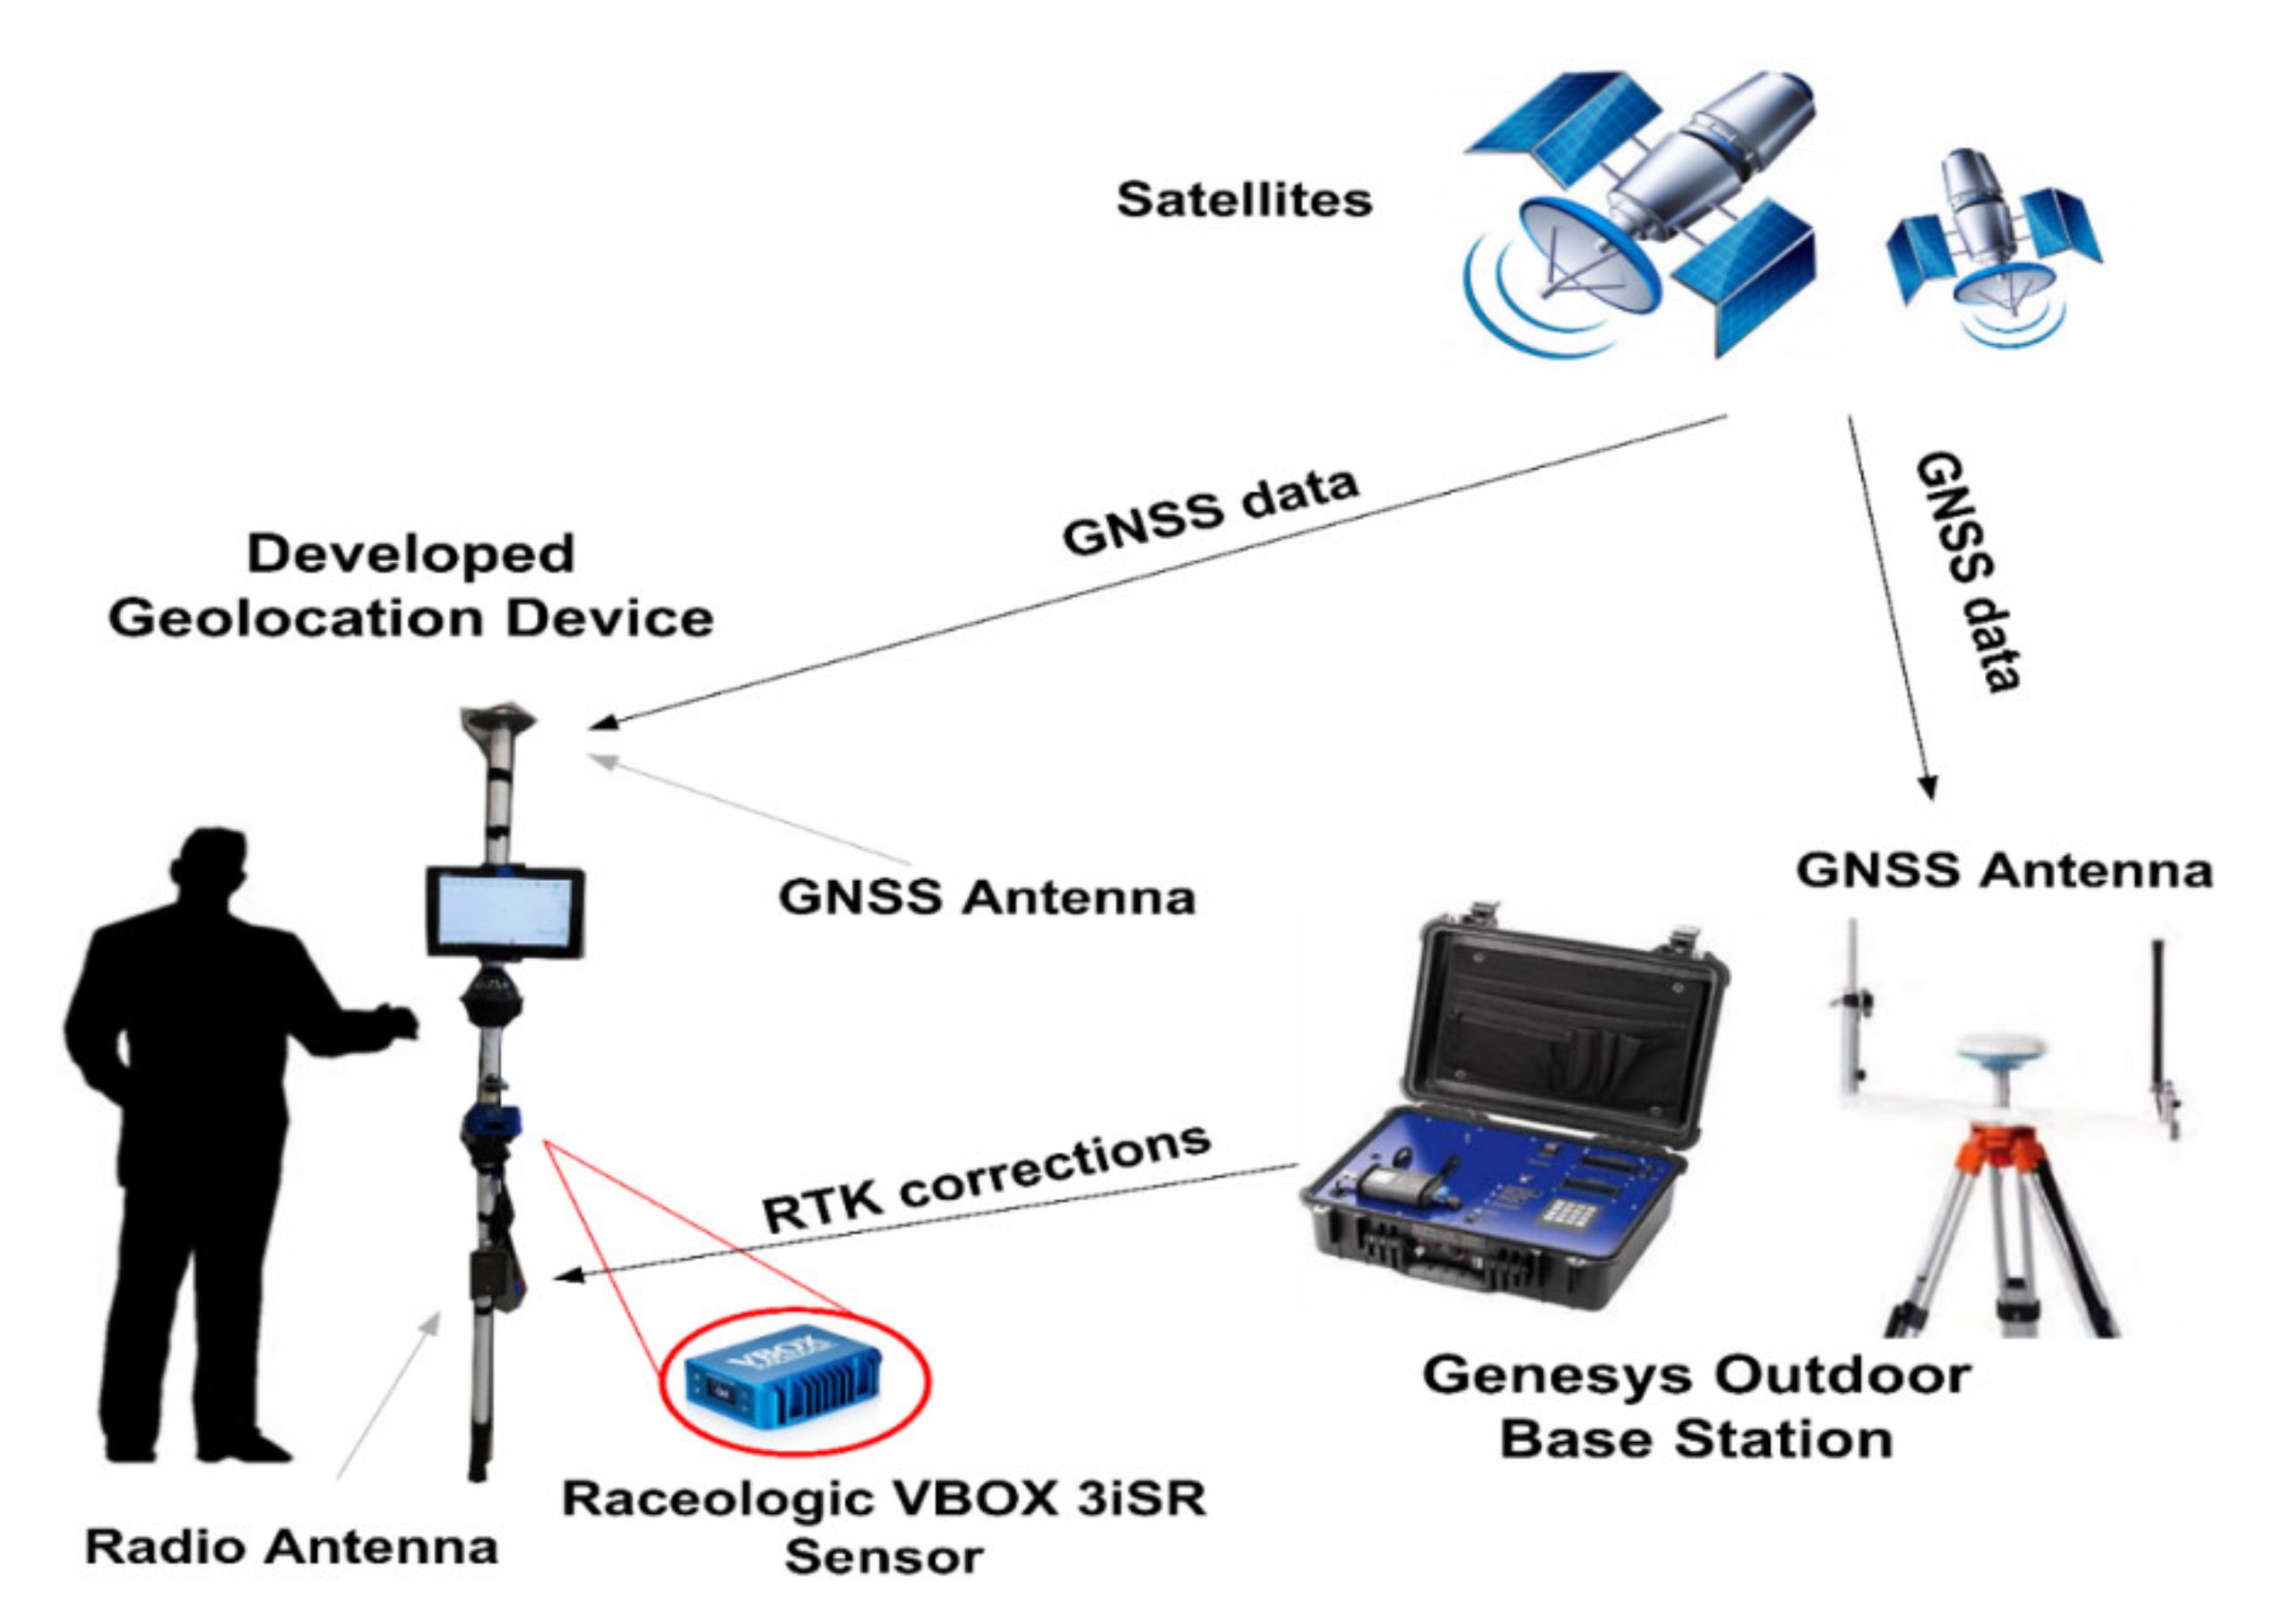
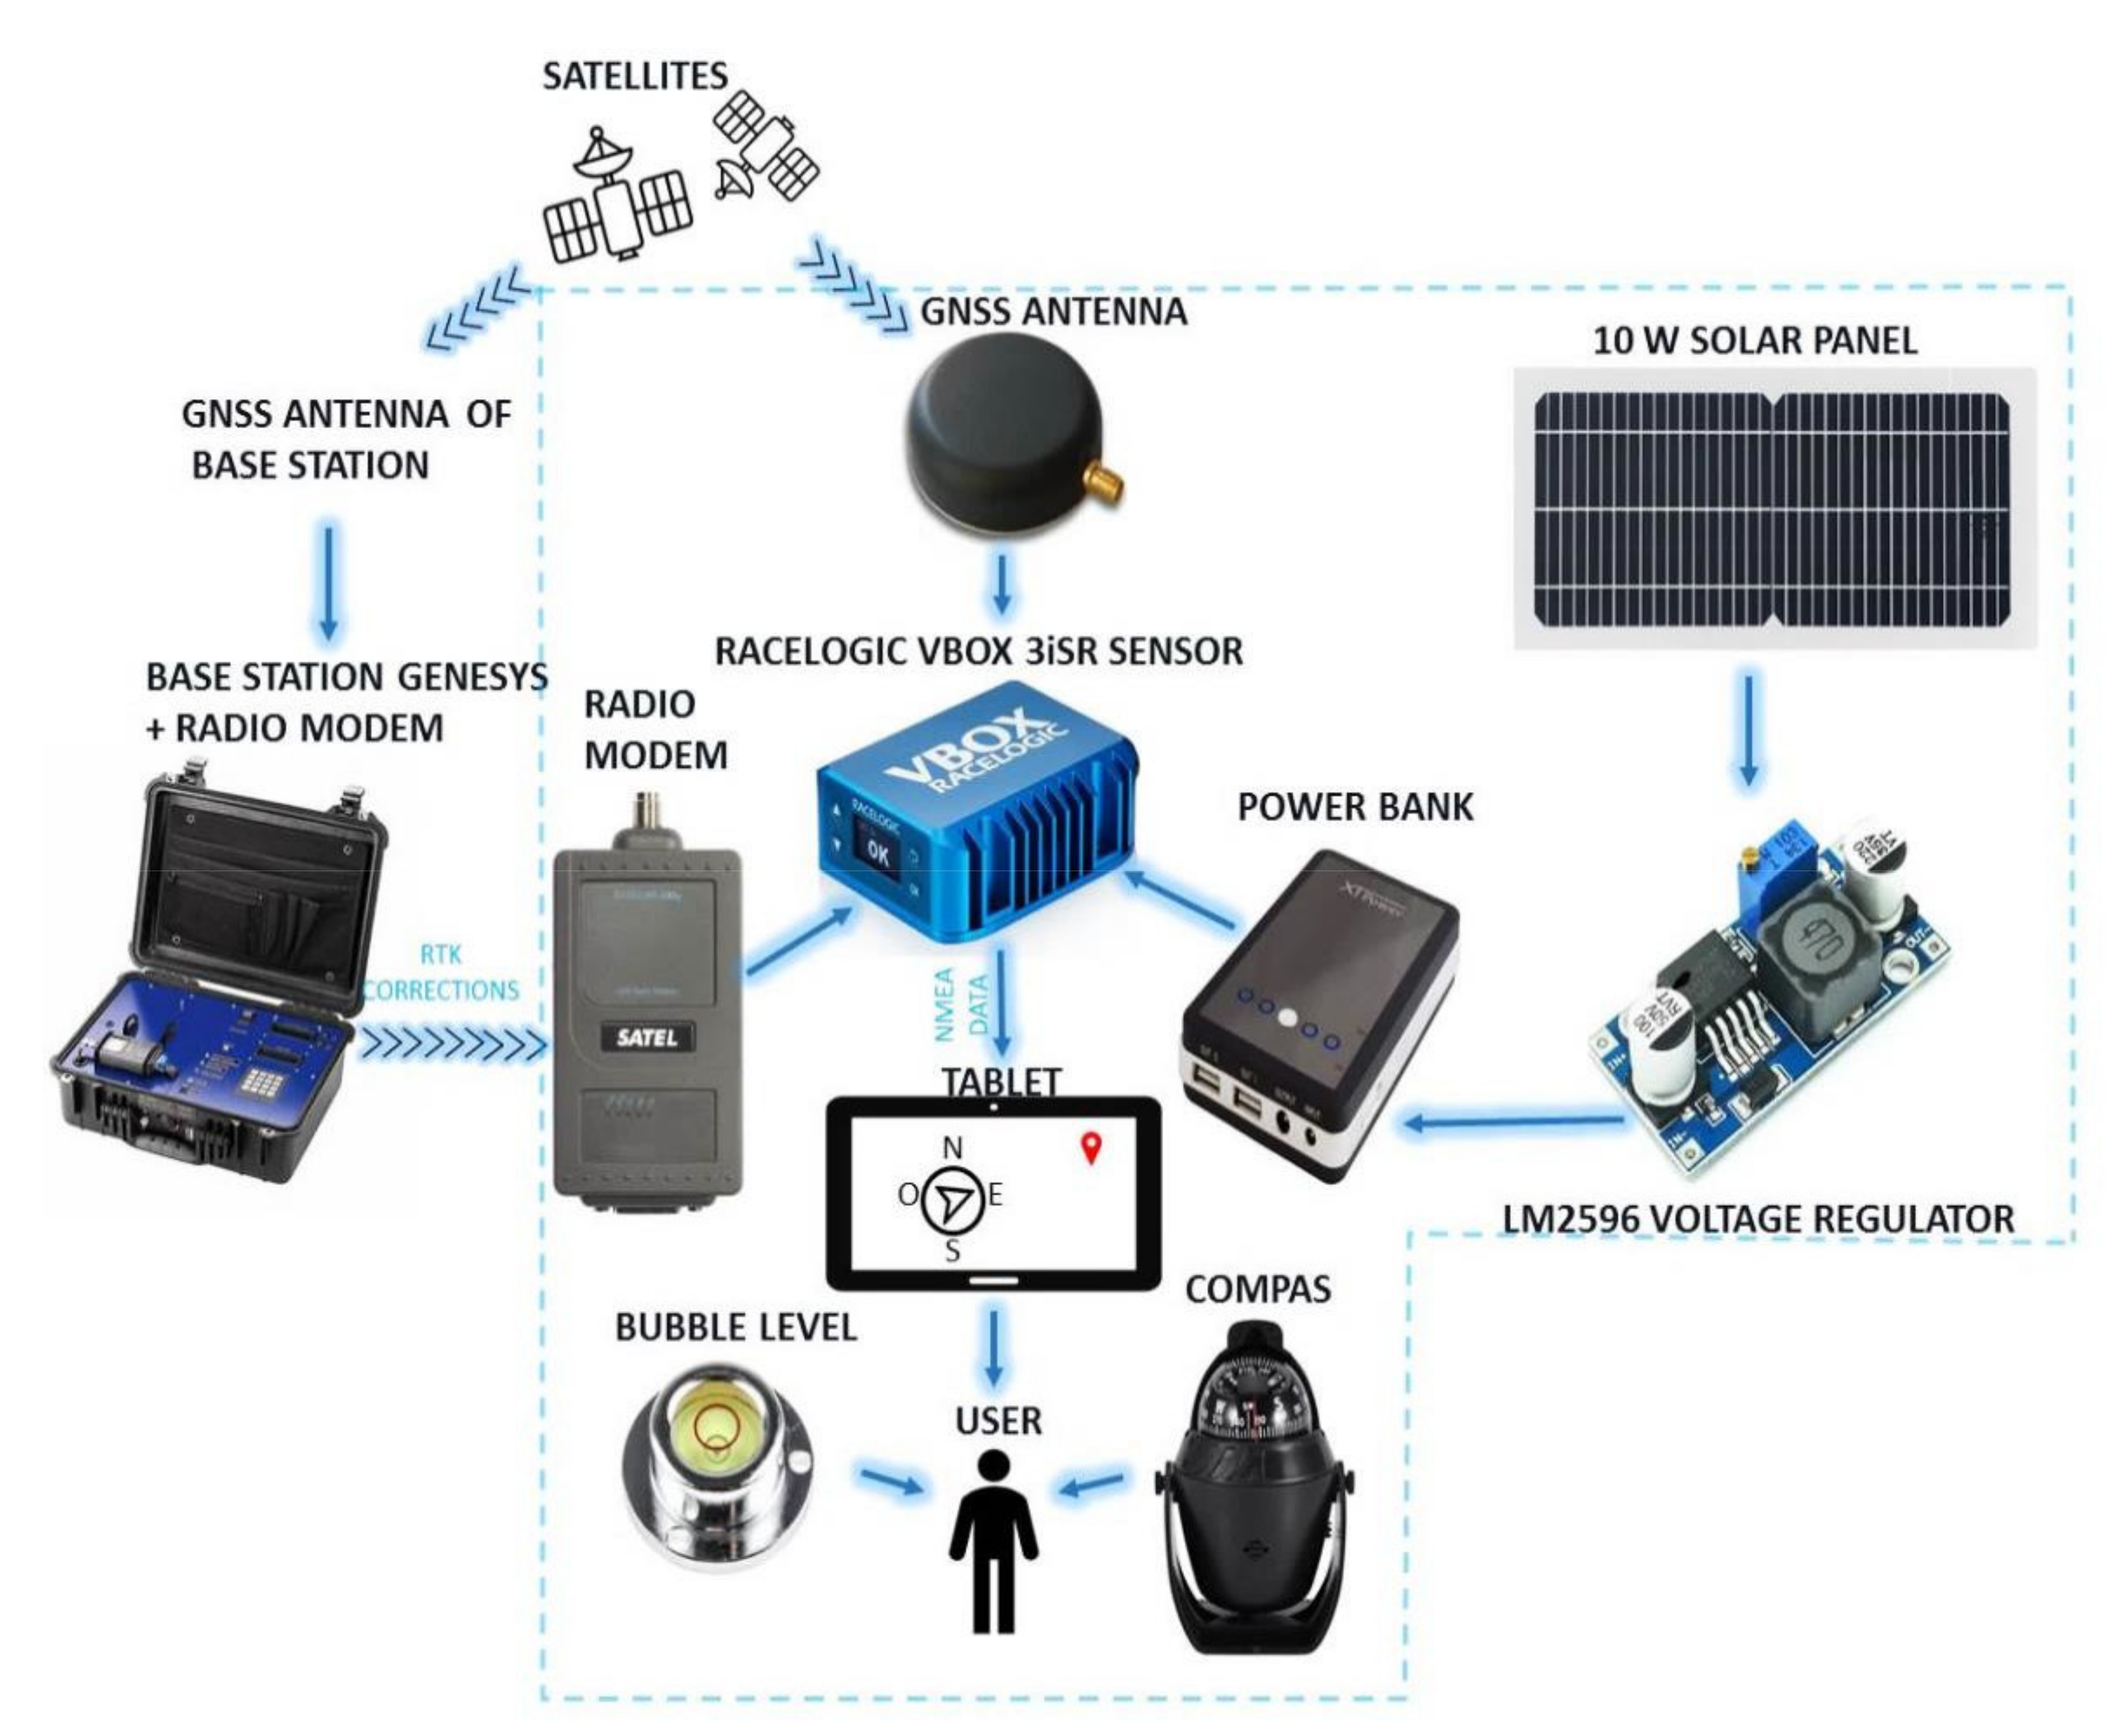
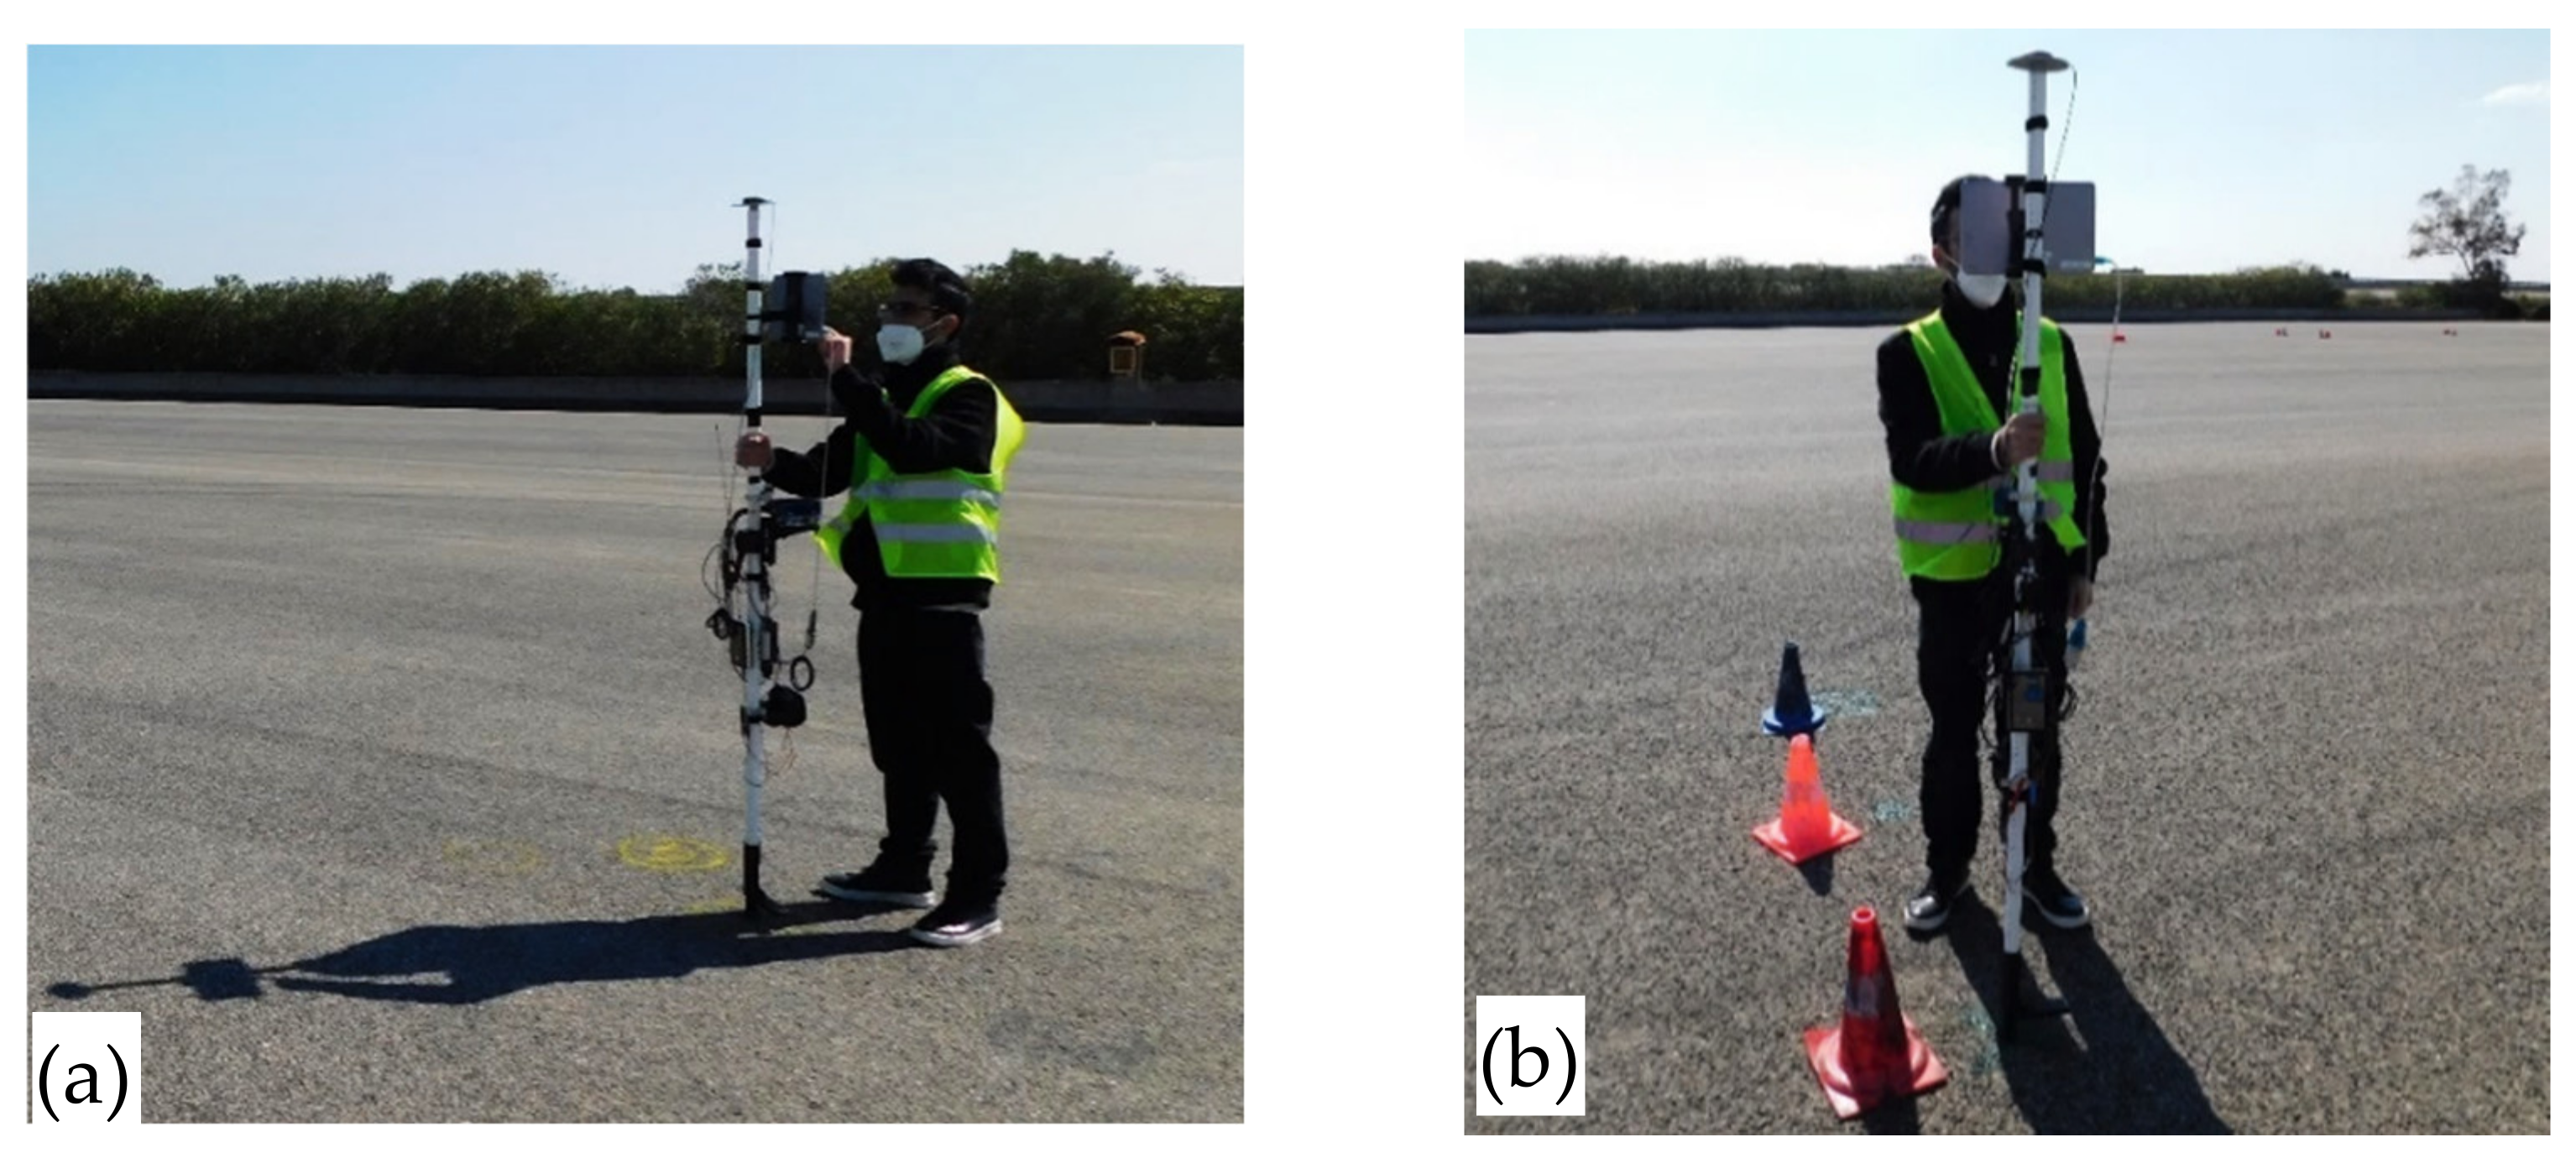
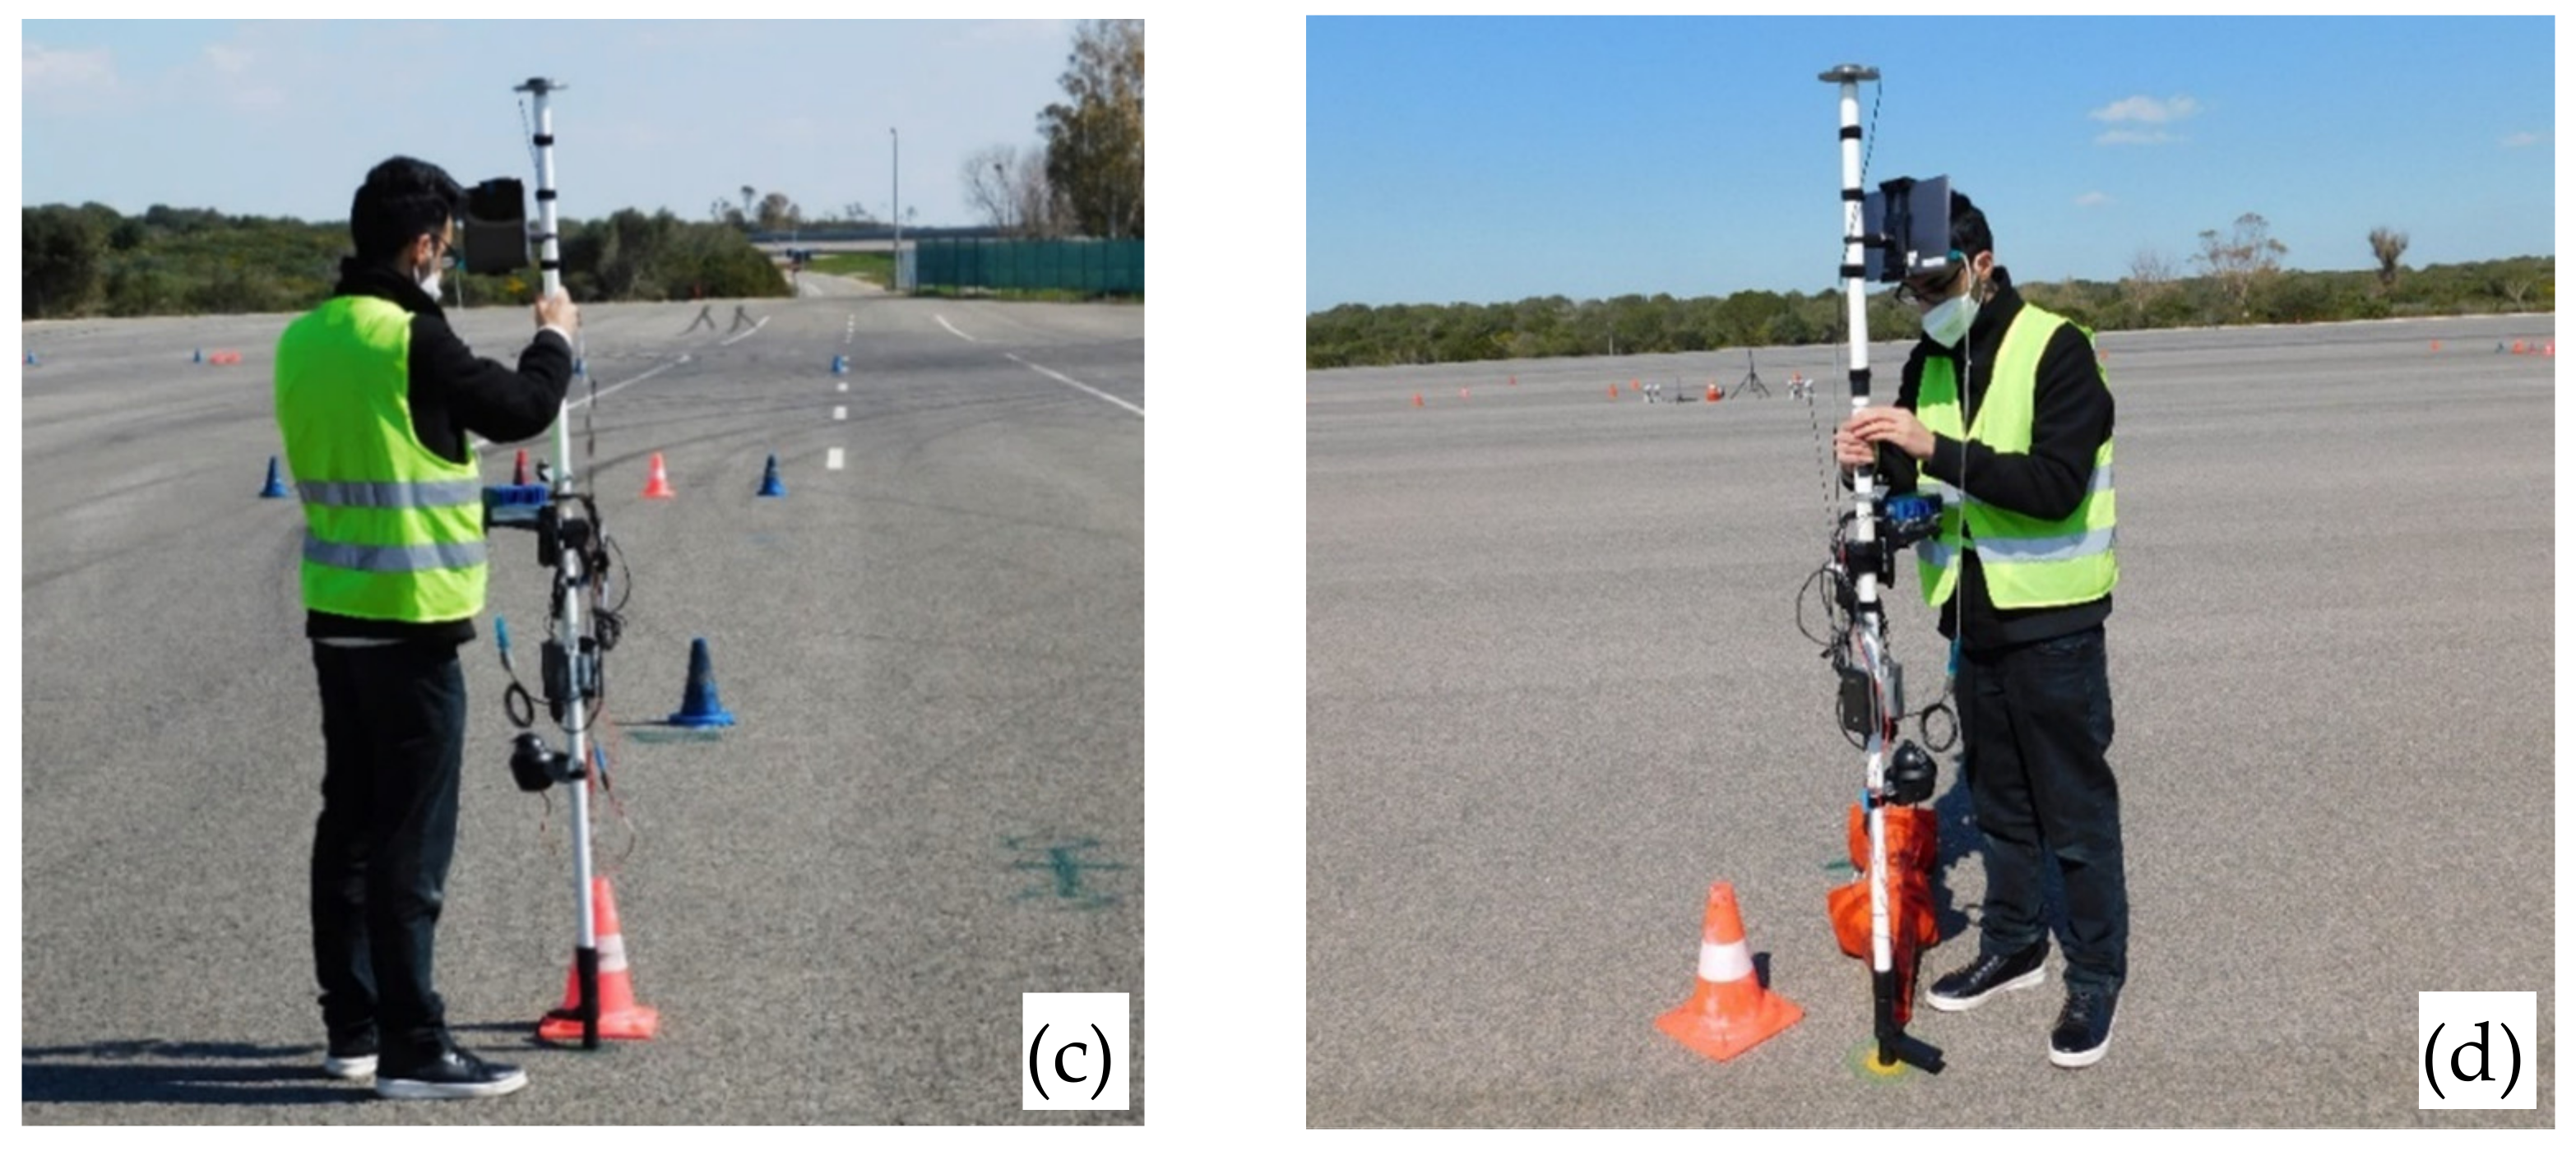
2.1. GNSS RTK-Based Stake-out Device: Technical Features and Functionalities of Used Components

This sub-section describes the geolocation device architecture in detail; Figure 6 shows a scheme with all the employed instruments along with necessary connections. As the user on the proving ground must hold it, its structure is light as possible to guarantee manageability and easy transportation. The chosen structure is a vertical pole with all the necessary elements fixed on it. The device’s position must be real-time geolocated with high precision, and therefore, the VBOX 3iSR INS was used; the latter combines measurements from the GNSS receiver (100 Hz RTK GPS/GLONASS) and wheel speed with those provided by the Inertial Measurement Unit (IMU) to accurately determine the position, speed, acceleration, attitude, and angular velocity of a vehicle [17]. VBOX 3iSR INS can also work as a GNSS-only mode (satellite receiver) by disabling the IMU and wheel speed data. All the tests shown in this paper were carried out with GNSS-only mode.
The VBOX 3iSR positioning accuracy is up to 2 cm with 95% circle of error probable (CEP) in RTK and up to 3 m with 95% CEP in standalone mode (no corrections) [19,20]. The VBOX 3iSR INS receives RTK corrective messages (protocol RTCM v.3.1) from the base station in the 403–473 MHz frequency range through an external radio modem. The Genesys base station, located inside the Porsche Technical Center, integrates a Novatel L1/L2 GNSS receiver supporting GPS, GLONASS, BeiDou, and Galileo satellite systems [18].
The VBOX 3iSR INS is connected to an external GNSS antenna placed on the pole top to have a better satellite view. Since the GNSS antenna position does not lie on the ground, it is crucial to keep the pole vertical during operations so that the antenna center horizontal coordinates coincide with those of the pole end in contact with the ground. For this aim, the device is equipped with a bubble level to correctly place the pole while fixing a point on the ground. A power bank feeds the VBOX 3iSR INS, which supports a supply voltage in the range 6.5–30 V (the supplier recommends 12 V); VBOX 3iSR INS, in turn, powers both the radio modem and GNSS antenna. Since the user needs to know the cardinal directions, a compass was included. The tablet is connected to VBOX 3iSR INS through a custom cable. The used elements are described as follows:
-
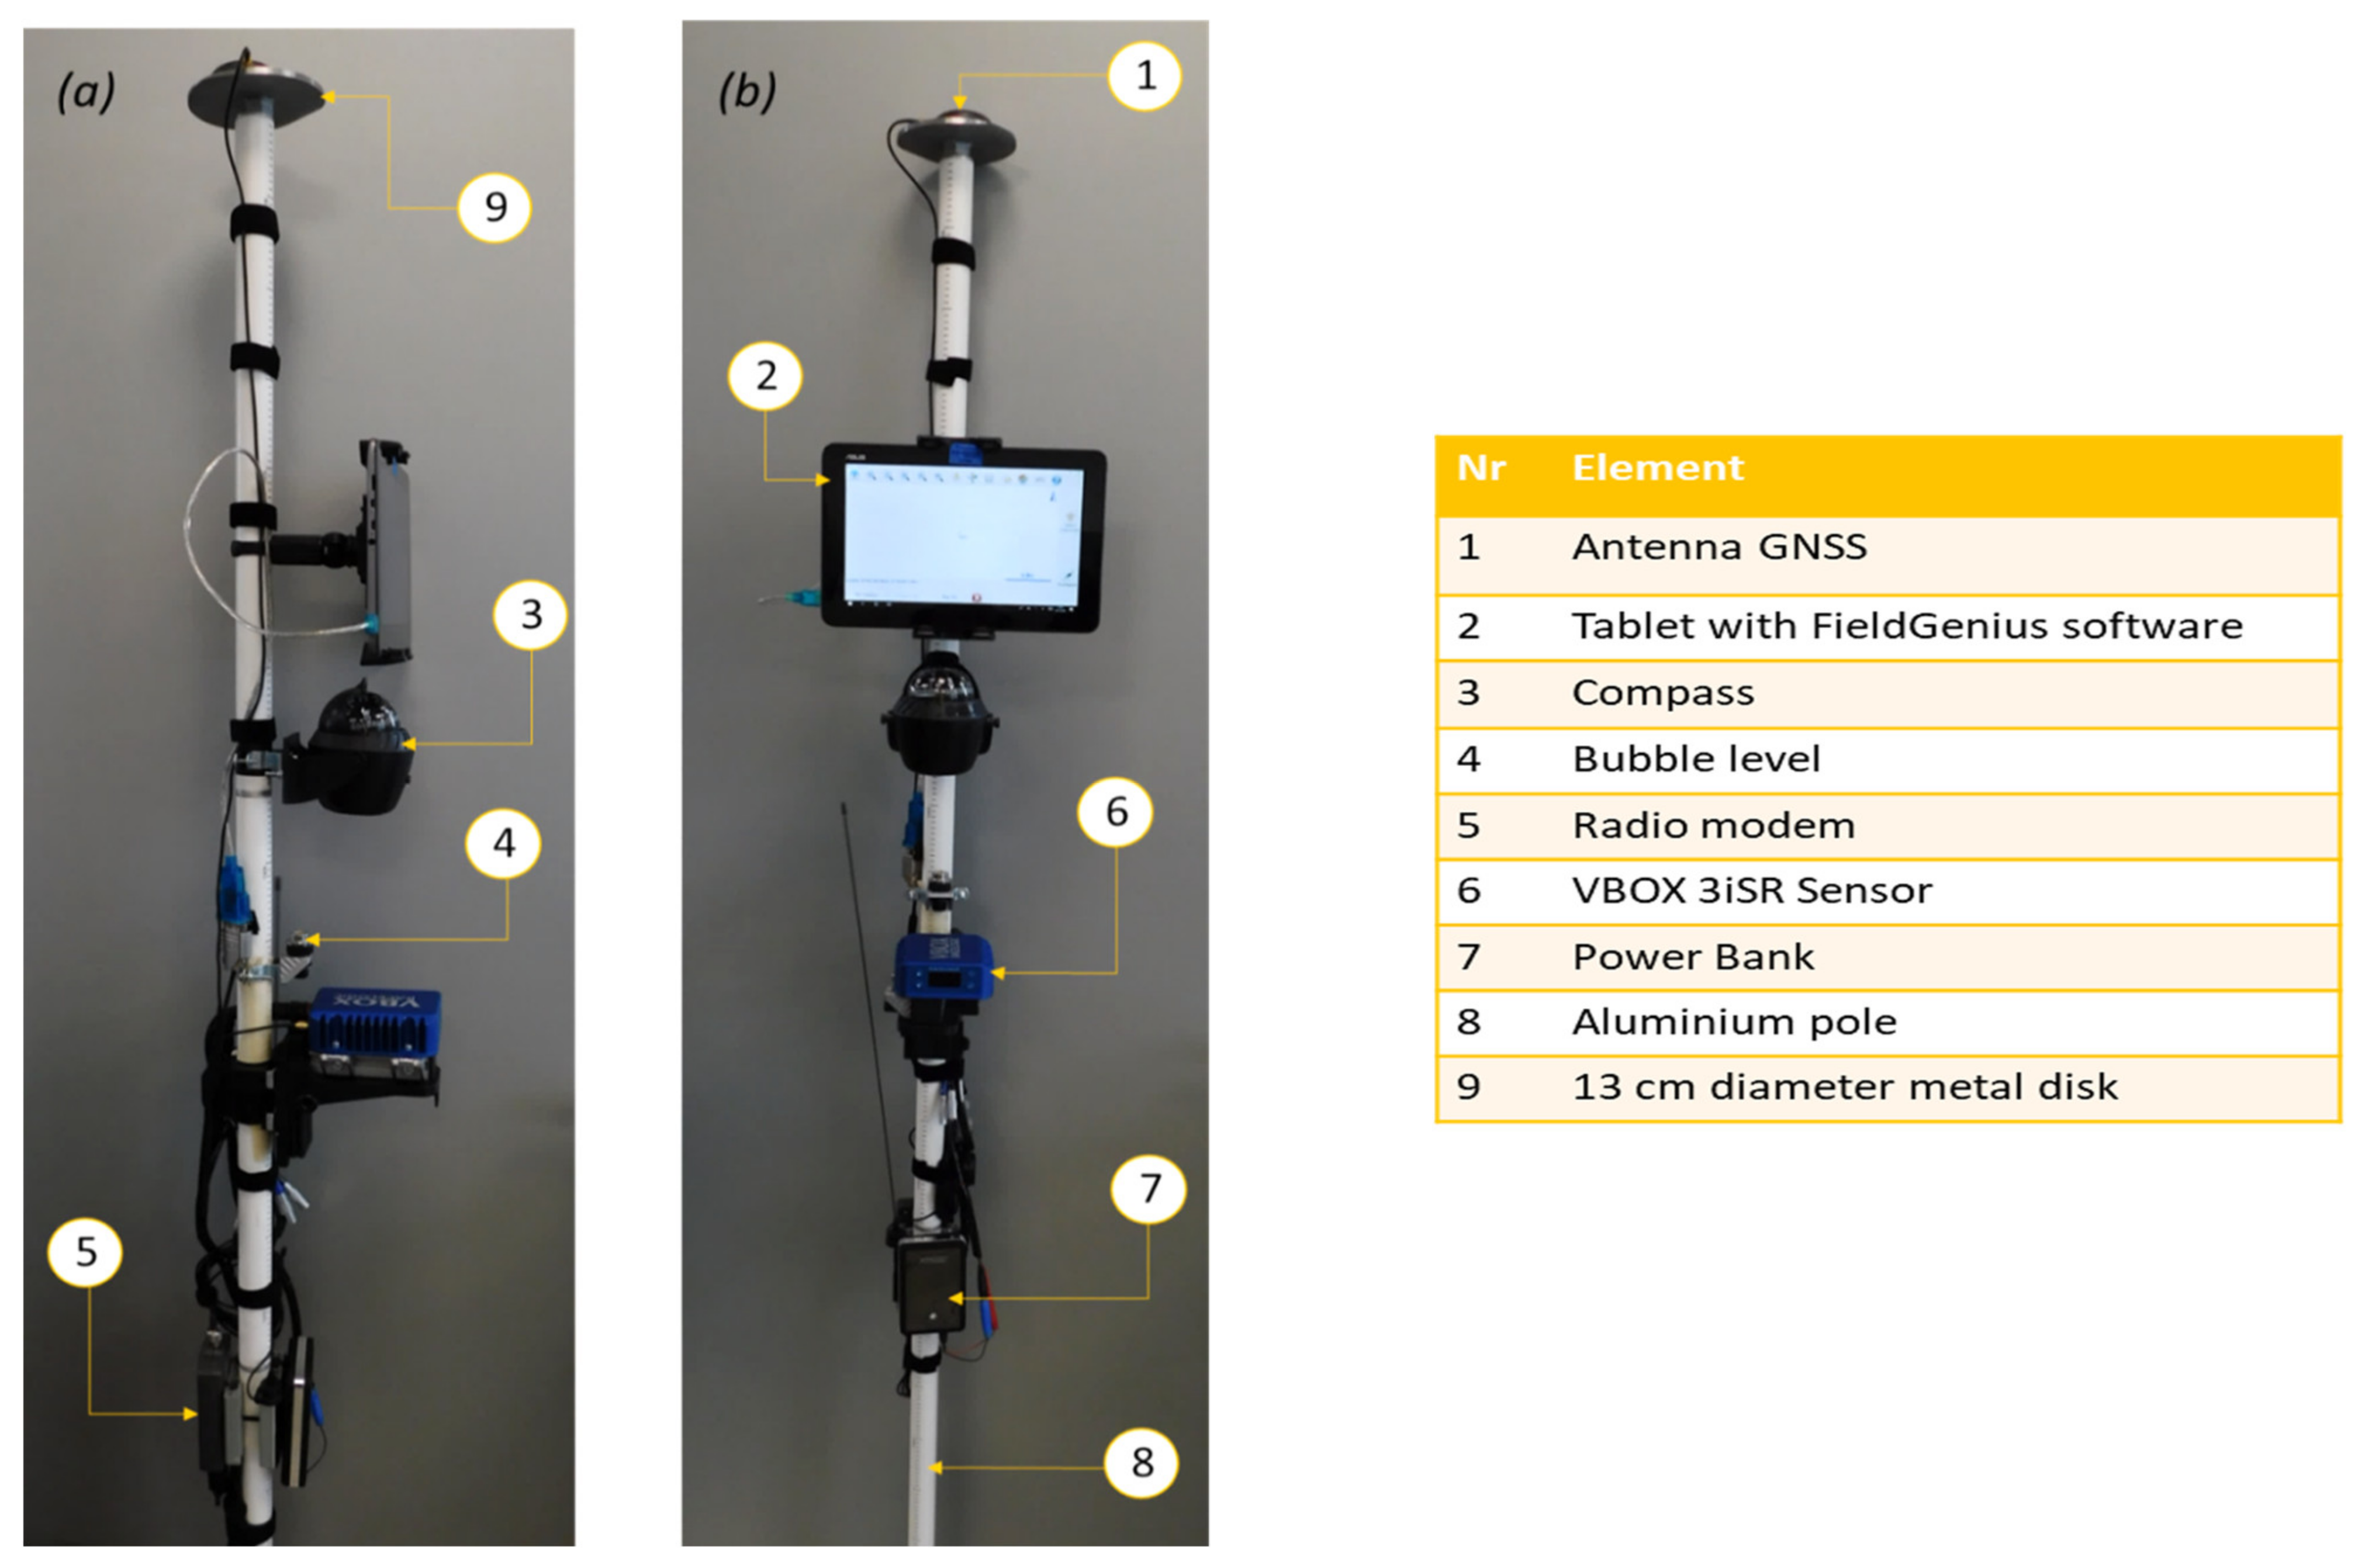
Compass: manufactured by Dioche, it shows the user the cardinal directions to correctly reach the destination points according to FieldGenius indications.
-
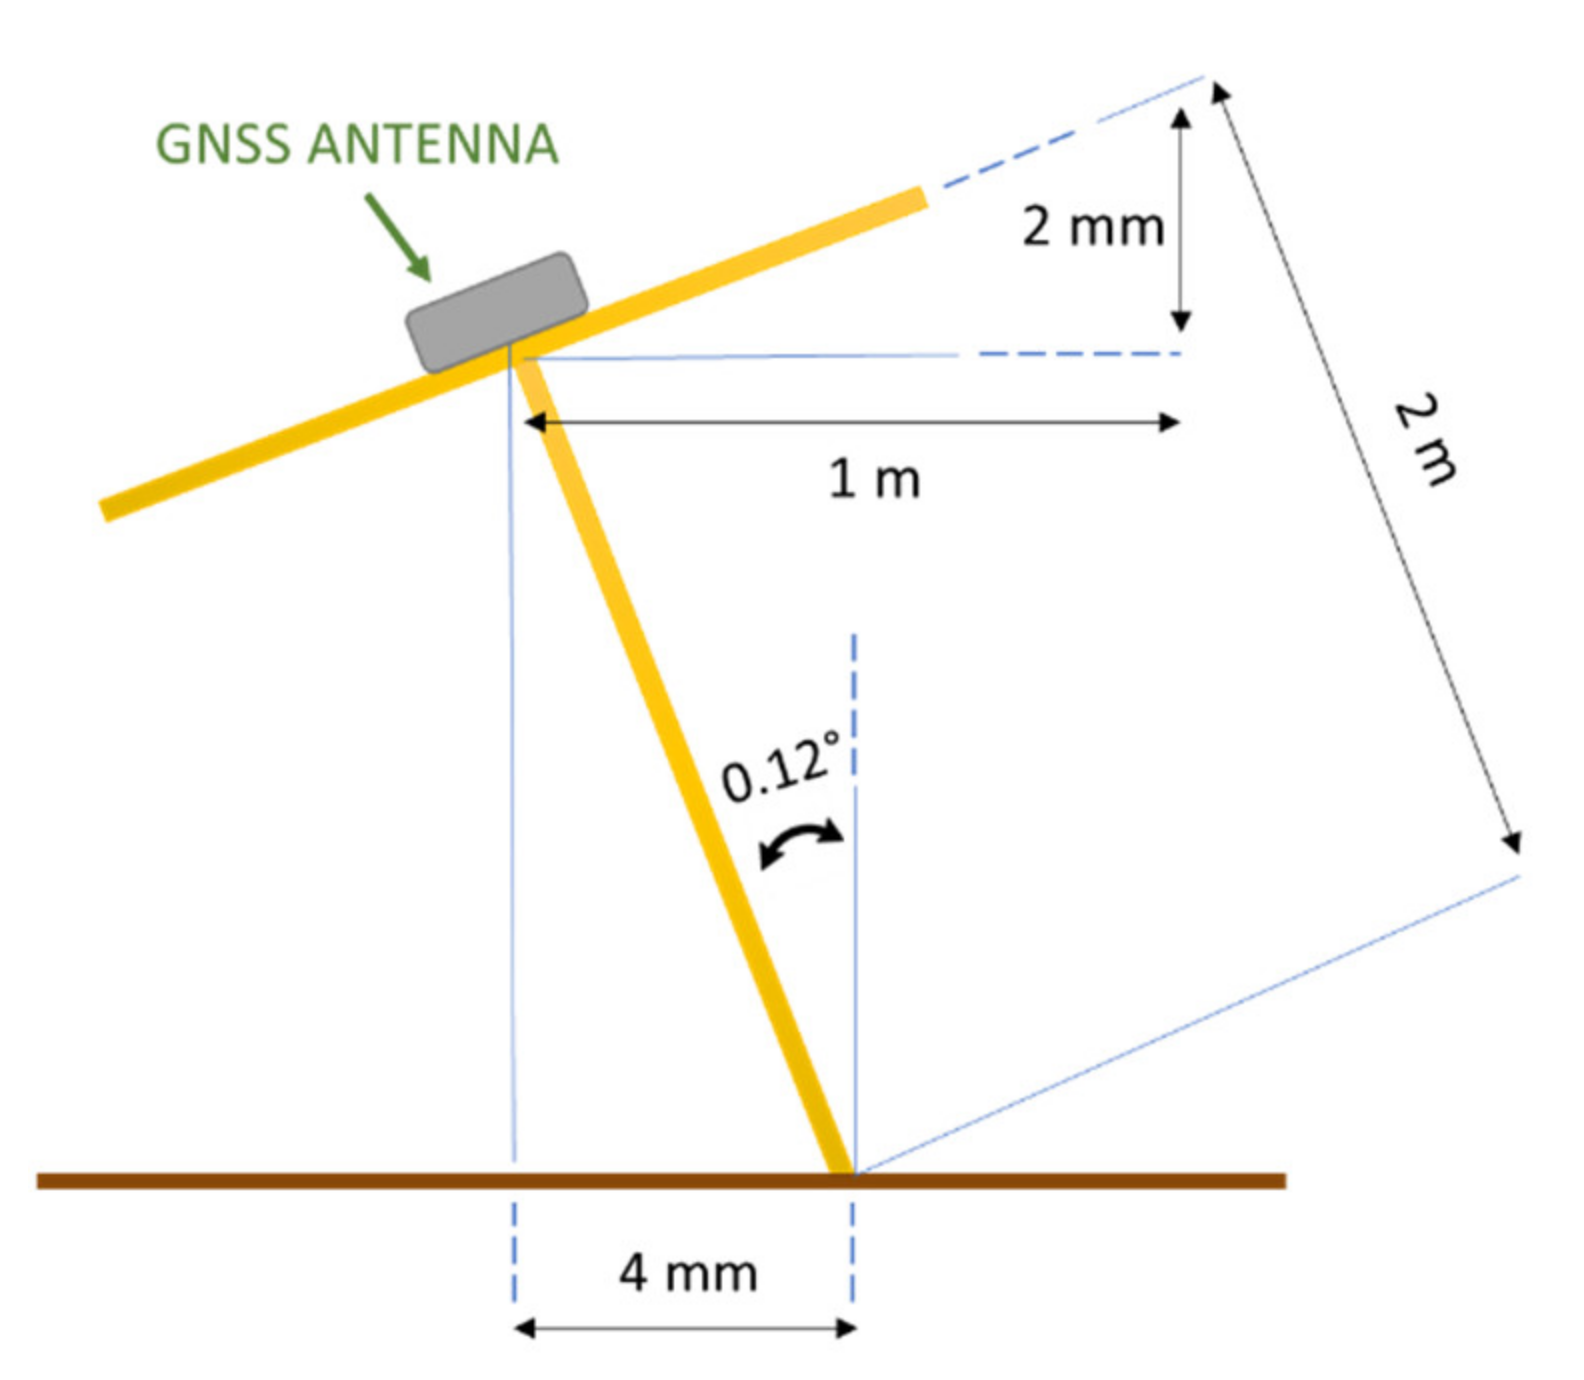
Bubble level: it helps the user keep the pole vertical since its inclination can be a positioning error source. The circular bubble level (21.5 mm diameter), manufactured by RS Pro [21], is mounted perpendicular to the pole axis. Its accuracy is 2 mm/m, that is, if the level is oriented parallel to the ground so that the bubble is within the red circle, a deviation error of 2 mm/m from the right plane parallel to the ground is generated. This deviation results in an angular error equal to 0.12° (Figure 7). Being the GNSS antenna positioned 2 m from the pole end in contact with the ground, the positioning error ε due to the bubble level inaccuracy is:
ε = l sen(θ) = 4 mm
In (1), l represents the pole length (2 m in this calculation), θ the angular error.
-
Power bank: a 12 V power bank with 37 Wh capacity powers the VBOX 3iSR INS [22]. The 12 V voltage is supplied by the output connector able to deliver up to 2 A (VBOX 3iSR max absorbed current is 0.625 A corresponding to 7.5 W power [17]). The 37 Wh capacity ensures a 5 h operation of the VBOX 3iSR INS in the case of maximum current absorption [23].
-
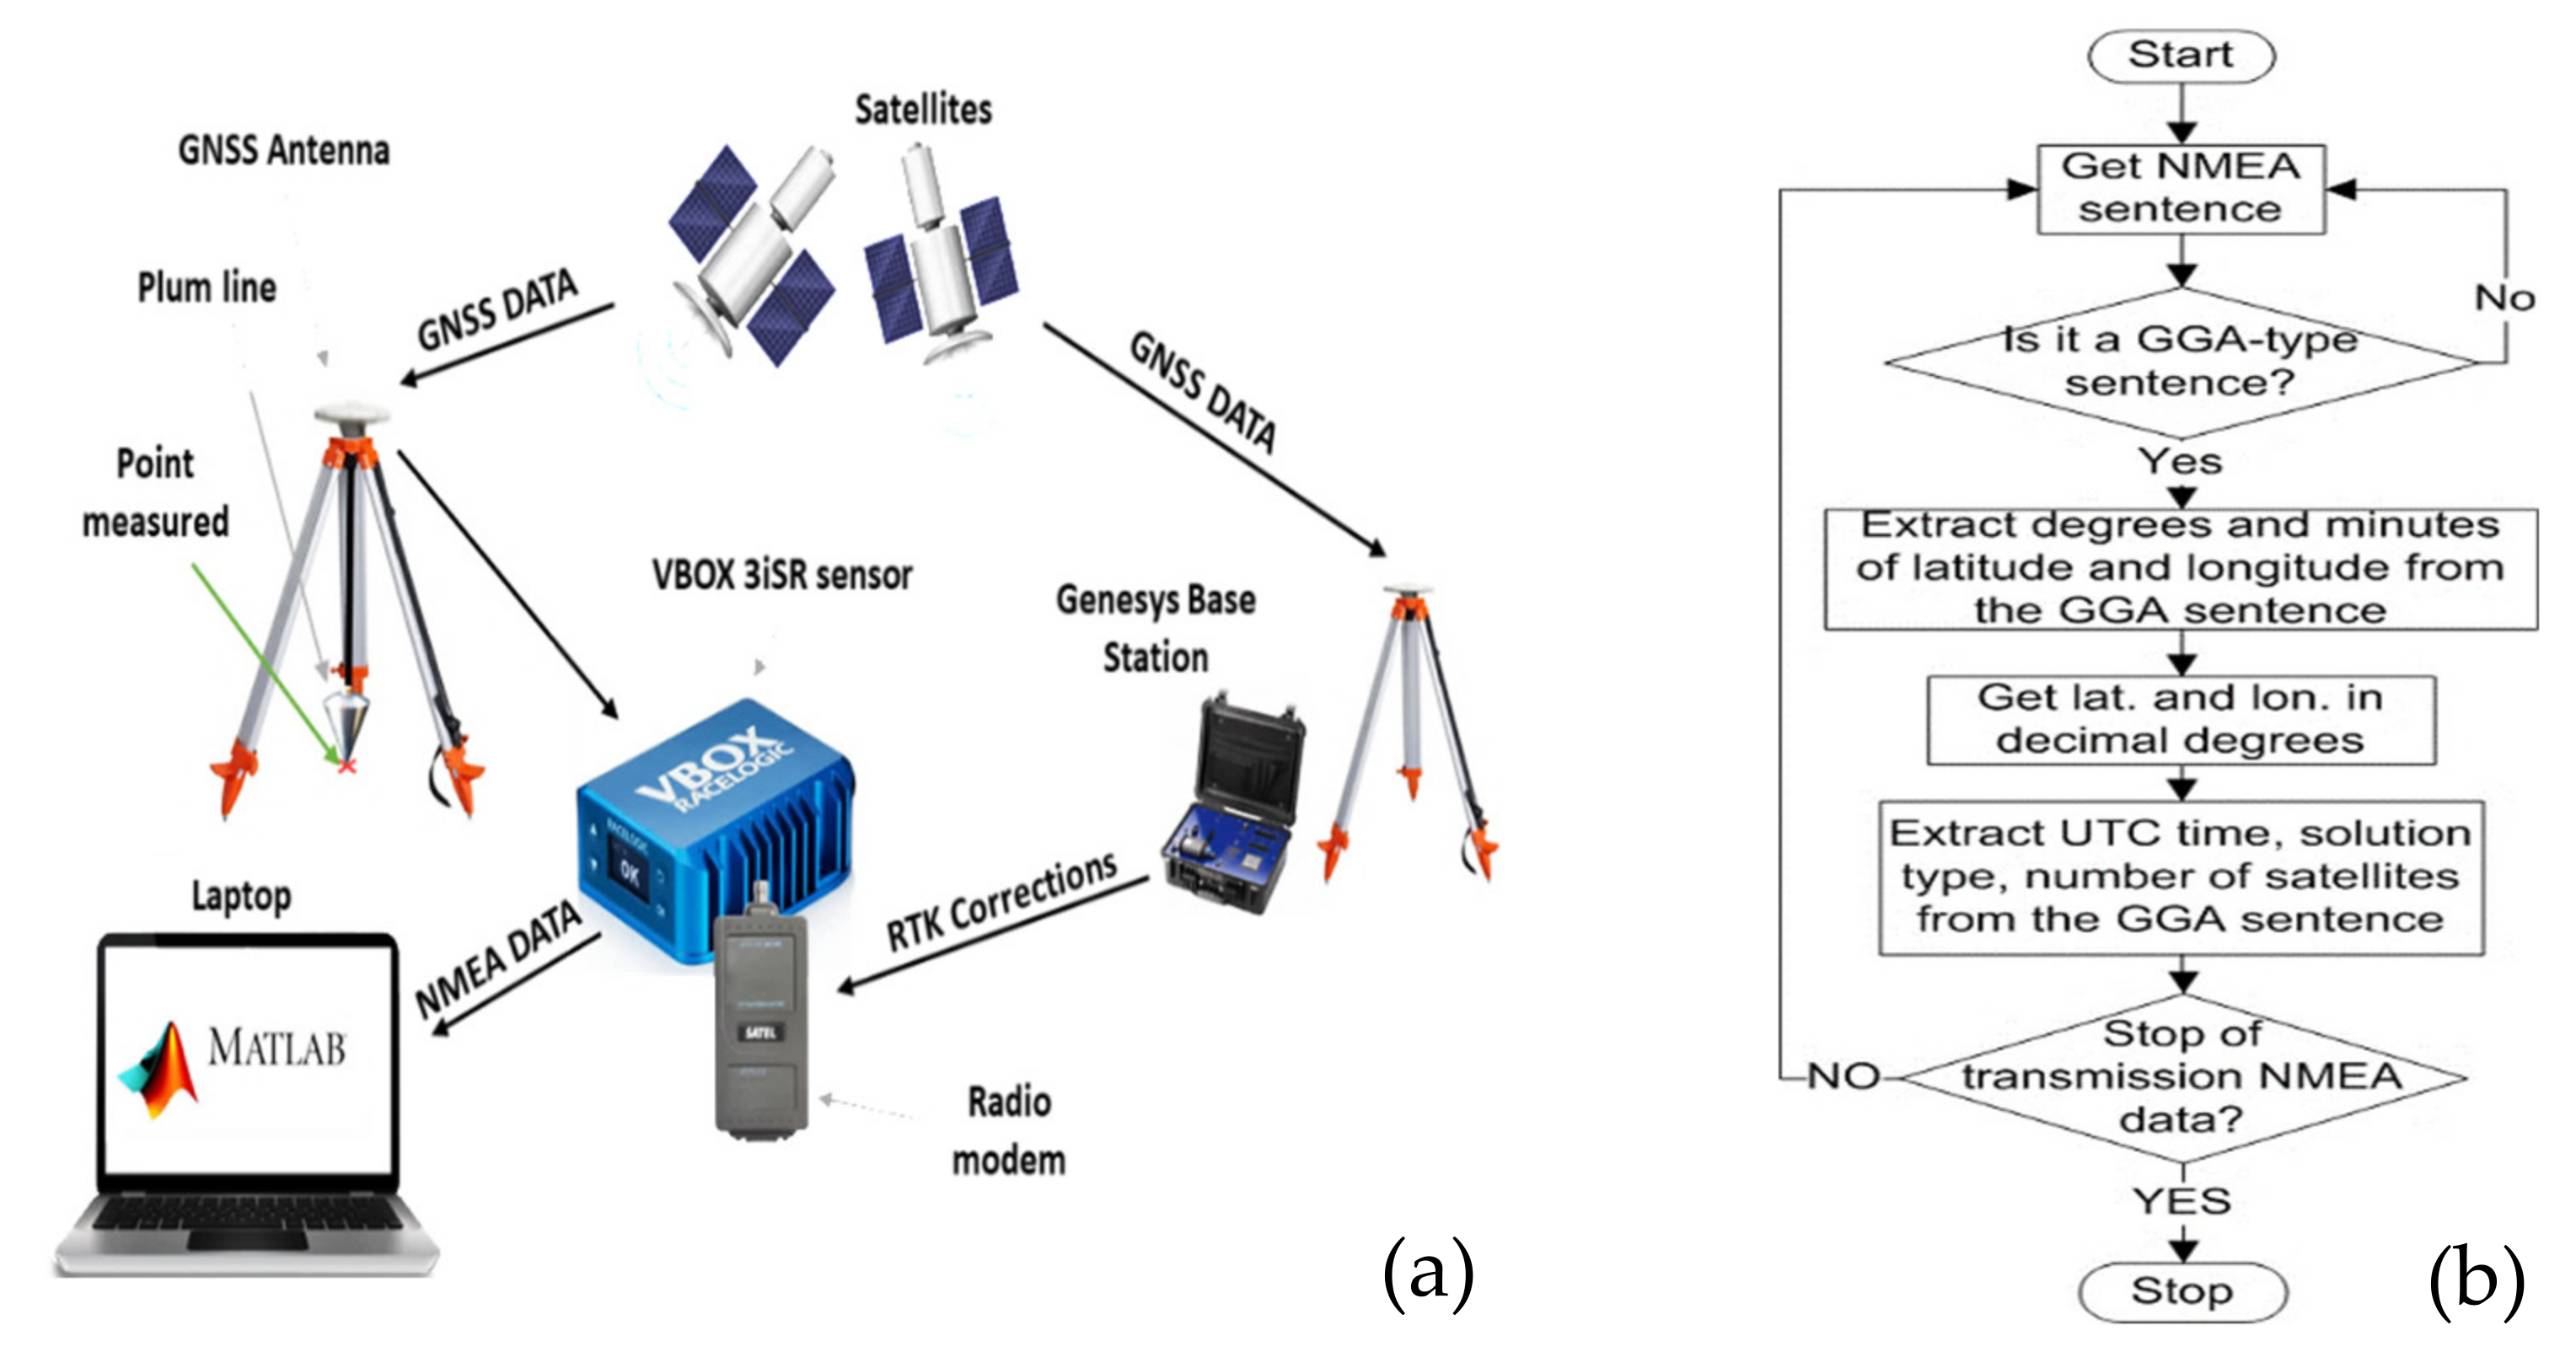
GNSS Antenna: model RLACS156 manufactured by Raceologic [24], it is placed on the pole top to obtain a better satellite signals reception (supported frequency band 1574–1606 MHz). According to supplier indication, the antenna (circular with diameter 57 mm) is placed on a metal disk that acts as a ground plane or reflector (diameter 13 cm, thickness 1 cm), with both centers lying on the pole axis [25]. The metal disk redirects the antenna back reception in the frontal direction, improving its gain; however, if it is placed too close to the antenna, the image current produced on the surface can be detrimental to the antenna efficiency [26]. It must be placed a wavelength quarter away from the antenna base so that the back-lobes undergo a 180° phase shift leading to a destructive combination [27].
-
Radio modem: model Satel Satelline-Easy; it allows the VBOX 3iSR INS to receive RTK corrections from the base station (frequency range 403–473 MHz) [28].
Both the compass and bubble level have been positioned to be visible to the user when standing. Figure 8 shows the stake-out geolocation device with its components numbered; Figure 9 shows its use on the track. In Figure 9a, the user selects on the FieldGenius software the points to be staked out; then, they move toward the target points by following indications provided by the software and compass (Figure 9b); in Figure 9c, the operator quickly locates the points on the track’s large space with centimeter accuracy and places the road cones on them. In Figure 9d, the user uses the geolocation device to acquire and save the point coordinates previously marked on the ground.
Optionally, the developed geolocation device can be equipped with a solar charging system for extending its autonomy when used in outdoor scenarios for longer than 5 h to avoid work interruption for battery recharging; in particular, it can be easily mounted on the pole through a quick-release bracket. The charging system comprises a lightweight and efficient 10 W monocrystalline solar panel (model XPG-10W-20W, manufactured by Xinpuguang Co., Ltd., Henan, China), featured by maximum operating voltage and current equal to 18 V and 600 mA, 21.6 V open-circuit voltage, 550 mA short-circuit current, dimensions 440 × 190 × 3mm, and weight 380 g (Figure 6). Moreover, the system includes a step-down regulator board based on the LM2596 IC, mounted on the solar panel back; it is an adjustable buck controller able to drive up to 3 A loads with a good line (<0.1%) and load (±4%) regulation; it was adjusted to provide 12 VDC applied to the battery pack through the power jack.

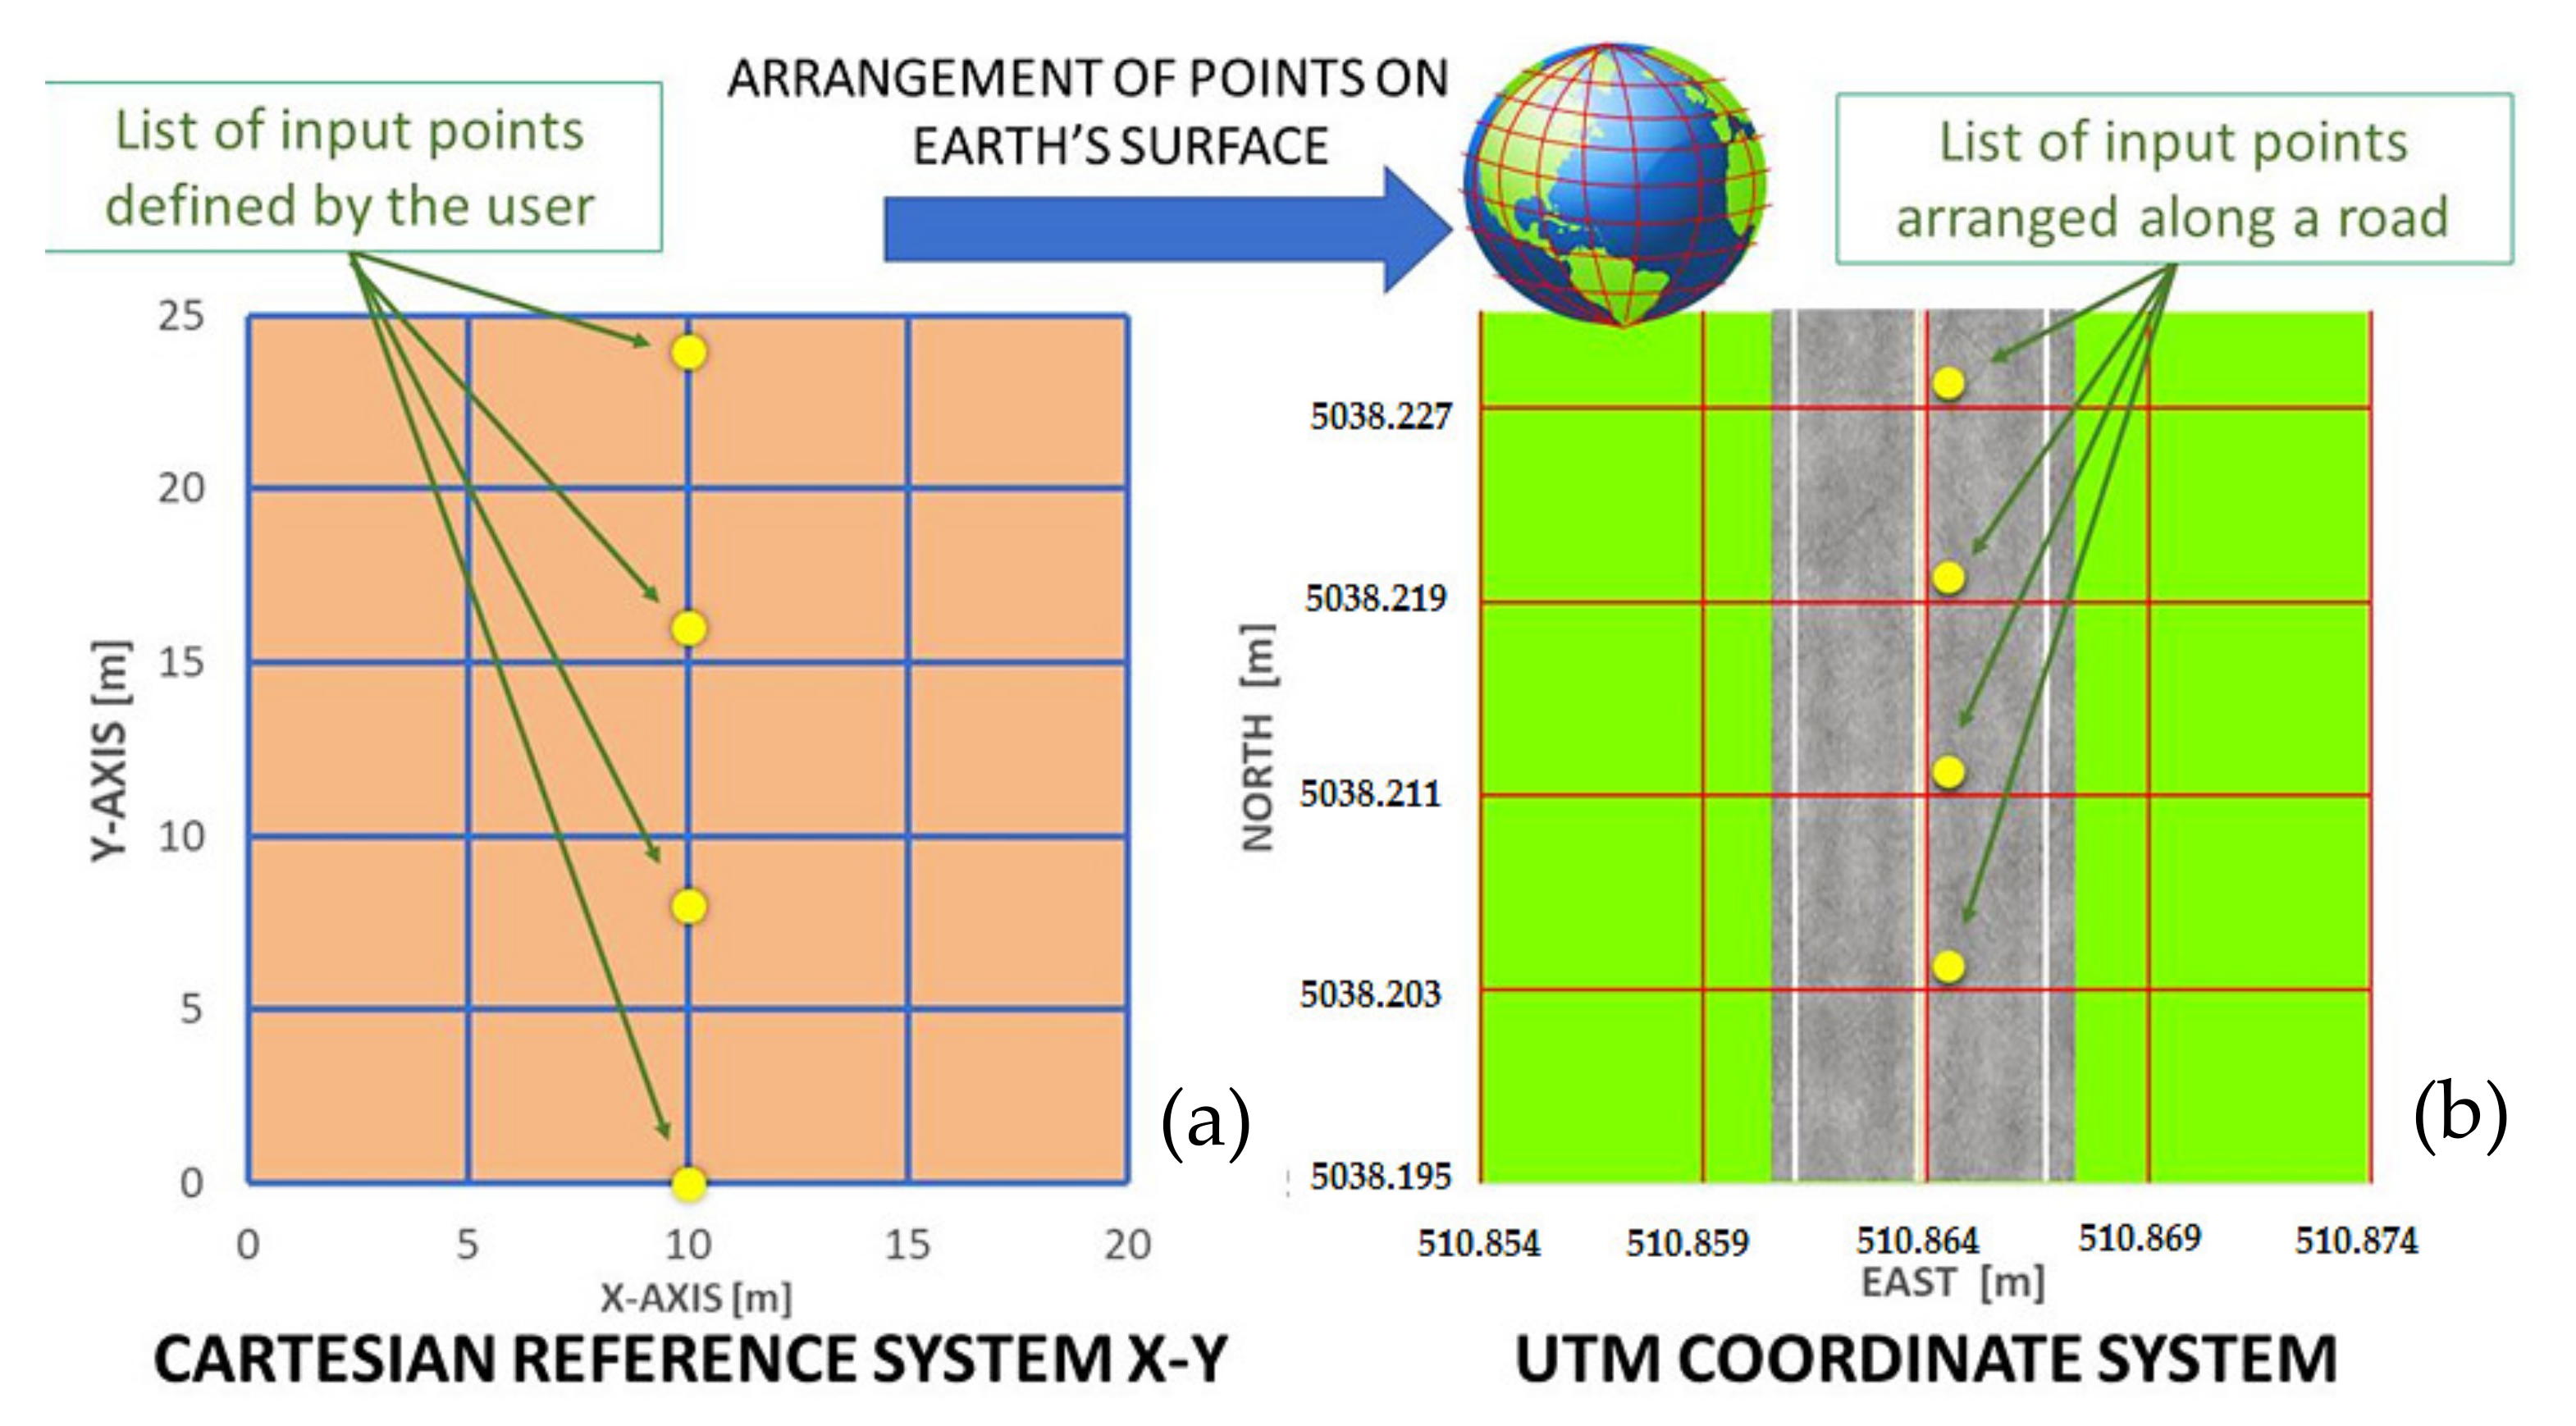
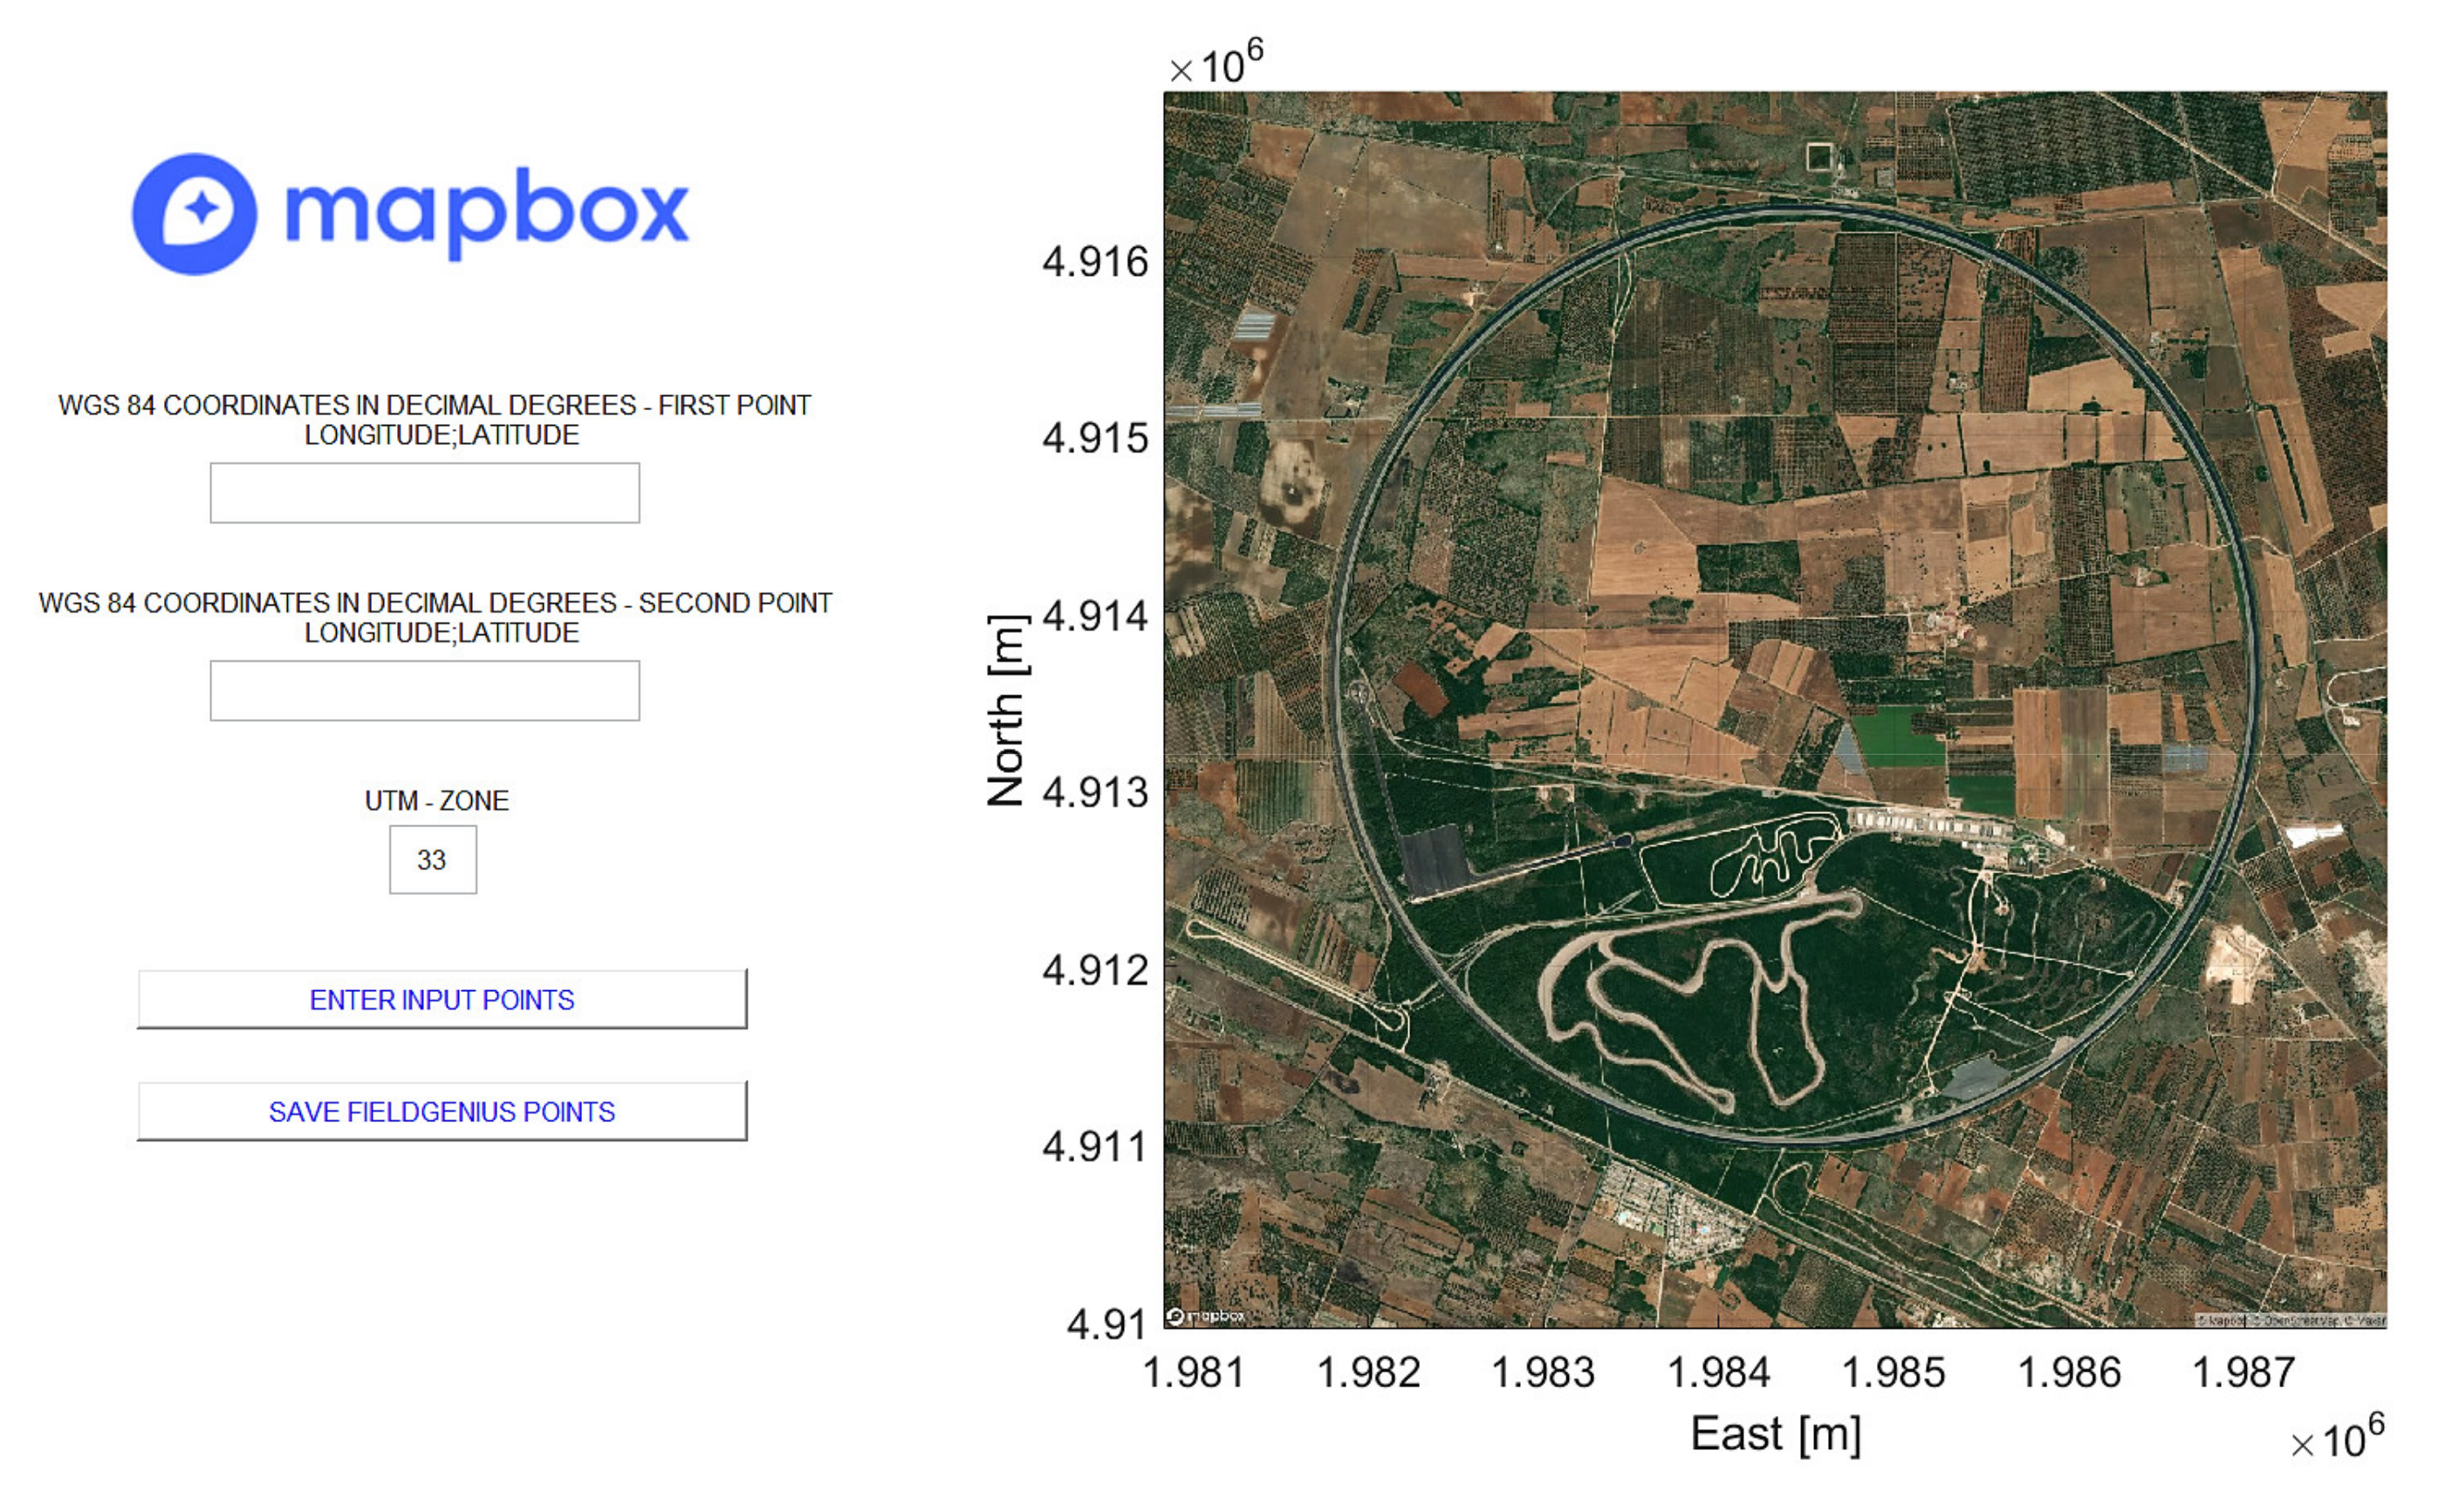
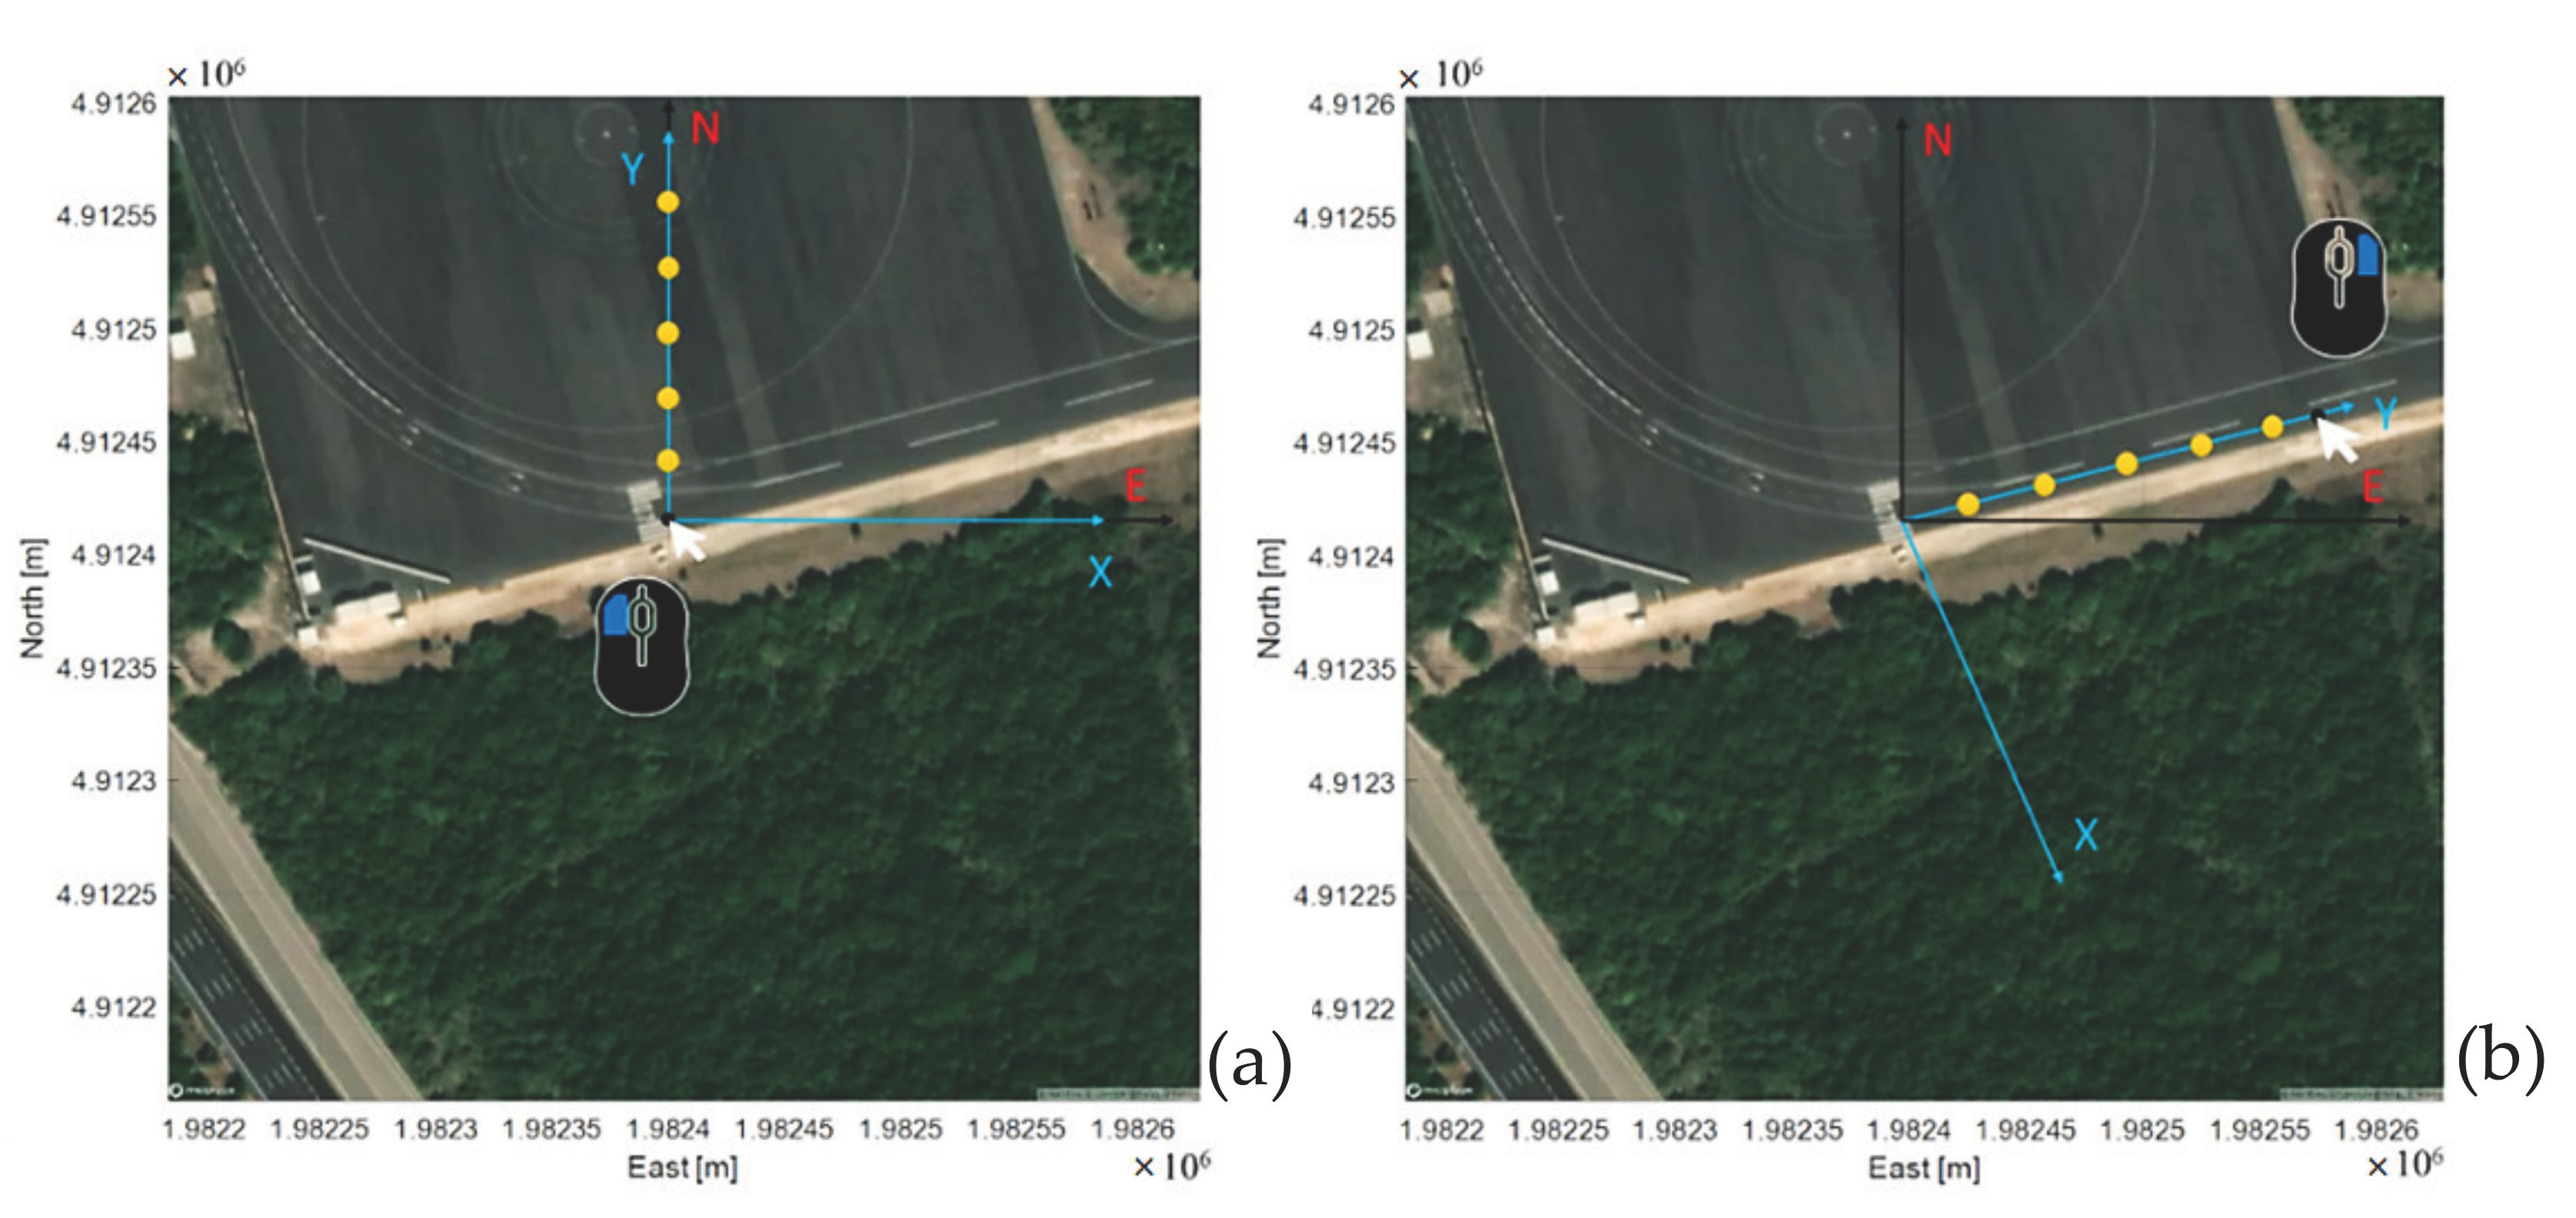
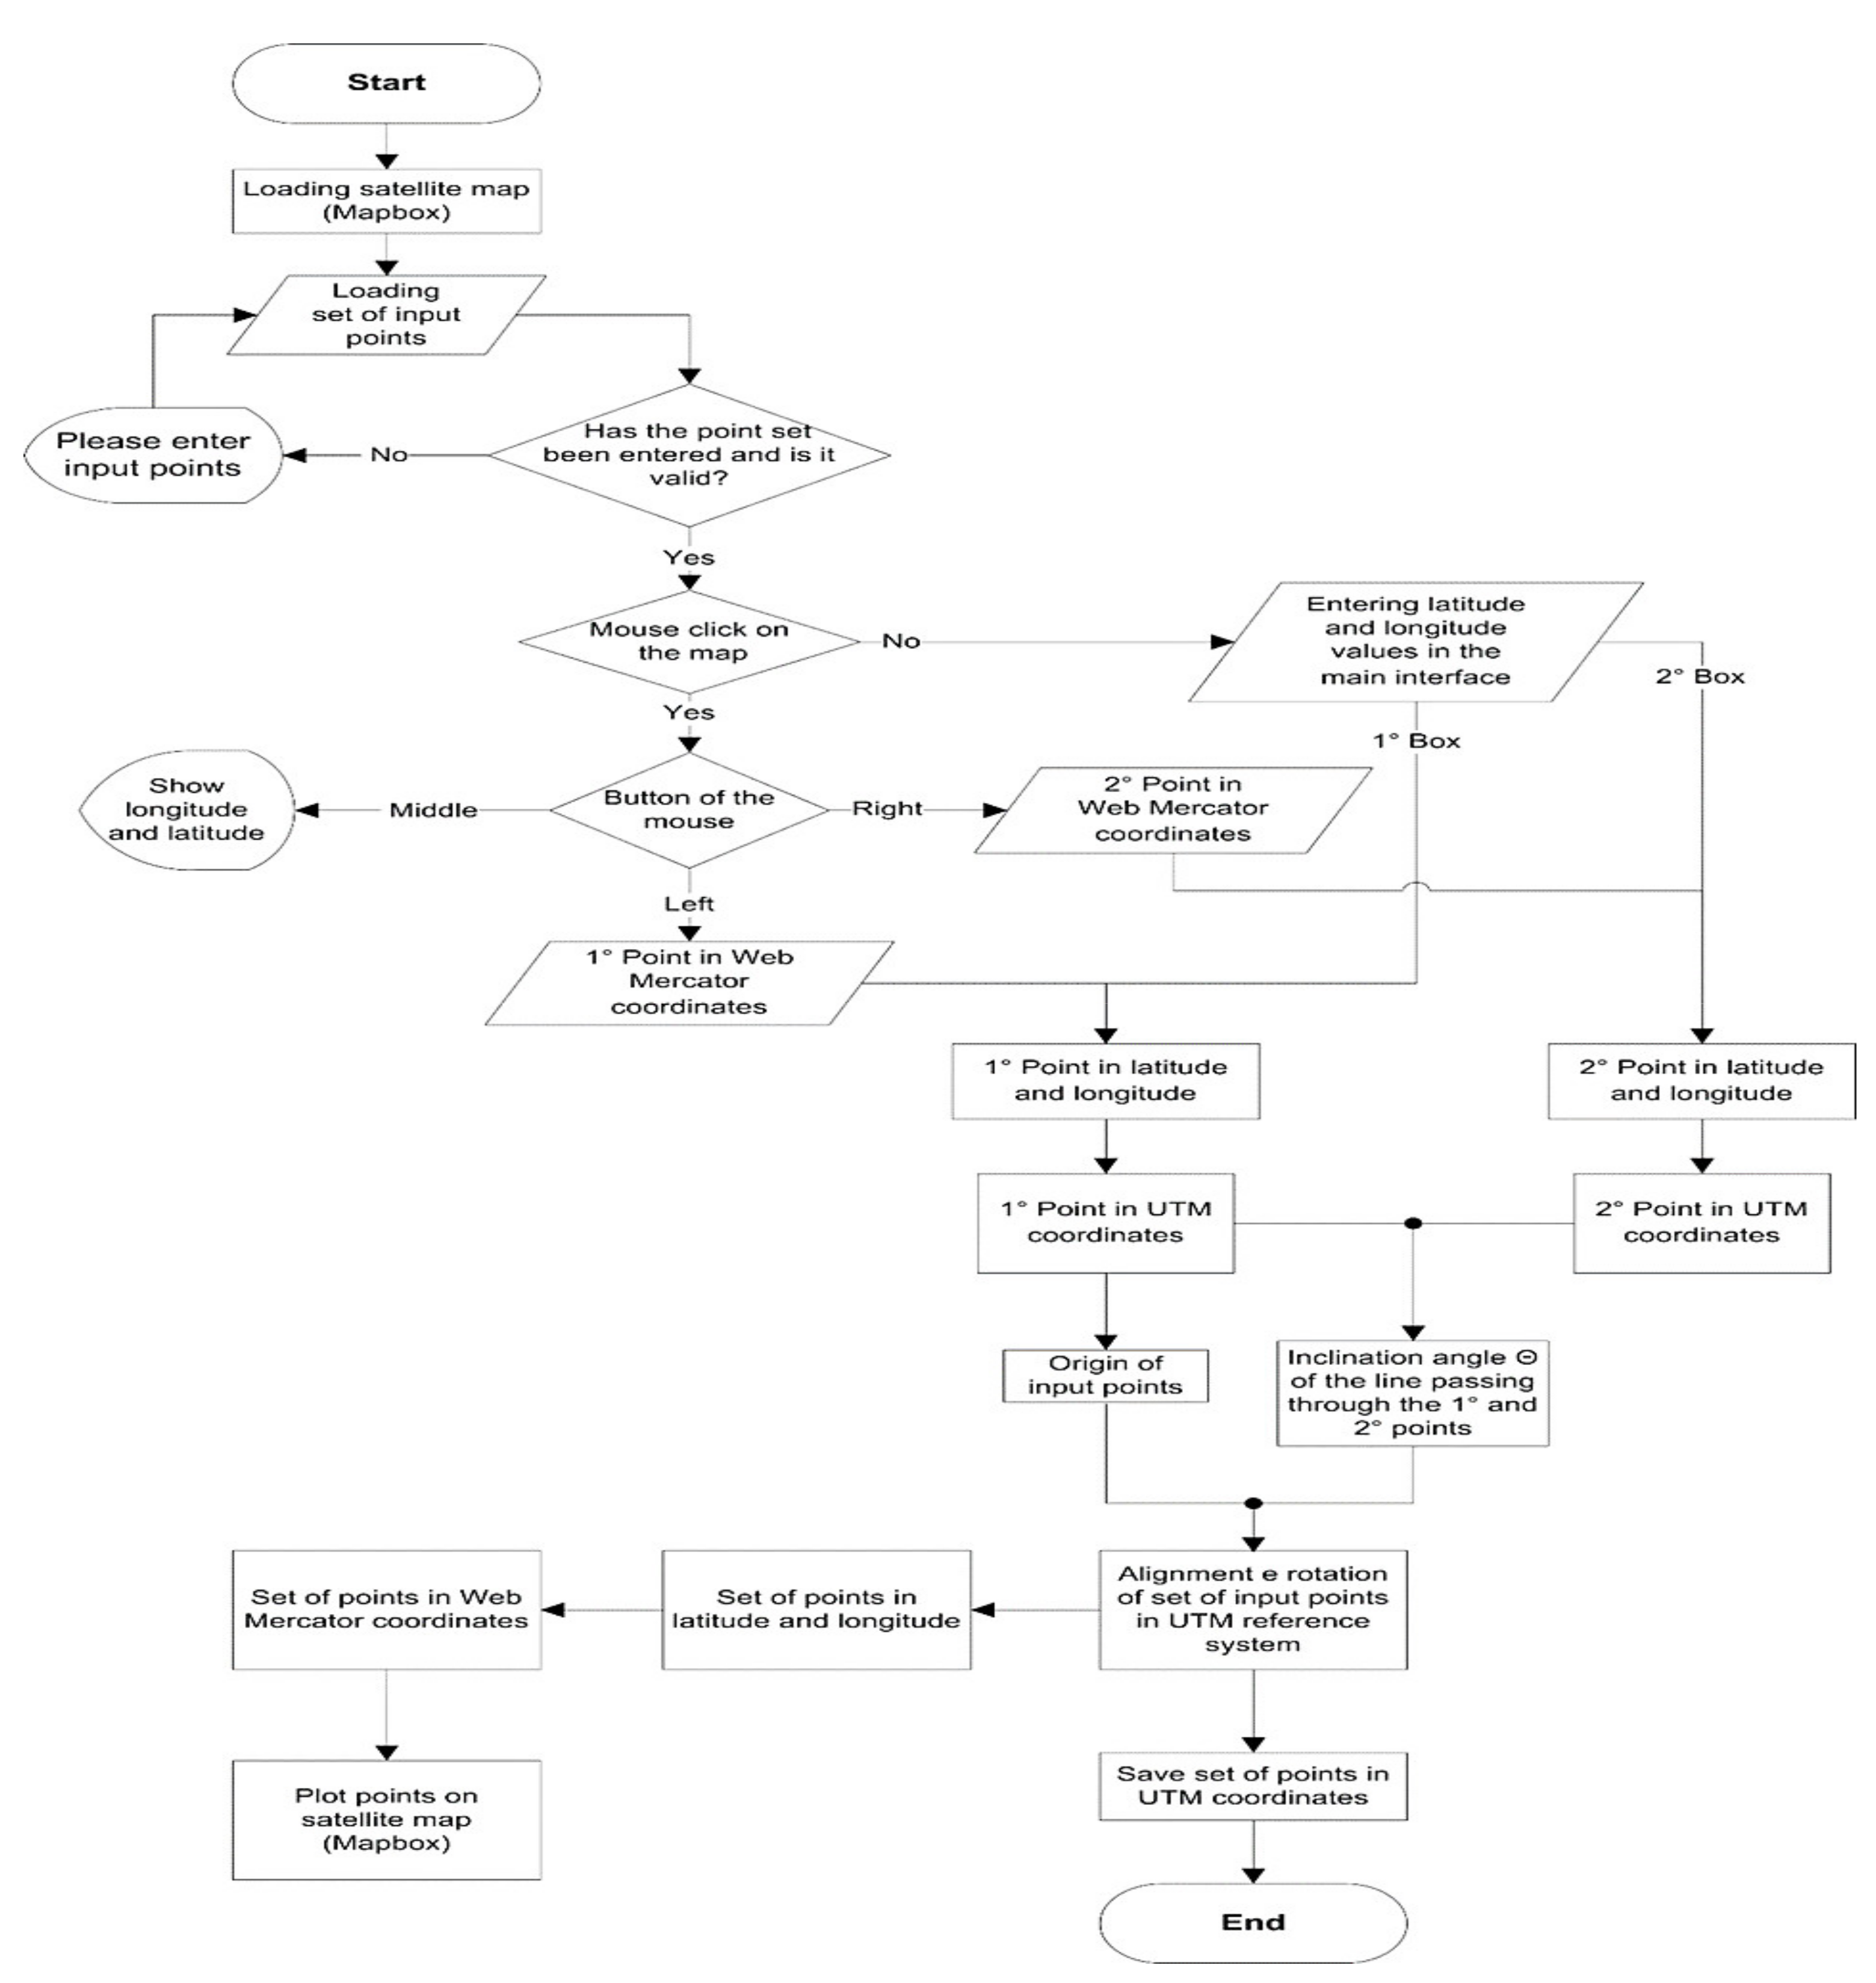
2.2. Development of the Matlab Tool for Placing a Set of Points in an Earth Reference System

A Matlab tool has been developed to support the user in positioning the set of points on the UTM coordinate system, to be then imported into the FieldGenius software and physically located on the proving ground using the geolocation device. The developed tool has been realized starting from a MATLAB script written by Zohar Bar-Yehuda and Chris Calloway, which allows navigation on Google maps with axes defined in WGS 84 geodetic reference system. The implemented tool is called Matlab Mapbox because it uses satellite maps downloaded from the Mapbox website, and its axes are defined in the Web Mercator reference system (EPSG:3857, details on https://epsg.io/3857, accessed on 15 February 2021). The Matlab Mapbox tool receives as input a text file containing a set of points in a Cartesian reference system and gives as output a text file containing the same set of points defined in the UTM coordinate system. The satellite map available on the Matlab Mapbox tool allows for placing the reference system on the Earth’s surface by choosing a first geographical point that fixes the origin and a second point that fixes the y-axis orientation (line passing through two chosen points). There are two possible ways of choosing these two points:
-
Typing the WGS 84 coordinates (latitude and longitude) of the two points.
-
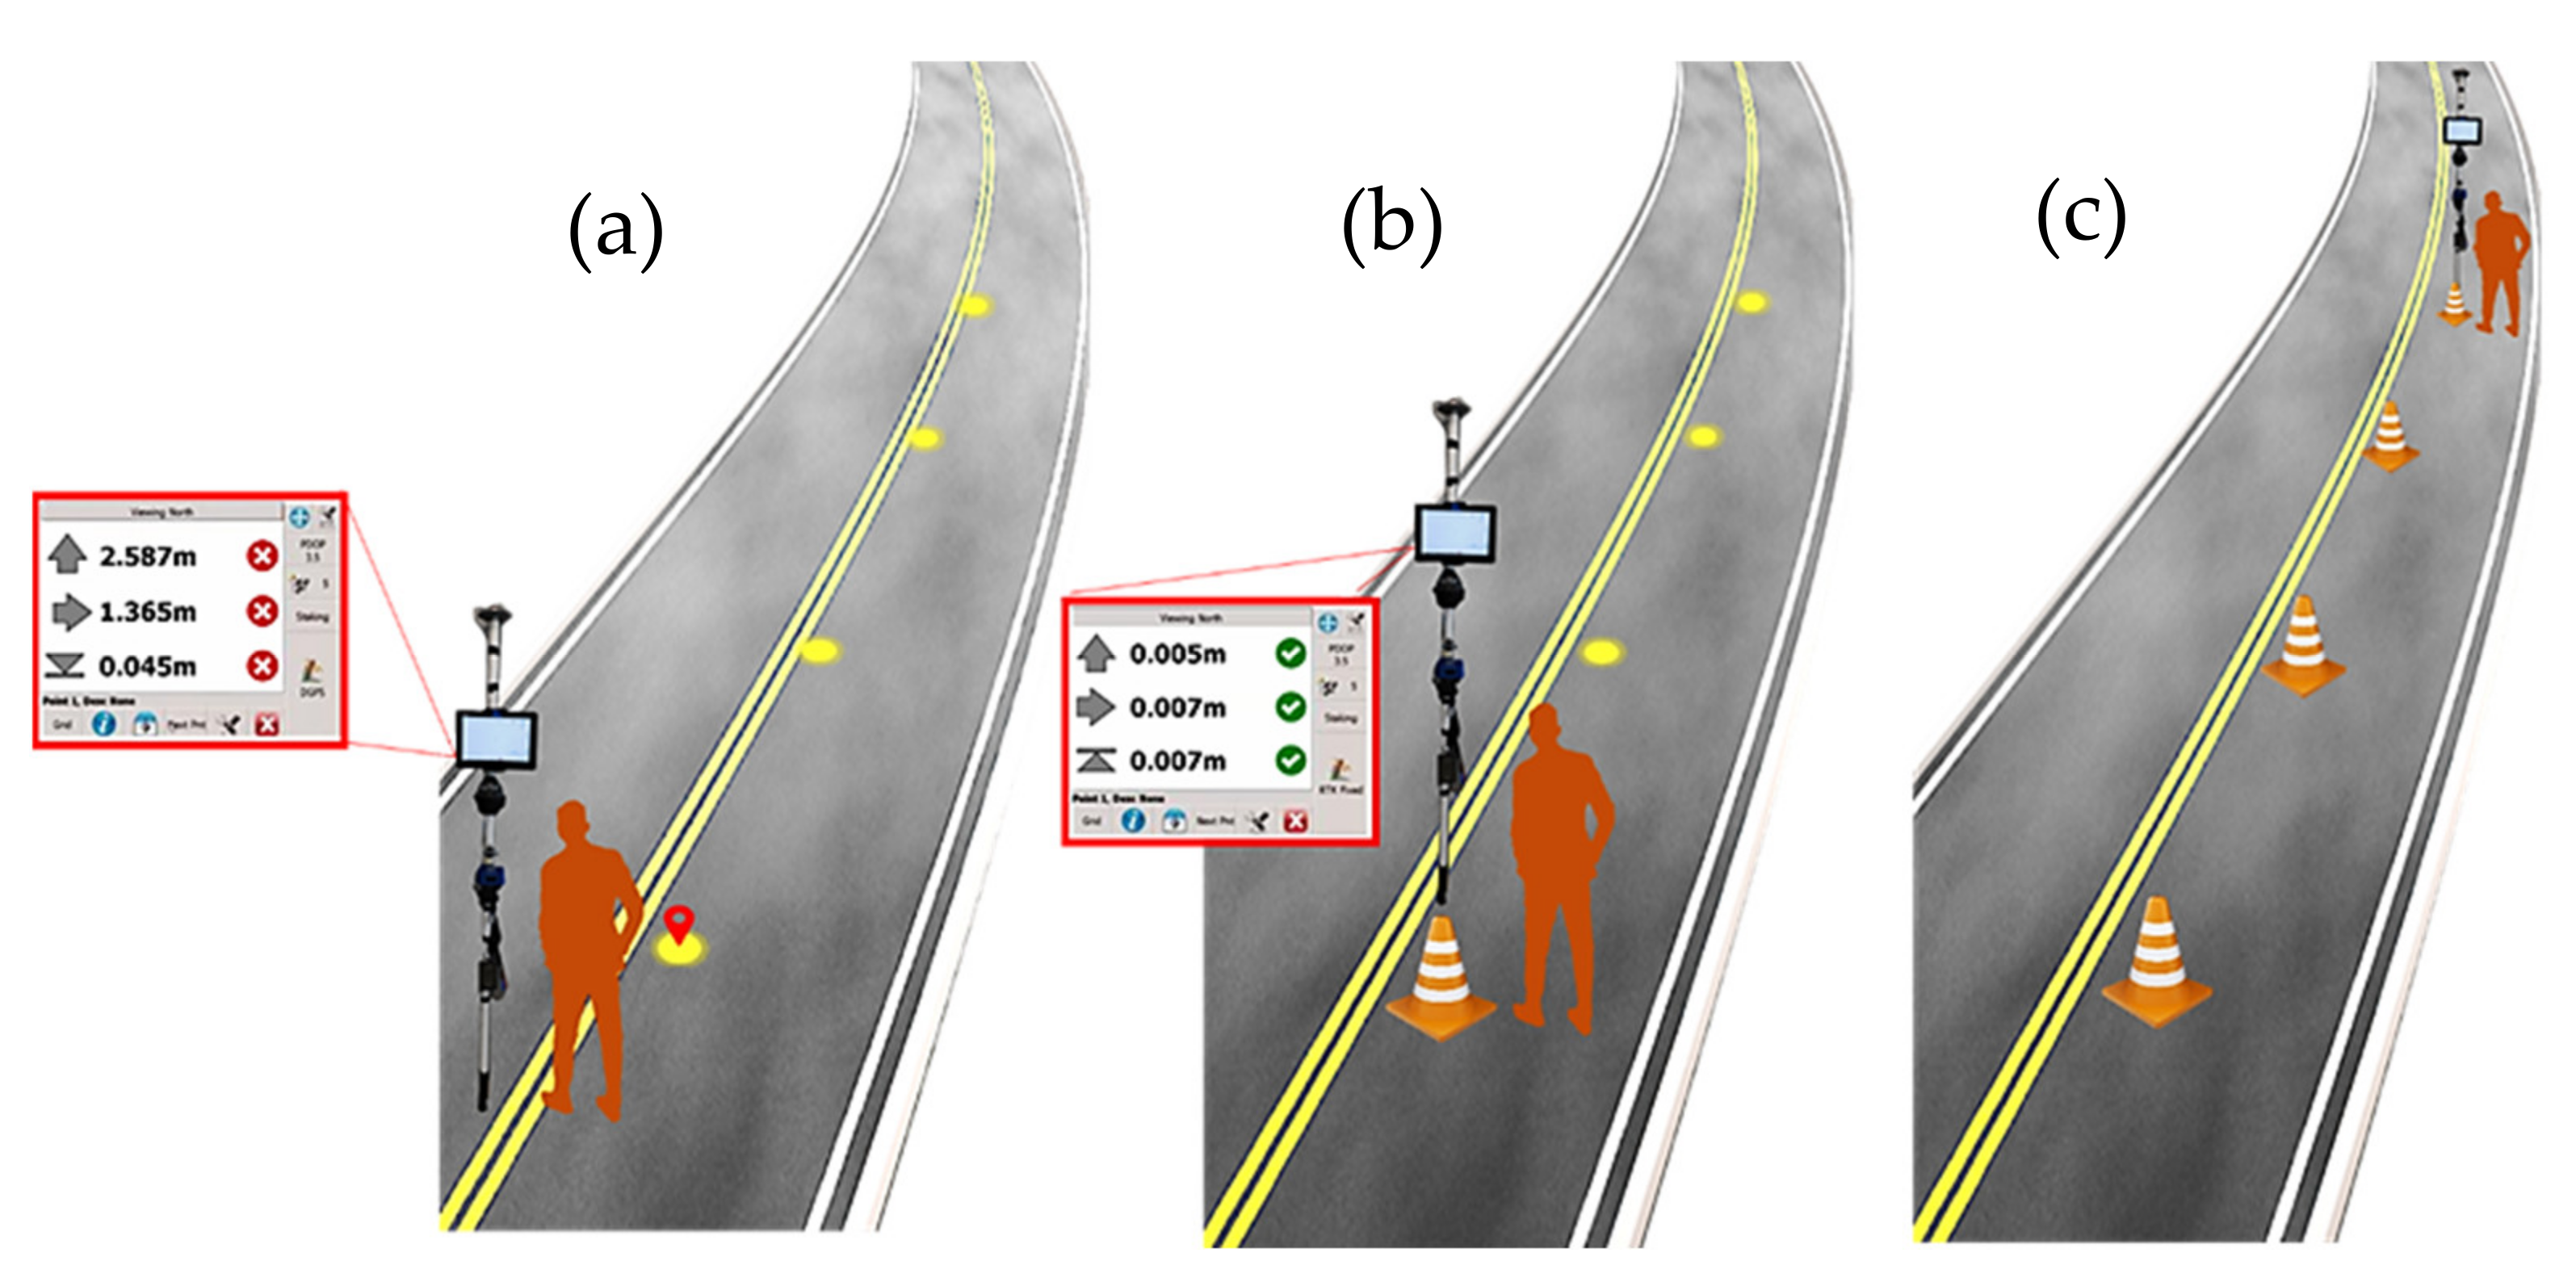
Choosing two satellite map points by clicking with left/right buttons of the mouse, taking as reference some visible elements of the satellite image (road signs or trees).
On the right side of Matlab Mapbox interface (Figure 10), there is the navigable map; on the left, there are three boxes to insert the longitude and latitude values of two chosen points (at least 7 decimal digits), and the UTM zone value (e.g., 33 for the Porche Technical Center location). Finally, by pressing the “ENTER INPUT POINTS” button, the user can choose the text file where the coordinate values of all the input points are stored.
Using the Matlab Mapbox tool, the user can fix, by left-clicking in a geographic point on the map, the Cartesian reference system origin (Figure 11a); then, by right-clicking on a second point, the user defines the y-axis orientation of the Cartesian reference system (Figure 11b) as the line direction passing through two chosen points.
Subsequently, the developed MATLAB tool processes the Web Mercator coordinates of the two points chosen by the user on the map, converting them into UTM coordinates, because the FieldGenius software requires as input a set of points defined in a terrestrial plane coordinate system such as the UTM. Therefore, the implemented MATLAB tool perform this conversion of points from a Web Mercator coordinate system to a UTM coordinate system.
The Matlab Mapbox tool flowchart is shown in Figure 12. If the origin and y-axis are set on the Mapbox satellite map, the two chosen points are defined on the Web Mercator coordinate system; then, they are transformed in geodetic coordinates (latitude and longitude) by the inverse formulas for the spherical Mercator projection [29] and converted in UTM-WGS 84 coordinates by transverse projection formulas [29,30]. Next, the points loaded by the user are aligned considering the origin UTM coordinates (first point) and rotated by an angle θ formed by the grid north direction with the line passing through the two chosen points (y-axis in Figure 11b) in the UTM coordinate system. Afterwards, the input points are imported into FieldGenius by uploading the text file with the UTM coordinate values. During on-field operation, the VBOX 3iSR INS outputs an NMEA data stream containing the latitude and longitude (WGS 84) values of the GNSS antenna current position converted by FieldGenius in UTM coordinates by transverse Mercator projection formula. The latter allows us to compare the coordinates of stake-out device position with those of the target points performing FieldGenius’s operation mode to guide the user. The transverse Mercator projection alters the relative distances between points but not the shapes; the scale error within each UTM projection zone is under 0.1% [31]. This error could be unacceptable compared to the test standards for configuration involving large distances (i.e., greater than 100m).

3. Results

In this section, the results of carried out experimental tests are presented. Specifically, Section 3.1 shows the experimental results to evaluate the positioning accuracy of the VBOX 3iSR INS in RTK mode, and Section 3.2 reports test results to validate the developed stake-out system operation. In this regard, two configurations were reproduced on the proving ground of the Porsche Technical Center using the stake-out system; the first one is a grid of 4 × 4 points, and the latter is defined by the ISO 3888-1 standard actually used in the automotive field to perform a double lane-change maneuver.

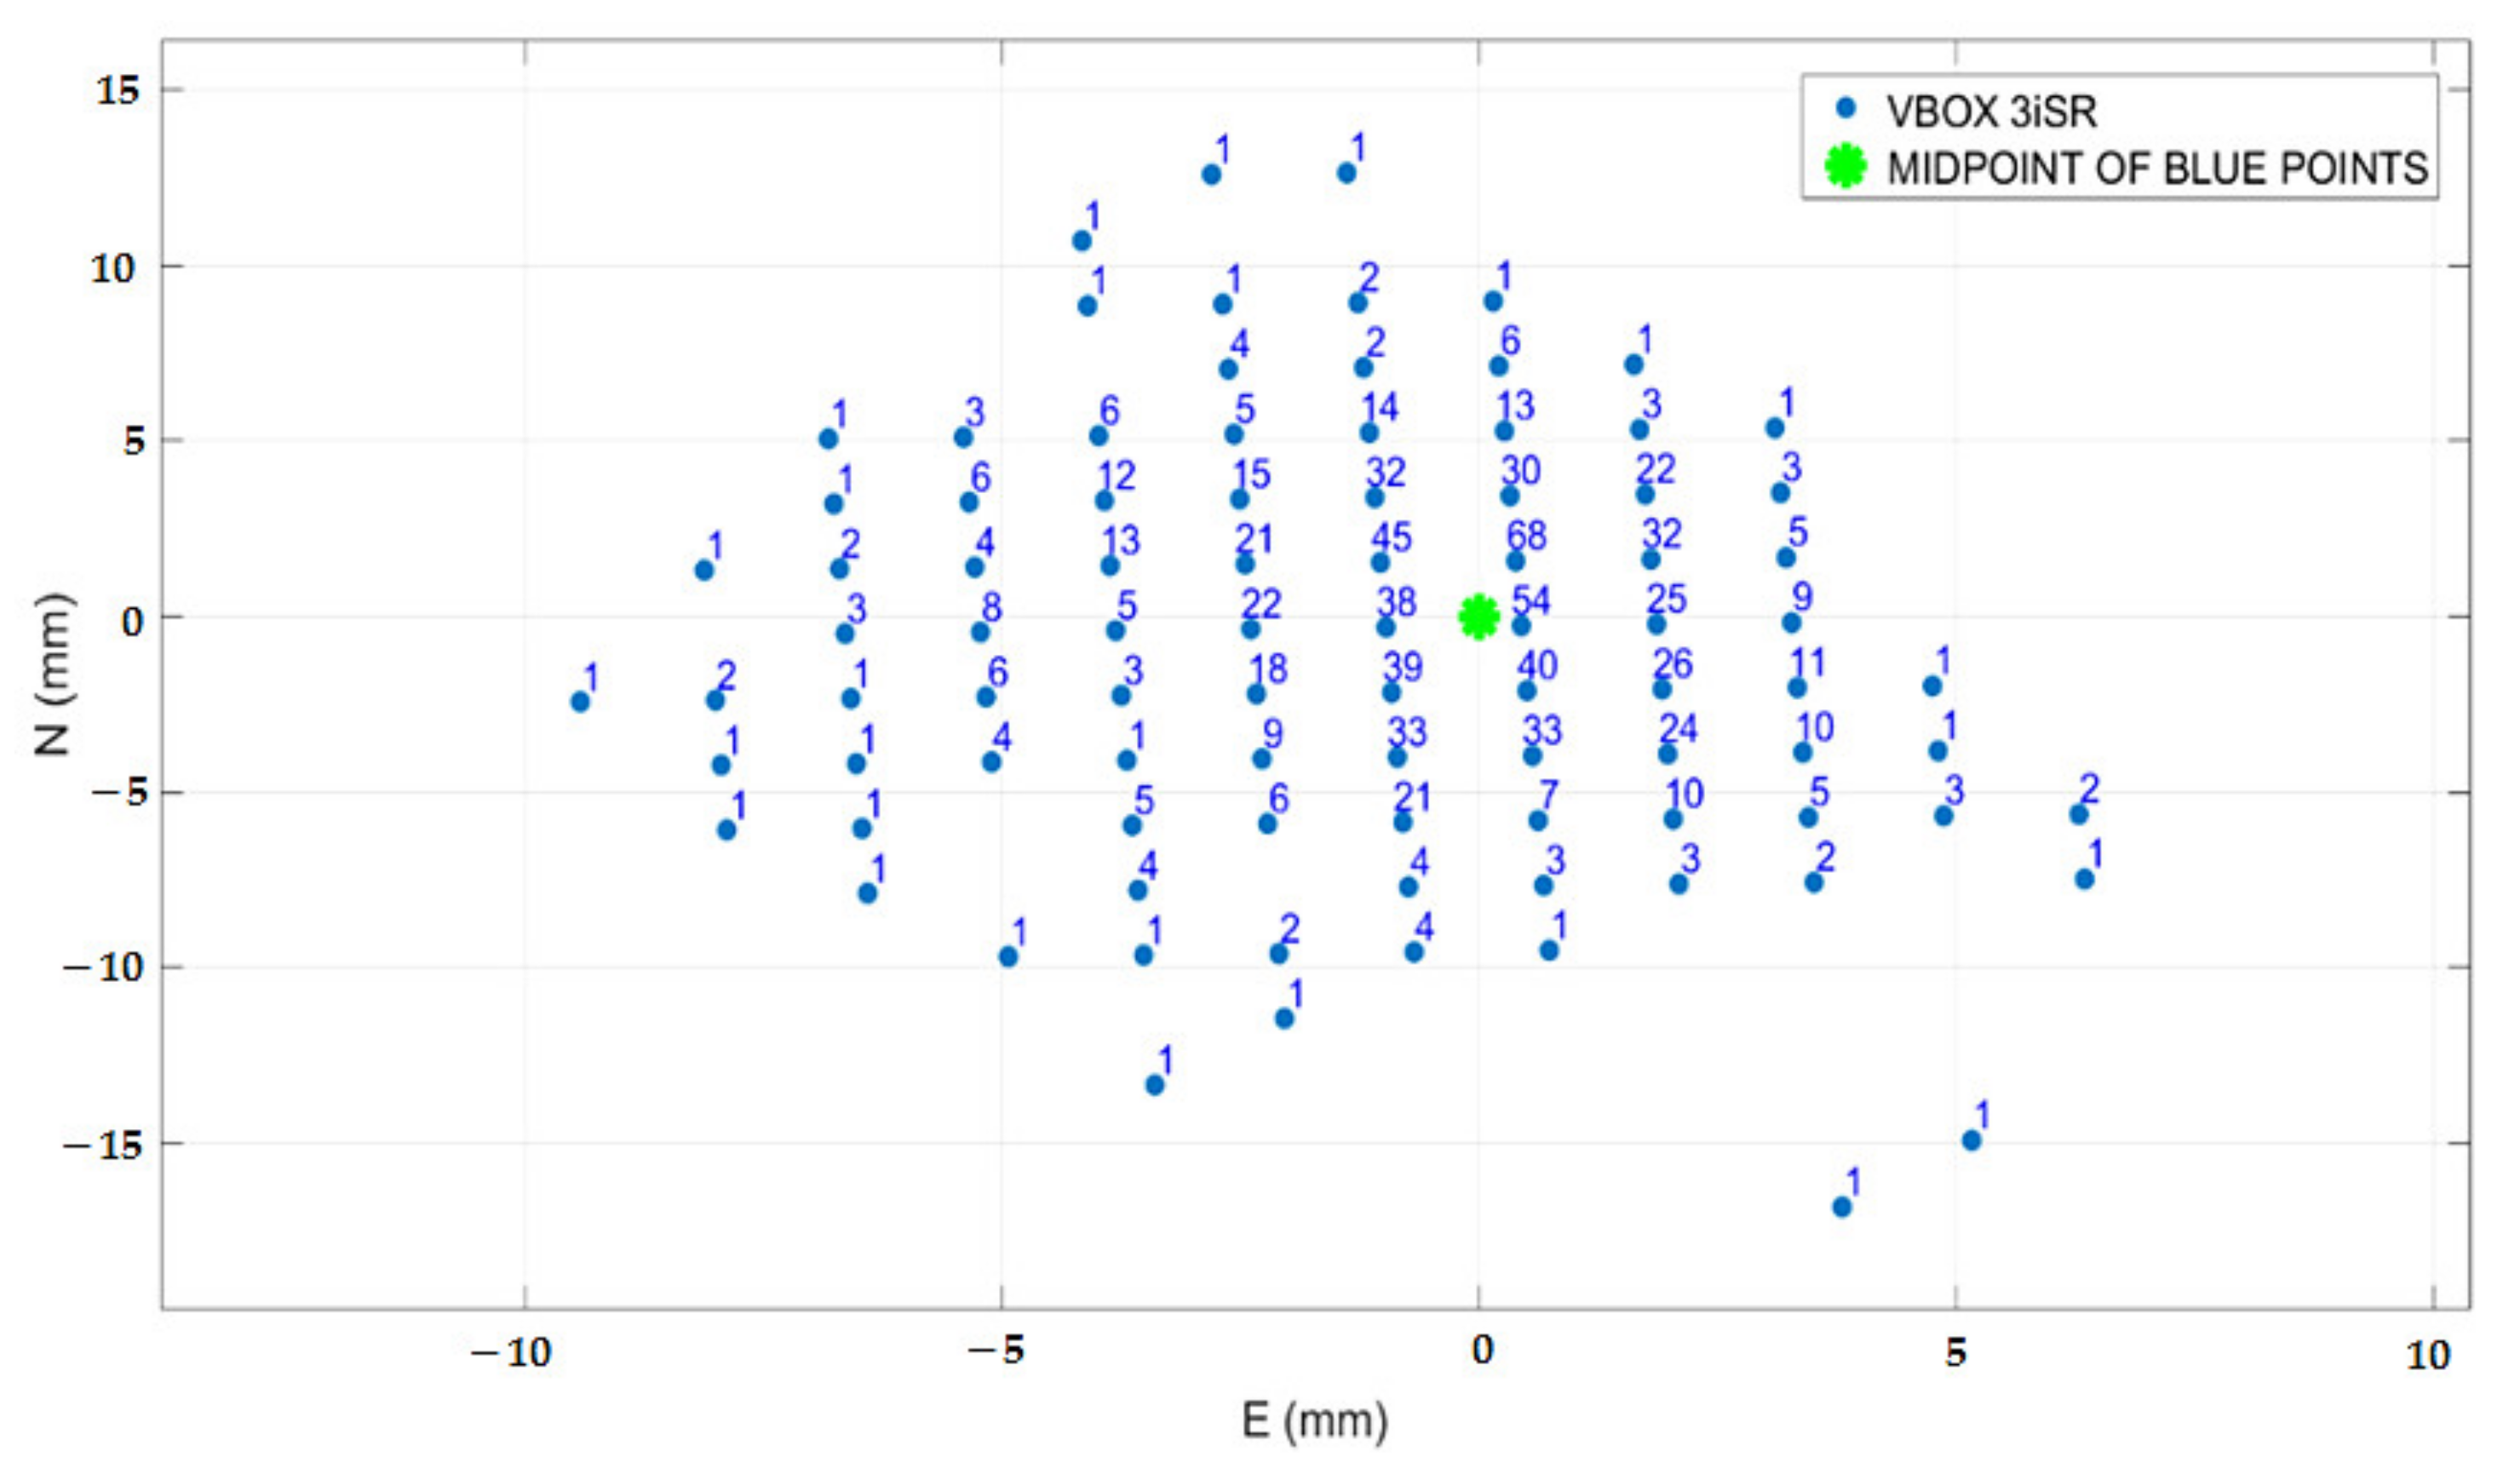
3.1. Experimental Results of Tests Performed on VBOX 3ISR INS with RLACS156 Antenna

The carried-out tests are based on the fast-static method by measuring the coordinates of a ground point for 15 min to evaluate the VBOX 3ISR INS positioning accuracy without introducing any misalignment between the antenna center and measuring point. The GNSS antenna was positioned about 1.60 m (manually measured) above the ground using a levelled tripod to achieve better satellite visibility and fixed at its geometric center with a plumb line falling precisely on the measuring point. It was assumed that the slight inaccuracy of the antenna height did not introduce any significant error in the measurement chain for the proposed tests. During the test, the VBOX 3iSR INS was connected to a laptop via serial communication, which receives the positioning data in NMEA standard and processes them by a Matlab script. This last saves only the GGA-type sentences and then extracts the latitude and longitude values related to GNSS antenna position, the universal time coordinated (UTC), and the number of satellites (between 14 and 16) to estimate the position (Figure 13a). Then, the developed Matlab script converts the extracted latitude and longitude values in relative UTM coordinates by implementing transverse projection formulas reported in [29,30] (Figure 13b).
Figure 14a shows the used experimental setup, Figure 14b the flowchart of the Matlab script. The positioning resolution (i.e., the smallest measurable difference in position) of the VBOX 3iSR was 1.67 × 10⁻⁸° (derived from the number of decimal digits of NMEA latitude and longitude min data), which corresponded to 1.4 mm east and 1.9 mm north for the 33 UTM zone. The sampling rate of the VBOX 3iSR INS was set to 1 Hz (i.e., 900 readings in the 15 min observation time with RTK fixed).
Figure 15 shows the graph of performed measurements expressed in relative UTM coordinates with respect to the midpoint; next to each point, the number represents the total readings with the same coordinates. Table 1 reports the UTM coordinates of the calculated midpoint (in Figure 15 the green symbol) and the standard deviation in east and north directions related to the performed measurements.
The results showed good data repeatability and low standard deviation, namely, 2.3 and 3.6 mm in the east and north directions, respectively, very low values for stake-out automotive applications. The RTK positioning accuracy of VBOX 3iSR INS was compared with the datasheet value (i.e., 2 cm 95% CEP). By a Matlab iterative calculation, we determined the radius of a circle centered at the midpoint (green point in Figure 15) containing 95% of the readings, equal to 0.75 cm 95% CEP, lower than the 2 cm CEP value declared by the manufacturer. Finally, we want to point out that the accuracy of the VBOX 3iSR INS’s midpoint with RTK correction was tested by the ADMA-G-ECO+ device.

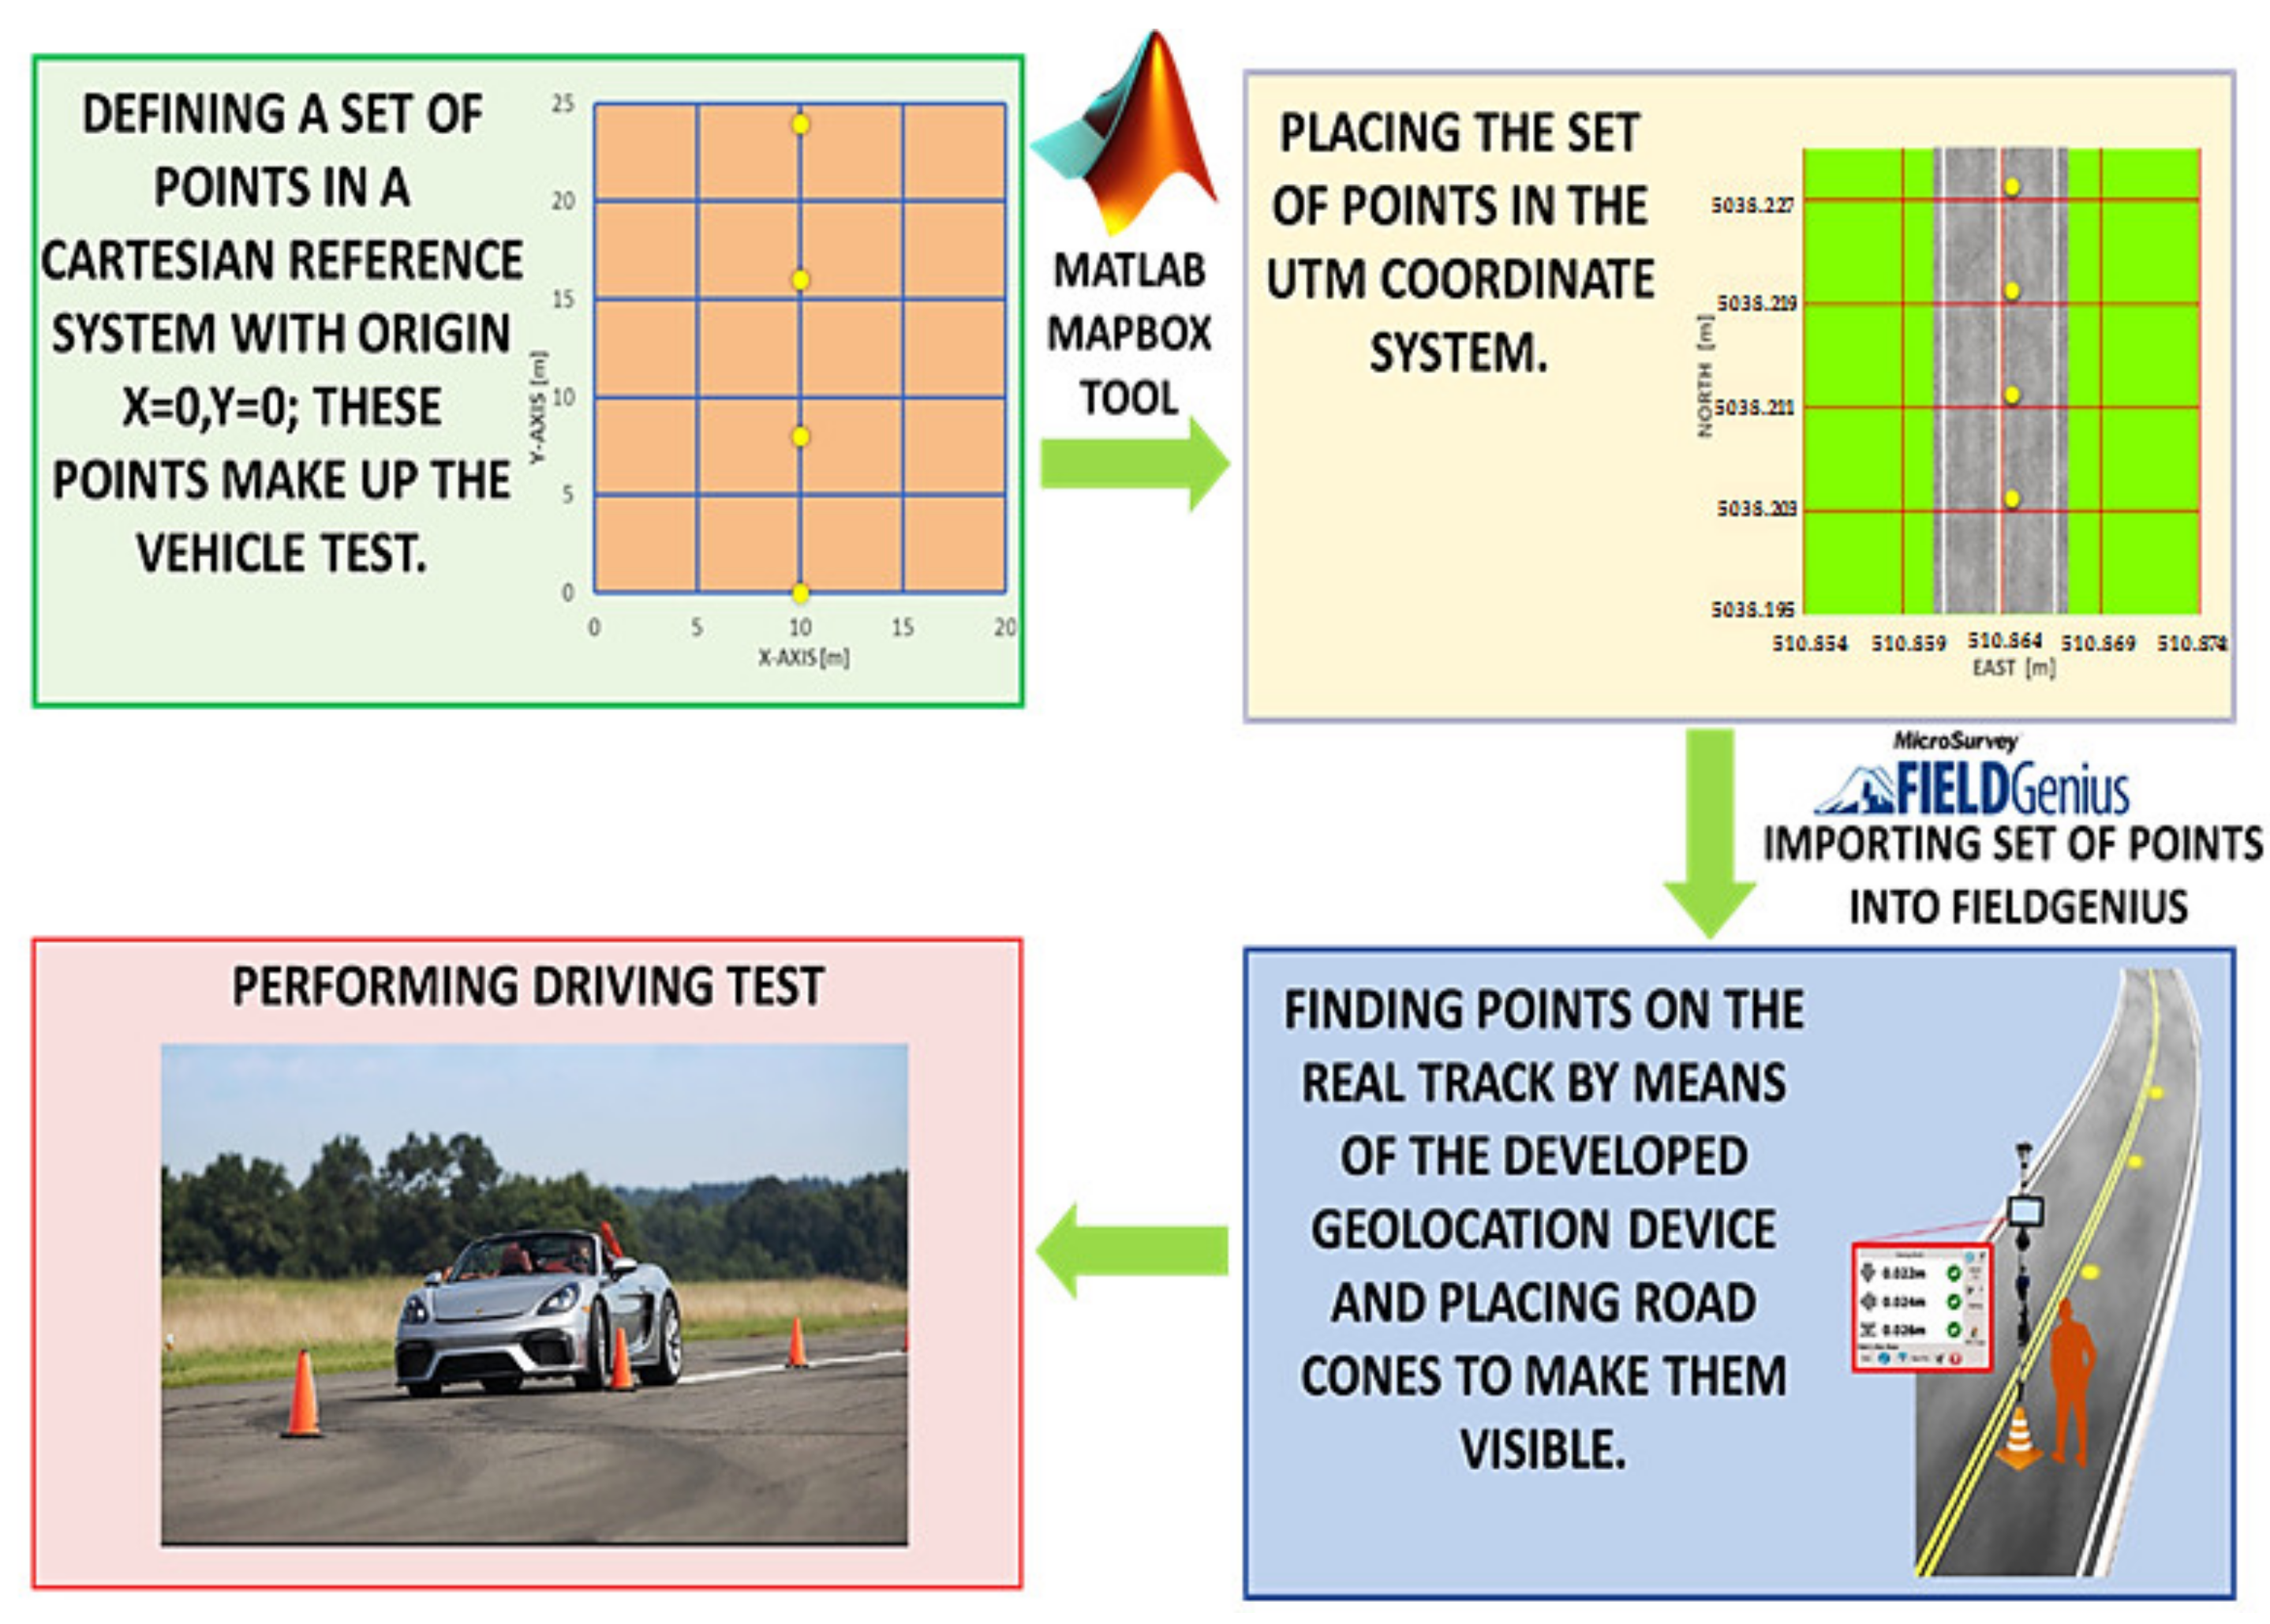
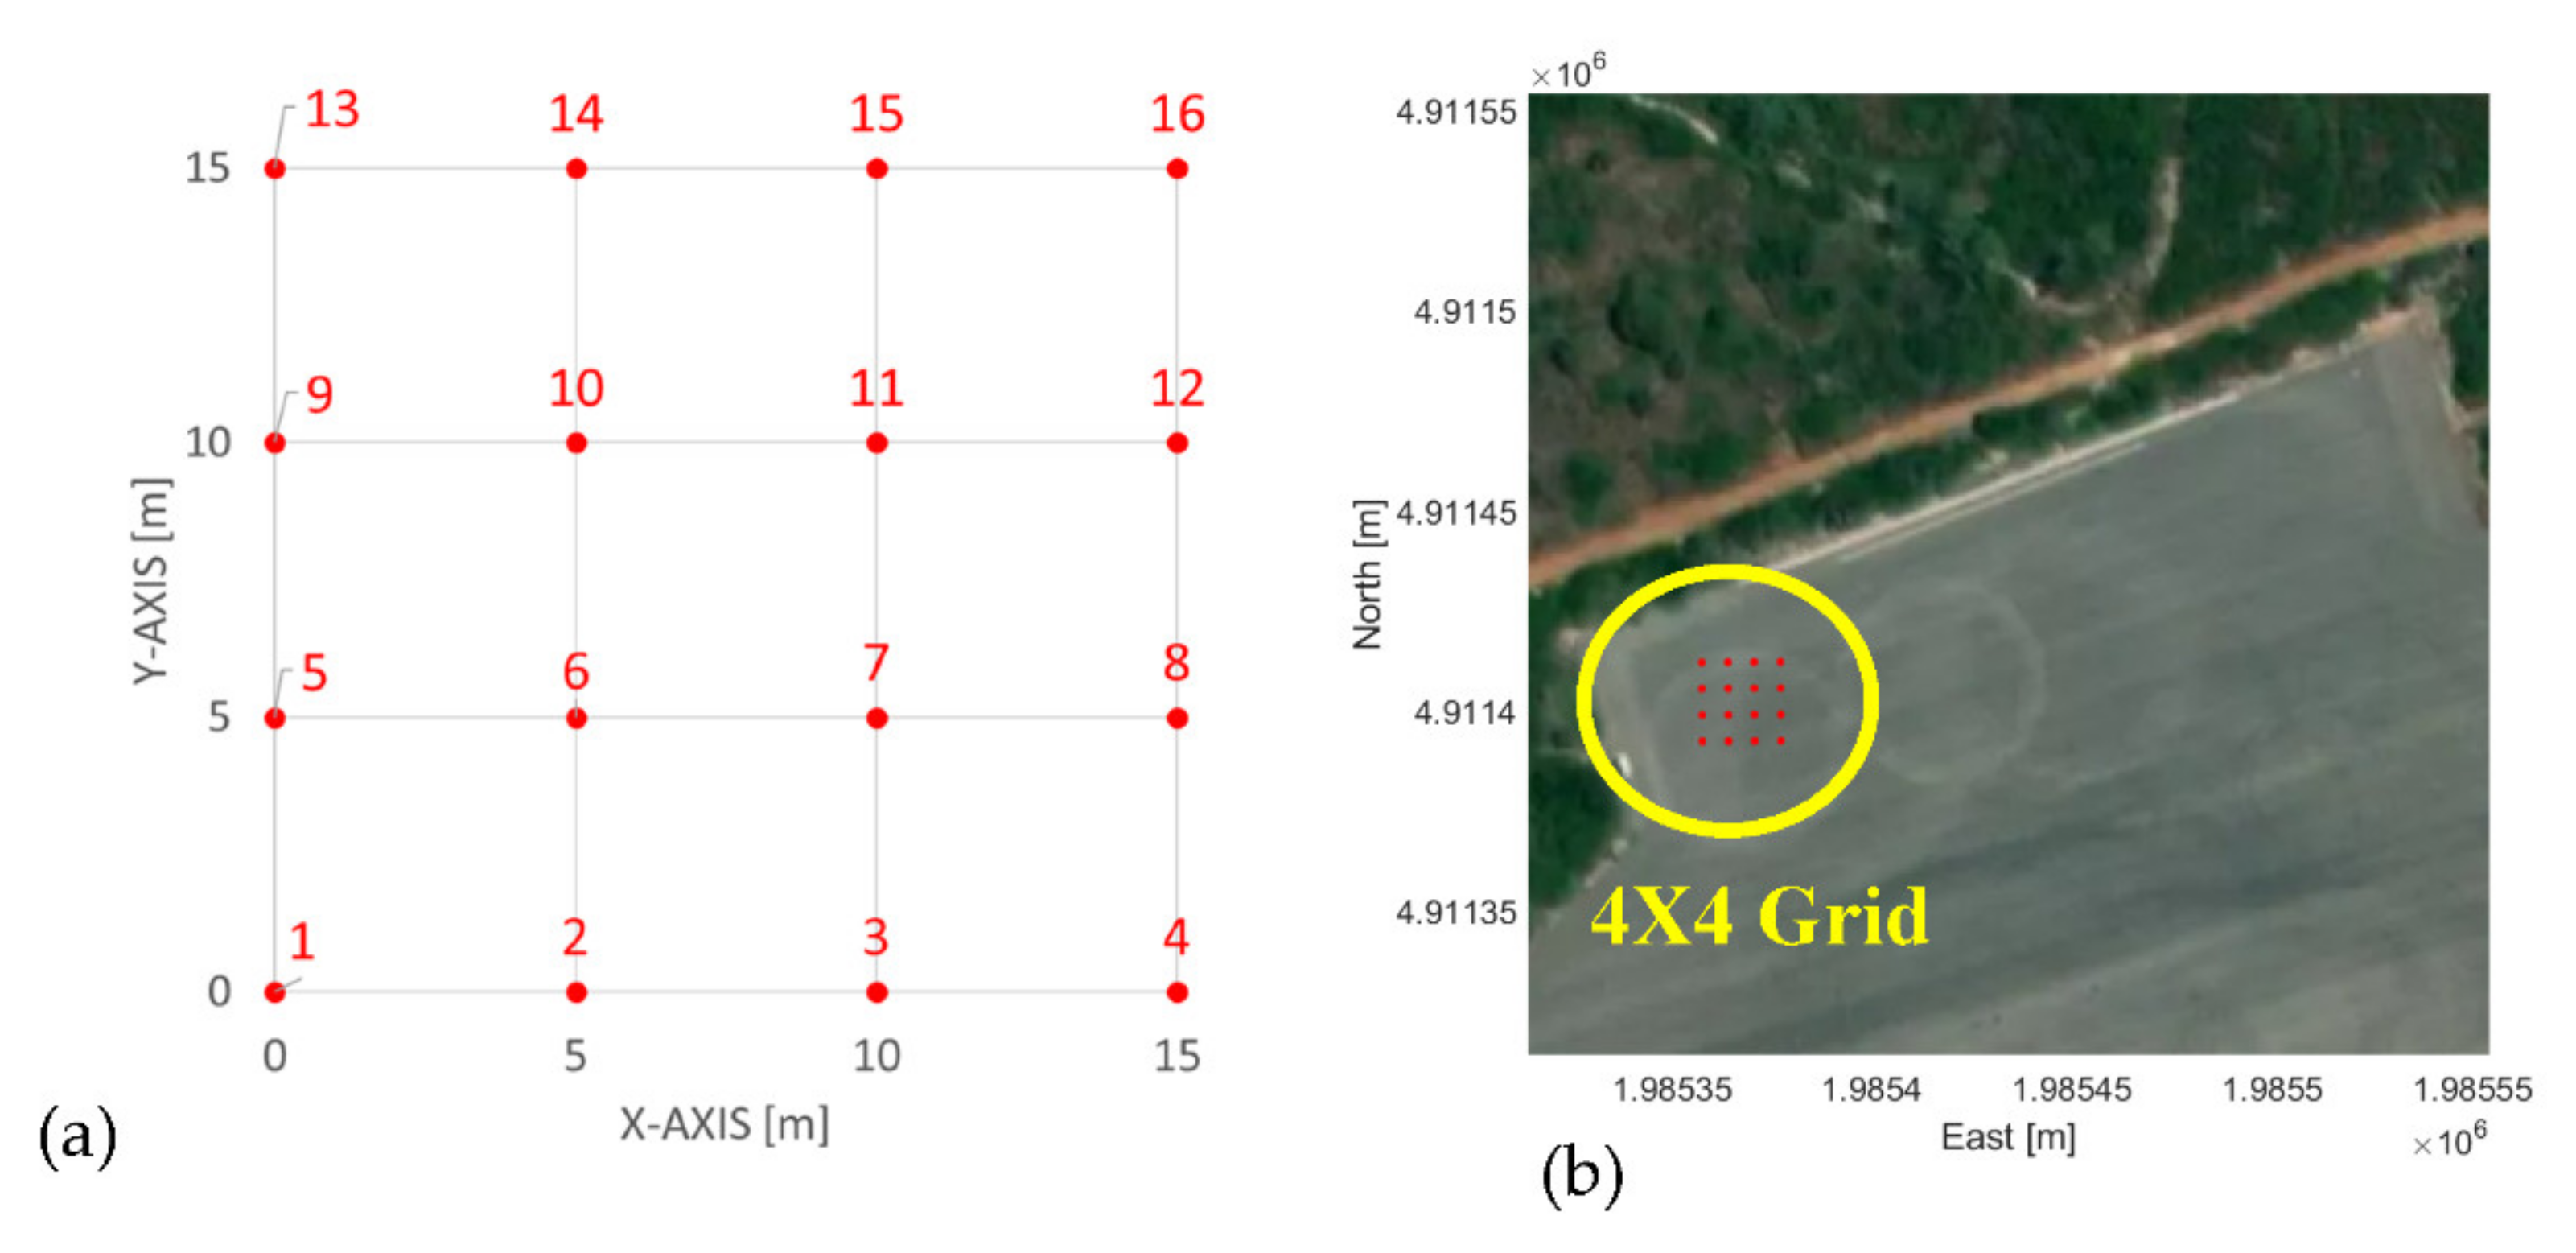
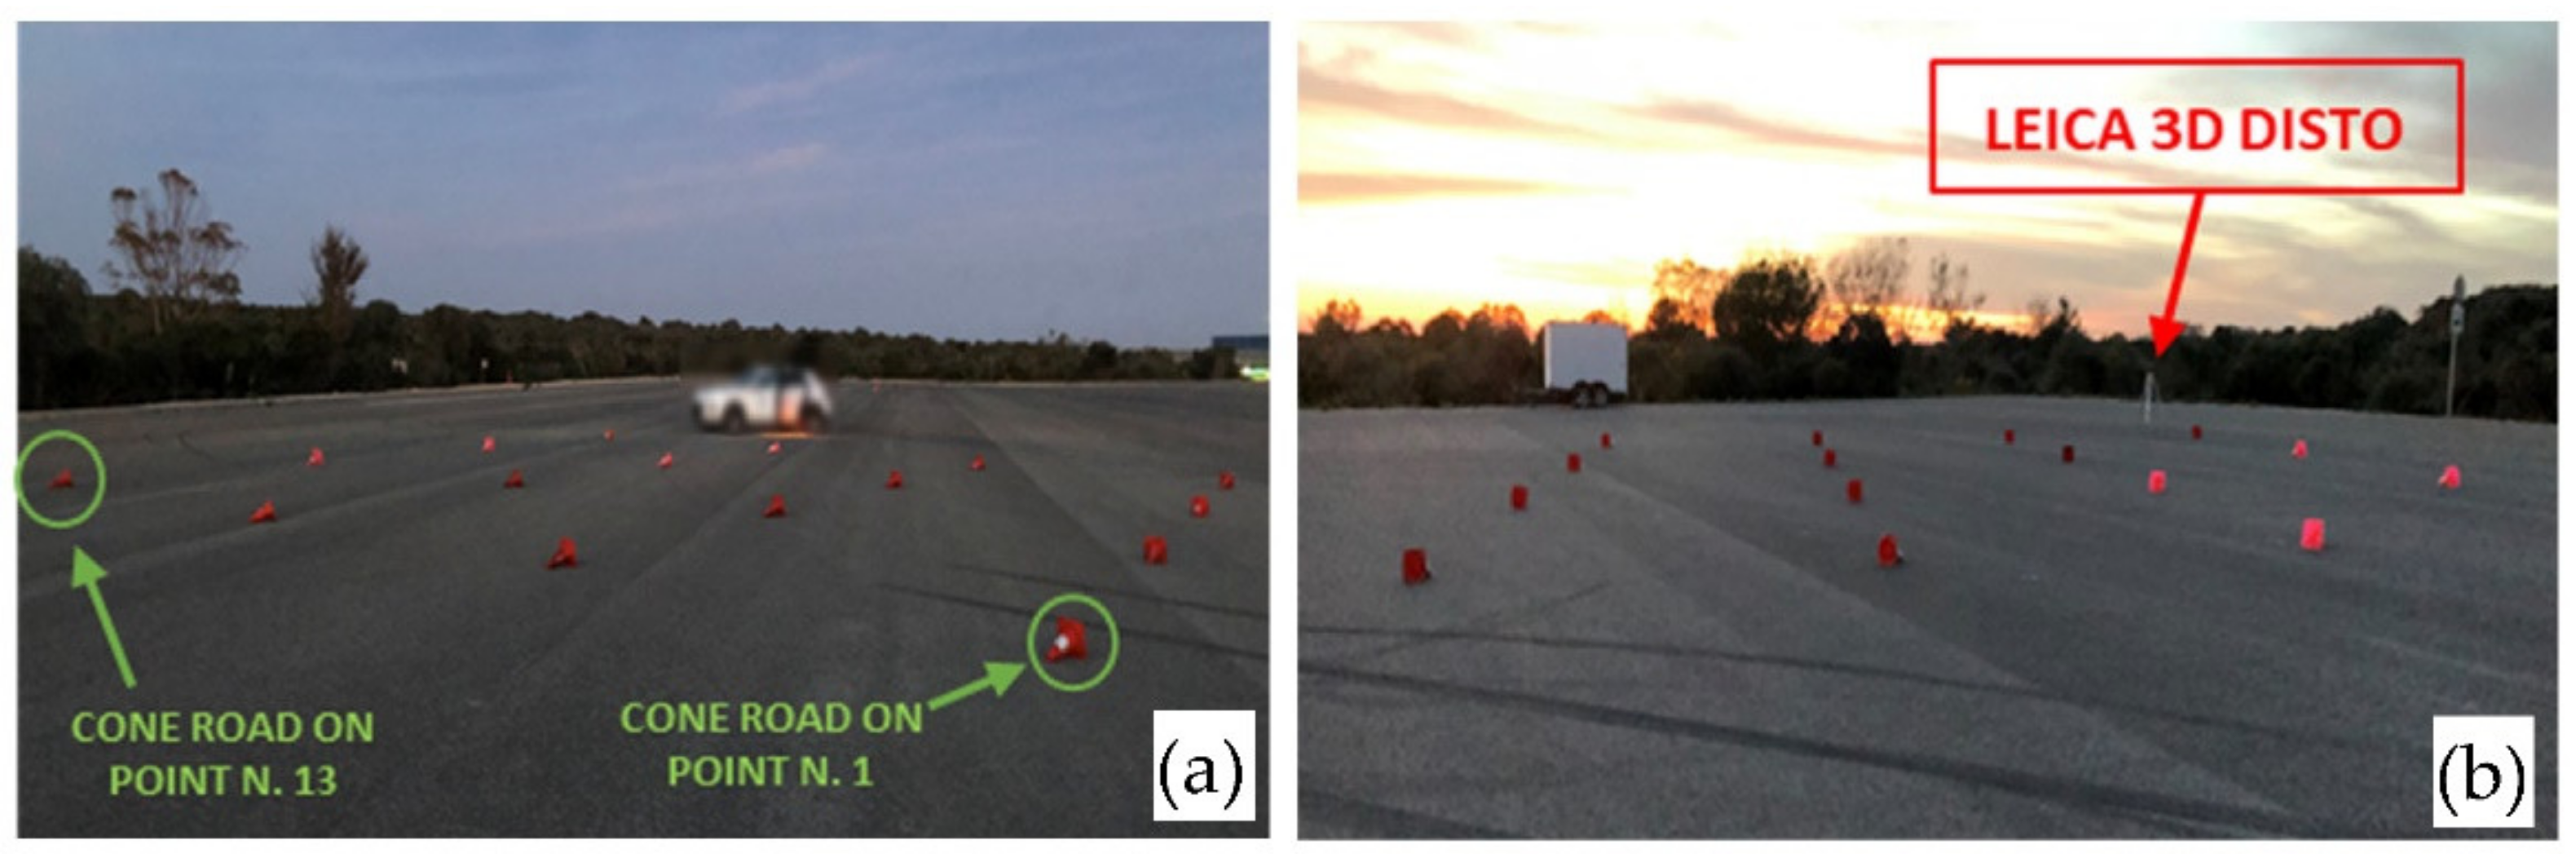
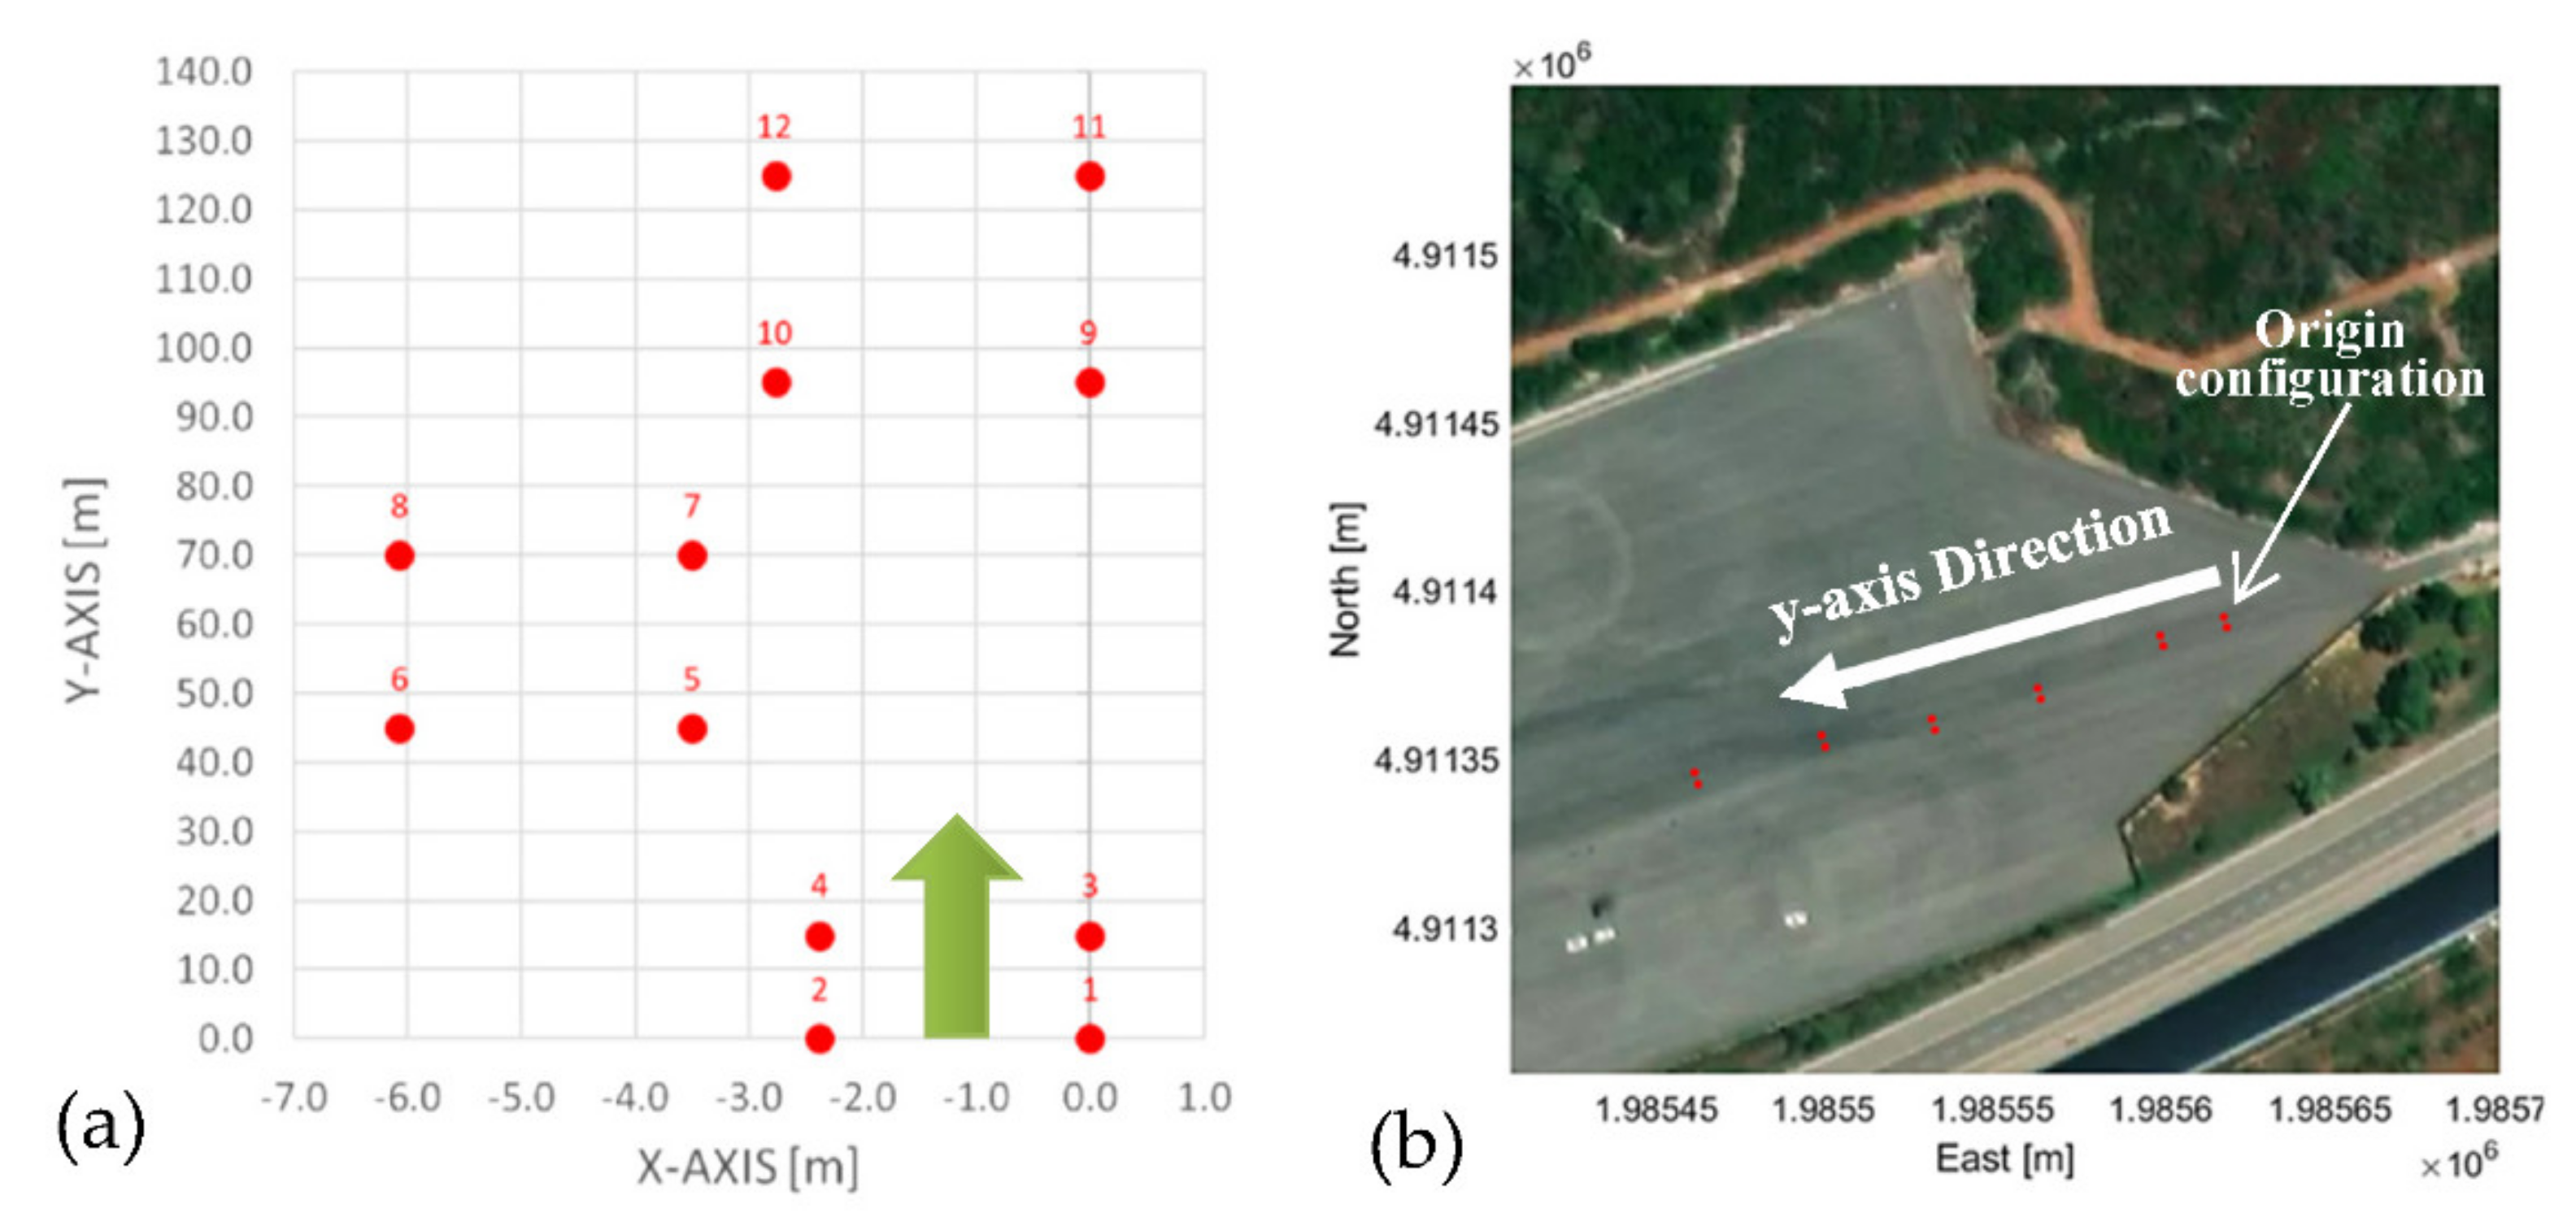
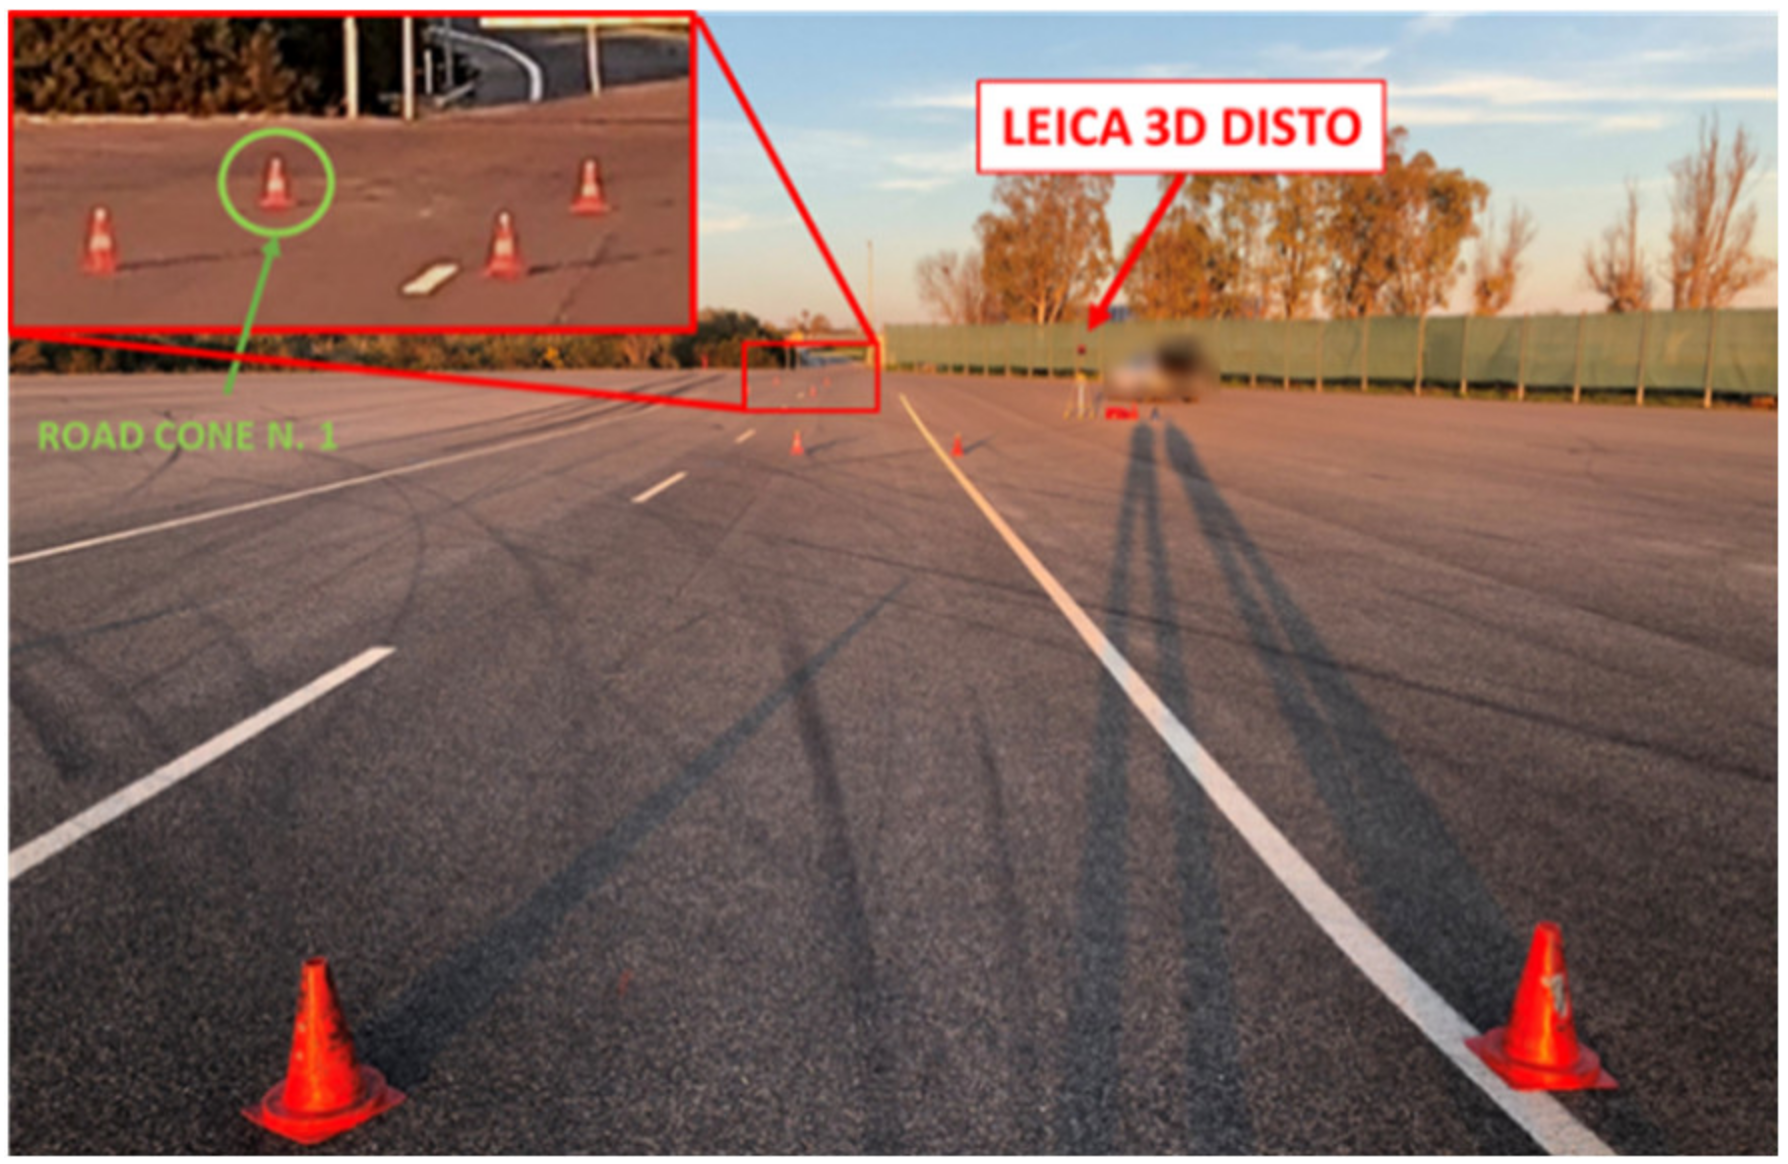
3.2. Automotive Test Preparation on the Testing Track through the Designed Stake-out System

This sub-section focuses on testing the designed stake-out system for preparing vehicle tests, consisting of laying out and precisely placing the road cones delimiting the car paths on the proving ground. These configurations are defined by international standards, such as the ISO 3888-1 or ISO 3888-2, or custom setup to reproduce road situations. The designed stake-out system allows for locating, with centimeter precision, the points on the track on the basis of the starting configuration and test location chosen by the user. However, this process introduces some errors in the relative distances between the points due to:
-
Inaccuracies of VBOX 3iSR INS and bubble level of the geolocation device.
-
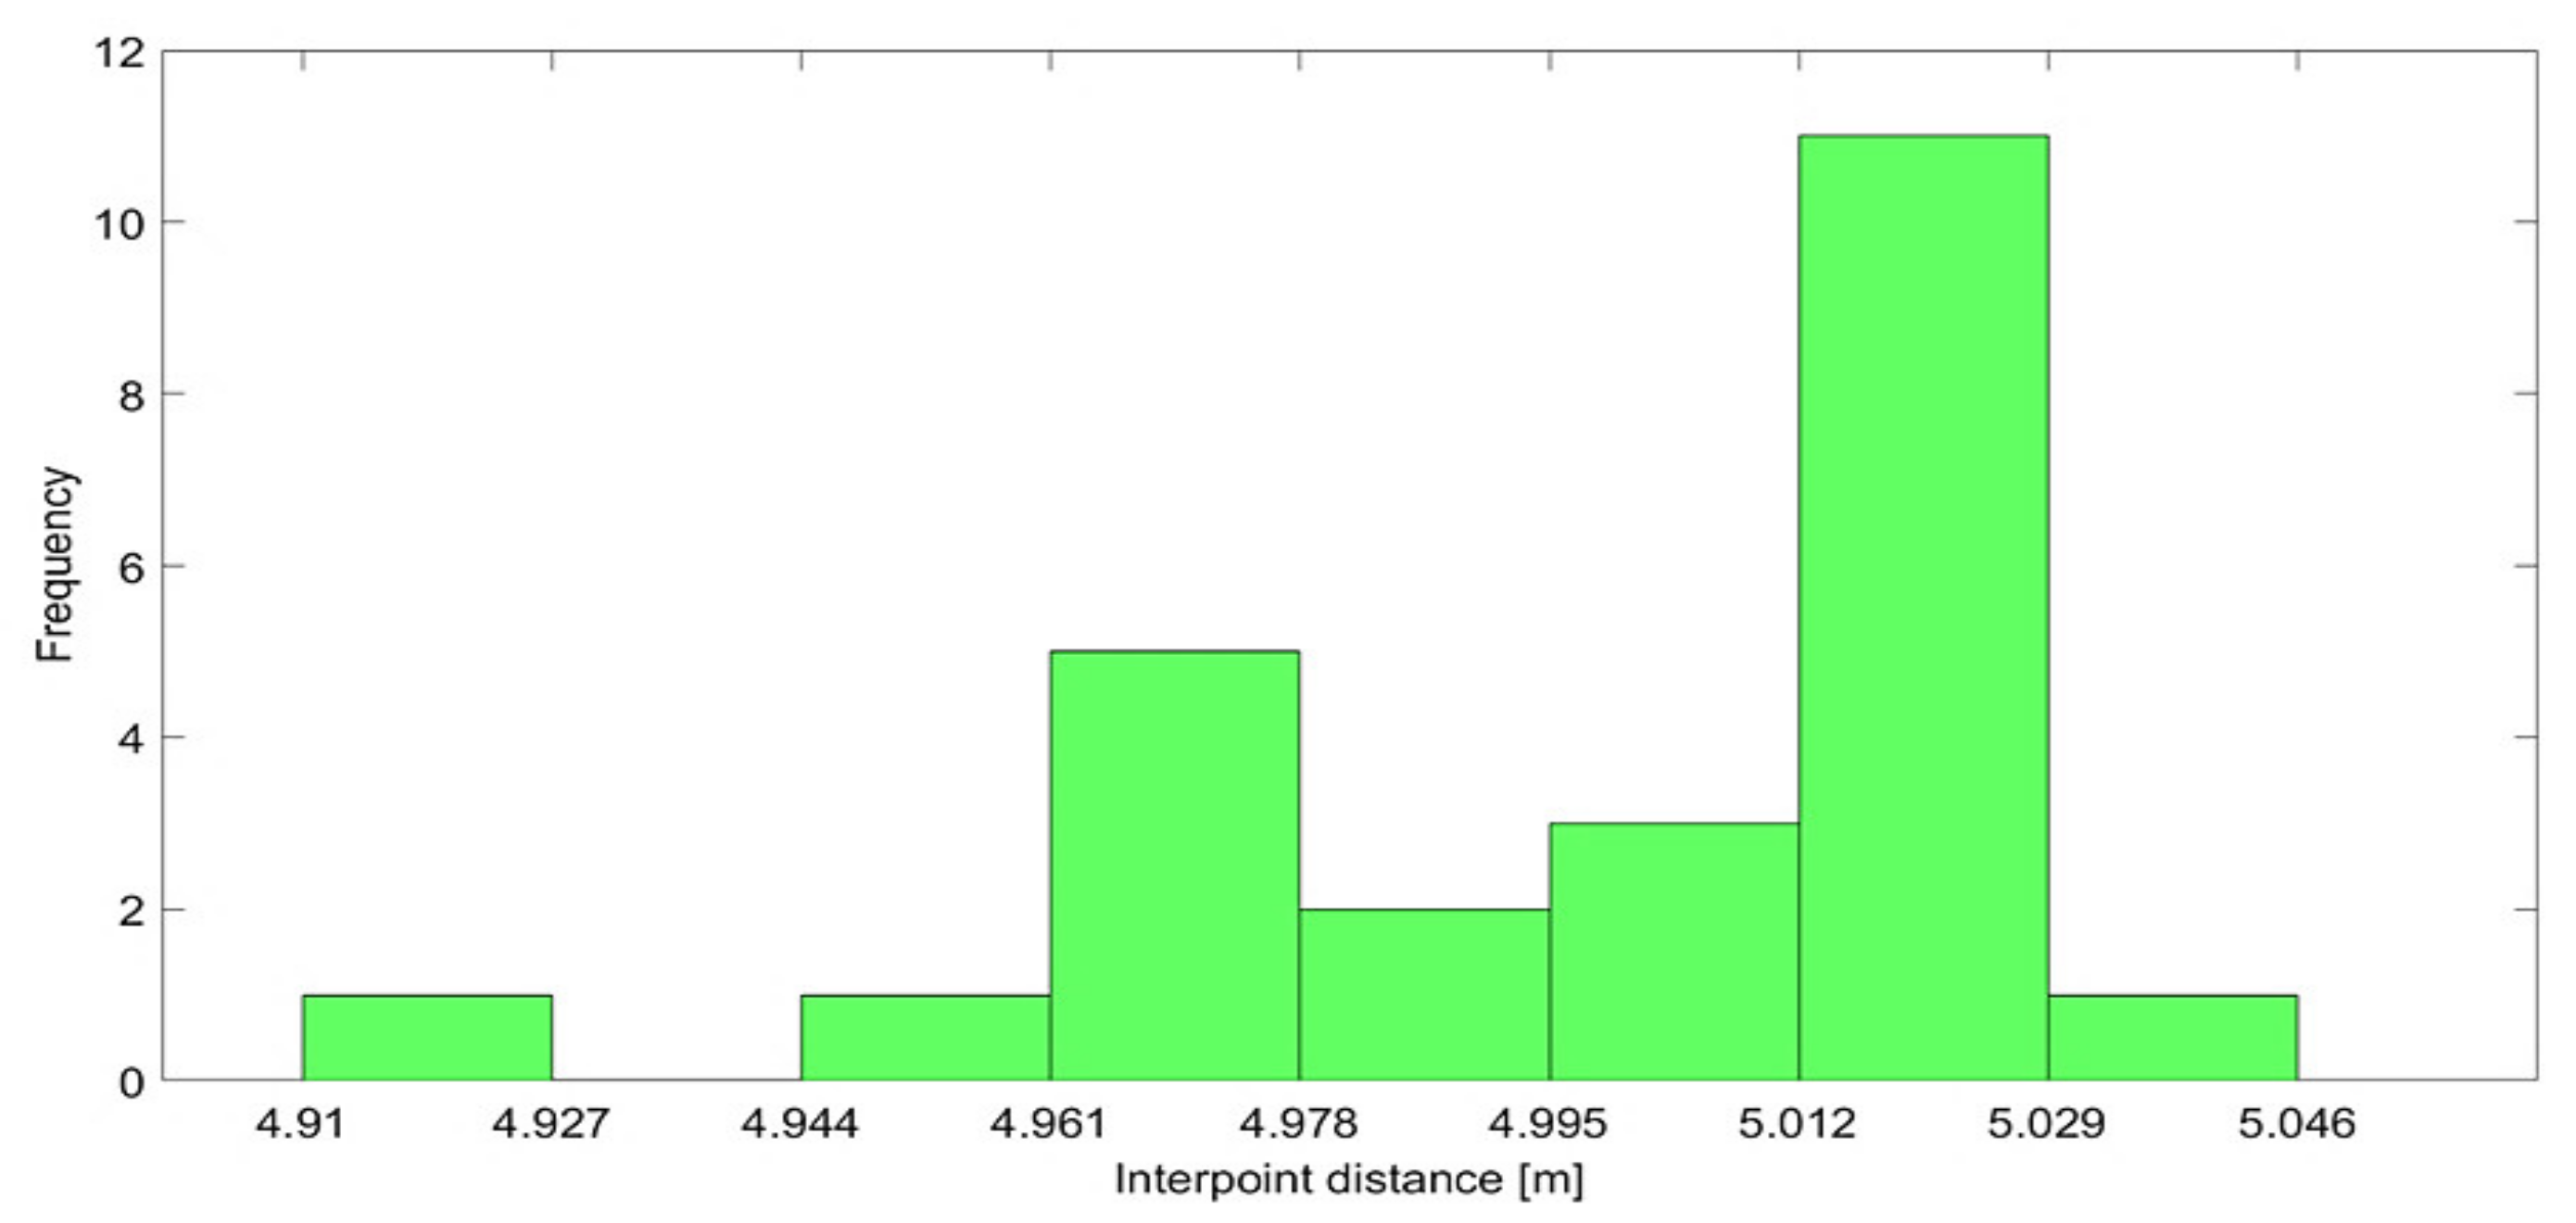
Distance alterations due to UTM projection.
Two test configurations were implemented on a road platform using the stake-out system; the obtained results regarding inter-point distance and angular measures allowed us to evaluate the introduced error compared to the initial configuration. The Leica 3D Disto sensor was used as a reference instrument, which integrates a high-precision laser distance meter and an angular encoder to determine relative positions between the targets hit by laser [32,33]). Its operating range (0.5-50 m) and accuracy (1 mm for distances up to 10 m, 2 mm up to 30 m, 4 mm up to 50 m) are suitable for the test application; moreover, the angular accuracy reported was 5″ [32]. The Leica sensor provides the coordinates of the points hit by the laser beam in the reference system formed as follows: the origin of the axes coincides with the first point hit by the laser, and the y-axis is defined by the second point hit by the laser. The x-axis is orthogonal to the y-axis, passing through the origin and contained in the plane containing the two points and the sensor. The right-hand triad defines the z-axis. Finally, the measurements were made by pointing the laser at specific targets provided by the Leica 3D Disto sensor manufacturer to avoid problems due to reflectance [32].
The first configuration was a grid of 4 × 4 points, 5 m away from each other in the vertical and horizontal directions; it was chosen to determine the introduced error on the relative distance between the points due to the high number of close points, making it easier to measure the distances by the Leica sensor. The 4 × 4 point grid was set up on the road platform by following the operative procedure described in Section 2; it was initially defined on a Cartesian reference system (Figure 16a) and then placed on the Mapbox satellite map after defining the origin and y-axis orientation (Figure 16b). Next, the Mapbox tool output file containing the grid points in UTM coordinates was uploaded into the FieldGenius software on the tablet. Finally, the 16 points of the grid were physically and quickly located by the operator on the road platform through the FieldGenius instructions related to cardinal directions (as depicted in Figure 5). Once each point was fixed, it was marked on the road, and a lying cone was placed to perform the distance measurement by the Leica 3D Disto sensor (Figure 17a,b).
To determine position differences between the obtained points grid on-road platform and the starting 4 × 4 configuration, we considered the distance and angular errors:
-
Distance error for i-th point: the difference between the nominal distance and that measured by the Leica 3D Disto sensor, both from the point n. 1 (origin).
-
Percentage distance error for i-th point: the ratio between the distance error and the nominal distance from the point n. 1 (origin).
-
Angular error: the difference between the nominal θ angle (formed by the y-axis and line passing through the points 1 and i-th), measured by the Leica 3D Disto sensor.
The above-defined parameter values related to distance measures of the 16 grid points were calculated, and the related standard deviation, mean values, and maximum values are reported in Table 2. The results clearly show the low mean values obtained for the distance (2.9 cm) and percentage distance error (0.26%); the maximum distance error was only 4.5 cm (for a real distance of 15.8 m related to the 8th point). The mean angular error was low as 0.18°, and the maximum error value was only 0.45°.
Further analyses were made on the measured distances between two successive points of the grid, which had both horizontal and vertical distances always equal to 5 m (Figure 16a). Figure 18 shows the distances’ distribution between two successive grid points, considering all possible combinations, and grouped into seven bins of equal width. The average error with respect to 5 m nominal distance was 2.4 cm, the standard deviation 1.7 cm, and the average percentage error 0.47%.
The second configuration, ruled by the ISO 3888-1 standard to perform the double lane-change maneuver, was intended to verify the stake-out system effectiveness to quickly prepare the vehicle test on the proving ground with high precision. The ISO 3888-1 test requires the placement of 22 traffic cones with precise relative distances to reproduce three lanes; however, only 12 points that limit the width and length of the lane were considered in this experimental phase. Similarly to the grid, the discrepancy between the configuration obtained on the track and starting one was evaluated, focusing on the lane width, the most critical parameter. The ISO 3888-1 standard requires the lane widths to be a function of the vehicle width (B parameter in Figure 1); in this test, B was considered to be 1.94 m (standard width for prototype cars), and the lane width was calculated by formulas of Figure 1. After, the 12 points were positioned on a Cartesian reference system with the origin coinciding with the first point. The y-axis was oriented along the test direction to be carried out (Figure 19a); using the Matlab Mapbox tool, the Cartesian reference system was arranged in the UTM coordinate system (Figure 19b). Finally, the 12 points were staked with the same procedure and settings previously used (Figure 20).
By the same measuring procedure using the Leica 3D Disto sensor, we performed the distance and angular measures with regards to the staked points; the obtained mean and maximum values are reported in Table 3. The angular error was much lower than the grid error (reduction factor 5), mainly due to higher distances of the double lane-change maneuver configuration. To verify the lanes width error, Figure 21 reports the comparison between the ISO 3888-1 standard lane widths and those measured; the maximum error was 4 cm, an acceptable value according to the reference standard.
Finally, Table 4 presents a comparison between the performances of our developed stake-out system with those of other similar systems reported in the scientific literature, both in terms of mean error and standard deviations, expressed in centimeters. As can be noted, the accuracy obtained by the developed system was in line with those reported in the cited scientific works, all in the order of few centimeters. Moreover, our system reached a lower standard deviation than other considered systems, indicating its higher precision.

4. Discussion

An innovative sensor-based system for preparing car tests on a track was designed in this scientific work. Automotive standards rule the points’ configuration and their relative position to verify under-test vehicle performance, such as road-holding or the proper operation of onboard systems, such as the electronic stability control (ESC) [40]. Preparing vehicle tests with traditional instruments (e.g., metric wheels) takes a long time, since operators place road cones (more than 100 m away) through inaccurate distance and angular measures [41,42]. They must also make perfectly straight lines, rarely realizable when using the metric wheel.
The designed stake-out geolocation system consists of a GNSS receiver-based device to allow stake-out centimeter-scale operations, integrated with a software platform that makes the preparatory phase of car tests more reliable and faster. The stake-out system performance has been verified in different real test setups, such as reported in Section 3.2. For the staking-out operations related to the 4 × 4 points grid with a 5 m distance between them, the obtained results provide a low mean distance error equal to 2.9 cm and a mean percentage error of 0.26%. The average angular error is also negligible, equal to 0.18° (Table 2). The average error on the distances between two consecutive grid points (referred to 24 point combinations) with respect to the nominal spacing (i.e., 5 m) was also low at 2.4 cm, which was an 0.47% average percentage error (Figure 18). Regarding the staking out test relative to the ISO 3888-1 double lane-change configuration, the average error over distances was 2.4 cm, the average percentage error was 0.26%, and the average angular error from the y-axis was 0.04°. The maximum error on the measured lane widths was 4 cm (Figure 21), a low value, corresponding to a percentage error of 1.56%, suitable for the specific application. Thus, in both on-track tested configurations, obtained performance confirmed the effectiveness of designed geolocation device in terms of staking functions.
On the basis of reported results obtained in the on-track tests, the designed and tested stake-out system represents a valuable operative instrument allowing efficient and accurate preparation of standardized automotive tests [43], usually performed at the Porsche Technical Center to certify prototype car performances. In this regard, Figure 22b–e shows a vehicle performing the ISO 3888-2 standard test prepared on the proving ground by employing the stake-out system (Figure 22a). The test reproduces a common road situation in which a vehicle makes a sudden lane change to avoid an obstacle, releasing the throttle at the first lane entrance. All cone arrangement operations were performed quickly and precisely with the proposed device, and this allowed the car performance test to be performed efficiently and accurately (Figure 22b).

5. Conclusions

This research work was conducted in collaboration with the Porsche Technical Center with the aim to realize a hardware/software stake-out system to support technicians during the preparatory phase of car performance tests on the proving ground. These vehicle tests are ruled by European or international standards that require the exact arrangement of the cones on the track to respect their relative distances as precisely as possible. To make the test’s preparatory phase efficient and immune from human errors, we have realized a sensor-based stake-out system to precisely locate the target points on large tracks, as previously defined onto the satellite map. Specifically, a pole structure device (called geolocation device) similar to field survey devices on the market, such as Trimble R10-2 and Leica GS18 T, was realized. The main element of the realized geolocation device is the VBOX 3iSR INS, a device used in automotive testing and integrates a GNSS RTK receiver allowing positioning measurements with centimeter accuracy. Through the geolocation device, an operator can be guided to the target points that define the test by following the graphical instructions provided by a commercial software called FieldGenius. Moreover, a solar energy harvesting section was developed to support the geolocalization device’s operation when used outdoors, extending its energy autonomy.
A software tool was developed in Matlab, allowing for the arrangement of a set of points, on the basis ofooo the specific automotive test standard, in a UTM coordinate system, using a navigable satellite map. The Matlab script receives as input a text file containing a set of points defined in a Cartesian reference system and provides a text file with the corresponding UTM terrestrial coordinates to be precisely located on the proving ground using the stake-out geolocation device. In addition, a graphical interface provides the user with real-time instructions to guide them from their current position to the destination points with centimeter accuracy.
The experimental results of the carried out on-track tests showed low angular (in the range 0.04–0.18°) and distance (2.4–2.9 cm) errors on the arrangement of the staked-out points. In conclusion, the stake-out system allows for the automotive test preparation with centimeter accuracy on any ground typology, even rough and uneven. The required time for the staking-out operations is only that necessary for the operator to reach the target points and position the geolocation device vertically on it.

Author Contributions

Conceptualization, N.I.G. and P.V.; methodology, R.D.F. and F.I.; software, F.I.; validation, F.I. and R.D.F.; data curation, F.I. and R.D.F.; writing—original draft preparation, F.I. and P.V.; writing—review and editing, P.V. and N.I.G.; supervision, P.V. and N.I.G. All authors have read and agreed to the published version of the manuscript.

Funding

This research received no external funding.

Institutional Review Board Statement

Not applicable.

Informed Consent Statement

Informed consent was obtained from all subjects involved in the study.

Data Availability Statement

Data of our study are available upon request.

Acknowledgments

The authors would like to thank A. Toma and V. Dodde of the engineering team of Nardò Technical Center S.r.l. (Porsche Engineering) for their technical support.

Conflicts of Interest

The authors declare no conflict of interest.

References

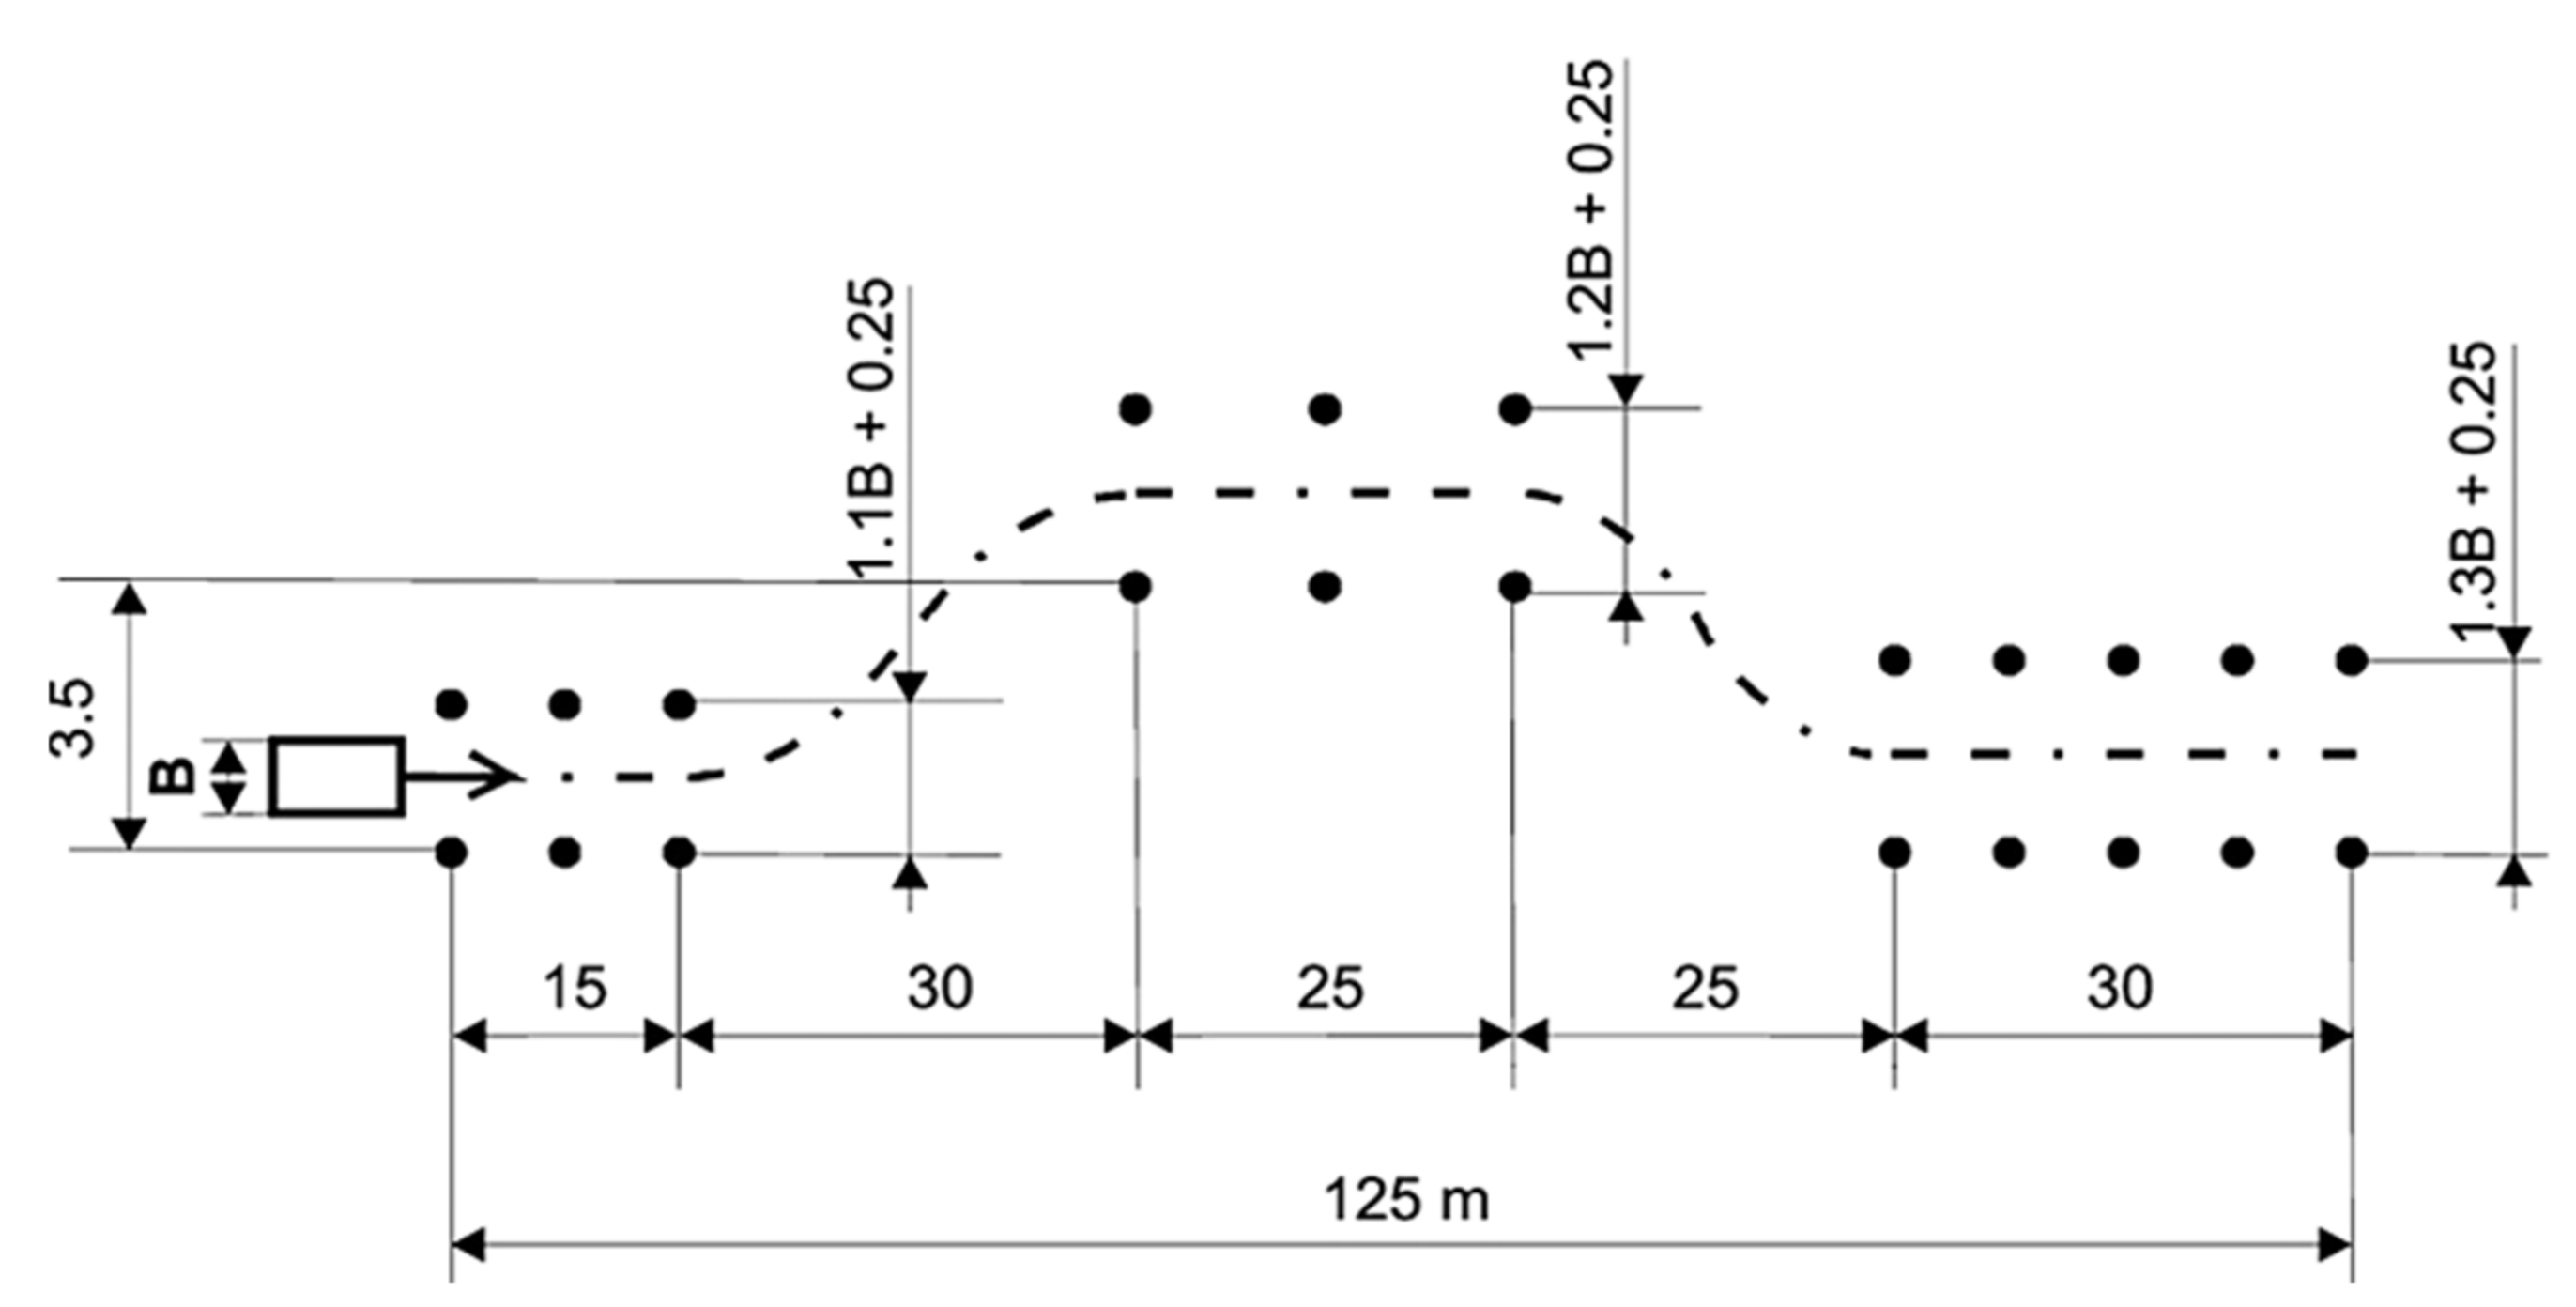
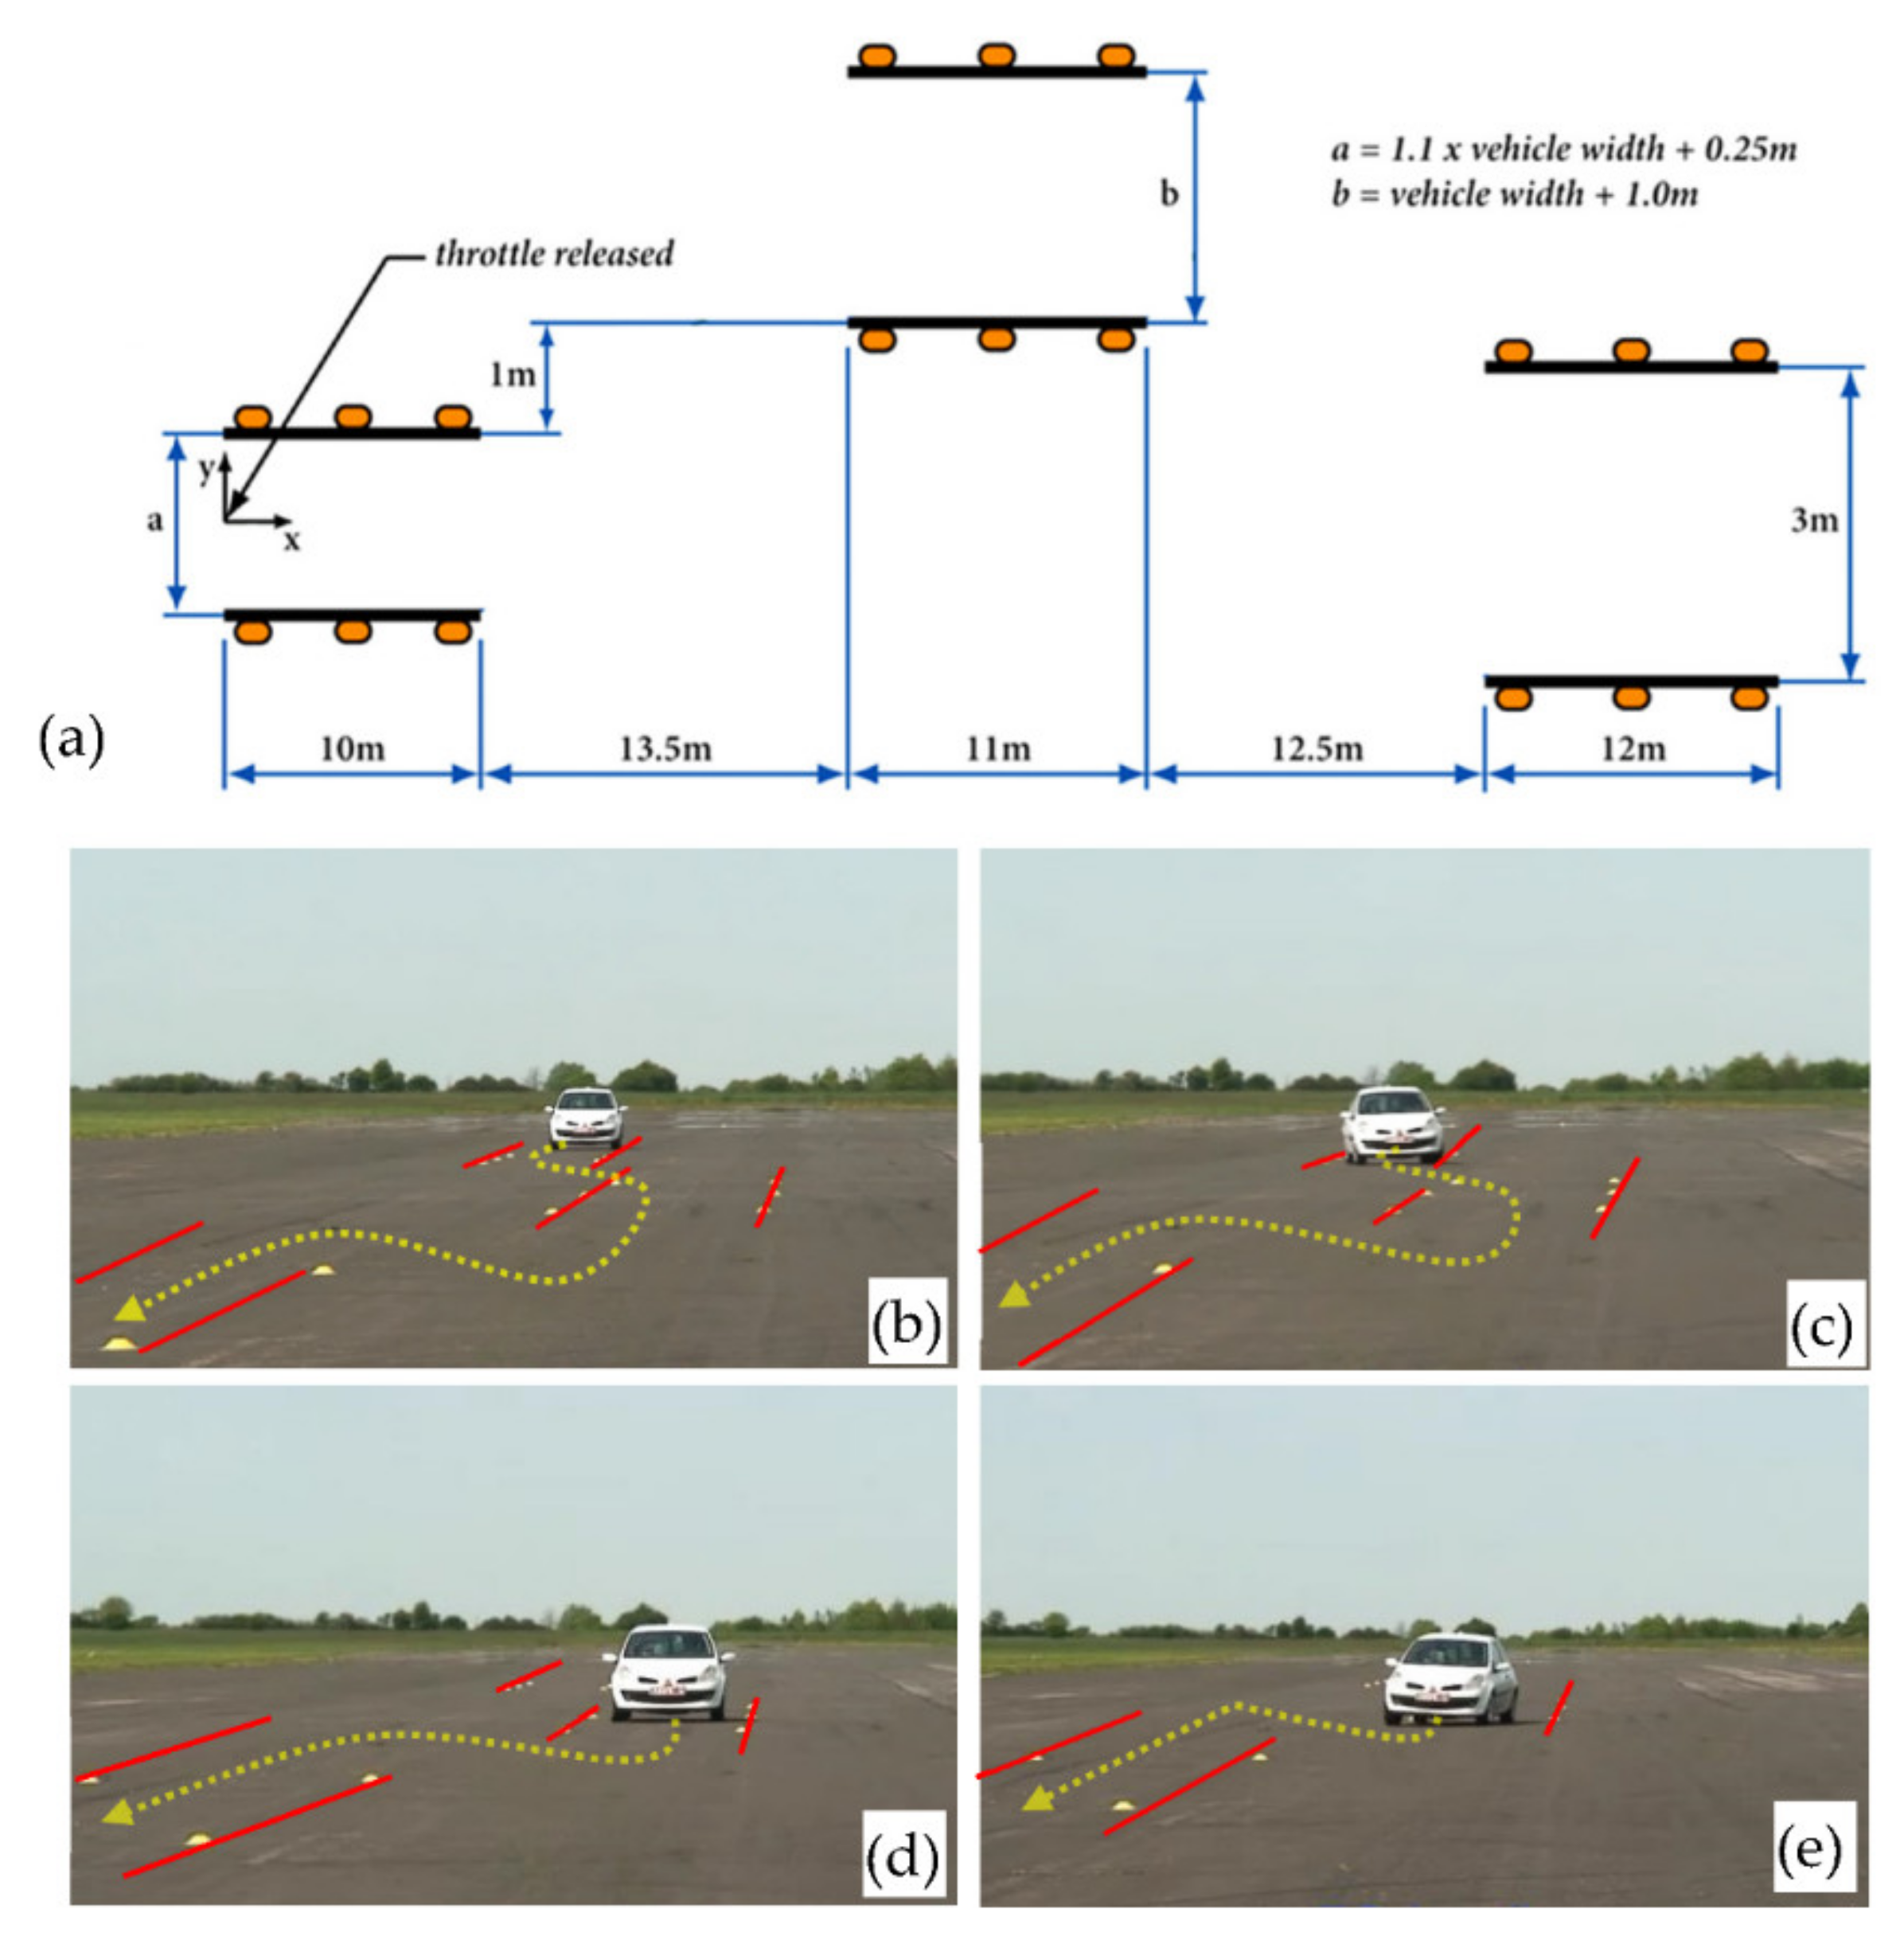
  1. ISO 3888-1:2018 Standard. Passenger Cars—Test Track for a Severe Lane-Change Manoeuvre—Part 1: Double Lane-Change. Available online: https://www.iso.org/standard/67973.html (accessed on 4 March 2021).
  2. Reński, A. Identification of Driver Model Parameters. Int. J. Occup. Saf. Ergon. 2001, 7, 79–92. [Google Scholar] [CrossRef] [Green Version]
  3. Limroth, J. Real-Time Vehicle Parameter Estimation and Adaptive Stability Control. All Dissertations. Number: 494. Clemson University. 2009. Available online: https://tigerprints.clemson.edu/all_dissertations/494 (accessed on 2 April 2021).
  4. Sun, Q.; Xia, J.C.; Foster, J.; Falkmer, T.; Lee, H. Pursuing Precise Vehicle Movement Trajectory in Urban Residential Area Using Multi-GNSS RTK Tracking. Transp. Res. Procedia 2017, 25, 2356–2372. [Google Scholar] [CrossRef]
  5. Catania, P.; Comparetti, A.; Febo, P.; Morello, G.; Orlando, S.; Roma, E.; Vallone, M. Positioning Accuracy Comparison of GNSS Receivers Used for Mapping and Guidance of Agricultural Machines. Agronomy 2020, 10, 924. [Google Scholar] [CrossRef]
  6. Niu, Z.; Nie, P.; Tao, L.; Sun, J.; Zhu, B. RTK with the Assistance of an IMU-Based Pedestrian Navigation Algorithm for Smartphones. Sensors 2019, 19, 3228. [Google Scholar] [CrossRef] [PubMed] [Green Version]
  7. Visconti, P.; De Fazio, R.; Costantini, P.; Miccoli, S.; Cafagna, D. Arduino-Based Solution for In-Car-Abandoned Infants’ Detection Remotely Managed by Smartphone Application. J. Commun. Softw. Syst. 2019, 15, 89–100. [Google Scholar] [CrossRef] [Green Version]
  8. Omae, M.; Fujioka, T.; Hashimoto, N.; Shimizu, H. The Application of RTK-GPS and Steer-by-Wire Technology to tHE Automatic Driving of Vehicles and an Evaluation of Driver Behavior. IATSS Res. 2006, 30, 29–38. [Google Scholar] [CrossRef] [Green Version]
  9. Han, J.-H.; Park, C.-H.; Park, Y.-J.; Kwon, J.H. Preliminary Results of the Development of a Single-Frequency GNSS RTK-Based Autonomous Driving System for a Speed Sprayer. J. Sensors 2019, 2019, 1–9. [Google Scholar] [CrossRef] [Green Version]
  10. Saponara, S. Real-time kinematics for accurate geolocalization of images in telerobotic applications. Real-Time Image Video Process. 2018, 10670, 106700J. [Google Scholar] [CrossRef]
  11. Moreno, H.; Valero, C.; Bengochea-Guevara, J.M.; Ribeiro, Á.; Garrido-Izard, M.; Andújar, D. On-Ground Vineyard Reconstruction Using a LiDAR-Based Automated System. Sensors 2020, 20, 1102. [Google Scholar] [CrossRef] [Green Version]
  12. Muhammad, B.; Prasad, R.; Nisi, M.; Menichetti, F.; Cianca, E.; Mennella, A.; Gagliarde, G.; Marenchino, D. Maintenance of the Photovolatic PlantsUsing UAV Equipped with Low-costGNSS RTK Receiver. J. Commun. Navig. Sens. Serv. (CONASENSE) 2018, 2017, 25–48. [Google Scholar] [CrossRef] [Green Version]
  13. Kulsinskas, A.; Durdevic, P.; Ortiz-Arroyo, D. Internal Wind Turbine Blade Inspections Using UAVs: Analysis and Design Issues. Energies 2021, 14, 294. [Google Scholar] [CrossRef]
  14. Sudevan, V.; Shukla, A.; Karki, H. Autonomous Tracking and Tagging of Buried Pipelines Based on Pipe-Locator Data. In Proceedings of the International Conference on Diagnostics of Structures an Components using Metal Magnetic Memory Method; Ether NDE: Prague, Czech Republic, 2019; pp. 1–8. [Google Scholar]
  15. Campos, D.F.; Matos, A.; Pinto, A.M. Multi-domain inspection of offshore wind farms using an autonomous surface vehicle. SN Appl. Sci. 2021, 3, 1–19. [Google Scholar] [CrossRef]
  16. Cantieri, A.; Ferraz, M.; Szekir, G.; Teixeira, M.A.; Lima, J.; Oliveira, A.S.; Wehrmeister, M.A. Cooperative UAV–UGV Autonomous Power Pylon Inspection: An Investigation of Cooperative Outdoor Vehicle Positioning Architecture. Sensors 2020, 20, 6384. [Google Scholar] [CrossRef]
  17. Racelogic Company, VBOX 3iSR Datasheet. Available online: https://www.racelogic.co.uk/_downloads/vbox/Datasheets/Data_Loggers/RLVB3iS_Data.pdf (accessed on 28 January 2021).
  18. Genesys (Sensor & Navigation Solution) Company. Genesys Outdoor Base Station Datasheet. Available online: https://www.genesys-offenburg.de/en/products/dgnss-correction-data/gps-outdoor-base-station/ (accessed on 28 January 2021).
  19. Williams, C.E. A Comparison of Circular Error Probable Estimators for Small Samples. Master’s Thesis, DTIC Document. 1997. Available online: https://apps.dtic.mil/sti/citations/ADA324337 (accessed on 1 March 2021).
  20. Liu, B.; Duan, X.; Yan, L. A Novel Bayesian Method for Calculating Circular Error Probability with Systematic-Biased Prior Information. Math. Probl. Eng. 2018, 2018, 1–9. [Google Scholar] [CrossRef]
  21. RS Pro Company. Bubble Level RS Pro Datasheet. Available online: https://docs.rs-online.com/8f60/0900766b81584b7a.pdf (accessed on 10 January 2021).
  22. XTPower Company. Power Bank XTPower MP-10000 Manual. Available online: https://www.xtpower.de/mediafiles/Anleitungen/Anleitung%20Powerbank%20MP-10000.pdf (accessed on 10 January 2021).
  23. De Fazio, R.; Cafagna, D.; Marcuccio, G.; Visconti, P. Limitations and Characterization of Energy Storage Devices for Harvesting Applications. Energies 2020, 13, 783. [Google Scholar] [CrossRef] [Green Version]
  24. Racelogic Company. Antenna RLACS156 Datasheet. Available online: https://racelogic.support/03LabSat_GPS_Simulators/Knowledge_Base/General_Information/LabSat_Antenna_Matrix#RLACS156 (accessed on 10 January 2021).
  25. Zhang, L.; Schwieger, V. Investigation of a L1-optimized choke ring ground plane for a low-cost GPS receiver-system. J. Appl. Geodesy 2017, 12, 55–64. [Google Scholar] [CrossRef]
  26. Kunysz, W. High Performance GPS Pinwheel Antenna; White Paper; NovAtel Inc. 2000, pp. 1–6. Available online: https://hexagondownloads.blob.core.windows.net/public/Novatel/assets/Documents/Papers/gps_pinwheel_ant/gps_pinwheel_ant.pdf (accessed on 25 March 2021).
  27. Teunissen, P.J.G.; Montenbruck, O. Springer Handbook of Global Navigation Satellite Systems; Springer: Berlin, Germany, 2017; ISBN 978-3-319-42926-7. [Google Scholar] [CrossRef]
  28. Satel Company. Radio Modem Satel Satelline-Easy Datasheet. Available online: https://www.satel.com/wp-content/uploads/2020/11/SATELLINE-EASy_11_2020_small.pdf (accessed on 10 January 2021).
  29. Snyder, J.P. Map projections: A working manual. In Professional Paper; US Geological Survey: Reston, VA, USA, 1987. [Google Scholar]
  30. International Association of Oil & Gas Producers (IOGP). Publication 373-7-2: “Coordinate Conversions and Transformations including Formulas”, Geomatics Guidance Note Number 7, Part 2—September 2019. Available online: https://www.iogp.org/wp-content/uploads/2019/09/373-07-02.pdf (accessed on 25 March 2021).
  31. UTM—Universal Transversal Projection. Available online: http://geokov.com/education/utm.aspx#:~:text=The%20scale%20error%20within%20each,Mercator%20projections%20are%20conformal%20projections (accessed on 20 March 2021).
  32. Leica Company. Leica 3D Disto Datasheet. Available online: https://shop.leica-geosystems.com/sites/default/files/2020-05/3DD%20Technical%20Data%20Sheet%20-%20US%20Std%20V5.pdf (accessed on 5 March 2021).
  33. Leica Company. Leica 3D Disto Manual. Available online: https://shop.leica-geosystems.com/sites/default/files/2020-05/847903_Leica_3D_Disto_UM_V.6-1-0_en.pdf (accessed on 5 March 2021).
  34. Feng, Y.; Wang, J. GPS RTK Performance Characteristics and Analysis. J. Glob. Position. Syst. 2008, 7, 1–8. [Google Scholar] [CrossRef] [Green Version]
  35. Hong, S.-E. The Accuracy Analysis of Parcel Surveying by RTK-GPS and RTK-GPS/GLONASS. Spat. Inf. Res. 2006, 14, 211–221. [Google Scholar]
  36. Xu, Y.; Chen, W. Performance Analysis of GPS/BDS Dual/Triple-Frequency Network RTK in Urban Areas: A Case Study in Hong Kong. Sensors 2018, 18, 2437. [Google Scholar] [CrossRef] [PubMed] [Green Version]
  37. Manandhar, D.; Honda, K.; Murai, S. Accuracy assessment and improvement for level survey using real time kinematic (RTK) GPS. In Proceedings of the IEEE 1999 International Geoscience and Remote Sensing Symposium, Hamburg, Germany, 28 June–2 July 1999; IEEE: Piscataway, NJ, USA, 2002; Volume 2, pp. 882–884, IGARSS’99 (Cat. No.99CH36293). [Google Scholar]
  38. Roh, T.-H.; Seo, D.-J.; Lee, J.-C. An accuracy analysis for horizontal alignment of road by the kinematic GPS/GLONASS combination. KSCE J. Civ. Eng. 2003, 7, 73–79. [Google Scholar] [CrossRef]
  39. Reid, T.G.R.; Pervez, N.; Ibrahim, U.; Houts, S.E.; Pandey, G.; Alla, N.K.; Hsia, A. Standalone and RTK GNSS on 30,000 km of North American Highways. In Proceedings of the 32nd International Technical Meeting of the Satellite Division of The Institute of Navigation (ION GNSS+ 2019), Miami, FL, USA, 16–20 September 2019; The Institute of Navigation: Manassas, VA, USA; pp. 2135–2158. [Google Scholar]
  40. Visconti, P.; Sbarro, B.; Primiceri, P.; de Fazio, R.; Lay-Ekuakille, A. Design and testing of electronic control system based on STM X-Nucleo board for detection and wireless transmission of sensors data applied to a single-seat Formula SAE car. Int. J. Electron. Telecommun. 2019, 65, 671–678. [Google Scholar] [CrossRef]
  41. RS Pro Company. Metric Measuring Wheel 10000 m ±1% Datasheet. Available online: https://it.rs-online.com/web/p/ruote-di-misurazione/1755055/?cm_mmc=IT-PLA-DS3A-_-google-_-PLA_IT_IT_Utensili_manuali_Whoop-_-(IT:Whoop!)+Ruote+di+misurazione-_-1755055&matchtype=&pla-328208572530&gclid=CjwKCAjw6fCCBhBNEiwAem5SO4T7zYy-NGNje5dSVPwB3Q_TOUeUTAiU-yPCvYiaQmivA7hNHafUFxoCDHAQAvD_BwE&gclsrc=aw.ds (accessed on 26 March 2021).
  42. Garosa Company. Metric Measuring Wheel 9999.9 ft 10 cm Datasheet. Available online: https://www.amazon.com/Mechanical-Measuring-Hand-Held-Accuracy-Distance/dp/B07ZNTCN4V/ref=sr_1_5?dchild=1&keywords=Measuring+Wheels+accuracy&qid=1616688581&s=hi&sr=1-5 (accessed on 26 March 2021).
  43. Visconti, P.; Sbarro, B.; Primiceri, P. A ST X-Nucleo-based telemetry unit for detection and Wi-Fi transmission of competition car sensors data: Firmware development, sensors testing and real-time data analysis. Int. J. Smart Sens. Intell. Syst. 2017, 10, 793–828. [Google Scholar] [CrossRef] [Green Version]
Figure 1. Cone displacement of the ISO 3888-1 double lane-change maneuver [2]; B represents the vehicle’s width (all the numerical values shown are to be intended in meters).
Energies 14 04885 g001
Figure 2. Configuration of the designed geolocation stake-out system to place a set of points on a track to carry out vehicle tests.
Energies 14 04885 g002
Figure 3. Set of points defined by user in a generic Cartesian reference system with origin x = 0, y = 0 (a); through a specific Matlab tool, the input points are arranged on the UTM coordinate system (b).
Energies 14 04885 g003
Figure 4. Activity flow to place a set of points on a track according to the specific standard.
Energies 14 04885 g004
Figure 5. Example of use of the geolocation device: during searching for a given point (a), and when this last is reached (b); positioning of the road cones in the selected configuration (c).
Energies 14 04885 g005
Figure 6. Graphical scheme of the stake-out geolocation device integrated the solar charging system (highlighted into the dashed line).
Energies 14 04885 g006
Figure 7. Positioning inaccuracy of the geolocation device due to bubble level.
Energies 14 04885 g007
Figure 8. Photos of the stake-out geolocation device with a side view (a) and front view (b).
Energies 14 04885 g008
Figure 9. Use of the stake-out geolocation device to locate points with centimeter accuracy on a wide track (ac) and record geographical coordinates of a point already marked on the ground (d).
Energies 14 04885 g009aEnergies 14 04885 g009b
Figure 10. The user interface of the developed Matlab Mapbox tool.
Energies 14 04885 g010
Figure 11. Interface of the Matlab Mapbox tool; choice of the origin by left-clicking on a point (a) and choice of the y-axis orientation by right-clicking on another point (b).
Energies 14 04885 g011
Figure 12. Flow chart of the script related to the Matlab Mapbox app.
Energies 14 04885 g012
Figure 13. NMEA messages acquired by the VBOX sensor, filtered by the developed Matlab script (a), and converted into UTM coordinate (b).
Energies 14 04885 g013
Figure 14. Experimental setup to detect the position of the measuring point by the VBOX 3iSR INS (a); flowchart of the developed Matlab code to process the NMEA data stream (b).
Energies 14 04885 g014
Figure 15. Positioning measures with VBOX 3iSR INS in RTK with antenna model RLACS156; the number next to each point represents the readings with the same north and east coordinates.
Energies 14 04885 g015
Figure 16. A 4 × 4 point grid defined in a Cartesian reference system (a); the same point grid defined in the Web Mercator coordinate system on the Mapbox satellite map of developed Matlab tool (b).
Energies 14 04885 g016
Figure 17. Cones arrangement on the staked-out grid points: points 1 and 13 are indicated to make clear the y-axis direction set on the road (a); Leica 3D Disto sensor to measure relative distances (b).
Energies 14 04885 g017
Figure 18. Histogram of the measured distances between two consecutive points considering the 24 possible combinations of the grid.
Energies 14 04885 g018
Figure 19. Point configuration defined by the ISO 3888-1 standard arranged in a Cartesian reference system (a); point arrangement of ISO 3888-1 vehicle test on the satellite map of the Mapbox tool (b).
Energies 14 04885 g019
Figure 20. Arrangement of road cones on the staked-out points related to vehicle test ruled by the ISO 3888-1 standard and position of the Leica 3D Disto sensor used to measure relative distances.
Energies 14 04885 g020
Figure 21. Comparison between measured lane widths (purple) and those defined by the ISO 3888-1 standard (blue).
Energies 14 04885 g021
Figure 22. ISO 3888-2 lane-change maneuver with the lane widths depending on the vehicle width (a); sequential shots (be) of a vehicle performing test ruled by the above standard configuration, defined on the track by the stake-out system.
Energies 14 04885 g022
Table 1. Midpoint, standard deviations, and CEP 95% value related to the positioning measurements on the measuring point with VBOX 3iSR INS in RTK mode.
VBOX 3iSR with RLACS156 Antenna
Midpoint UTM coordinates(738504.449 m E; 4466935.146 m N)
Standard deviation UTM East2.3 mm
Standard deviation UTM North3.6 mm
CEP 95%7.5 mm
Table 2. Mean, standard deviation, and maximum values of distance error from point n. 1, percentage distance error from point n. 1, and angular error from the y-axis (grid configuration).
Mean Standard DeviationMax Value
Distance error (cm)2.91.14.5
Percentage distance error %0.260.120.46
Angular error (°)0.180.130.45
Table 3. Mean, standard deviation, and maximum value of distance error from point 1, percentage distance error, and angular error (point configuration for the double lane-change maneuver).
MeanStandard DeviationMax Value
Distance error (cm)2.40.32.9
Percentage distance error %0.260.350.15
Angular error (°)0.040.030.08
Table 4. Table comparing the performances of our developed stake-out system with other characterizations reported in the literature in terms of mean error and standard deviation.
WorkUsed SystemMean Error (cm)Standard Deviation (cm)
Our systemVBOX 3iSR2.40.3
Feng et al. [34]HD-RTK2™2.00.7
Kong [35]Topcon HiPer1.50.9
Xu et al. [36]Trimble R102.20.8
Manadhar et al. [37]Novatel R203.02.0
Rohr et al. [38]Javad5.3-
Reid et al. [39]OxTS RT300075.010.0
Publisher’s Note: MDPI stays neutral with regard to jurisdictional claims in published maps and institutional affiliations.

