
Complementary Optimization of Hydropower with Pumped Hydro Storage–Photovoltaic Plant for All-Day Peak Electricity Demand in Malawi


Abstract
:
1. Introduction
- Exploring the PHS–PV system and showcasing the concept of exploiting the temporary–periodic flow in run-of-river plants with a small reservoir regulation capacity for meeting the all-day peak electricity demand in Malawi.
- Developing the quasi-steady operational framework for the exploitation of a temporary–periodic flow and PHS–PV power generation.
- Incorporating the net head effects for the PHS–PV in both generating and pumping modes in the model.
2. Materials and Methods
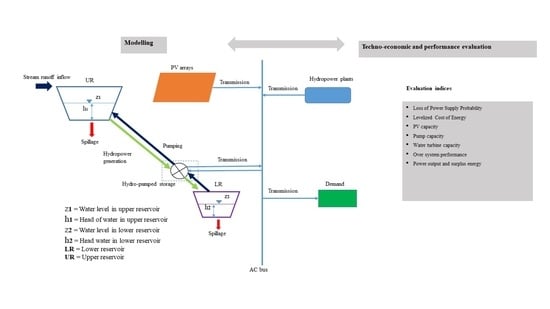
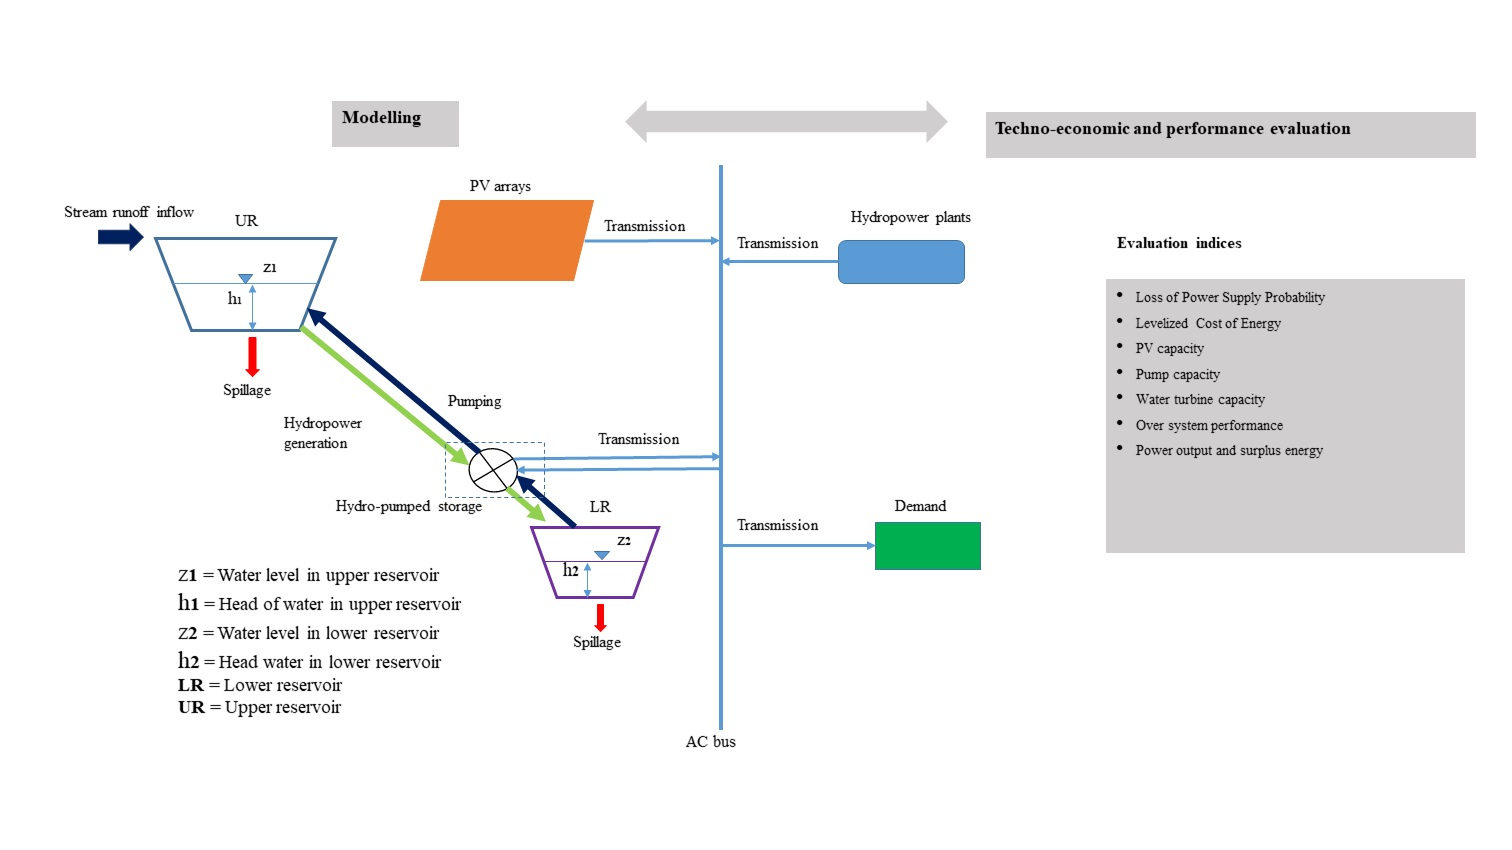
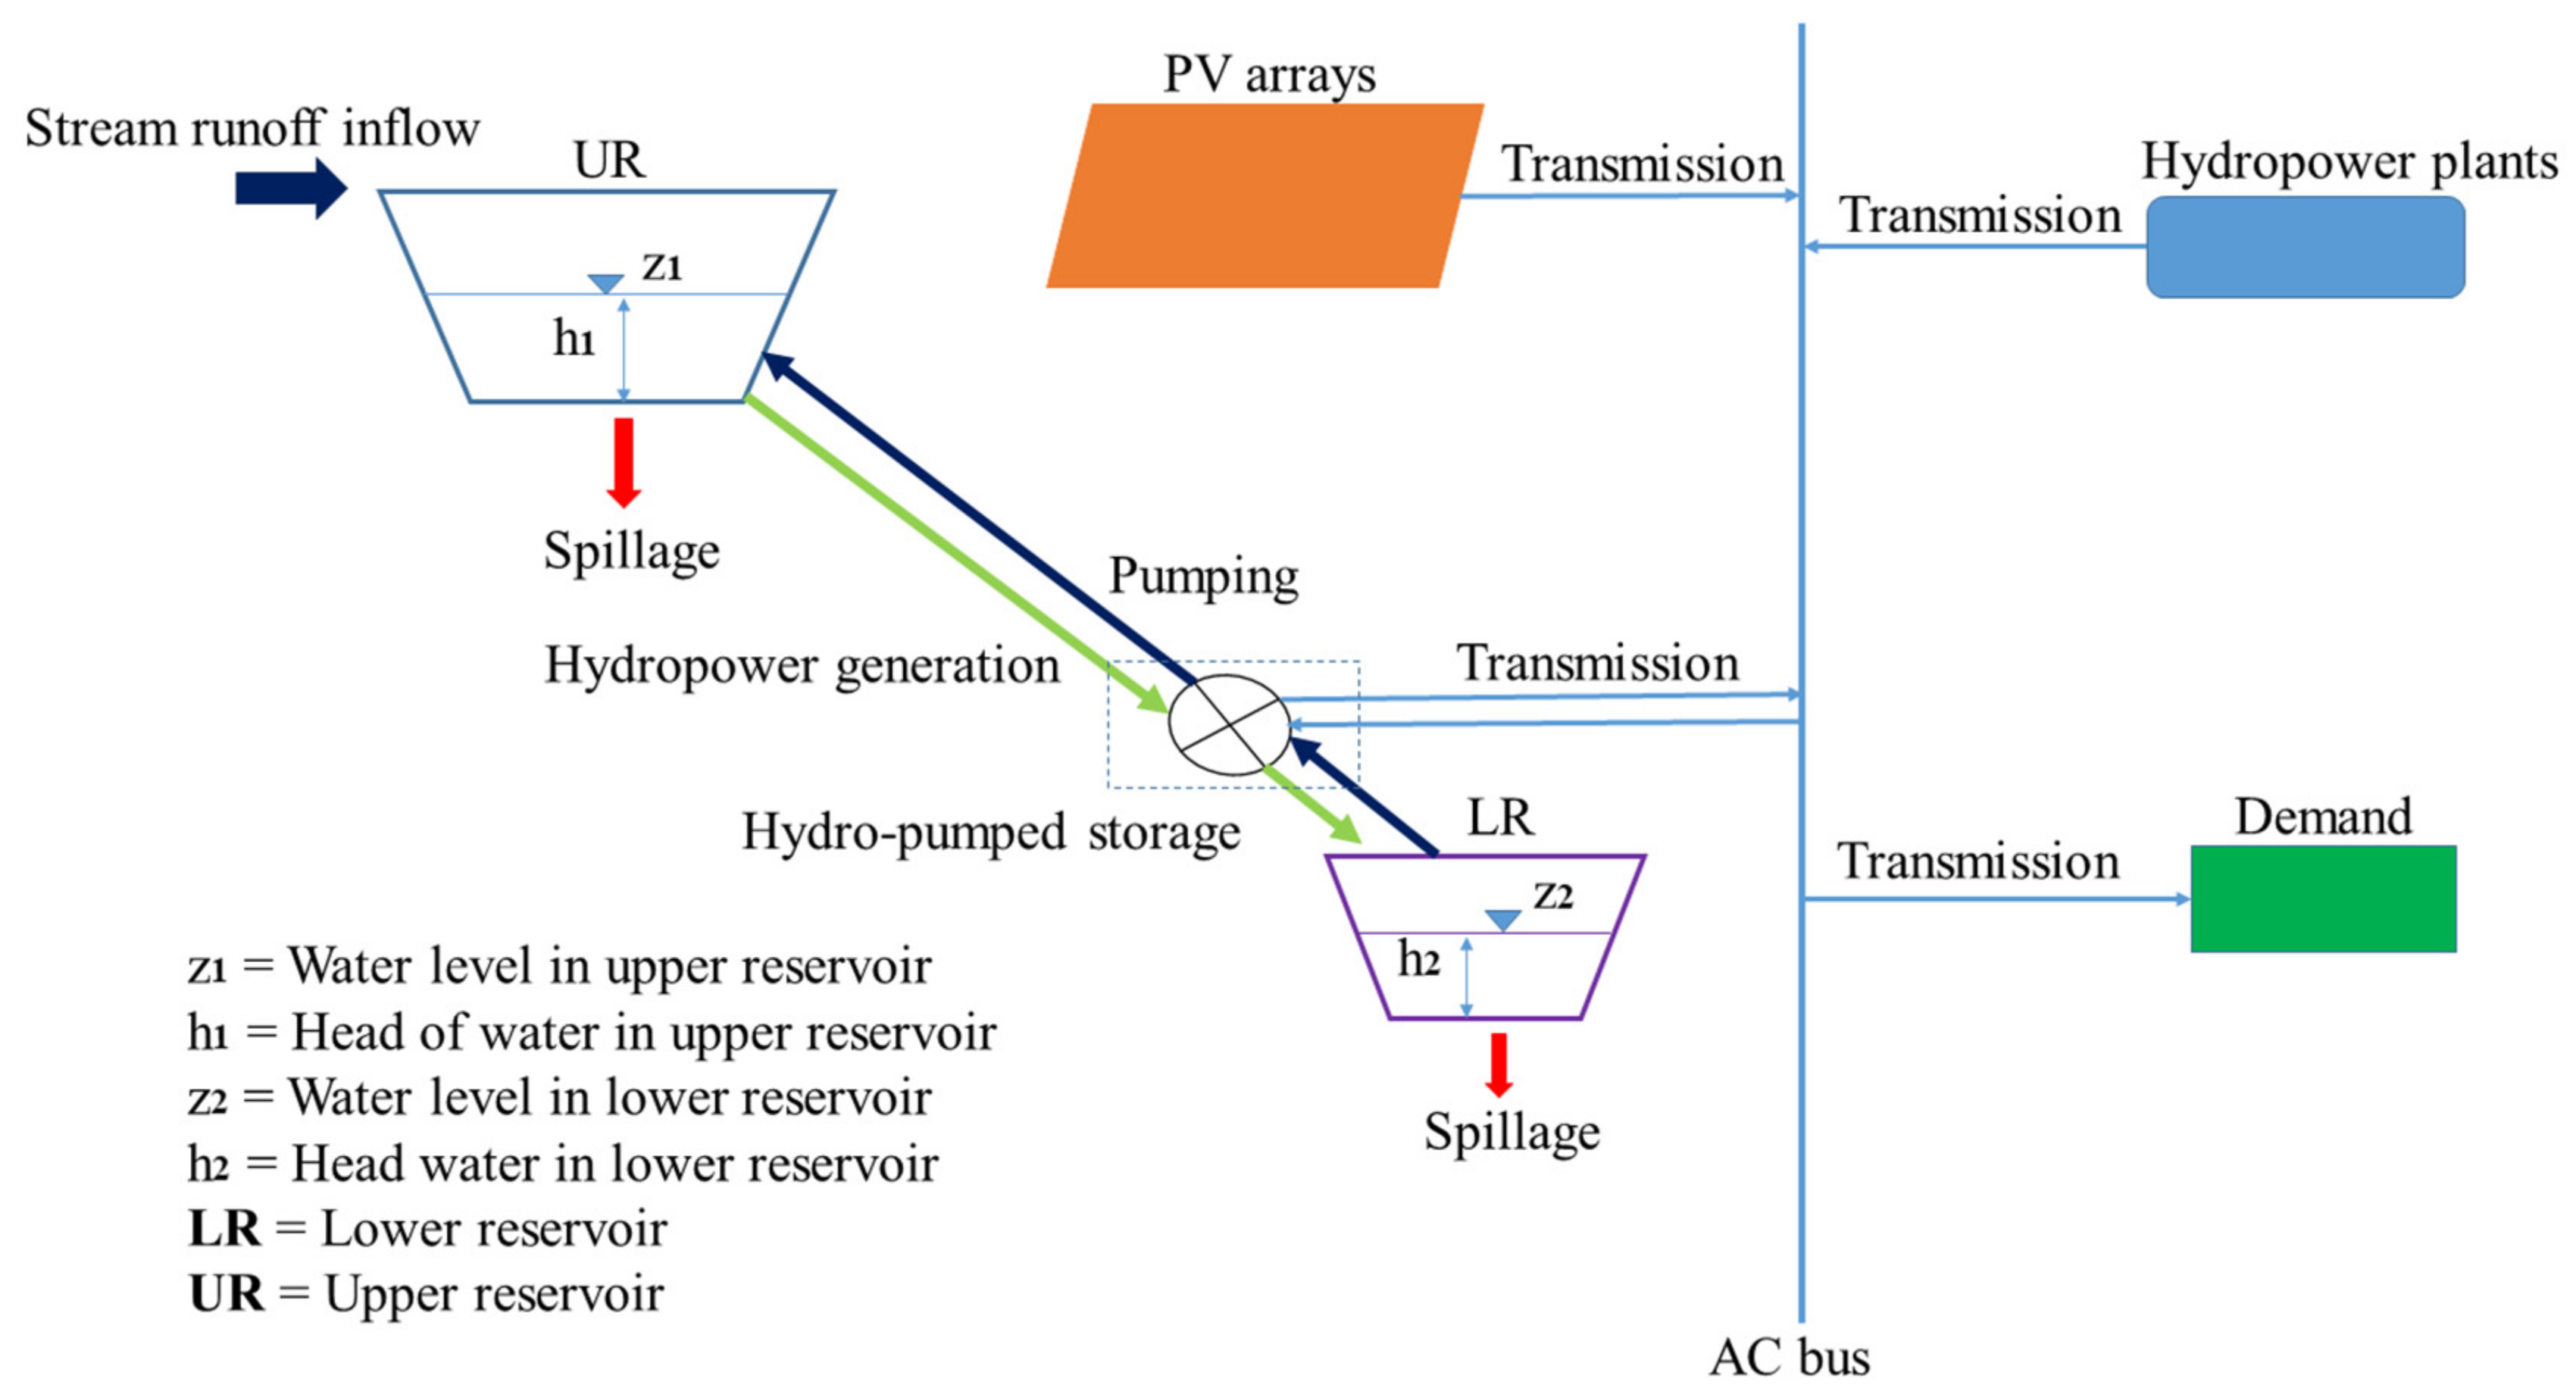
2.1. Linear Optimisation Model for the Cascade Hydro/PHS–PV Combined Electric Power System
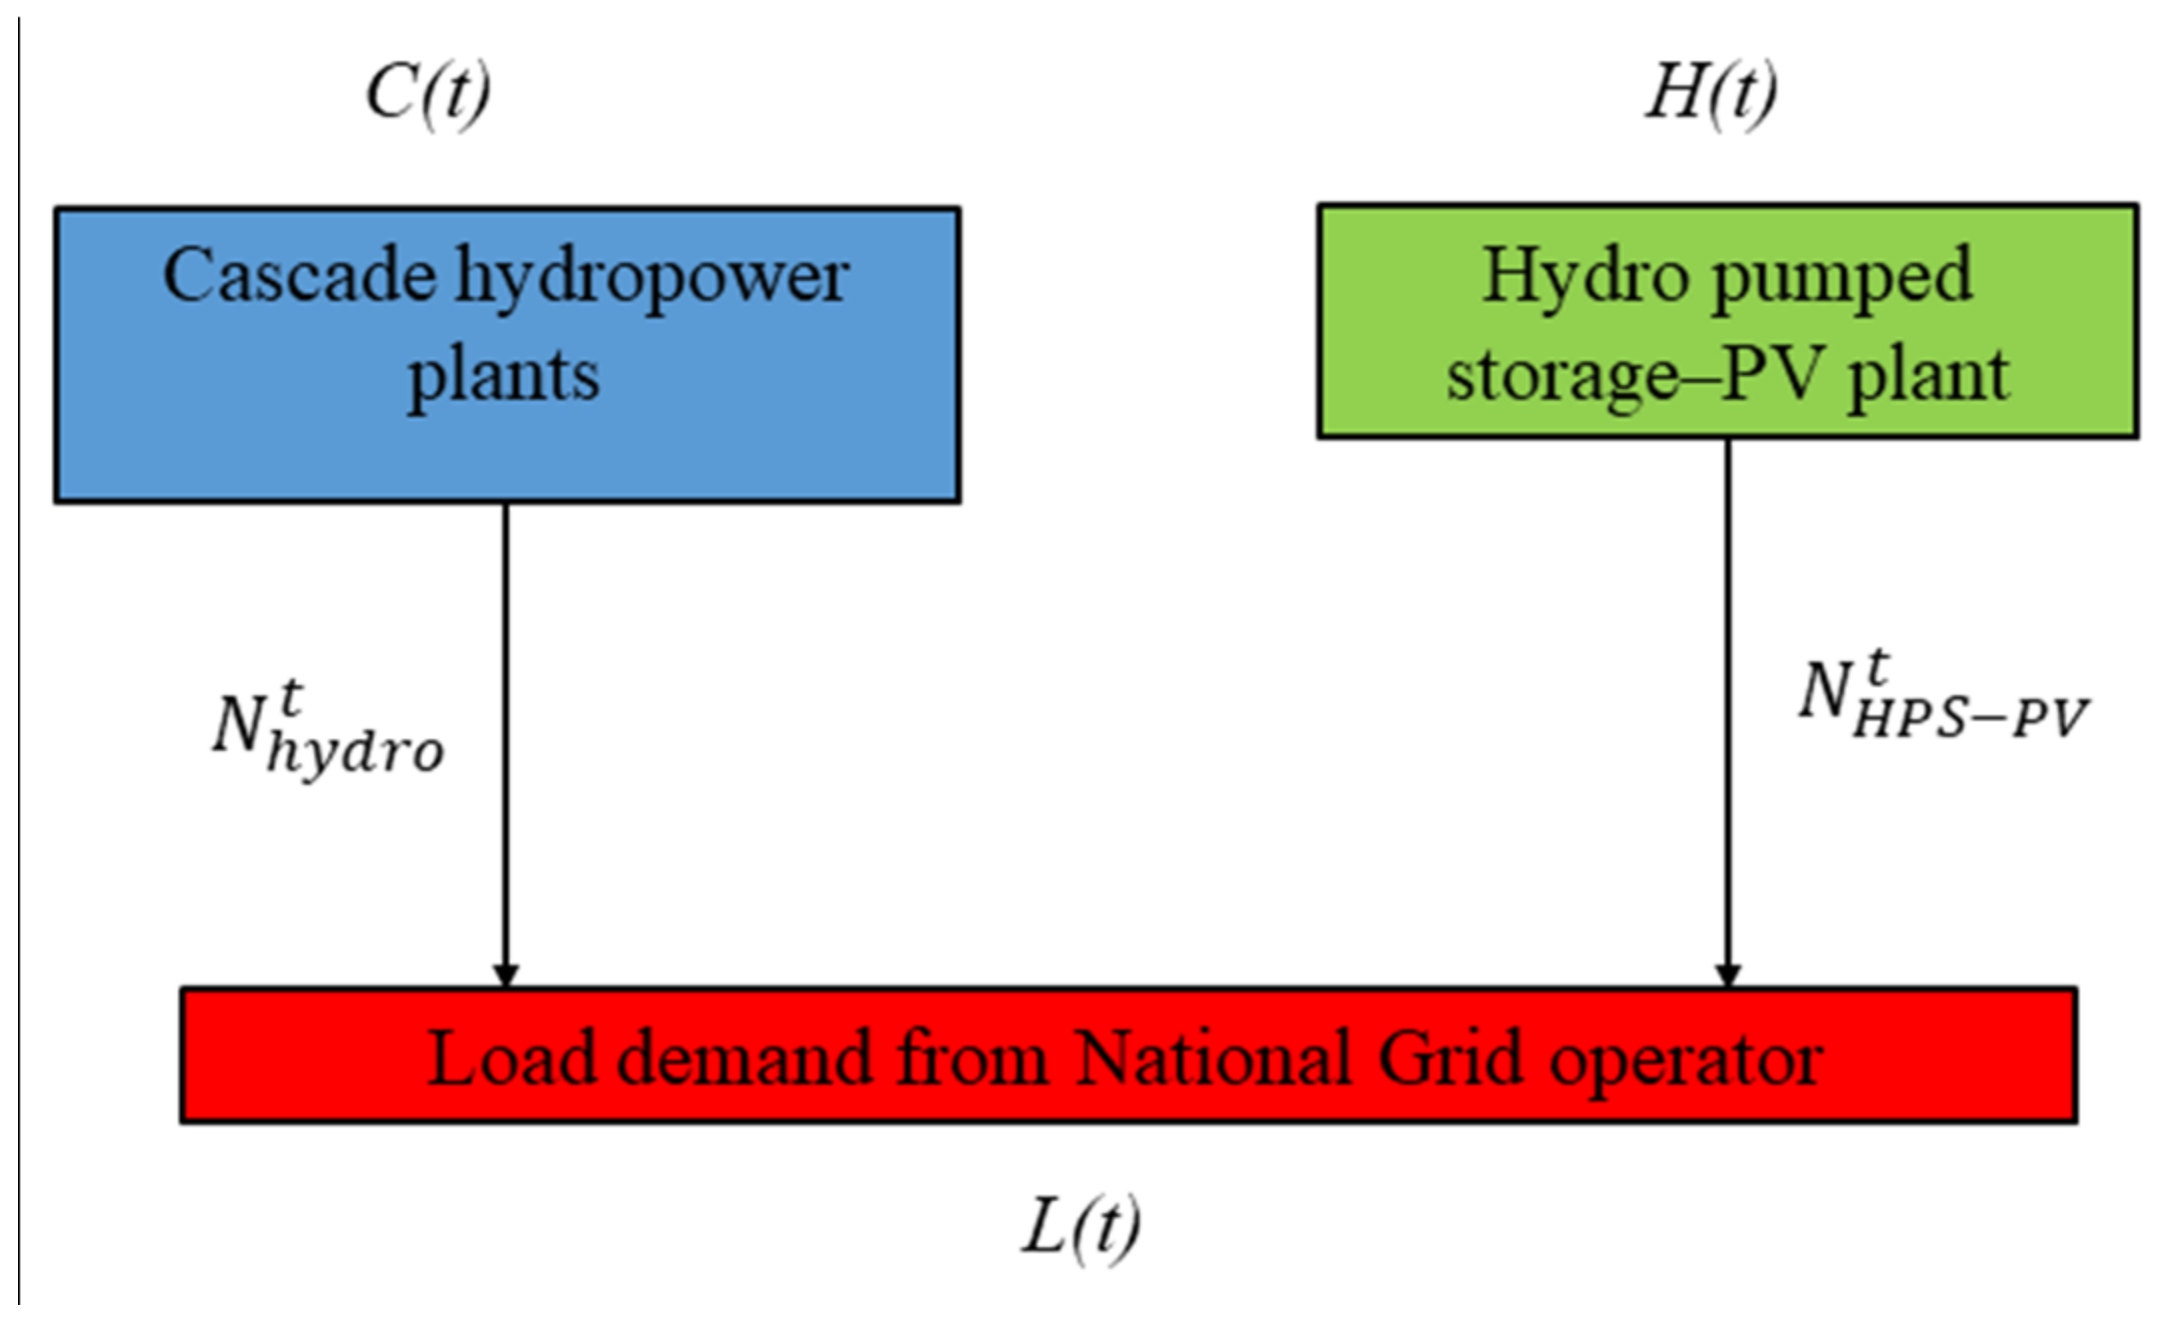
2.1.1. Objective Function
2.1.2. Constraints
- The decision variables should be positive values; the total electricity output dispatched to meet load demand from both cascade hydropower and PHS–PV plants should constantly be positively expressed in Equations (6) and (7) below:
- 2.
- The amount of power dispatched by the PHS–PV plant and cascade hydropower plants in the tth time interval(t) should constantly be no more than or equal to the maximum electricity the corresponding system can produce and is expressed in Equations (8) and (9) below:
- 3.
- The total electricity generated from both cascade hydropower and PHS–PV plants in the tth time interval (t) should constantly be no more than or equal to the load demand L(t) as expressed in Equation (10) below:
- 4.
- Constraints such as upper and lower reservoir storage, upper and lower reservoir water level, release flow, and non-negative constraints are expressed in Equations (11)–(16) below:
- Upper reservoir water storage and water level constraints:
- Lower reservoir storage and water level constraints:
- Reservoir flow release constraints:
- Non-negative constraints:
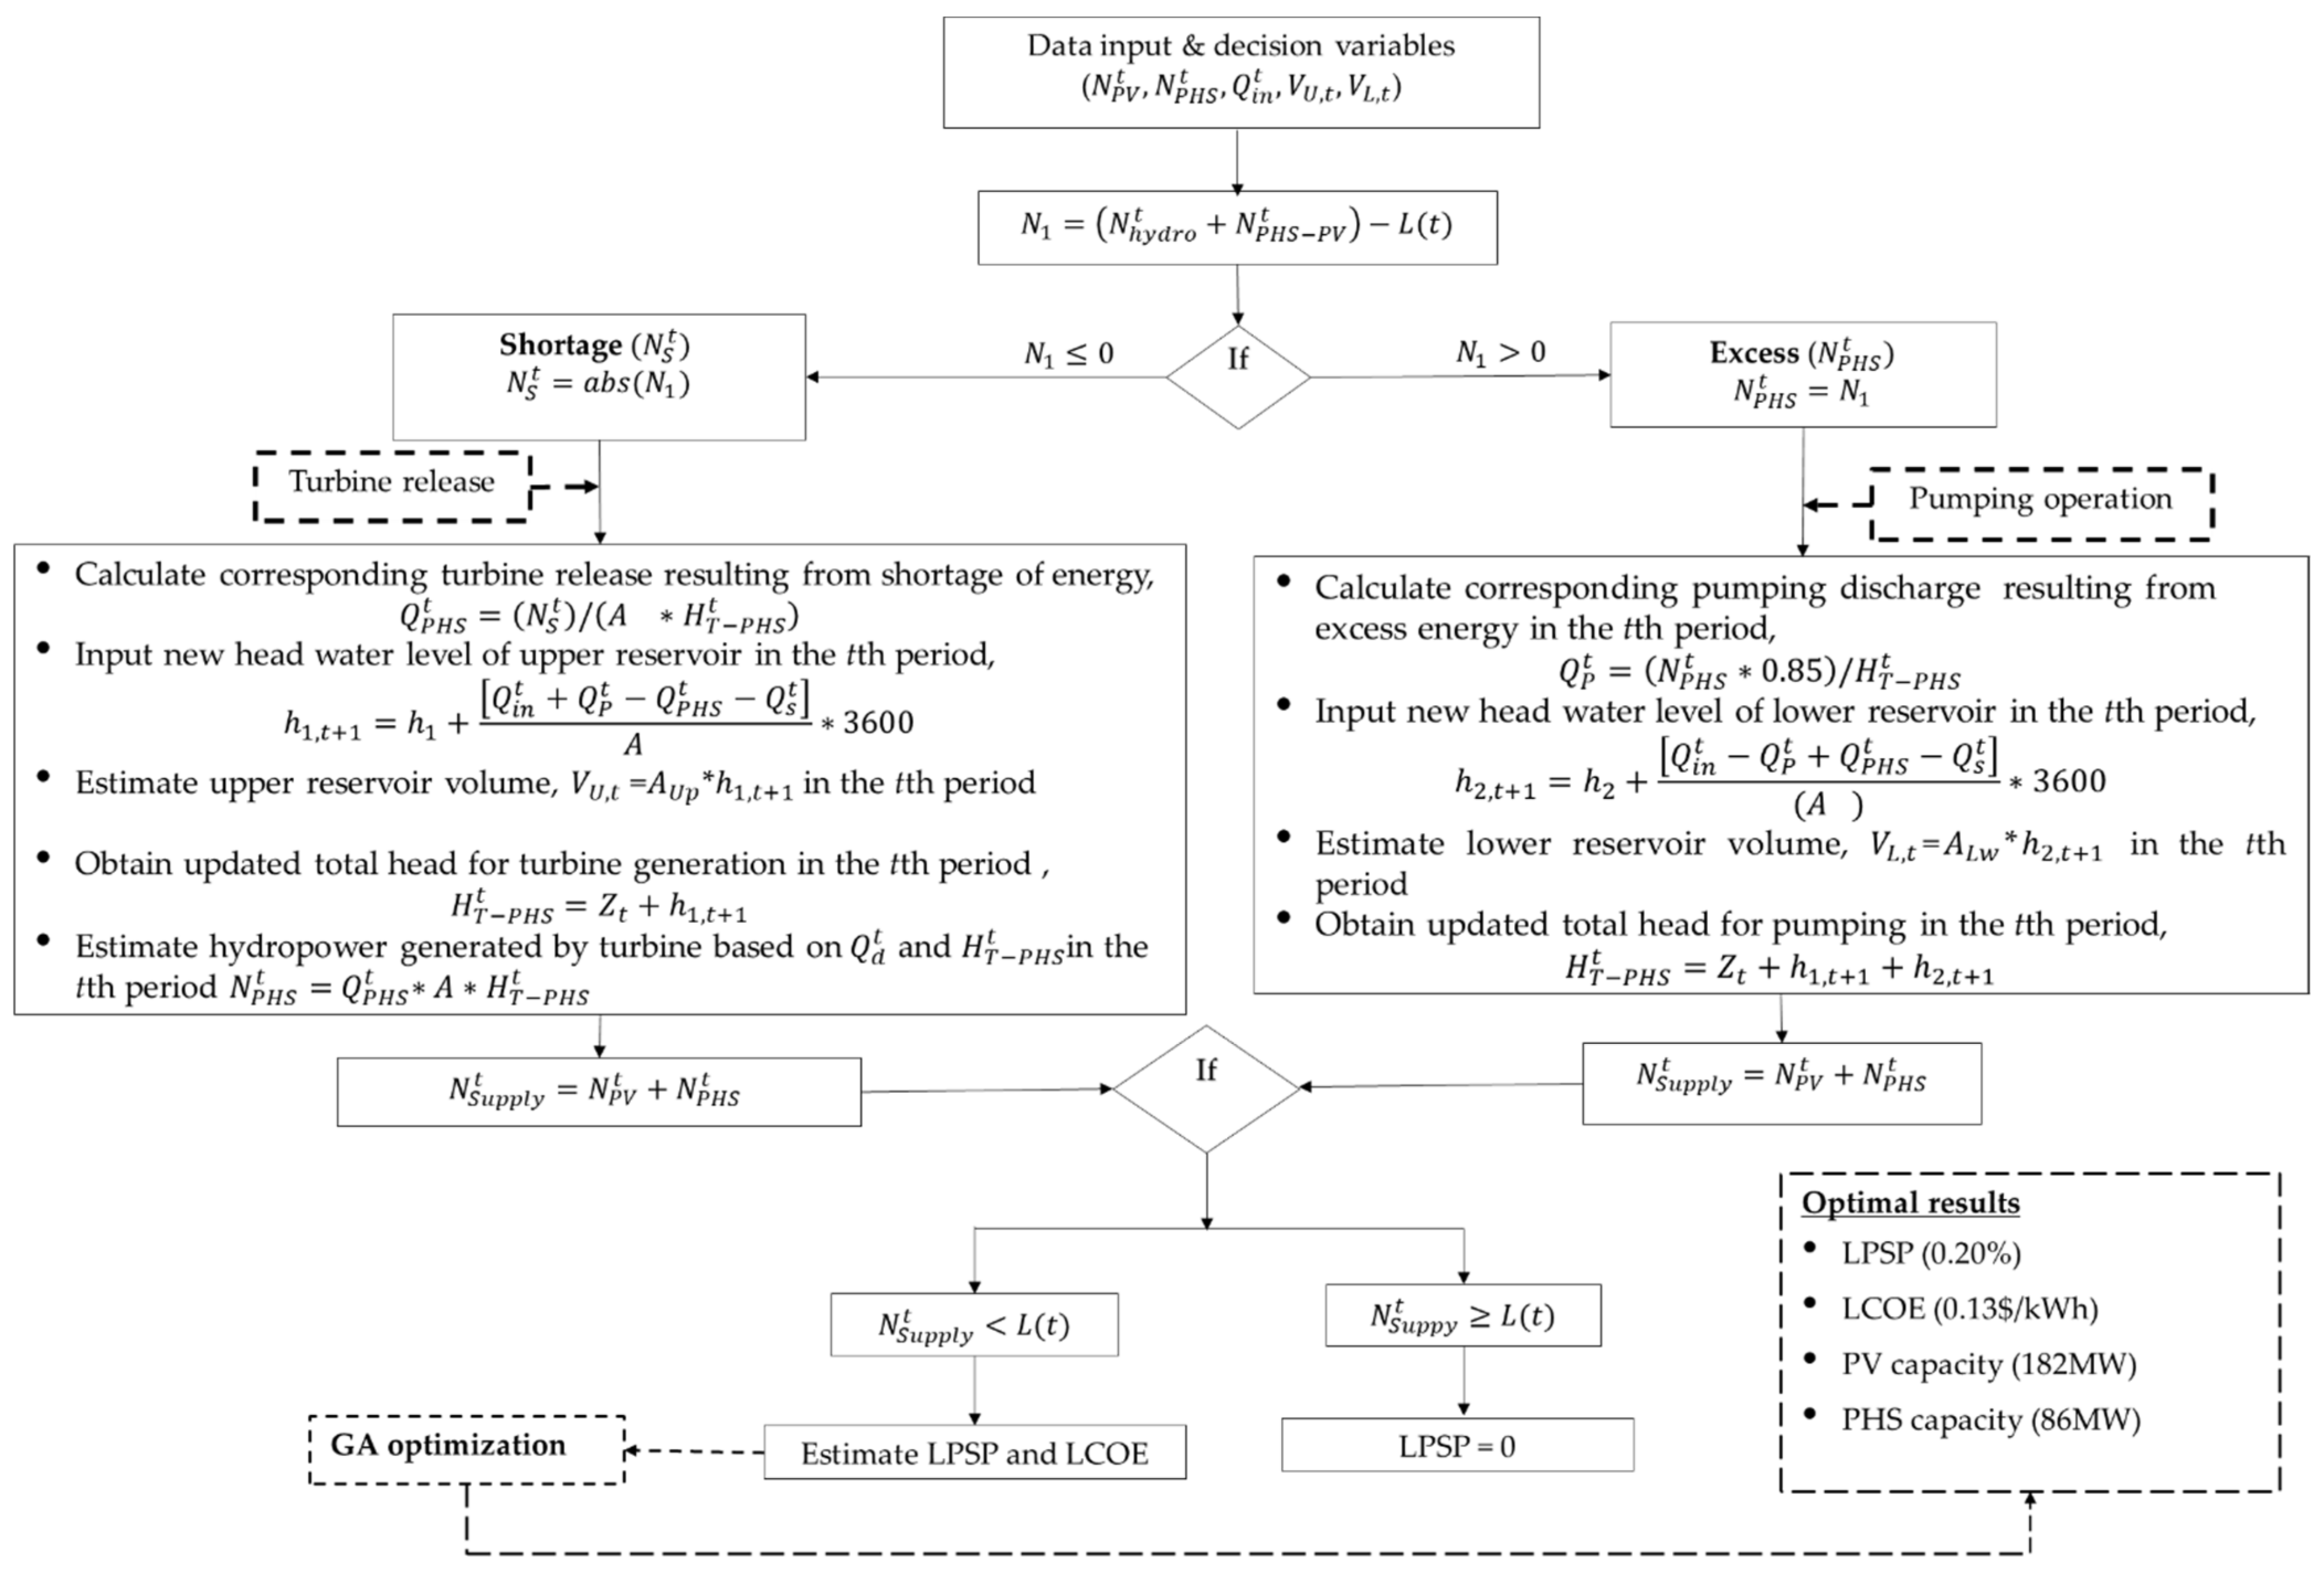
2.1.3. The Proposed Energy Supply Mode
2.1.4. The Quasi-Steady Operating Strategy for the PHS–PV Mode
- At any time interval, power output was calculated as expressed in Equation (17) below:
- 2.
- At any time interval, if power output was more than load demand, any excess power was dispatched to the pump for reservoir charging as expressed in Equation (18) below:
- 3.
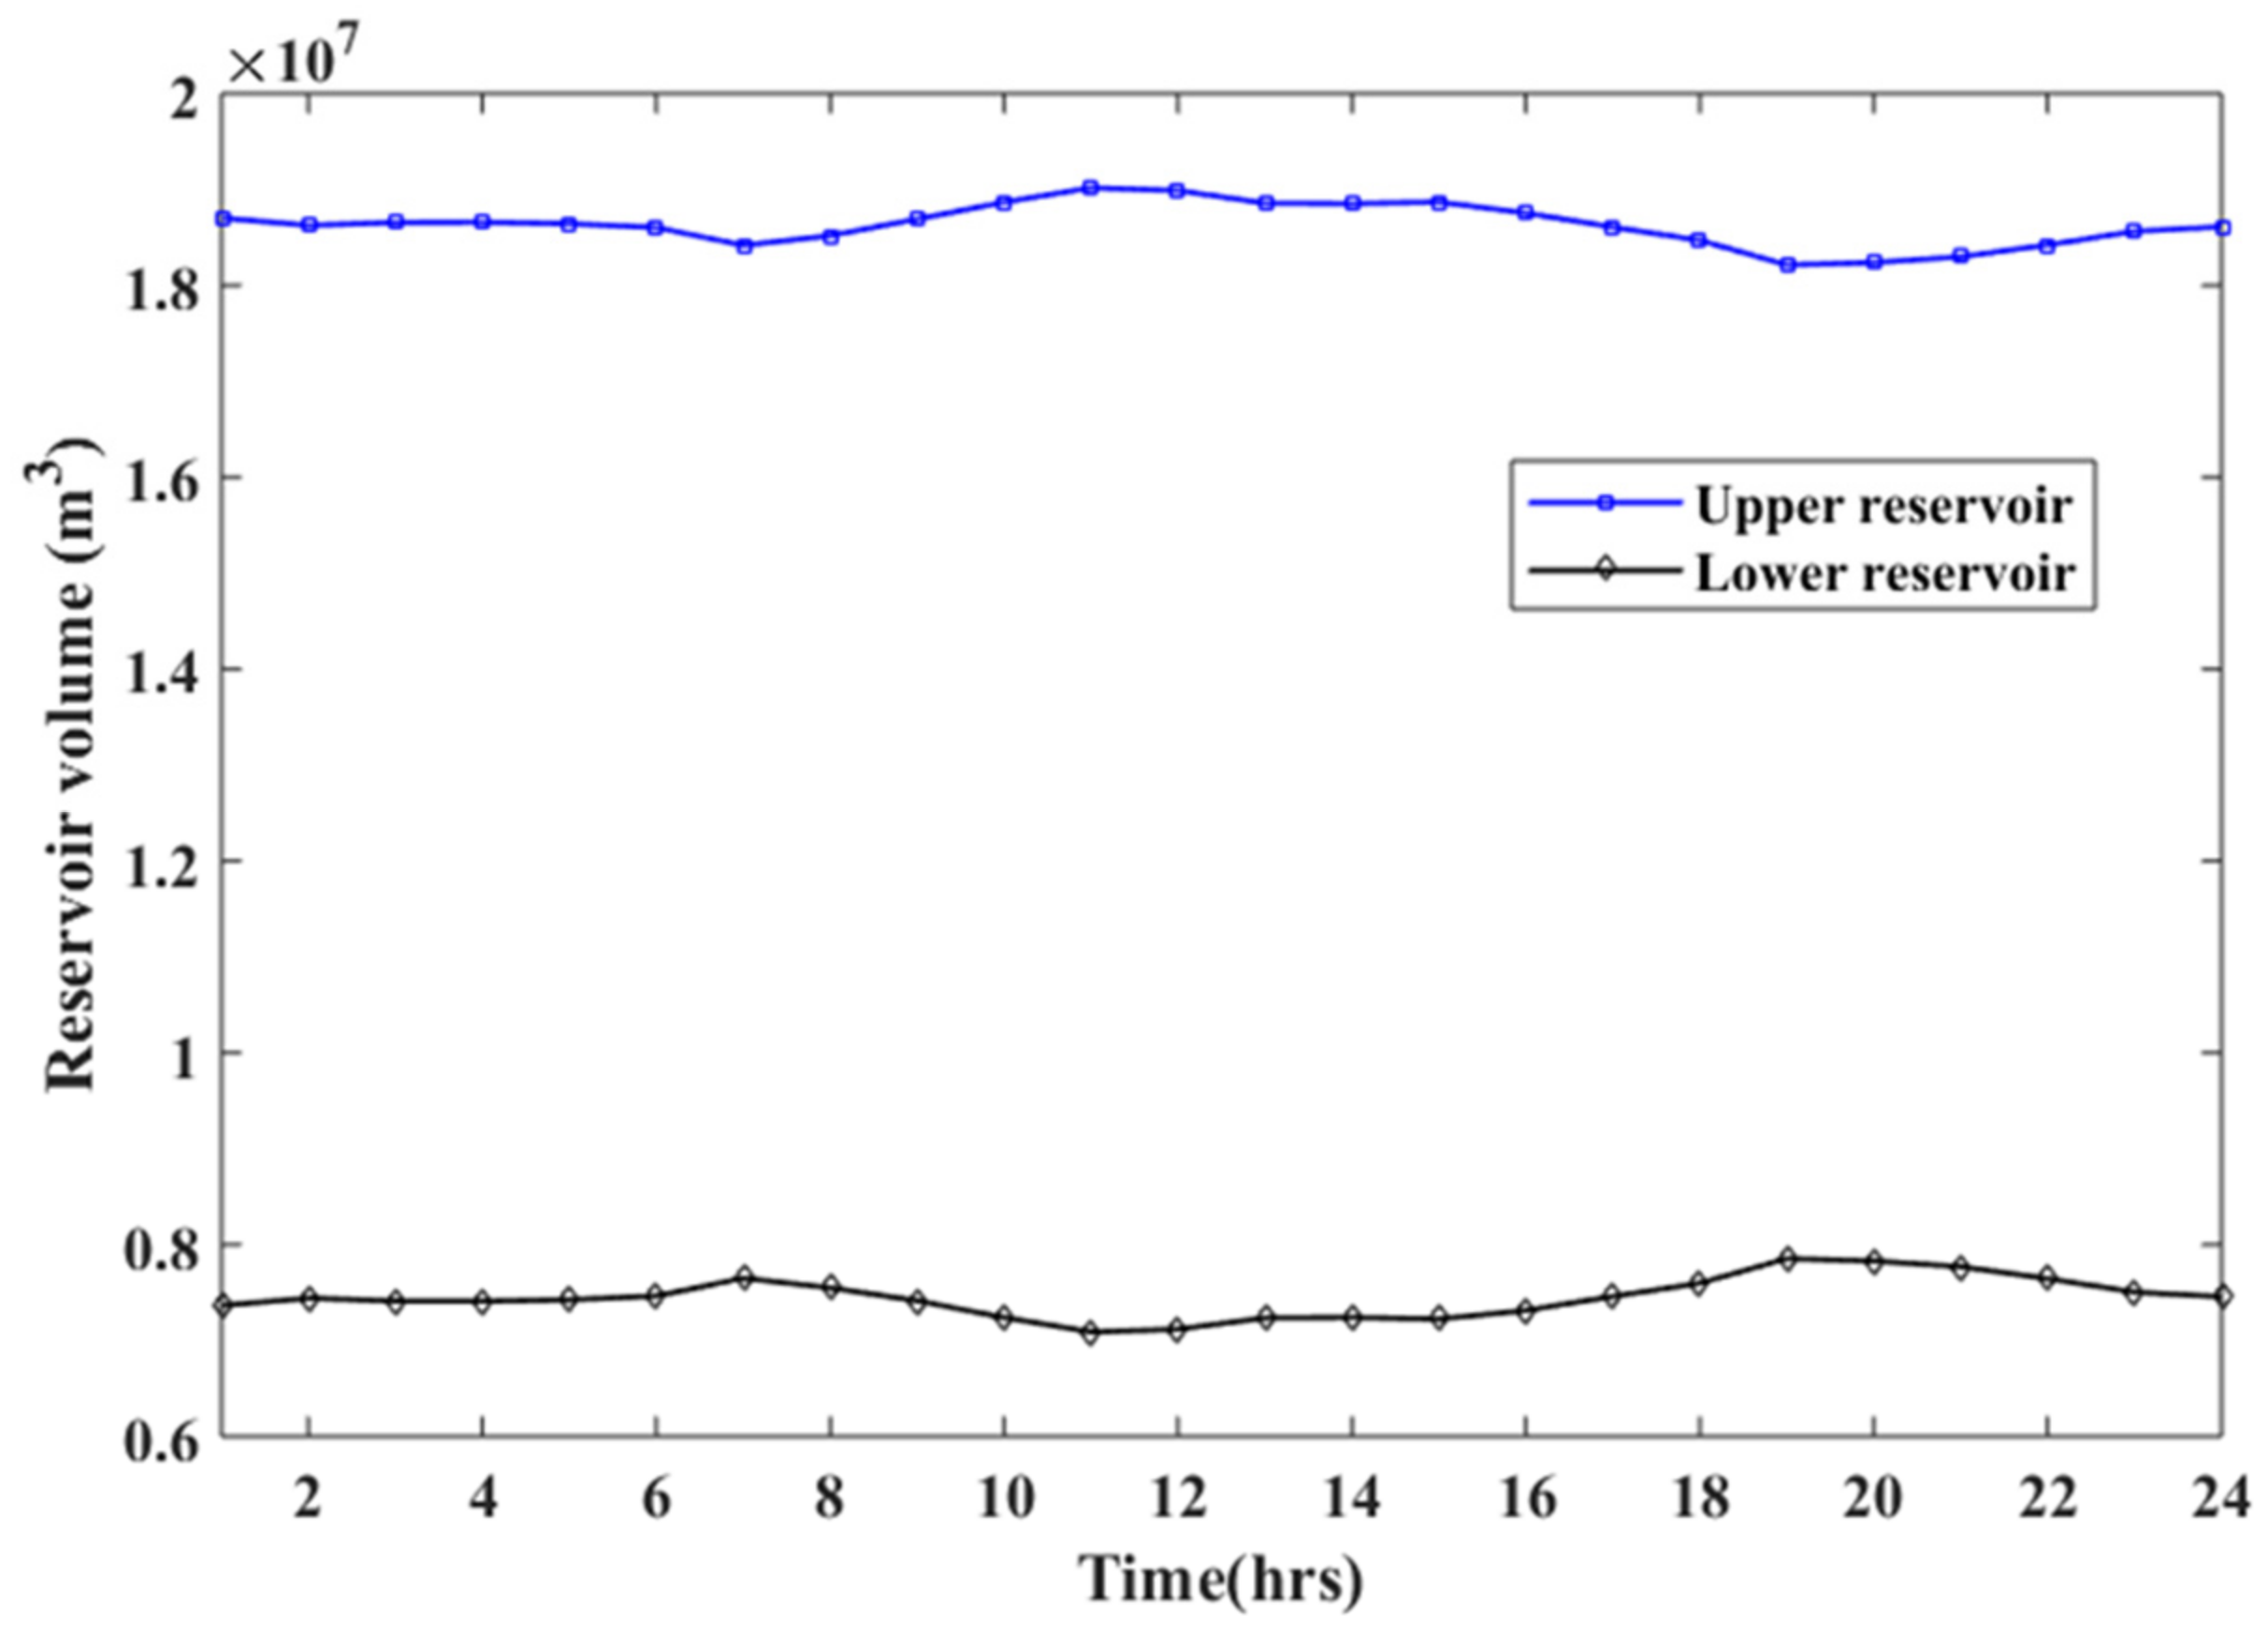
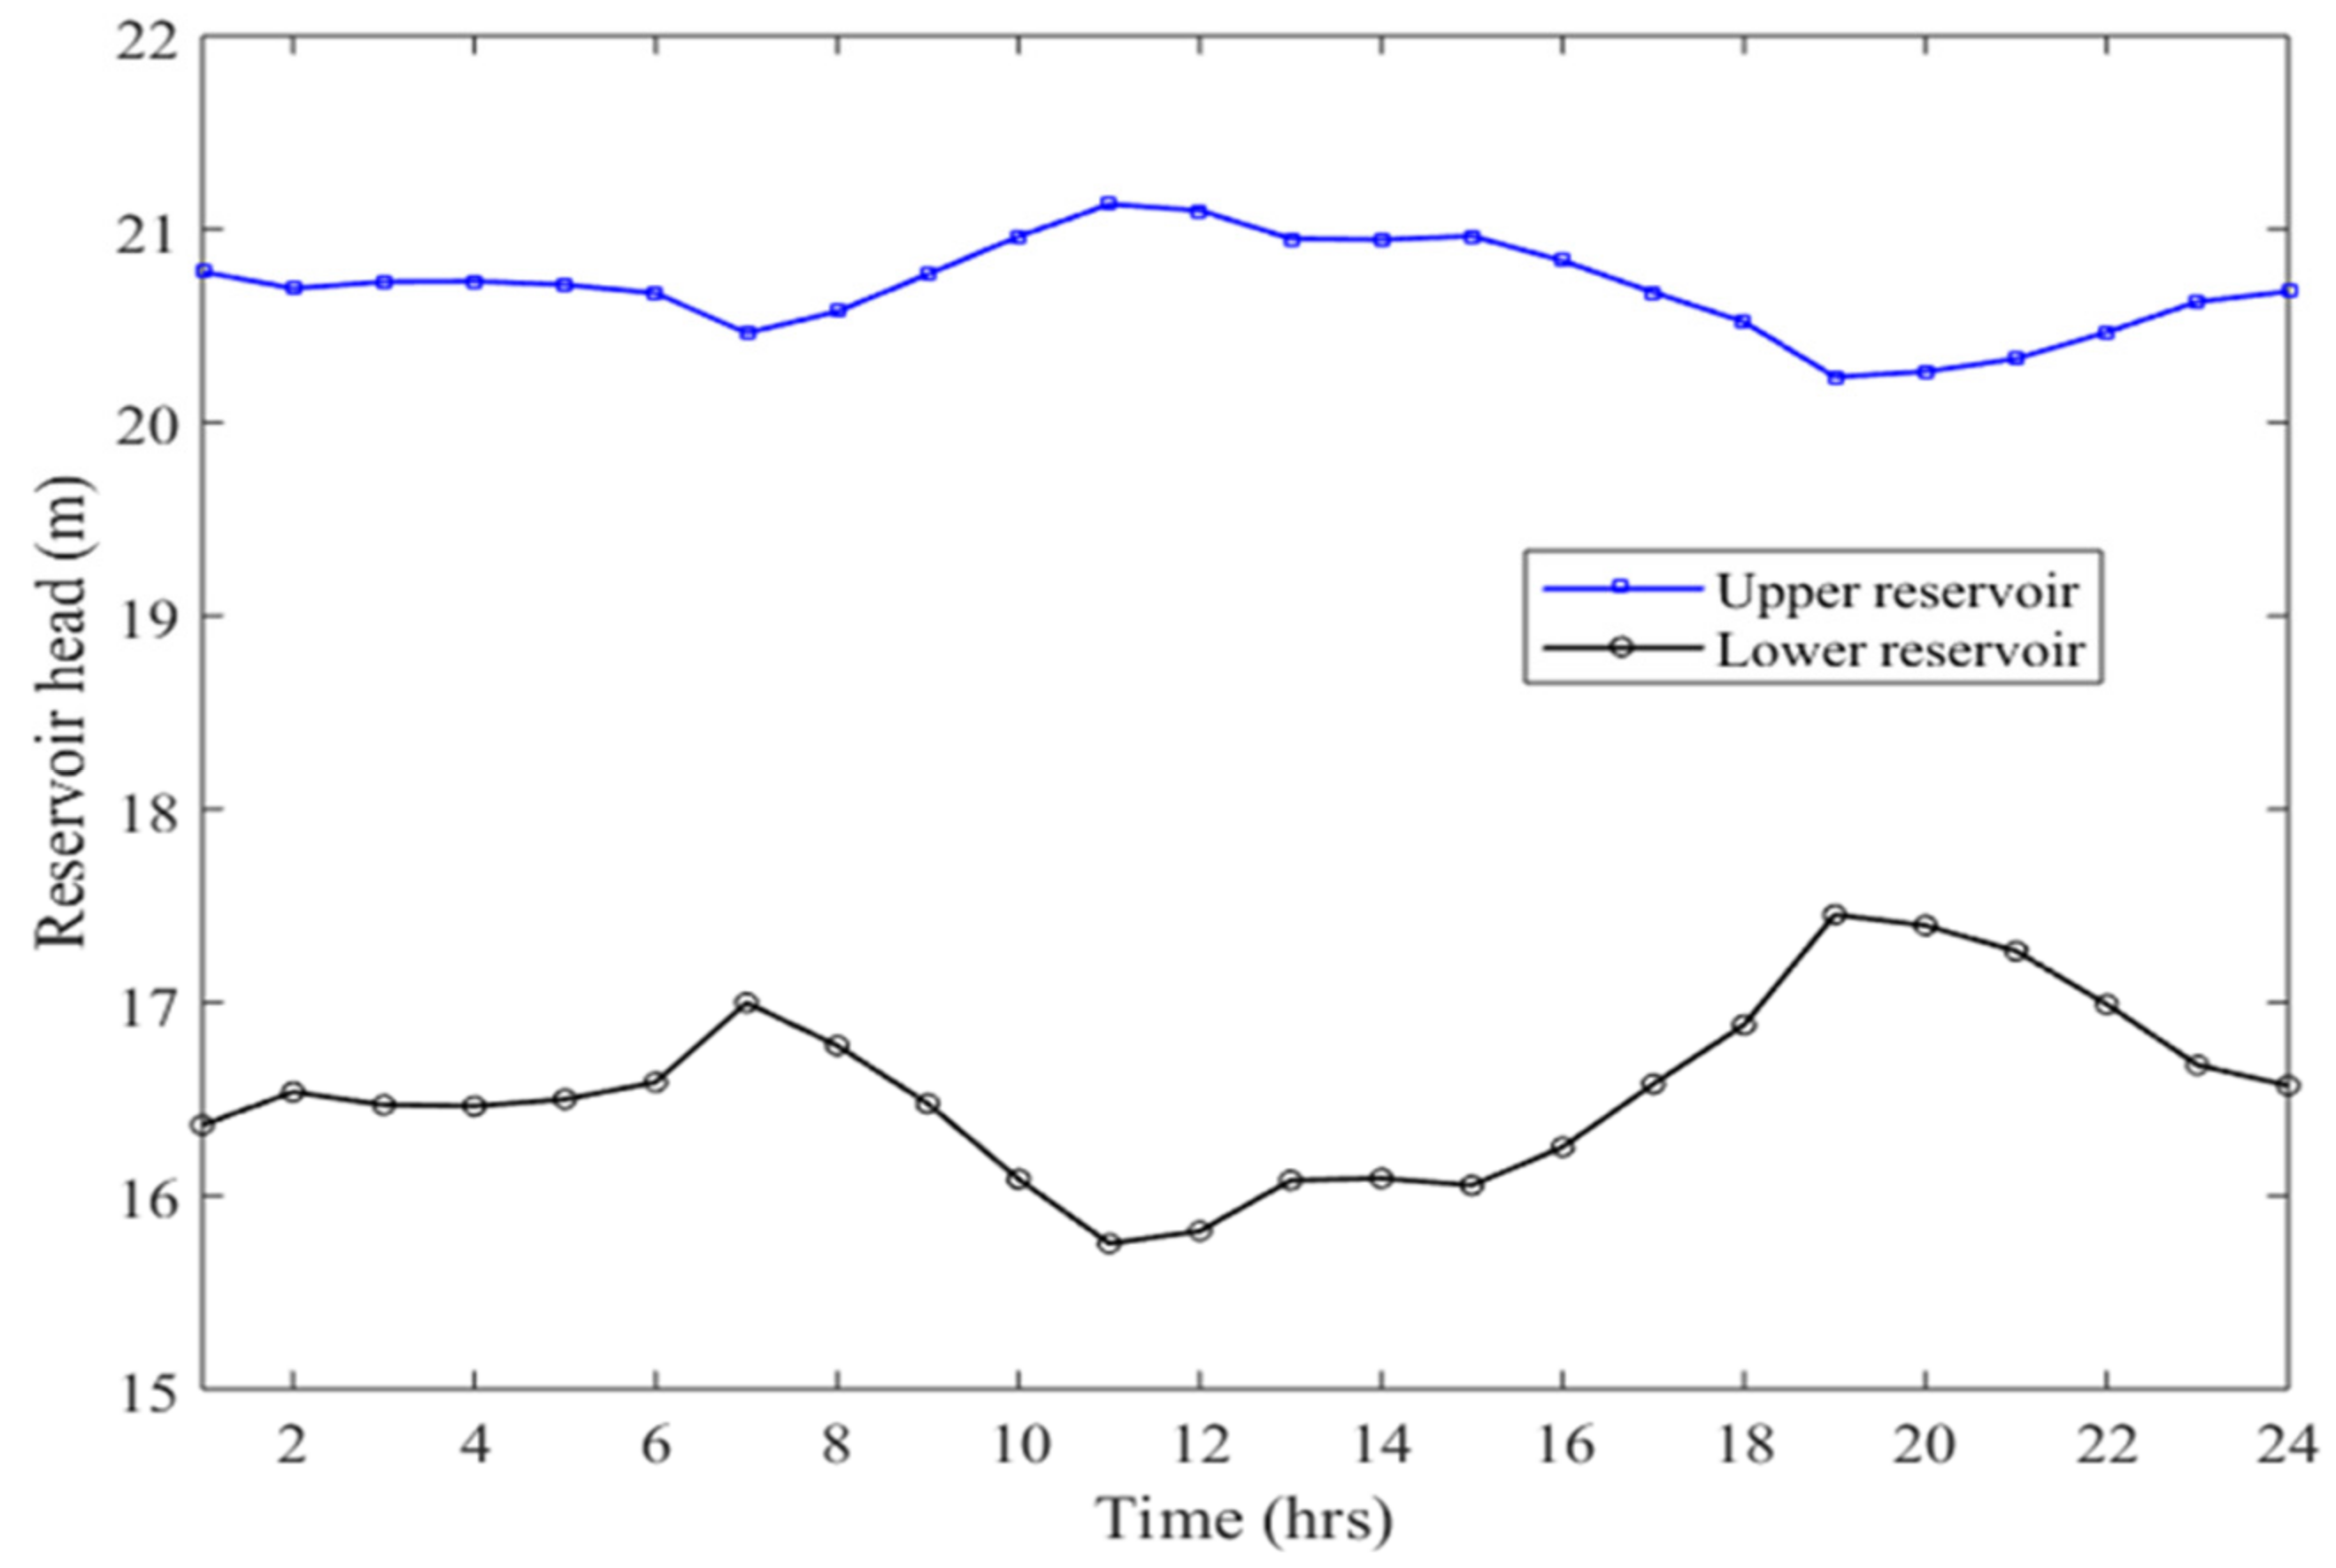
- During this period, pumping of water from lower reservoir to upper reservoir for night storage was in operation in the PHS–PV system. Additionally, the corresponding pump discharge, head water level, volume in lower reservoir, and updated head water level were calculated in the tth period, respectively, as expressed in Equations (19)–(22) below:
- 4.
- At any time interval, if power output was less than load demand, then load demand was not fully met with the system experiencing a shortage of power supply as expressed in Equation (23) below:
- 5.
- During this period, the turbine operation of the PHS–PV system was dispatched as a complementary source of power supply to the system for load satisfaction. The corresponding turbine release resulting from energy shortage, head water level, volume in lower reservoir, and updated head water level were calculated in the tth period, respectively, and expressed in Equations (24)–(28) below:
- 6.
- At any time interval, if a shortage in power output was not fully satisfied by the system power output (defined as the sum of cascade hydropower output, PV power output, and turbine operation for PHS–PV). Then, the loss of power supply probability (LPSP) and LCOE was estimated expressed in Equations (29)–(31) below:
- 7.
- A bi-objective problem was established and applied in Genetic Algorithm (GA) for optimization in MATLAB.
- 8.
- The volume and water levels inside the upper and lower reservoirs were constantly restored based on calculated pumping storage. The constraints and terms used in Section 2.1.2 were also applied.
2.2. Multi-Objective Optimization Model for Economic and Technical Evaluation of the System
- Objective Optimization Functions
- Objective function F1: minimizing the levelized cost of energy (LCOE: defined as a method to calculate energy costs based on operational expenditure (OPEX) and capital expenditure (CAPEX) [37]);
- Objective function F2: minimizing the loss of power supply probability (LPSP: defined as the percentage of time intervals during which the demand is not fully satisfied [2]).
- 2.
- Decision variables
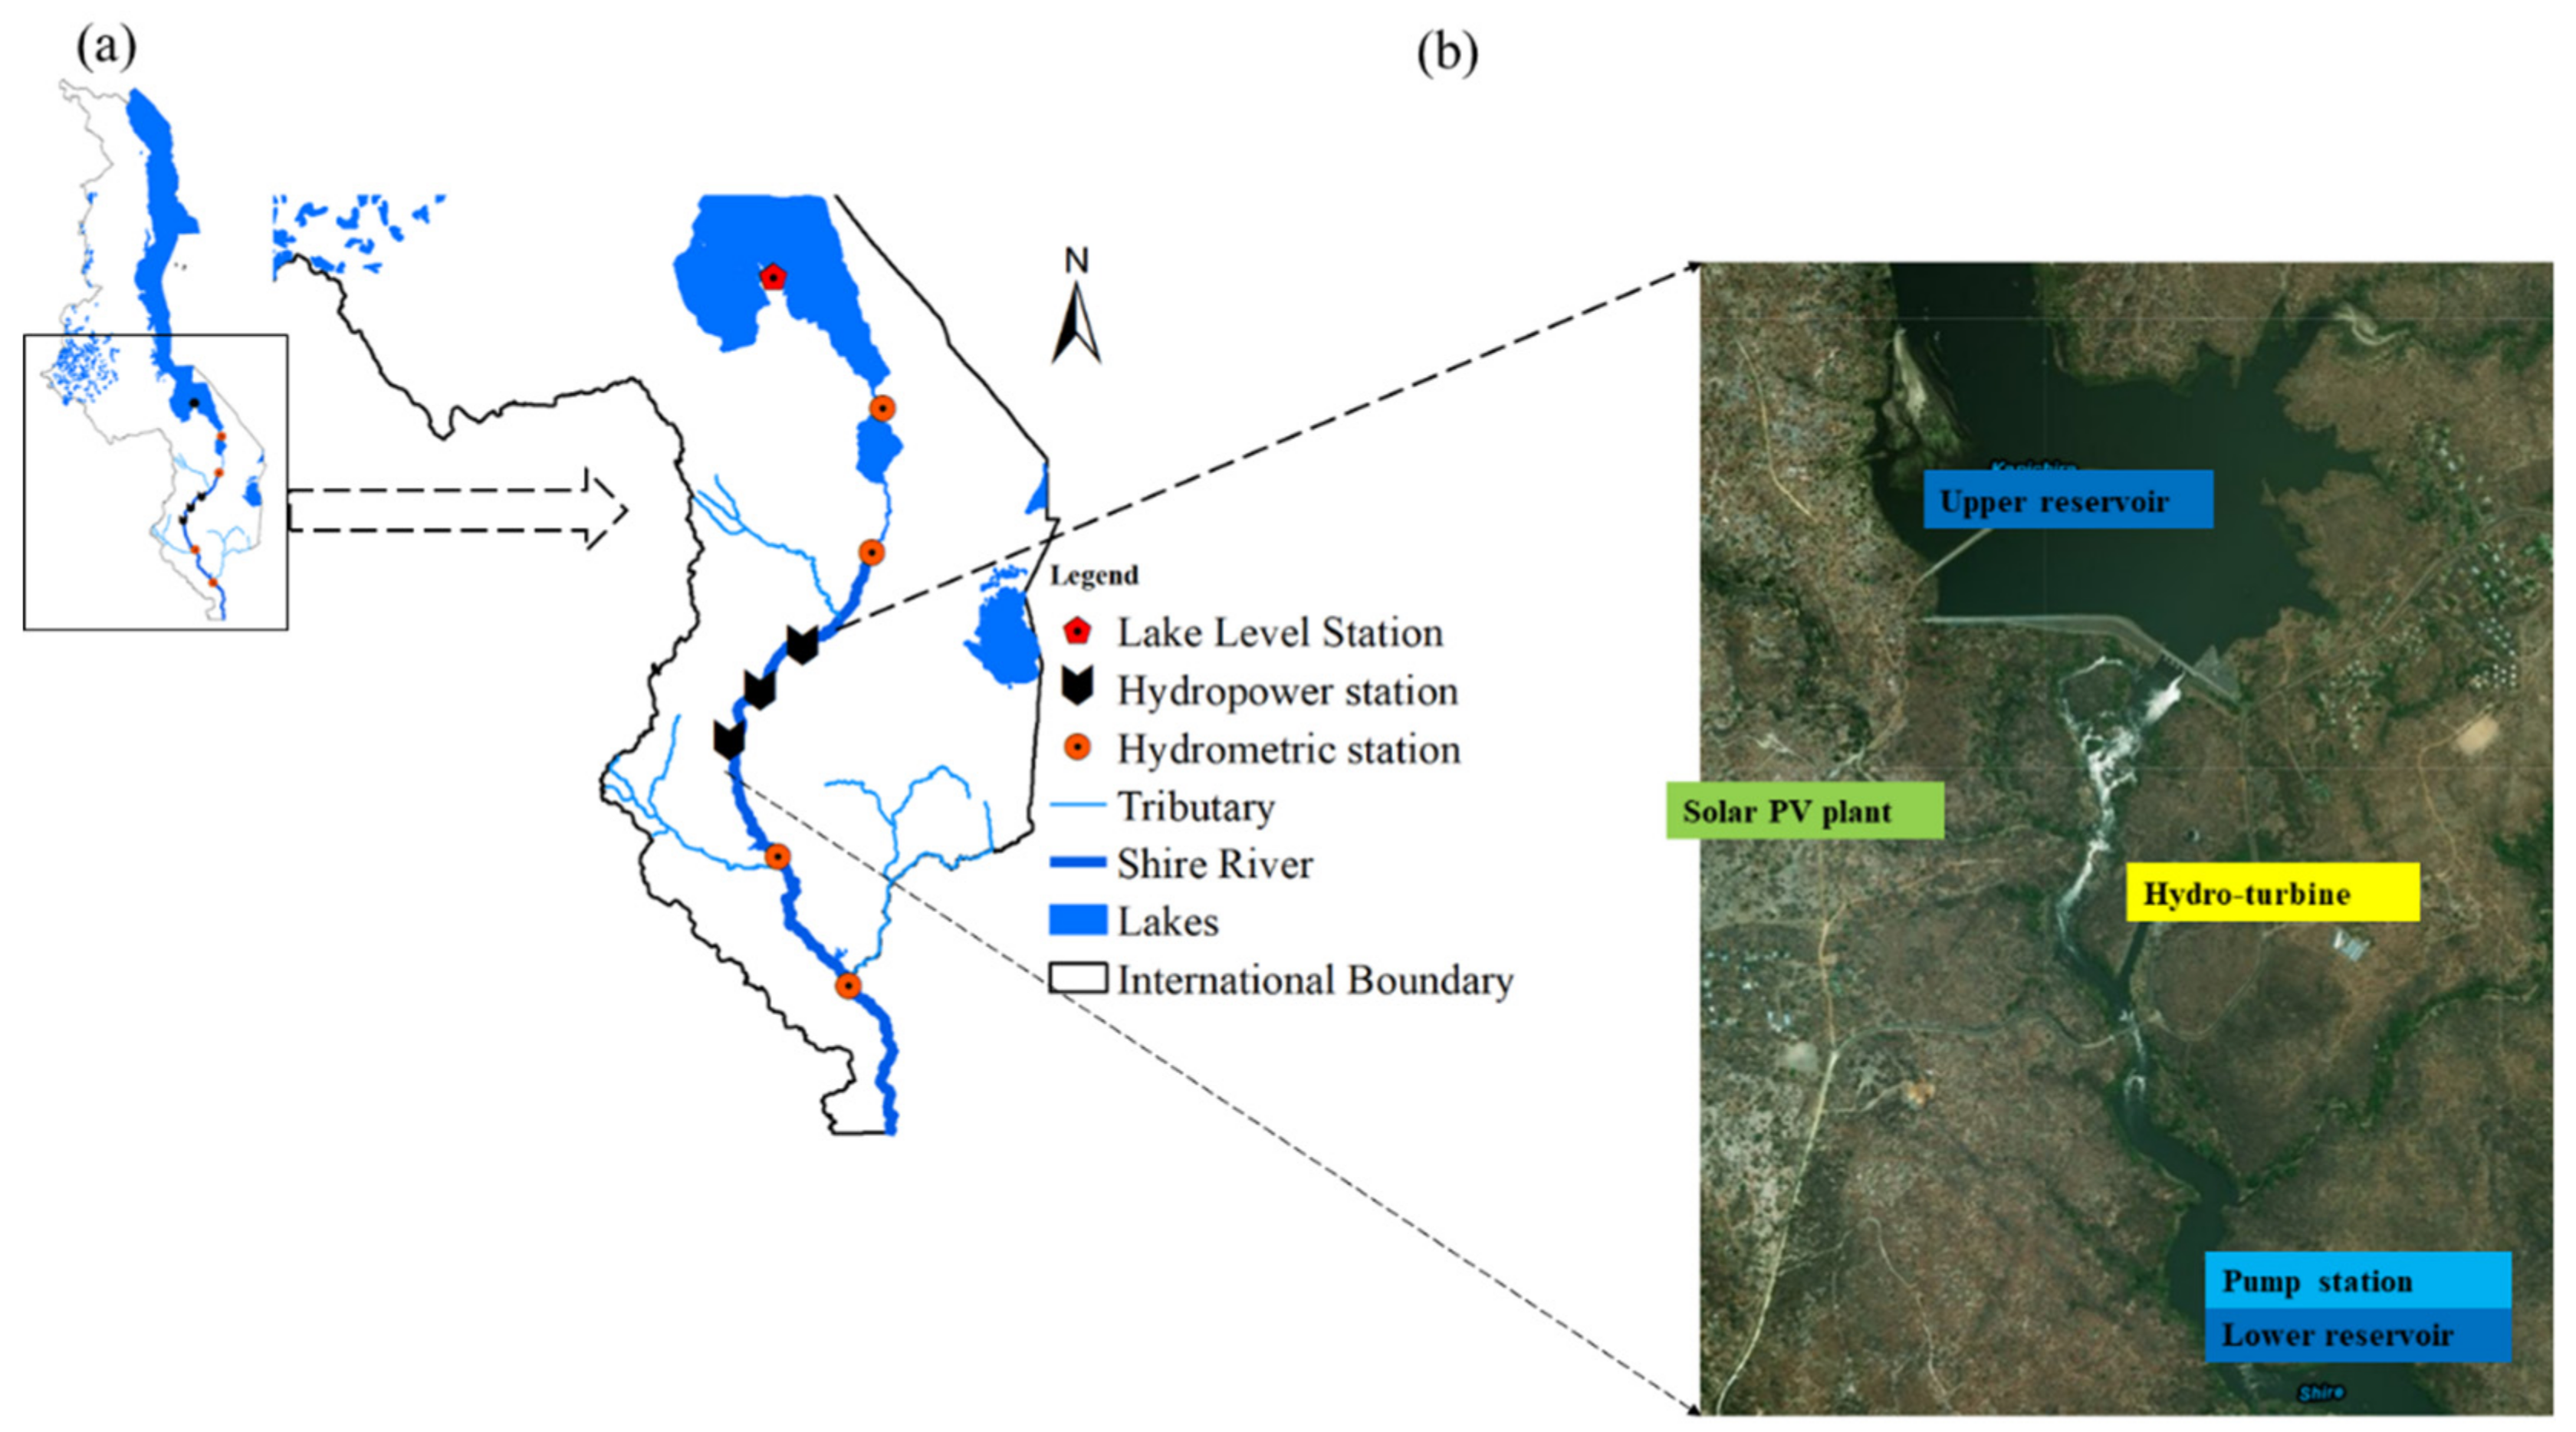
2.3. Case Study
2.4. Simulation Data
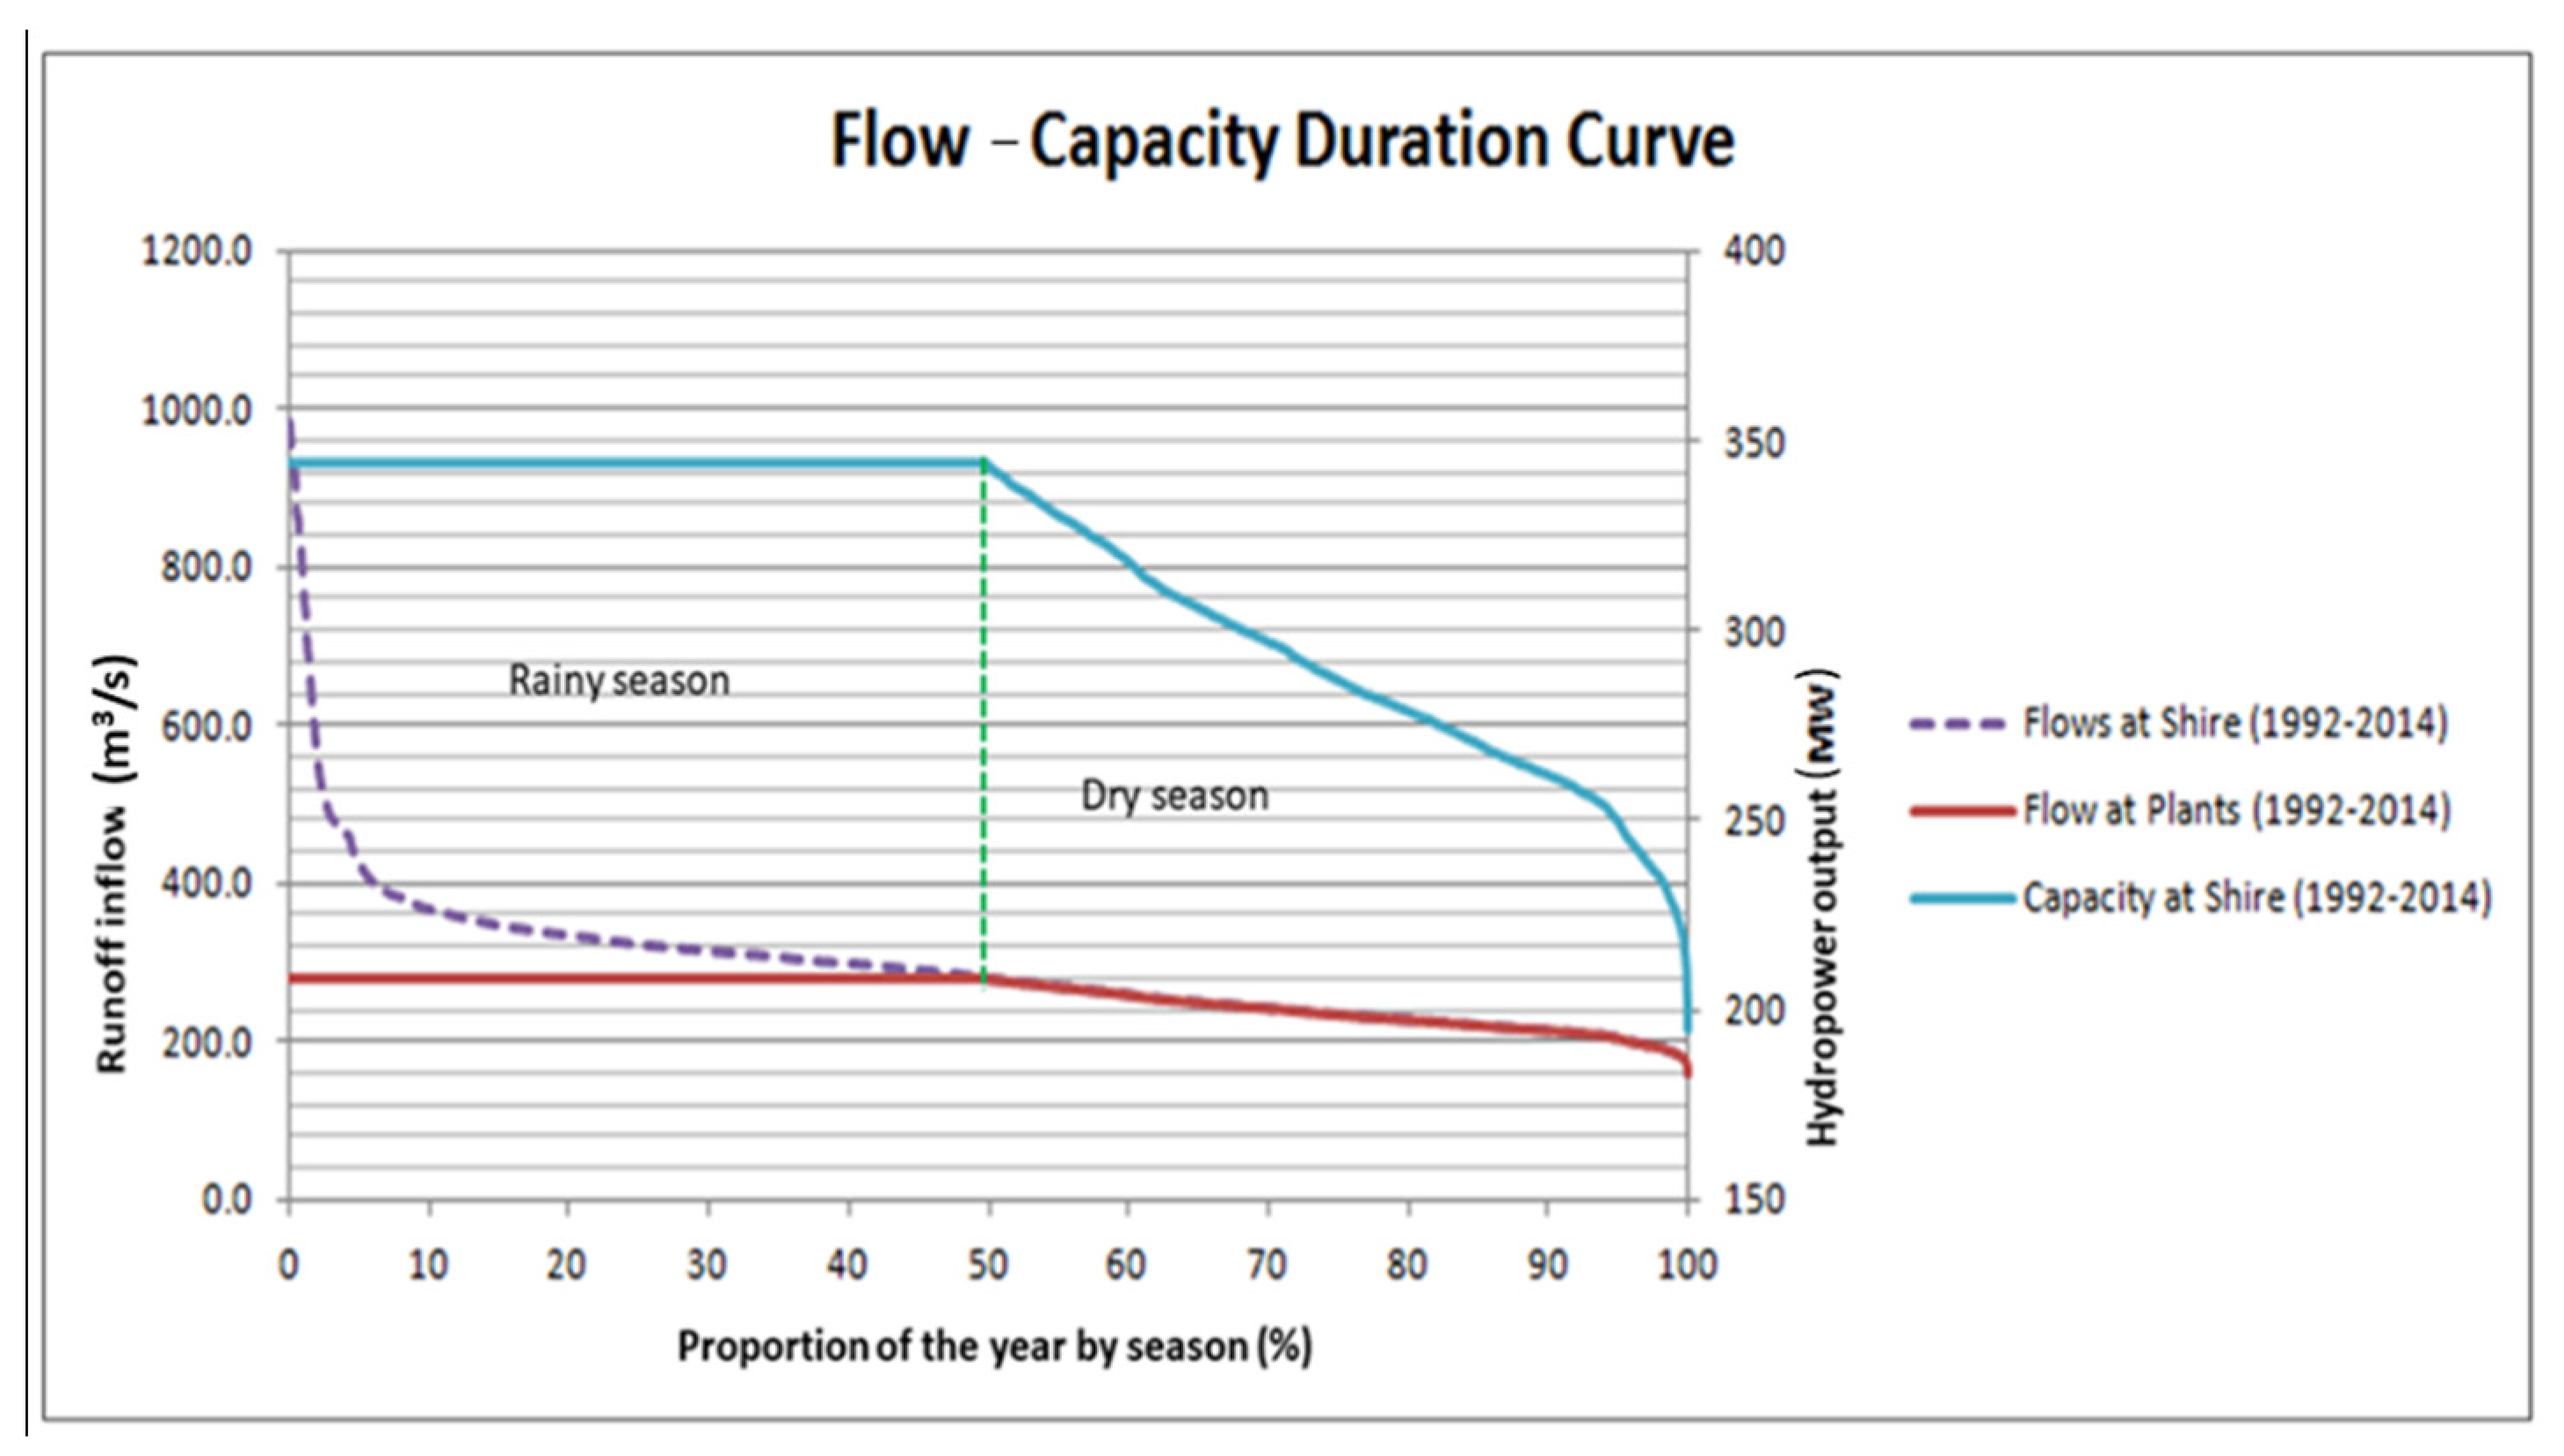
- Hydropower and runoff data
- 2.
- Photovoltaic power output data
- 3.
- Load data
- 4.
- System component-associated costs
3. Results
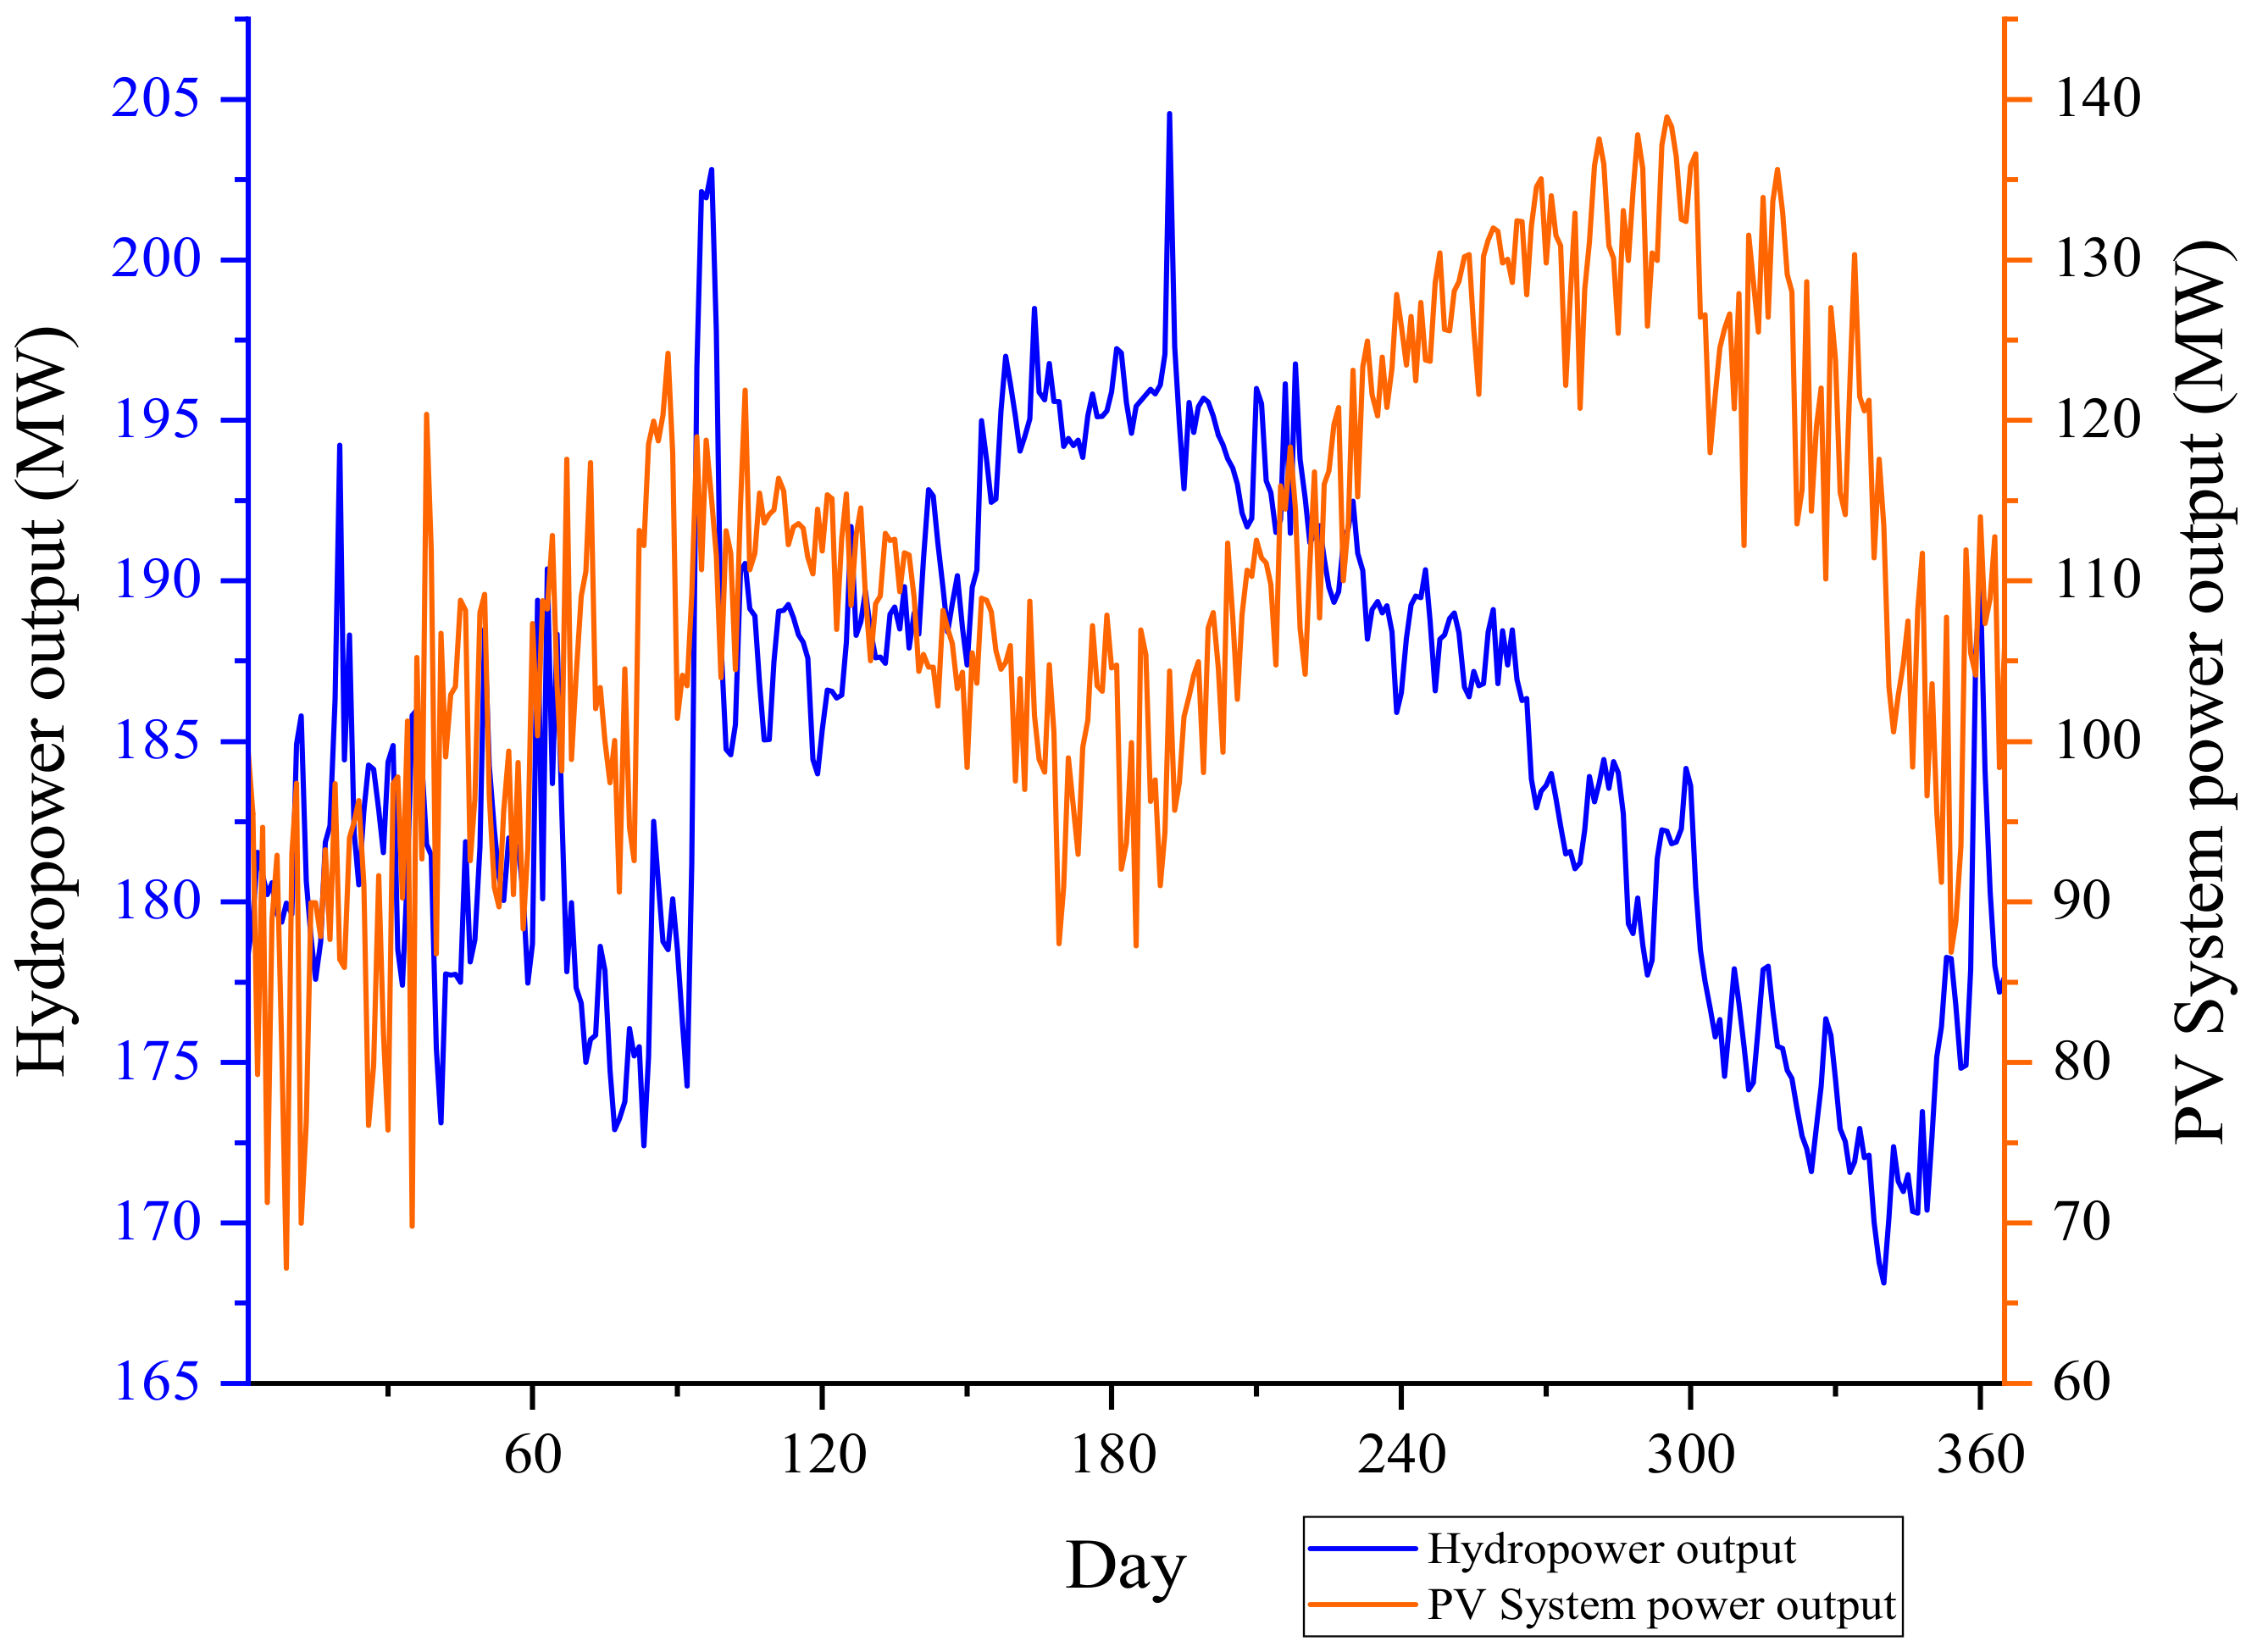
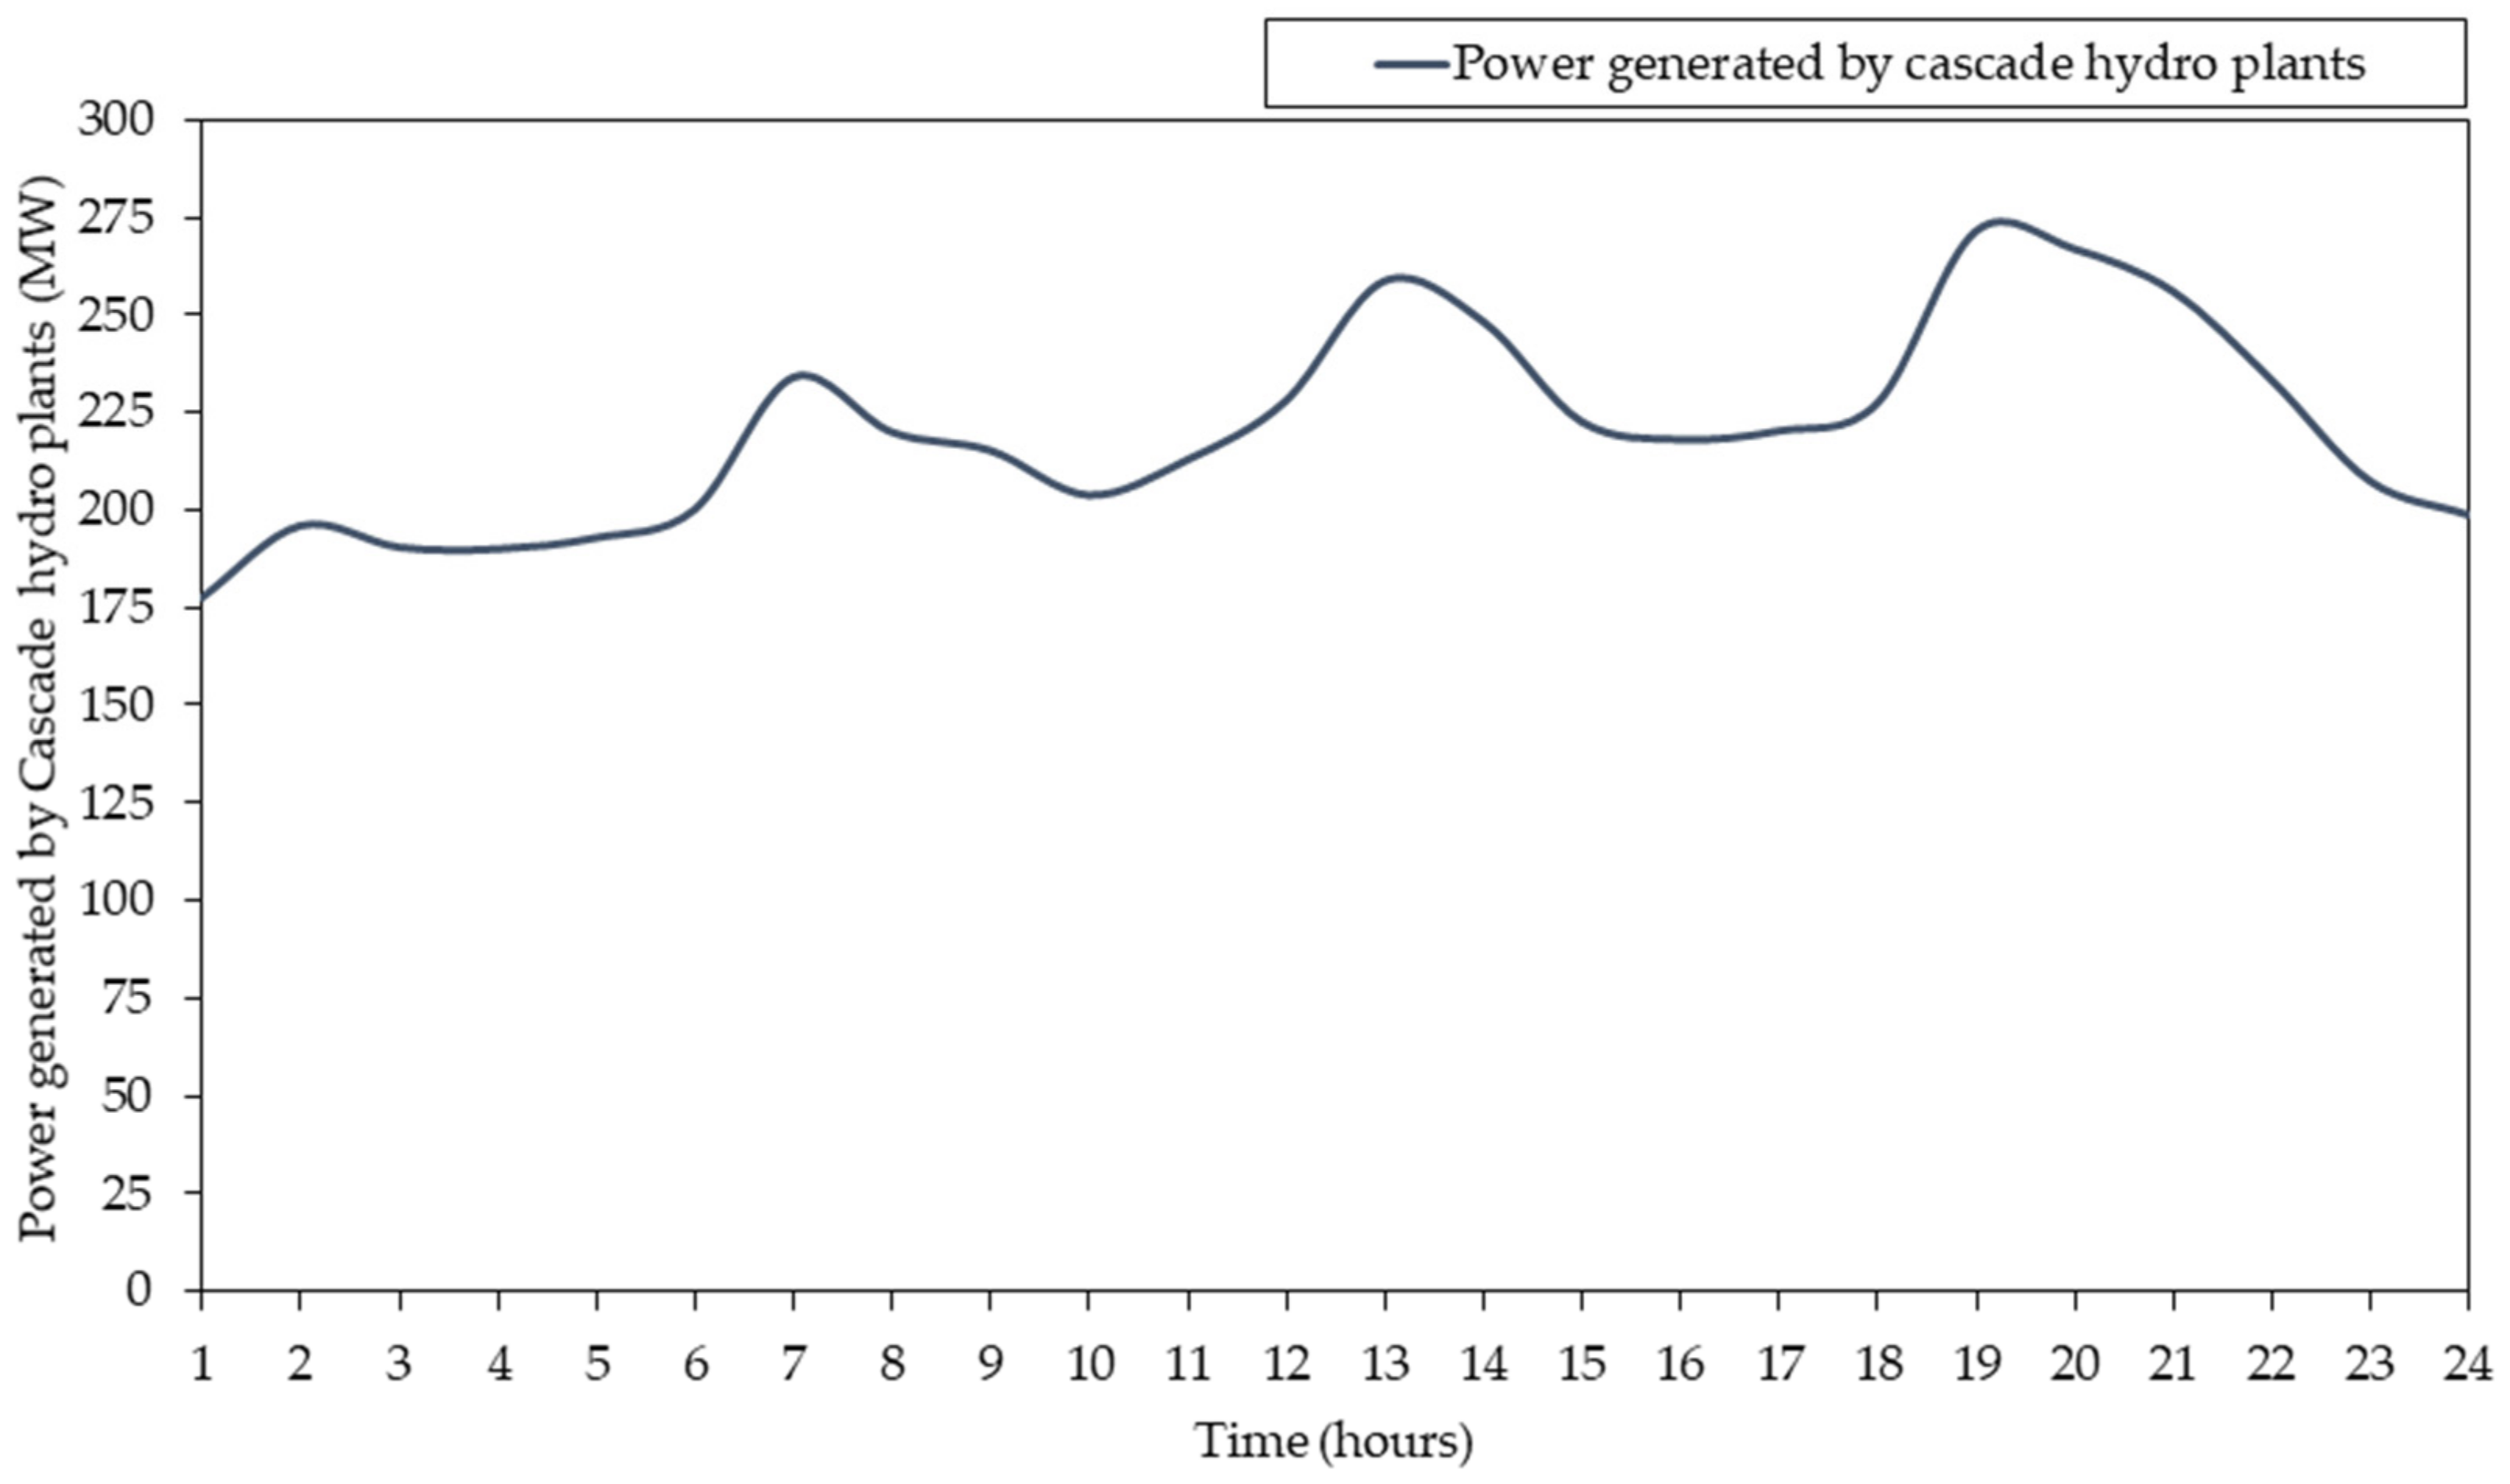
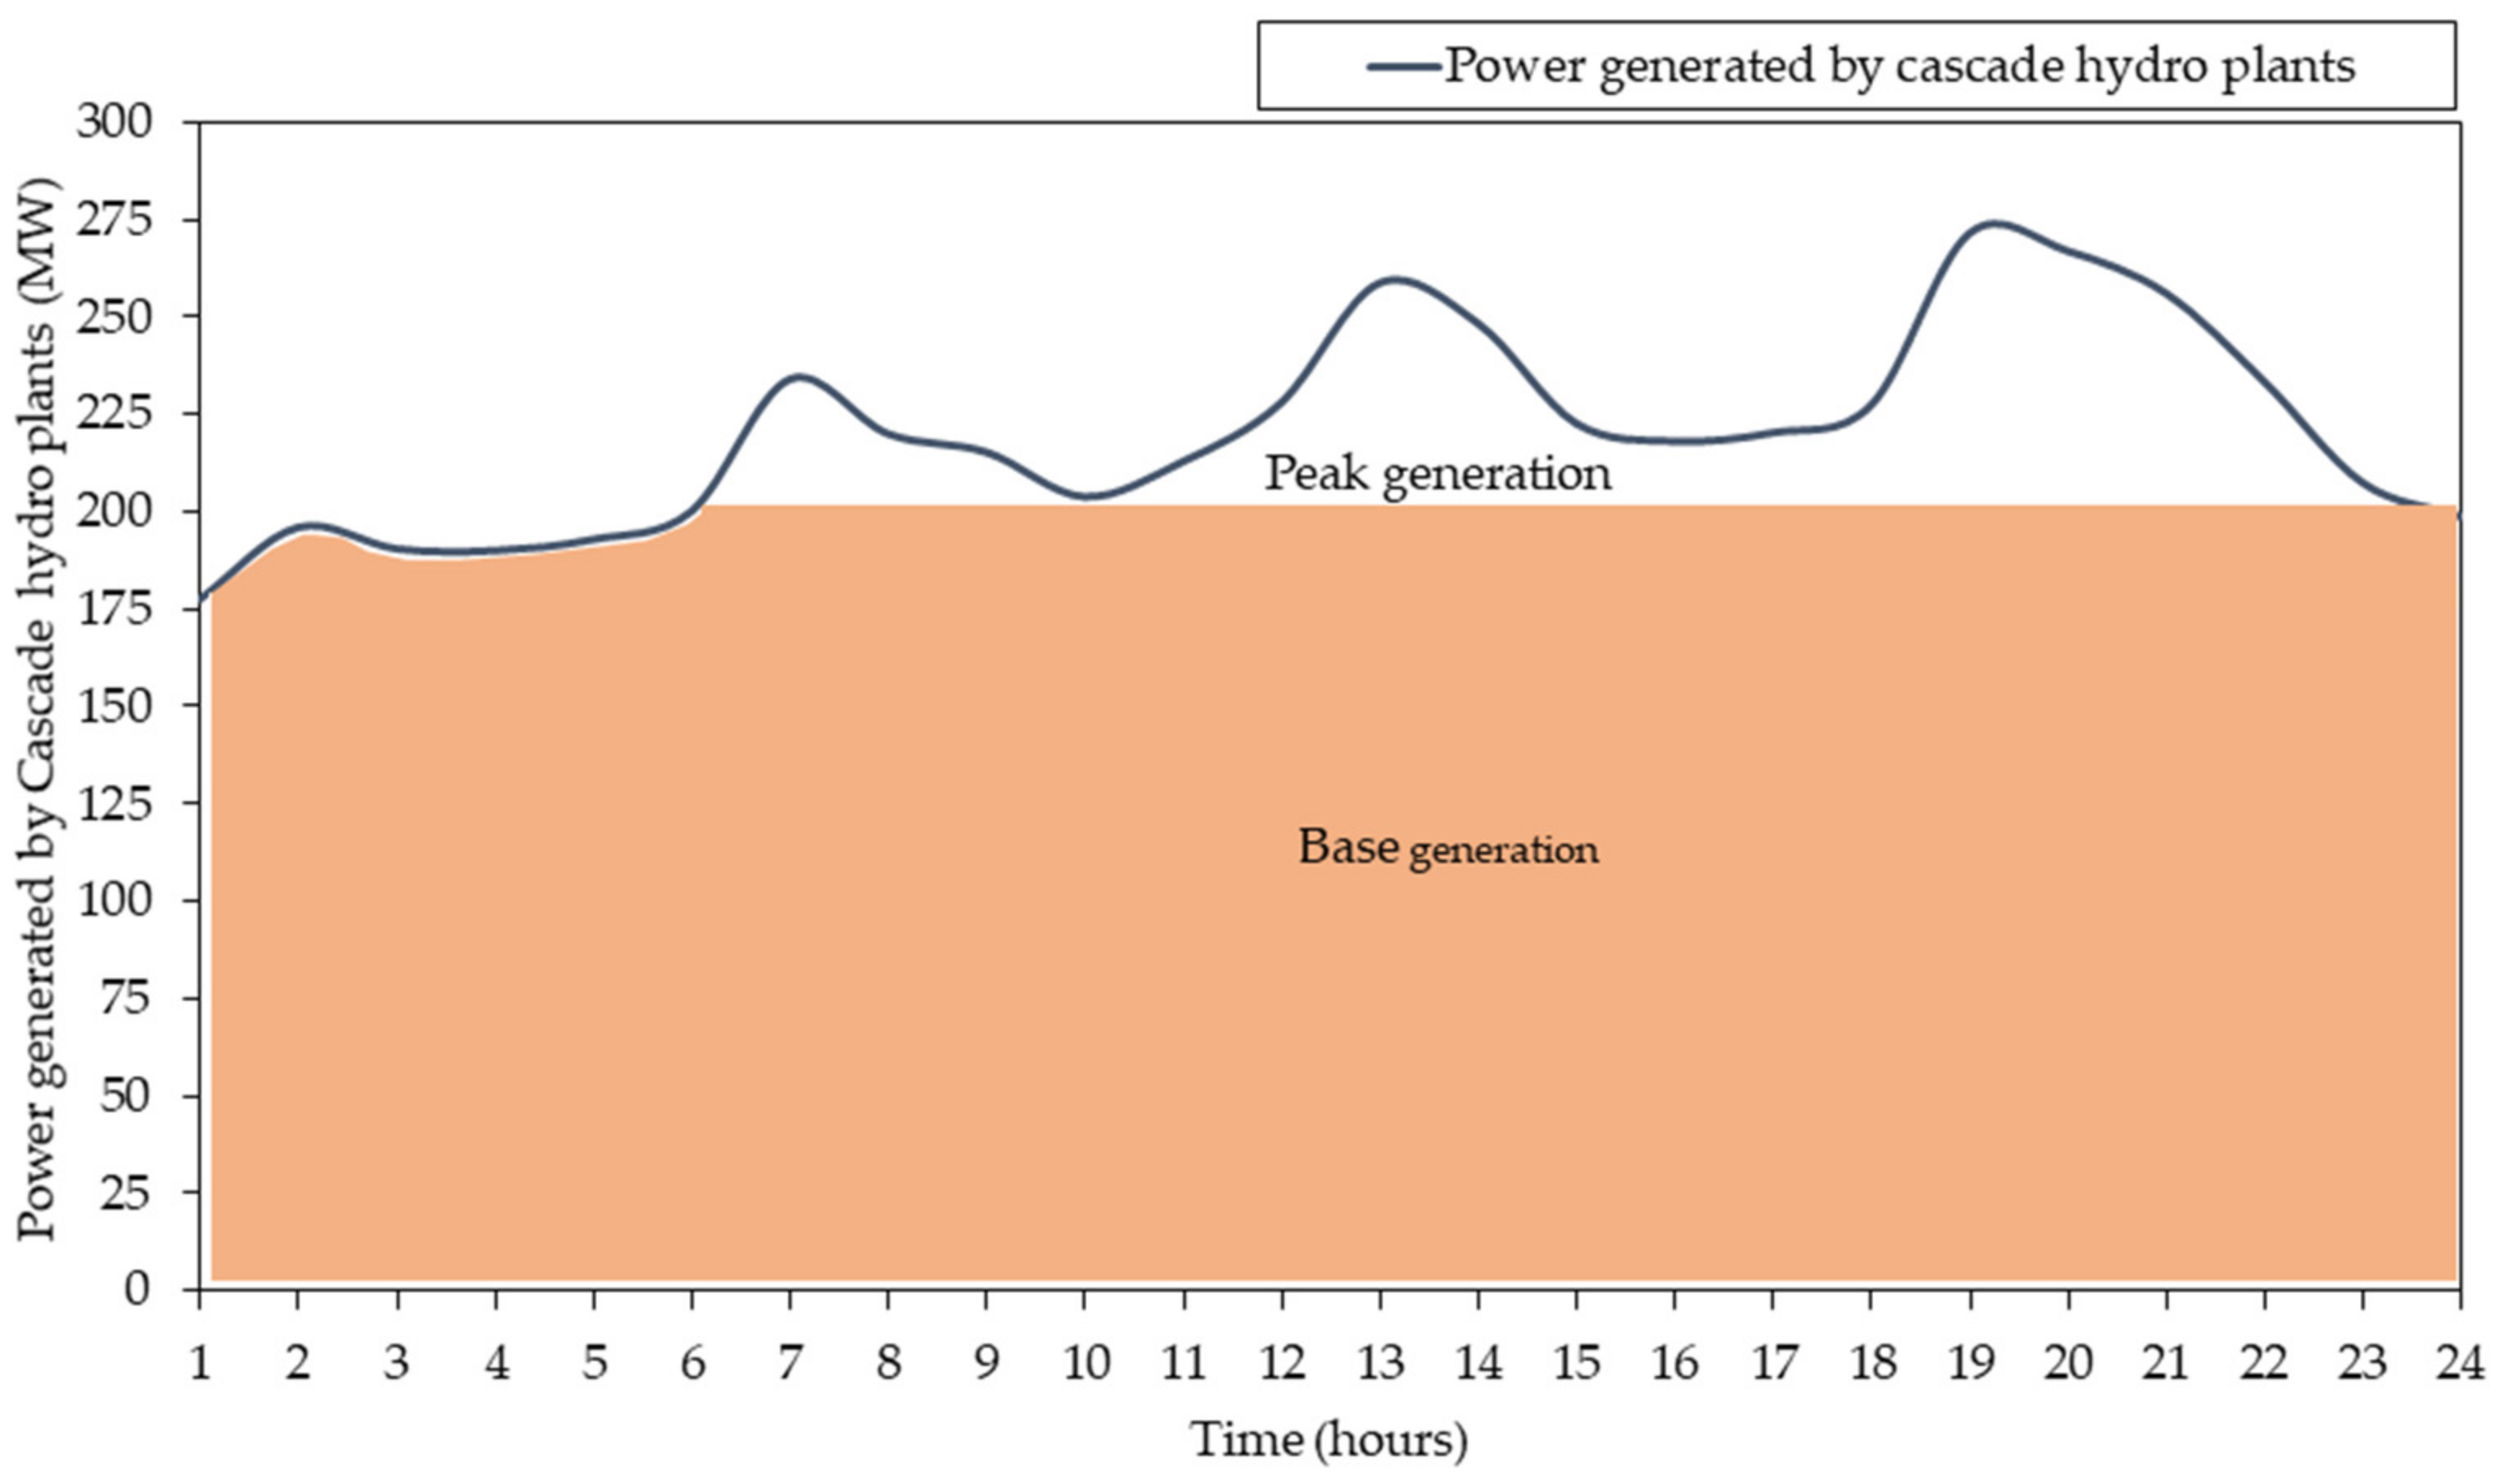
3.1. Power Generation by Cascade Hydropower Plants along the Shire River
3.2. Optimal Results for Load Satisfaction
3.2.1. Simulation Results and Software for Optimization
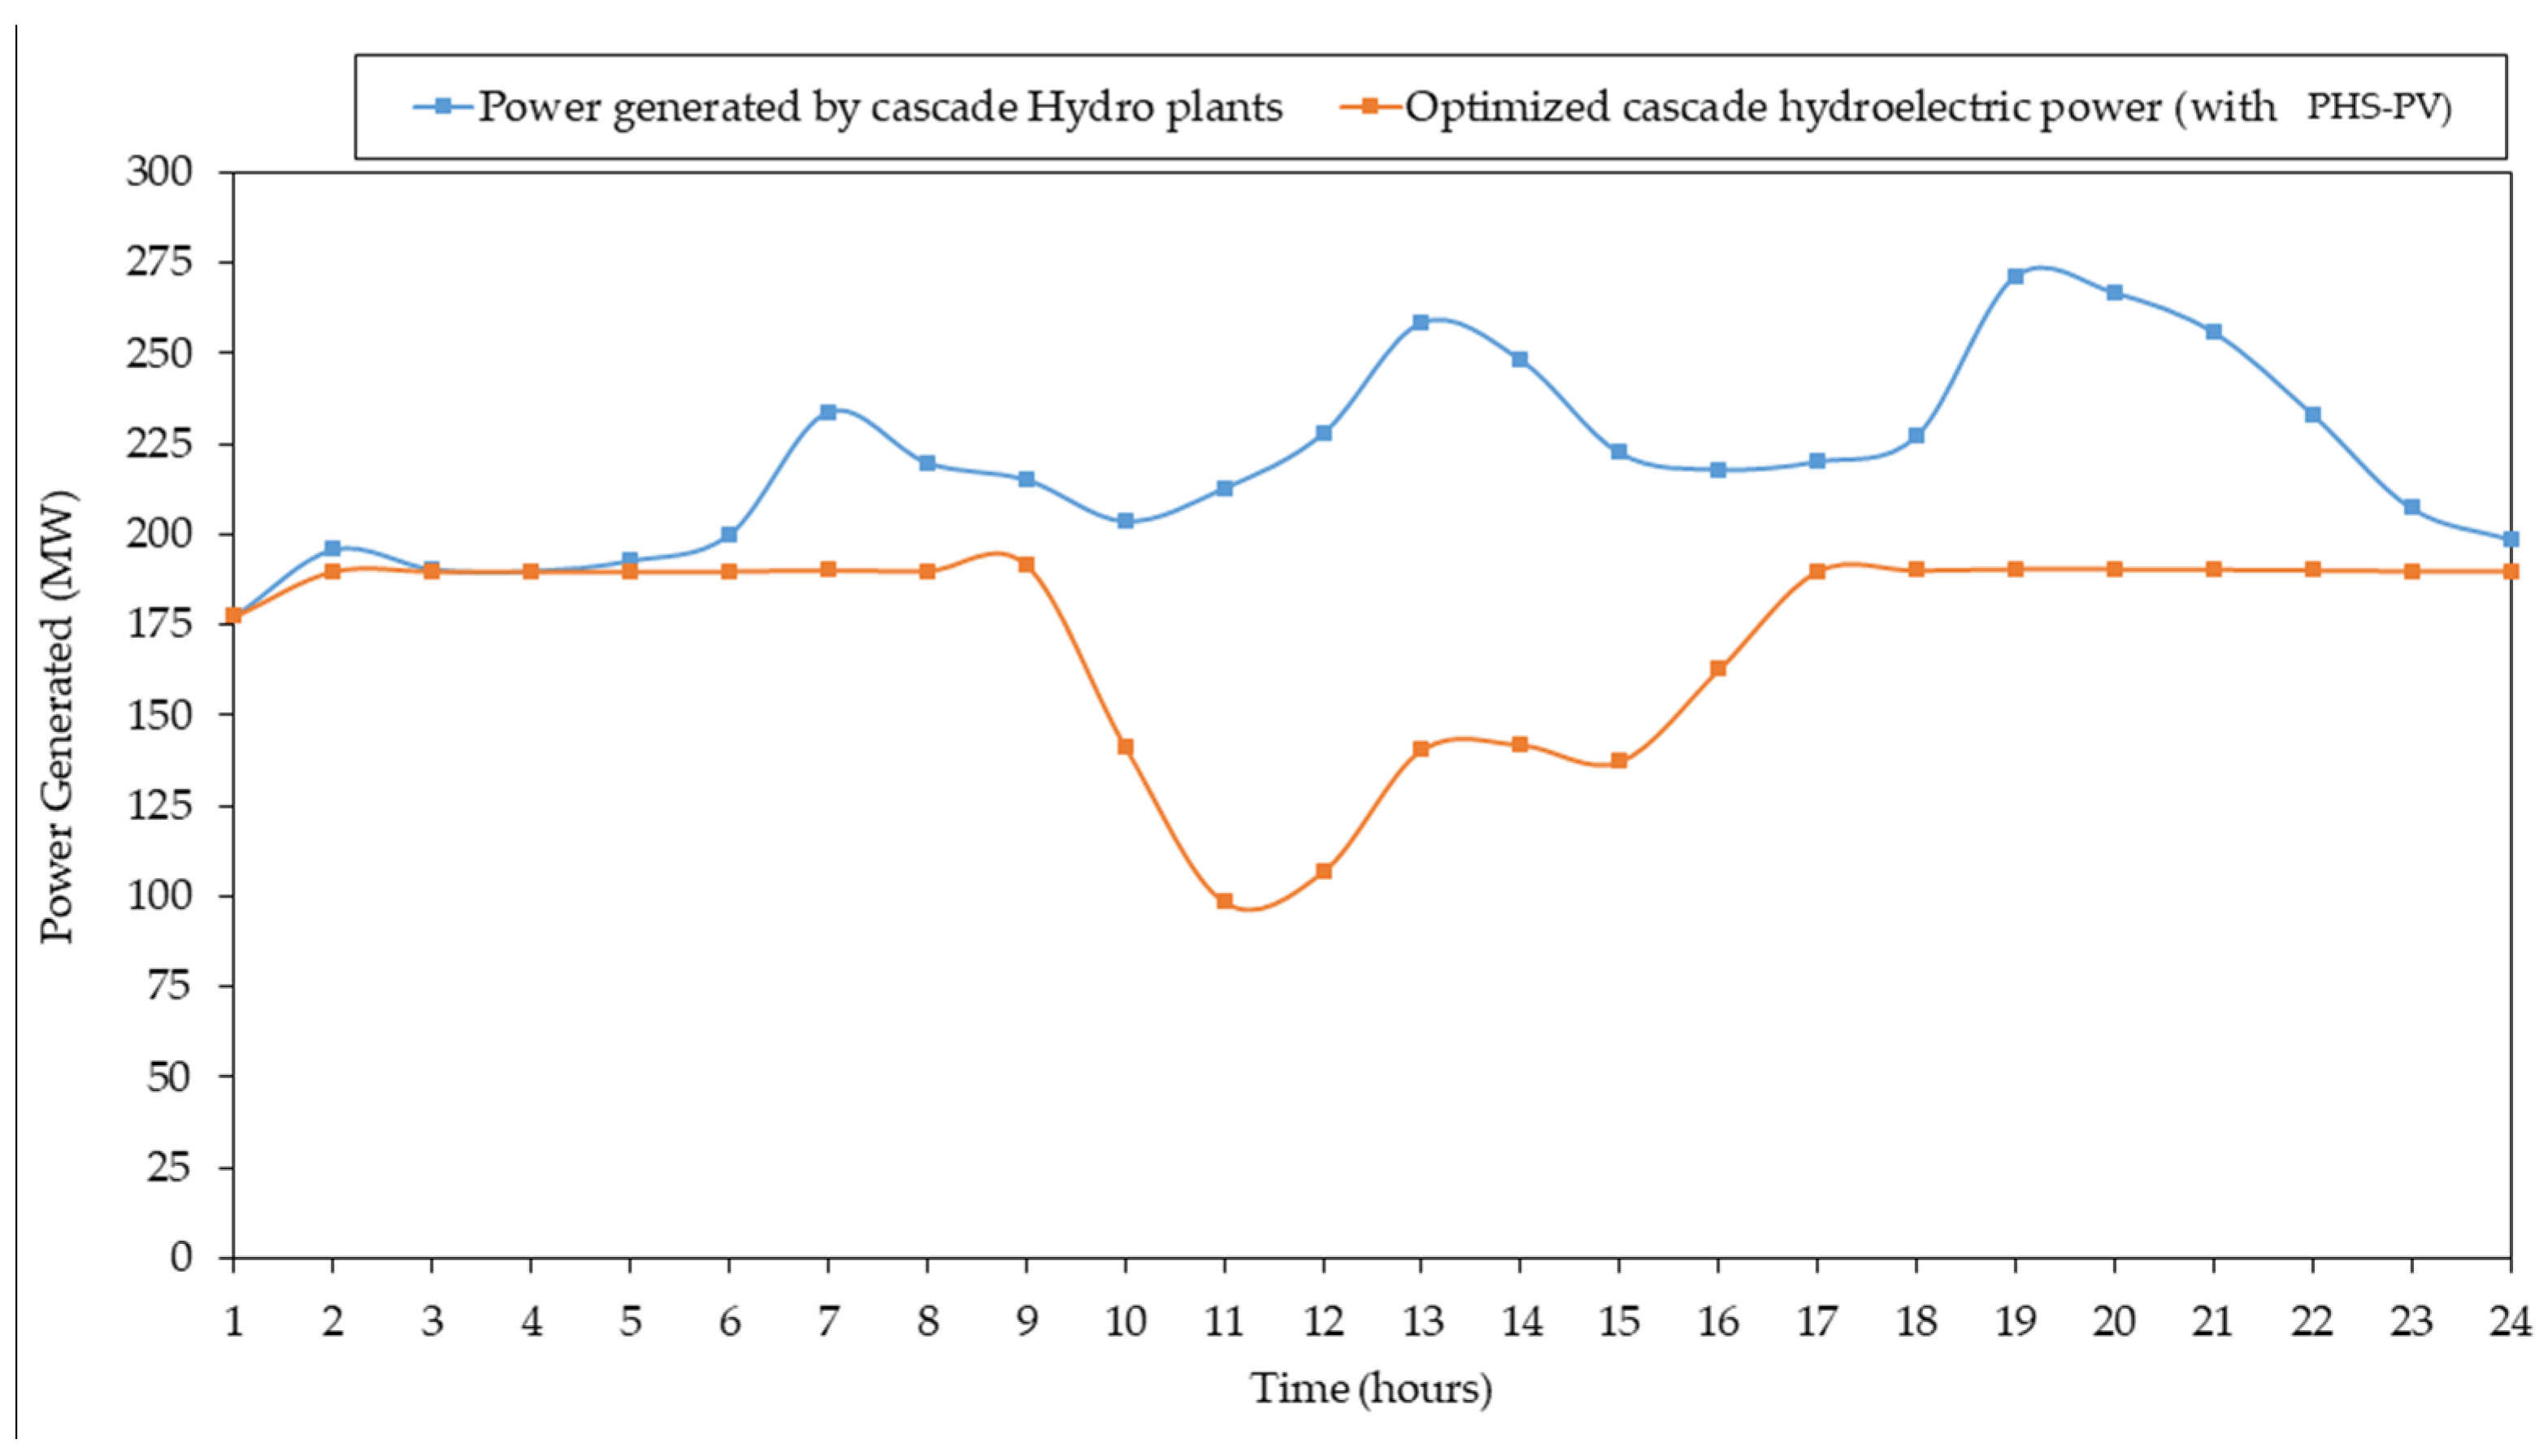
3.2.2. Optimized Electric Power from the Cascade Hydropower Plants
- Indirect water conservation and low stress on generators
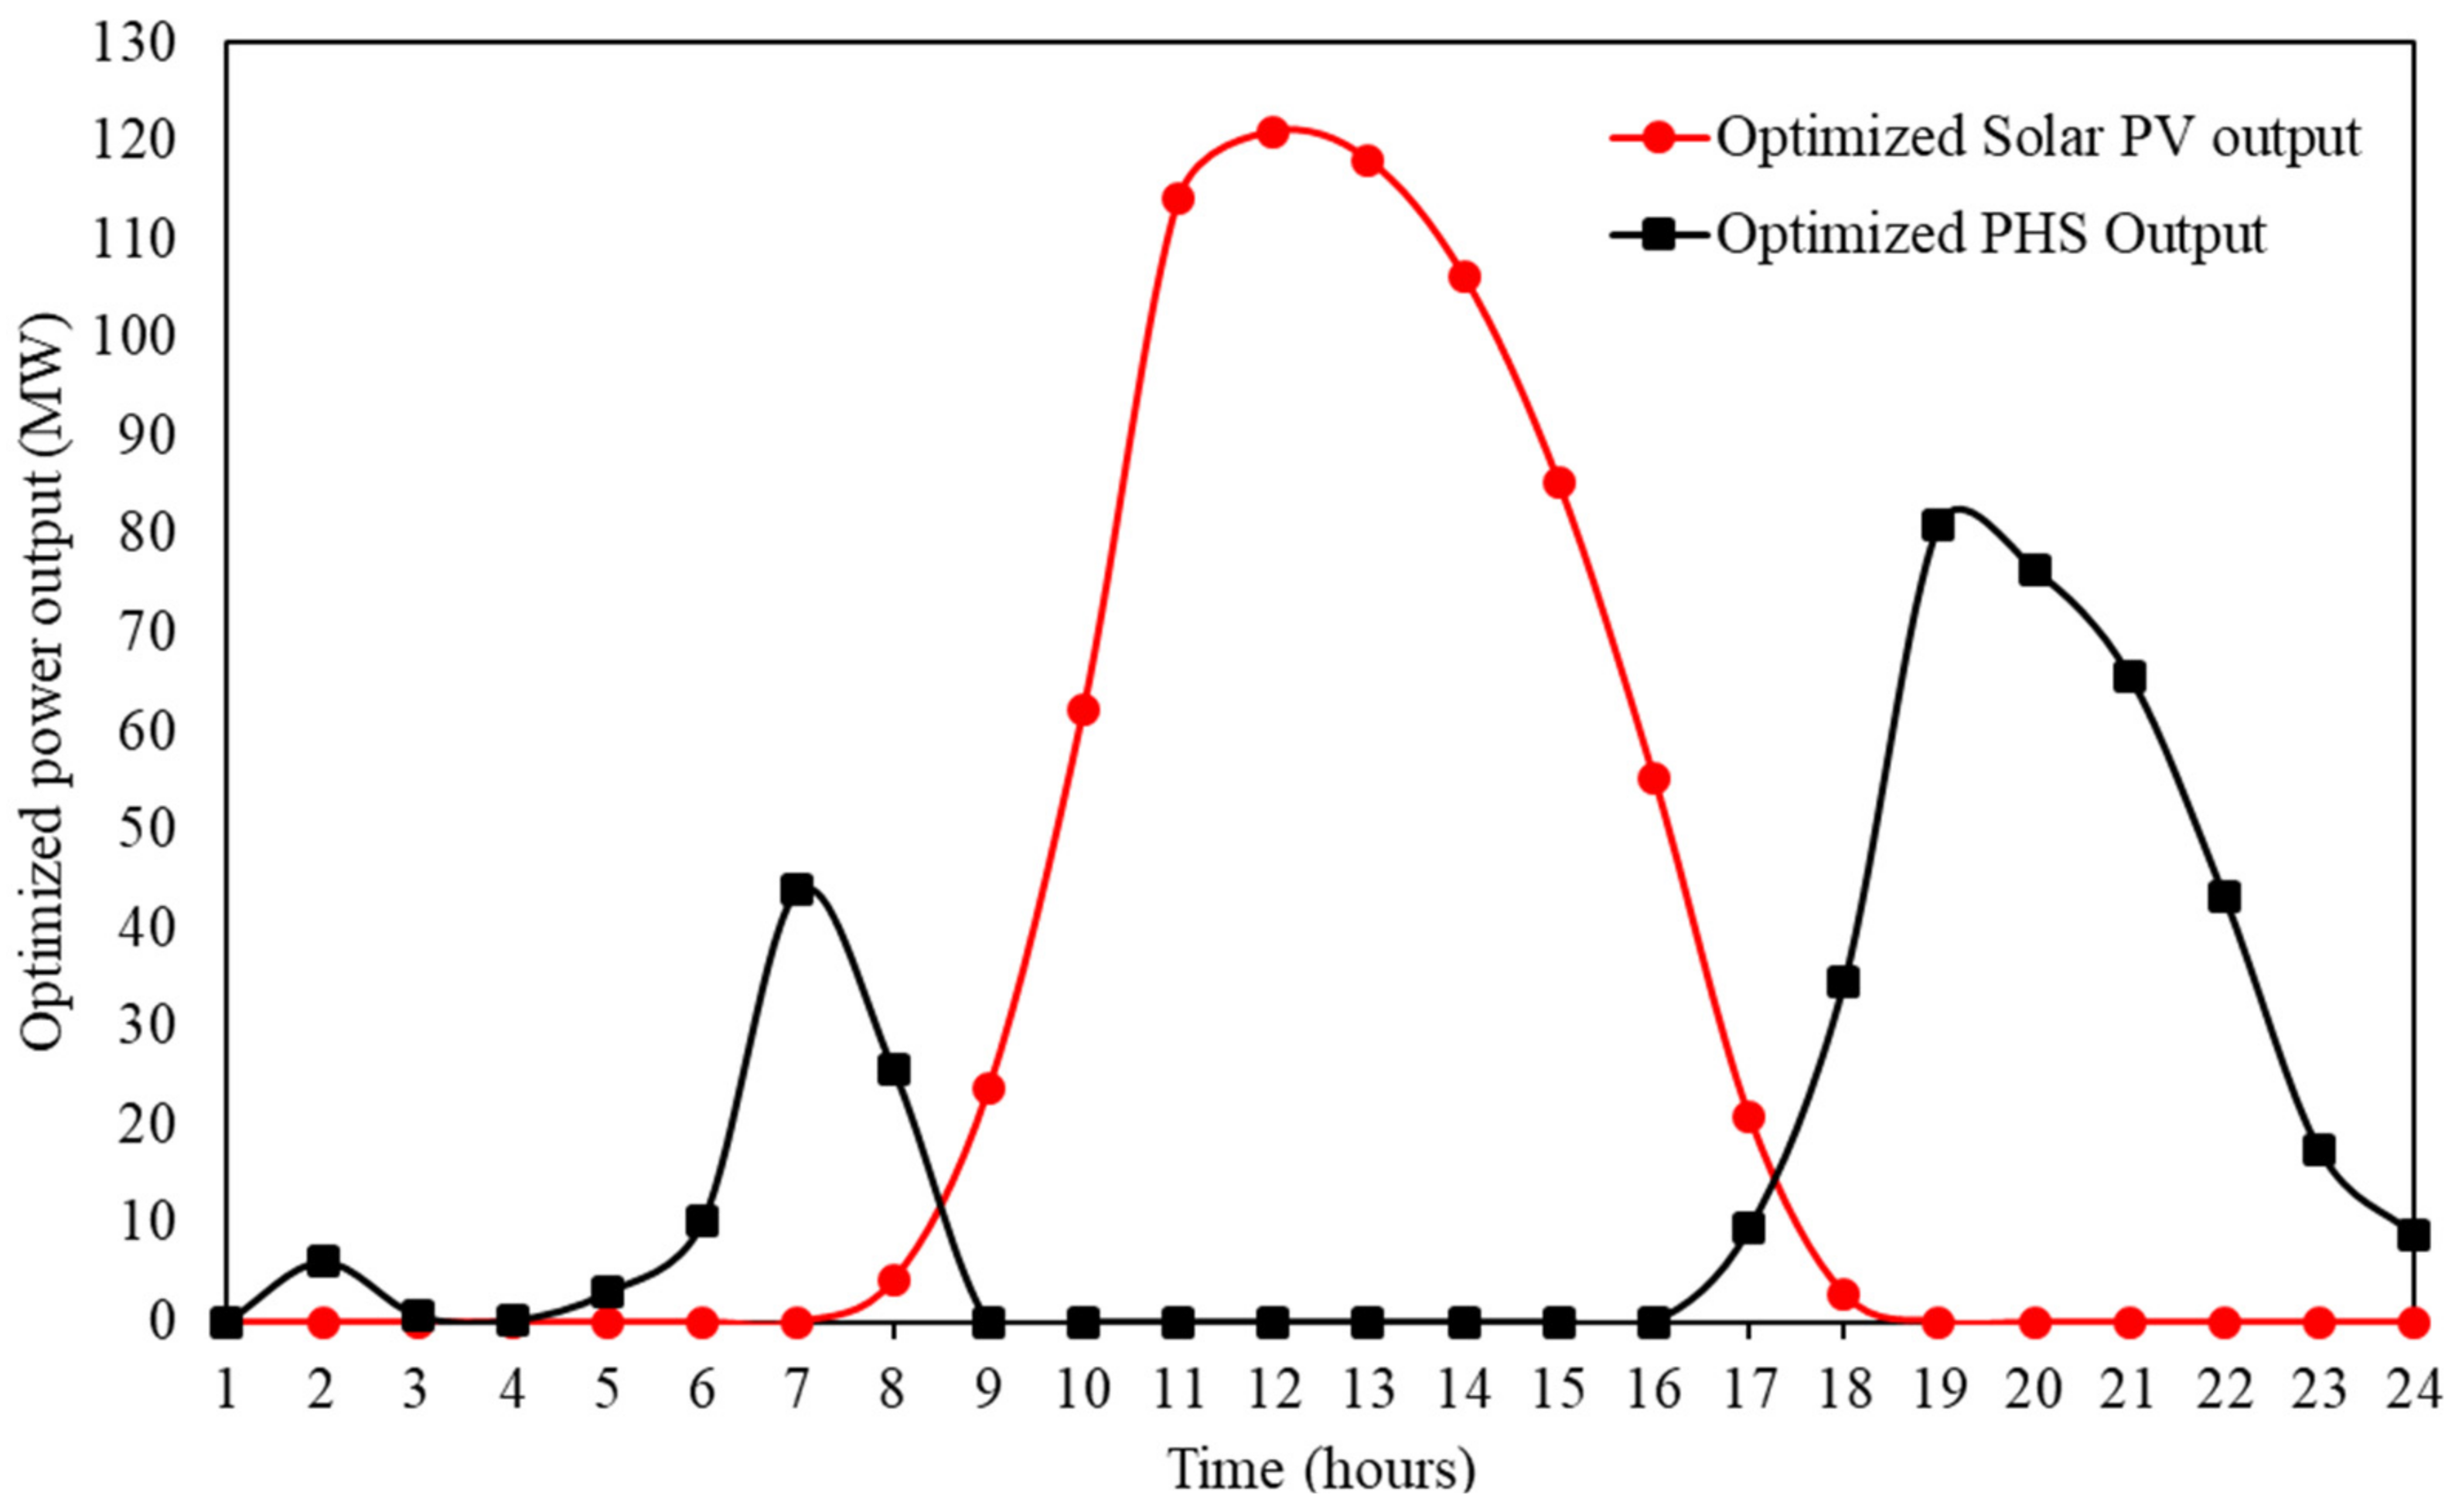
3.2.3. Electric Power from the Solar PV and PHS Plants
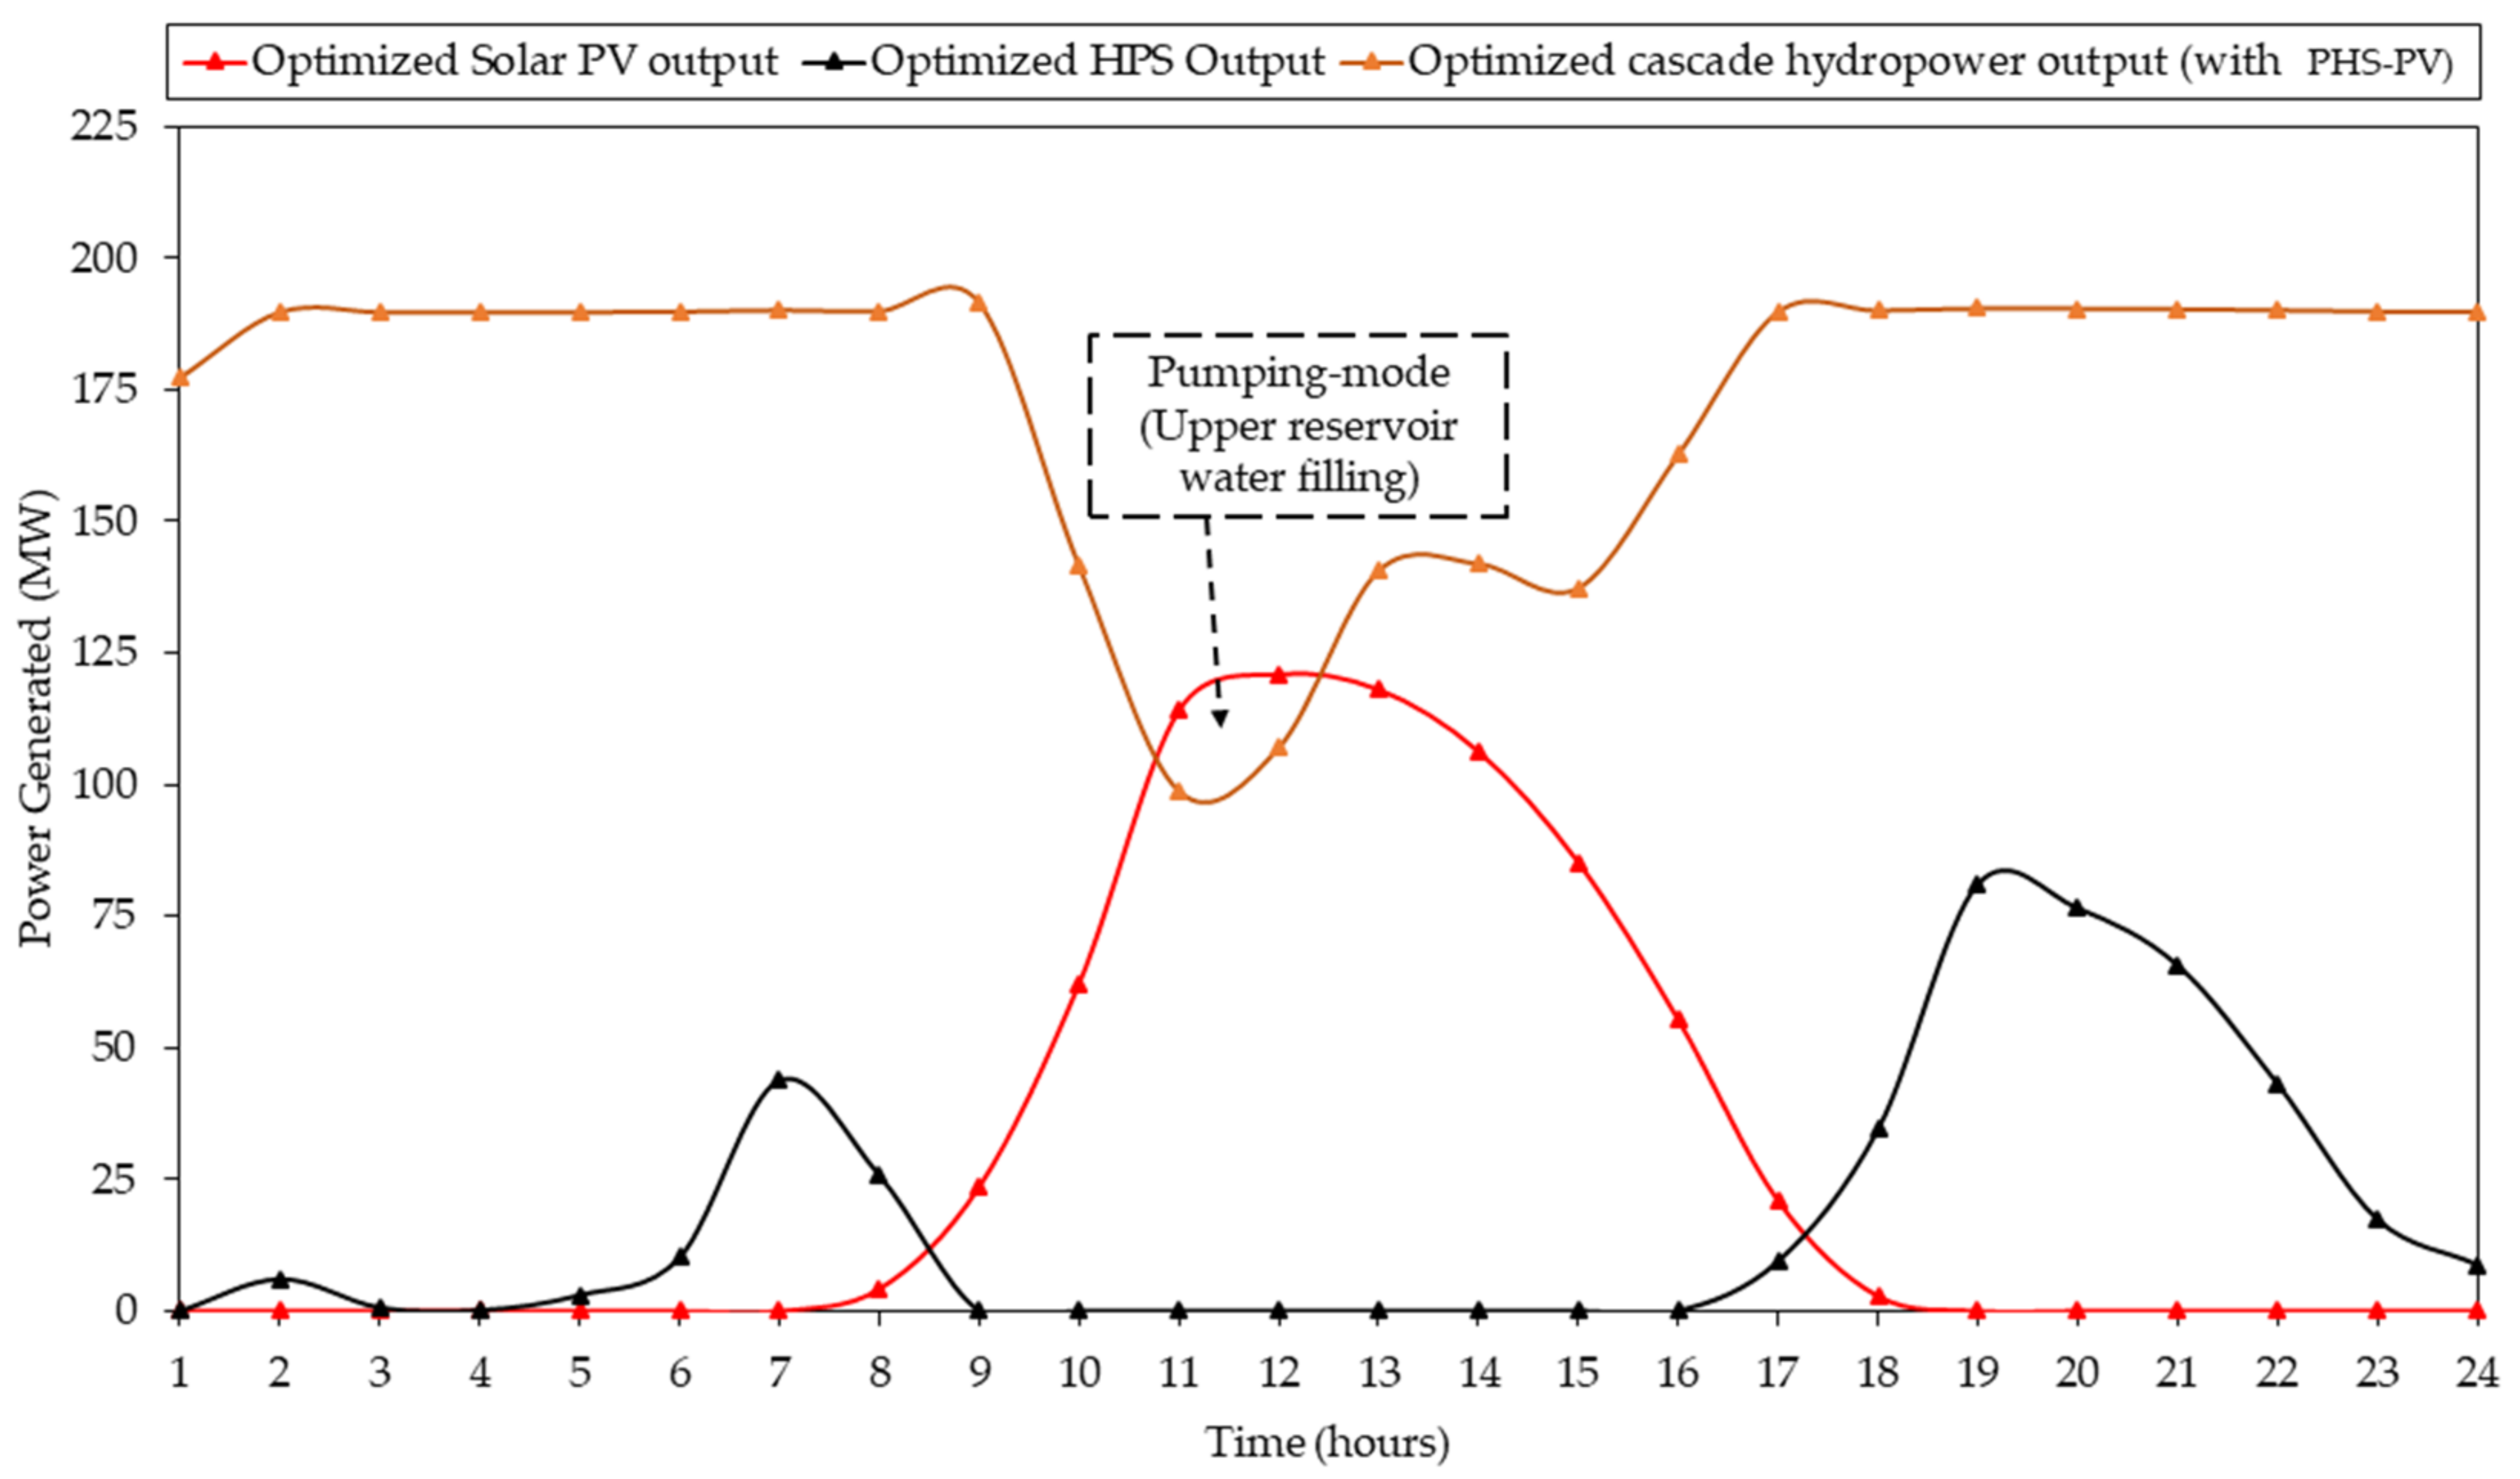
3.2.4. Combined Power Operation of PHS–PV and Cascade Hydropower Plants
3.2.5. Impact of the Head Effect on Power Production
3.3. Optimized Techno-Economic Evaluation of the System
4. Discussion
5. Conclusions
Author Contributions
Funding
Institutional Review Board Statement
Informed Consent Statement
Data Availability Statement
Acknowledgments
Conflicts of Interest
References
- UN Assembly. Transforming Our World: The 2030 Agenda for Sustainable Development; United Nations: New York, NY, USA, 2015; Available online: https://sustainabledevelopment.un.org/content/documents/21252030%20Agenda%20for%20Sustainable%20Development%20web.pdf (accessed on 11 August 2021).
- Mahmoudimehr, J.; Shabani, M. Optimal design of hybrid photovoltaic-hydroelectric standalone energy system for north and south of Iran. Renew. Energy 2018, 115, 238–251. [Google Scholar] [CrossRef]
- Kocaman, A.S.; Modi, V. Value of pumped hydro storage in a hybrid energy generation and allocation system. Appl. Energy 2017, 205, 1202–1215. [Google Scholar] [CrossRef] [Green Version]
- González, A.; Riba, J.R.; Rius, A.; Puig, R. Optimal sizing of a hybrid grid-connected photovoltaic and wind power system. Appl. Energy 2015, 154, 752–762. [Google Scholar] [CrossRef] [Green Version]
- Merkel, E.; McKenna, R.; Fichtner, W. Optimisation of the capacity and the dispatch of decentralised micro-CHP systems: A case study for the UK. Appl. Energy 2015, 140, 120–134. [Google Scholar] [CrossRef]
- Margeta, J.; Glasnovic, Z. Theoretical settings of photovoltaic-hydro energy system for sustainable energy production. Sol. Energy 2012, 86, 972–982. [Google Scholar] [CrossRef]
- Caralis, G.; Papantonis, D.; Zervos, A. The role of pumped storage systems towards the large scale wind integration in the Greek power supply system. Renew. Sustain. Energy Rev. 2012, 16, 2558–2565. [Google Scholar] [CrossRef]
- Margeta, J.; Glasnovic, Z. Exploitation of temporary water flow by hybrid PV-hydroelectric plant. Renew. Energy 2011, 36, 2268–2277. [Google Scholar] [CrossRef]
- Deane, J.P.; Gallachóir, Ó.B.P.; McKeogh, E.J. Techno-economic review of existing and new pumped hydro energy storage plant. Renew. Sustain. Energy Rev. 2010, 14, 1293–1302. [Google Scholar] [CrossRef]
- Ardizzon, G.; Cavazzini, G.; Pavesi, G. A new generation of small hydro and pumped-hydro power plants: Advances and future challenges. Renew. Sustain. Energy Rev. 2014, 31, 746–761. [Google Scholar] [CrossRef]
- Margeta, J.; Glasnovic, Z. Feasibility of the green energy production by hybrid solar + hydropower system in Europe and similar climate areas. Renew. Sustain. Energy Rev. 2010, 14, 1580–1590. [Google Scholar] [CrossRef]
- Glasnovic, Z.; Margeta, K.; Omerbegovic, V. Artificial water inflow created by Solar Energy for continuous green energy production. Water Resour. Manag. 2013, 27, 2303–2323. [Google Scholar] [CrossRef]
- Rehman, S.; Al-Hadhrami, L.M.; Alam, M.M. Pumped hydro energy storage system: A technological review. Renew. Sustain. Energy Rev. 2015, 44, 586–598. [Google Scholar] [CrossRef]
- Delgado-Antillón, C.P.; Domínguez-Navarro, J.A. Probabilistic siting and sizing of energy storage systems in distribution power systems based on the islanding feature. Electr. Power Syst. Res. 2018, 155, 225–235. [Google Scholar] [CrossRef]
- Kougias, I.; Szabo, S.; Monforti-Ferrario, F.; Huld, T.; Bódis, K. A methodology for optimization of the complementarity between small-hydropower plants and solar PV systems. Renew. Energy 2016, 87, 1023–1030. [Google Scholar] [CrossRef]
- François, B.; Zoccatelli, D.; Borga, M. Assessing small hydro/solar power complementarity in ungauged mountainous areas: A crash test study for hydrological prediction methods. Energy 2017, 127, 716–729. [Google Scholar] [CrossRef]
- Jurasz, J.; Ciapała, B. Integrating photovoltaics into energy systems by using a run-off-river power plant with pondage to smooth energy exchange with the power gird. Appl. Energy 2017, 198, 21–35. [Google Scholar] [CrossRef]
- Papaefthymiou, S.V.; Papathanassiou, S.A. Optimum sizing of wind-pumped-storage hybrid power stations in island systems. Renew. Energy 2013, 64, 187–196. [Google Scholar] [CrossRef]
- Ma, T.; Yang, H.; Lu, L.; Peng, J. Pumped storage-based standalone photovoltaic power generation system: Modeling and techno-economic optimization. Appl. Energy 2015, 137, 649–659. [Google Scholar] [CrossRef]
- Ayotamuno, M.J.; Kogbara, R.B.; Ogaji, S.O.; Probert, S.D. An improved mathematical model for a pumped hydro storage system considering electrical, mechanical, and hydraulic losses. Appl. Energy 2019, 247, 228–236. [Google Scholar] [CrossRef]
- Padrón, S.; Medinaand, J.F.; Rodríguez, A. Analysis of a pumped storage system to increase the penetration level of renewable energy in isolated power systems. Gran Canaria: A case study. Energy 2011, 36, 6753–6762. [Google Scholar] [CrossRef]
- Juan, I.; Díaz, P.; Jiménez, J. Contribution of a pumped-storage hydropower plant to reduce the scheduling costs of an isolated power system with high wind power penetration. Energy 2016, 109, 92–104. [Google Scholar] [CrossRef] [Green Version]
- Kapsali, M.; Anagnostopoulos, J.S. Investigating the role of local pumped-hydro energy storage in interconnected island grids with high wind power generation. Renew. Energy 2017, 114, 614–628. [Google Scholar] [CrossRef]
- Chen, C.L.; Chen, H.C.; Lee, J.Y. Application of a generic superstructure-based formulation to the design of wind-pumped-storage hybrid systems on remote islands. Energy Convers. Manag. 2016, 111, 339–351. [Google Scholar] [CrossRef]
- Zhang, Y.; Ma, C.; Lian, J.; Chaima, E. Optimal photovoltaic capacity of large-scale hydro-photovoltaic complementary systems considering electricity delivery demand and reservoir characteristics. Energy Convers. Manag. 2019, 195, 597–608. [Google Scholar] [CrossRef]
- Abdul Aziz, N.I.; Sulaiman, S.I.; Shaari, S.; Musirin, I.; Sopian, K. Optimal sizing of stand-alone photovoltaic system by minimizing the loss of power supply probability. Sol. Energy 2017, 150, 220–228. [Google Scholar] [CrossRef]
- Ould Bilal, B.; Sambou, V.; Ndiaye, P.A.; Kébé, C.M.; Ndongo, M. Optimal design of a hybrid solar–wind-battery system using the minimization of the annualized cost system and the minimization of the loss of power supply probability (LPSP). Renew. Energy 2010, 35, 2388–2390. [Google Scholar] [CrossRef]
- Maleki, A.; Pourfayaz, F. Optimal sizing of autonomous hybrid photovoltaic/wind/battery power system with LPSP technology by using evolutionary algorithms. Sol. Energy 2015, 115, 471–483. [Google Scholar] [CrossRef]
- Maleki, A.; Pourfayaz, F.; Hafeznia, H.; Rosen, M.A. A novel framework for optimal photovoltaic size and location in remote areas using a hybrid method: A case study of eastern Iran. Energy Convers. Manag. 2017, 153, 129–143. [Google Scholar] [CrossRef]
- Lian, J.; Zhang, Y.; Ma, C.; Chaima, E. A review on recent sizing methodologies of hybrid renewable energy systems. Energy Convers. Manag. 2019, 199, 112027. [Google Scholar] [CrossRef]
- Portero, U.; Velázquez, S.; Carta, J.A. Sizing of a wind-hydro system using a reversible hydraulic facility with seawater. A case study in the Canary Islands. Energy Convers. Manag. 2015, 106, 1251–1263. [Google Scholar] [CrossRef]
- Ma, T.; Yang, H.; Lu, L. Feasibility study and economic analysis of pumped hydro storage and battery storage for a renewable energy powered island. Energy Convers. Manag. 2014, 79, 387–397. [Google Scholar] [CrossRef]
- Maleki, A.; Khajeh, M.G.; Ameri, M. Optimal sizing of a grid independent hybrid renewable energy system incorporating resource uncertainty, and load uncertainty. Int. J. Elec. Power Energy Syst. 2016, 83, 514–524. [Google Scholar] [CrossRef]
- Ma, T.; Yang, H.; Lu, L.; Peng, J. An optimization sizing model for solar photovoltaic power generation system with Pumped Storage. Energy Procedia 2014, 6, 5–8. [Google Scholar] [CrossRef] [Green Version]
- Luo, Y.; Shi, L.; Tu, G. Optimal sizing and control strategy of isolated grid with wind power and energy storage system. Energy Convers. Manag. 2014, 80, 407–415. [Google Scholar] [CrossRef]
- Simão, M.; Ramos, H.M. Hybrid Pumped Hydro Storage Energy Solutions towards Wind and PV Integration: Improvement on Flexibility, Reliability and Energy Costs. Water 2020, 12, 2457. [Google Scholar] [CrossRef]
- Hansen, K. Decision-making based on energy costs: Comparing levelized cost of energy and energy system costs. Energy Strategy Rev. 2019, 24, 68–82. [Google Scholar] [CrossRef]
- Eberhard, A.; Foster, V.; Briceño-Garmendia, C.; Ouedraogo, F.; Camos, D.; Shkaratan, M. Underpowered: The State of the Power Sector in Sub-Saharan Africa. In Africa Infrastrucure Diagnostic Background Paper 6; The World Bank: New York, NY, USA, 2008; Available online: https://openknowledge.worldbank.org/bitstream/handle/10986/7833/482140ESW0P11110Power0Sector0Review.pdf?sequence=1 (accessed on 20 August 2019).
- Breeze, P. Power Generation Technologies, 3rd ed.; Newnes: Boston, MA, USA, 2019; pp. 22–35. [Google Scholar]
- EU. Photovoltaic Geographical Information System (PVGIS); European Union: Brussels, Belgium, 2019; Available online: https://re.jrc.ec.europa.eu/pvg_tools/en/tools.html (accessed on 27 August 2019).
- IRENA. Solar PN in Africa: Costs and Markets; International Renewable Energy Agency: Abu Dhabi, United Arab Emirates, 2016; Available online: https://www.irena.org/publications/2016/Sep/Solar-PV-in-Africa-Costs-and-Markets (accessed on 10 September 2019).
- Papaefthymiou, S.V.; Papathanassiou, S.A.; Karamanou, E.G. Application of Pumped Storage to increase renewable energy penetration in Autonomous Island Systems. In Wind Energy Conversion Systems; Muyeen, S., Ed.; Springer: London, UK, 2012; pp. 295–335. [Google Scholar]
- CEICdata. Malawi Bank Lending Rate. Available online: https://www.ceicdata.com/en/indicator/malawi/bank-lending-rate (accessed on 4 September 2019).
- Rooij, D. Balance of System (BOS): What Is It? Sino Voltaics. Available online: https://sinovoltaics.com/learning-center/basics/balance-of-system-bos/ (accessed on 4 February 2020).
- Fu, R.; Feldman, D.; Margolis, R. United States Solar Photovoltaic System Cost Benchmark: Q1 2018; National Renewable Energy Laboratory. Available online: https://www.nrel.gov/docs/fy19osti/72133.pdf (accessed on 4 February 2020).
- IRENA. Renewable Power Generation Costs in 2018; International Renewable Energy Agency: Abu Dhabi, United Arab Emirates. Available online: https://www.irena.org/publications/2019/May/Renewable-power-generation-costs-in-2018 (accessed on 5 May 2020).
- Rauf, H.; Gull, M.S.; Arshad, N. Complementing hydroelectric power with floating solar PV for daytime peak electricity demand. Renew. Energy 2020, 162, 1227–1242. [Google Scholar] [CrossRef]
- Su, C.; Cheng, C.; Wang, P.; Shen, J.; Wu, X. Optimization model for long-distance integrated transmission of wind farms and pumped-storage hydropower plants. Appl. Energy 2019, 242, 285–293. [Google Scholar] [CrossRef]
- Wu, G.; Deshmukh, R.; Ndhlukula, K.; Radojicic, T.; Reilly, J. Renewable Energy Zones for the Africa Clean Energy Corridor; LBNL (LBNL-187271); International Renewable Energy Agency and Lawrence Berkeley National Laboratory: Barkeley, CA, USA, 2015. [Google Scholar] [CrossRef]


| HPP | Head (m) | Design Mean Flow (m3/s) | Capacity (MW) |
|---|---|---|---|
| Nkula | 50 | 280 | 124 |
| Tedzani | 37 | 280 | 93 |
| Kapichira | 54 | 270 | 128 |
| Shire River Cascade Total | 345 | ||
| Component Investment Expenditure | Unit | Reference |
|---|---|---|
| PV rate power (kW) | USD/kW | [2,19,41] |
| is turbine nominal power(kW) | USD/kW | [18] |
| is pump nominal power(kW) | USD/kW | [18] |
| is maximum volume of upper reservoir | USD/m3 | [18] |
| is maximum volume of lower reservoir | USD/m3 | [18] |
| PV rated power (kW) | USD/kW | [2,19,34] |
| USD/kW | [18,42] | |
| i = 13.9 | % | [43] |
| Time (Hrs) | Load Demand (MW) | Cascade Hydropower Output (without PHS–PV) (MW) | Output Summary of 182 MW Solar PV System at Shire (MW) | Output Summary of 86 MW PHS System at Shire (MW) | Optimized Cascade Hydropower Output (with PHS–PV) (MW) | Optimized Solar PV Power Output (MW) | Optimized PHS Power Output (MW) |
|---|---|---|---|---|---|---|---|
| 1 | 177.294 | 177.294 | 0 | 0 | 177.294 | 0 | 0 |
| 2 | 195.8 | 195.8 | 0 | 6.055 | 189.745 | 0 | 6.055 |
| 3 | 190.3 | 190.3 | 0 | 0.605 | 189.695 | 0 | 0.605 |
| 4 | 189.8 | 189.8 | 0 | 0.11 | 189.691 | 0 | 0.11 |
| 5 | 192.7 | 192.7 | 0 | 2.983 | 189.717 | 0 | 2.983 |
| 6 | 199.96 | 199.96 | 0 | 10.177 | 189.783 | 0 | 10.177 |
| 7 | 233.88 | 233.88 | 0 | 43.791 | 190.089 | 0 | 43.791 |
| 8 | 219.84 | 219.84 | 4.224 | 25.692 | 189.924 | 4.224 | 25.692 |
| 9 | 215.14 | 215.14 | 23.624 | 0 | 191.516 | 23.624 | 0 |
| 10 | 203.66 | 203.66 | 62.191 | 0 | 141.469 | 62.191 | 0 |
| 11 | 212.76 | 212.76 | 114.123 | 0 | 98.637 | 114.123 | 0 |
| 12 | 227.9 | 227.9 | 120.972 | 0 | 106.928 | 120.972 | 0 |
| 13 | 258.654 | 258.654 | 118.087 | 0 | 140.567 | 118.087 | 0 |
| 14 | 248.219 | 248.219 | 106.312 | 0 | 141.907 | 106.312 | 0 |
| 15 | 222.512 | 222.512 | 85.227 | 0 | 137.285 | 85.227 | 0 |
| 16 | 217.946 | 217.946 | 55.319 | 0 | 162.627 | 55.319 | 0 |
| 17 | 220.131 | 220.131 | 20.932 | 9.423 | 189.776 | 20.932 | 9.423 |
| 18 | 227.292 | 227.292 | 2.843 | 34.445 | 190.004 | 2.843 | 34.445 |
| 19 | 271.439 | 271.439 | 0 | 81.011 | 190.428 | 0 | 81.011 |
| 20 | 266.831 | 266.831 | 0 | 76.445 | 190.386 | 0 | 76.445 |
| 21 | 255.911 | 255.911 | 0 | 65.623 | 190.288 | 0 | 65.623 |
| 22 | 233.192 | 233.192 | 0 | 43.109 | 190.083 | 0 | 43.109 |
| 23 | 207.239 | 207.239 | 0 | 17.391 | 189.848 | 0 | 17.391 |
| 24 | 198.555 | 198.555 | 0 | 8.785 | 189.770 | 0 | 8.785 |
| Design Parameter | Optimal Solution | Unit |
|---|---|---|
| Levelized cost of energy (LCOE) | 0.13 | USD/kWh |
| Loss of power supply probability(LPSP) | 0.20 | % |
| PV capacity | 182 | MW |
| Pump capacity | 31 | MW |
| Turbine capacity | 86 | MW |
| Inverter | 1.82 × 10⁵ | kW |
| Upper reservoir capacity | 2.7 × 10⁷ | m3 |
| Lower reservoir capacity | 1.35 × 10⁷ | m3 |
| Design Parameter | Capacity/Proportion | Investment Cost (USD) |
|---|---|---|
| PV modules | 606,667 | 364 |
| Pump | 3.1 × 10⁴ (kW) | 12.2 |
| Turbine | 8.6 × 10⁴ (kW) | 37.52 |
| Upper reservoir | 2.7 × 10⁷ (m3) | 0.42 |
| Lower reservoir | 1.35 × 10⁷ (m3) | 0.2 |
| O&M | 2% of total investment cost | 8.29 |
| Balance of plant | 60% of total investment cost | 248.6 |
| Power Plant | Load Demand (kW) | Power Output (kW) | Annual Excess Output (kW) | Annual Unmet Load (kW) | LPSP (%) |
|---|---|---|---|---|---|
| Cascade hydro | 1.91 × 10⁹ | 1.19 × 10⁹ | 1.94 × 10⁶ | 7.23 × 10⁸ | 37.91 |
| PHS–PV plus cascade hydro | 1.91 × 10⁹ | 1.99 × 10⁹ | 8.11 × 10⁷ | 3.8 × 10⁶ | 0.20 |
Publisher’s Note: MDPI stays neutral with regard to jurisdictional claims in published maps and institutional affiliations. |
© 2021 by the authors. Licensee MDPI, Basel, Switzerland. This article is an open access article distributed under the terms and conditions of the Creative Commons Attribution (CC BY) license (https://creativecommons.org/licenses/by/4.0/).
Share and Cite
Chaima, E.; Lian, J.; Ma, C.; Zhang, Y.; Kavwenje, S. Complementary Optimization of Hydropower with Pumped Hydro Storage–Photovoltaic Plant for All-Day Peak Electricity Demand in Malawi. Energies 2021, 14, 4948. https://0-doi-org.brum.beds.ac.uk/10.3390/en14164948
Chaima E, Lian J, Ma C, Zhang Y, Kavwenje S. Complementary Optimization of Hydropower with Pumped Hydro Storage–Photovoltaic Plant for All-Day Peak Electricity Demand in Malawi. Energies. 2021; 14(16):4948. https://0-doi-org.brum.beds.ac.uk/10.3390/en14164948
Chicago/Turabian StyleChaima, Evance, Jijian Lian, Chao Ma, Yusheng Zhang, and Sheila Kavwenje. 2021. "Complementary Optimization of Hydropower with Pumped Hydro Storage–Photovoltaic Plant for All-Day Peak Electricity Demand in Malawi" Energies 14, no. 16: 4948. https://0-doi-org.brum.beds.ac.uk/10.3390/en14164948