
Lithium-Ion Battery Operation, Degradation, and Aging Mechanism in Electric Vehicles: An Overview


1
Department of Energy Technology, Aalborg University, 9220 Aalborg, Denmark
2
Department of Material Production, Aalborg University, 9220 Aalborg, Denmark
*
Author to whom correspondence should be addressed.
Energies 2021, 14(17), 5220; https://0-doi-org.brum.beds.ac.uk/10.3390/en14175220
Submission received: 28 July 2021
/
Revised: 13 August 2021
/
Accepted: 18 August 2021
/
Published: 24 August 2021
(This article belongs to the Topic Optimisation, Optimal Control and Nonlinear Dynamics in Electrical Power, Energy Storage and Renewable Energy Systems)
Abstract
:Understanding the aging mechanism for lithium-ion batteries (LiBs) is crucial for optimizing the battery operation in real-life applications. This article gives a systematic description of the LiBs aging in real-life electric vehicle (EV) applications. First, the characteristics of the common EVs and the lithium-ion chemistries used in these applications are described. The battery operation in EVs is then classified into three modes: charging, standby, and driving, which are subsequently described. Finally, the aging behavior of LiBs in the actual charging, standby, and driving modes are reviewed, and the influence of different working conditions are considered. The degradation mechanisms of cathode, electrolyte, and anode during those processes are also discussed. Thus, a systematic analysis of the aging mechanisms of LiBs in real-life EV applications is achieved, providing practical guidance, methods to prolong the battery life for users, battery designers, vehicle manufacturers, and material recovery companies.

1. Introduction
Lithium-ion batteries (LiBs) with high energy density are receiving increasing attention because of their environmental friendliness and are widely used in electric vehicles (EVs) worldwide [1]. Battery degradation problems, such as capacity fading and internal resistance increasing, inevitably occur with time and use. These cause great trouble to users and manufacturers [2]. A clear understanding of how batteries age in EVs is urgently needed to: (i) optimize the battery materials, (ii) improve battery cell production, and (iii) guide the design of automotive battery systems.
At present, scientists from different fields have researched, from different perspectives, the aging of LiBs. Some scientists specifically discussed the impacts of environmental and operational factors on battery degradation [3], while others studied the battery aging mechanism through the post-mortem analysis of the internal components of the battery cell [4]. However, a close connection between the battery operation and degradation in EV applications and the corresponding aging mechanism has not yet been established. Thus, a review is necessary in order to systematically and comprehensively describe the aging of LiBs in EVs.
Many reviews on battery aging have been published presenting the battery degradation and aging mechanisms. The main contents of these reviews are summarized in Table 1. These reviews are mostly based on analyzing laboratory accelerated aging test results, which are mainly obtained using constant charging/discharging current and are significantly different from the battery operation in EVs. Besides, most of them lack the connection with the battery operation scenarios, and focus only on the degradation behavior of the battery itself; in reality, the influential factors on battery charging, discharging and standby are different, and aging should be described independently based on the operation status. Moreover, the battery chemistries reviewed in these works mainly involved stable LiCoO2 and LiFePO4, which are more stable and mature and are not considered to be state-of-the-art technology for EVs. Therefore, the aging mechanisms of widely EV-used Ni-rich battery chemistries (LiNi1−xMxO2, M = Co, Mn and Al. (NMC) and (NCA)) need further study. In order to address this gap, in this paper, we review the NMC and NCA battery operation, degradation, and the corresponding aging mechanisms in real-life-EV use.
In this article, we analyzed the applications of LiBs in current EVs, and divided the battery operation scenario into three modes: charging, standby, and driving. The influence on EV battery degradation from the corresponding factors for these modes is studied, respectively. Finally, the relationship between the battery operation mode and the aging mechanisms of battery cell components (i.e., anode, cathode, and electrolyte) is established in order to clearly describe LiBs aging in real EV use.
The remainder of this paper is structured as follows: in Section 2, we will introduce the LiBs chemistries used in EV applications. Section 3 will describe in detail the battery operation modes in EV application. Section 4 will present the LiBs degradation in EV applications. Section 5 will discuss the aging mechanisms of LiBs, which are caused by the EV operation, and Section 6 provides concluding remarks.
2. LiBs in EV Applications
2.1. Electric Vehicle Applications
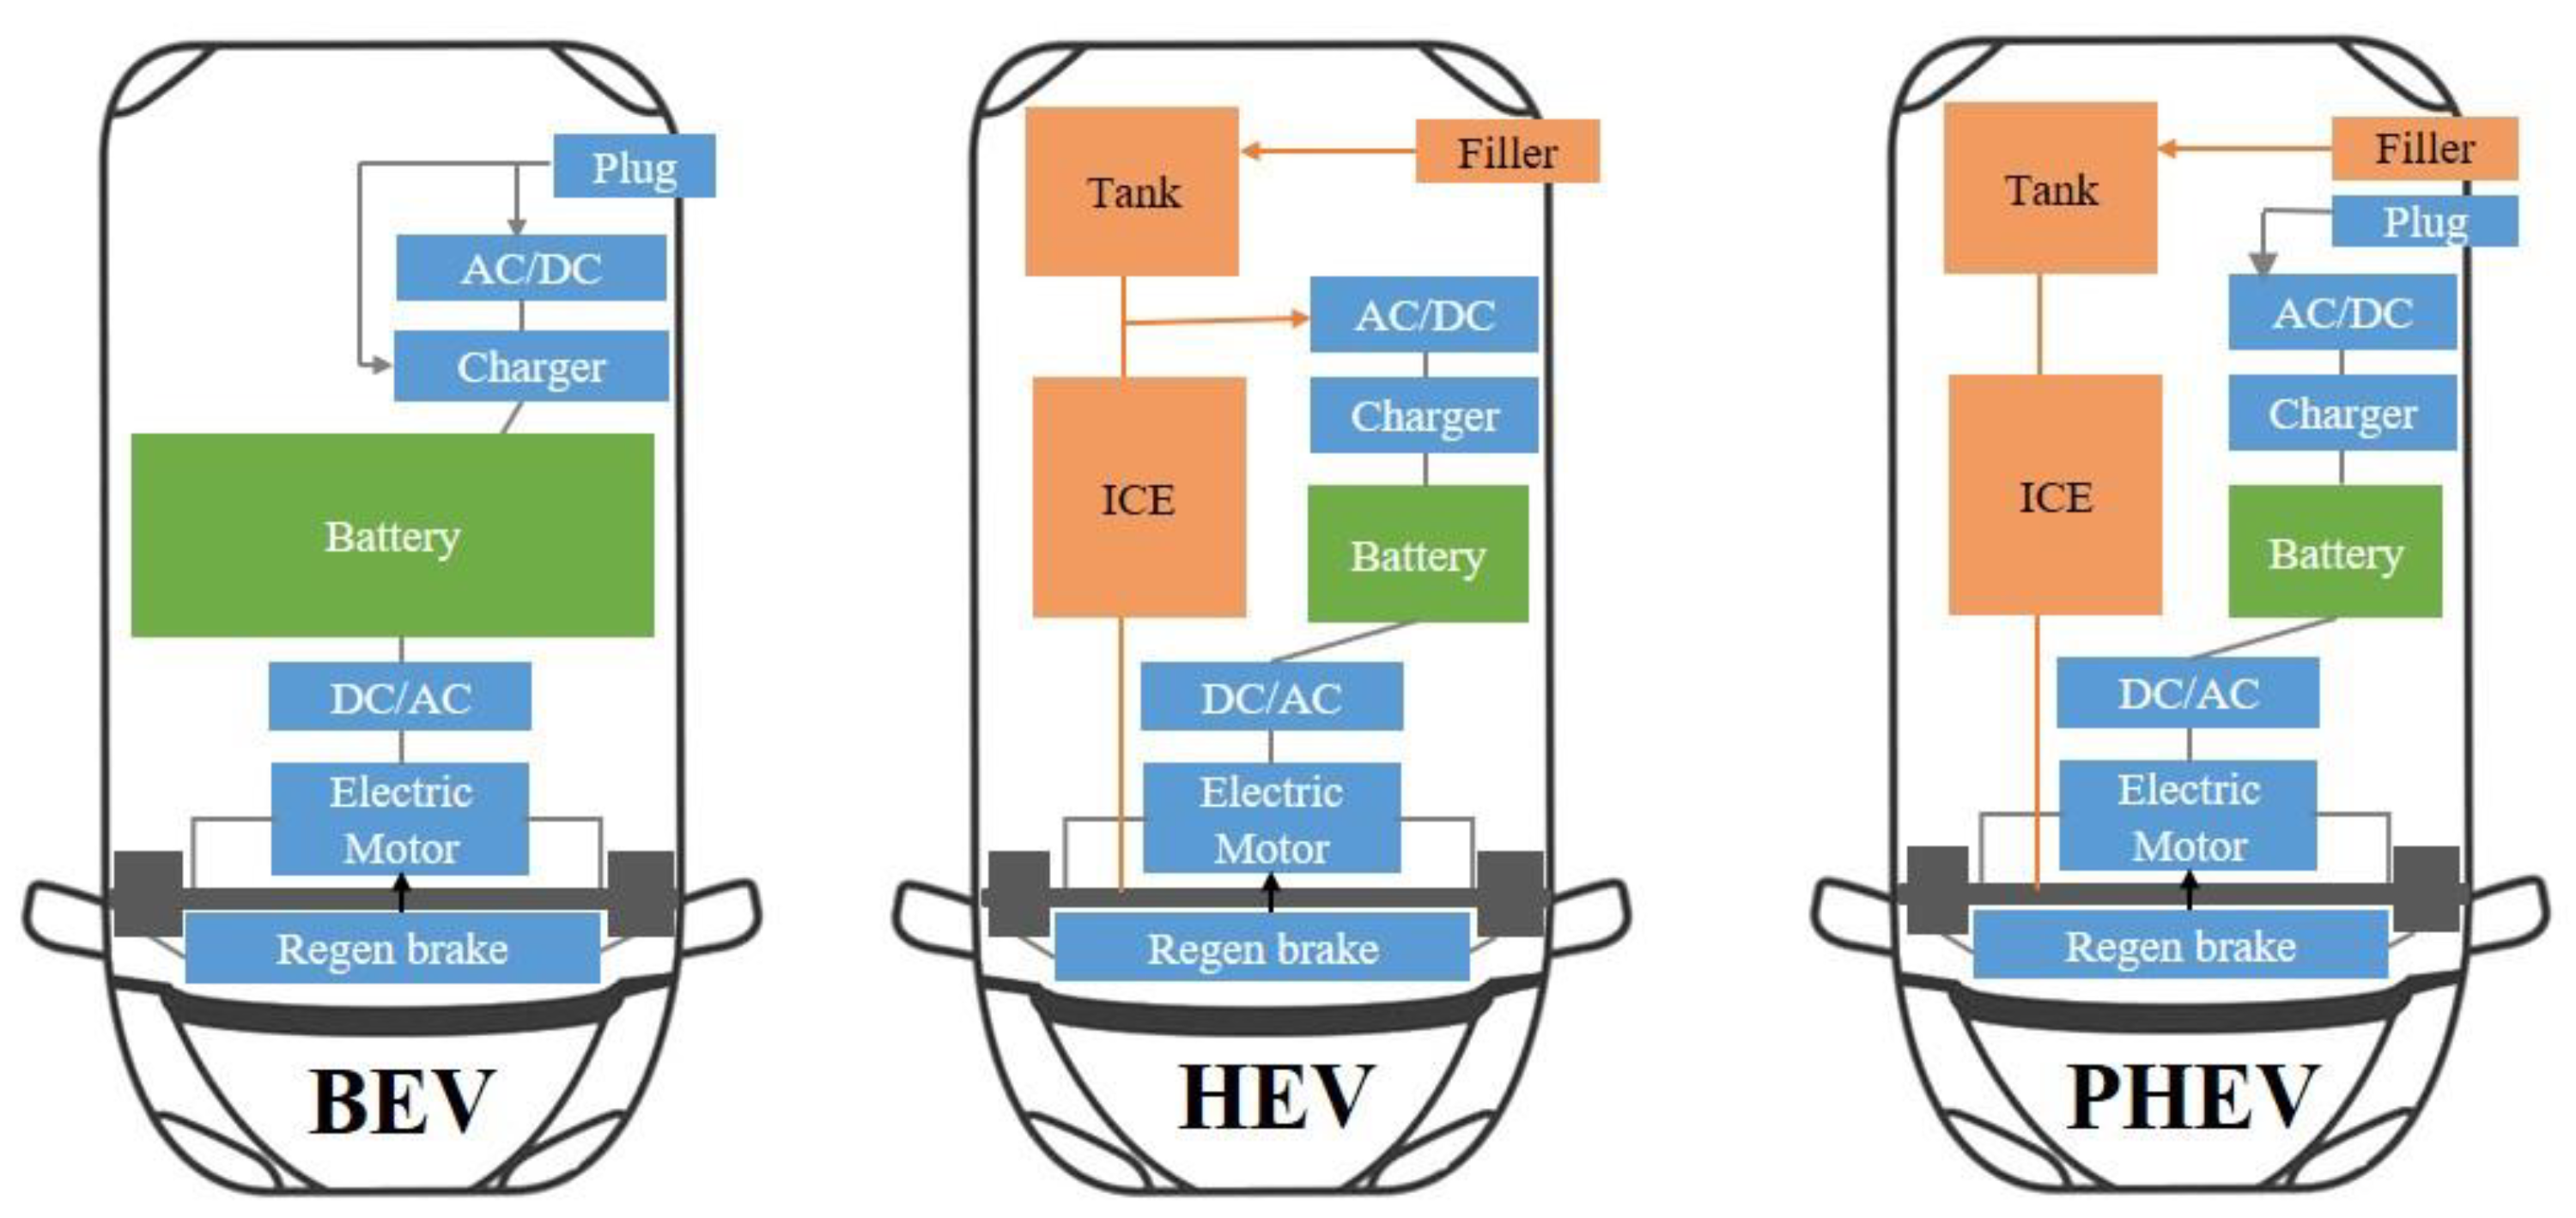
Depending on the primary source of energy, EVs can be classified mainly into the following three types: Battery Electric Vehicles (BEV), Hybrid Electric Vehicles (HEV) and Plug-In Hybrid Electric Vehicles (PHEV). The energy flow in these three types of EVs is presented in Figure 1.
BEVs are completely powered by electrical energy from batteries. The external energy is supplied only by plugging the BEV into the electricity grid for charging, and there is no on-board electricity generation. Depending on the EV manufacture, batteries powering BEV usually have a capacity between 20 kWh and 80 kWh, which ensure a range of up to 663 km [19,20]. Because the energy is supplied only by batteries, the BEV requires a larger battery pack size and capacity than other EVs.
HEVs are the most commonly used EV technology, combining an internal combustion engine (ICE) and an electric motor. In their powertrain, fossil fuel is the only external energy powering the ICE, and the energy for charging the battery is obtained from the braking process. The electric motor is used to power the vehicle for a short distance or to support the main engine (e.g., at a stoplight) [21]. Thus, HEVs require the lowest battery capacity, which is between 1.3 kWh and 1.6 kWh [19]. No charging plug for connection to the electricity grid exists in HEVs, which is usually considered to be a fuel-efficiency measure. Therefore, the battery capacity and size requirements are relatively low.
The powertrain of PHEVs is similar to the one of HEVs, and consists of an ICE and an electric engine; however, the main difference is that the PHEV can be plugged into an external source (e.g., EV charger) for charging. Furthermore, the HEV battery can also be charged throughout the regenerative braking processes. PHEVs have batteries with a larger capacity than HEVs, and, thus, they can extend the driving mileage when using electricity alone. Traditionally, this type of vehicle is powered by 50% gasoline and 50% electricity. The size of the battery capacity for PHEV applications is usually between 4.5 kWh and 10 kWh [22].
2.2. Lithium-Ion Chemistries in EV Applications
There is a growing demand for commercial LiBs with a high energy density for powering EVs. The energy density is mainly determined by the operating voltage of the active battery materials and their specific capacity. There are many types of LiBs with wide application prospects, such as spinel LMO/LNMO cathode [26], olivine LFP cathode [27,28], and layered NMC/NCA [29]. Among them, the group of Ni-rich layered oxides (LiNi1−xMxO2, M = Co, Mn, and Al) have both higher gravimetric and volumetric specific capacities than other intercalation-type cathode materials [30]. Moreover, the high working voltage of LiNi1−xMxO2 meets the withstand voltage of the current electrolytes. Therefore, the NMC and NCA are widely used in current EV models [31]. More details of NMC and NCA-based batteries will be discussed in the following sections.
The performance of these Ni-rich cathode materials is greatly influenced by the properties of the used elements (i.e., Ni, Co, and Mn orAl). The capacity of the batteries is mainly provided by Ni; however, the use of Ni also leads to a poor cycle life and thermal stability. On the other hand, Mn and Al offer an improved cycle life and safety. Furthermore, Co contributes to the electronic conductivity, ensuring a lower resistance. The LiNixCoyMnzO2 (x = 1/3, 0.5, 0.6, 0.7, and 0.8) materials with high energy density, long cycle life, and excellent thermal stability have attracted much attention [32]. With the increasing of Ni content, the specific discharge capacity and total residual lithium also increase, but the corresponding capacity retention and safety characteristics gradually decrease [32,33]. However, this does not hinder its large-scale application in real life, due to the high reversible capacity, discharge working voltage, and relatively low costs for Ni-rich materials [34]. Among them, researchers replace the Mn element of LiNixCoyMnzO2 with certain amounts of Al element [35]. The prepared LiNi0.8Co0.15Al0.05O2 shows better thermal stability and cyclability than NMC cathodes [36].
The anode is used to store Li+ in the charging process. The traditional anode raw material is graphite (LiC6) with a capacity of 372 mAh/g. In addition, lithium titanate (LTO) with an operating voltage of around 1.55 V (vs. Li+/Li) has been considered for various vehicle applications. It enables the LTO to avoid self-discharge when working as an anode and thus enhances its safety and stability [37]. A brief comparative analysis of these chemistries is presented in Table 3 [30].
3. Battery Operation in EV Application
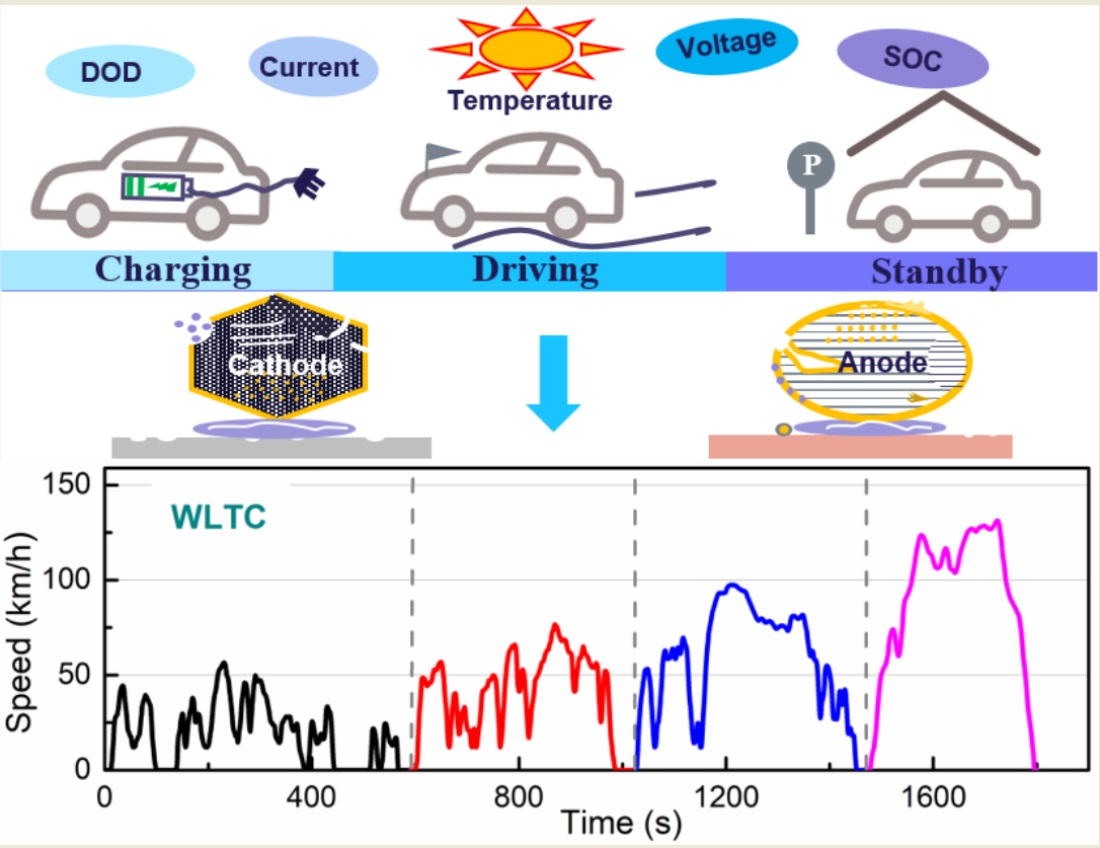
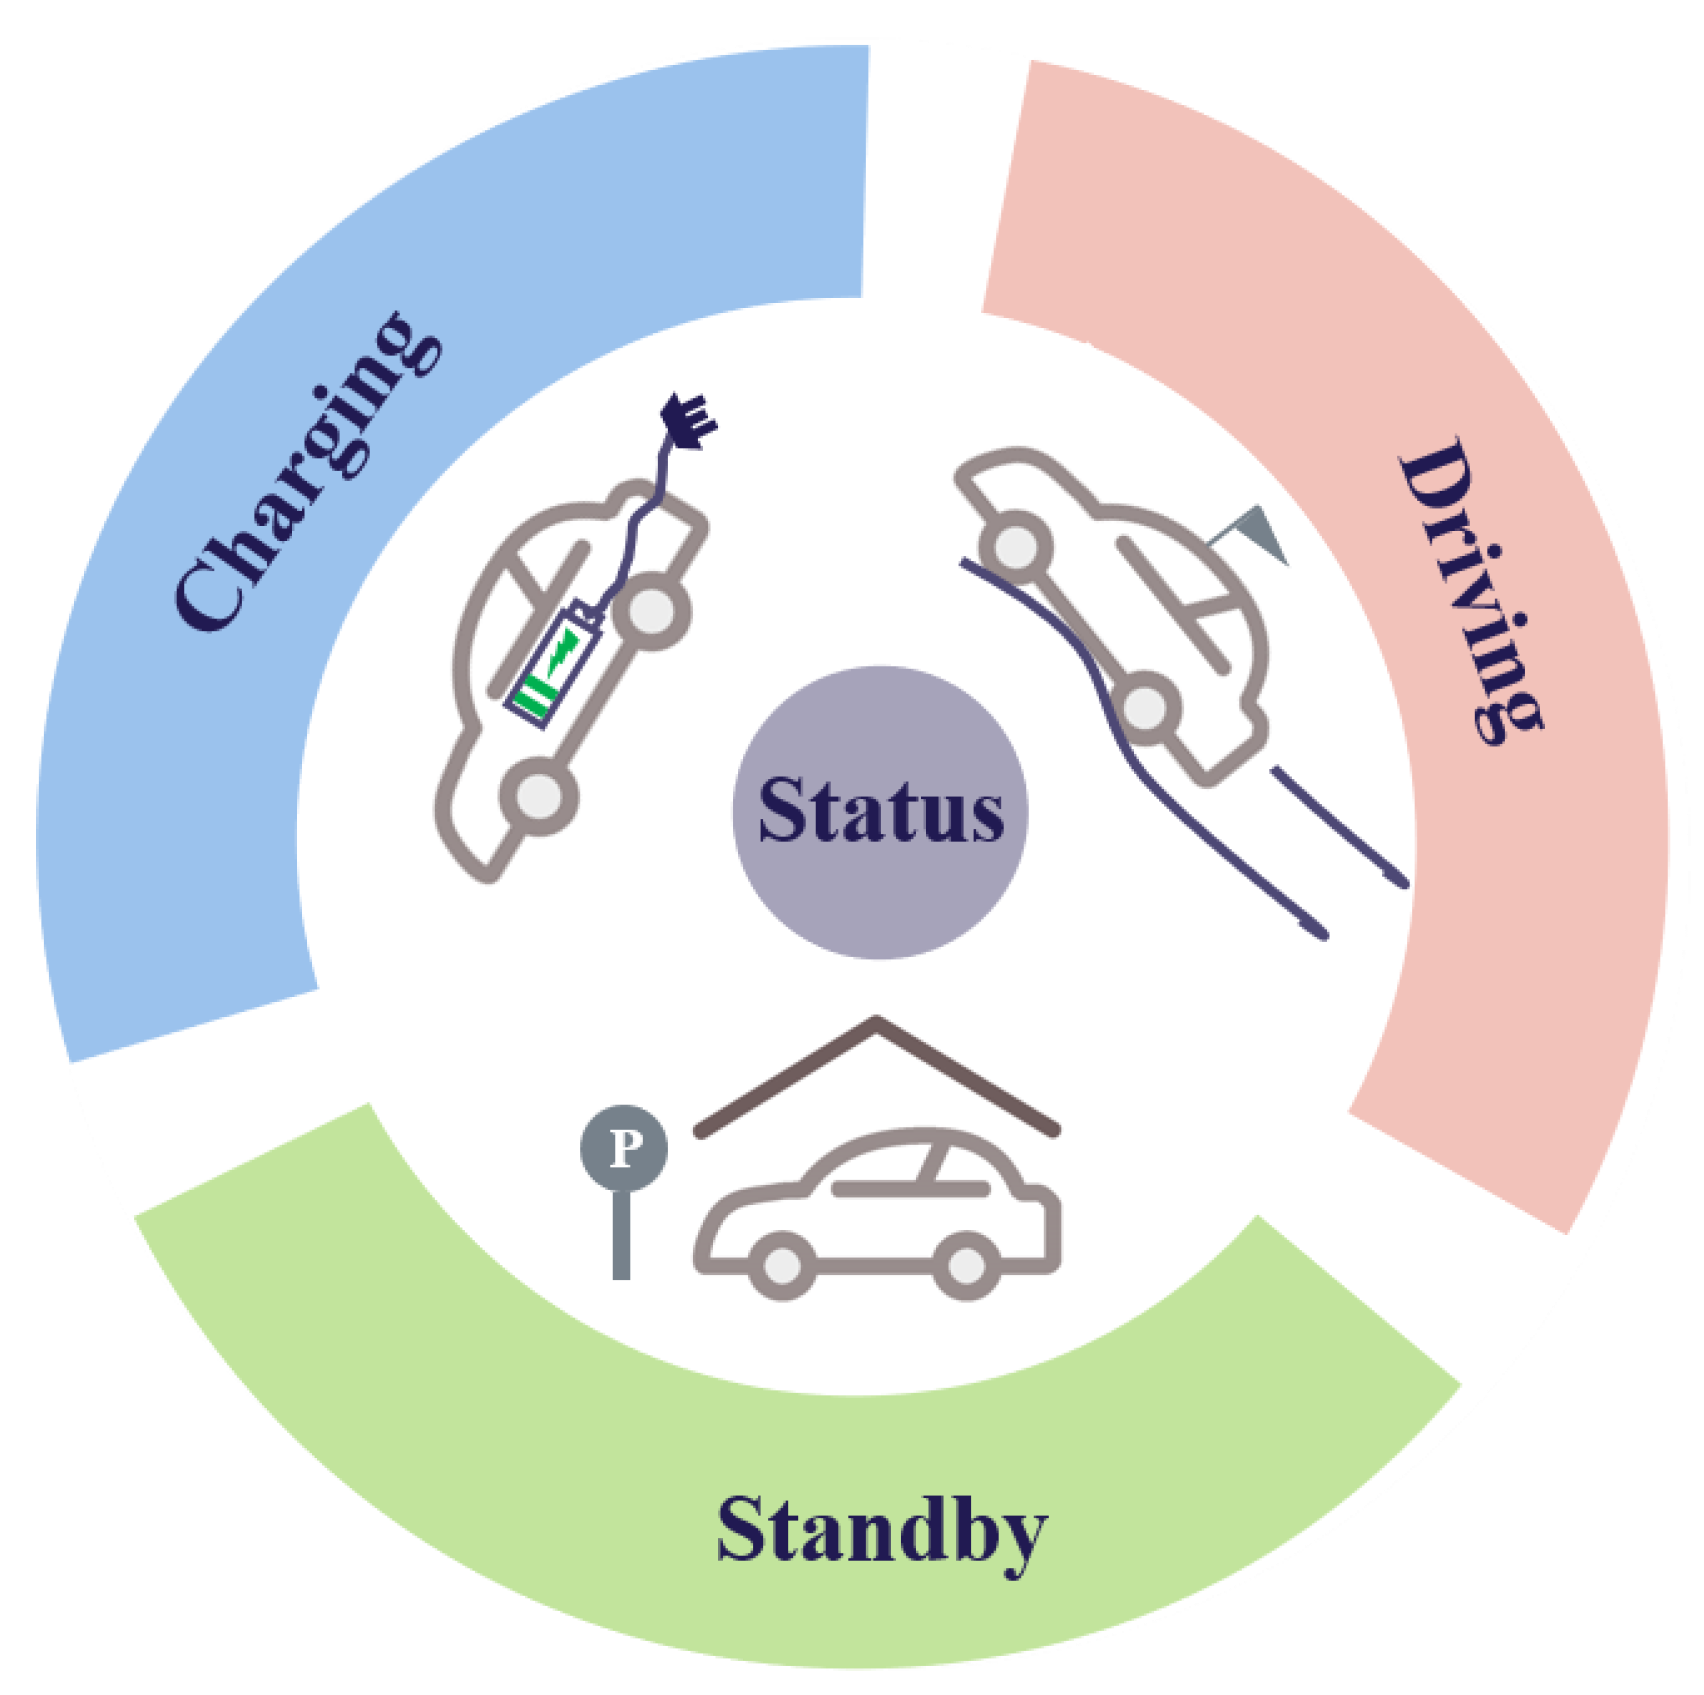
The battery in EV applications is complex and diverse, as well as in the influence of various factors. It not only depends on driving habits, but also will be affected by environmental factors, such as the temperature, which varies from season-to-season and region-to-region. The load of the vehicle, driving frequency and mileage, charging habits and road conditions are different for different drivers, which puts the battery in a different situation. Therefore, it is very difficult to standardize the battery operation in EV applications and even more difficult to estimate its state-of-health. However, the factors (e.g., driving habits, road conditions, load of the vehicles and so on) mainly affect battery aging during driving. As a result, according to the battery working state, we can divide the battery usage status into three independent processes (charging process, driving, and standby) and study them separately, as illustrated in Figure 3.
3.1. EV Battery Charging
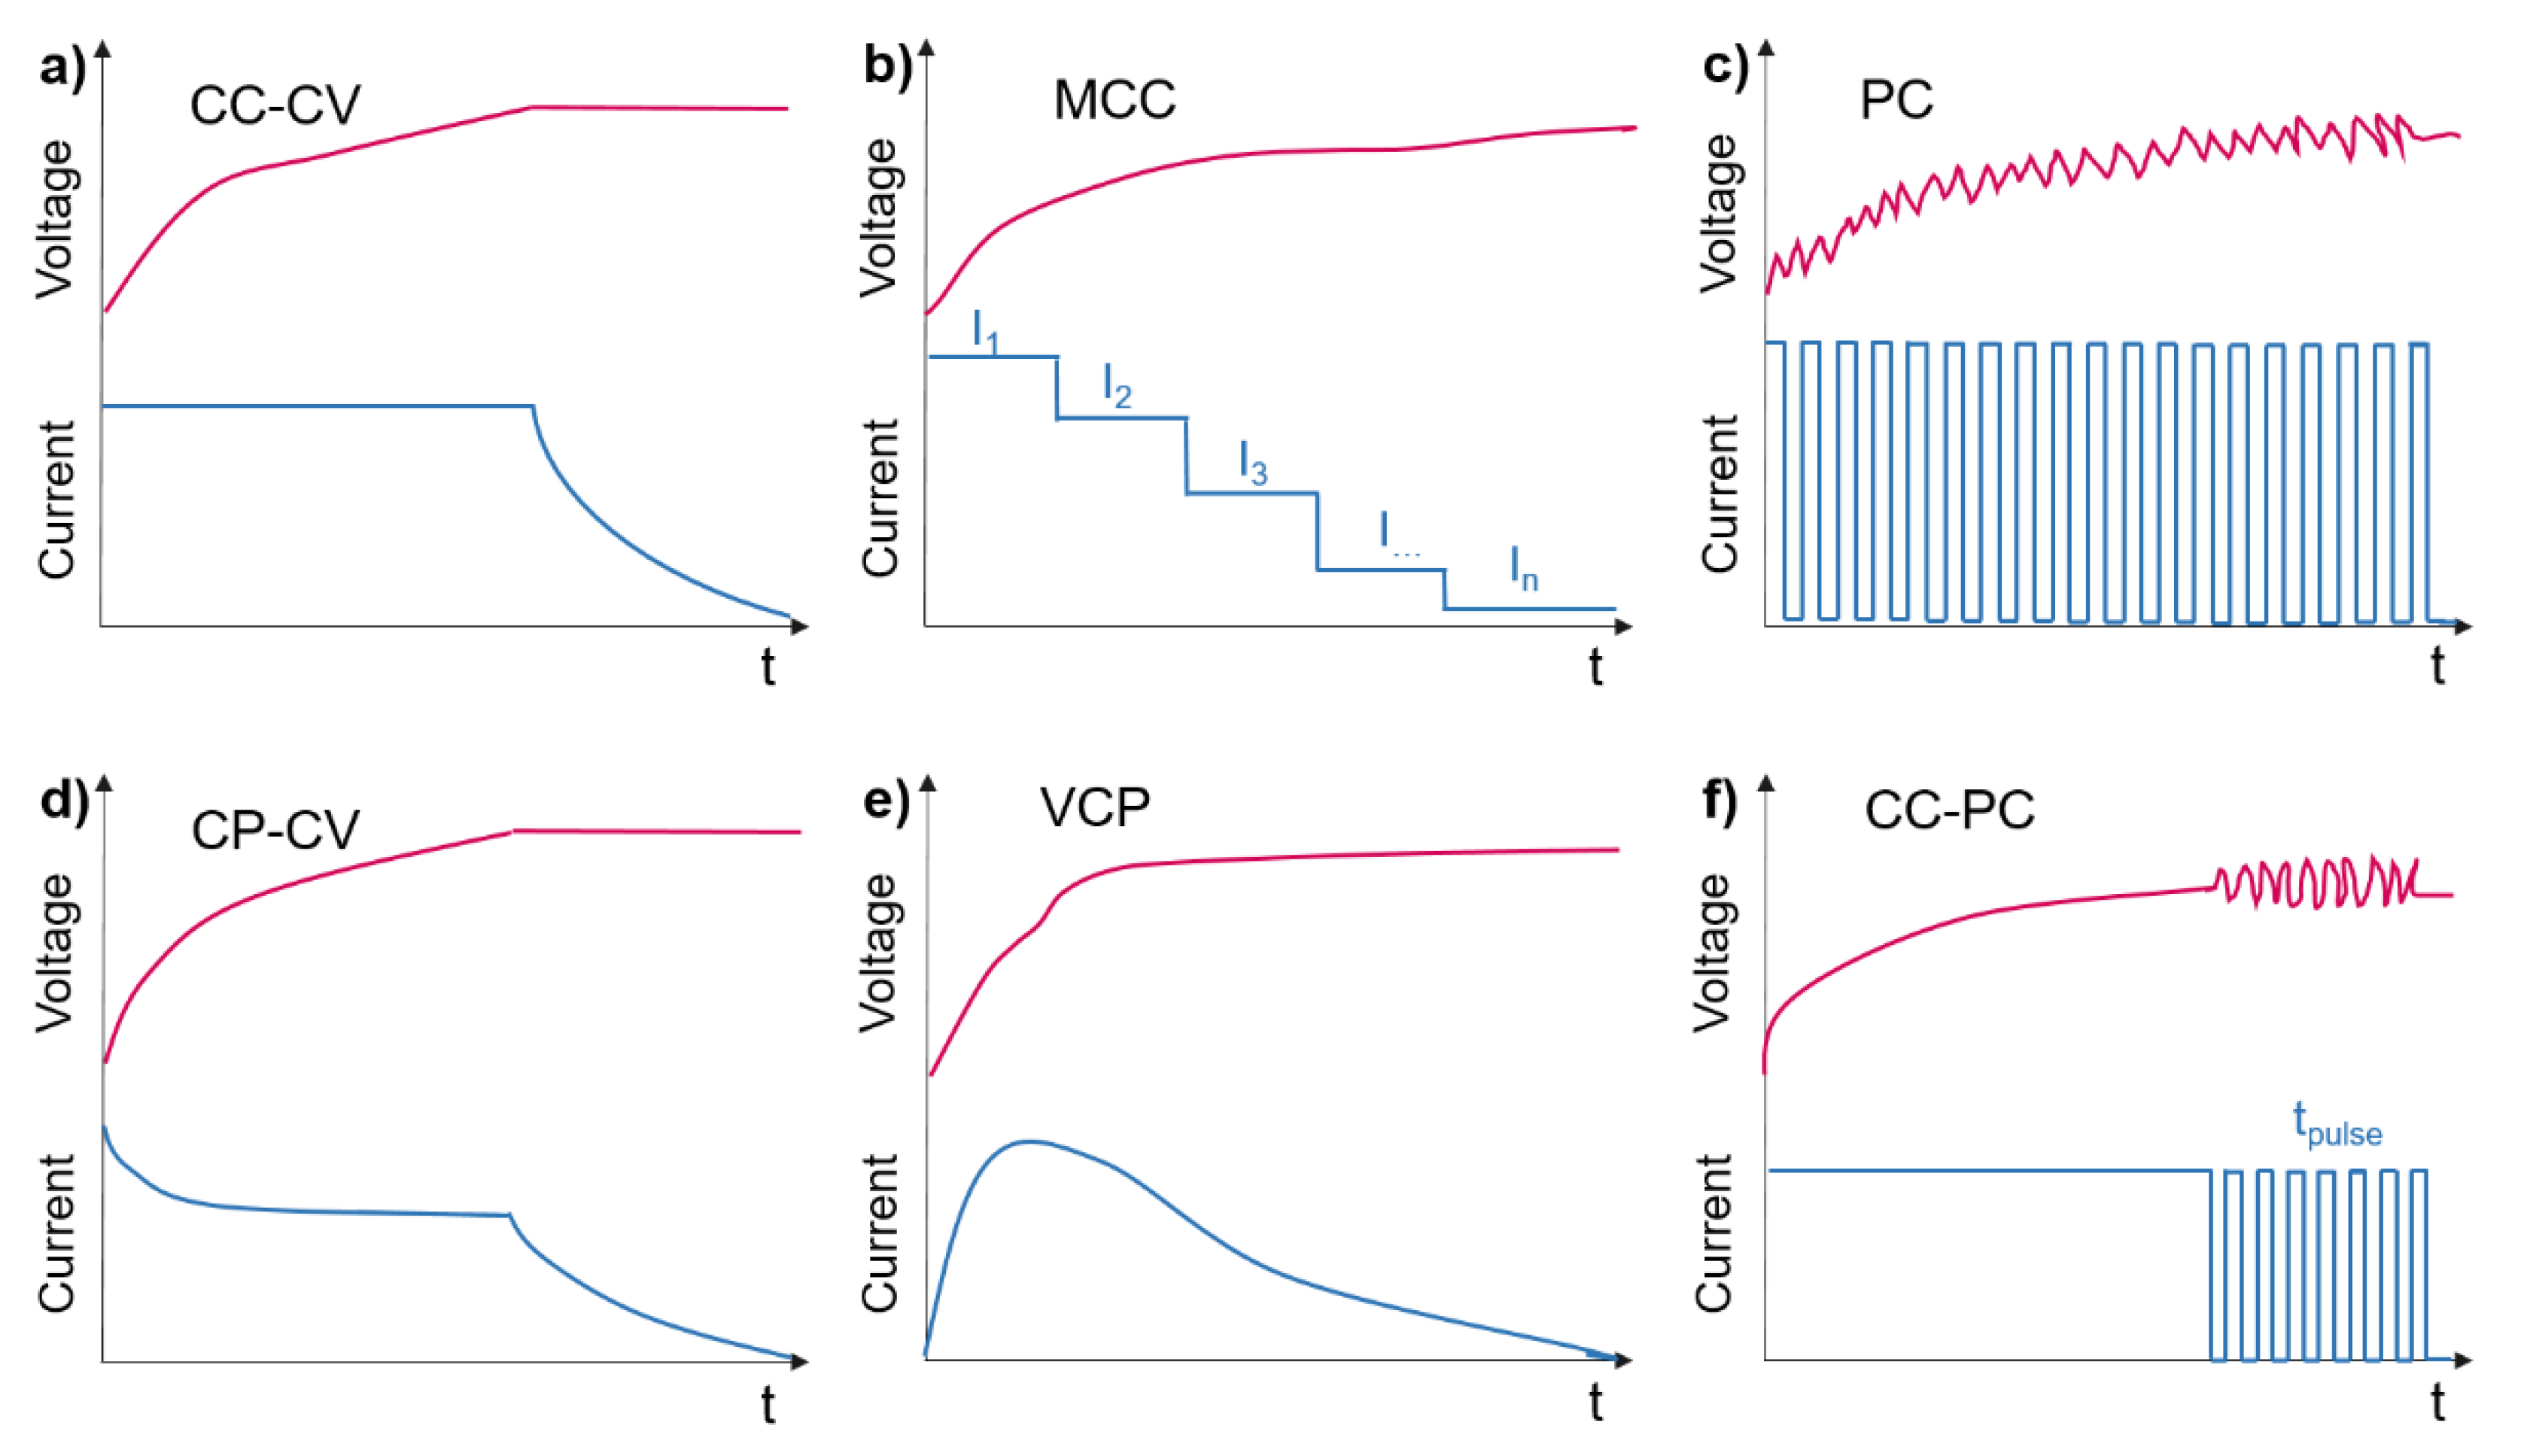
The most used protocol for charging LiB is a constant current constant voltage (CC-CV), which consists of a constant current charging phase during which the battery voltage increases up to the cut-off value, followed by a constant voltage phase until the current falls to near-zero, as shown in Figure 4a. The battery charging protocol is closely related to the daily usage of the EV and to the battery’s SOH, which will be reflected in the charging time. In order to reduce the charging time and negative effect on the battery from high currents, several alternative charging protocols are proposed in the literature, which are: Multistage Constant Current (MCC) charging, Pulse Charging (PC), Constant Power Constant Voltage (CP-CV), Variable Current Profile (VCP) and Constant Current Pulsed Charging (CC-PC) [38,39,40,41].
To achieve fast charging and slow down the battery’s aging process, researchers proposed the Multistage Constant Current (MCC) protocol as one of the earliest charging types. This method sets different current levels during the charging process, as illustrated in Figure 4b, in order to minimize battery degradation. This is a very promising charging method, but the optimal value and duration of the current level need to be further researched [42]. To reduce the concentration polarization and mechanical stresses, charging is periodically interrupted by short rest periods (as presented in Figure 4c) or discharge pulses in the pulse charging protocols [41]. In [38], the authors found that the cycle life is similar to the battery when charged by CC-CV method; nevertheless, according to the results presented in [41], there is no overall agreement regarding the positive and/or negative effects on battery performance and lifetime of the pulsed charging methods. Besides, this charging method is complex, and also involves many factors to consider, such as pulsed current amplitude, its duty cycle, and pulse frequency, hindering its large-scale application [43]. The CP-CV protocol provides a low-current near the end of charging to alleviate metallic lithium plating at the anode (Figure 4d). However, as presented in [44], a fast capacity fading can be observed from a 0.5 C CP-CV charging, which is caused by high polarization in the initial CP-charging. Furthermore, some complex variable current profiles have been used for battery charging (Figure 4e). Sikha et al. designed, in [45], a varying current profile (VCP) protocol, which is less damaging than the pure CV charging in the early cycles. However, this profile, too, resulted in a significant capacity degradation compared to that of CC-CV with the same mean current. Another battery charging protocol is the CC-PC charging protocol which combines a constant current and pulsed charging (Figure 4f). The application cost of the charging protocol is relatively low, avoiding voltage control and variable charging currents [40]. But, it can deteriorate the cycle life due to pulses leading to an exceedance voltage in the high voltage period [38].
At present, the standardized CC-CV protocol is widely applied in real-life applications (e.g., EVs), while the other presented charging protocols, developed based on an array of physical motivations which include plenty of advantages in some certain conditions (such as fast-charging), are mainly applied at the research stage or even at a reduced-scale in real life. Currently, the EVs are mainly charged by the CC-CV protocol. In the aging analysis section (Section 4 and Section 5), we mainly discuss the aging mechanisms which are caused by the CC-CV charging protocols.
3.2. EV Driving Operation
3.2.1. Real-Life Scenarios
The driving profiles of EVs in real life are diverse. They mainly depend on the vehicle design, the behavior of the driver, and the external environment, resulting in difference in service life and health status. Generally, the vehicle design considers multiple factors in order to meet the needs of different consumers, including the overall dimensions, passenger capacity, tire type and shape, specific front area, and body type [46]. This will make the EVs operate differently in different situations, and lead to different energy demands. In addition, the battery pack sizing and output power are also different. Driver behavior is also related to different traffic conditions. Furthermore, the external environment conditions (e.g., mainly ambient temperature, but also precipitation, wind, etc.) also have an important effect on the battery loading and, subsequently, on the range of the EV. All of these factors make EV driving very diverse. Therefore, it is difficult to study, analyze, and propose a unified set of aging mechanisms for batteries operated in EVs using real-life data. There is limited available literature regarding battery usage harvested from real-life operations. For example, Jafari et al. analyzed, in [47], the real-world daily driving undertaken by a fleet of connected vehicles. The data set contains the records of the connected vehicles volunteered by drivers using their vehicles in the US. The data from 50 driving cycles of 50 drivers were used to evaluate EV driving during an entire year.
In order to simulate the driving conditions of the EVs and evaluate the degradation behavior of the batteries, researchers developed a series of driving cycle profiles based on extensive real-life data, which fully considers various factors (e.g., driving habits, road conditions, load of the vehicles, vehicles type, weather, and so on). These standardized EV driving profiles are very convenient for laboratory battery testing and performance-degradation evaluation.
3.2.2. Driving Cycle Profiles
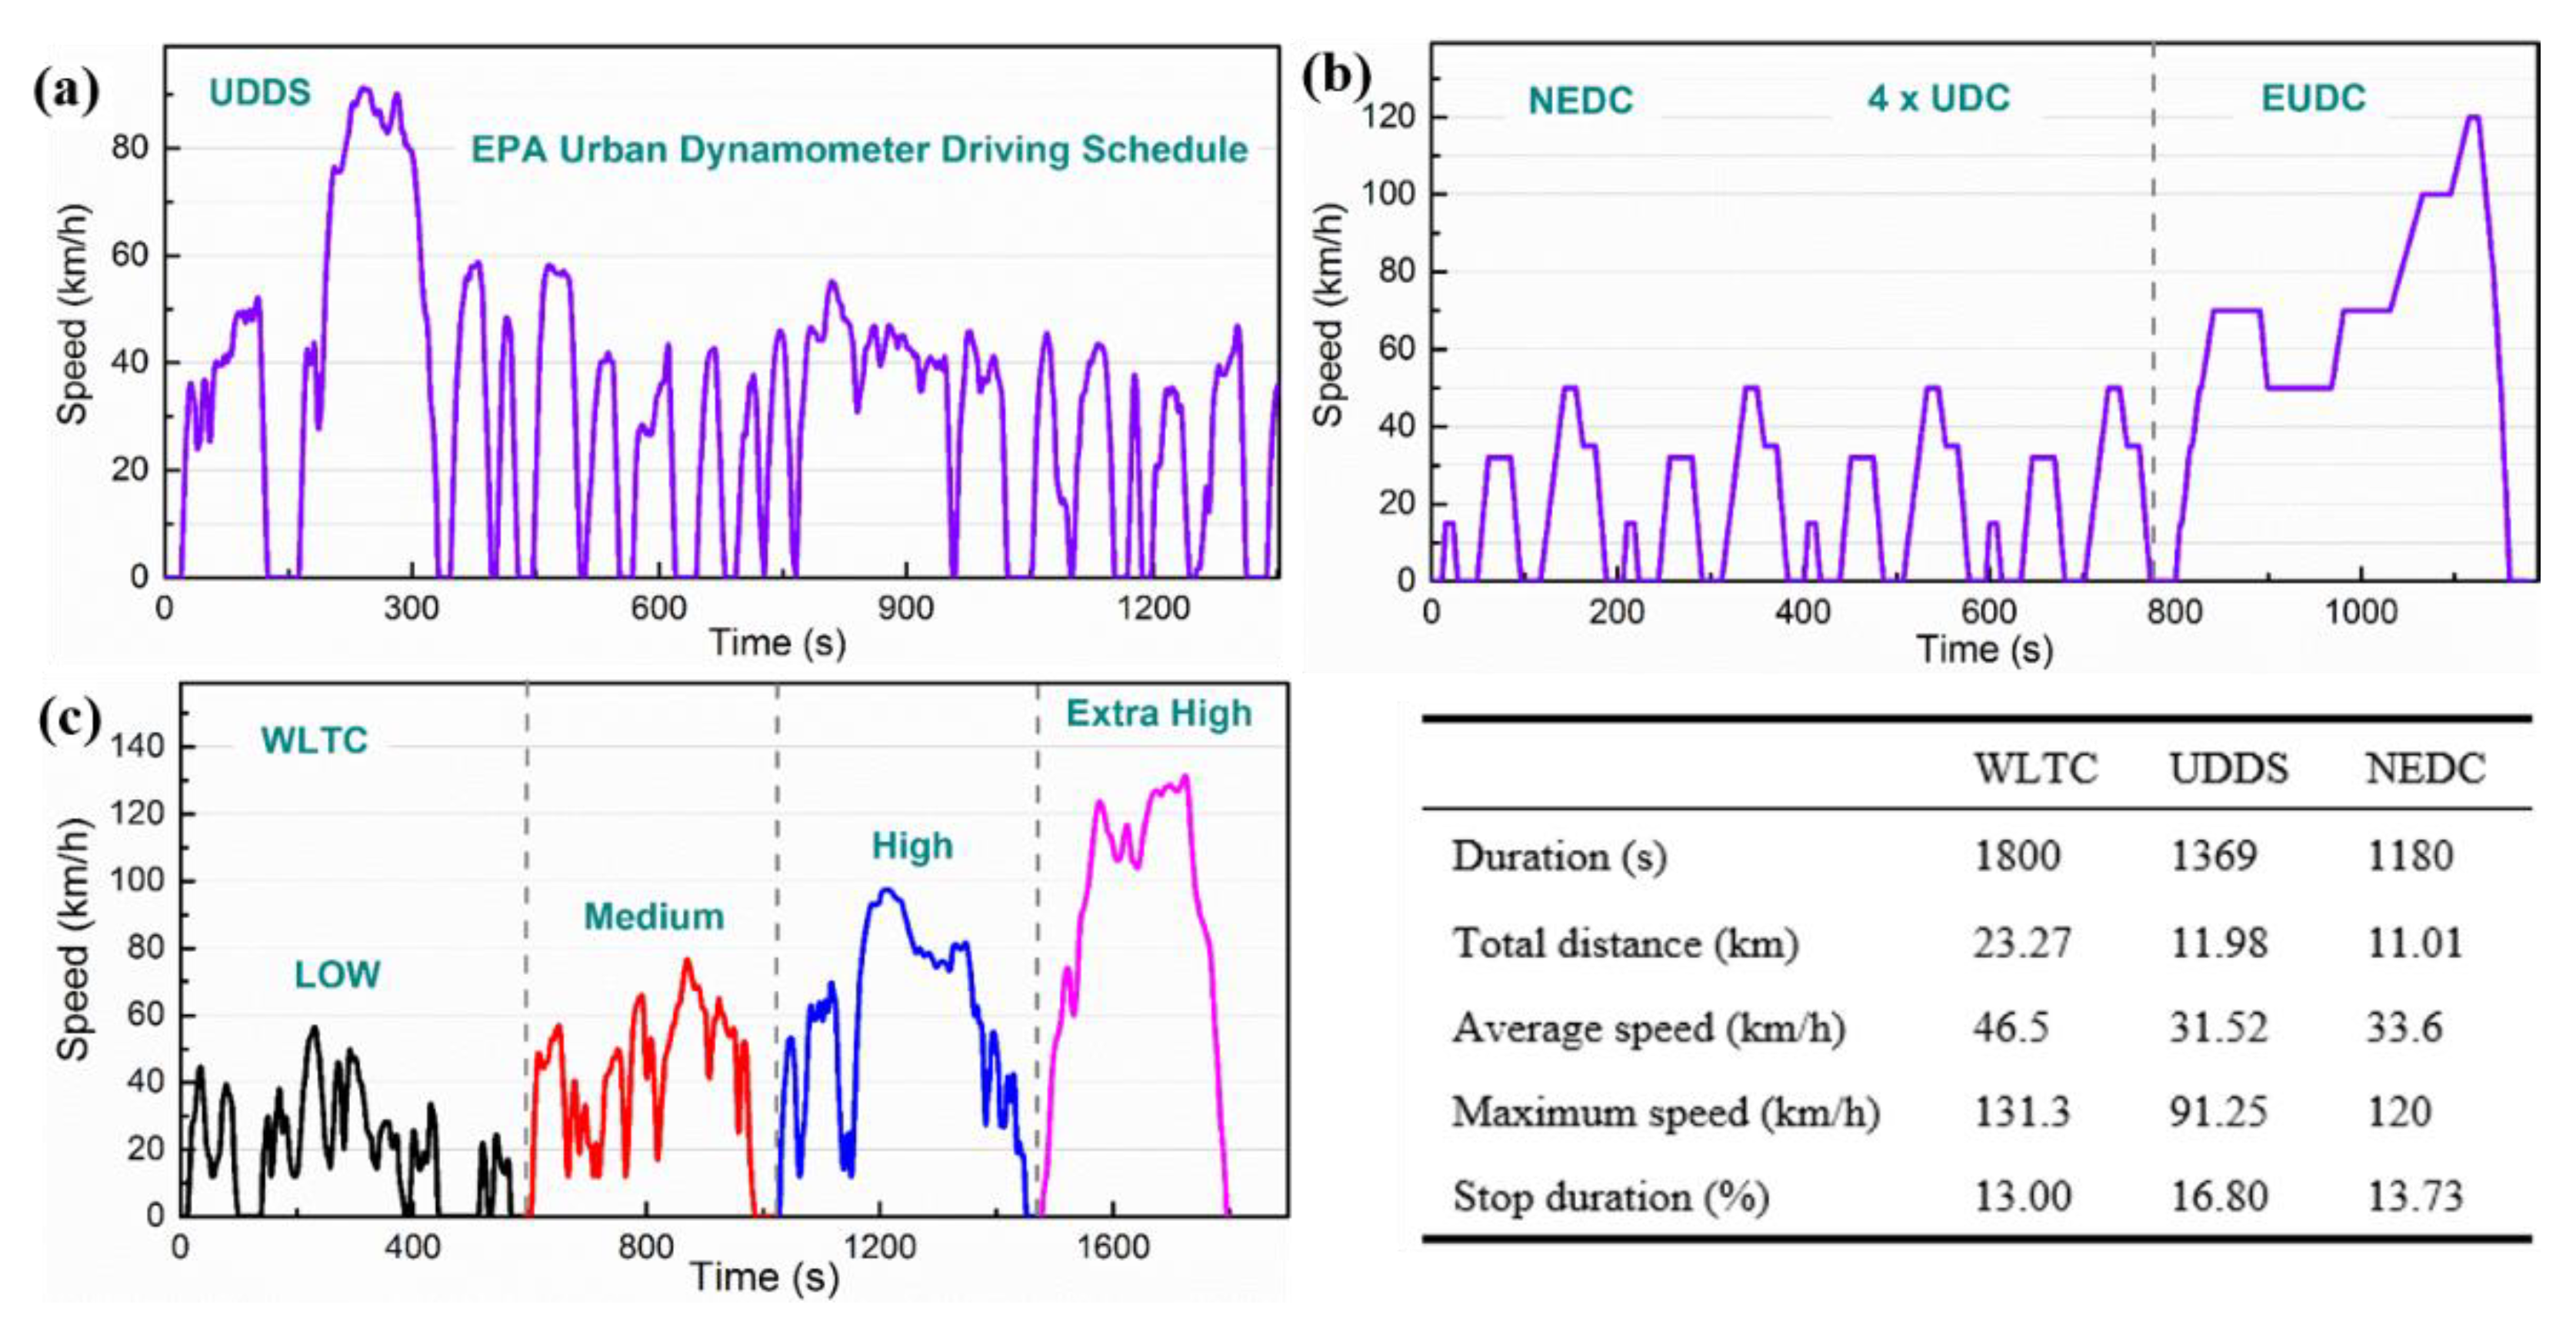
Many countries and organizations create their standard driving cycle based on their roads and environment, in order to assess the performance of EVs and their batteries [44]. The driving cycle consists of a series of repetitive sequences of vehicle operating modes that represent the driving models, as shown in Figure 5.
The EPA Urban Dynamometer Driving Schedule (UDDS), presented in Figure 5a, is commonly called the “LA4” or “the city test”; the UDDS represents city driving conditions and has been used as the standard driving cycle in United States since 1972 for light-duty vehicle testing. The New European Driving Cycle (NEDC) is also an early driving cycle that was introduced in 1996 and divided into two parts, as shown in Figure 5b. The first part simulates urban driving conditions which are repeated four times and the second part simulates extra-urban driving conditions with a high speed. With the regulation of EURO 6, which is the most recent emission standard for passenger cars imposed by the European Union Commission, the light-duty vehicles are tested with an updated standard driving cycle, the World Harmonized Light Vehicles Test Cycle (WLTC), which provides more dynamic driving behaviors [48]. WLTC was generated to define a globally harmonized standard for determining the levels of pollutants, energy consumption, and the electric range for light-duty driving, from approximately 765,000 km of data gathered in five different regions: EU, USA, India, Korea, and Japan. The “real world” driving data contains different road characteristics (urban, rural, and motorway) and driving conditions (peak, off-peak, weekend), covering a wide range of vehicle categories, various engines and manufacturers. This is similar to the different kinds of roads that are commonly travelled on, containing a low speed (L/ < 60 km/h), a medium (M/ < 80 km/h), a high speed (H/ < 110 km/h) and extra-high speed (Ex-H/ > 110 km/h), corresponding to the urban, rural and motorway classification, as shown in Figure 5c. Nowadays, more and more manufactures use WLTC to evaluate the performance of PHEV, HEV and BEV. In below table, a comparison of the aforementioned driving cycles is presented.
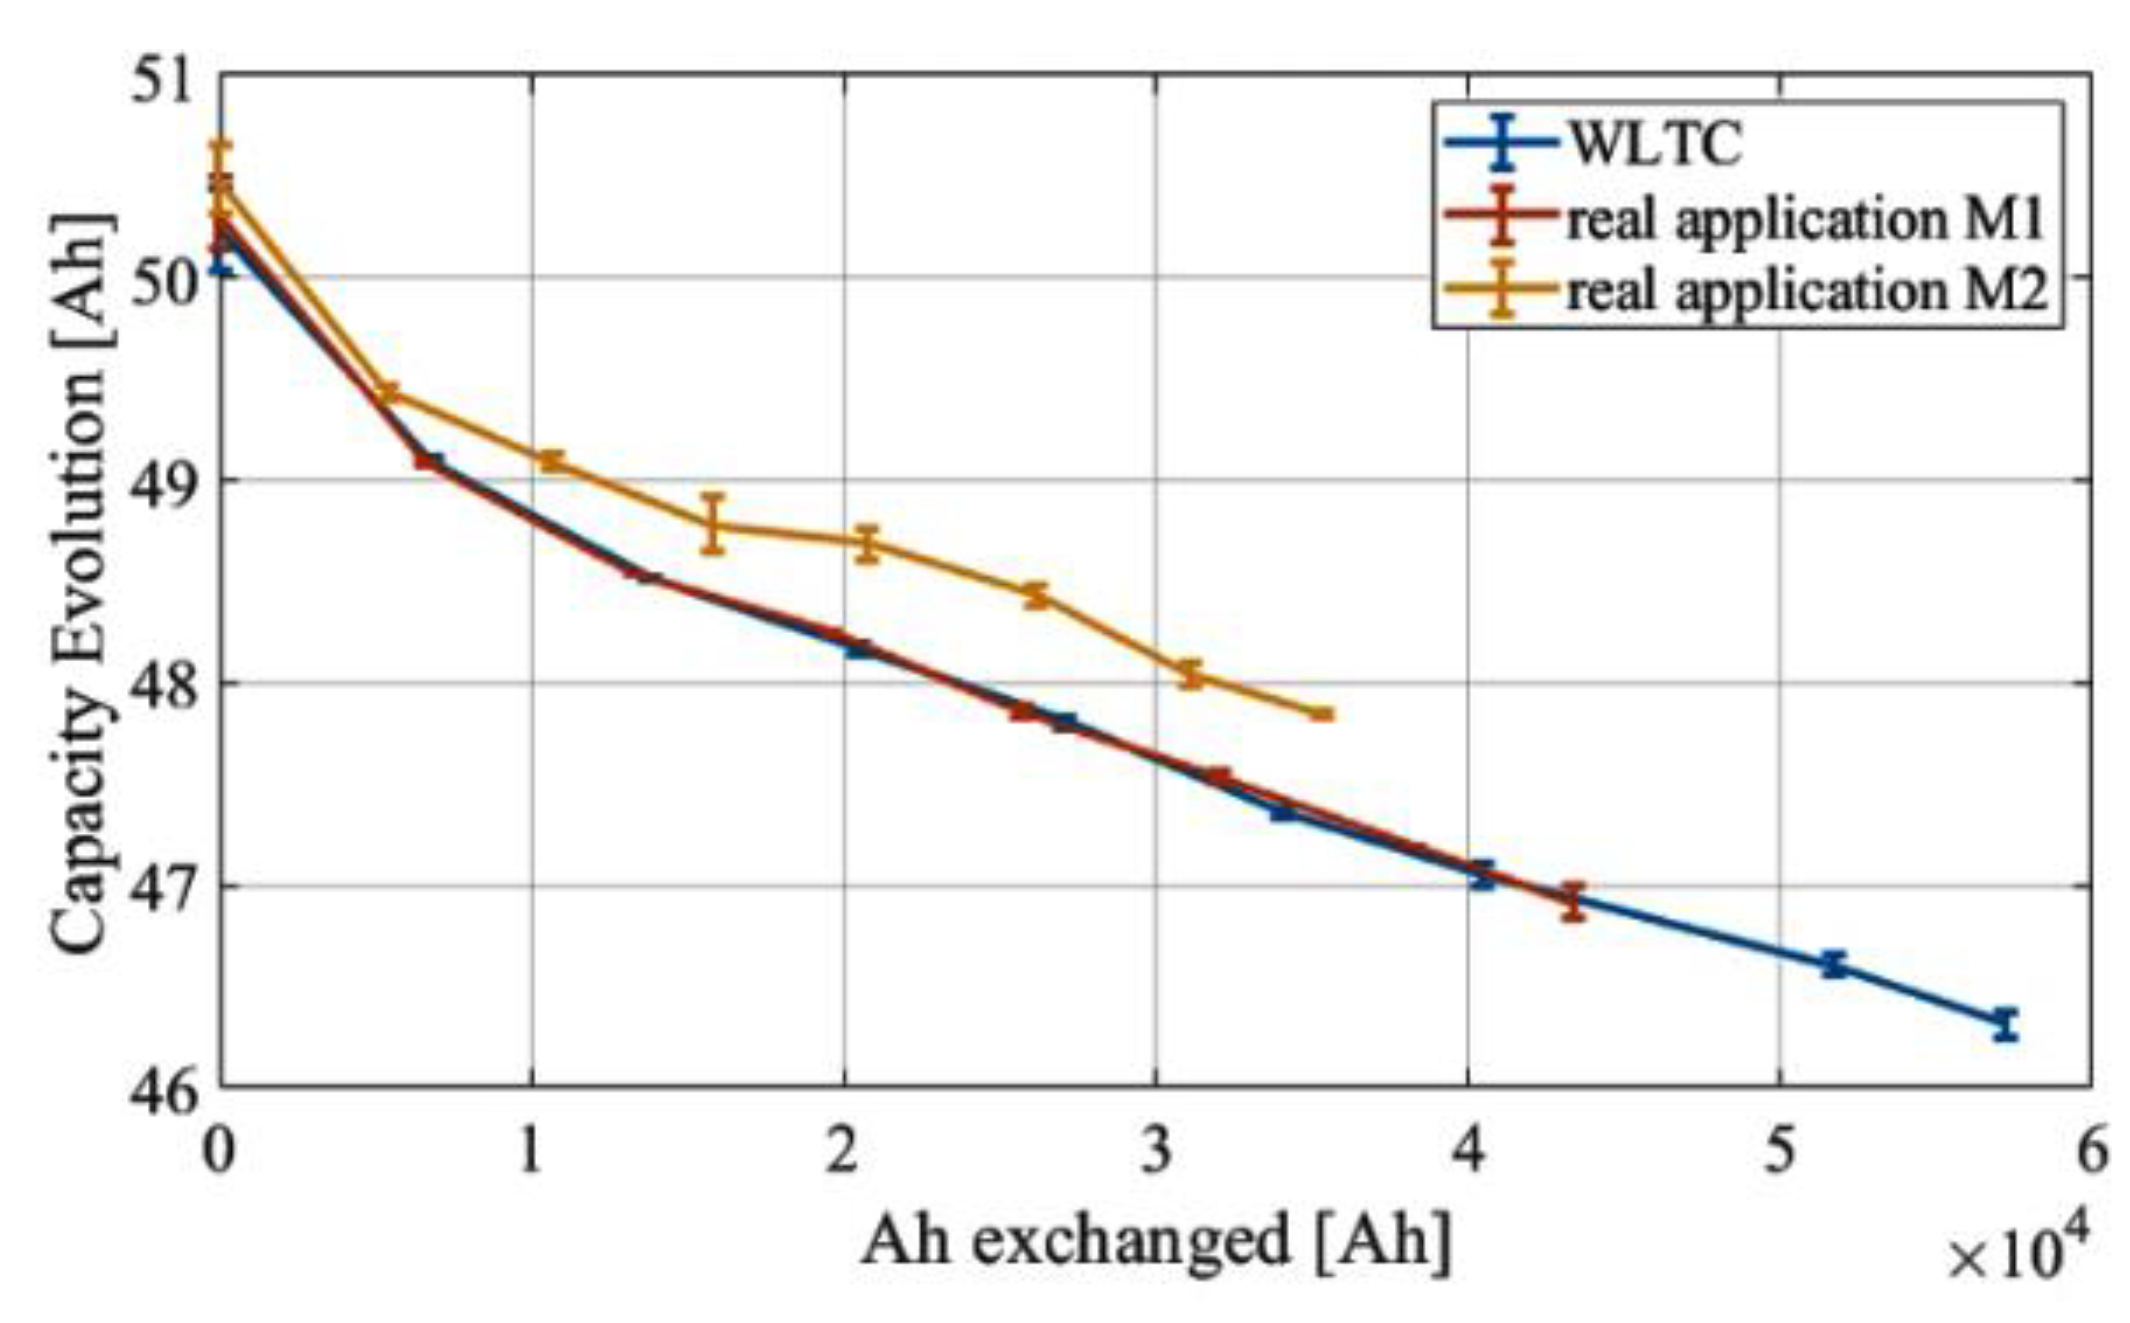
To prove the validity of the WLTC profile for EVs studies, Ben-Marzouk et al. [49] collected the real-life EV data for two years on ten EVs, and built synthetic profiles of the real application M1 and real application M2, as shown in Figure 6. These profiles are compared with the WLTC profile and they show great similarity in terms of aging, especially for the real application M1. These results validate the use of the WLTC profile in aging tests and aging studies of EV batteries.
3.3. EV Standby Operation
In EV applications, the standby state accounts for a large proportion of the entire battery service life. As presented in [50], the standby time can reach 90% of the total vehicle operation. This means that calendar aging cannot be ignored when assessing battery degradation and lifetime in such applications. In [51], Swierczynski et al. showed that more than 75% of capacity fade was caused by calendar aging during the EV operation. Thus, it is particularly important to study the calendar aging process and related factors, such as the state-of-charge (SOC) and temperature. In normal conditions, the calendar aging process is slow, and it takes several years or even tens of years for a battery to end its service life by calendaring only. In actual research, elevated temperature and/or high SOC levels are often used to accelerate battery aging.
4. Aging in EV Application
4.1. Aging in Charging
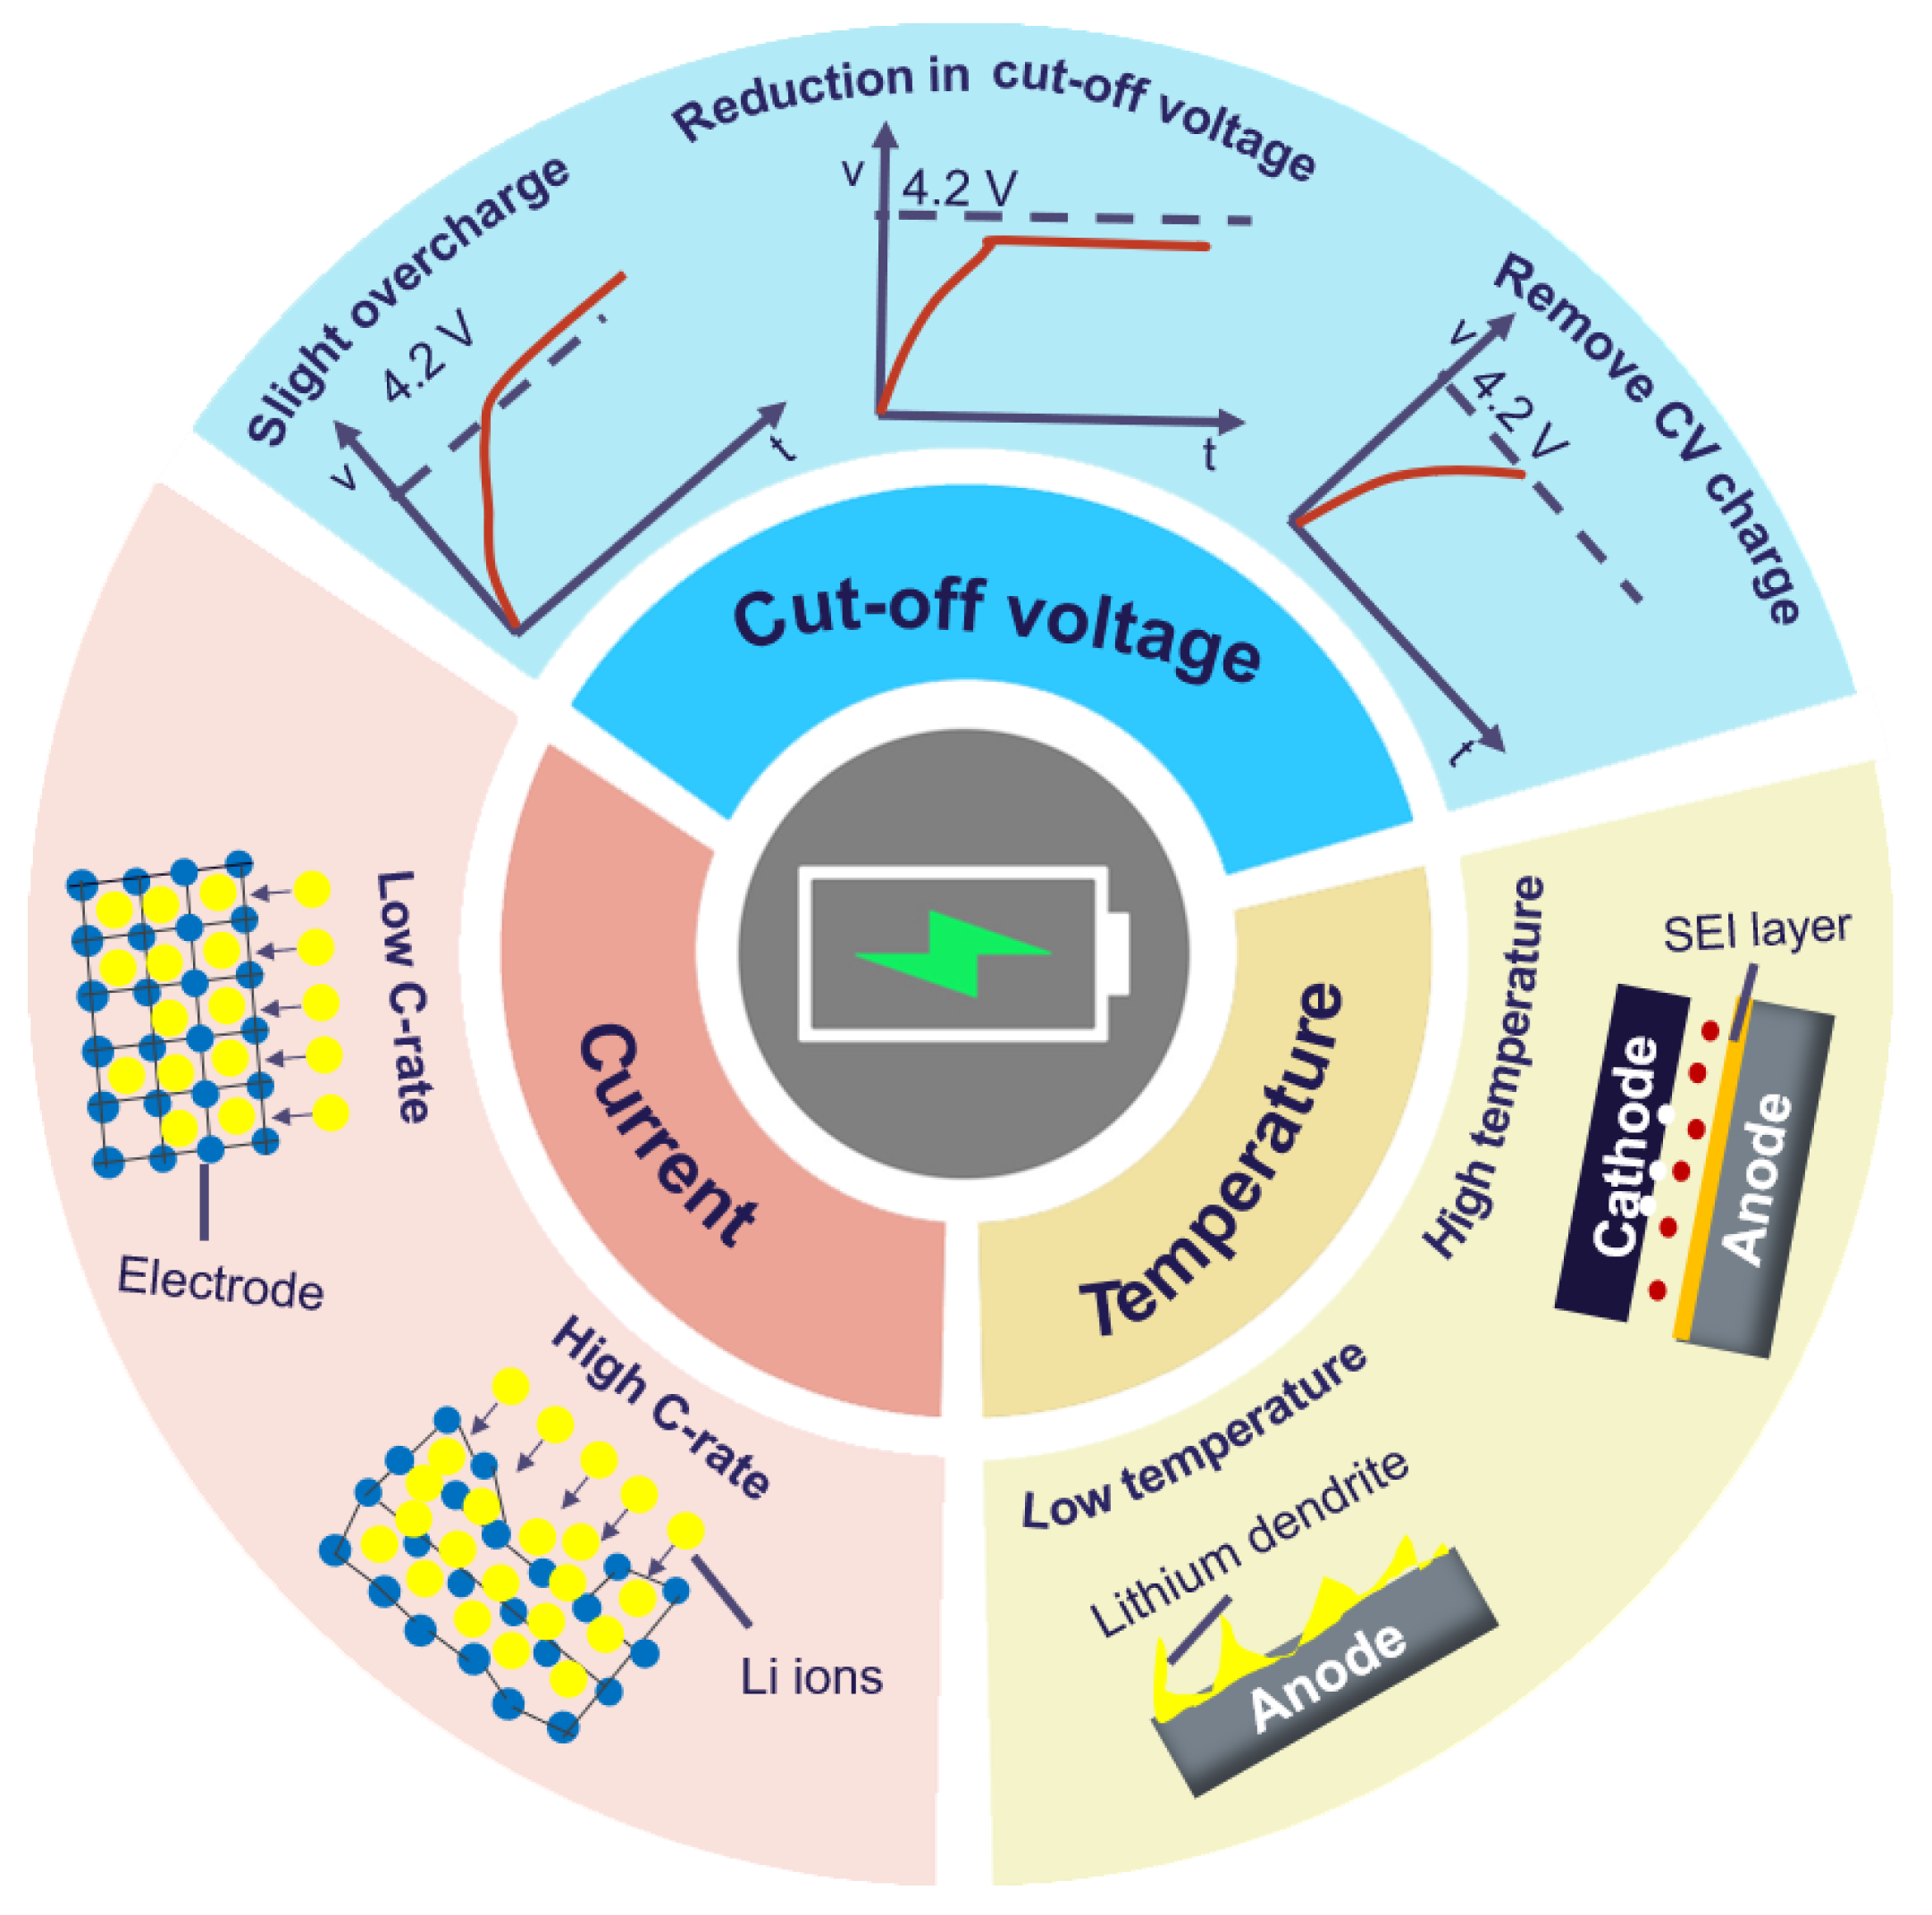
The LiBs aging in the charging process is related to many factors, such as the cut-off voltage, current rate, and temperature. Using a high cut-off voltage, more capacity can be charged and a high charging current can significantly shorten the charging period. However, in these cases, the degradation process of LiBs will be greatly accelerated. The most common factors affecting the charging process and their variations are shown in Figure 7.
4.1.1. Impact of Charging Voltage
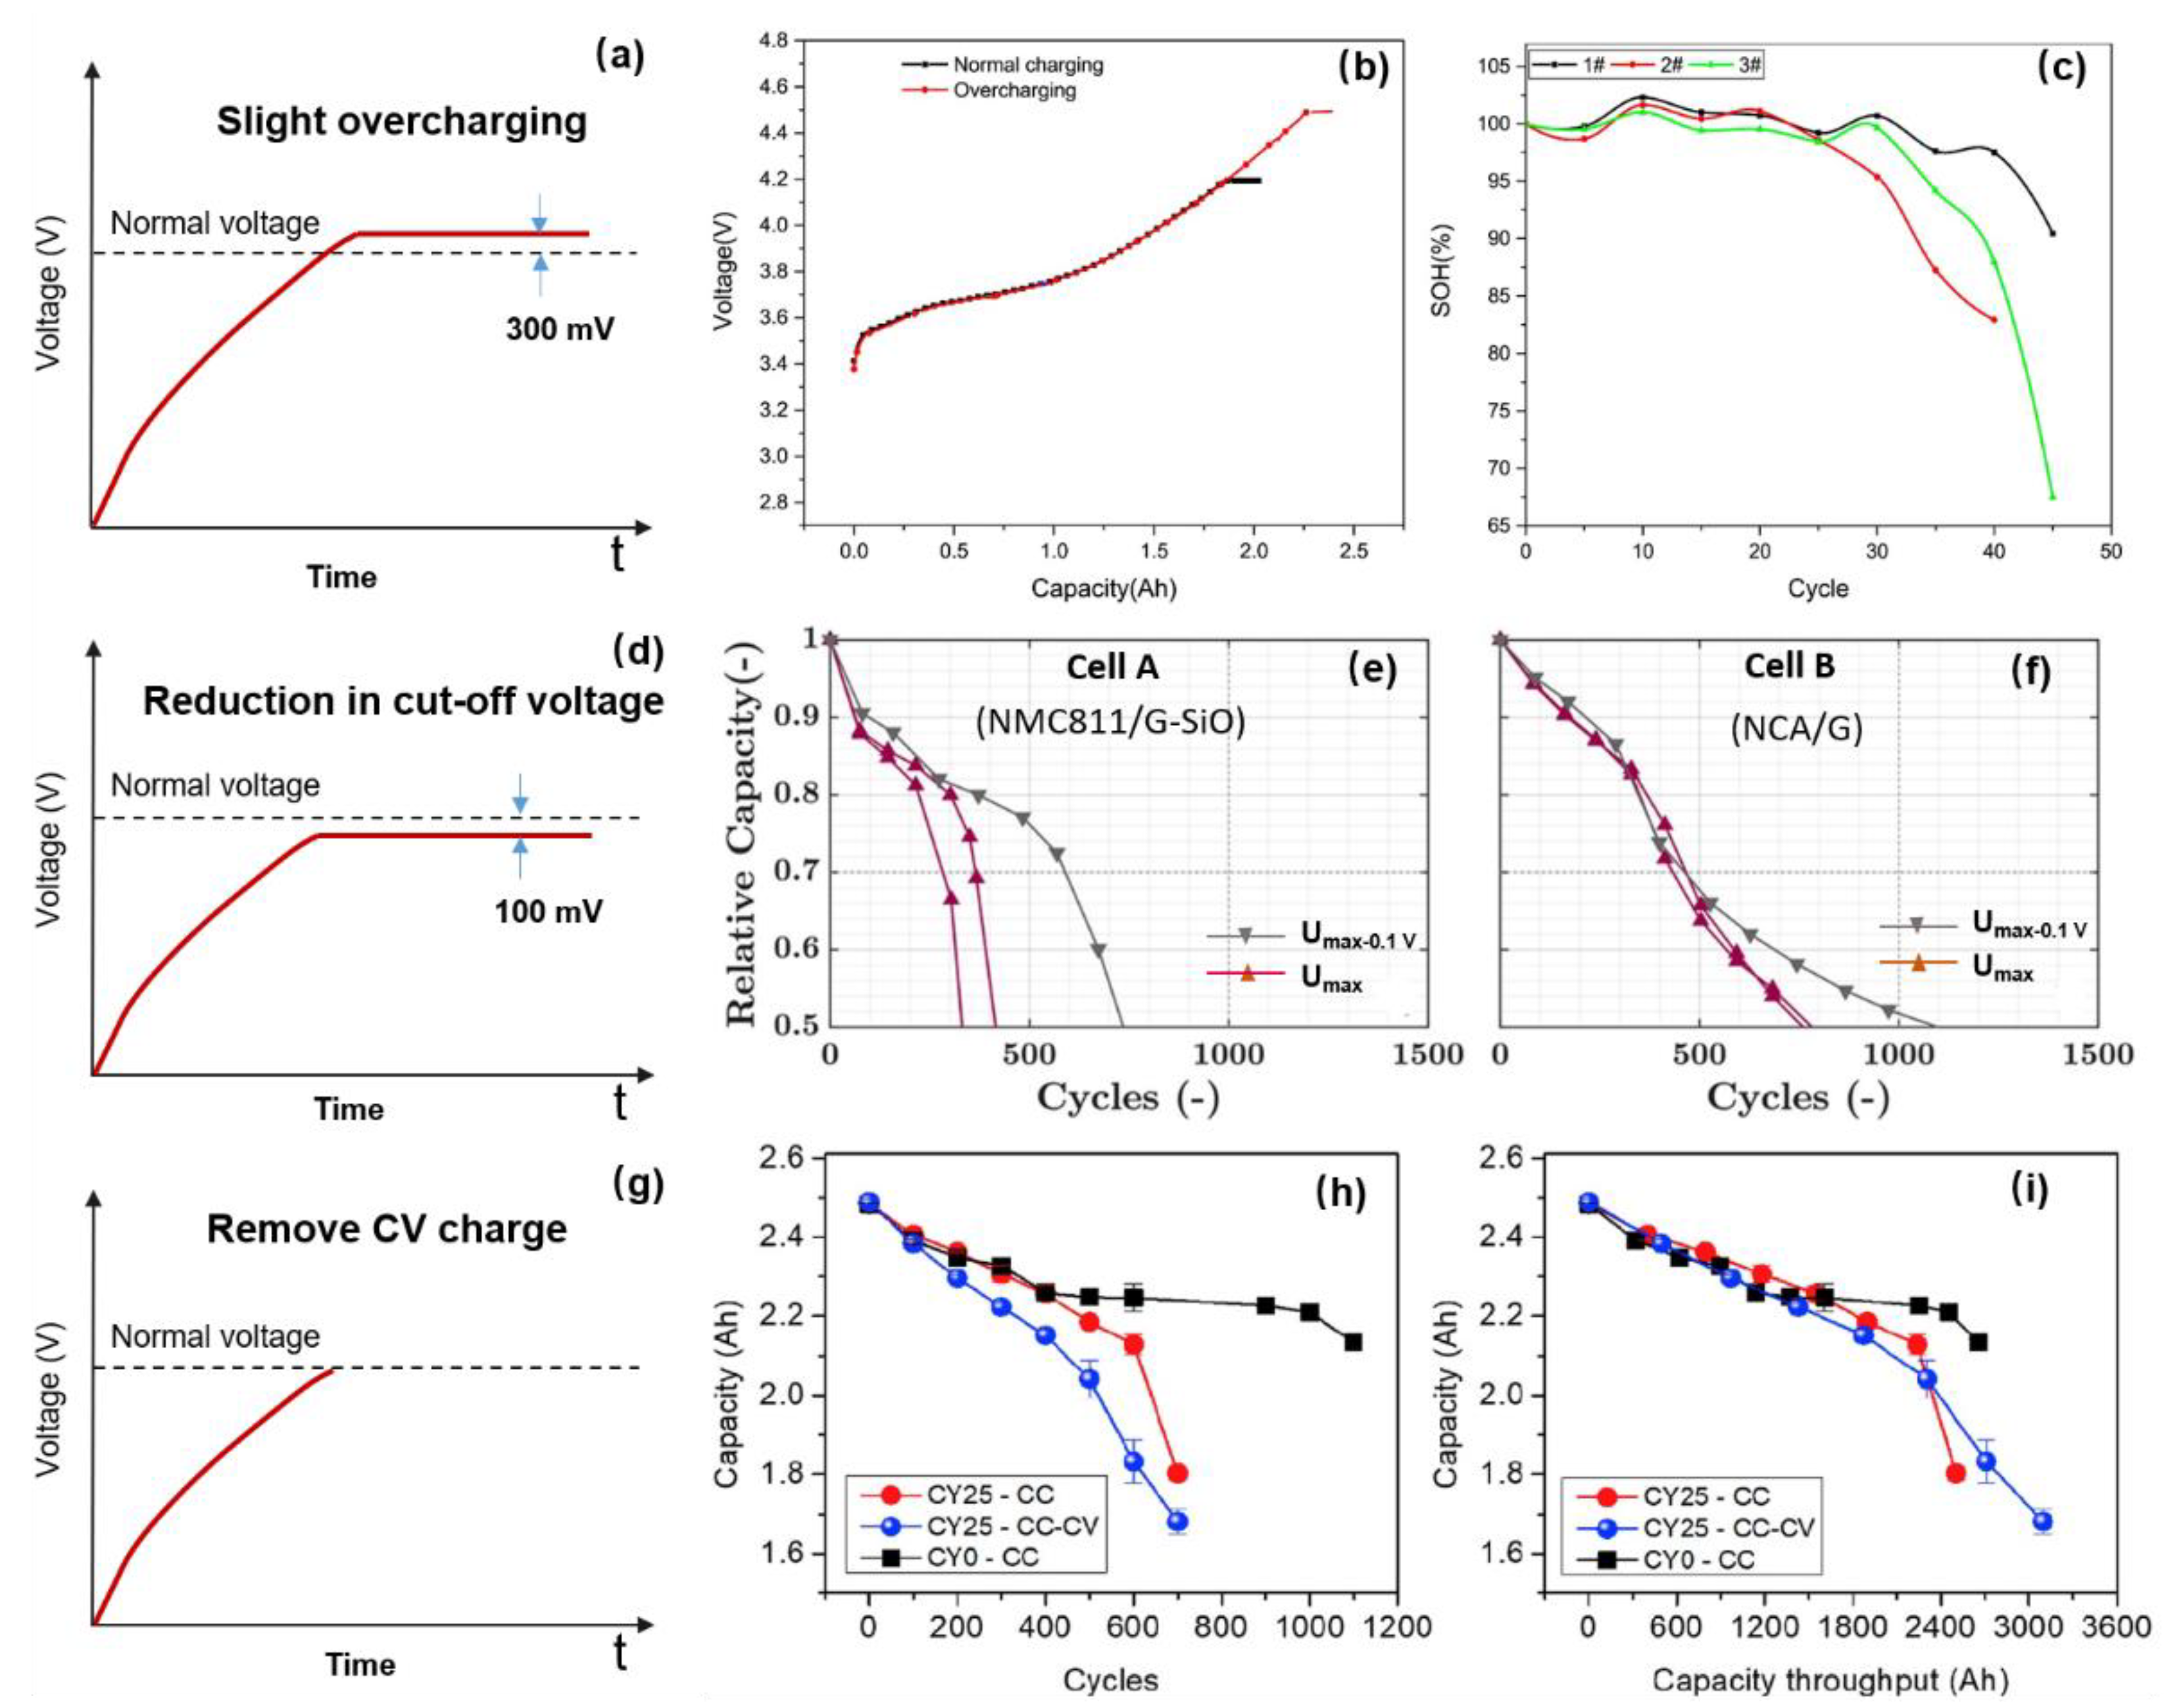
Slight overcharging or reduction in the cut-off voltage have an obvious impact on the degradation of LiBs. In [52] the author accelerated the battery aging by 300 mV overcharging. The schematic diagram is shown in Figure 8a. They designed a cycle aging experiment for 18650-type batteries (i.e., 2 Ah, NMC/graphite) and charged one of them in the voltage range of 2.75–4.5 V, while another battery in was charged in the nominal range of 2.75–4.2 V. The battery charging/discharging profiles are shown in Figure 8b. As expected, the overcharged battery has an 18% higher capacity than the battery charged in the nominal conditions; however, for the overcharged batteries (three overcharged cells tested at the same condition) the capacity fade is pronounced, as shown in Figure 8c. The SOH drops to 80% after only approximately 40 cycles, which is much quickly than for the battery aged under normal voltage (which needed over 100 cycles to reach the same SOH). Thus, overcharging the battery highly accelerates the degradation process.
In contrast, in [53], Rathieu et al. charged two different types of batteries with a slight reduction of 100 mV in the cut-off voltage, as shown in Figure 8d. For battery A (i.e., 3.0 Ah, NMC 811/G-SiO), the reduction of the cut-off voltage led to both a lower charging time and a lower degradation (Figure 8e); however, this results in a reduction of the charged capacity (i.e., only 83%). For battery B (i.e., 2.5 Ah, NCA/G), there is no significant reduction in the charging time or in the degradation (Figure 8f), but a lower capacity is achieved (i.e., 89%).
Furthermore, in [54], the author analyzed the contribution of the constant voltage process to the battery charging, and charged 18650-type batteries (2.5 Ah, NMC/Graphite, and NCA/Graphite) by the CC (2.5 A to 4.2 V) (Figure 8g) and CC-CV protocols (2.5 A to 4.2 V and 0.1 A cut-off current) at room temperature, respectively. The battery charged with the CC-CV protocol lost 20% of its capacity after 500 cycles, while the battery charged only with the CC protocol reached the same degradation level after 600 cycles, as shown in Figure 8h. From Figure 8i, it can be seen that the batteries contribute a similar total capacity throughput charged by CC-CV and CC protocols. However, using the CC-CV protocol, more capacity (about 20%) can be charged in comparison to the CC protocol.
It can be concluded that slight overcharging will increase the capacity but will obviously accelerate the battery aging. For the reduction in cut-off voltage and the removing of the CV charging, there is no significant reduction in the charging time and in the degradation, but a lower capacity is achieved.
4.1.2. Impact of the Charging Current
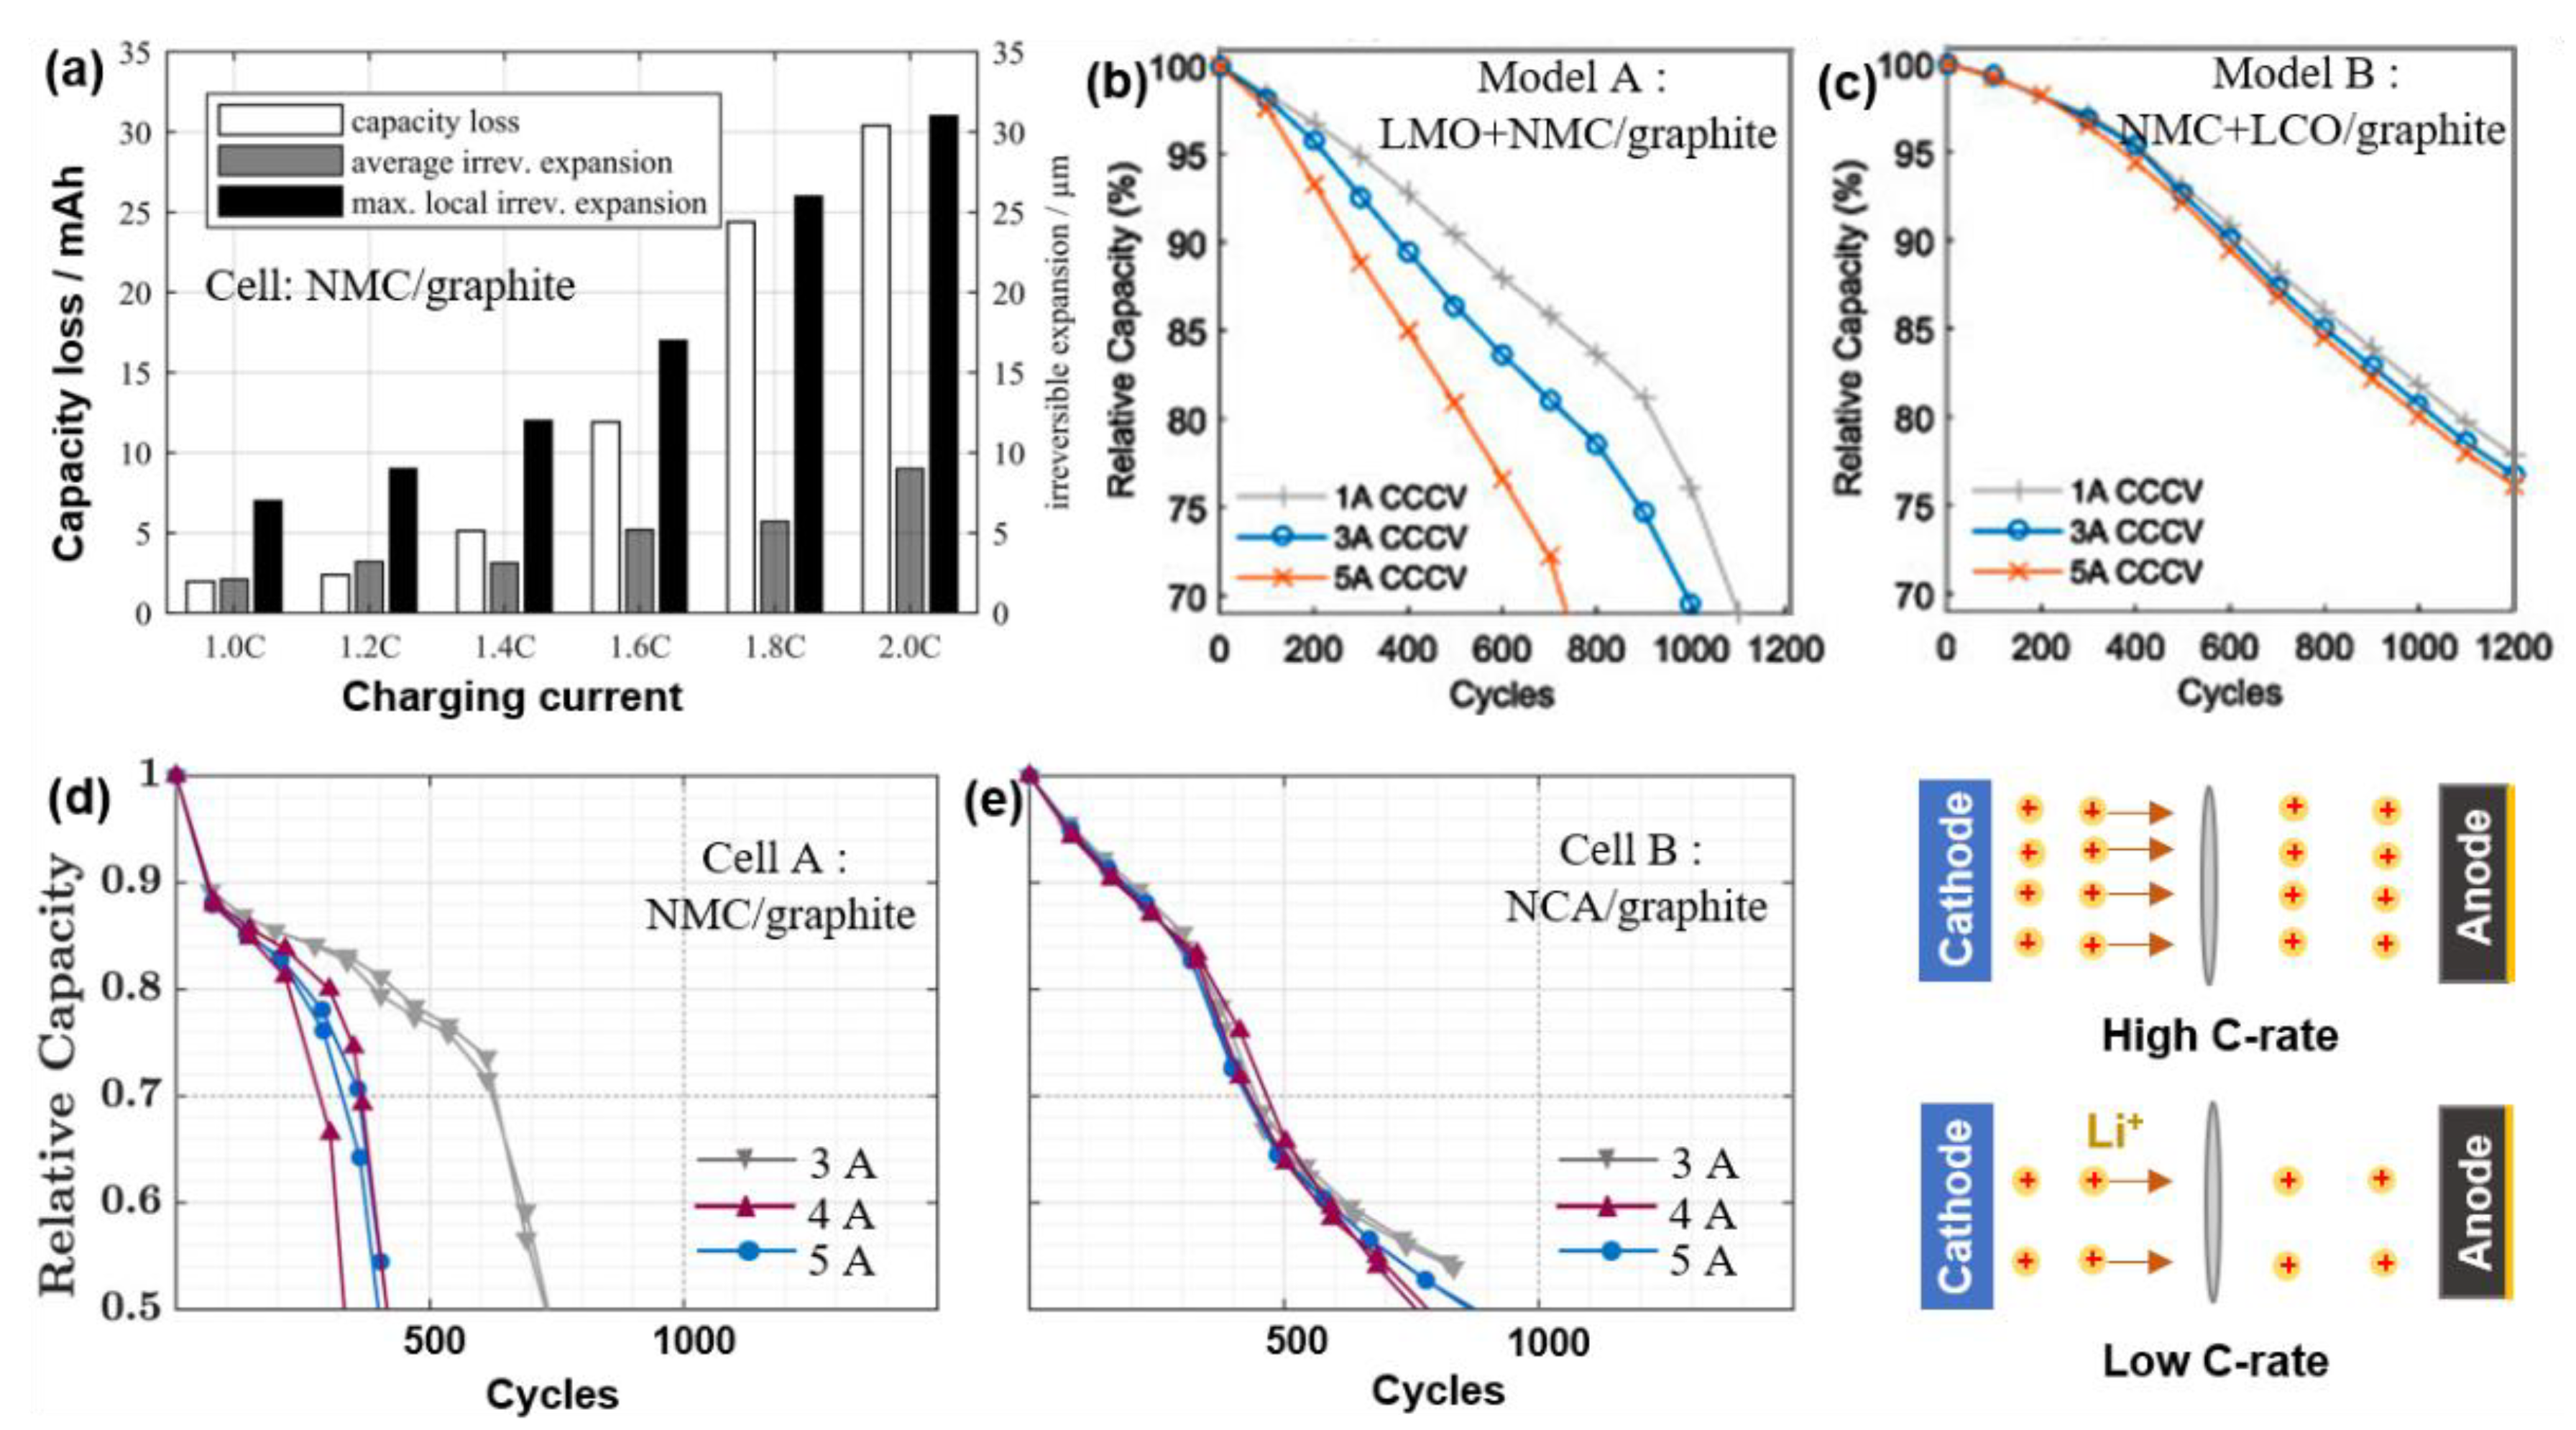
In charging, the current Ich is an important parameter for charging speed. Spingler et al. [55] charged batteries (i.e., NMC/graphite, 3.3 Ah) with a constant current between 1.0 C and 2.0 C. The capacity loss and both average and maximum local irreversible expansion per cycle are shown in Figure 9a. With the increase of the C-rate, the battery capacity fade becomes more and more obvious. Furthermore, the irreversible expansion and capacity loss are correlated with a bivariate correlation of 0.996. This means that a higher charging rate will lead to a larger irreversible expansion, corresponding to a growing tendency for capacity loss. Especially for the 2 C charging, the fade of capacity is about 30 mAh per cycle.
Keil et al. analyzed the impact of high charging currents on the cycle life of two different types of batteries: Model A (i.e., (LMO+NMC)/graphite) and Model B (i.e., (NMC+LCO)/graphite), as shown in Figure 9b,c, respectively [38]. For the Model A battery cell (Figure 9b), the increase in the charging C-rate (from 1 C to 5 C) increases the battery degradation (i.e., capacity fade). On the other hand, for the Model B battery cells, (Figure 9c) the battery degradation is not influenced by the charging C-rate, which may be related to the composition of the cathode.
Furthermore, in [53], the authors compared the influence of three different charging currents (i.e., 3 A, 4 A, and 5 A) on two LiBs, cell A (i.e., NMC/graphite) and cell B (i.e., NCA/graphite), considering two cells for each aging condition. The capacity degradation tendency, which is presented in Figure 9d (cell A) and Figure 9e (cell B), is similar for the two investigated chemistries; in the beginning, there is a high capacity loss, followed by a slower capacity fade in the middle of the life cycle, and ending with a sudden capacity degradation period. For cell A, the capacity fade behavior of the battery cells charged with 5 A and 4 A is similar, and a faster degradation is observed than for the cells charged with 3 A (especially after 20% capacity fade). On the other hand, it can be observed that the degradation paths are similar for cell B under all the currents from 3 A to 5 A (Figure 9e).
Based on the above studies, it can be concluded that, in most cases, higher charging current rates result in the faster degradation of LiBs; however, both the degradation trend and the influence of the charging rate change from chemistry-to-chemistry.
4.1.3. Impact of Charging Temperature
At low-temperatures, LiBs are characterized. In [56], the authors assessed the battery (i.e., NCA/graphite, 2.9 Ah) charging in different low temperatures (i.e., −5 °C, −10 °C, −15 °C and −20 °C). After charging to full state, they set a 3 h rest at room temperature for the batteries, and then discharged all the batteries at 25 °C. At low temperatures, not only is the charging efficiency lowered, but the energy that can be charged is correspondingly reduced. Moreover, the authors found that the capacity obviously declines, with the reduction in the ambient charging temperature. In the harsh conditions of −20 °C, the battery capacity drops to 72% after only eight cycles. In contrast, at higher temperatures (>+40 °C), the charging capacity increases and the internal resistance decreases further, compared with charging at room temperature [57].
To conclude, the aging of the battery during the charging process is affected by the cut-off voltage, current and temperature. High cut-off voltage, high current and extreme temperatures (both low and high temperatures) will accelerate the battery aging.
4.2. Aging in Driving
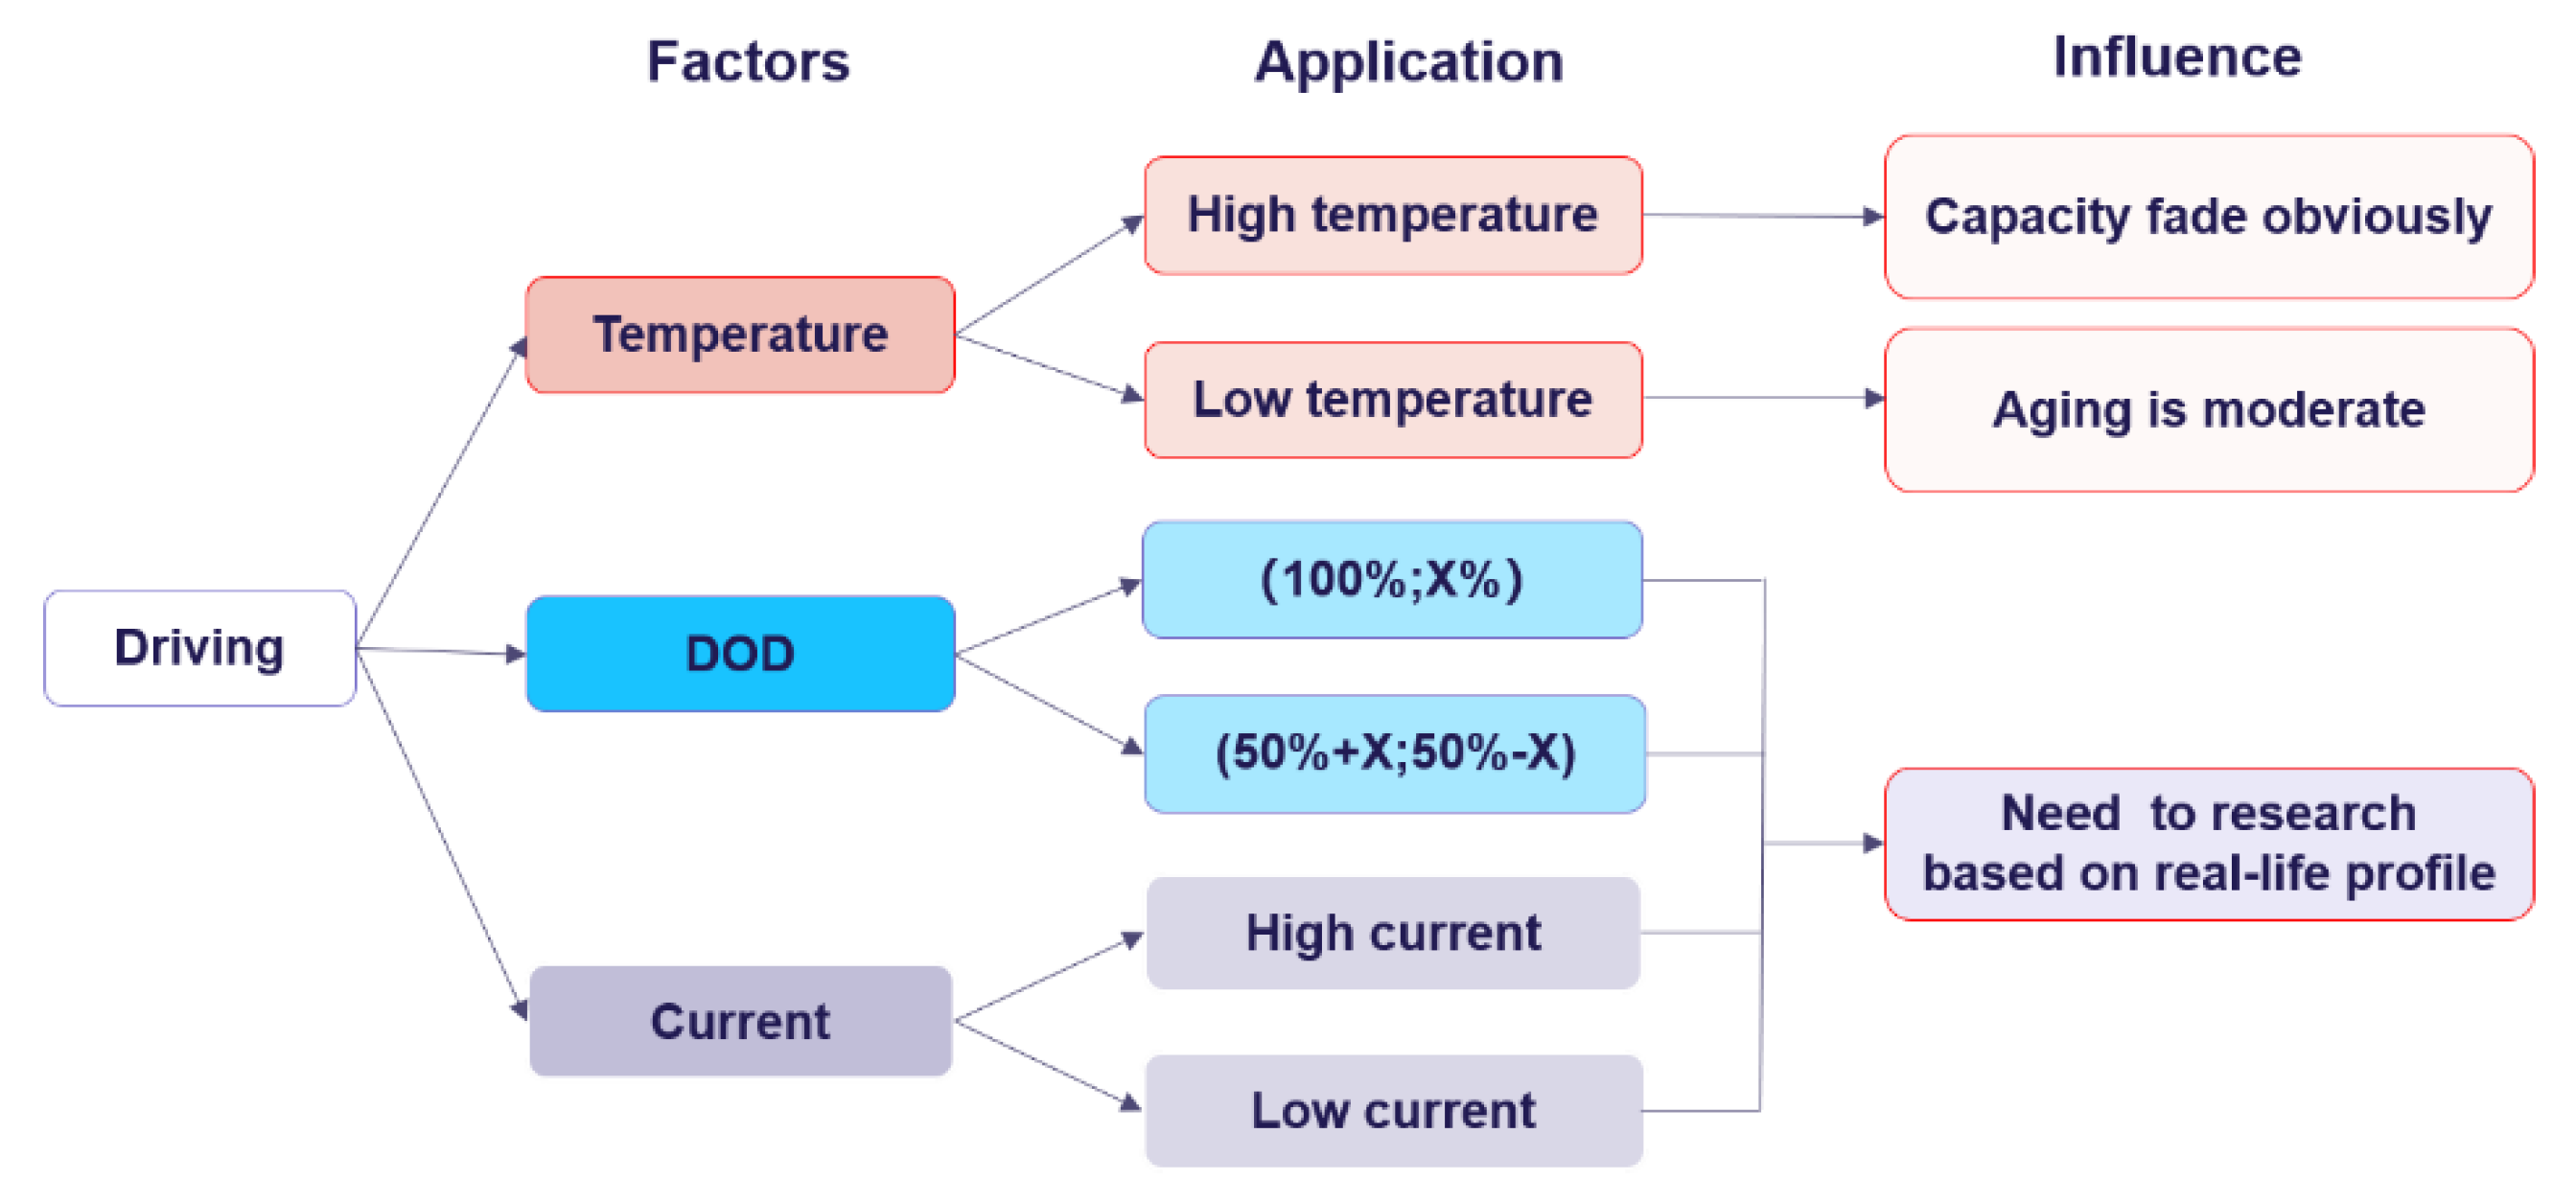
The battery degradation in EV driving is sensitive to a variety of factors from the behavior of the user to the environmental conditions. The mileage of the EV’s daily use is related to the battery depth of discharge (DOD); driving speed and acceleration are related to the battery discharge current; and the main environmental factor that influences the battery aging is the temperature. These factors and the corresponding influences on the battery are summarized in Figure 10.
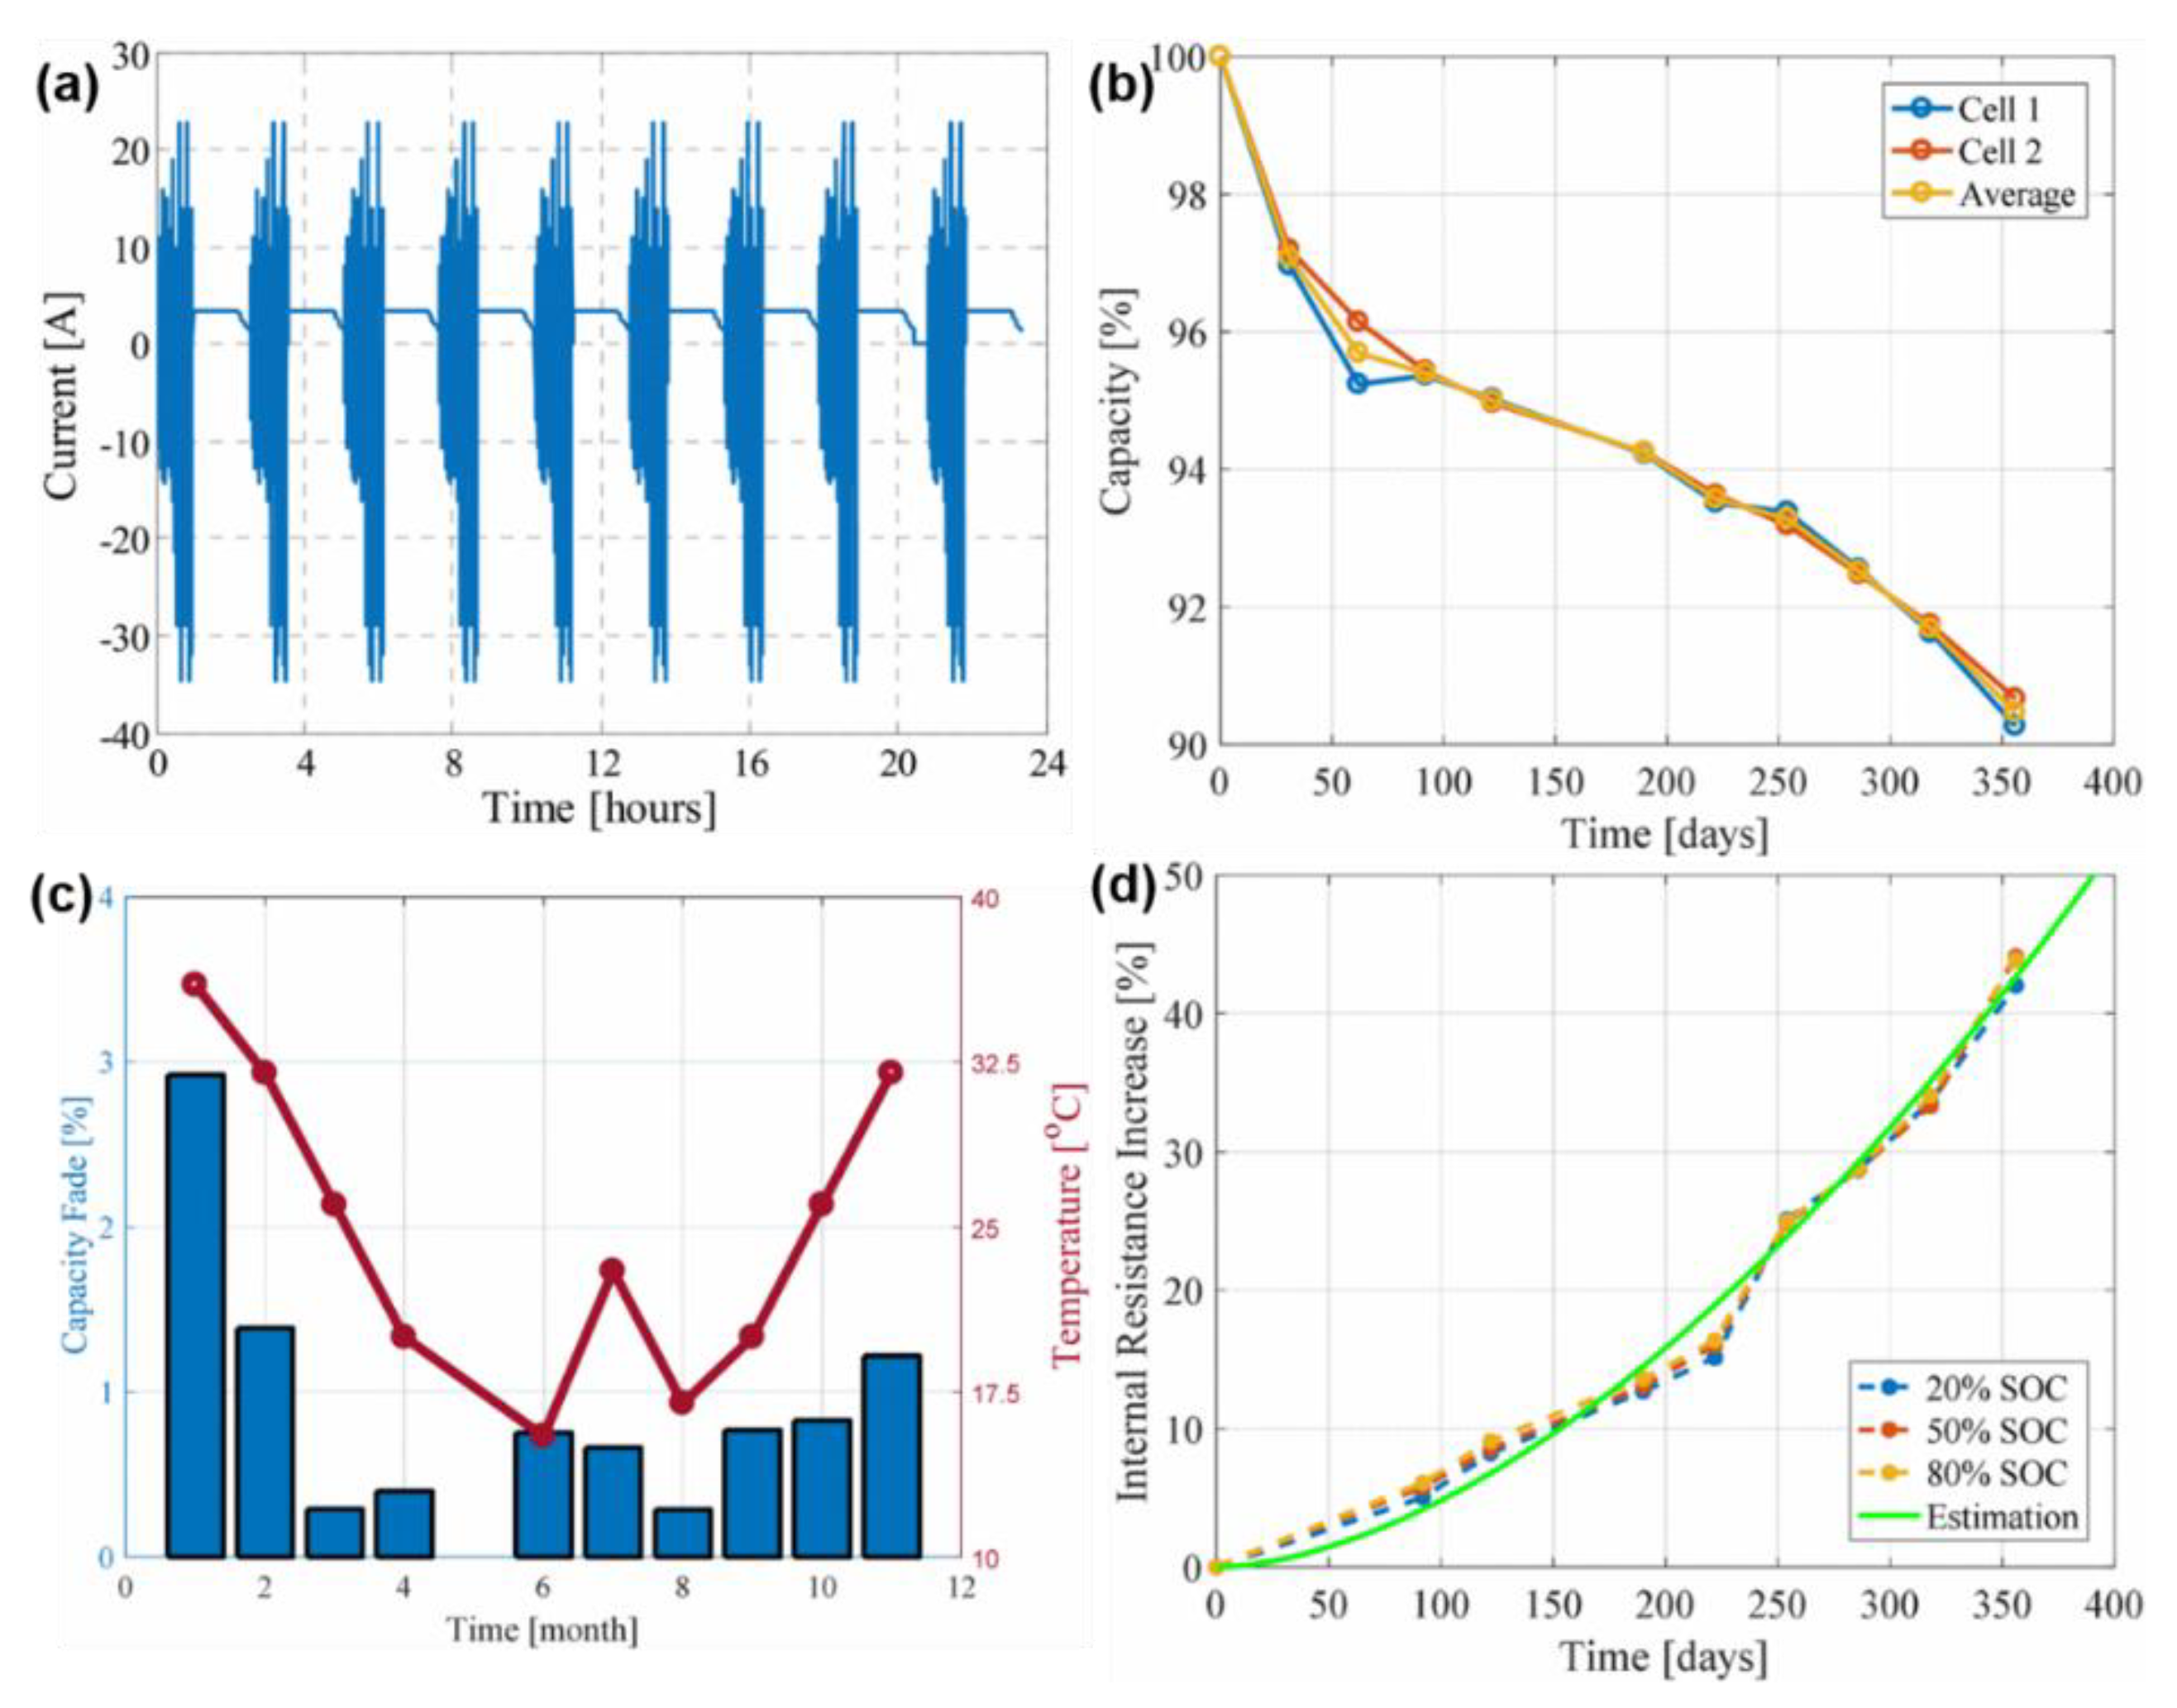
Performing laboratory accelerated aging test is an effective method to analyze degradation in EV batteries. In [58], Stroe et al. carried out a daily aging profile (e.g., WLTC), which consisted of 22 h cycling and 2 h stand-by, as presented in Figure 11a, and analyzing and assessing the aging of NMC-based battery cells. Furthermore, the temperature changed monthly in accordance with the climate of Seville, Spain. After eleven months of accelerated aging, the two tested cells lost approximately 10% of their initial capacity (Figure 11b). A slow down tendency of the capacity fade appeared as the aging of the battery evolved, and the authors attributed this to the irreversible capacity loss caused by the formation and growth of the solid electrolyte interface (SEI) layer in the initial stages. The relationship between the monthly capacity fade and the temperature is shown in Figure 11c. The highest capacity fade occurs in the first month, approximately 3%, corresponding to a cycling temperature of 36 °C. They also found that the degradation is minimal when the battery is cycled at 26 °C (approximately room temperature). In addition, the increase of internal resistance accelerates as the aging process evolves during the eleven months of testing (Figure 11d). In [59], the author obtained a similar conclusion that the capacity of pouch cell (e.g., NMC/graphite, 20 Ah) will fade more quickly in high-temperature driving. They show that after 2184 cycles, the battery lost 19.2% capacity when aged using the WLTC at 45 °C. On the contrary, when the battery was aged at a temperature of 10 °C, almost no capacity degradation was observed after 1428 cycles.
In [58], it was predicted that the battery will reach 20% capacity fade under the considered aging profile (based on the WLTC driving cycle) after approximately 5.8 years. To further accelerate battery aging, Simolka et al. selected the last part of the WLTC driving cycle (called “extra high”), corresponding to high currents, and named it as “AP1” [60]. Based on AP1, the authors then doubled the current load in order to create a new profile: “AP2”. The capacity fade of the LFP/G cells was tested based on AP1 and AP2 profiles; at the same time, two DODs (i.e., 50% and 100%) were performed. These methods are very suitable for studying the real-life applications of batteries in EVs. However, there are few studies about NMC and NCA battery discharge based on these methods, currently.
Overdischarging also leads to the degradation of the battery. In [61], the author found that overdischarging deteriorates the electrode materials. On the one hand, as the discharging cut-off voltage decreases, the surface temperature of the battery increases significantly, leading to transition metal dissolution at cathode; on the other hand, overdischarging causes irreversible structural transformation of cathode and anode, resulting in a decrease in capacity. As presented by Lai et al. in [62], the critical over-discharging range for the DOD is from 115% to 120%. When over-discharging exceeds this range (i.e., more than 20% overdischarging), the rate of capacity degradation is greatly accelerated. If the open-circuit voltage of the battery does not recover to values higher than 2 V during the rest process, this may lead to an irreversible internal short circuit. Even worse, an explosion caused by overdischarge when the external temperature is high has been reported [63].
It can be concluded that high temperatures will accelerate battery degradation in real-life driving. Furthermore, overdischarging will also lead to battery degradation.
4.3. Aging in Standby
The standby state takes up a considerable amount of time in EVs’ real-life operation, and the contribution to total aging is significant. The pace of the degradation process during standby, known as calendar aging, varies depending on the SOC and temperature.
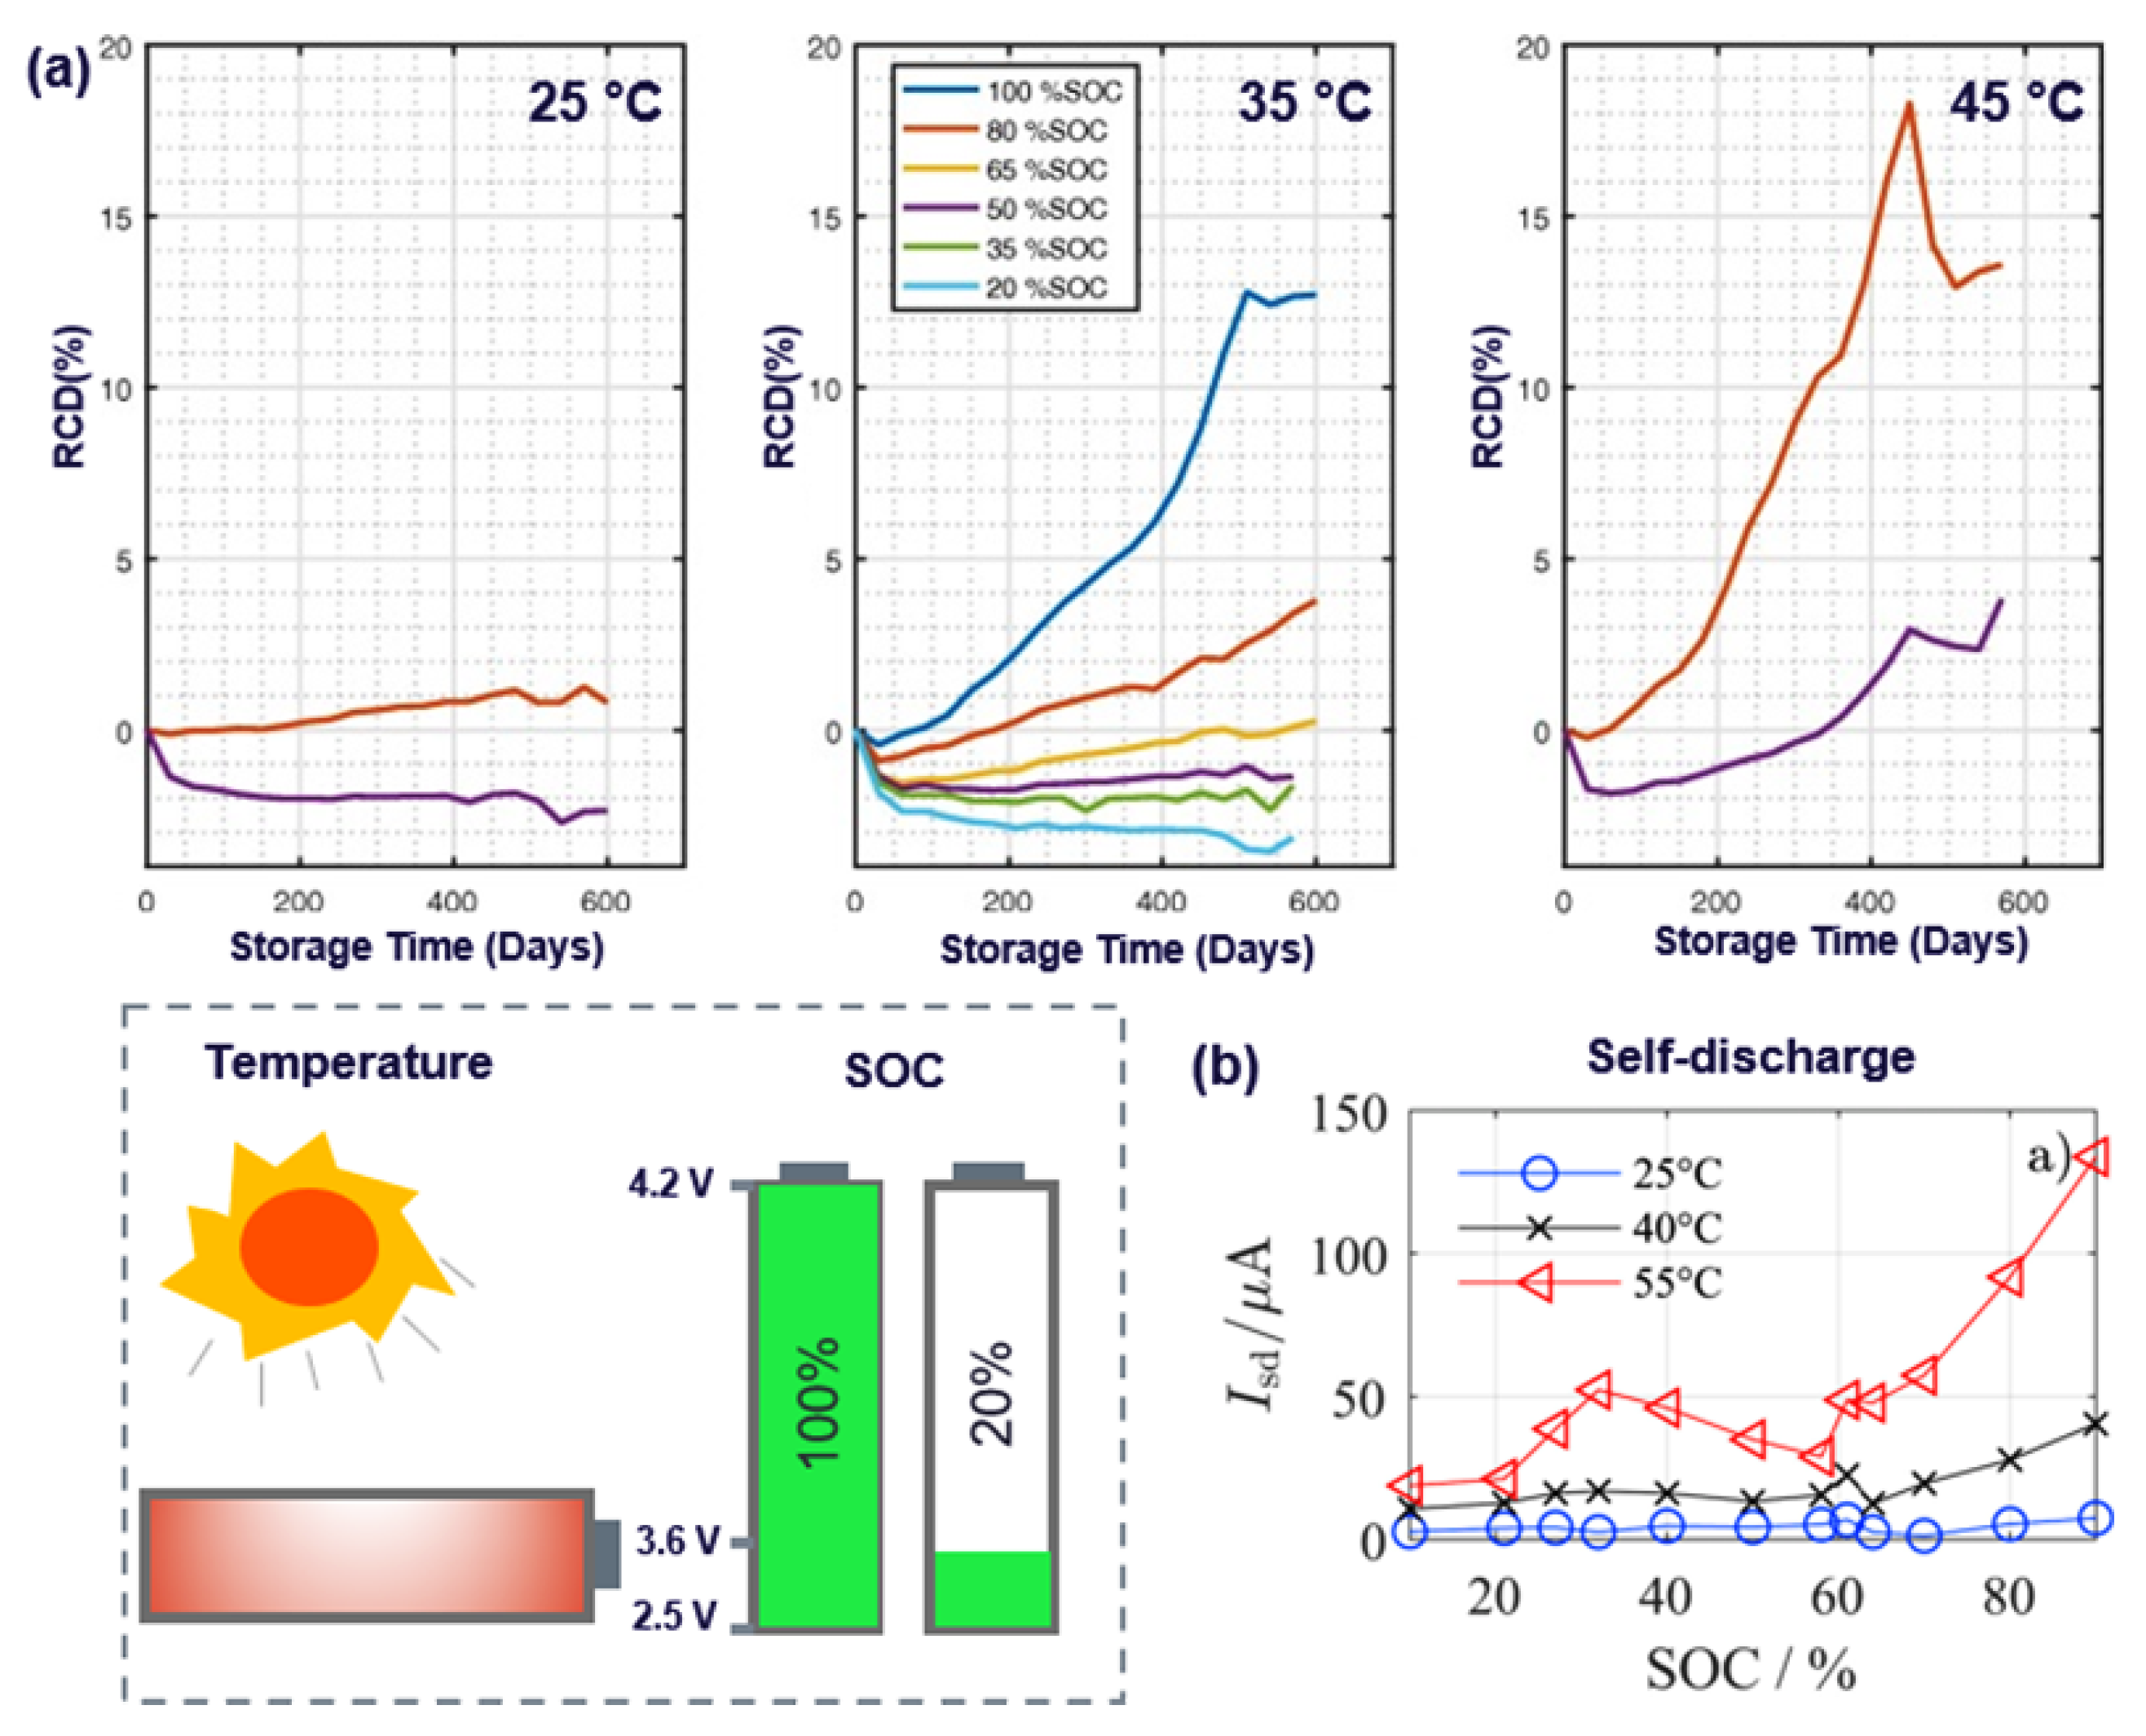
The effect of the SOC and temperature on the capacity fade of NMC-based LiBs is exemplified in Figure 12a [64]. It is evident that the battery capacity fade is more notable at high temperatures than at a moderate temperature. In addition, high SOCs will also accelerate capacity fade due to the high voltage. As expected, the highest capacity degradation occurs in the toughest conditions, with a high storage SOC (80%), and the highest temperatures (45 °C) among these cases. The calendar aging situation is presented in Figure 12b. In [65], the authors varied the storage SOC from 5% to 95%, and obtained a similar conclusion that a higher SOC (i.e., over 70%) will accelerate the battery (e.g., LTO/NMC) aging significantly during 300 days of calendar aging. However, there is no evident capacity degradation in cells with a SOC below 70%, even at 60 °C. This behavior occurs because the LTO/NMC cells are more stable than other cells, even at high temperatures. However, as reported in [66], when the cells (i.e., LMO+NMC/graphite) were stored at a middle SOC (i.e., 50%), the degradation is faster than for the cells which were stored at extreme SOCs (i.e., 10% and 90%). This is different from what was presented in previous literature that showed an increase in degradation by increasing the SOC at 25 °C. However, it is obvious from most of the available literature that storage/idling the LiBs at low SOCs and in low temperatures will result in slower capacity fade and, subsequently, a long lifetime. Some of the recent work investigating the calendar aging of NMC- and NCA-based LiBs is summarized in Table 4.
Self-discharge is also an important process during calendar aging, which results in voltage decay and lower available energy. In [71], the authors analyzed the self-discharge dependence on the temperature and SOC in a commercial cell. As shown in Figure 12b, they found a self-discharge current from 2.0 μA to 4.5 μA at 25 °C, which is equivalent to 0.04–0.1% of the reversible capacity loss in one month; as the standby temperature increase from 25 °C to 55 °C, the self-discharge current increase to 135 μA at 90% SOC. Furthermore, the self-discharge current increases with the increase of SOC, and the growth trend is particularly obvious at a high temperature of 55 °C.
Based on the above analysis, during standby operation, high temperature and high SOC, the degradation of the battery will be accelerated and the self-discharge phenomenon will be more obvious.
4.4. Aging in Whole Application
Aging during standby operation is a very slow process, and it may take more than ten years at room temperature before a battery reaches its end-of-life (EOL); however, this operation takes up to 80% of the battery operation time in EV applications [72]. As such, the impacts of standby aging cannot be underestimated. Low temperatures (e.g., 0–25 °C) and a low SOC can effectively slow down the battery aging in standby [73].
Aging during the charging process is inevitable. Compared with driving aging, the charging aging process is easier to be controlled. Usually, various charging methods can be used to minimize the battery degradation and reduce the charging time.
Usually, the main aging of the battery is caused by driving [47]. Driving aging is the most complicated and uncontrollable. It is related to the driver’s route and driving environment, and differs due to different driving conditions.
In short, suitable temperatures, low SOC states in the standby process, and optimized charging methods can minimize battery aging. For the complicated aging during driving operation, some external protection measures (e.g., thermal management, battery pack design, and so on) are necessary to prolong the life of battery.
5. Aging on Lithium-Ion Batteries
In Section 4, we separately analyzed the battery degradation in charging, driving and standby operation, and the corresponding stress factors (e.g., temperature, current, overdischarging etc.) were also summarized. The reason for battery degradation is that these factors lead to deterioration in the internal components of LiBs. In this section, we systematically review the main aging mechanisms at both the anode and cathode of LiBs, as well as in the electrolyte.
5.1. Aging at the Cathode
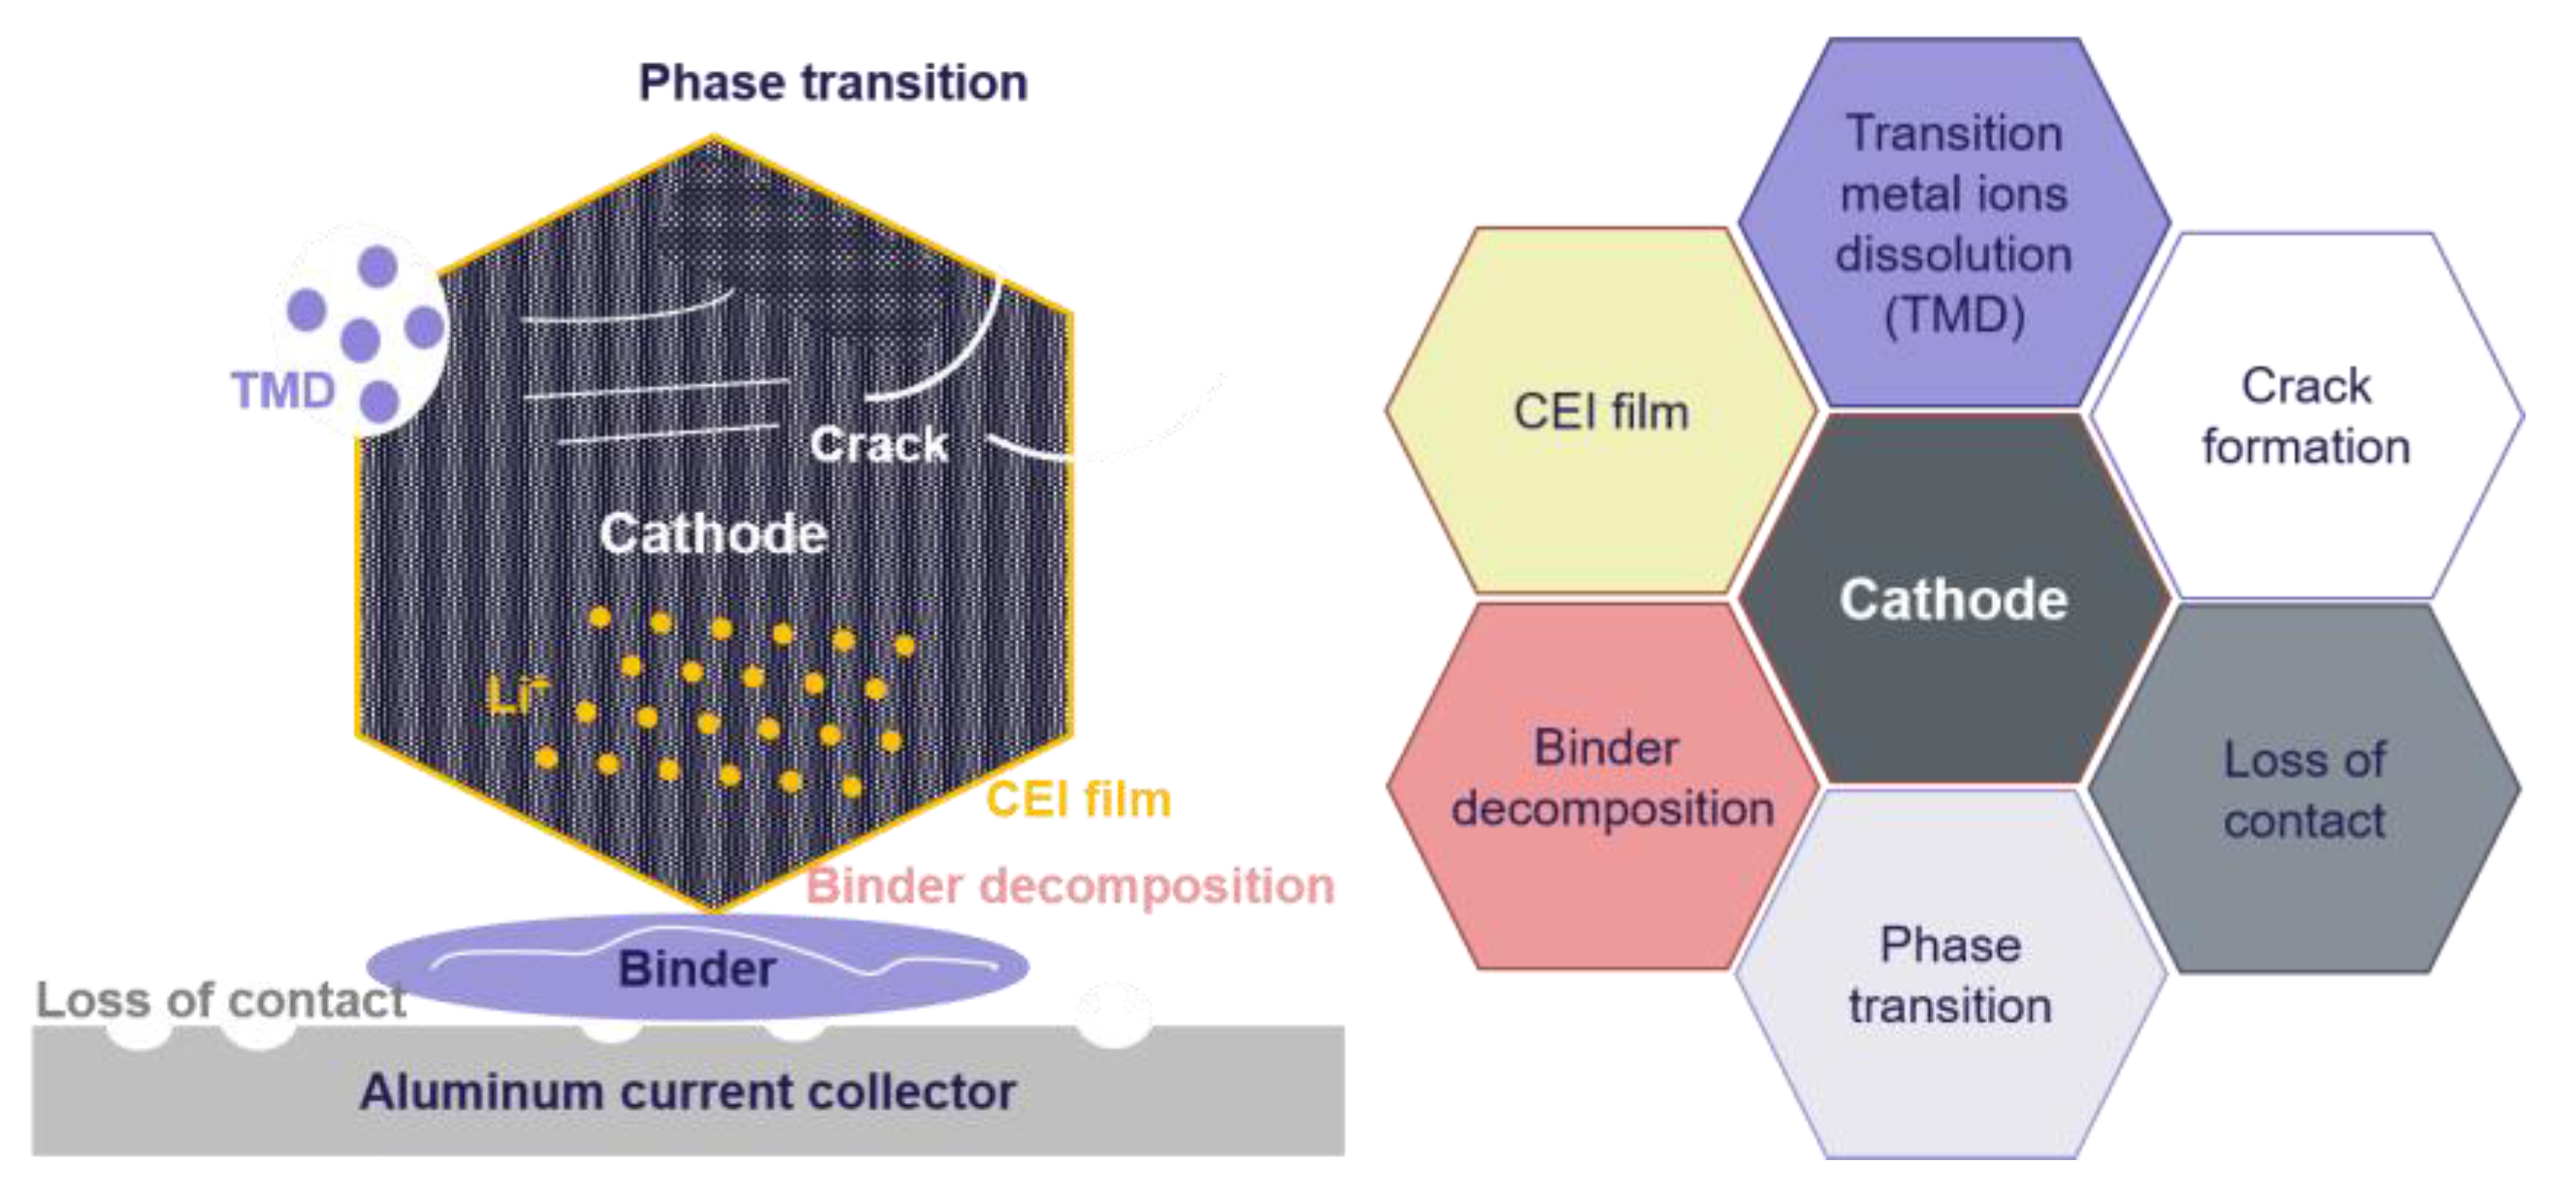
Changes in the cathode, such as phase transition, cracking in particles, transition metal dissolution (TMD), CEI film formation, binder decomposition, and loss contrast with collector have an evident influence on the aging of LiBs [5,8].
The loss of active materials on the cathode is a common aging process and is reflected in many aspects. The cathode structure is prone to changes during both standby, charging and driving aging [12]. Especially in high current rate operations, many Li+ achieve intercalation or de-intercalation from the cathode in a short time, which influences the irreversible disorder phase transition in the cathode structure. Even worse, battery long-term cycling under high voltage or high current will lead to cracks in the cathode material. The generated fractures hinder the diffusion of Li+ and lead to severe capacity fade [74]. Furthermore, the appearance of cracks will result in an unstable structure of the cathode, which by prolonged cycling, will further cause powdering and collapse of the cathode materials [75]. If the cracks are distributed inside the cathode, the diffusion of Li+ is difficult to achieve due to the lack of contact with the electrolyte, this may result in some cathode materials being in an “isolated” state. Moreover, the battery operation at a high voltage (at high SOC level) or high environment temperature will accelerate the dissolution of the transition metal (TMD), especially for the Mn element, which dissolves in organic solvents, producing water and HF [76]. The produced HF continues to dissolve the transition metals and the Li+ on the surface of the cathode, leading to significant capacity fade [77].
The loss of the Li+ in the cathode is mainly attributed to the formation of the cathode-electrolyte interface (CEI) film. The CEI film, which is similar to SEI film, consists of lithium alkyl carbonates, lithium alkoxides (ROLi), Li2CO3, etc. [78]. These compounds result mainly from the side reaction between cathodes and electrolytes. Operation of the battery at a high voltage (SOC) will accelerate the decomposition of electrolytes and produce more HF which erodes the cathode, resulting in more CEI ingredients [76]. Furthermore, when the battery is in charging and driving with high current rates, the side reactions will also be enhanced because large currents increase the temperature significantly. The electrolyte is easily decomposed at high temperatures, and this will accelerate CEI production [79]. Operation at high temperatures will also lead to binder decomposition and the current collector dissolution. The degradation of the binder will lead to the structure of the positive electrode being unstable, as a loss of contact in the electrodes results in an internal resistance rise in battery [80].
All these main degradation mechanisms, corresponding to the cathode, are presented in Figure 13.
5.2. Aging at the Electrolyte
The electrolyte transports Li+ between the cathode and anode, and it is an important part of LiBs. The cycle stability, capacity, safety, and operating condition of LiBs are dependent on the electrolyte [81]. Conventional electrolytes usually consist of lithium hexafluorophosphate (LiPF6) and other organic carbonates, such as ethyl methyl carbonate (EMC), dimethyl carbonate (DMC), and diethyl carbonate (DEC).
The LiPF6 is not stable, and it can be easily decomposed into LiF and PF5 [82]. The electrolyte aging starts with the reaction of organic carbonates and PF5. From the electrochemical reaction at the charged anode, these products will then form a surface film on the anode, known as SEI film [83]. At the same time, a CEI film will form on the cathode surface. The stable and dense surface film can inhibit the electrode’s surface exposure to electrolytes, effectively reducing the reaction between the electrolytes and electrode [84]. However, the continuous rupture and regeneration of the SEI and CEI films during the battery cycling will continue to consume Li+. This will result in reduced battery capacity. At present, some electrolyte lithium additives have been added to the electrolyte to form a more stable SEI film [85,86,87].
Especially in the charged state or at high temperatures, the electrolyte decomposition is an inherent risk, leading to gas formation inside batteries; this may lead to severe developments, such as a rise in the inner pressure of the battery cell, fire, or even explosions. In [88], Gerelt-Od et al. investigated the overcharging of battery cells from 4.2 to 4.4 V in moderate temperatures of 35–45 °C, which are the normal operating conditions in real life. Four main gases (i.e., H2, CH4, CO2, and CO) were detected when cells were exposed to the aforementioned electrical and thermal conditions. With the increase in battery voltage, more H2 will be produced.
5.3. Aging at the Anode
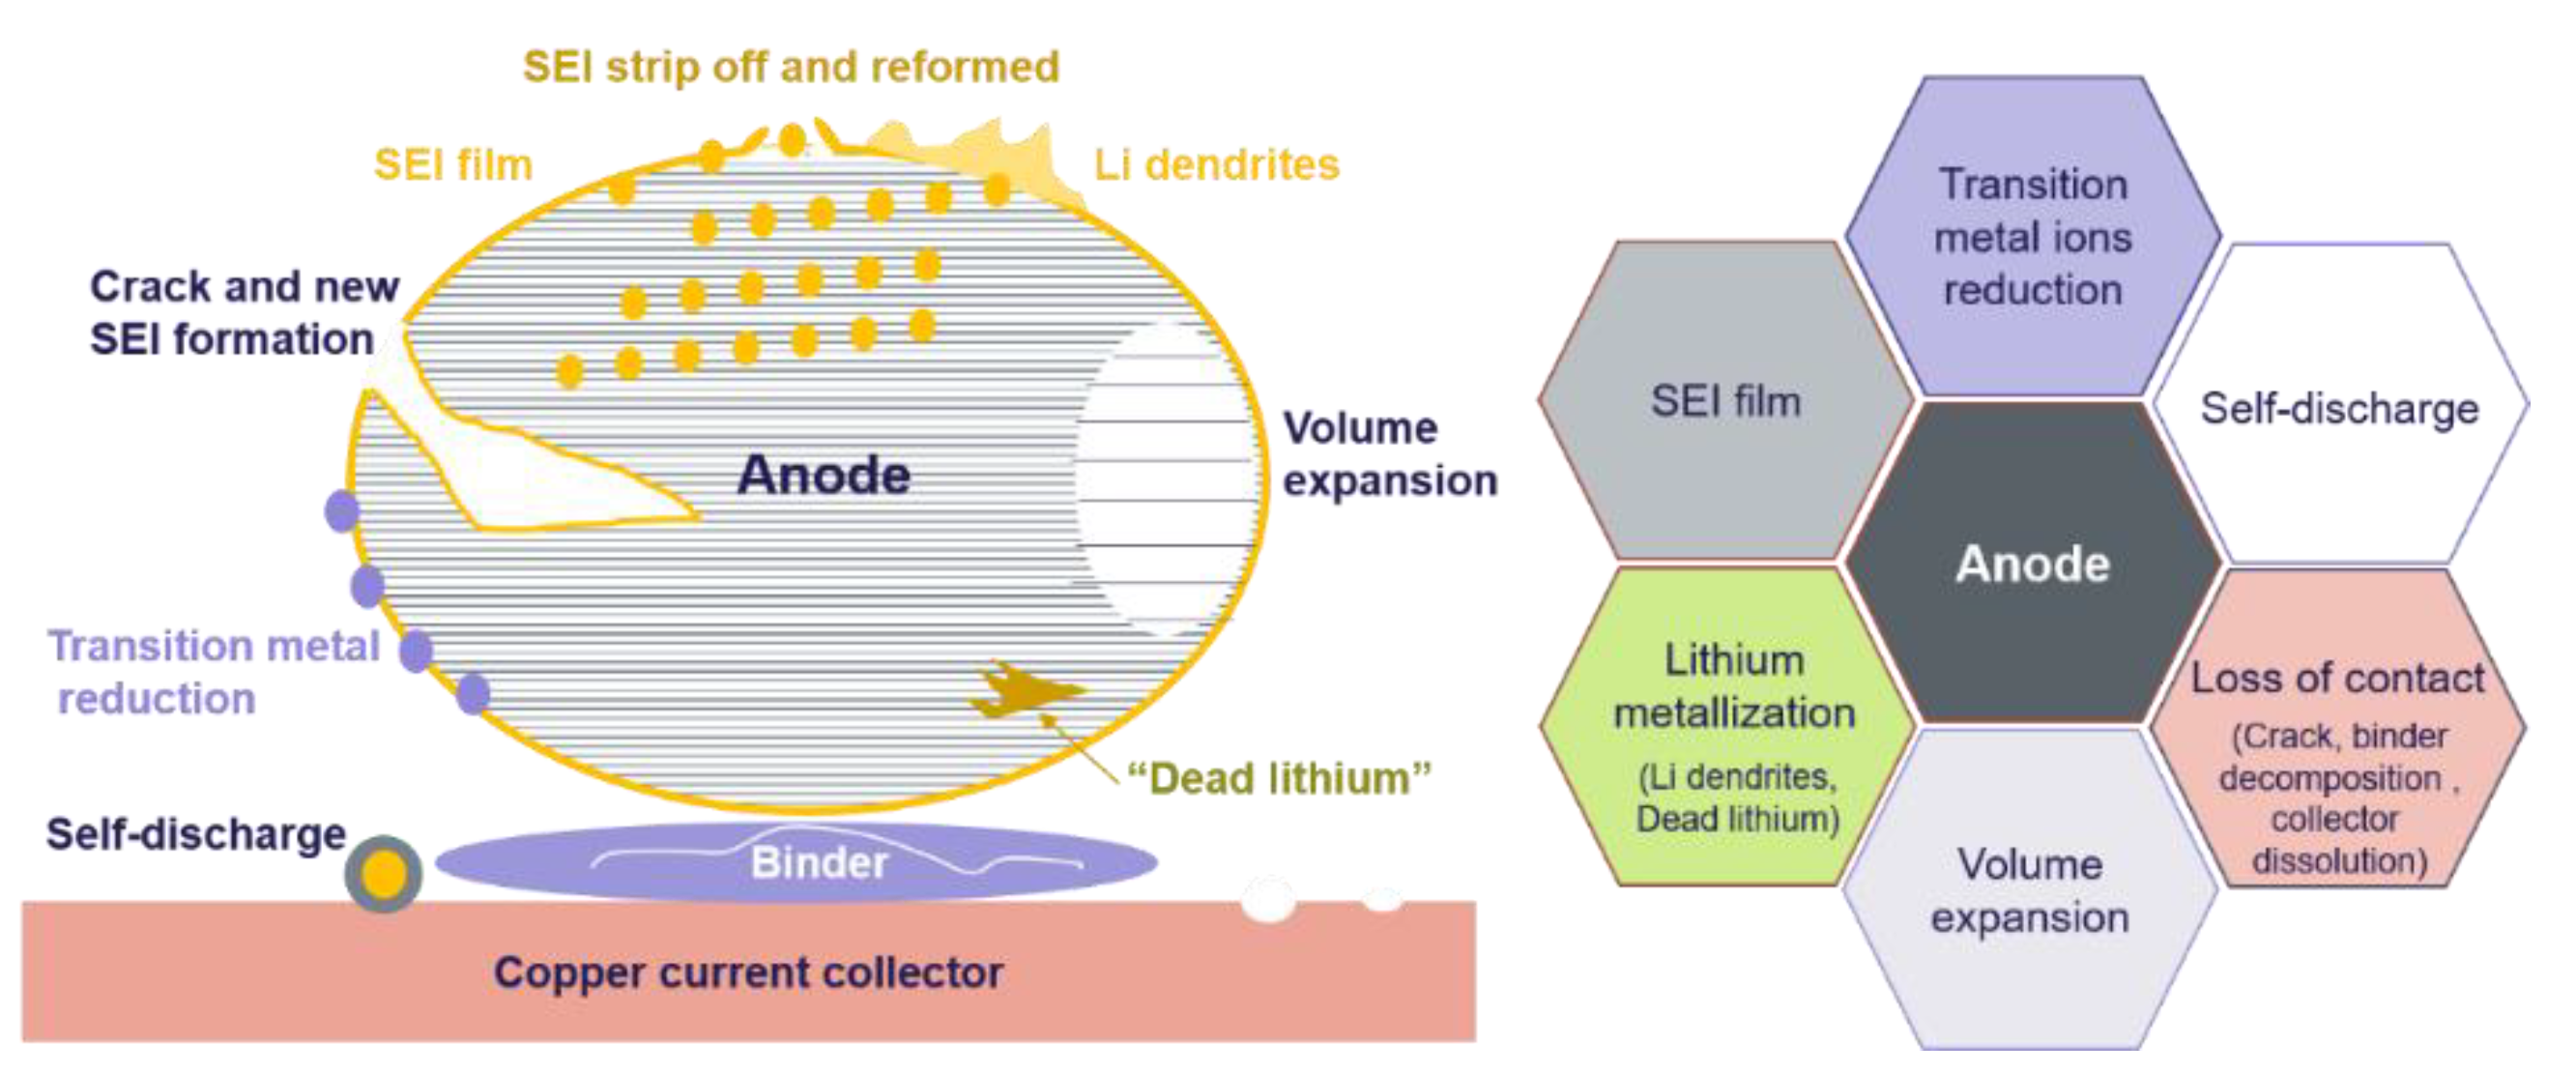
The major aging mechanisms at the anode of LiBs are solid electrolyte interphase (SEI) formation, anode volume expansion, lithium metallization, loss of contact, and transition metal ions reduction.
The process of SEI film formation is complex and mainly happens during the first several charging and driving process. In those processes, firstly, the Li+ from the cathode and the organic compounds from the electrolyte reacts with the graphite anode producing an SEI film with a thickness usually estimated between a few angstroms up to tens of nanometers [89]. The formation of SEI film consumes Li+, resulting in the loss of the lithium inventory, and, subsequently, capacity fade. The SEI formation can consume up to 10% of the initial battery capacity [90]. A stable SEI film is beneficial to the anode, as it coats the anode surface and inhibits the direct contact between the electrolyte and the anode, reducing further side reactions. Furthermore, the SEI film also has high selective permeability for Li+. However, the SEI growth is difficult to control, because it is highly dependent on the type of material and morphology of the anode, battery temperature, electrolyte composition, and electrochemical conditions [8]. Moreover, the SEI film is easy to corrode after the long-term operation of the battery. Subsequently, the cracked SEI film will expose the anode to the electrolyte, leading to additional SEI growth and capacity loss. Electrolyte decomposition and side reactions will produce gas and exacerbate this degradation process. Even worse, during charging and driving, the graphite volume expands by approximately 10% [9]. Cracking of the SEI film is accelerated by cycling at high DOD levels and/or idling the battery at elevated SOCs. All of these processes will consume Li+ to generate the SEI film, resulting in capacity fade and resistance increase.
The formation of lithium metal is also a common aging mechanism at the anode side. When the LiBs operate at high SOC, the anode will be intercalated with a lot of Li+, resulting in a low potential of the anode (i.e., the redox potential of Li/Li+ close to 0 V) [91]. When the partial anode polarization potential is below this voltage, the Li+ will deposit on the anode surface, forming metallic lithium. Especially during cycling at a high DOD or during long-term idling at a high SOC, lithium dendrites will grow on the anode [92]. The formation of lithium dendrites not only reduces the usable Li+, but also destroys the anode structure and, possibly, pierces the separator leading to short circuits and thermal runaway [93]. Finally, charging the battery with high current rates, which are greater than the speed of Li+ diffusion to the anode, will lead to lithium plating. Moreover, the operation of the LiBs at low temperatures will lead to a slow Li+ diffusion, producing more lithium plating and dendrite on the anode [94].
A high SOC state results in a high QNMC/SiC, which is related to the side reactions at the anode, including the dissolution of the Cu current collector and oxidation of the electrolyte. At the same time, a high temperature will accelerate this process. When the battery is stored in a high SOC, the self-discharge occurs significantly. Driven by the potential difference between the cathode and anode, the dissolved transition metal ions move from the cathode to the anode and are reduced by the charged anode forming metals deposits [95]. As a result, the deposited metals in an inactive state (e.g., “dead lithium”) appear in the anode or on the copper current collector surface. The deposited metals, as cathode, then combine with the anode to form a micro-battery, which greatly reduces the current efficiency and aggravates the available capacity fade of the LiBs [96].
All the aforementioned anode aging mechanisms are illustrated in Figure 14.
6. Conclusions
Because of their intrinsic properties, such as higher energy densities and low cost, Ni-based LiBs chemistries (i.e., NMC and NCA) are the preferred choices for powering EVs. As such, this work is mostly focused on reviewing the aging mechanisms and degradation behavior of these chemistries when used in various EV applications.
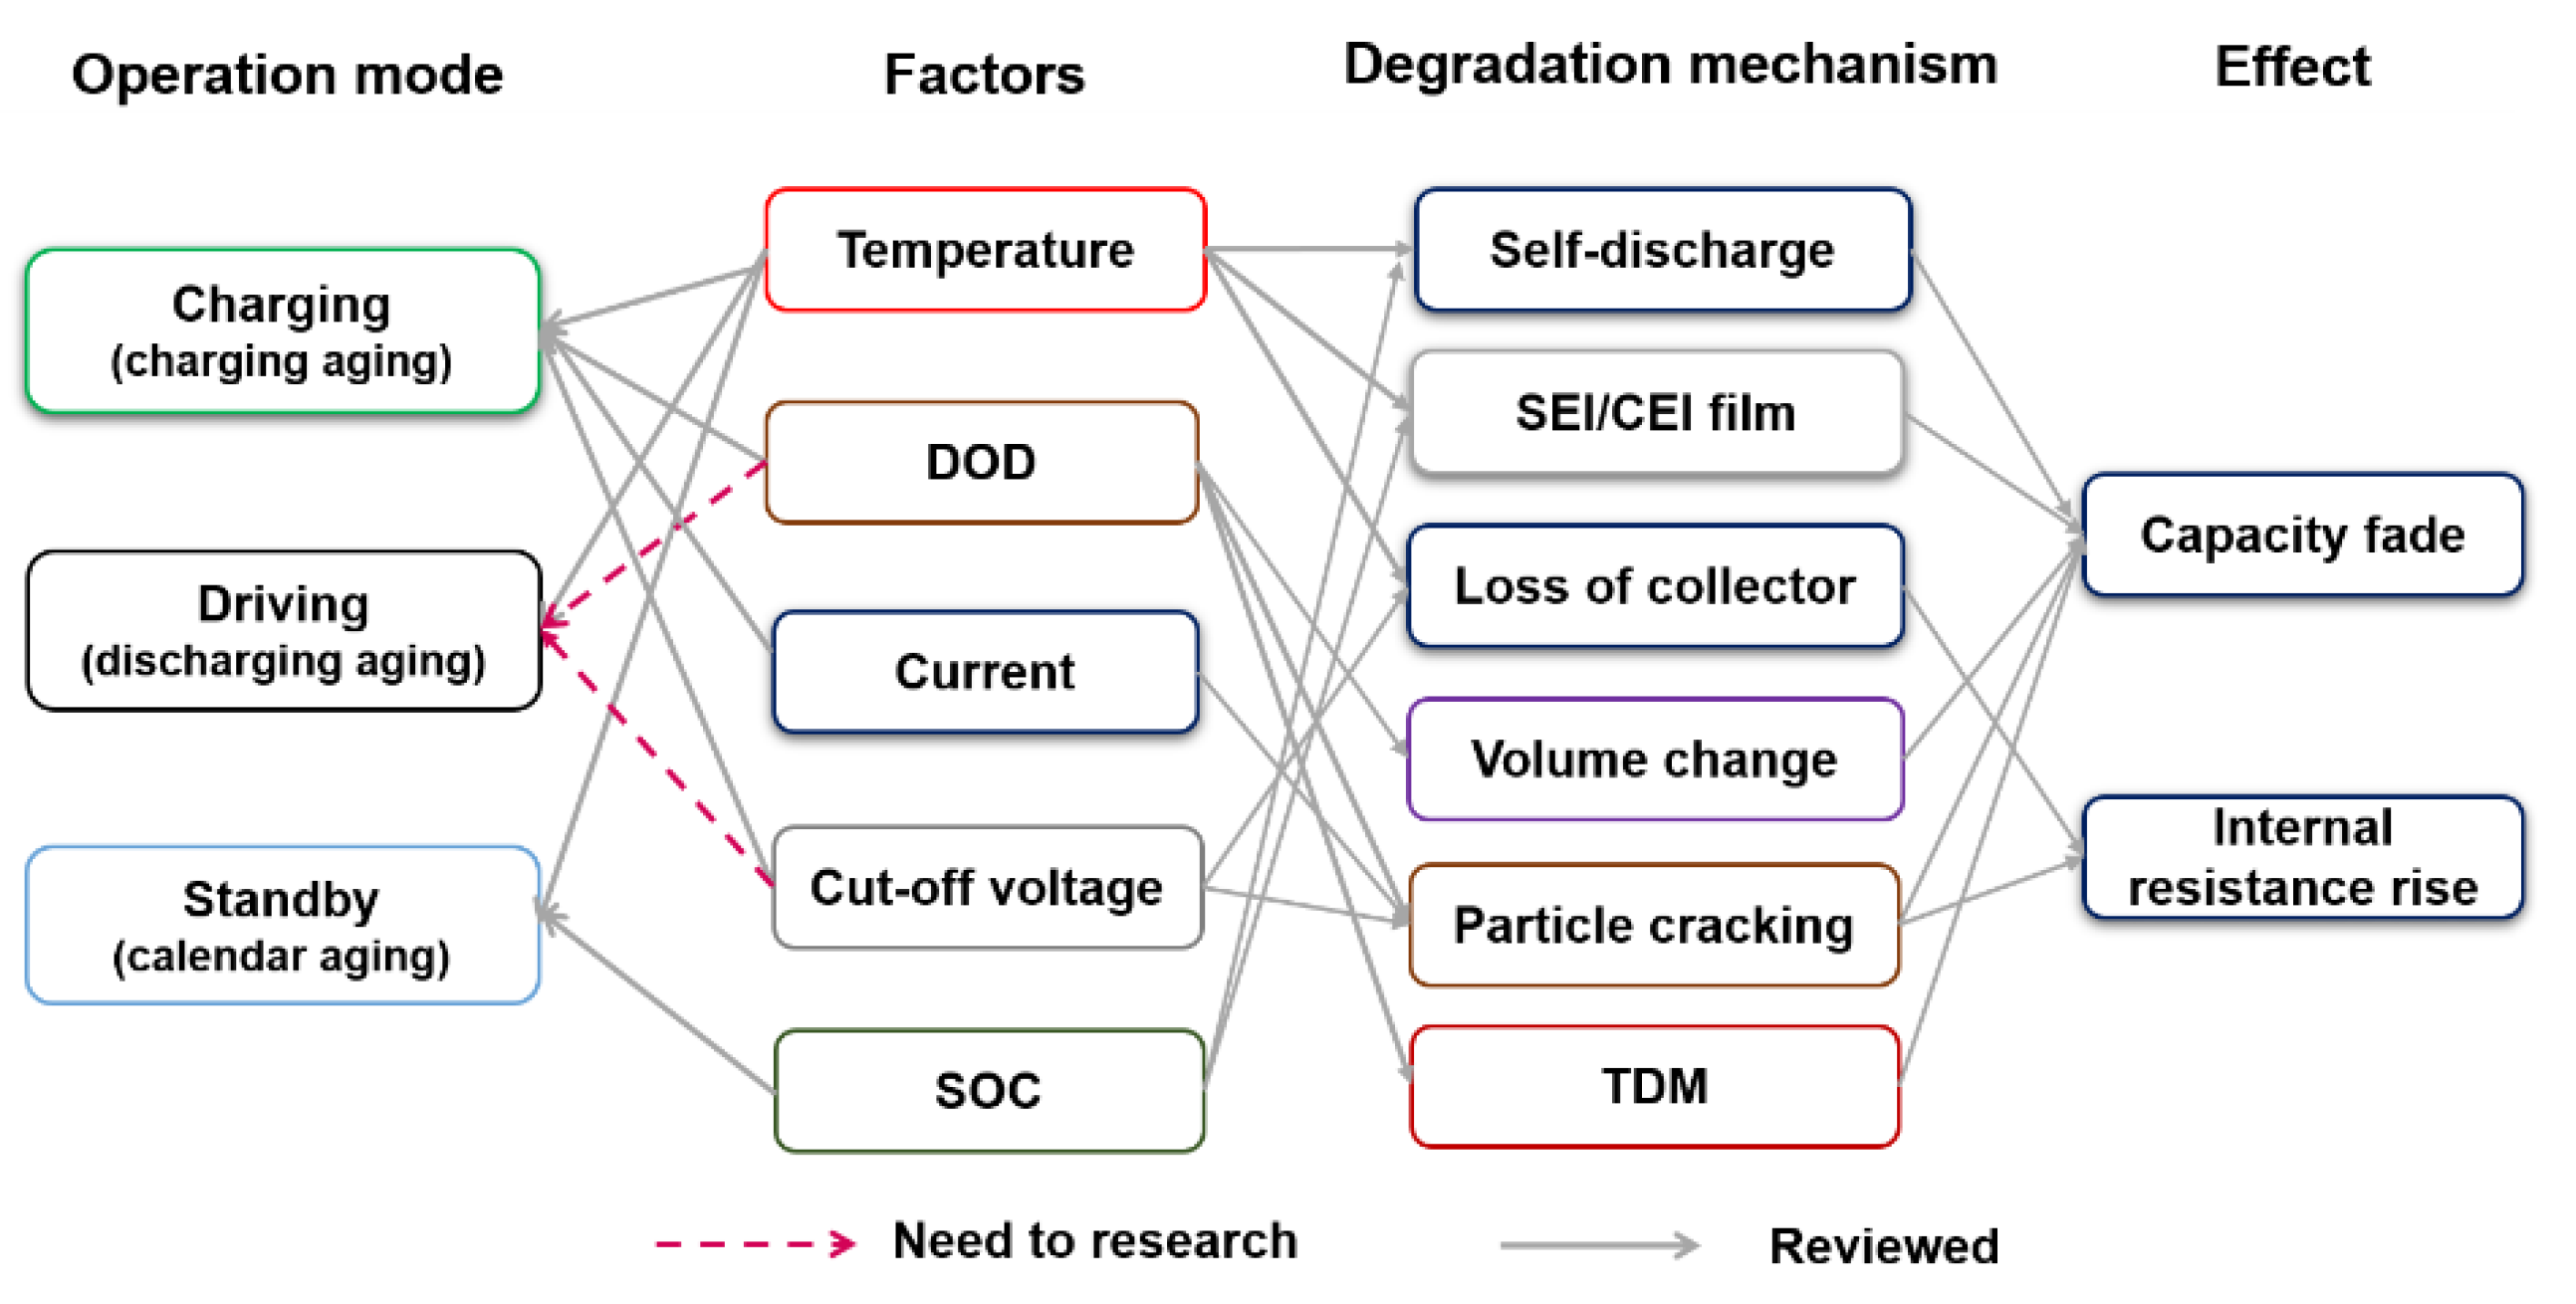
The long-term operation of LiBs in EVs involves many complex aging mechanisms. According to different application scenarios, this paper analyzes the battery aging behavior under EV charging, standby, and driving conditions, respectively. For all of the aforementioned conditions, we have individually linked the battery stress factors (e.g., temperature, cut-off voltage, etc.) to the battery performance and degradation behavior in EV applications. The effect of these stress factors (i.e., temperature, SOC, current, cut-off voltage, and DOD) on the degradation of the battery cathode, electrolyte, and anode is then fully analyzed. Therefore, this article provides a comprehensive review of the degradation of the battery performance parameters under EV operation, using driving cycles.
By minimizing exposure to the conditions that most accelerate battery aging, the life-span of the battery can be prolonged. High-temperature operation will cause side reactions in the battery, while lithium metalization on the anode is accelerated at low temperatures. Furthermore, a high charging current reduces the EV charging time but accelerate the battery aging to a significant extent. Finally, the high SOC operation (e.g., high cut-off voltage, idling at high SOC, and/or cycling at high DOD) also lead to accelerated degradation on the battery. All of these factors, which are specific to the EV battery operation, the triggered degradation mechanisms, and the effect on the battery performance parameters, are illustrated in Figure 15.
However, the battery degradation problem still needs further research, especially regarding EVs operation. At present, the literature regarding battery performance-degradation and subsequent aging mechanism identification is very limited and, frequently, is based on data that is obtained using standardized driving cycles, which do not always reflect the real-life battery operation in EVs.
Author Contributions
J.G. wrote the paper, J.G. and D.-I.S., designed the structures of the paper; Y.L. and K.P. reviewed the paper. All authors have read and agreed to the published version of the manuscript.
Funding
J.G. was supported by a grant from the China Scholarship Council (no. 202006370035); Y.L. was supported by a grant from the China Scholarship Council (no. 202006220024).
Institutional Review Board Statement
Not applicable.
Informed Consent Statement
Not applicable.
Data Availability Statement
Not applicable.
Conflicts of Interest
The authors declare no conflict of interest.
References
- Deng, J.; Bae, C.; Denlinger, A.; Miller, T. Electric Vehicles Batteries: Requirements and Challenges. Joule 2020, 4, 511–515. [Google Scholar] [CrossRef]
- Albertsen, L.; Richter, J.L.; Peck, P.; Dalhammar, C.; Plepys, A. Circular business models for electric vehicle lithium-ion batteries: An analysis of current practices of vehicle manufacturers and policies in the EU. Resour. Conserv. Recycl. 2021, 172, 105658. [Google Scholar] [CrossRef]
- Pellow, M.A.; Ambrose, H.; Mulvaney, D.; Betita, R.; Shaw, S. Research gaps in environmental life cycle assessments of lithium ion batteries for grid-scale stationary energy storage systems: End-of-life options and other issues. Sustain. Mater. Technol. 2020, 23, e00120. [Google Scholar] [CrossRef]
- El Ghossein, N.; Sari, A.; Venet, P.; Genies, S.; Azaïs, P. Post-Mortem Analysis of Lithium-Ion Capacitors after Accelerated Aging Tests. J. Energy Storage 2021, 33, 102039. [Google Scholar] [CrossRef]
- Han, X.; Lu, L.; Zheng, Y.; Feng, X.; Li, Z.; Li, J.; Ouyang, M. A review on the key issues of the lithium ion battery degradation among the whole life cycle. eTransportation 2019, 1, 100005. [Google Scholar] [CrossRef]
- Tian, H.; Qin, P.; Li, K.; Zhao, Z. A review of the state of health for lithium-ion batteries: Research status and suggestions. J. Clean. Prod. 2020, 261, 120813. [Google Scholar] [CrossRef]
- Mocera, F.; Soma, A.; Clerici, D. Study of aging mechanisms in lithium-ion batteries for working vehicle applications. In Proceedings of the 2020 Fifteenth International Conference on Ecological Vehicles and Renewable Energies, Monte-Carlo, Monaco, 10–12 September 2020. [Google Scholar]
- Woody, M.; Arbabzadeh, M.; Lewis, G.M.; Keoleian, G.A.; Stefanopoulou, A. Strategies to limit degradation and maximize Li-ion battery service lifetime-Critical review and guidance for stakeholders. J. Energy Storage 2020, 28, 101231. [Google Scholar] [CrossRef]
- Balakrishnan, P.G.; Ramesh, R.; Prem Kumar, T. Safety mechanisms in lithium-ion batteries. J. Power Sources 2006, 155, 401–414. [Google Scholar] [CrossRef]
- Broussely, M.; Biensan, P.; Bonhomme, F.; Blanchard, P.; Herreyre, S.; Nechev, K.; Staniewicz, R.J. Main aging mechanisms in Li ion batteries. J. Power Sources 2005, 146, 90–96. [Google Scholar] [CrossRef]
- Barré, A.; Deguilhem, B.; Grolleau, S.; Gérard, M.; Suard, F.; Riu, D. A review on lithium-ion battery ageing mechanisms and estimations for automotive applications. J. Power Sources 2013, 241, 680–689. [Google Scholar] [CrossRef] [Green Version]
- Birkl, C.R.; Roberts, M.R.; McTurk, E.; Bruce, P.G.; Howey, D.A. Degradation diagnostics for lithium ion cells. J. Power Sources 2017, 341, 373–386. [Google Scholar] [CrossRef]
- Palacín, M.R. Understanding ageing in Li-ion batteries: A chemical issue. Chem. Soc. Rev. 2018, 47, 4924–4933. [Google Scholar] [CrossRef]
- Xiong, R.; Pan, Y.; Shen, W.; Li, H.; Sun, F. Lithium-ion battery aging mechanisms and diagnosis method for automotive applications: Recent advances and perspectives. Renew. Sustain. Energy Rev. 2020, 131, 110048. [Google Scholar] [CrossRef]
- Teichert, P.; Eshetu, G.G.; Jahnke, H.; Figgemeier, E. Degradation and aging routes of ni-rich cathode based li-ion batteries. Batteries 2020, 6, 8. [Google Scholar] [CrossRef] [Green Version]
- Alipour, M.; Ziebert, C.; Conte, F.V.; Kizilel, R. A review on temperature-dependent electrochemical properties, aging, and performance of lithium-ion cells. Batteries 2020, 6, 35. [Google Scholar] [CrossRef]
- Chen, Y.; Kang, Y.; Zhao, Y.; Wang, L.; Liu, J.; Li, Y.; Liang, Z.; He, X.; Li, X.; Tavajohi, N.; et al. A review of lithium-ion battery safety concerns: The issues, strategies, and testing standards. J. Energy Chem. 2021, 59, 83–99. [Google Scholar] [CrossRef]
- Yang, S.; Zhang, C.; Jiang, J.; Zhang, W.; Zhang, L.; Wang, Y. Review on state-of-health of lithium-ion batteries: Characterizations, estimations and applications. J. Clean. Prod. 2021, 314, 128015. [Google Scholar] [CrossRef]
- Balali, Y.; Stegen, S. Review of energy storage systems for vehicles based on technology, environmental impacts, and costs. Renew. Sustain. Energy Rev. 2021, 135, 110185. [Google Scholar] [CrossRef]
- Tesla Other Europe. Powerwall. Available online: https://www.tesla.com/en_eu/powerwall (accessed on 18 July 2021).
- Gerssen-Gondelach, S.J.; Faaij, A.P.C. Performance of batteries for electric vehicles on short and longer term. J. Power Sources 2012, 212, 111–129. [Google Scholar] [CrossRef]
- Ajanovic, A.; Haas, R. Electric vehicles: Solution or new problem? Environ. Dev. Sustain. 2018, 20, 7–22. [Google Scholar] [CrossRef]
- Ahmadian, A.; Mohammadi-Ivatloo, B.; Elkamel, A. A Review on Plug-in Electric Vehicles: Introduction, Current Status, and Load Modeling Techniques. J. Mod. Power Syst. Clean Energy 2020, 8, 412–425. [Google Scholar] [CrossRef]
- EVD Compare Hybrid and Electric Vehicles-EV Database UK 2019. Available online: https://ev-database.uk/ (accessed on 18 July 2021).
- Bureau of Transportation Statistics. Hybrid-Electric, Plug-in Hybrid-Electric and Electric Vehicle Sales. Available online: https://www.bts.gov/content/gasoline-hybrid-and-electric-vehicle-sales (accessed on 18 July 2021).
- Li, Y.; Guo, J.; Chen, Y.; Deng, S.; Zhu, J.; Cao, G.; Lei, T.; Zhang, J. Phase transition regulation and Cd-O/Cd-F compounds multi-effect. Ionics 2020, 26, 1681–1693. [Google Scholar] [CrossRef]
- Zhang, B.; Xu, Y.; Wang, J.; Lin, J.; Wang, C.; Chen, Y. Lanthanum and cerium Co-doped LiFePO4: Morphology, electrochemical performance and kinetic study from −30–+50 °C. Electrochim. Acta 2019, 322, 134686. [Google Scholar] [CrossRef]
- Sui, X.; Świerczyński, M.; Teodorescu, R.; Stroe, D.I. The degradation behavior of lifepo4/c batteries during long-term calendar aging. Energies 2021, 14, 1732. [Google Scholar] [CrossRef]
- Zhu, J.; Cao, G.; Li, Y.; Wang, S.; Deng, S.; Guo, J.; Chen, Y.; Lei, T.; Zhang, J.; Chang, S. Nd2O3 encapsulation-assisted surface passivation of Ni-rich LiNi0.8Co0.1Mn0.1O2 active material and its electrochemical performance. Electrochim. Acta 2019, 325, 134889. [Google Scholar] [CrossRef]
- Wu, F.; Maier, J.; Yu, Y. Guidelines and trends for next-generation rechargeable lithium and lithium-ion batteries. Chem. Soc. Rev. 2020, 49, 1569–1614. [Google Scholar] [CrossRef] [PubMed]
- Li, W.; Lee, S.; Manthiram, A. High-Nickel NMA: A Cobalt-Free Alternative to NMC and NCA Cathodes for Lithium-Ion Batteries. Adv. Mater. 2020, 32, 2002718. [Google Scholar] [CrossRef]
- Xu, L.; Zhou, F.; Liu, B.; Zhou, H.; Zhang, Q.; Kong, J.; Wang, Q. Cathode Material for High Energy Density Li-Ion Batteries. Int. J. Electrochem. 2018, 2018, 6930386. [Google Scholar] [CrossRef] [Green Version]
- Noh, H.; Youn, S.; Seung, C.; Sun, Y. Comparison of the structural and electrochemical properties cathode material for lithium-ion batteries. Power Sources 2013, 233, 121–130. [Google Scholar] [CrossRef]
- Zheng, J.; Yang, Z.; Dai, A.; Tang, L.; Wei, H.; Li, Y.; He, Z.; Lu, J. Boosting Cell Performance of LiNi0.8Co0.15Al0.05O2 via Surface Structure Design. Small 2019, 15, 1904854. [Google Scholar] [CrossRef] [PubMed]
- Hu, G.; Liu, W.; Peng, Z.; Dua, K.; Cao, Y. Synthesis and electrochemical properties of LiNi0.8Co0.15Al0.05O2 prepared from the precursor Ni0.8Co0.15Al0.05OOH. J. Power Sources 2012, 198, 258–263. [Google Scholar] [CrossRef]
- Wang, S.; Li, Y.; Liu, S.; Deng, S.; Chen, Y.; Zhu, J.; Zhang, J.; Guo, J.; Chang, S. Superior Electrochemical and Kinetics Performance of LiNi0.8Co0.15Al0.05O2 Cathode by Neodymium Synergistic Modifying for Lithium Ion Batteries. J. Electrochem. Soc. 2020, 167, 090509. [Google Scholar] [CrossRef]
- He, Y.F.; Chu, D.Y.; Zhuo, Z. Cycle Stability of Dual-Phase Lithium Titanate (LTO)/TiO2 Nanowires as Lithium Battery Anode. J. Multidiscip. Appl. Nat. Sci. 2021, 1, 54–61. [Google Scholar] [CrossRef]
- Keil, P.; Jossen, A. Charging protocols for lithium-ion batteries and their impact on cycle life-An experimental study with different 18650 high-power cells. J. Energy Storage 2016, 6, 125–141. [Google Scholar] [CrossRef]
- Tomaszewska, A.; Chu, Z.; Feng, X.; O’Kane, S.; Liu, X.; Chen, J.; Ji, C.; Endler, E.; Li, R.; Liu, L.; et al. Lithium-ion battery fast charging: A review. eTransportation 2019, 1, 100011. [Google Scholar] [CrossRef]
- Serhan, H.A.; Ahmed, E.M. Effect of the different charging techniques on battery life-time: Review. In Proceedings of the 2018 International Conference on Innovative Trends in Computer Engineering, ITCE, Aswan, Egypt, 19–21 February 2018; pp. 421–426. [Google Scholar] [CrossRef]
- Huang, X.; Li, Y.; Acharya, A.B.; Sui, X.; Meng, J.; Teodorescu, R.; Stroe, D.I. A review of pulsed current technique for lithium-ion batteries. Energies 2020, 13, 2458. [Google Scholar] [CrossRef]
- Attia, P.M.; Grover, A.; Jin, N.; Severson, K.A.; Markov, T.M.; Liao, Y.H.; Chen, M.H.; Cheong, B.; Perkins, N.; Yang, Z.; et al. Closed-loop optimization of fast-charging protocols for batteries with machine learning. Nature 2020, 578, 397–402. [Google Scholar] [CrossRef] [PubMed] [Green Version]
- Huang, X.; Li, Y.; Meng, J.; Sui, X.; Teodorescu, R.; Stroe, D.I. The Effect of Pulsed Current on the Performance of Lithium-ion Batteries. In Proceedings of the ECCE 2020-IEEE Energy Conversion Congress and Exposition, Detroit, MI, USA, 11–15 October 2020; pp. 5633–5640. [Google Scholar] [CrossRef]
- Paul, T.; Mesbahi, T.; Durand, S.; Flieller, D.; Uhring, W. Study and influence of standardized driving cycles on the sizing of li-ion battery / supercapacitor hybrid energy storage. In Proceedings of the 2019 IEEE Vehicle Power and Propulsion Conference, VPPC 2019-Proceedings, Hanoi, Vietnam, 14–17 October 2019. [Google Scholar] [CrossRef]
- Sikha, G.; Ramadass, P.; Haran, B.S.; White, R.E.; Popov, B.N. Comparison of the capacity fade of Sony US 18650 cells charged with different protocols. J. Power Sources 2003, 122, 67–76. [Google Scholar] [CrossRef]
- Varga, B.O.; Sagoian, A.; Mariasiu, F. Prediction of electric vehicle range: A comprehensive review of current issues and challenges. Energies 2019, 12, 946. [Google Scholar] [CrossRef] [Green Version]
- Jafari, M.; Gauchia, A.; Zhao, S.; Zhang, K.; Gauchia, L. Electric Vehicle Battery Cycle Aging Evaluation in Real-World Daily Driving and Vehicle-to-Grid Services. IEEE Trans. Transp. Electrif. 2017, 4, 122–134. [Google Scholar] [CrossRef]
- Patel, S.S.; Asakit, J. Real Driving Particulate Emissions from a Gasoline PHEV. Master’s Thesis, Chalmers University of Technology, Goteborg, Sweden, 2020. [Google Scholar]
- Ben-marzouk, M.; Pelissier, S.; Clerc, G.; Member, S.; Sari, A. Generation of a real-life battery usage pattern for electrical vehicle application and aging comparison with the WLTC profile. IEEE Trans. Veh. Technol. 2021, 9545, 5618–5627. [Google Scholar] [CrossRef]
- Eddahech, A.; Briat, O.; Woirgard, E.; Vinassa, J.M. Remaining useful life prediction of lithium batteries in calendar ageing for automotive applications. Microelectron. Reliab. 2012, 52, 2438–2442. [Google Scholar] [CrossRef]
- Swierczynski, M.; Stroe, D.I.; Stan, A.I.; Teodorescu, R.; Kær, S.K. Lifetime Estimation of the Nanophosphate LiFePO4/C Battery Chemistry Used in Fully Electric Vehicles. IEEE Trans. Ind. Appl. 2015, 51, 3453–3461. [Google Scholar] [CrossRef]
- Liu, J.; Duan, Q.; Ma, M.; Zhao, C.; Sun, J.; Wang, Q. Aging mechanisms and thermal stability of aged commercial 18650 lithium ion battery induced by slight overcharging cycling. J. Power Sources 2020, 445, 227263. [Google Scholar] [CrossRef]
- Mathieu, R.; Briat, O.; Gyan, P.; Vinassa, J.M. Comparison of the impact of fast charging on the cycle life of three lithium-ion cells under several parameters of charge protocol and temperatures. Appl. Energy 2021, 283, 116344. [Google Scholar] [CrossRef]
- Zhu, J.; Dewi Darma, M.S.; Knapp, M.; Sørensen, D.R.; Heere, M.; Fang, Q.; Wang, X.; Dai, H.; Mereacre, L.; Senyshyn, A.; et al. Investigation of lithium-ion battery degradation mechanisms by combining differential voltage analysis and alternating current impedance. J. Power Sources 2020, 448, 28–30. [Google Scholar] [CrossRef]
- Spingler, F.B.; Wittmann, W.; Sturm, J.; Rieger, B.; Jossen, A. Optimum fast charging of lithium-ion pouch cells based on local volume expansion criteria. J. Power Sources 2018, 393, 152–160. [Google Scholar] [CrossRef]
- You, H.; Dai, H.; Li, L. The Aging Law of Low Temperature Charging of Lithium-Ion Battery; SAE Technical Papers; Tongji University: Shanghai, China, 2019. [Google Scholar]
- Lindgren, J.; Lund, P.D. Effect of extreme temperatures on battery charging and performance of electric vehicles. J. Power Sources 2016, 328, 37–45. [Google Scholar] [CrossRef]
- Stroe, D.I.; Swierczynski, M.; Kær, S.K.; Laserna, E.M.; Zabala, E.S. Accelerated aging of lithium-ion batteries based on electric vehicle mission profile. In Proceedings of the 2017 IEEE Energy Conversion Congress and Exposition, ECCE 2017, Cincinnati, OH, USA, 1–5 October 2017; pp. 5631–5637. [Google Scholar] [CrossRef] [Green Version]
- Hosen, M.S.; Karimi, D.; Kalogiannis, T.; Pirooz, A.; Jaguemont, J.; Berecibar, M.; Van Mierlo, J. Electro-aging model development of nickel-manganese-cobalt lithium-ion technology validated with light and heavy-duty real-life profiles. J. Energy Storage 2020, 28, 101265. [Google Scholar] [CrossRef]
- Simolka, M.; Heger, J.F.; Kaess, H.; Biswas, I.; Friedrich, K.A. Influence of cycling profile, depth of discharge and temperature on commercial LFP/C cell ageing: Post-mortem material analysis of structure, morphology and chemical composition. J. Appl. Electrochem. 2020, 50, 1101–1117. [Google Scholar] [CrossRef]
- Ouyang, D.; Weng, J.; Chen, M.; Liu, J.; Wang, J. Experimental analysis on the degradation behavior of overdischarged lithium-ion battery combined with the effect of high-temperature environment. Int. J. Energy Res. 2020, 44, 229–241. [Google Scholar] [CrossRef]
- Lai, X.; Zheng, Y.; Zhou, L.; Gao, W. Electrical behavior of overdischarge-induced internal short circuit in lithium-ion cells. Electrochim. Acta 2018, 278, 245–254. [Google Scholar] [CrossRef]
- Ouyang, D.; Chen, M.; Liu, J.; Wei, R.; Weng, J.; Wang, J. Investigation of a commercial lithium-ion battery under overcharge/over-discharge failure conditions. RSC Adv. 2018, 8, 33414–33424. [Google Scholar] [CrossRef] [Green Version]
- De Hoog, J.; Timmermans, J.M.; Ioan-Stroe, D.; Swierczynski, M.; Jaguemont, J.; Goutam, S.; Omar, N.; Van Mierlo, J.; Van Den Bossche, P. Combined cycling and calendar capacity fade modeling of a Nickel-Manganese-Cobalt Oxide Cell with real-life profile validation. Appl. Energy 2017, 200, 47–61. [Google Scholar] [CrossRef]
- Bank, T.; Feldmann, J.; Klamor, S.; Bihn, S.; Sauer, D.U. Extensive aging analysis of high-power lithium titanate oxide batteries: Impact of the passive electrode effect. J. Power Sources 2020, 473, 228566. [Google Scholar] [CrossRef]
- Stroe, D.I.; Schaltz, E. Lithium-Ion Battery State-of-Health Estimation Using the Incremental Capacity Analysis Technique. IEEE Trans. Ind. Appl. 2020, 56, 678–685. [Google Scholar] [CrossRef]
- Ben-Marzouk, M.; Chaumond, A.; Redondo-Iglesias, E.; Montaru, M.; Pélissier, S. Experimental protocols and first results of calendar and/or cycling aging study of lithium-ion batteries-The MOBICUS project. World Electr. Veh. J. 2016, 8, 388–397. [Google Scholar] [CrossRef] [Green Version]
- Liu, K.; Ashwin, T.R.; Hu, X.; Lucu, M.; Widanage, W.D. An evaluation study of different modelling techniques for calendar ageing prediction of lithium-ion batteries. Renew. Sustain. Energy Rev. 2020, 131, 110017. [Google Scholar] [CrossRef]
- Keil, P.; Jossen, A. Impact of Dynamic Driving Loads and Regenerative Braking on the Aging of Lithium-Ion Batteries in Electric Vehicles. J. Electrochem. Soc. 2017, 164, A3081–A3092. [Google Scholar] [CrossRef]
- Keil, P.; Schuster, S.F.; Wilhelm, J.; Travi, J.; Hauser, A.; Karl, R.C.; Jossen, A. Calendar Aging of Lithium-Ion Batteries. J. Electrochem. Soc. 2016, 163, A1872–A1880. [Google Scholar] [CrossRef]
- Zilberman, I.; Sturm, J.; Jossen, A. Reversible self-discharge and calendar aging of 18650 nickel-rich, silicon-graphite lithium-ion cells. J. Power Sources 2019, 425, 217–226. [Google Scholar] [CrossRef]
- Wang, D.; Coignard, J.; Zeng, T.; Zhang, C.; Saxena, S. Quantifying electric vehicle battery degradation from driving vs. vehicle-to-grid services. J. Power Sources 2016, 332, 193–203. [Google Scholar] [CrossRef] [Green Version]
- Yang, S.; Deng, C.; Zhang, Y.; He, Y. State of charge estimation for lithium-ion battery with a temperature-compensated model. Energies 2017, 10, 1560. [Google Scholar] [CrossRef] [Green Version]
- Han, Y.; Heng, S.; Wang, Y.; Qu, Q.; Zheng, H. Anchoring Interfacial Nickel Cations on Single-Crystal LiNi0.8Co0.1Mn0.1O2 Cathode Surface via Controllable Electron Transfer. ACS Energy Lett. 2020, 5, 2421–2433. [Google Scholar] [CrossRef]
- Guo, J.; Li, Y.; Chen, Y.; Deng, S.; Zhu, J.; Wang, S.; Zhang, J.; Chang, S.; Zhang, D.; Xi, X. Stable interface Co3O4 -coated LiNi0.5 Mn1.5 O4 for lithium-ion batteries. J. Alloys Compd. 2019, 811, 152031. [Google Scholar] [CrossRef]
- Zhou, R.; Huang, J.; Lai, S.; Li, J.; Wang, F.; Chen, Z.; Lin, W.; Li, C.; Wang, J.; Zhao, J. A bifunctional electrolyte additive for H2O/HF scavenging and enhanced graphite/LiNi0.5Co0.2Mn0.3O2 cell performance at a high voltage. Sustain. Energy Fuels 2018, 2, 1481–1490. [Google Scholar] [CrossRef]
- Hemmelmann, H.; Dinter, J.K.; Elm, M.T. Thin Film NCM Cathodes as Model Systems to Assess the Influence of Coating Layers on the Electrochemical Performance of Lithium Ion Batteries. Adv. Mater. Interfaces 2021, 8, 2002074. [Google Scholar] [CrossRef]
- Jie, Y.; Ren, X.; Cao, R.; Cai, W.; Jiao, S. Advanced Liquid Electrolytes for Rechargeable Li Metal Batteries. Adv. Funct. Mater. 2020, 30, 1910777. [Google Scholar] [CrossRef]
- Hekmatfar, M.; Hasa, I.; Eghbal, R.; Carvalho, D.V.; Moretti, A.; Passerini, S. Effect of Electrolyte Additives on the LiNi0.5Mn0.3Co0.2O2 Surface Film Formation with Lithium and Graphite Negative Electrodes. Adv. Mater. Interfaces 2020, 7, 1901500. [Google Scholar] [CrossRef] [Green Version]
- Zhao, C.Z.; Zhao, Q.; Liu, X.; Zheng, J.; Stalin, S.; Zhang, Q.; Archer, L.A. Rechargeable Lithium Metal Batteries with an In-Built Solid-State Polymer Electrolyte and a High Voltage/Loading Ni-Rich Layered Cathode. Adv. Mater. 2020, 32, 1905629. [Google Scholar] [CrossRef]
- Li, Y.; Wan, S.; Veith, G.M.; Unocic, R.R.; Paranthaman, M.P.; Dai, S.; Sun, X.G. A Novel Electrolyte Salt Additive for Lithium-Ion Batteries with Voltages Greater than 4.7 V. Adv. Energy Mater. 2017, 7, 1601397. [Google Scholar] [CrossRef]
- Heiskanen, S.K.; Kim, J.; Lucht, B.L. Generation and Evolution of the Solid Electrolyte Interphase of Lithium-Ion Batteries. Joule 2019, 3, 2322–2333. [Google Scholar] [CrossRef]
- Horsthemke, F.; Leißing, M.; Winkler, V.; Friesen, A.; Ibing, L.; Winter, M.; Nowak, S. Development of a lithium ion cell enabling in situ analyses of the electrolyte using gas chromatographic techniques. Electrochim. Acta 2020, 338, 135894. [Google Scholar] [CrossRef]
- Wang, C.; Yu, L.; Fan, W.; Liu, J.; Ouyang, L.; Yang, L.; Zhu, M. Lithium Difluorophosphate As a Promising Electrolyte Lithium Additive for High-Voltage Lithium-Ion Batteries. ACS Appl. Energy Mater. 2018, 1, 2647–2656. [Google Scholar] [CrossRef]
- Deng, K.; Zeng, Q.; Wang, D.; Liu, Z.; Wang, G.; Qiu, Z.; Zhang, Y.; Xiao, M.; Meng, Y. Nonflammable organic electrolytes for high-safety lithium-ion batteries. Energy Storage Mater. 2020, 32, 425–447. [Google Scholar] [CrossRef]
- Schultz, C.; Vedder, S.; Streipert, B.; Winter, M.; Nowak, S. Quantitative investigation of the decomposition of organic lithium ion battery electrolytes with LC-MS/MS. RSC Adv. 2017, 7, 27853–27862. [Google Scholar] [CrossRef] [Green Version]
- Rinkel, B.L.D.; Hall, D.S.; Temprano, I.; Grey, C.P. Electrolyte oxidation pathways in lithium-ion batteries. J. Am. Chem. Soc. 2020, 142, 15058–15074. [Google Scholar] [CrossRef]
- Gerelt-Od, B.; Kim, J.; Shin, E.; Kang, H.; Kim, N.; Jo, C.; Son, H.; Yoon, S. In situ Raman investigation of resting thermal effects on gas emission in charged commercial 18650 lithium ion batteries. J. Ind. Eng. Chem. 2021, 96, 339–344. [Google Scholar] [CrossRef]
- Fedorov, R.G.; Maletti, S.; Heubner, C.; Michaelis, A.; Ein-Eli, Y. Molecular Engineering Approaches to Fabricate Artificial Solid-Electrolyte Interphases on Anodes for Li-Ion Batteries: A Critical Review. Adv. Energy Mater. 2021, 2101173, 2101173. [Google Scholar] [CrossRef]
- An, S.J.; Li, J.; Daniel, C.; Mohanty, D.; Nagpure, S.; Wood, D.L. The state of understanding of the lithium-ion-battery graphite solid electrolyte interphase (SEI) and its relationship to formation cycling. Carbon 2016, 105, 52–76. [Google Scholar] [CrossRef] [Green Version]
- Agubra, V.; Fergus, J. Lithium ion battery anode aging mechanisms. Materials 2013, 6, 1310–1325. [Google Scholar] [CrossRef] [PubMed] [Green Version]
- Yan, C.; Cheng, X.B.; Tian, Y.; Chen, X.; Zhang, X.Q.; Li, W.J.; Huang, J.Q.; Zhang, Q. Dual-Layered Film Protected Lithium Metal Anode to Enable Dendrite-Free Lithium Deposition. Adv. Mater. 2018, 30, 1707629. [Google Scholar] [CrossRef] [PubMed]
- Xu, X.L.; Wang, S.J.; Wang, H.; Xu, B.; Hu, C.; Jin, Y.; Liu, J.B.; Yan, H. The suppression of lithium dendrite growth in lithium sulfur batteries: A review. J. Energy Storage 2017, 13, 387–400. [Google Scholar] [CrossRef]
- Persson, K.; Sethuraman, V.A.; Hardwick, L.J.; Hinuma, Y.; Meng, Y.S.; Van Der Ven, A.; Srinivasan, V.; Kostecki, R.; Ceder, G. Lithium diffusion in graphitic carbon. J. Phys. Chem. Lett. 2010, 1, 1176–1180. [Google Scholar] [CrossRef] [Green Version]
- Li, J.; Xing, L.; Zhang, L.; Yu, L.; Fan, W.; Xu, M.; Li, W. Insight into self-discharge of layered lithium-rich oxide cathode in carbonate-based electrolytes with and without additive. J. Power Sources 2016, 324, 17–25. [Google Scholar] [CrossRef]
- Liao, X.; Huang, Q.; Mai, S.; Wang, X.; Xu, M.; Xing, L.; Liao, Y.; Li, W. Understanding self-discharge mechanism of layered nickel cobalt manganese oxide at high potential. J. Power Sources 2015, 286, 551–556. [Google Scholar] [CrossRef]
Figure 1.
The schematic representation of the three types of EVs; from left to right: Battery Electric Vehicles (BEV), Hybrid Electric Vehicles (HEV), and Plug-In Hybrid Electric Vehicles (PHEV).
Figure 1.
The schematic representation of the three types of EVs; from left to right: Battery Electric Vehicles (BEV), Hybrid Electric Vehicles (HEV), and Plug-In Hybrid Electric Vehicles (PHEV).

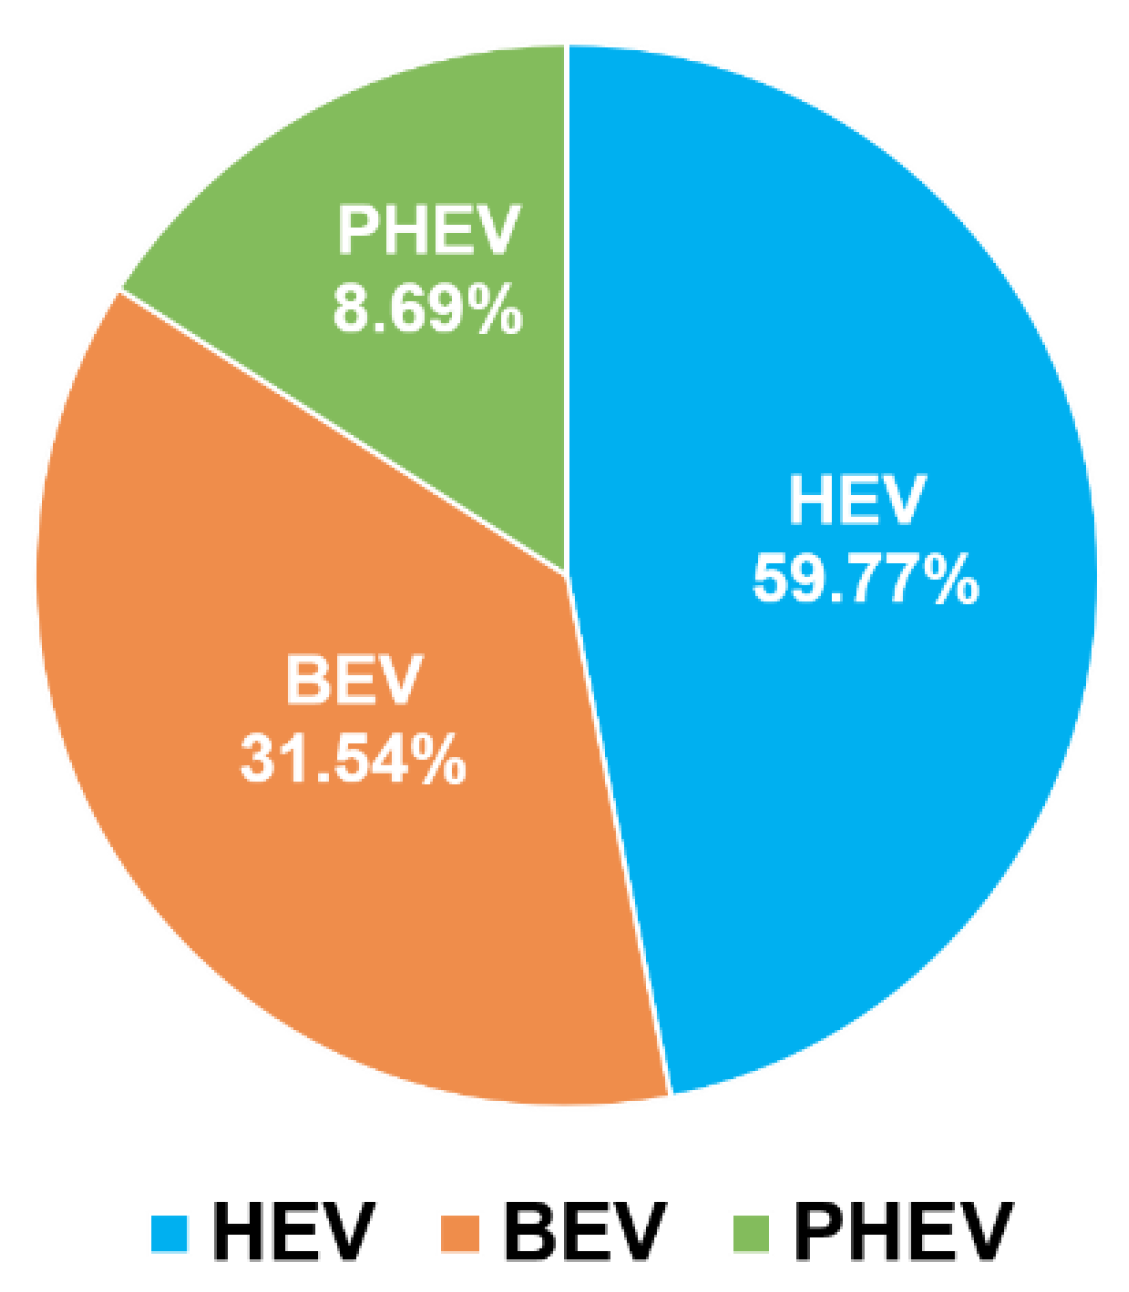
Figure 2.
The global market share of HEV, PHEV, and BEV in 2020 (based on [25]).
Figure 2.
The global market share of HEV, PHEV, and BEV in 2020 (based on [25]).

Figure 3.
The battery operation modes in EV applications.

Figure 4.
Schematic illustration of different charging protocols: (a) Constant Current Constant Voltage (CC-CV); (b) Multistage Constant Current (MCC); (c) Pulse Charging (PC); (d) Constant Power Constant Voltage (CP-CV); (e) Variable Current Profile (VCP); (f) Constant Current Pulsed Charging (CC-PC).

Figure 5.
The driving cycle profiles of (a) UDDS, (b) NEDC and (c) WLTC for a class 3 vehicle.

Figure 6.
Evolution of the capacity of the batteries according to Ah exchanged for each aging profile [49].
Figure 6.
Evolution of the capacity of the batteries according to Ah exchanged for each aging profile [49].

Figure 7.
The influence on the battery aging from the factors of the charging process.

Figure 8.
The effect of the charging voltage on the battery capacity fade. (a) the schematic diagram of slight overcharging; (b) charging/discharging profiles for standard and overcharge cells, (c) capacity fading of three LiBs under the same overcharging cycling condition (2.75–4.5 V) [52]. (d) the schematic diagram of reduction in cut-off voltage; (e) the capacity fade curves for cell A, (f) the capacity fade curves for cell B [53]. (g) the schematic diagram of CC charging protocol; (h) capacity degradation curves based on cycles; (i) capacity degradation curves based on throughput [54].

Figure 9.
(a) Capacity loss and irreversible expansion per cycle as a function of C-rate in CC-CV charging [55]; (b,c) cycle life for different combinations of moderate (3 A) and high (5 A) charging current Ich and discharging current Idis [38]; (d,e) impact of charge current Ich on cycle life at 25 °C for two types of batteries [53].

Figure 10.
The influence in battery aging from common factors in driving (WLTC) test.

Figure 11.
(a) One−day load current profile for accelerated aging based on WLTC driving cycle; (b) capacity fade of the tested NMC-based cells during eleven months of accelerated aging tests; (c) correlation between the monthly measured battery capacity fade and the considered temperature; (d) measured internal resistance increase at different SOC [58].

Figure 12.
Battery performance-degradation during standby operation; (a) the influence of temperature and SOC on the battery capacity during calendar aging [64]; (b) self-discharge current for different temperature and SOCs [71].

Figure 13.
The main degradation mechanisms at the cathode of a lithium-ion battery.

Figure 14.
The main degradation mechanism at the anode side of a lithium-ion battery.

Figure 15.
The main degradation mechanism of batteries in EV applications.


Table 1.
An overview of the published literature related to battery aging.
| References | Topic | Chemistries | ||
|---|---|---|---|---|
| Operation | Degradation | Aging Mechanism | ||
| Han et al., 2019 [5] | √ | √ | LMO, LCO, LFP, NMC | |
| Tian et al., 2020 [6] | √ | LMO, LFP, NMC | ||
| Mocera et al., 2020 [7] | √ | LFP | ||
| Woody et al., 2020 [8] | √ | √ | LCO, LMO, LFP, NCA, NMC | |
| Vetter et al., 2005 [9] | √ | LCO, LMO, NMC | ||
| Broussely et al., 2005 [10] | √ | LCO, NMC | ||
| Barre et al., 2013 [11] | √ | √ | LCO | |
| Birkl et al., 2017 [12] | √ | LCO | ||
| Palacin et al., 2018 [13] | √ | LMO, LCO, NMC, NCA | ||
| Xiong et al., 2020 [14] | √ | √ | LFP, NCA, NMC | |
| Teichert et al., 2020 [15] | √ | NMC | ||
| Alipour et al., 2020 [16] | √ | √ | LCO, LFP, NMC, NCA | |
| Chen et al., 2021 [17] | √ | √ | LCO | |
| Yang et al., 2021 [18] | √ | √ | NMC, NCA | |
Table 2.
The comparison of the main characteristics of EVs in the market.
| Type | Manufacturer | Battery-Only Range (km) | Battery Capacity (kWh) |
|---|---|---|---|
| HEV | Toyota Prius IV | / | 1.3–1.6 |
| BMW 225xe | |||
| Audi A3 e-tron | |||
| Toyota Prius III | |||
| PHEV | Chevy Volt | 64 | 18.4 |
| Toyota Prius XW30 | 21 | 5.2 | |
| Jaguar I-Pace | 470 | 90.0 | |
| BEV | Tesla Model S | 663 | 100.0 |
| BMW i3 | 246 | 42.2 | |
| Nissan Leaf | 364 | 62.0 | |
| Renault Zoe | 395 | 52 |
Table 3.
A brief comparative analysis of common chemistries.
| Electrode | VAverage (v) | VMax (v) | Specific Capacity (mAh g−1/mAh cm−3) | Gravimetric Energy (wh kg−1) | |
|---|---|---|---|---|---|
| Cathode | LiNi0.8Co0.15Al0.05O2 | 3.7 | 4.6 | 220/979 | 758 |
| LiNi1/3Co1/3Mn1/3O2 | 3.6 | 4.7 | 160/712 | 576 | |
| LiNi0.5Co0.2Mn0.3O2 | 3.6 | 4.7 | 170/757 | 612 | |
| LiNi0.6Co0.2Mn0.2O2 | 3.6 | 4.7 | 180/810 | 648 | |
| LiNi0.7Co0.15Mn0.15O2 | 3.6 | 4.7 | 190/855 | 684 | |
| LiNi0.8Co0.1Mn0.1O2 | 3.6 | 4.7 | 200/930 | 720 | |
| Anode | graphite | 0.6 | 3 | 372/735 | 190 |
| LTO | 1.55 | 2.5 | 175/607 | 263.5 | |
Table 4.
Comparison of calendar aging procedures and main conclusion from some work in current literature.
Table 4.
Comparison of calendar aging procedures and main conclusion from some work in current literature.
| Battery Type | Chemistry | Temperature °C | SOC (%) | Main Conclusion | Sources |
|---|---|---|---|---|---|
| SIMCAL (2009–2012) | NMC | 0, 25, 45 and 60 | 0, 30, 65, 80 and 100 | Higher SOC leads to higher capacity loss; temperature over 30 °C begin to accelerate the aging | [67] |
| Panasonic NCR18650BD | LiC6/NCA | 10, 25 and 45 | 20, 50 and 90 | Accelerate aging obviously occurs in 45 °C or 90% SOC case | [68] |
| Panasonic NCR18650PD | G/NCA | 10, 25 and 40 | 30, 45, 60, 75 and 90 | Higher temperature leads to higher capacity fade from 10 °C to 40 °C | [69] |
| Panasonic NCR18650PD | G/NCA | 25, 40 and 50 | 5, 10, 20, 30, 40, 45, 50, 55, 60, 65, 70, 80, 90, 95 and 100 | Accelerate aging with the increasing of SOC or storage temperature | [70] |
| SanyoUR18650E | G/NMC | ||||
| EIG NMC pouch cell | G/NMC | 10, 25 and 45 | 10, 40 and 80 | Higher SOC accelerates capacity fade, which is prominent at a higher temperature than at moderate temperature | [59] |
| Pouch cell | LTO/NMC | 40, 60 and 80 | 5, 20, 55, 70, 90 and 95 | There is no obvious relationship between temperature and capacity fade for LTO/NMC, while the internal resistance increased significantly. | [65] |
| EIG NMC pouch cell | G/NMC | 25, 35 and 45 | 20, 35, 50, 65, 80 and 100 | Accelerate aging with the increasing of SOC or storage temperature | [64] |
Publisher’s Note: MDPI stays neutral with regard to jurisdictional claims in published maps and institutional affiliations. |
© 2021 by the authors. Licensee MDPI, Basel, Switzerland. This article is an open access article distributed under the terms and conditions of the Creative Commons Attribution (CC BY) license (https://creativecommons.org/licenses/by/4.0/).
Share and Cite
MDPI and ACS Style
Guo, J.; Li, Y.; Pedersen, K.; Stroe, D.-I. Lithium-Ion Battery Operation, Degradation, and Aging Mechanism in Electric Vehicles: An Overview. Energies 2021, 14, 5220. https://0-doi-org.brum.beds.ac.uk/10.3390/en14175220
AMA Style
Guo J, Li Y, Pedersen K, Stroe D-I. Lithium-Ion Battery Operation, Degradation, and Aging Mechanism in Electric Vehicles: An Overview. Energies. 2021; 14(17):5220. https://0-doi-org.brum.beds.ac.uk/10.3390/en14175220
Chicago/Turabian StyleGuo, Jia, Yaqi Li, Kjeld Pedersen, and Daniel-Ioan Stroe. 2021. "Lithium-Ion Battery Operation, Degradation, and Aging Mechanism in Electric Vehicles: An Overview" Energies 14, no. 17: 5220. https://0-doi-org.brum.beds.ac.uk/10.3390/en14175220
Note that from the first issue of 2016, this journal uses article numbers instead of page numbers. See further details here.