
VxG Pattern-Based Analysis and Battery Deterioration Diagnosis


New and Renewable Energy Laboratory, KEPCO Research Institute, Korea Electric Power Corporation, 105 Munji-ro Yuseong-gu, Daejeon 34056, Korea
*
Author to whom correspondence should be addressed.
Energies 2021, 14(17), 5422; https://0-doi-org.brum.beds.ac.uk/10.3390/en14175422
Submission received: 29 July 2021
/
Revised: 14 August 2021
/
Accepted: 27 August 2021
/
Published: 31 August 2021
(This article belongs to the Topic Optimisation, Optimal Control and Nonlinear Dynamics in Electrical Power, Energy Storage and Renewable Energy Systems)
Abstract
:This paper presents the results of an analysis using the direct current internal resistance (DCIR) method on a nickel-cobalt-manganese oxide (NCM)-based battery with a nominal capacity of 55.6 Ah. The accelerated degradation test was performed on V0G, V1G, and V2G patterns, representing existing simple power supply, smart charging control, and bi-directional charge/discharge control, respectively. We assumed V0G, V1G, and V2G patterns and conducted charging and discharging experiments according to the set conditions. According to the pattern repetition, changes in the internal resistance of DCIR and AC-impedance were analyzed and battery deterioration was diagnosed. By comparing DCIR and AC-impedance, we confirmed that the changes in internal resistance has a similar trend. In particular, we propose a new DCIR analysis method in the “stop-operation” part rather than the traditional DCIR method. In the case of traditional DCIR method, time is required for the battery to stabilize. However, the newly proposed DCIR analysis method has the advantage of diagnosing the deterioration of the battery during system operation by analyzing the internal resistance without the stabilization time of the battery.
1. Introduction
The problems of climate change and energy depletion have raised extensive interests worldwide. Many countries are resorting to the use of electric vehicle (EV) as a substitute for combustion engine cars as well as the supply of renewable energy sources including solar energy and offshore wind power as a way to solve such problems. In general, the energy storage system (ESS) or energy storage device is a device in which electric energy is stored in a battery for later use through loading. The ESS is mainly applied for the smoothing of electric power peak through charge-discharge, stabilization of discontinuous output characteristics of wind and solar power, and control of frequency of electric power [1,2,3,4]. EVs have attracted much interest as they do not emit exhaust gas and show outstanding fuel efficiency. It is also predicted that, in line with the rapid advancement of EVs, the development of applied technologies would be vigorous. The resource utilization of electric power for EVs is made possible via the technologies that move away from the conventional simple power supply (V0G) towards the smart charging control through EV charge control and communication (V1G) and via the bidirectional charge-discharge control (V2G) [5,6]. Thus, it is necessary for the battery deterioration to be diagnosed based on the analysis of the influence of the uni- or bi-directional charge or charge-discharge on the EV battery performance and life through VxG technology.
For ESS and EV, the battery gradually loses capacity and gains resistance through continuous aging during repeated charge and discharge. In other words, the battery can only be used for a limited period and should be repaired or replaced before a problem arises due to aging.
The methods used to diagnose battery deterioration include capacity analysis and internal resistance (IR) analysis of the direct current internal resistance (DCIR) and AC-impedance [7,8,9]. Batteries are generally not suitable for EV use when the delivered capacity or power of a cell, module, or pack is less than 80% of its original rated value. Prior to the IR diagnosis for the battery contained in ESS and EV, the battery requires stabilization with its state of charge (SOC) adjusted to the initially set specific value, which necessitates an hour or more for the diagnosis of battery deterioration [10]. This poses a challenge in testing battery deterioration during charge or discharge (i.e., during the operation of ESS or EV).
In this study, the battery cell voltage without load (V0) and the battery cell voltage at a set time after the onset of the charge or discharge (V1 or Vn) (V1: voltage immediately after the onset of current, Vn: voltage after n seconds of current) were measured, and the average current consumption or production (Iavg) from the battery cell being tested in a set period of time was estimated. The IR was obtained based on V0, V1, Vn, and Iavg, without SOC adjustment or stabilization of the test system. In addition, by experimenting on battery life with V0G, V1G, and V2G patterns as the set cycle and with the battery put to accelerated degradation, the battery deterioration was analyzed by examining the IR at the “stop-operation” part.
2. Materials and Methods
Test System and Performance Test Experiment
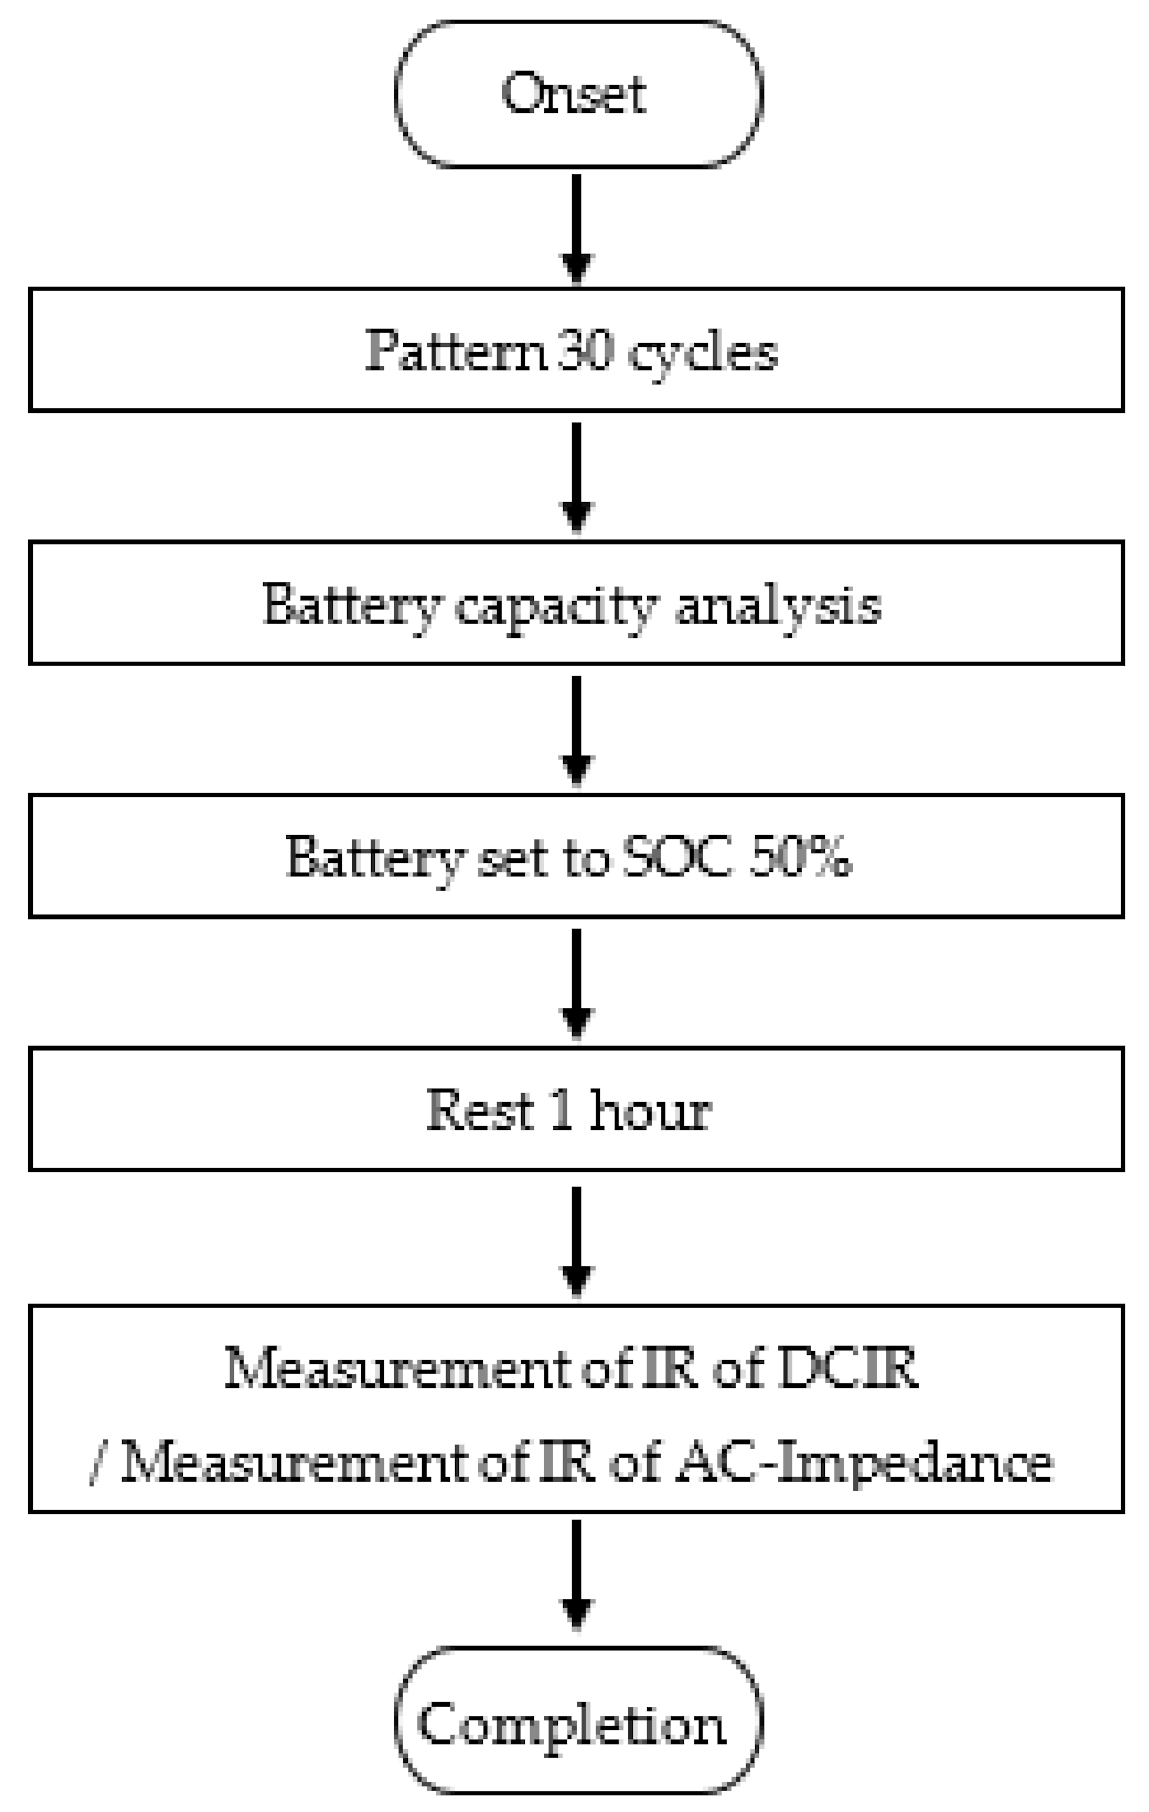
The battery in this study was an NCM-based Li-ion battery with nominal capacity of 55.6 Ah. The operation voltage ranged between 3.0~4.2 V. A flowchart of the steps in the battery performance test is shown in Figure 1. After 30 repetitions of a given pattern, the battery degradation was diagnosed by assessing the nominal capacity of the battery and measuring the IR of DCIR and AC-impedance.
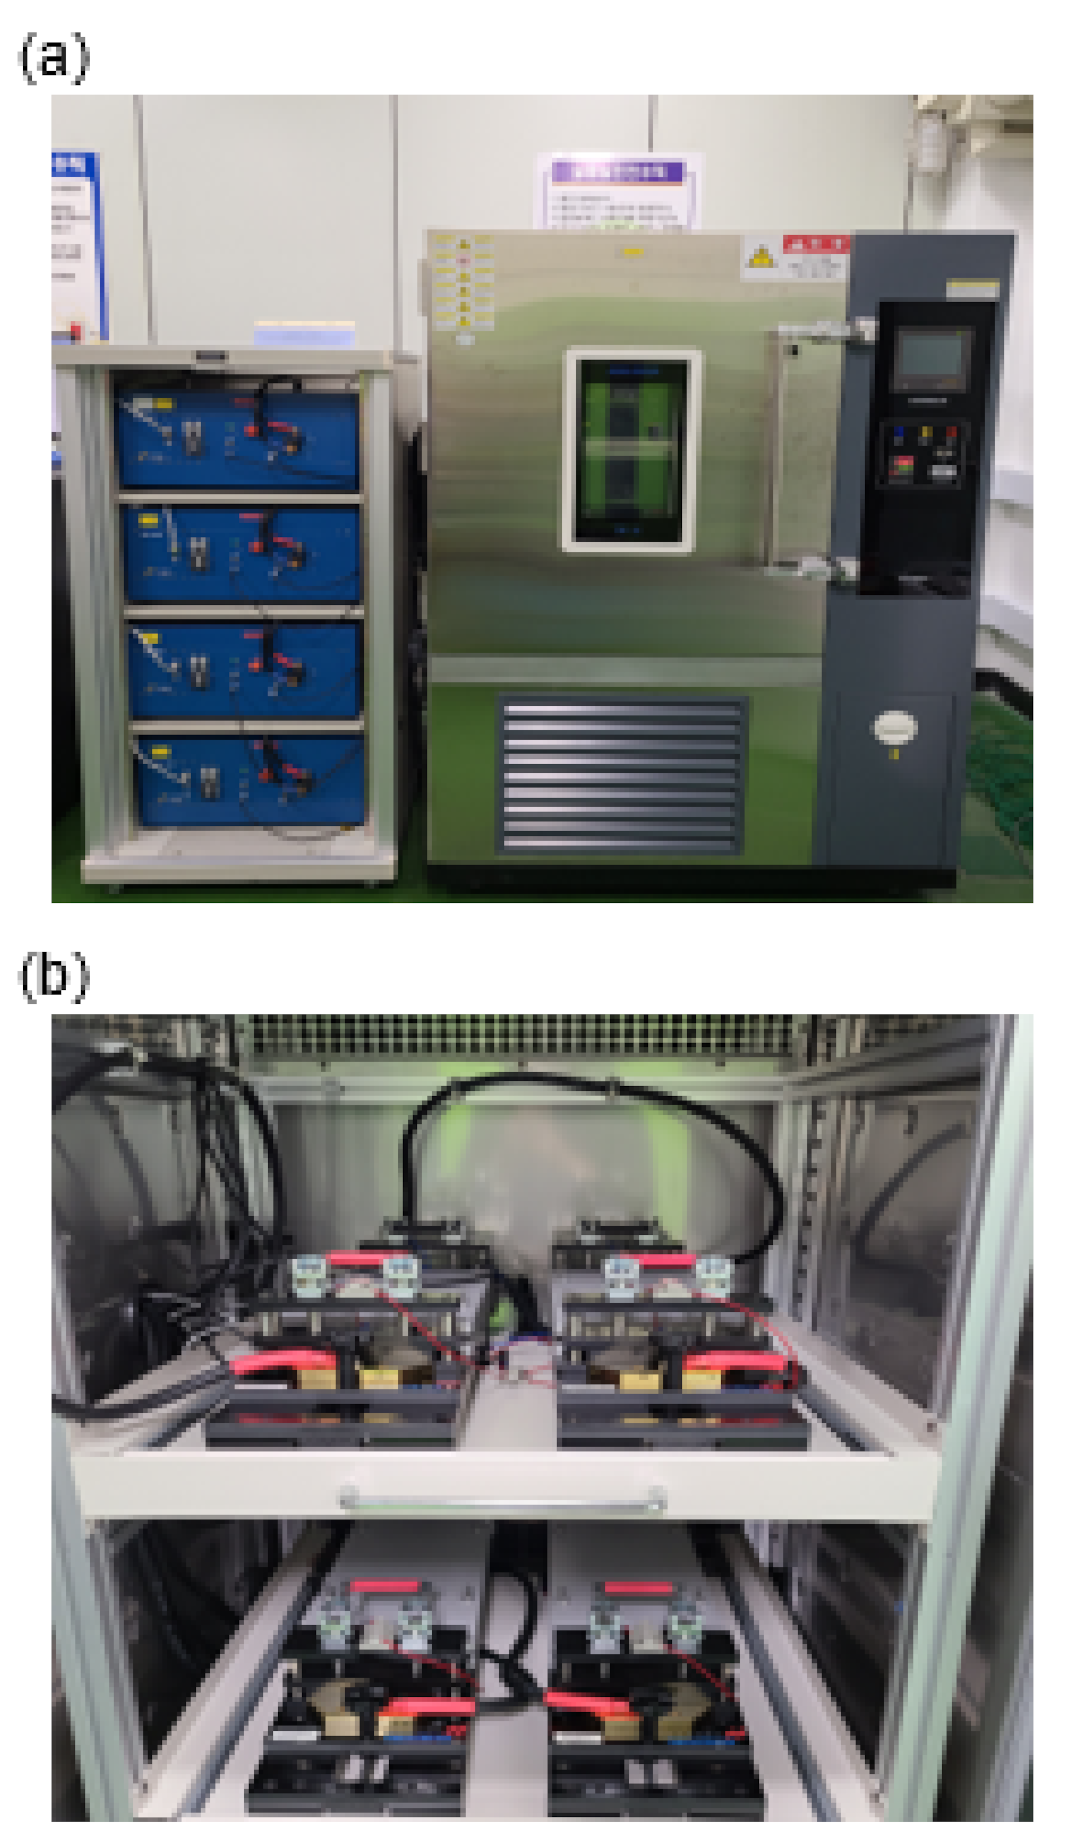
For the charge-discharge experiment, the test system shown in Figure 2a was used. To obtain adequate data through a diversity of experiments, HCP-1005 of BioLogic was used, and for real-time voltage and temperature data sensing, a data logger was used. All tests were performed in a chamber as the experiment required room temperature (25 °C). Using the jig shown in Figure 2b, the four pouch cells could be simultaneously used in different experiments, thereby maximizing the test efficiency. In addition, to increase the battery efficiency, a pressure jig was used as shown in Figure 2b.
Through a number of battery experiments, data analysis and electrochemical characterization were performed. For this, the discharge capacity based on current counting was measured through the constant current (CC) discharge and CC-constant voltage (CV) charge method. The CV experiment ends as the current reaches 2.78 A (1/20 C). To measure the discharge capacity, 0.5 C current was applied up to the full discharge voltage at 100% state of charge (SOC), and an hour of rest was given between the discharge mode and charge mode for the electrochemical equilibrium to be achieved. Next, at 100% SOC, 0.5 C current was applied up to the capacity (Ah) corresponding to 50% SOC, and at 50% SOC, an hour of rest was given for the equilibrium to be achieved. Subsequently, the IR was measured based on the galvanostatic intermittent titration technique (GITT) or DCIR. Here, 1.0 C (55.6 A) current was applied. After another an hour of rest, the AC-impedance was measured.
3. Results & Discussion
3.1. Operation Patterns
To diagnose battery deterioration, specific patterns of the charge-discharge of the battery were repeated. Three patterns are proposed in this study; pattern A: V0G, pattern B: V1G, pattern C: V2G. These patterns are characterized as follows: V0G for the conventional simple power supply, V1G for the smart charging control via EV charge control and communication, and V2G for bi-directional charge-discharge control. Figure 3 shows the time-dependent changes in SOC and current, for V0G in (a), (b), for V1G in (c), (d), and for V2G in (e), (f). Each pattern in Figure 3 is arbitrary and different from the actual pattern in operation.
3.2. Performance Test for Battery Cell Patterns (V0G, V1G, V2G)
As mentioned in Figure 1, the three factors of performance (capacity, DCIR, and AC-impedance) were measured at 30 repetitions of each pattern to diagnose and analyze the battery deterioration. Figure 4, Figure 5 and Figure 6 show the results of the battery performance test under the 30 pattern repetitions for each.
3.2.1. Battery Performance Test: Capacity
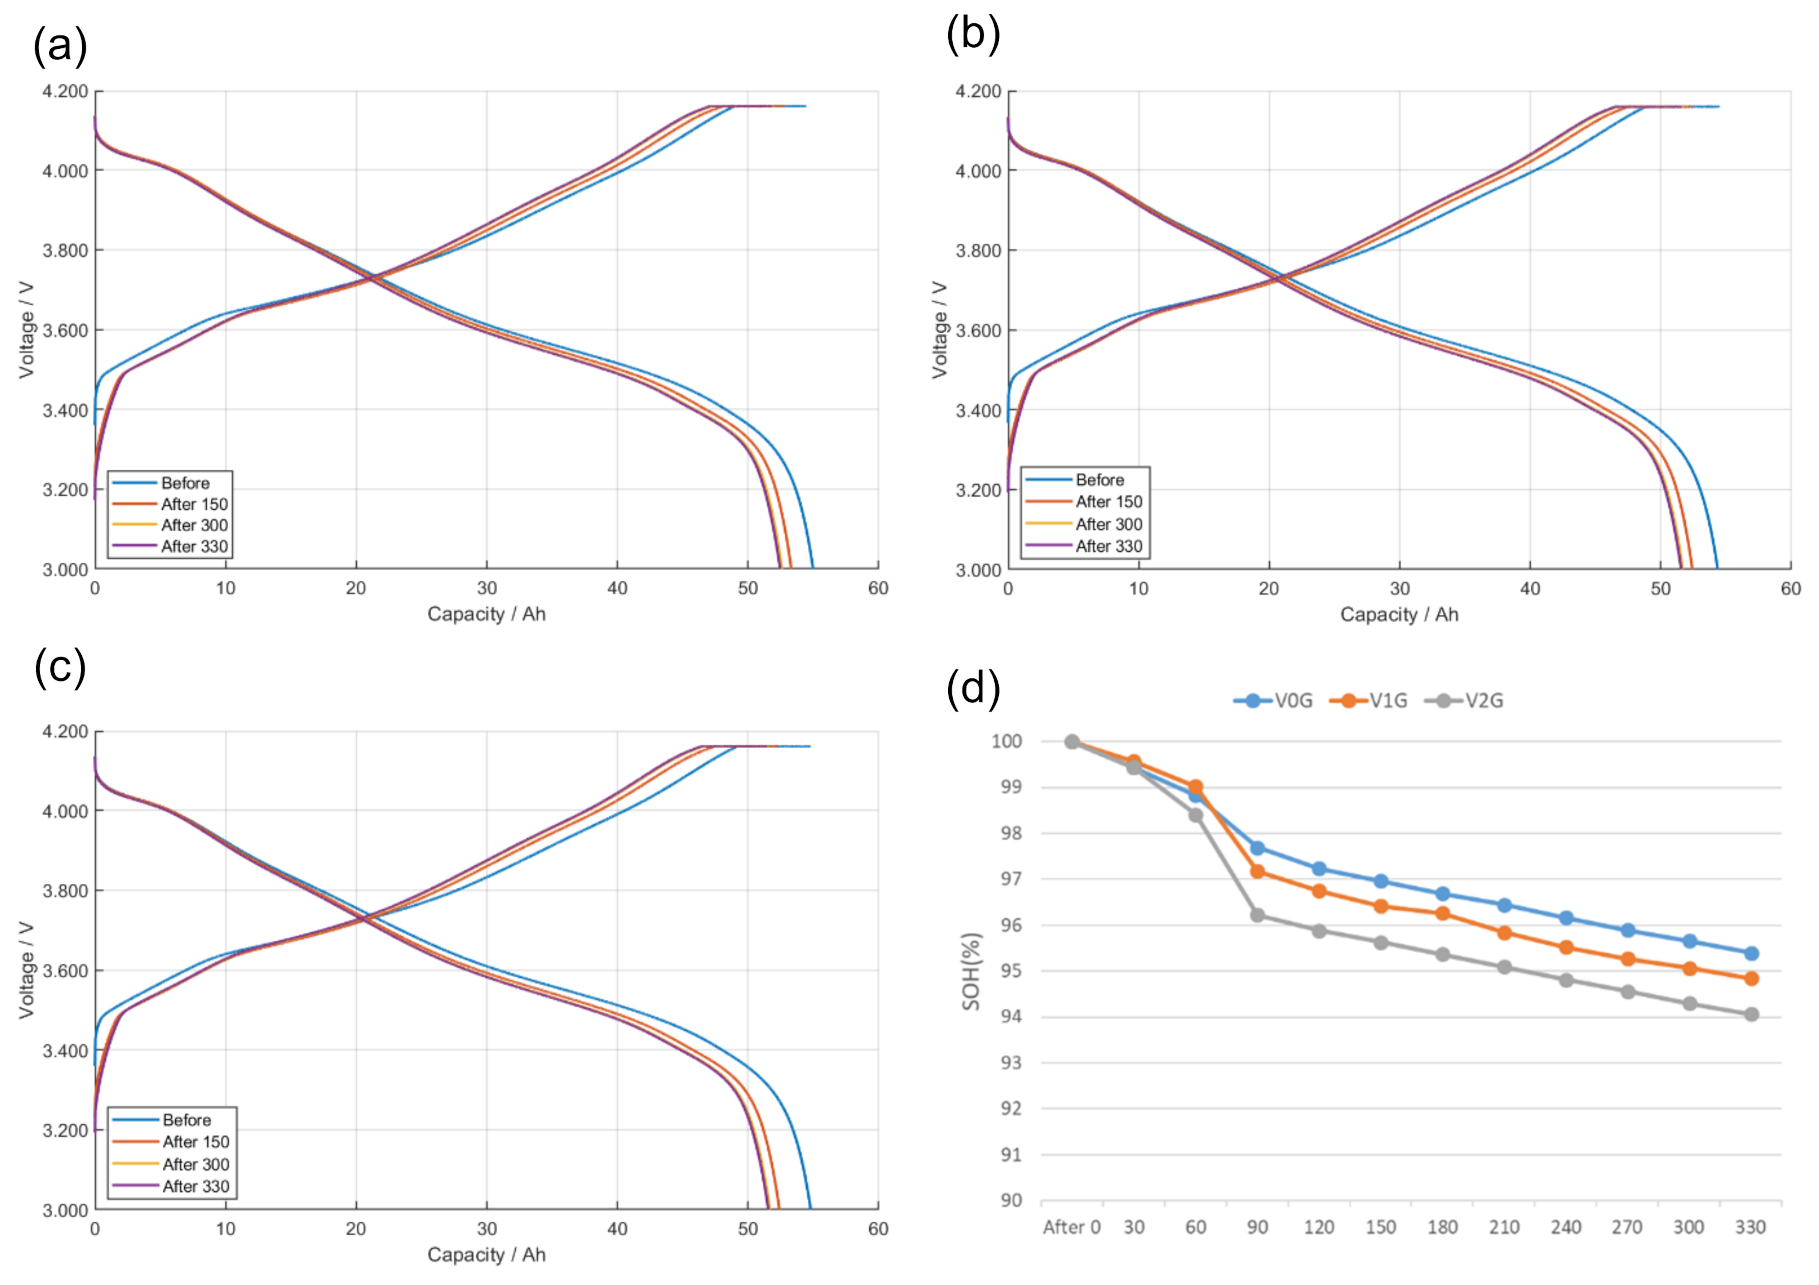
Figure 4 shows the result of capacity measurements after 330 repetitions of V0G, V1G, and V2G patterns. The decrease in battery capacity with the increase in pattern repetition can be seen. In (a), the battery capacity following V0G pattern repetitions is shown to decrease from the initial 54.97 Ah (State of Health (SOH) 100%) to 52.44 Ah (SOH 95.40%). Similar results are visible for V1G and V2G. In (b), the battery capacity following V1G pattern repetitions is shown to decrease from the initial 54.35 Ah (SOH 100%) to 51.55 Ah (SOH 94.84%). The battery capacity following V2G pattern repetitions is also shown to decrease from the initial 54.79 Ah (SOH 100%) to 51.54 Ah (SOH 94.07%). Figure 4d shows the comparison of capacity change following the V0G, V1G, and V2G pattern repetitions.
SOH after 330 pattern repetitions was 95.40% for V0G, 94.84% for V1G, and 94.07% for V2G, indicating the capacity fades quickly in the order of V2G, V1G and V0G. This may be due to two reasons. The first is the influence of the calendar life. The operation time of a single cycle for each pattern was 18 h for V0G, 21 h for V1G, and 24 h for V2G, with 3 h difference per cycle and approximately 90 h difference for 30 pattern repetitions, so that the influence of calendar life led to the variation in battery deterioration. Another reason is the difference in the quantity of charge/discharge. V2G has a higher level of charge-discharge than V0G or V1G, which could lead to the variation in battery deterioration. For future causal analysis, the completion time of each pattern is to be set identical to prevent the influence of calendar life in testing the battery deterioration according to pattern.
3.2.2. Battery Performance Test: DCIR
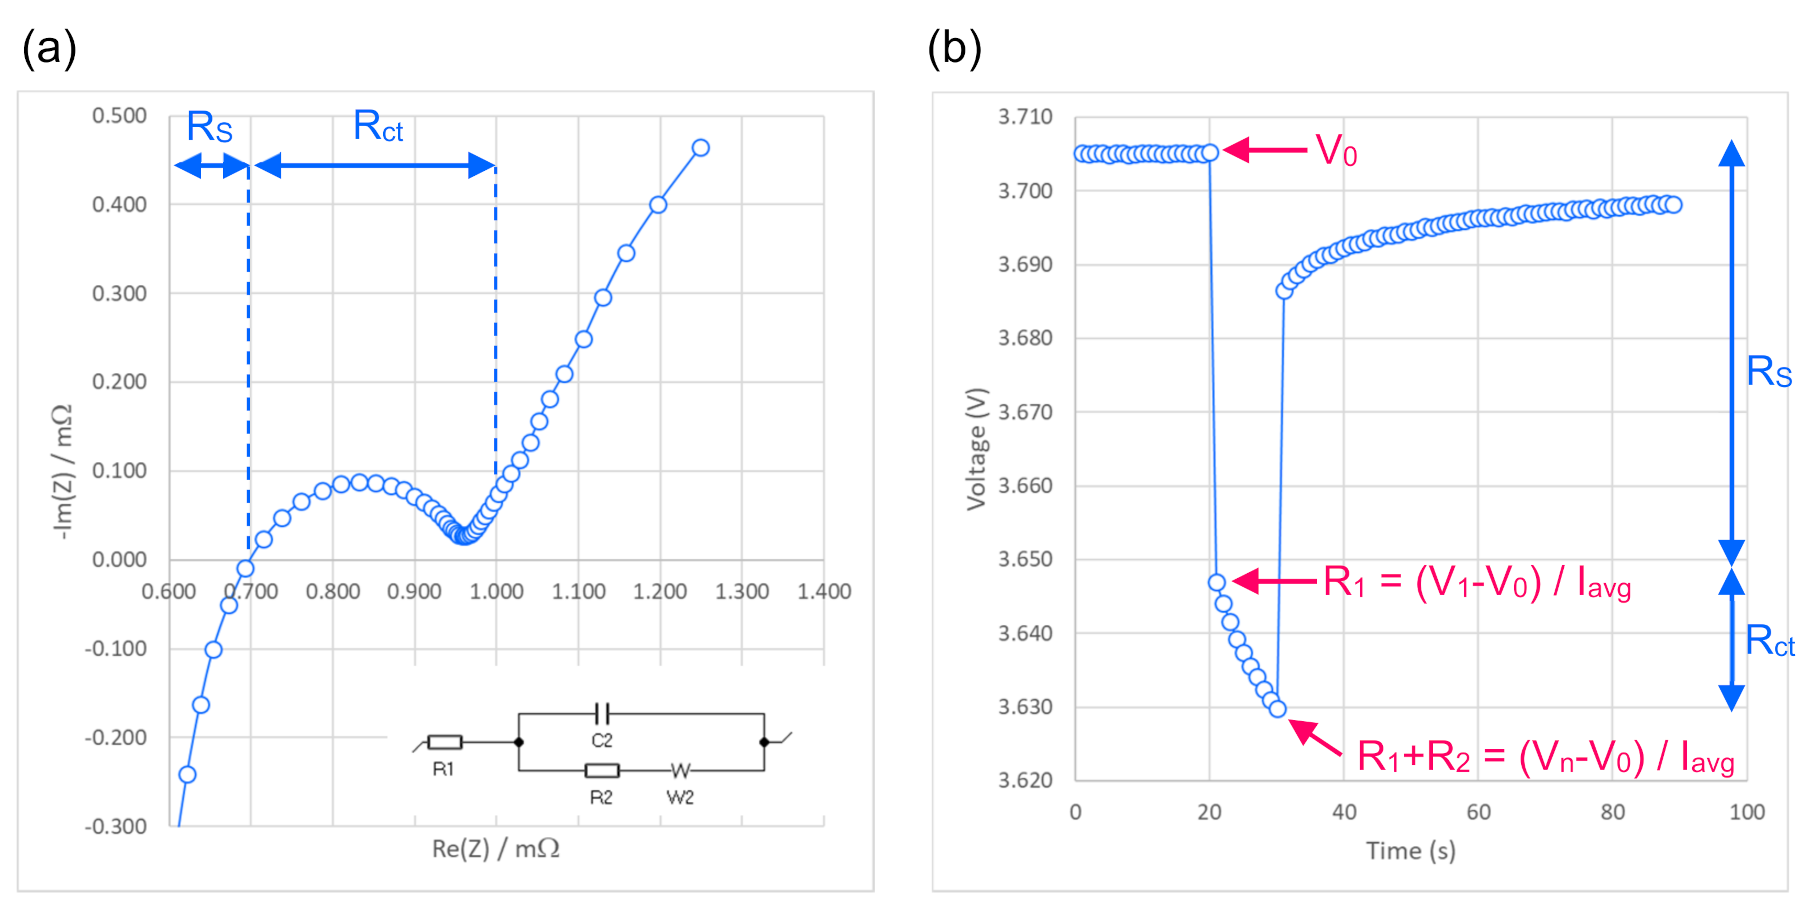
DCIR is calculated based on Ohm’s law; R = ΔV/Iavg. The ohmic resistance for the whole cell of DCIR, R1 (Rs in AC-impedance), is calculated based on the difference between the voltage measured immediately after the application of discharge pulse (V1) and the voltage without load (V0) (1). The charge transfer resistance, R2 (Rct in AC-impedance), is calculated based on the difference between the voltage measured after the application of discharge pulse for n sec (Vn) and the voltage measured immediately after the application of discharge pulse (V1) (2).
As a result, the discharge pulse current is identical for R1 and R2 so that, after the application of voltage, the voltage (V1, Vn) becomes the key determinant. In addition, the voltage after application is determined based on the time of data recording, and the result of recording with 1 sec interval is shown in Figure 7b.
Figure 7 shows the result of comparing the IR between AC-impedance and DCIR of a fresh cell for the V0G pattern. The DCIR immediately after the application of current was 1.049 mΩ, R1: 1.049 mΩ, while the AC-impedance was 0.981 mΩ (Rs: 0.699 mΩ, Rct: 0.282 mΩ) (Figure 6a). As shown, the R1 of DCIR is greater than the Rs + Rct of AC-impedance. This is because, immediately after the current is applied, the resistance corresponding to Rs as well as Rct are measured together for the DCIR. For this, the DCIR result was analyzed based on the data obtained after 1 sec. In future, R1 and R2 values are to be extracted based on the data recording of 1 ms or 10 ms interval to analyze the relationship between the DCIR and AC-impedance.
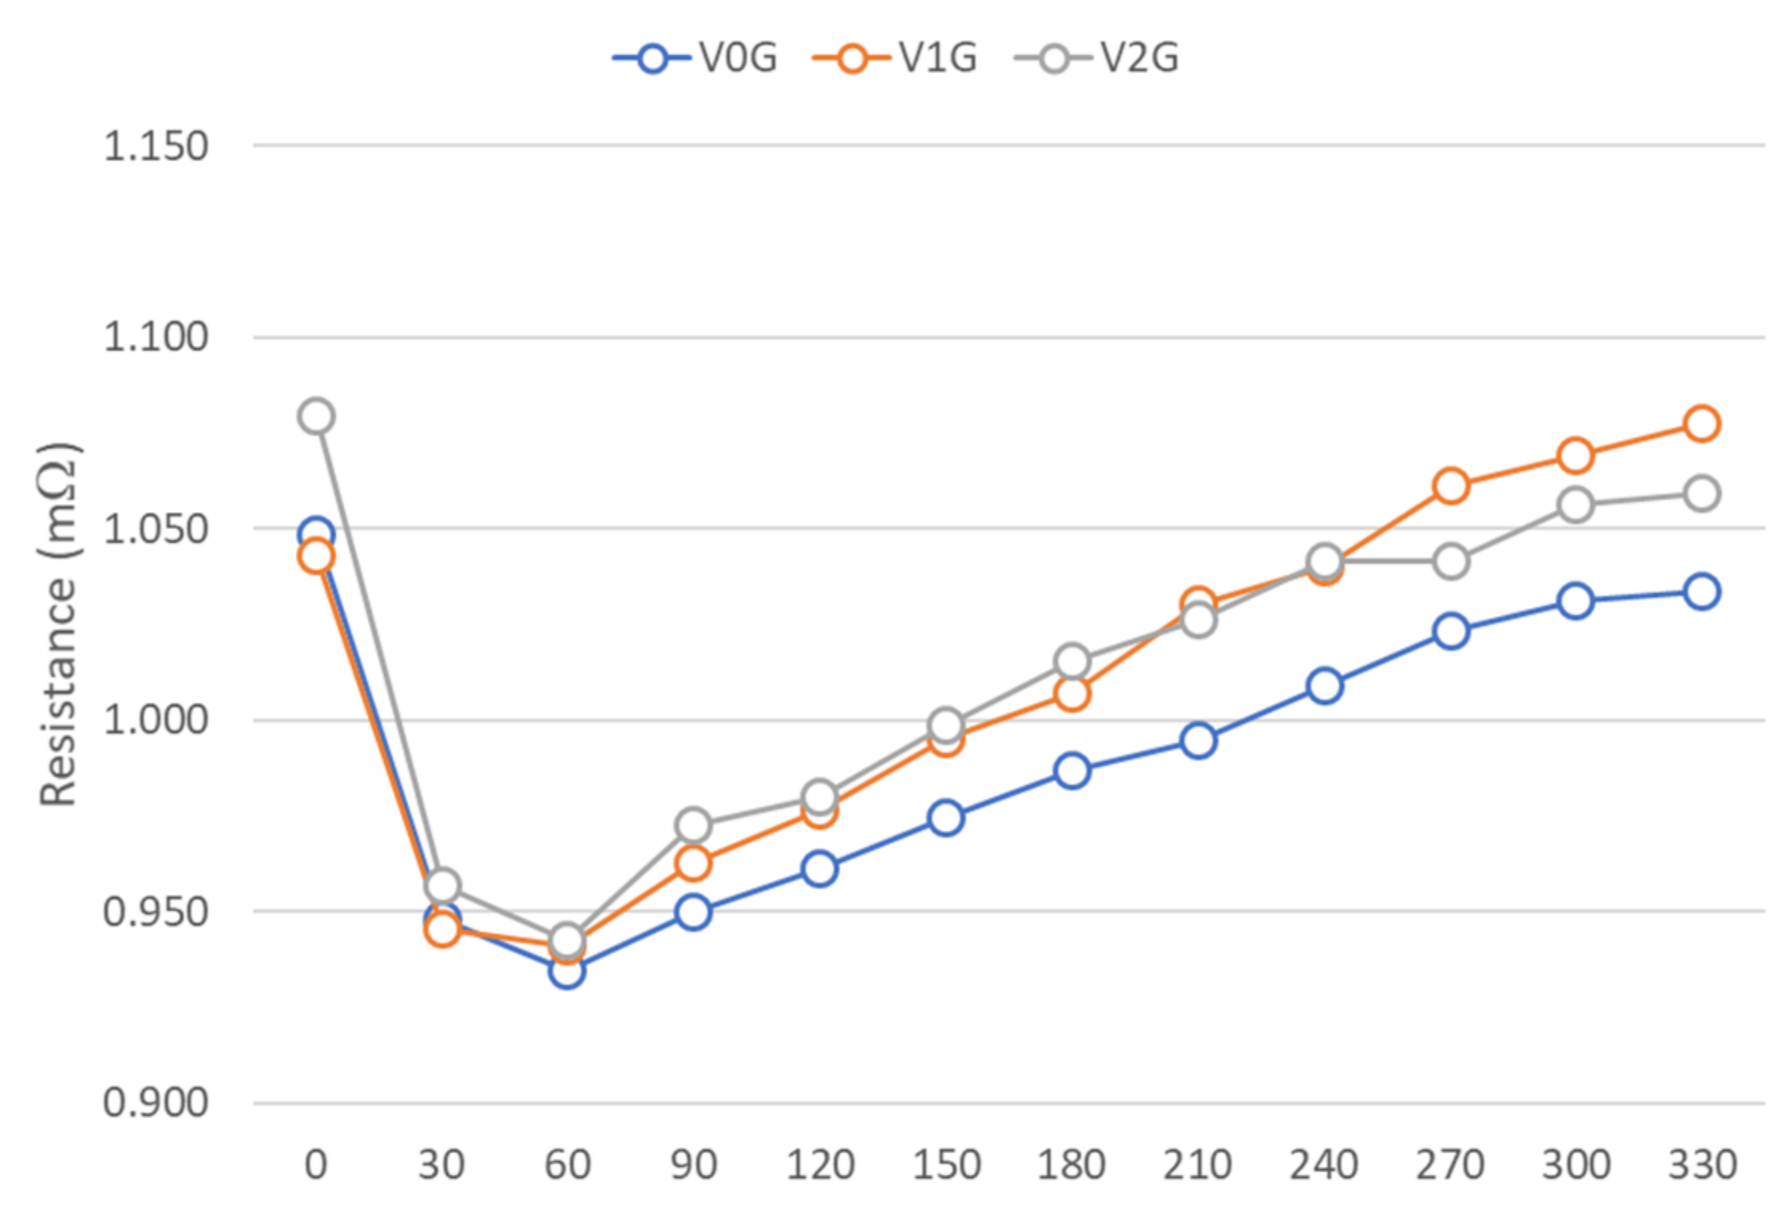
Figure 5 shows the result of measuring the IR through DCIR after 330 repetitions of V0G, V1G, and V2G patterns. The IR was measured after 30 pattern repetitions at 50% SOC. Next, the IR was calculated based on the voltage measured after applying the current of 1.0 C (55.6 A). Notably, the IR in this study was calculated using the voltage measured after 1 sec application of the current (Figure 5). The initial IR of the battery used in the operation of V0G, V1G, and V2G patterns was 1.049 mΩ, 1.043 mΩ, and 1.079 mΩ, respectively. Up to 60 pattern repetitions, the IR decreased (V0G: 0.935 mΩ, V1G: 0.941 mΩ, V2G: 0.942 mΩ). Afterwards, the battery deterioration with increased pattern repetition led to a rise in IR to 1.034 mΩ, 1.078 mΩ, and 1.059 mΩ for V0G, V1G, and V2G, respectively, after 330 repetitions. As a result, a solid electrolyte interface (SEI) layer is formed through the initial charge-discharge, where the SEI layer stabilizes while preventing the continuous degradation of the electrolyte on the anode surface [11,12]. In addition, the gas produced through battery charge-discharge is thought to have increased the internal pressure to improve the contact performance and ultimately reduce the IR [13,14]. After 60 pattern repetitions, the IR increased owing various causes with the progression of charge-discharge, such as the growth of the SEI layer, consumption of the electrolyte, and the damage on the SEI layer [11,12]. Similar results are observed in the AC-impedance analysis (Figure 6).
3.2.3. Battery Performance Test: AC-Impedance
As mentioned in Figure 1, the electrochemical impedance spectroscopy (EIS) was performed after each of the 30 pattern repetitions. The AC-impedance was measured as the applied frequency was reduced from high to low, and as a result, the ohmic resistance, Rs, was measured at high frequency, and the charge transfer resistance, Rct, was measured at medium frequency.
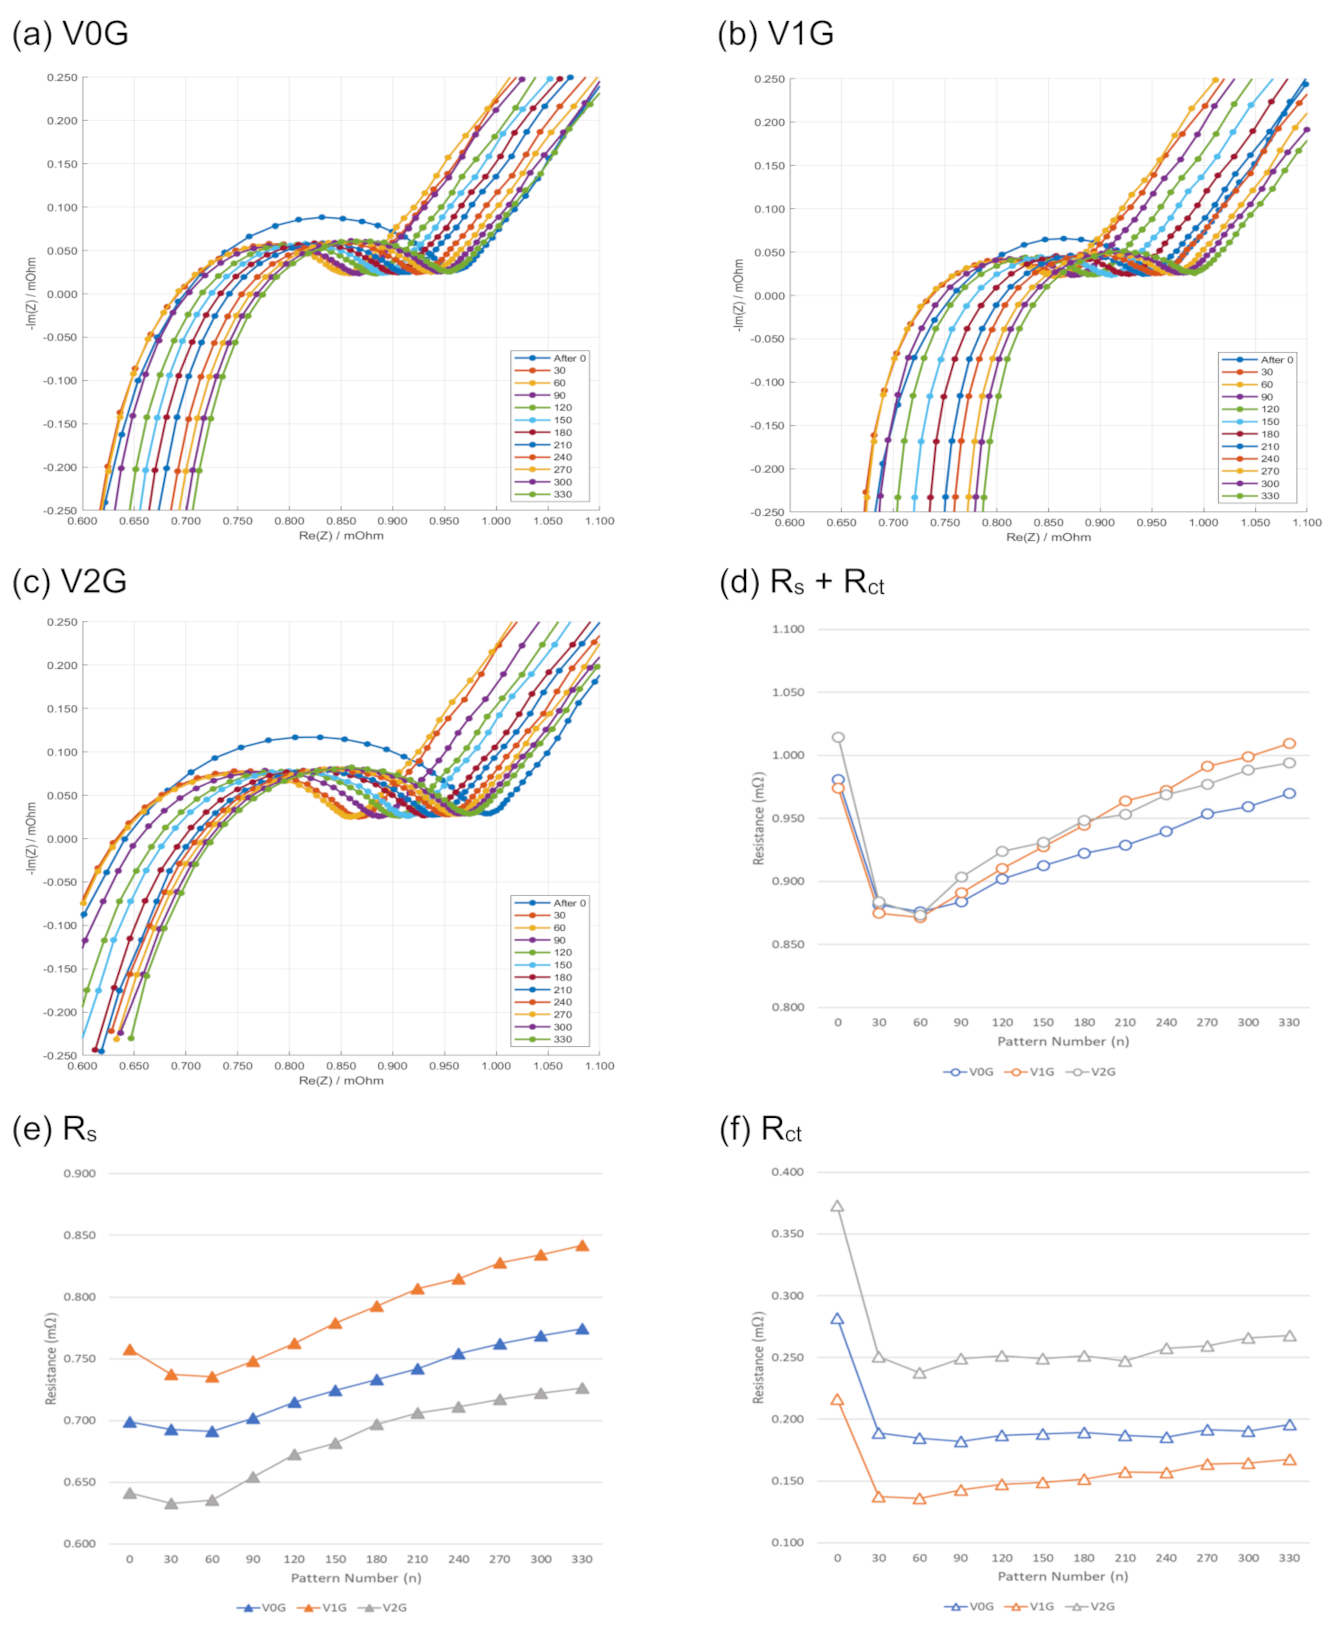
To extract the factors of battery characteristics, the EIS was performed at 50% SOC, and the potentiostatic method was used to apply the AC waveform of 10 mV voltage amplitude and for the measurements from 10 kHz up to 100 mHz. Figure 6 shows the result of IR measurements for AC-impedance after 330 repetitions of the V0G, V1G, and V2G patterns. As in the case of DCIR, the IR decreased for up to 60 repetitions for each pattern. Afterwards, the IR increased as the number of pattern repetition increased.
Such trend was highly similar to the trend exhibited by DCIR. While the absolute values may vary, the trend of IR decrease for up to 60 pattern repetitions, followed by a gradual increase in IR with an increase in pattern repetitions, appears almost identical. Thus, the DCIR is considered to be as useful in analyzing and selecting degraded batteries.
In addition, the Rs and Rct values of AC-impedance were comparatively analyzed. Figure 6e is the result of comparing the ohmic resistance, Rs, per pattern. Figure 6f is the result of comparing the charge transfer resistance, Rct, per pattern. An approximately 0.1 mΩ decrease can be seen, from the initial values; 0.282 mΩ for V0G, 0.216 mΩ for V1G and 0.373 mΩ for V2G to 0.185 mΩ for V0G, 0.136 mΩ for V1G and 0.238 mΩ for V2G after 60 pattern repetitions. In contrast, for Rs, the initial values decreased from 0.699 mΩ for V0G, 0.758 mΩ for V1G and 0.641 mΩ for V2G to 0.691 mΩ for V0G, 0.736 mΩ for V1G and 0.635 mΩ for V2G after 60 pattern repetitions, by approximately 0.015 mΩ. Thus, up to 60 pattern repetitions, the value of Rct plays a key role in the changes in IR. This is because the IR for Rct falls as the SEI layer is formed upon the initial charge-discharge. [11,12,15,16]. It is also because the gas formed during charge-discharge increases the internal pressure to improve the contact between the electrode and binder [17]. Moreover, the decrease in Rs was also by approximately 0.015 mΩ, owing to the increase in ionic conductivity after the SEI layer formation [13,14].
3.2.4. Battery Performance Test: DCIR of the “Stop-Operation” Part
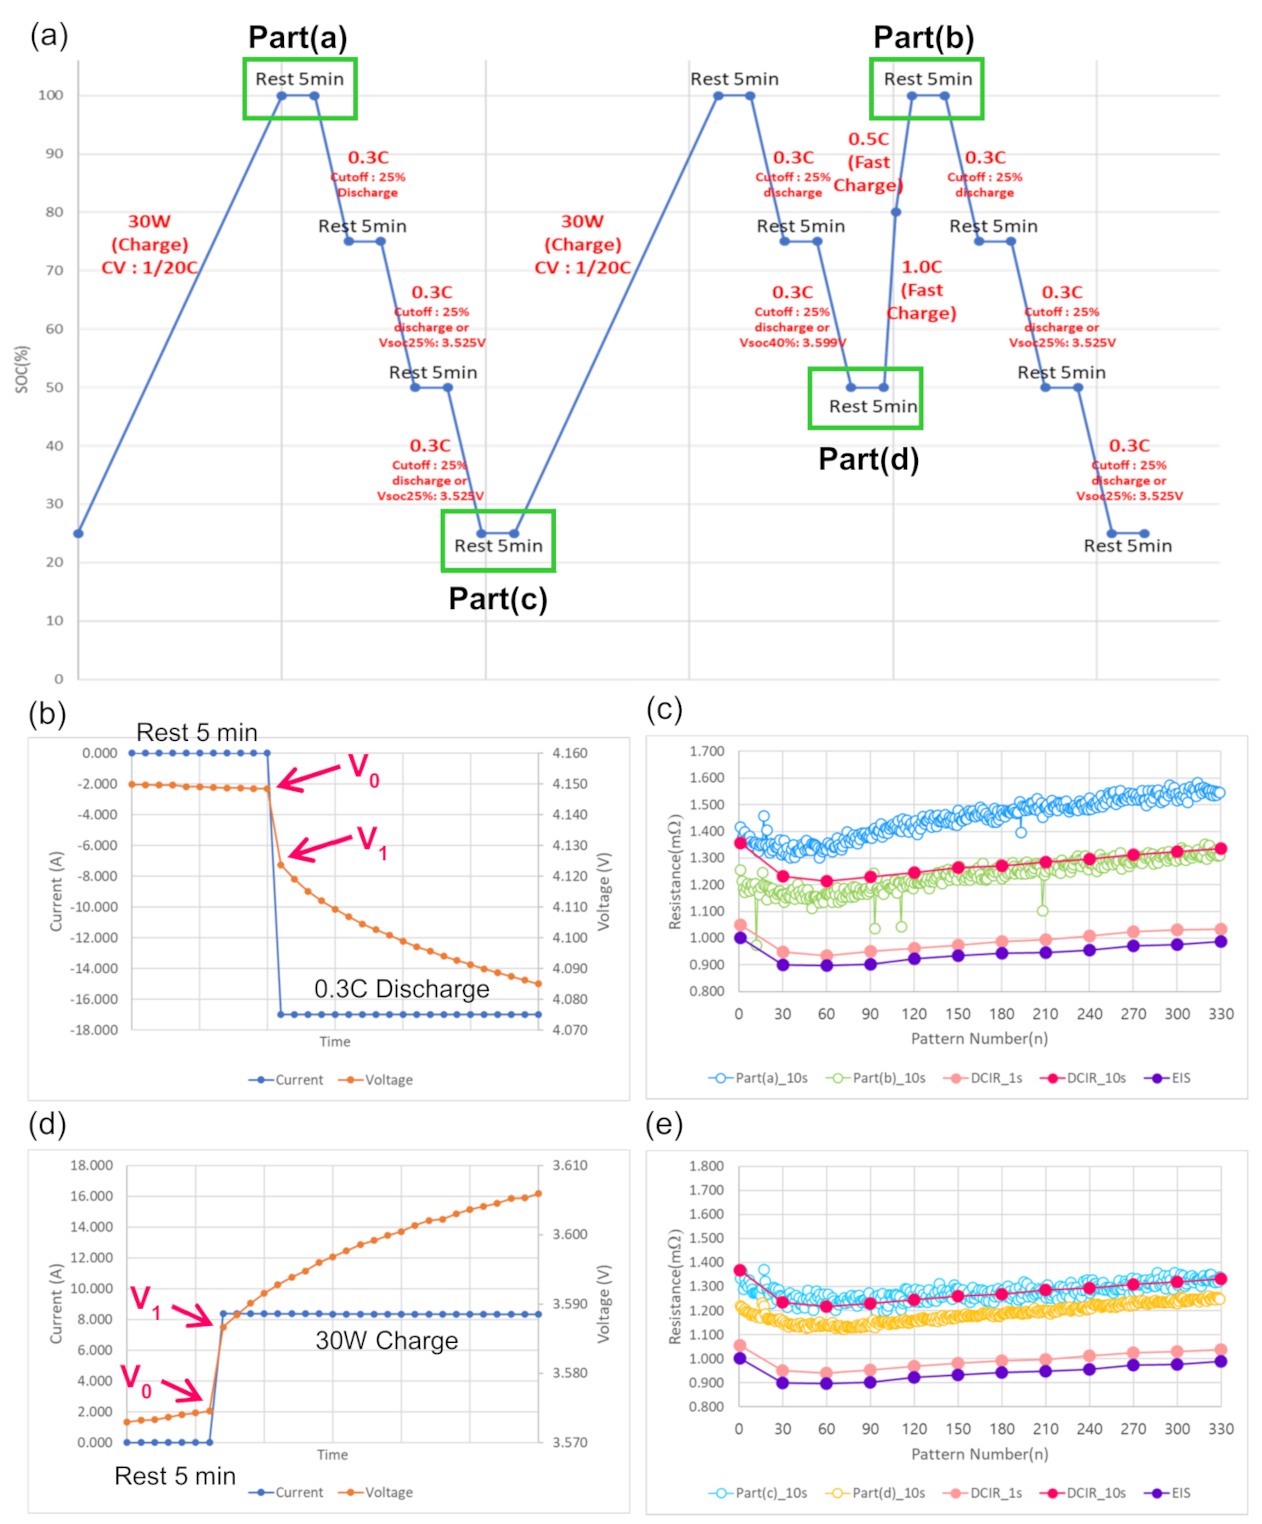
In the case of the conventional DCIR, an hour of rest is required for stabilization after setting the SOC to a specific value, and the IR is estimated based on the voltage difference after applying the DC-pulse current. Here, however, the IR is estimated using the “stop” part during the operation of ESS or EV without the time of stabilization. Notably, while repeating each of the V0G, V1G, and V2G patterns, the IR is analyzed at the “stop-operation” part to diagnose battery deterioration. As can be seen in Figure 8a for V0G pattern, there are 11 “stop-operation” parts with 5 min rest. At the four marked parts shown in Figure 8a, the IR was compared with the conventional DCIR. The IR can be measured using the voltage of the part to which the current has been applied for n sec after the rest. In this analysis, the IR was measured using the voltage after 10 sec at the “stop-operation” part.
The SOC at each part was as follows: (1) Part (a): SOC 100%, (2) Part (b): SOC 90%, (3) Part (c): SOC 25%, (4) Part (d): SOC 50%. The SOC at the same part may vary according to the state of battery deterioration. In addition, for every 30 pattern repetitions, the following IRs were measured at SOC 50%: IR of DCIR (R1) immediately after the application of current, (2) IR of DCIR (R1 + R2) after 10 sec of current application, (3) IR of AC-impedance (EIS). These IRs were then comparatively analyzed. Here, the IR of AC-impedance includes both the ohmic resistance Rs and the charge transfer resistance Rct. Figure 8c shows the result of comparing the DCIR at Part (a) and Part (b) and the DCIR at 50% SOC. The DCIR at Part (a) showed a mean difference of 0.218 mΩ from the DCIR at Part (b). For Part (a), the charge at low C-rate allows an adequate level of charge up to 100% SOC. For Part (b), on the other hand, the charge at high C-rate (1.0 or 0.5 C) leads to the charge up to approximately 90% SOC. As the IR varies according to the SOC, different IR values were obtained. Figure 8d shows the result of measuring the DCIR at Part (c) and Part (d). Similar to Figure 8c, the IR varies according to the SOC [8,9].
In addition, the changes in IR appear highly similar between EIS and DCIR_1s. This is because, as previously said, the IR of DCIR after 1 sec current application includes both Rs and Rct of AC-impedance.
Thus, the analysis of correlation between DCIR and AC-impedance seems to require more precise analysis at interval of 1 ms or 10 ms. Notably, the result in Figure 8c is considerably important in analyzing the battery deterioration for the running of the EV or ESS. In Figure 8c, Part (a) or Part (b) are the parts where the system such as EV or ESS operates following the stop so that the IR can be measured from the perspective of actual use and the battery deterioration can be analyzed.
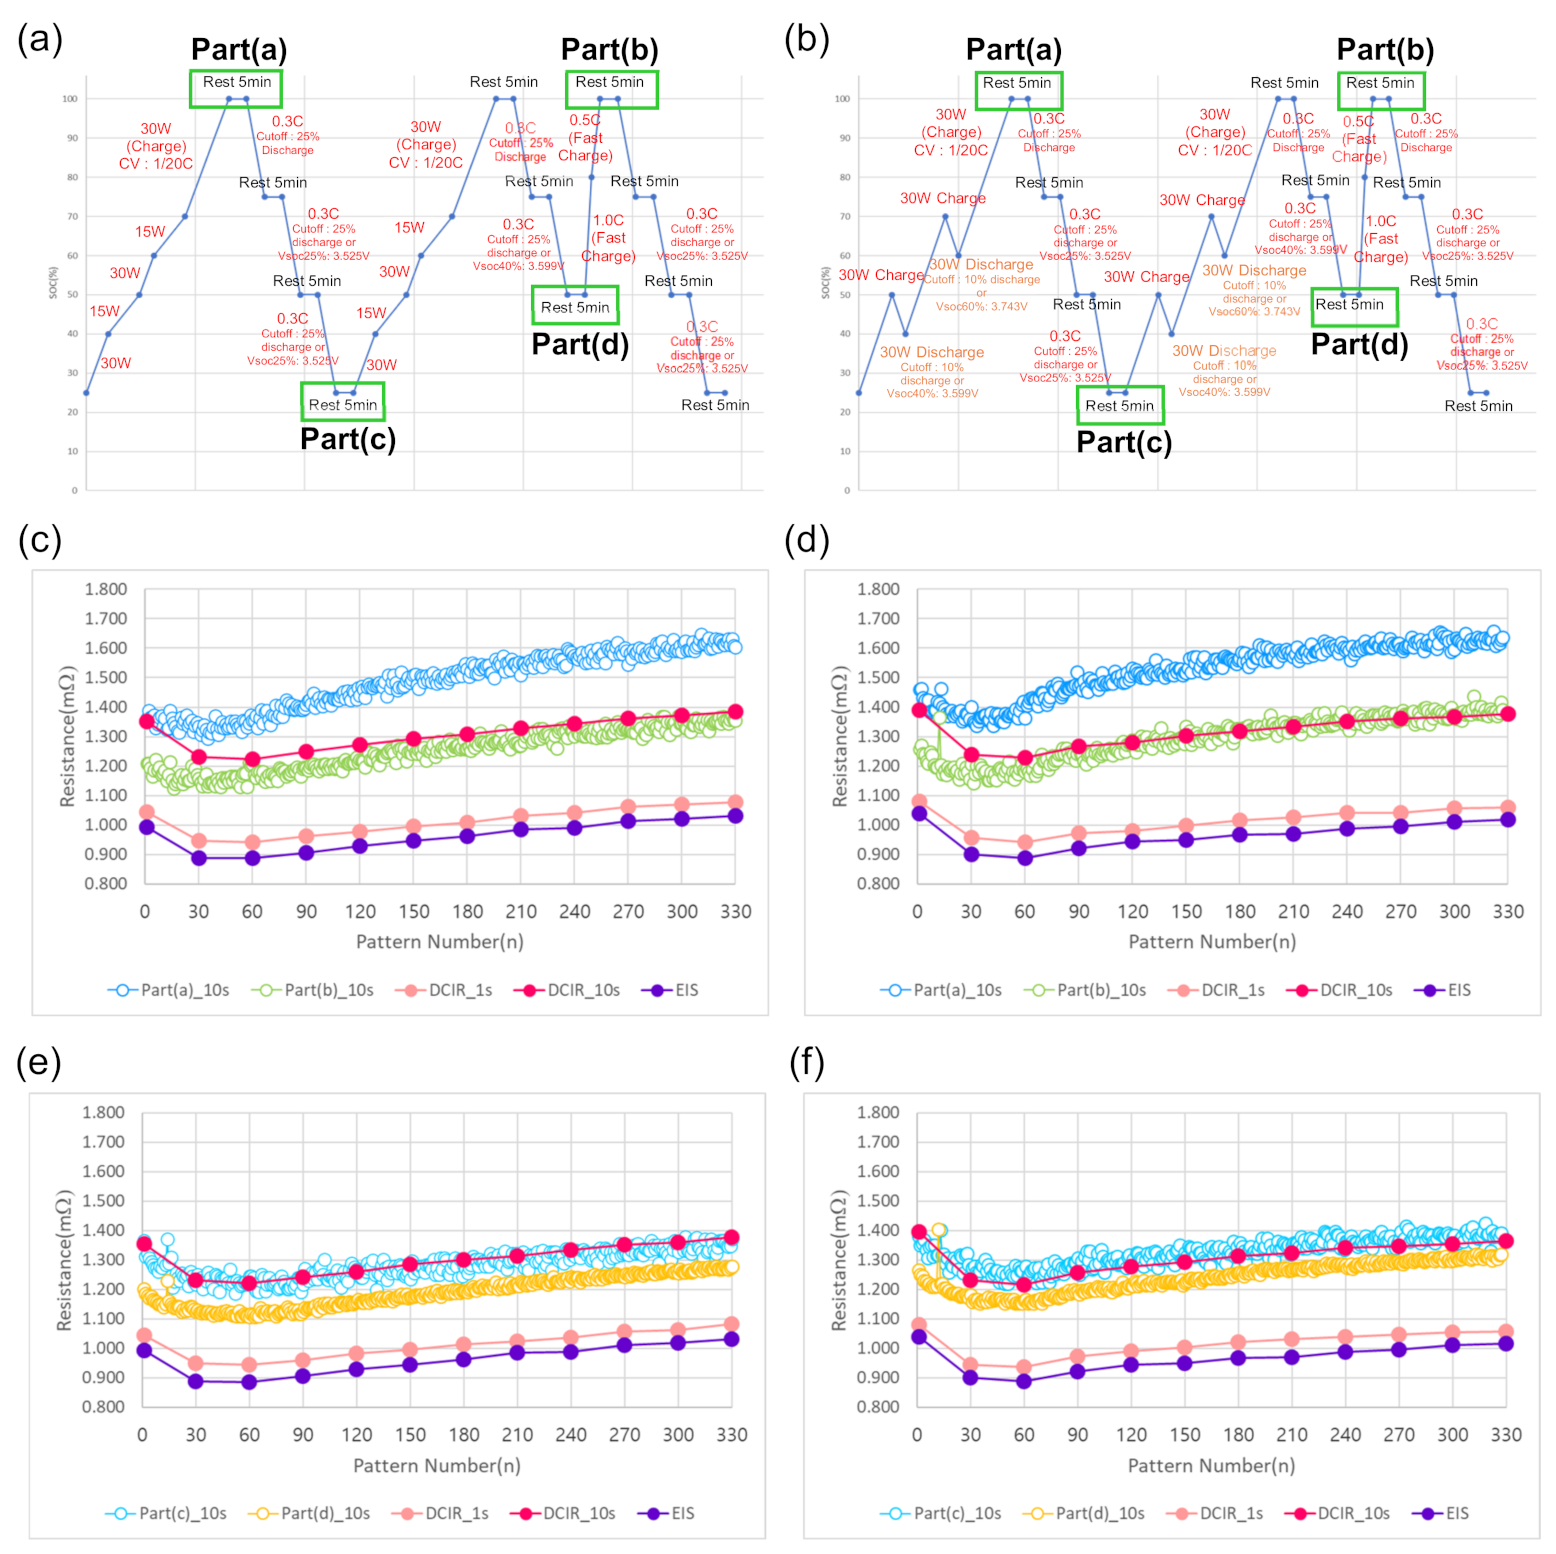
Figure 9 shows the result of comparing the DCIR at the “stop-operation” part according to the repetitions of V1G and V2G patterns. The results for V1G pattern are shown in Figure 9a,c,e, and the results for V2G pattern are shown in Figure 9b,d,f. The results were obtained after 330 repetitions of the V1G and V2G patterns. Similar to the DCIR at the “stop-operation” part for the V0G pattern, the DCIR decreased for up to 60 pattern repetitions, followed by an increase based on battery deterioration as the number of repetitions increased. While the resistance varied according to the SOC, the trend was identical across all patterns. Notably, a similar trend of IR based on pattern repetitions could be observed across all of the followings; Part (a), Part (b), Part (c), Part (d), DCIR_1s, DCIR_10s, and AC-impedance, and through this, the changes in IR may be determined, and the state of battery deterioration compared to the initial state may be predicted. Based on the findings so far, it is likely that the DCIR can be measured at the “stop-operation” part for VxG patterns as well as any other operation conditions. Thus, the DCIR method is presumed to be applicable to various ESS or EV operation conditions.
4. Conclusions
The validity of the method of DCIR at the “stop-operation” part was verified with respect to the measurement of IR and the diagnosis of battery deterioration. The effect of DCIR at the “stop-operation” part was tested through simulations for the three proposed patterns: V0G, V1G, and V2G. In the case of the conventional DCIR method, time is required for setting the battery to a specific SOC and for stabilization. Due to the stabilization time required, it is difficult to diagnose battery deterioration during the operation of ESS or EV. In this study, the DCIR at the “stop-operation” part was tested, without the need for the stabilization time, to propose a novel method of battery deterioration diagnosis.
The results of simulation for the V0G, V1G, and V2G patterns showed that the IR variation was considerably similar between the conventional DCIR and the DCIR at the “stop-operation” part. Through additional comparison with the AC-impedance method, a similar trend was found for all three methods; the conventional DCIR, the AC-impedance, and the DCIR at the “stop-operation” part. Based on the relationship between the IR of AC-impedance and the IR of DCIR_1s, the latter was shown to include both the Rs and Rct of the former, even for a mere 1 sec current application. It is necessary that a more precise experiment be performed to analyze the Rs and Rct independently. Thus, a follow-up study will be conducted to analyze the correlation between AC-impedance and DCIR by measuring voltage/current at 1 ms or 10 ms interval.
The trend of change in IR was monitored for four different methods; the DCIR at the “stop-operation” part, the DCIR_1s, DCIR_10s, and AC-impedance with an adequate level of stabilization time. The trend of change in the battery IR was monitored for three different patterns, whereby the IR was found to decrease for up to the first 60 pattern repetitions then increase with an increase in the number of pattern repetition. Such trend was shared by all four methods. Thus, it is anticipated that the DCIR at the “stop-operation” part will prove useful as a method to diagnose battery deterioration and be applied to the ESS or EV operation patterns in future. Furthermore, the method may be applied not only to the proposed three patterns but also to the FR pattern, peak shaving pattern, in smart grids, microgrids, and active power distribution systems [18,19]. These are applied in actual electric power systems to enable battery deterioration diagnosis during the operation of ESS, EV, and active power distribution systems, to select high-risk batteries and ultimately reduce risks such as fire and enhance the quality of battery safety.
Author Contributions
J.L. and S.-E.L. and K.-Y.P. and J.-H.C. conceived and designed the experiment; J.L. and S.-E.L. and H.-S.K. performed the experiment; visualization, K.-Y.P. and J.-H.C. and H.-S.K. analyzed the theory; J.L. and S.-E.L. wrote the manuscript; J.L. and S.-E.L. and K.-Y.P. participated in research plan development and revised the manuscript; supervision J.-H.C.; All authors contributed to the manuscript. All authors have read and agreed to the published version of the manuscript.
Funding
This research was funded by Korea Institute of Energy Technology Evaluation and Planning (KETEP) and the Ministry of Trade, Industry and Energy (MOTIE) of the Korea (grant number: 20202010600010).
Institutional Review Board Statement
Not applicable.
Informed Consent Statement
Not applicable.
Data Availability Statement
Data sharing not applicable.
Conflicts of Interest
The authors declare no conflict of interest.
References
- Goodenough, J.B.; Park, K.-S. The Li-Ion Rechargeable Battery: A Perspective. J. Am. Chem. Soc. 2013, 135, 1167–1176. [Google Scholar] [CrossRef] [PubMed]
- Xu, K. Nonaqueous Liquid Electrolytes for Lithium-Based Rechargeable Batteries. Chem. Rev. 2004, 104, 4303–4418. [Google Scholar] [CrossRef] [PubMed]
- Choi, J.W.; Aurbach, D. Promise and reality of post-lithium-ion batteries with high energy densities. Nat. Rev. Mater. 2016, 1, 16013. [Google Scholar] [CrossRef]
- Wu, F.; Maier, J.; Yu, Y. Guidelines and trends for next-generation rechargeable lithium and lithium-ion batteries. Chem. Soc. Rev. 2020, 49, 1569–1614. [Google Scholar] [CrossRef] [PubMed]
- Uddin, K.; Dubarry, M.; Glick, M.B. The viability of vehicle-to-grid operations from a battery technology and policy perspective. Energy Policy 2018, 113, 342–347. [Google Scholar] [CrossRef]
- Uddin, K.; Jackson, T.; Widanage, W.D.; Chouchelamane, G.; Jennings, P.A.; Marco, J. On the possibility of extending the lifetime of lithium-ion batteries through optimal V2G facilitated by an integrated vehicle and smart-grid system. Energy 2017, 133, 710–722. [Google Scholar] [CrossRef]
- Cho, I.-H.; Lee, P.-Y.; Kim, J.-H. Analysis of the Effect of the Variable Charging Current Control Method on Cycle Life of Li-ion Batteries. Energies 2019, 12, 3023. [Google Scholar] [CrossRef] [Green Version]
- Kwon, S.-J.; Han, D.; Choi, J.H.; Lim, J.-H.; Lee, S.-E.; Kim, J. Remaining-useful-life prediction via multiple linear regression and recurrent neural network reflecting degradation information of 20Ah LiNixMnyCo1−x−yO2 pouch cell. J. Electroanal. Chem. 2020, 858, 113729. [Google Scholar] [CrossRef]
- Kwon, S.-J.; Lee, S.-E.; Lim, J.-H.; Choi, J.; Kim, J. Performance and Life Degradation Characteristics Analysis of NCM LIB for BESS. Electronics 2018, 7, 406. [Google Scholar] [CrossRef] [Green Version]
- Braco, E.; Martín, I.S.; Berrueta, A.; Sanchis, P.; Ursúa, A. Experimental assessment of cycling ageing of lithium-ion second-life batteries from electric vehicles. J. Energy Storage 2020, 32, 101695. [Google Scholar] [CrossRef]
- An, S.J.; Li, J.; Daniel, C.; Mohanty, D.; Nagpure, S.; Wood, D.L. The state of understanding of the lithium-ion-battery graphite solid electrolyte interphase (SEI) and its relationship to formation cycling. Carbon 2016, 105, 52–76. [Google Scholar] [CrossRef] [Green Version]
- Wang, A.; Kadam, S.; Li, H.; Shi, S.; Qi, Y. Review on modeling of the anode solid electrolyte interphase (SEI) for lithium-ion batteries. NPJ Comput. Mater. 2018, 4, 1. [Google Scholar] [CrossRef] [Green Version]
- Mussa, A.S.; Klett, M.; Lindbergh, G.; Lindström, R.W. Effects of external pressure on the performance and ageing of single-layer lithium-ion pouch cells. J. Power Sources 2018, 385, 18–26. [Google Scholar] [CrossRef]
- Lee, J.-I.; Park, J.-H.; Lee, S.-Y.; Park, S. Surface engineering of sponge-like silicon particles for high-performance lithium-ion battery anodes. Phys. Chem. Chem. Phys. 2013, 15, 7045. [Google Scholar] [CrossRef] [PubMed] [Green Version]
- Xie, H.; Wu, Z.; Wang, Z.; Qin, N.; Li, Y.; Cao, Y.; Lu, Z. Solid electrolyte interface stabilization via surface oxygen species functionalization in hard carbon for superior performance sodium-ion batteries. J. Mater. Chem. A 2020, 8, 3606–3612. [Google Scholar] [CrossRef]
- Pender, J.P.; Jha, G.; Youn, D.H.; Ziegler, J.M.; Andoni, I.; Choi, E.; Heller, A.; Dunn, B.S.; Weiss, P.S.; Penner, R.M.; et al. Electrode Degradation in Lithium-Ion Batteries. ACS Nano 2020, 14, 1243–1295. [Google Scholar] [CrossRef] [Green Version]
- Huang, Q.; Loveridge, M.J.; Genieser, R.; Lain, M.J.; Bhagat, R. Electrochemical Evaluation and Phase-related Impedance Studies on Silicon–Few Layer Graphene (FLG) Composite Electrode Systems. Sci. Rep. 2018, 8, 1–9. [Google Scholar] [CrossRef] [Green Version]
- Naderi, E.; Asrari, A. In Hardware-in-the-loop experimental validation for a lab-scale microgrid targeted by cyberattacks. In Proceedings of the 9th International Conference on Smart Grid, Setubal, Portugal, 29 June–1 July 2021. [Google Scholar]
- Naderi, E.; Bibek, K.C.; Ansari, M.; Asrari, A. Experimental Validation of a Hybrid Storage Framework to Cope with Fluctuating Power of Hybrid Renewable Energy-Based Systems. IEEE Trans. Energy Convers. 2021, 36, 1991–2001. [Google Scholar] [CrossRef]
Figure 1.
A flowchart of battery performance test.

Figure 2.
(a) Test system, (b) Pressure jig.

Figure 3.
Changes in SOC and current according to pattern. (a) Changes in SOC for V0G pattern, (b) Changes in current for V0G pattern, (c) Changes in SOC for V1G pattern, (d) Changes in current for V1G pattern, (e) Changes in SOC for V2G pattern, (f) Changes in current for V2G pattern.
Figure 3.
Changes in SOC and current according to pattern. (a) Changes in SOC for V0G pattern, (b) Changes in current for V0G pattern, (c) Changes in SOC for V1G pattern, (d) Changes in current for V1G pattern, (e) Changes in SOC for V2G pattern, (f) Changes in current for V2G pattern.

Figure 4.
Post-pattern battery performance test: Capacity. (a) Capacity after V0G pattern, (b) Capacity after V1G pattern, (c) Capacity after V2G pattern, (d) Comparison of capacity between V0G, V1G, and V2G patterns.
Figure 4.
Post-pattern battery performance test: Capacity. (a) Capacity after V0G pattern, (b) Capacity after V1G pattern, (c) Capacity after V2G pattern, (d) Comparison of capacity between V0G, V1G, and V2G patterns.

Figure 5.
Comparison of DCIR between V0G, V1G, and V2G patterns.

Figure 6.
Post-pattern battery performance test: AC-impedance. (a) AC-impedance after V0G pattern, (b) AC-impedance after V1G pattern, (c) AC-impedance after V2G pattern, (d) Comparison of AC-impedance (Rs + Rct) between patterns, (e) Comparison of Rs between patterns, (f) Comparison of Rct between patterns.

Figure 7.
(a) Internal resistance of AC-Impedance, (b) Internal resistance of DCIR.

Figure 8.
DCIR of the “stop-operation” part after V0G pattern repetition. (a) V0G pattern and the “stop-operation” part, (b) Changes in current and voltage at Part (a), (c) Comparison of DCIR between parts (a, b), (d) Changes in current and voltage at part (c), (e) Comparison of DCIR between parts (c, d).

Figure 9.
DCIR of the “stop-operation” part according to pattern repetition. (a) V1G pattern and the “stop-operation” part, (b) V2G pattern and the “stop-operation” part, (c) Comparison of DCIR between parts (a, b) (V1G), (d) Comparison of DCIR between parts (a, b) (V2G), (e) Comparison of DCIR between parts (c, d) (V1G), (f) Comparison of DCIR between parts (c, d) (V2G).

Publisher’s Note: MDPI stays neutral with regard to jurisdictional claims in published maps and institutional affiliations. |
© 2021 by the authors. Licensee MDPI, Basel, Switzerland. This article is an open access article distributed under the terms and conditions of the Creative Commons Attribution (CC BY) license (https://creativecommons.org/licenses/by/4.0/).
Share and Cite
MDPI and ACS Style
Lim, J.; Lee, S.-E.; Park, K.-Y.; Kim, H.-S.; Choi, J.-H. VxG Pattern-Based Analysis and Battery Deterioration Diagnosis. Energies 2021, 14, 5422. https://0-doi-org.brum.beds.ac.uk/10.3390/en14175422
AMA Style
Lim J, Lee S-E, Park K-Y, Kim H-S, Choi J-H. VxG Pattern-Based Analysis and Battery Deterioration Diagnosis. Energies. 2021; 14(17):5422. https://0-doi-org.brum.beds.ac.uk/10.3390/en14175422
Chicago/Turabian StyleLim, Jungho, Sung-Eun Lee, Kwang-Yong Park, Hee-Soo Kim, and Jin-Hyeok Choi. 2021. "VxG Pattern-Based Analysis and Battery Deterioration Diagnosis" Energies 14, no. 17: 5422. https://0-doi-org.brum.beds.ac.uk/10.3390/en14175422
Note that from the first issue of 2016, this journal uses article numbers instead of page numbers. See further details here.