
Indonesia’s Vast Solar Energy Potential


School of Engineering, Australian National University, Canberra 2600, Australia
*
Author to whom correspondence should be addressed.
Energies 2021, 14(17), 5424; https://0-doi-org.brum.beds.ac.uk/10.3390/en14175424
Submission received: 16 July 2021
/
Revised: 11 August 2021
/
Accepted: 24 August 2021
/
Published: 31 August 2021
(This article belongs to the Topic Optimisation, Optimal Control and Nonlinear Dynamics in Electrical Power, Energy Storage and Renewable Energy Systems)
Abstract
:In this paper, we conclude that Indonesia has vast potential for generating and balancing solar photovoltaic (PV) energy to meet future energy needs at a competitive cost. We systematically analyse renewable energy potential in Indonesia. Solar PV is identified to be an energy source whose technical, environmental and economic potential far exceeds Indonesia’s present and future energy requirements and is far larger than all other renewable energy resources combined. We estimate that electricity consumption in Indonesia could reach 9000 terawatt-hours per year by 2050, which is 30 times larger than at present. Indonesia has abundant space to deploy enough solar to meet this requirement, including on rooftops, inland reservoirs, mining wasteland, and in combination with agriculture. Importantly, Indonesia has a vast maritime area that almost never experiences strong winds or large waves that could host floating solar capable of generating >200,000 terawatt-hours per year. Indonesia also has far more off-river pumped hydro energy storage potential than required for balancing solar generation.
1. Introduction
The purpose of this paper is to systematically analyse the potential of Indonesia to generate enough renewable energy to be energy self-sufficient. This includes both now and in several decades time when Indonesian per capita energy consumption may rise to match the developed world. It also includes the electricity required for the elimination of fossil fuels via full electrification of transport, heating, and industry. The paper identifies vastly greater practical solar generation potential than previous studies; much more than sufficient to meet all of Indonesia’s future energy needs.
Indonesia has the world’s 4th largest population of 276 million people [1] with 335 million projected in 2050 [2]. Electricity availability is near 100%. The current electricity demand of 1.1 Megawatt-hour (MWh) per person per year is projected to rise to 7 MWh per person per year in the next two decades [2], mainly due to rising living standards. For context, electricity demand in Singapore is 9 MWh per person per year [3,4].
Because of its high population and projected rapid growth in energy consumption, Indonesia’s energy future will have a significant impact on global greenhouse emissions. Indonesia pledged in 2015 to reduce greenhouse gas emissions by 29–41% from the business as usual scenario by 2030 [5]. Electricity in Indonesia is generated primarily by coal (61%) and gas (23%) [6]. If Indonesia continues to meet its energy needs in 2050 primarily from fossil fuels, it is difficult to imagine that the Paris emissions targets can be met. The National General Electricity Plan targets doubling the share of renewable energy generation to 23% of the country’s total generation mix by 2025 [7].
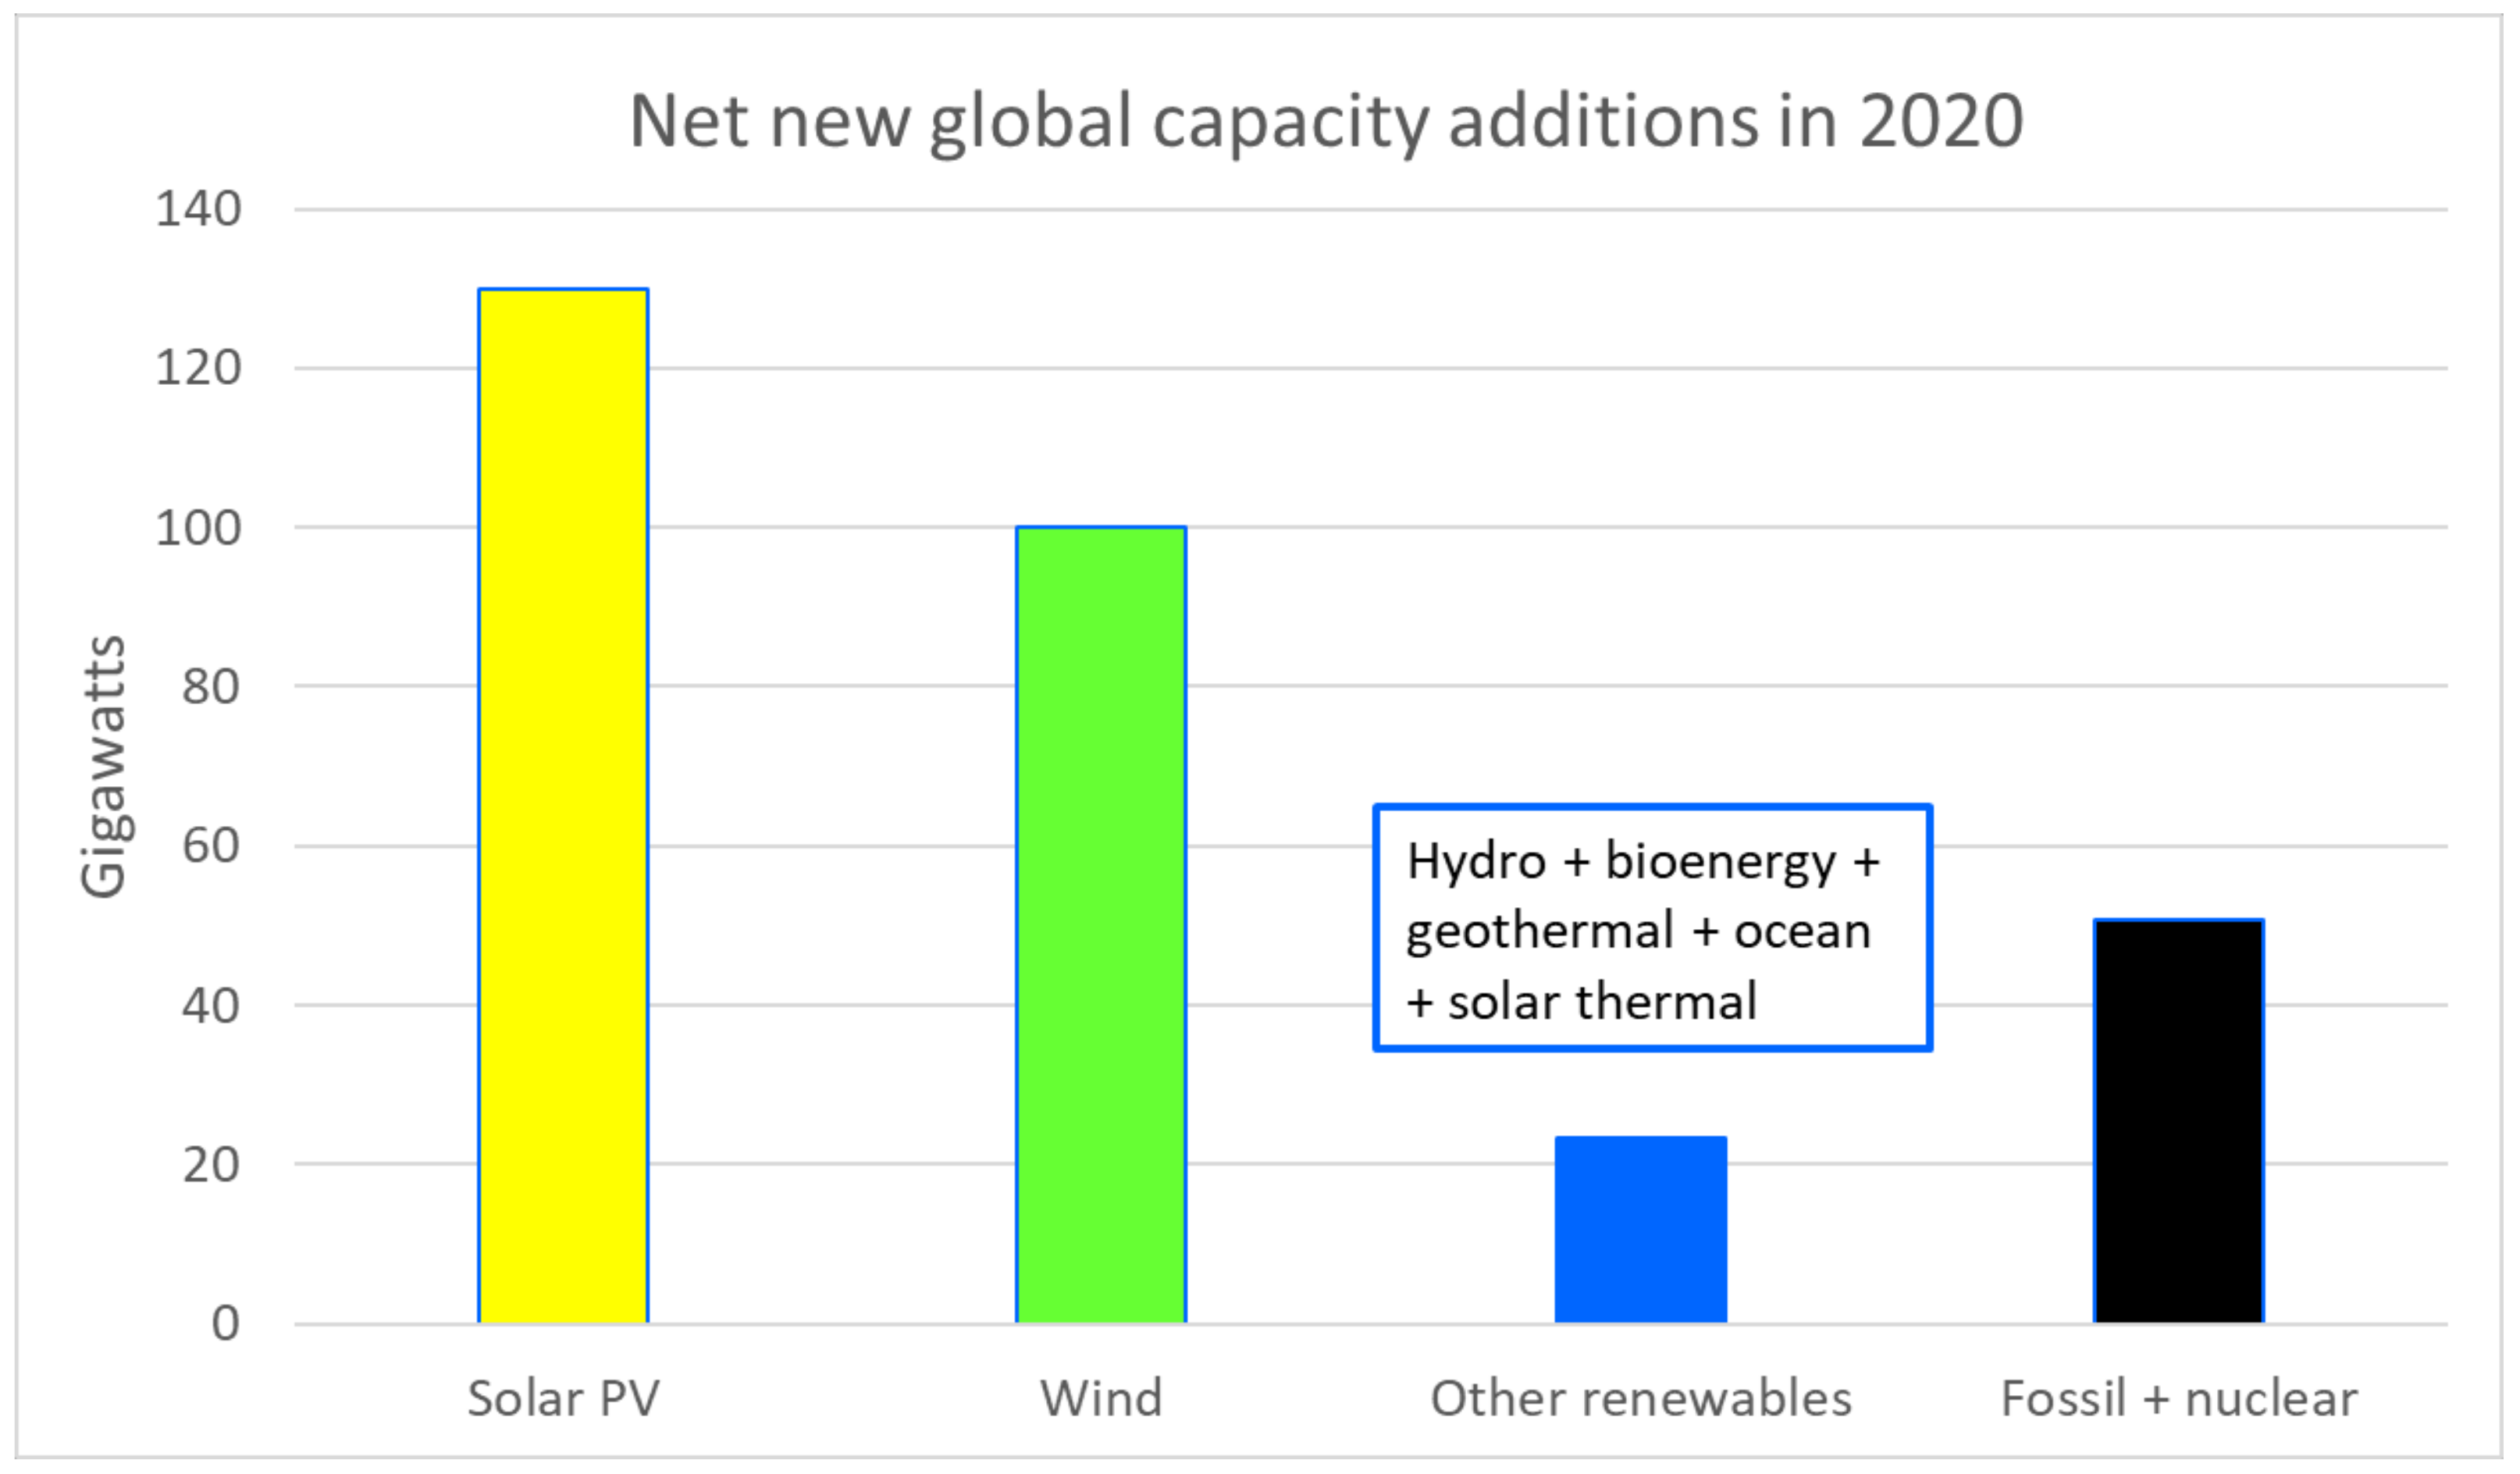
Dramatic falls in the cost of solar PV and wind-generated electricity are causing a profound shift in generation patterns in many countries. In 2020, about three-quarters of global net generation capacity additions comprised solar PV and wind (Figure 1).
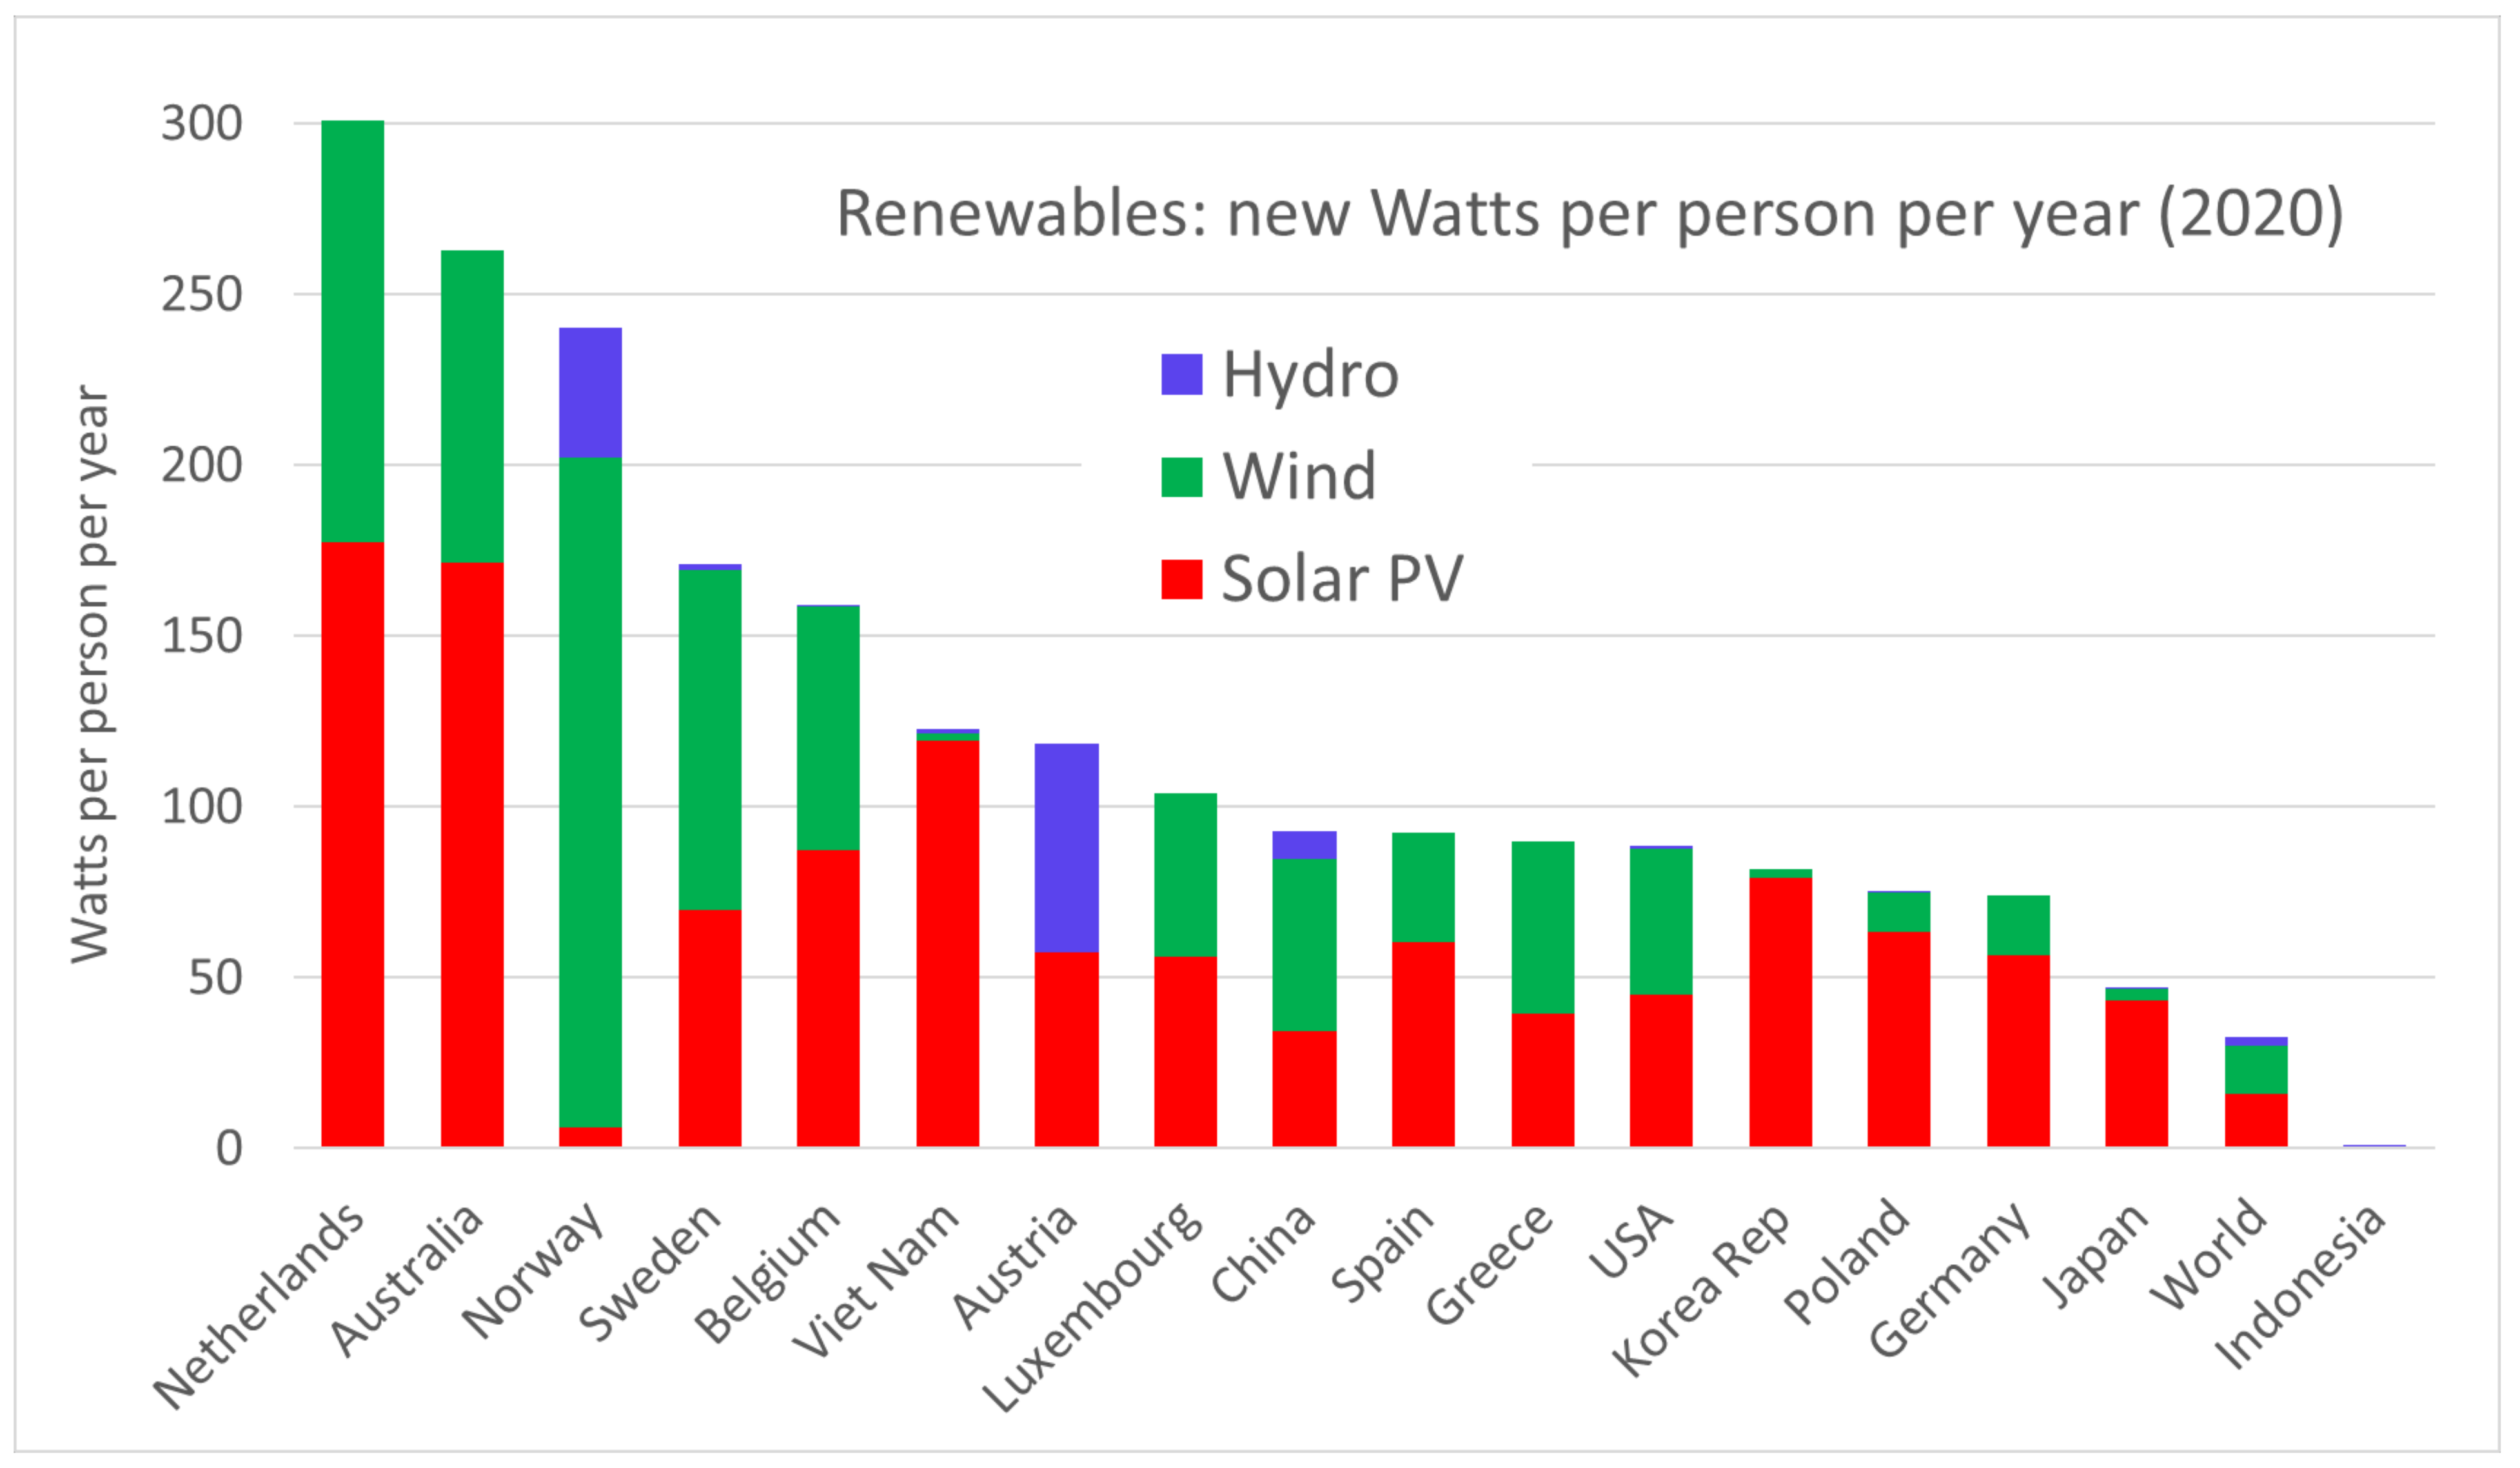
In some countries, including nearby Australia, solar and wind constitute nearly all new generation capacity. However, Indonesia is adopting solar and wind energy very slowly by global per capita standards (Figure 2).
Indonesia’s renewable electricity share slowly increased from 4.4% in 2015 to 9.2% in 2019 [12]. According to the National General Energy Plan [2], the renewable energy potential in Indonesia is 443 Gigawatts (GW), including a solar energy potential of 208 GW (Table 1).
Given its large potential and low costs, it is important to understand the scale of the solar opportunity. As will be shown in this work, the solar energy potential listed in Table 1 is vastly less than the actual potential. Exploring this disparity is a prime motivation for this paper.
The paper is organised as follows:
- Estimation of a generous upper bound on Indonesian electricity demand in 2050 assuming a rise in per capita energy consumption to match developed countries and full electrification of energy services including transport, heating, and industry.
- A survey of previous studies of Indonesia’s renewable energy potential.
- An analysis of Indonesia’s solar energy resource and variability.
- Systematic exploration of where solar panels could be located on a very large scale.
- A discussion of balancing 100% renewable energy in Indonesia including identification of a vast off-river pumped hydro energy storage resource.
- Discussion of the results and conclusion.
The novelty of this paper is a systematic analysis of the amount of solar energy that could be harvested in Indonesia, showing that it is far larger than previous studies and also far larger than potential demand. This includes:
- Identification of the vast scale of Indonesian maritime areas for hosting floating solar panels without subjecting them to large waves and strong winds. The vast seascape area where waves do not exceed 4 m in height and wind speeds do not exceed 15 m/sec has not been previously identified.
- Estimation of the substantial capacity of solar that could be hosted by defunct mines. A geographic information system (GIS) analysis of the area of land (and hence solar hosting capacity) has not been done before.
- Identification of Indonesian off-river pumped hydro as a low-impact, low-cost and mature technology with far larger storage capacity than Indonesia would ever need. Our previous novel work in identifying 616,000 off-river sites around the world with a storage potential of 23 million Gigawatt-hours is applied to Indonesia for the first time.
Discussions of energy options are changing very fast in Indonesia and elsewhere due to low and falling costs for solar and rising concern about global warming. We hope that this paper, which identifies vast solar and pumped hydro storage resources, removes doubts that Indonesia can be nearly 100% solar powered in the future.
2. Energy Requirements in 2050
Major countries including China, Japan, South Korea, the USA, and the European Union countries have indicated their intention to decarbonise by 2050 or 2060. This will be accomplished mainly through renewable electrification of fossil fuel energy services [14]. The purpose of this paper is to determine whether Indonesia can meet a realistic upper bound on its entire energy requirements in 2050 from domestic solar energy. This includes electricity, transport, buildings, and industry. Zero fossil fuel use is assumed.
In calculating Indonesian electricity demand in 2050, we assume Indonesia’s population grows to 335 million in 2050 [2]. Further, we assume that per capita annual consumption of electricity and energy in 2050 grows to match that of Singapore, which has a mature industrialised economy, is Indonesia’s close neighbour, and also has a high population density. Electricity consumption in Singapore currently averages 9 MWh per person per year [3,4].
Further, we assume that complete electrification of all energy services occurs. Coal, oil, and gas are entirely removed from the economy. Land transport is assumed to be via electric vehicles. Low-temperature heating and cooling are assumed to be via electric heat pumps with high-temperature heating via electric furnaces. Production of fertilisers, plastics, synthetic fuel for shipping and aviation, iron and steel, and similar products is assumed to be entirely electrified, utilising where necessary hydrogen derived from water splitting and carbon derived from air capture. An analysis for Australia suggests that this would double or triple electricity demand [15]. A factor of 3 is naively adopted for a hypothetical high income, high energy-consuming, industrialised, Indonesia in 2050.
Thus, we assume annual electricity demand in 2050 is [335 million people] × [9 MWh per person] × 3, which equals 9000 Terawatt-hours (TWh) per year. This compares with the current electricity demand of 300 TWh per year. Assuming an average capacity factor of 15.4% (detailed calculation below), this corresponds to 6.7 Terawatts (TW) of solar power (1350 TWh per year per TW).
This is not an unrealistic scenario if the world decarbonises by 2050, and if Indonesia enjoys a high level of economic success akin to Singapore. As will be shown, even this high annual energy demand can be comfortably met through the use of solar energy.
Table 1 provides a governmental estimate for the potential of non-solar renewable power sources of 235 GW. Assuming an optimistic average capacity factor of 50%, the annual energy generation from the non-solar sources could amount to about 1000 TWh per year. This is orders of magnitude smaller than the solar potential and is neglected for the purposes of exploring whether solar could accomplish the entire task.
The question this paper seeks to answer is whether there is sufficient land and water in Indonesia to meet its upper bound energy requirements in 2050 from solar PV when subject to realistic constraints relating to food production, forest protection, environmental values, geography (e.g., mountainous regions), and wave heights/wind speeds (for floating maritime PV).
In our analysis, we include roof-mounted PV, PV floating on inland lakes and reservoirs, PV floating in sheltered areas of Indonesia’s inland sea, PV on wasteland, and PV in combination with agriculture. We exclude the use of forested land, urban land (except on rooftops), and environmentally protected land such as national parks.
The task is to find realistic space for 6.7 TW of solar PV generating about 9000 TWh per year and occupying (and alienating) a space of about 35,000 km2 (100 m2 per person) and spread across about 8 million km2 of land and ocean.
3. Previous Estimates of Indonesia’s Solar Resources
There have been many technical and cost studies of renewable energy deployment in Indonesia. Most studies apply strong and unnecessary constraints on siting of solar panels, resulting in a solar power potential that is several orders of magnitude smaller than estimated in this paper. In particular, these studies did not include a systematic analysis of solar located in maritime areas and in former mining areas, which are shown to be highly prospective.
The National General Energy Plan [2] suggested a solar energy potential of only 208 GW. Veldhuis and Reinders [16] suggested that the total potential of grid-connected solar in Indonesia is 1000 GW, which could generate 1500 TWh of electricity by constraining the suitable area to where an electricity grid exists. Kunaifi et al. [17] updated the Veldhuis and Reinders calculation and added modest off-grid solar potential. IRENA [18] estimated that available land and rooftops could host 533 GW. Based on Global Source Map research conducted by Energy Sector Management Support Program in the World Bank, Indonesia’s solar power potential was estimated to be more than 500 GW [19]. The Institute for Essential Services Reform reported that Indonesia has a technical potential of residential rooftop solar PV capacity in the range of 194 GW to 655 GW [20,21].
In studies of high solar PV supply scenario for the Java-Bali grid, Guenther [22], Simaremare et al. [23], and Wang [24] argued that siting a large number of solar panels would face difficulties in finding the required land.
Vidinopoulus et al. [25] reported that Indonesia’s solar potential is about 26,000 TWh of electricity production per year (equivalent to about 19 TW of solar PV), which is 30 times larger than other estimates but still an order of magnitude smaller than identified in this paper. Vidinopoulus et al. included estimates for available land and inland water that would not conflict with environmental values. An area of 3600 km2 was identified as allocated to palm oil production for biodiesel, which is a very inefficient method of energy production compared with using the same land for solar PV. The study recognised the large potential of solar PV in conjunction with agriculture, which was estimated to be far larger than all other potential renewable energy sources combined. An analysis of defunct mining areas was not included. The study did not include Indonesia’s vast maritime solar resource potential. All PV arrays were assumed to be single-axis tracking, although this reduces the yield per hectare because of the need to space out the trackers to avoid self-shading.
4. Solar PV Resource Assessment
4.1. Solar Panel Energy Yield
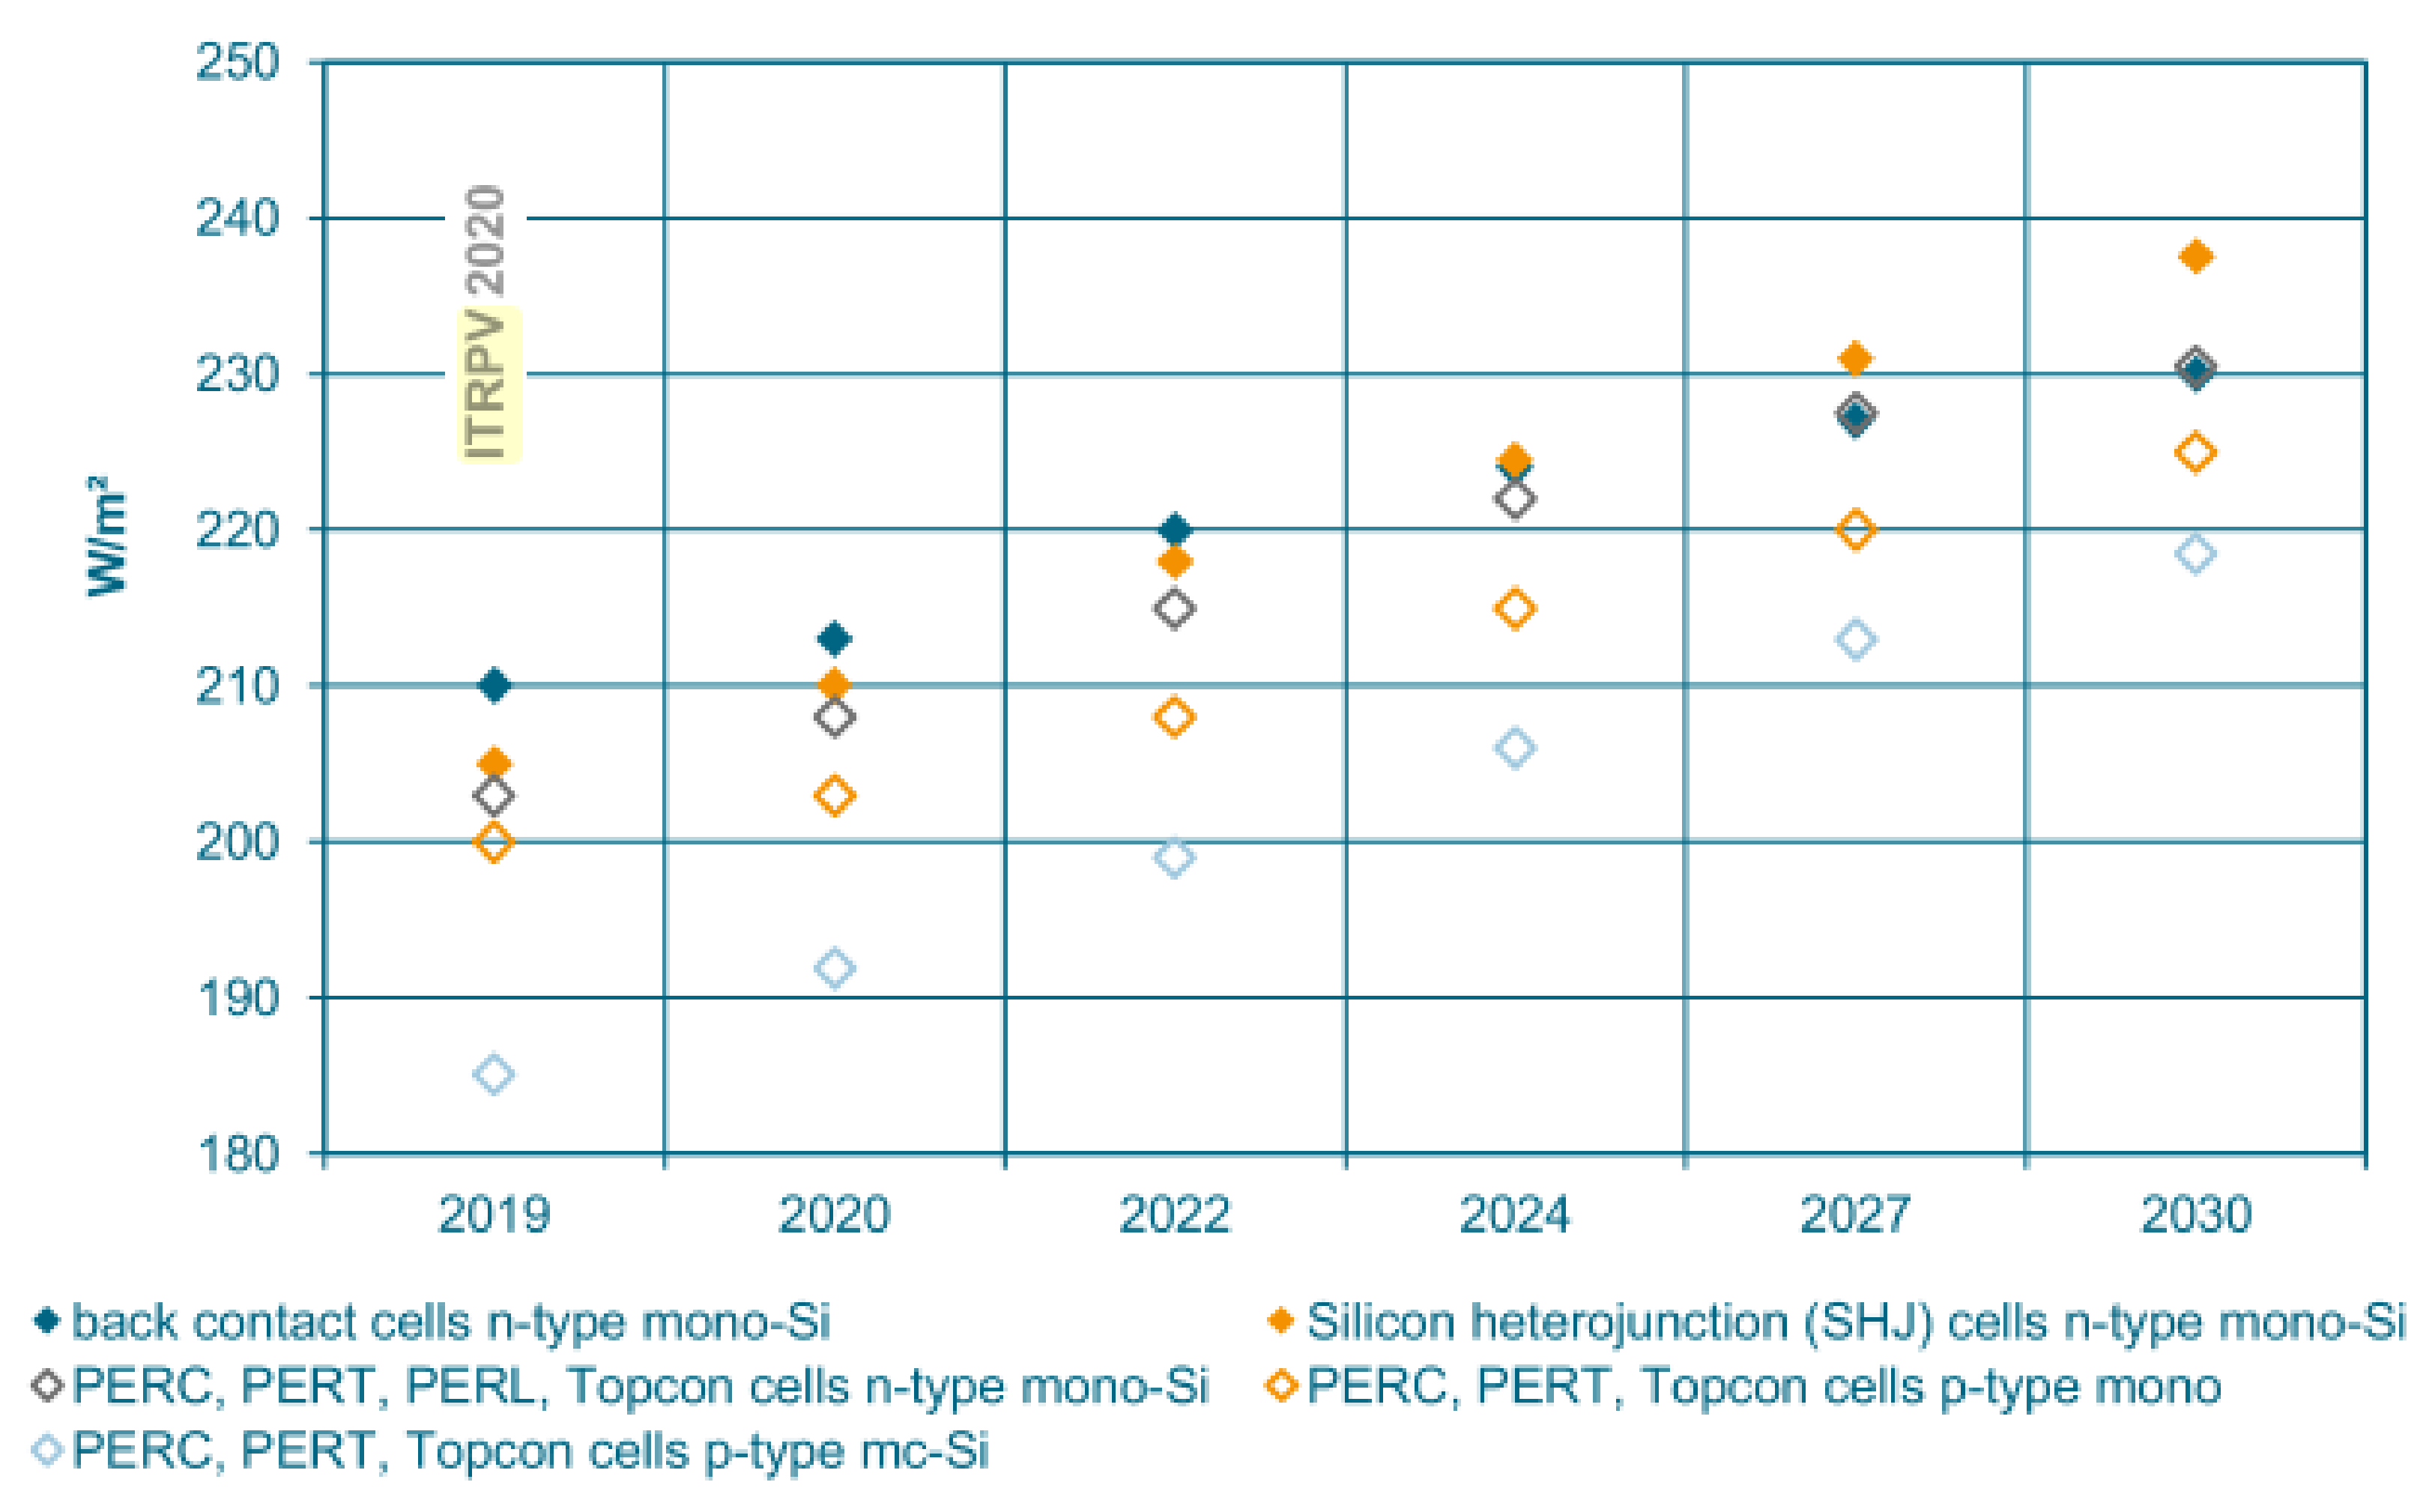
According to the International Technology Roadmap for Photovoltaics 11th update, PERC panels are expected to reach yields of about 225 W/m² under standard test conditions by 2030 (Figure 3) [26].
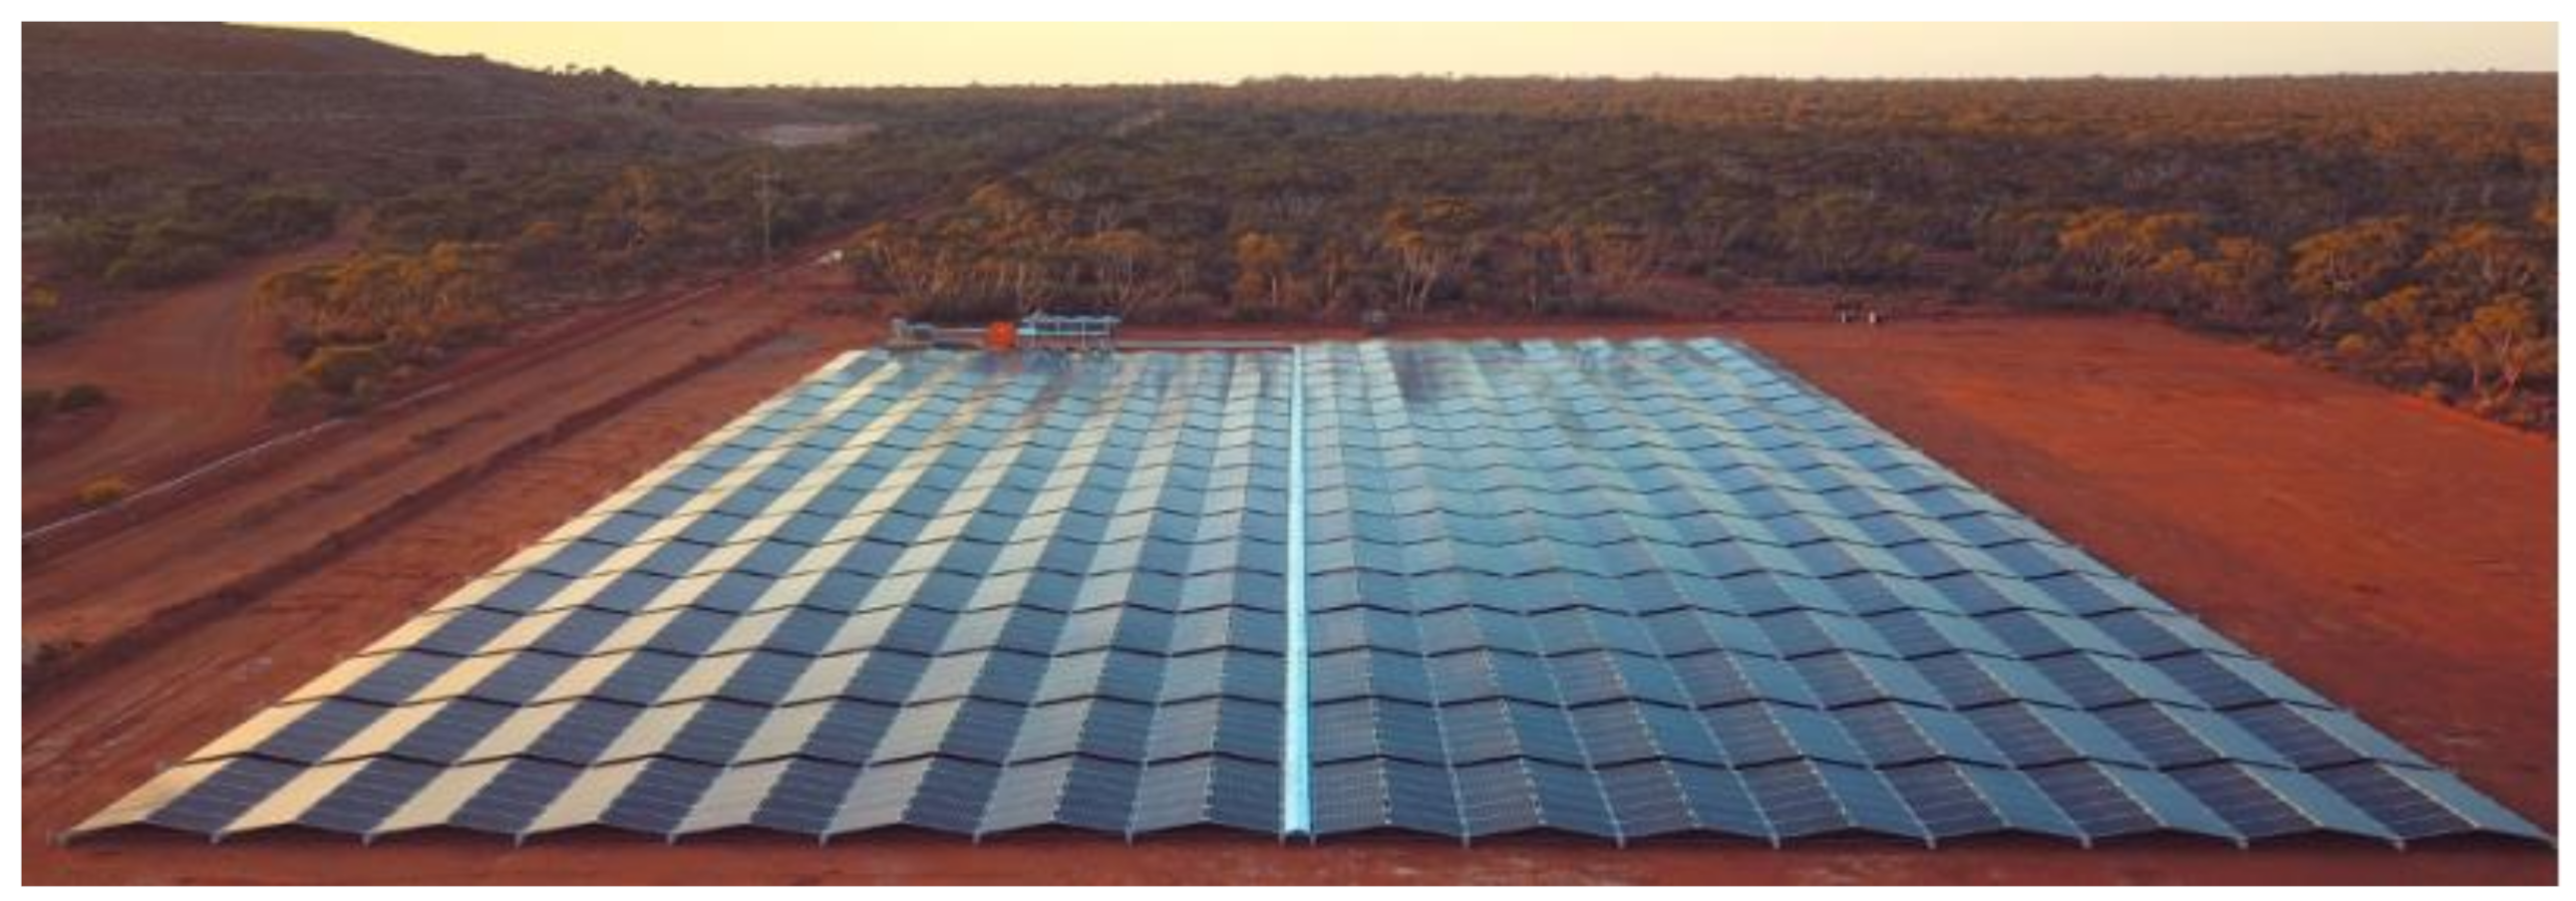
Typical tropical modules are mounted with a tilt of about 10° to assist with dirt removal by water runoff, with spacing between modules averaging 10% (illustrated in Figure 4). Thus, the nameplate DC capacity of a solar PV system is expected to be about 200 Watts per m2 (0.2 GW per km2) in the 2030s.
4.2. Solar Resource Distribution
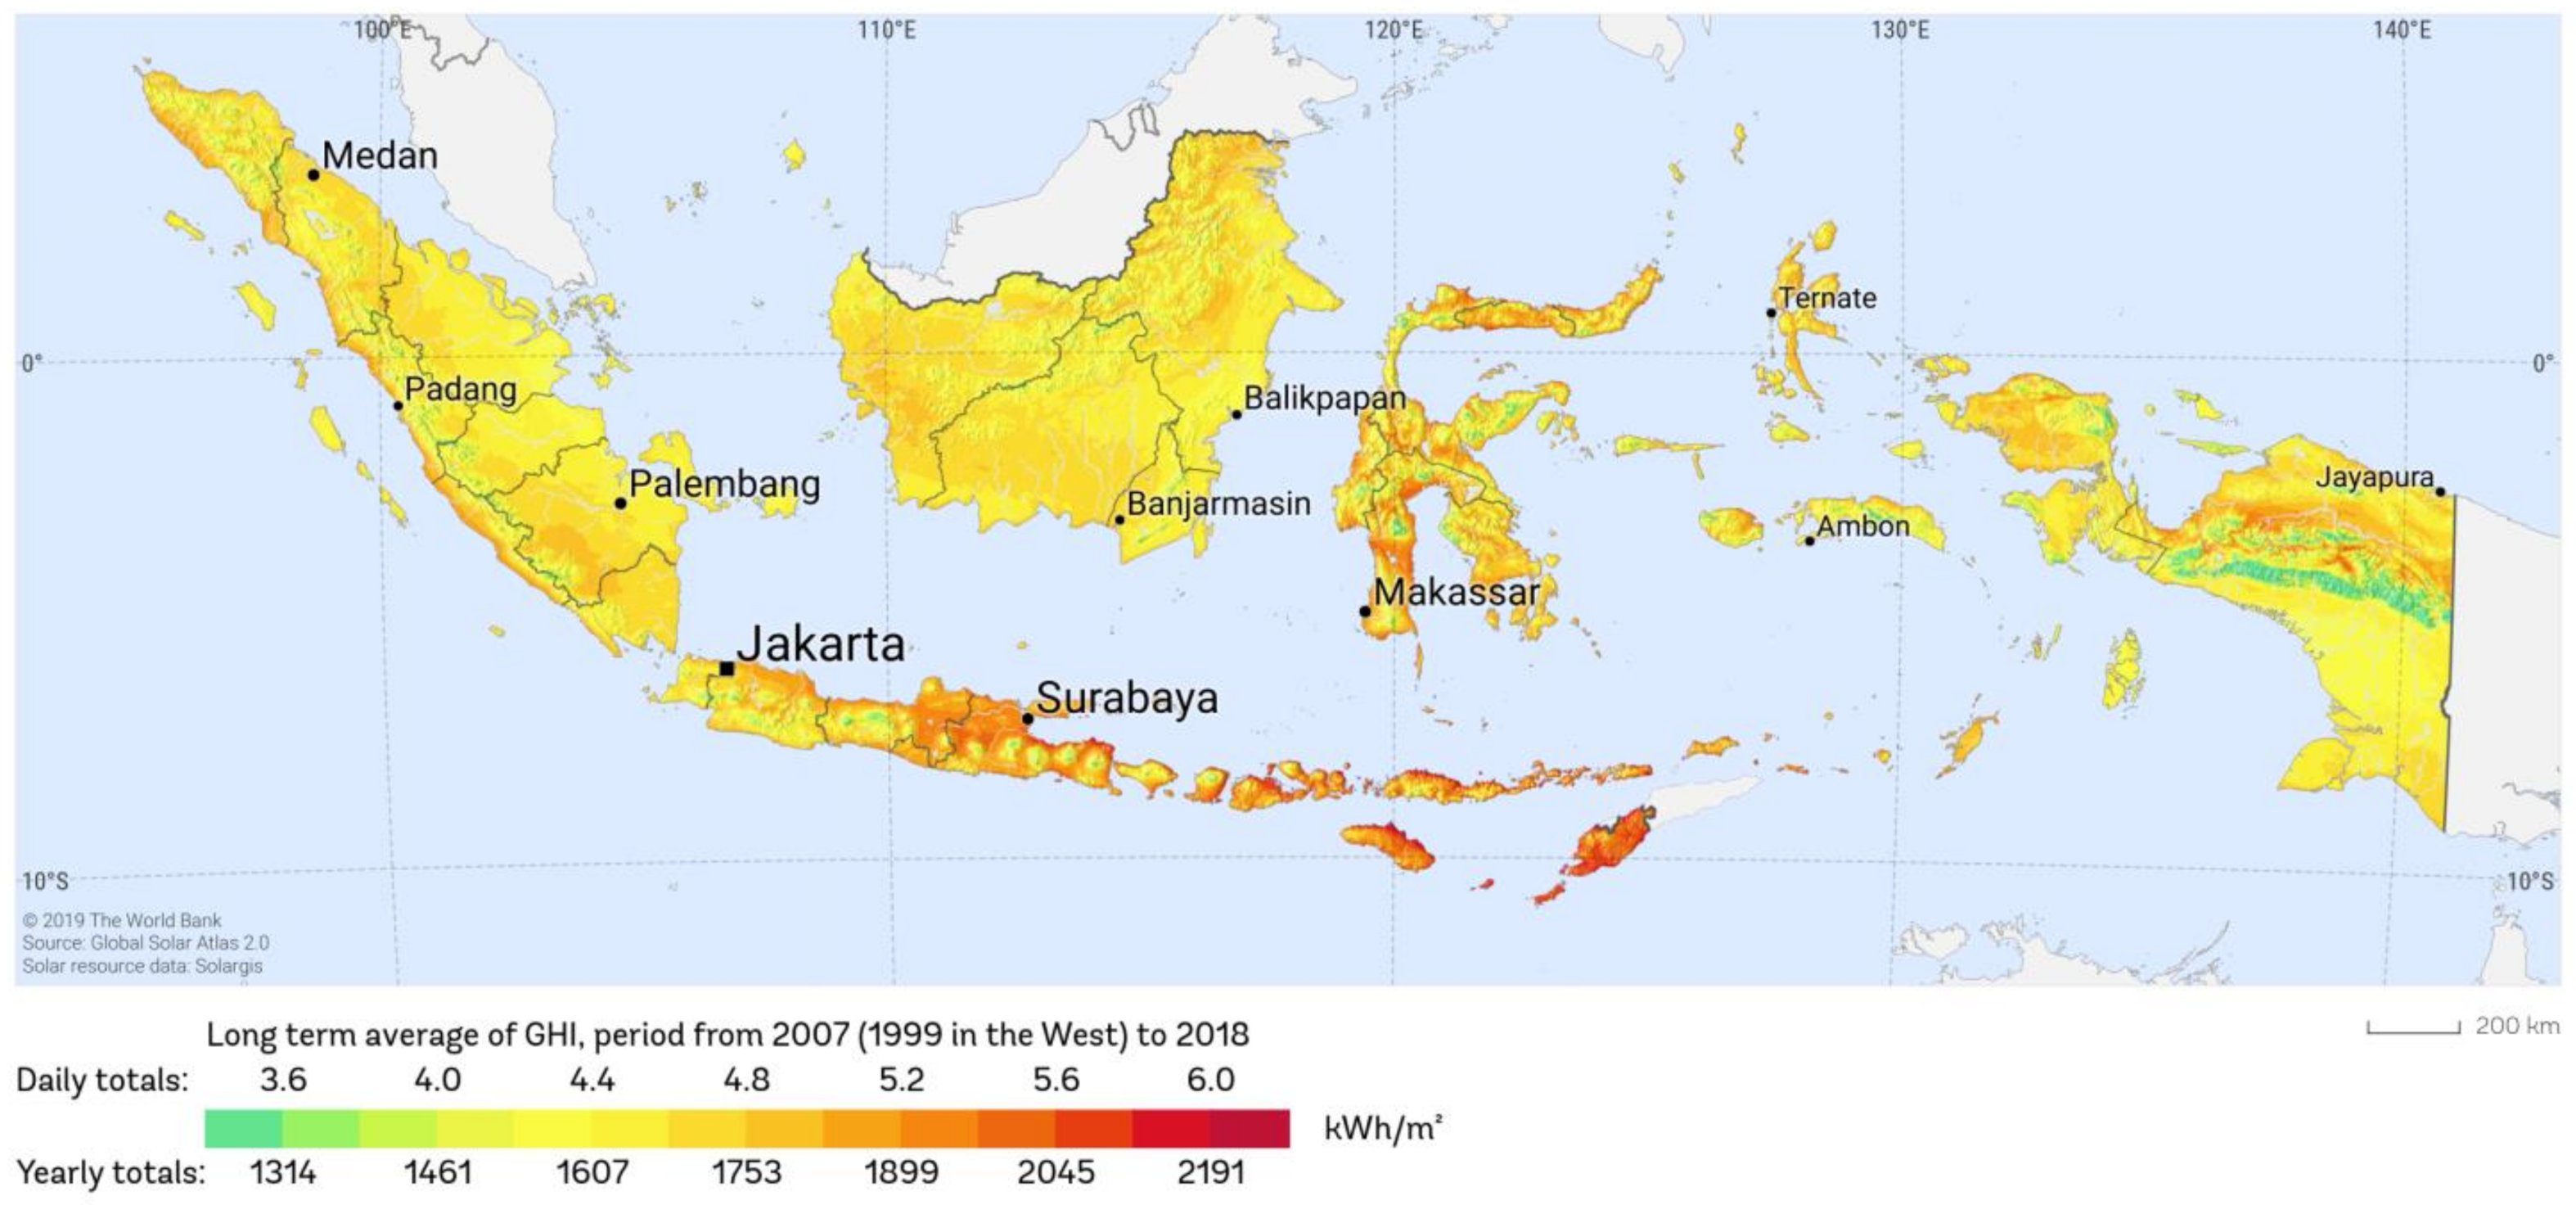
Indonesia is an equatorial country. Solar potential is relatively uniformly distributed (Figure 5). Indonesia has a daily average global horizontal irradiation (GHI) of 4.8 kWh/m2 per day [2,16,28]. This compares favourably with the daily average GHI in Germany (2.9 kWh/m2), Japan (3.6 kWh/m2), China (4.1 kWh/ m2), and Singapore (4.5 kWh/m2), as reported by the Global Solar Atlas [29].
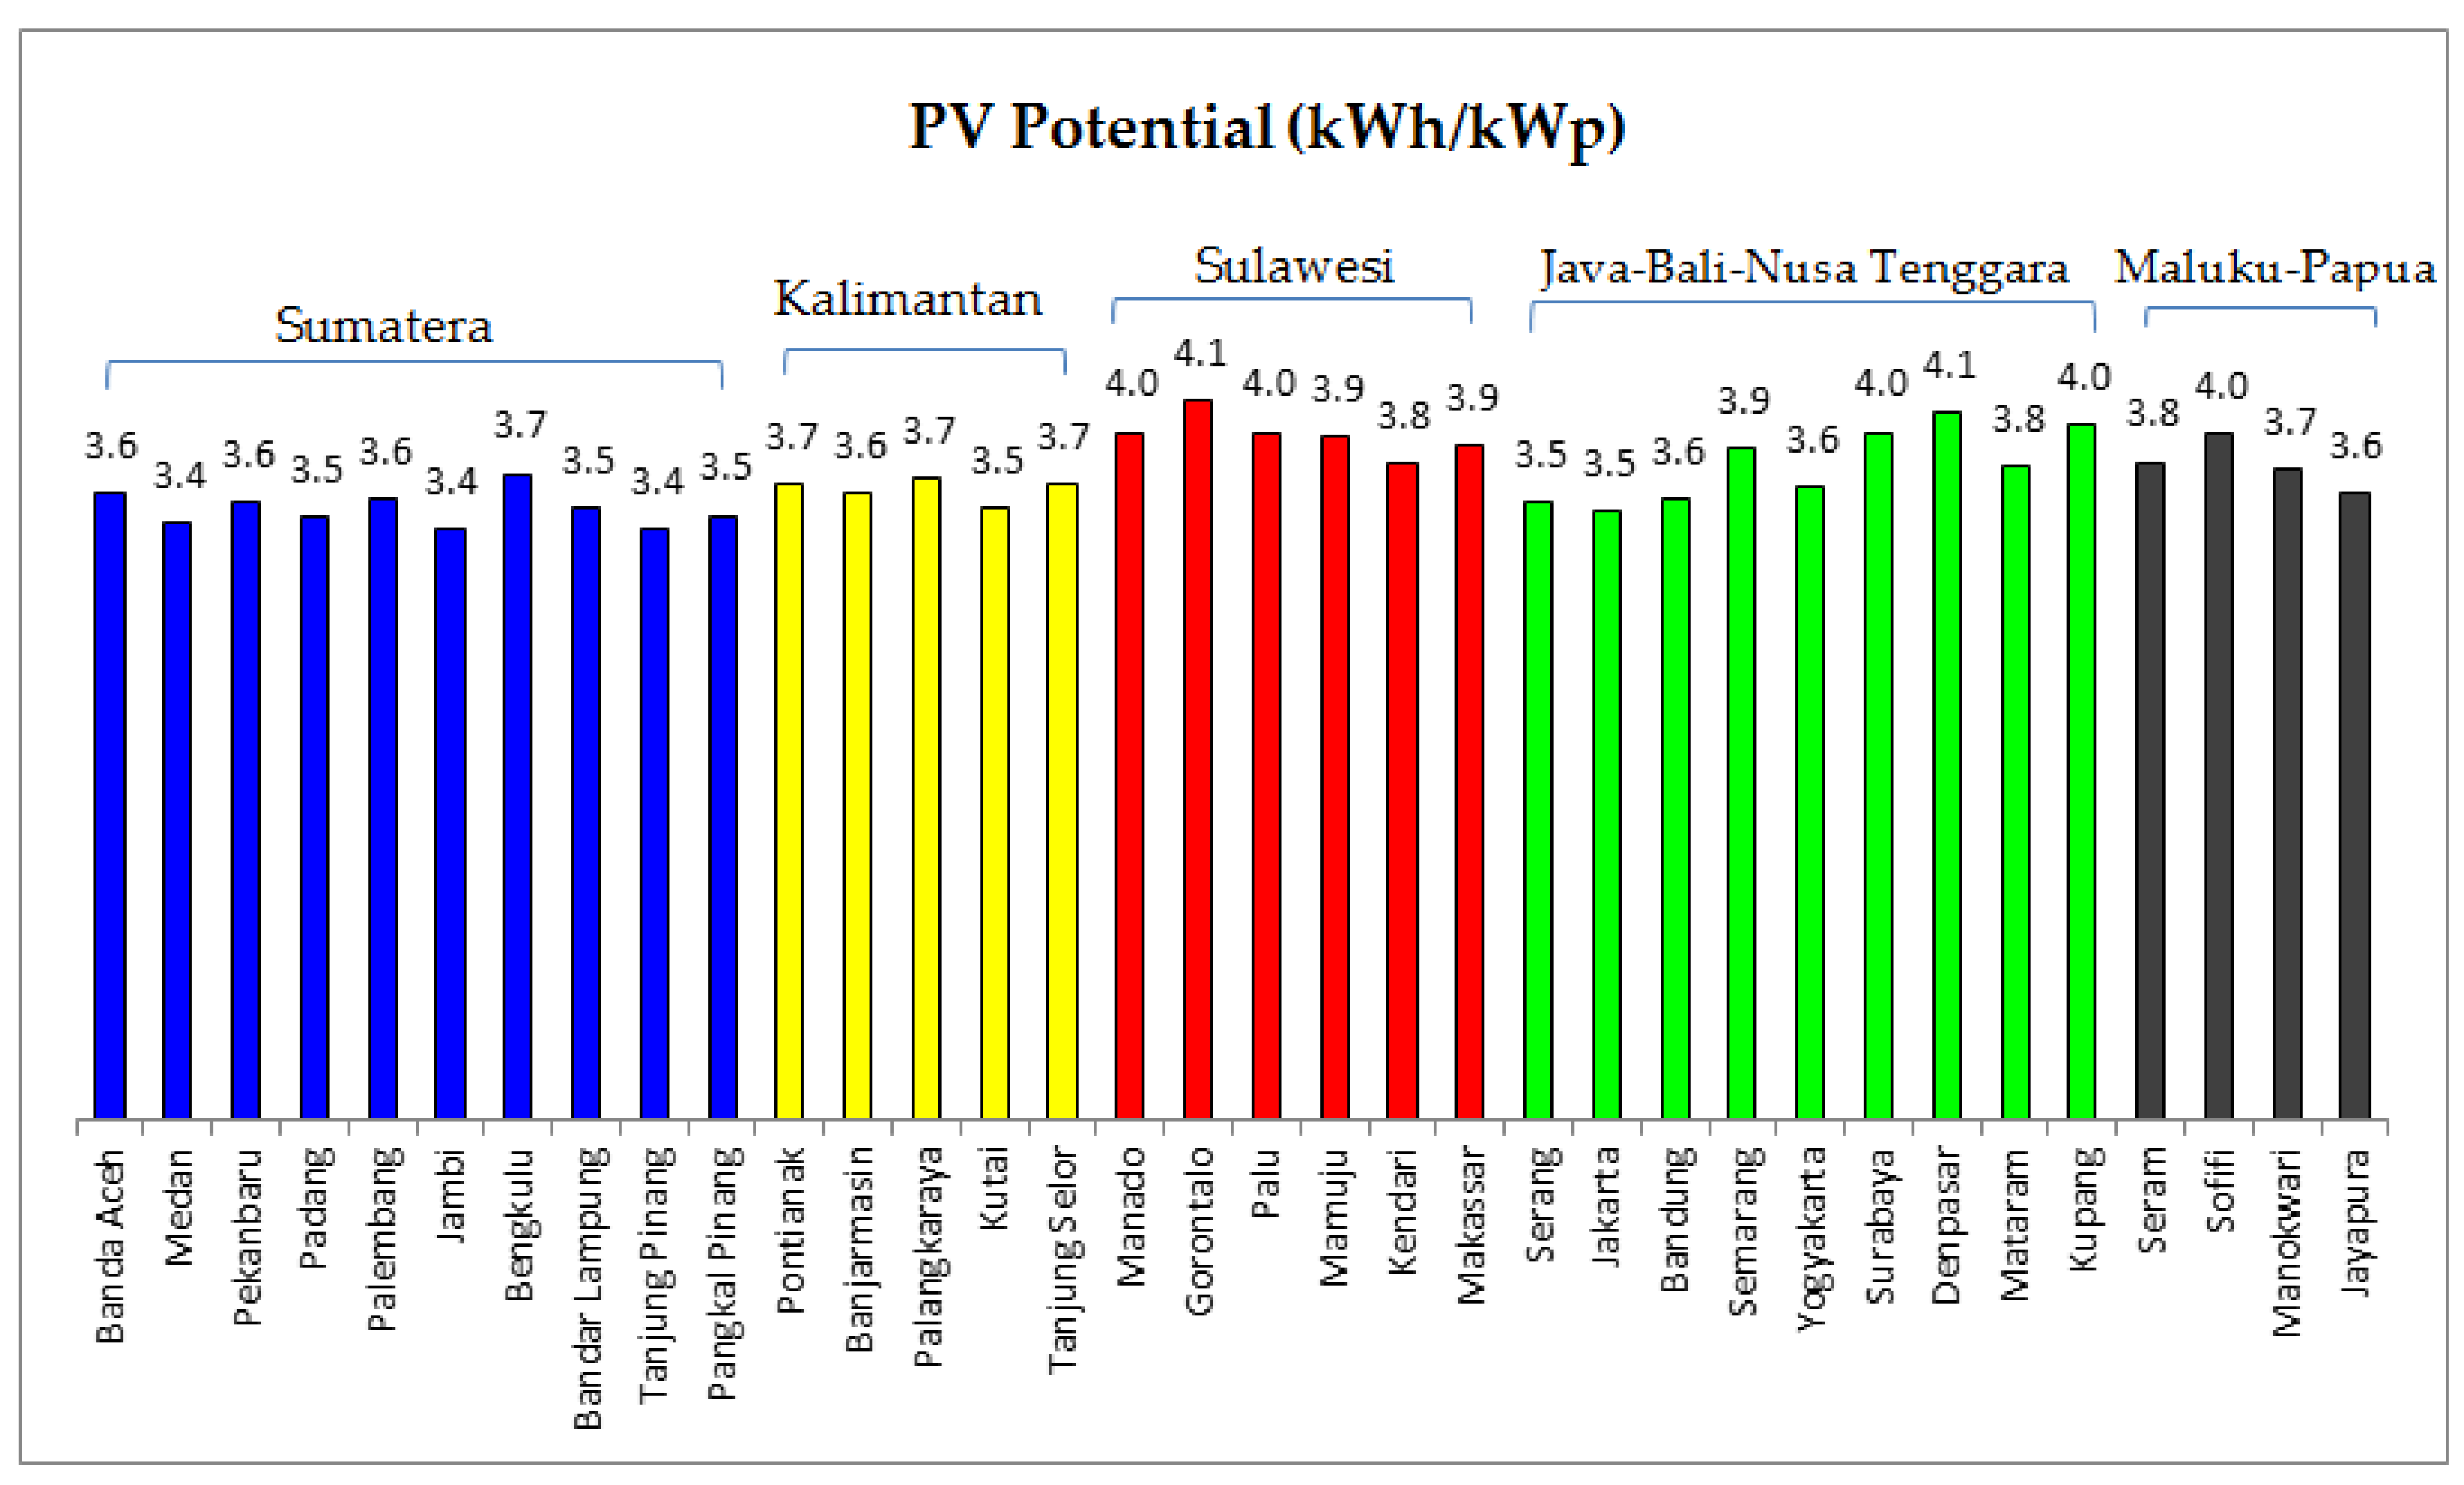
We used the PVWatts model of the System Advisory Model (SAM) [30] to calculate the potential PV output for 34 Indonesian cities spread over 5 regions. We averaged daily GHI data from Solcast [31] over 2010–2019. Assumptions comprised a premium crystalline silicon module fixed open rack array tilted at an angle of 10°; and total system losses of 14%. The expected average solar PV capacity factor is 15.4%. This equates to an annual energy output of about 1.4 Gigawatt-hour (GWh) per MW DC rating of solar PV. The PV potential output for selected cities is presented in Figure 6. The range is 3.4 to 4.1 kWh/kWp (10% variation about the mean.)
4.3. Solar Resource Variability
As an equatorial country, Indonesia has no cold winter. Both solar energy availability [32] and energy demand have low seasonal variation, and large-scale (expensive) seasonal storage of energy is not required.
The temporal variation in average solar irradiation for 34 cities located over the five regions is presented in Table 2. The values of GHI in the ten years period 2010–2019 are compared for Sumatera (10 cities), Kalimantan (5 cities), Sulawesi (6 cities), Java-Bali-Nusa Tenggara (9 cities), and Maluku-Papua (4 cities).
Indonesia has a low daily, weekly, and seasonal variation of GHI. This is illustrated in Table 2 which tabulates GHI averaged over cities located in each of the 5 main regions for the period 2010–2019. The first row is the average daily GHI over 10 years. The other rows tabulate the worst day, 2-day period, 7-day period, and month over 10 years relative to the average. The last column does likewise for the sum of the 34 cities.
The worst day during 2010–2019, averaged over 34 Indonesian cities, is half as good as the average day. As expected, the worst 2 consecutive days, 7 consecutive days, and month produces higher fractions of the average.
Averaging over individual islands produces lower fractions, which suggests that good inter-island interconnection would be advantageous. The worst 7-day period for individual islands is a larger proportion of the corresponding figure for 34 Indonesian cities than is the case for a 1-day or 2-day period. This suggests that larger storage can substitute for stronger transmission interconnection.
Seasonal storage of solar energy is not required in Indonesia. Energy storage need only be short term, primarily for day–night load balancing.
4.4. Balancing High Levels of Variable Solar PV
Balancing high levels of variable solar and wind electricity in an electricity grid is straightforward using off-the-shelf techniques that already have existing large-scale (>100 GW) deployment [33], comprising:
- Strong large-area interconnection so variations in weather and demand are smoothed;
- Demand management; paying companies and individuals to reduce demand during periods of stress for the grid;
- Storage
Energy storage for the electricity industry is nearly entirely in the form of hydro (water held in large dams), pumped hydro energy storage (PHES), and batteries (home, utility, and electric vehicles).
Batteries are becoming major components of electrical systems. They offer cost-effective storage for periods of sub-seconds to an hour or so. For storage of hours to weeks, however, pumped hydro storage is much cheaper. Globally, pumped hydro energy storage comprises about 99% of the storage energy and 95% of the storage power [34].
Currently, most pumped hydro storage is associated with rivers. Damming rivers for hydroelectricity can have an enormous environmental impact. Additionally, relatively few rivers are available for damming. There is enormous scope in Indonesia for off-river (closed-loop) PHES systems that are located away from any significant river. The off-river PHES system comprises a pair of artificial reservoirs spaced several kilometres apart, located at different altitudes (typically 200–800 m difference), and connected with pipes and tunnels. Off-river PHES utilises conventional hydroelectric technology for the construction of reservoirs, tunnels, pipes, powerhouses, electromechanical equipment, control systems, switchyard and transmission, but in a novel configuration.
In 2019, we released a comprehensive global Atlas of off-river pumped hydro [35,36]. This Atlas has been widely used by Governments, electricity and hydro companies, The World Bank, and solar and wind farm developers.
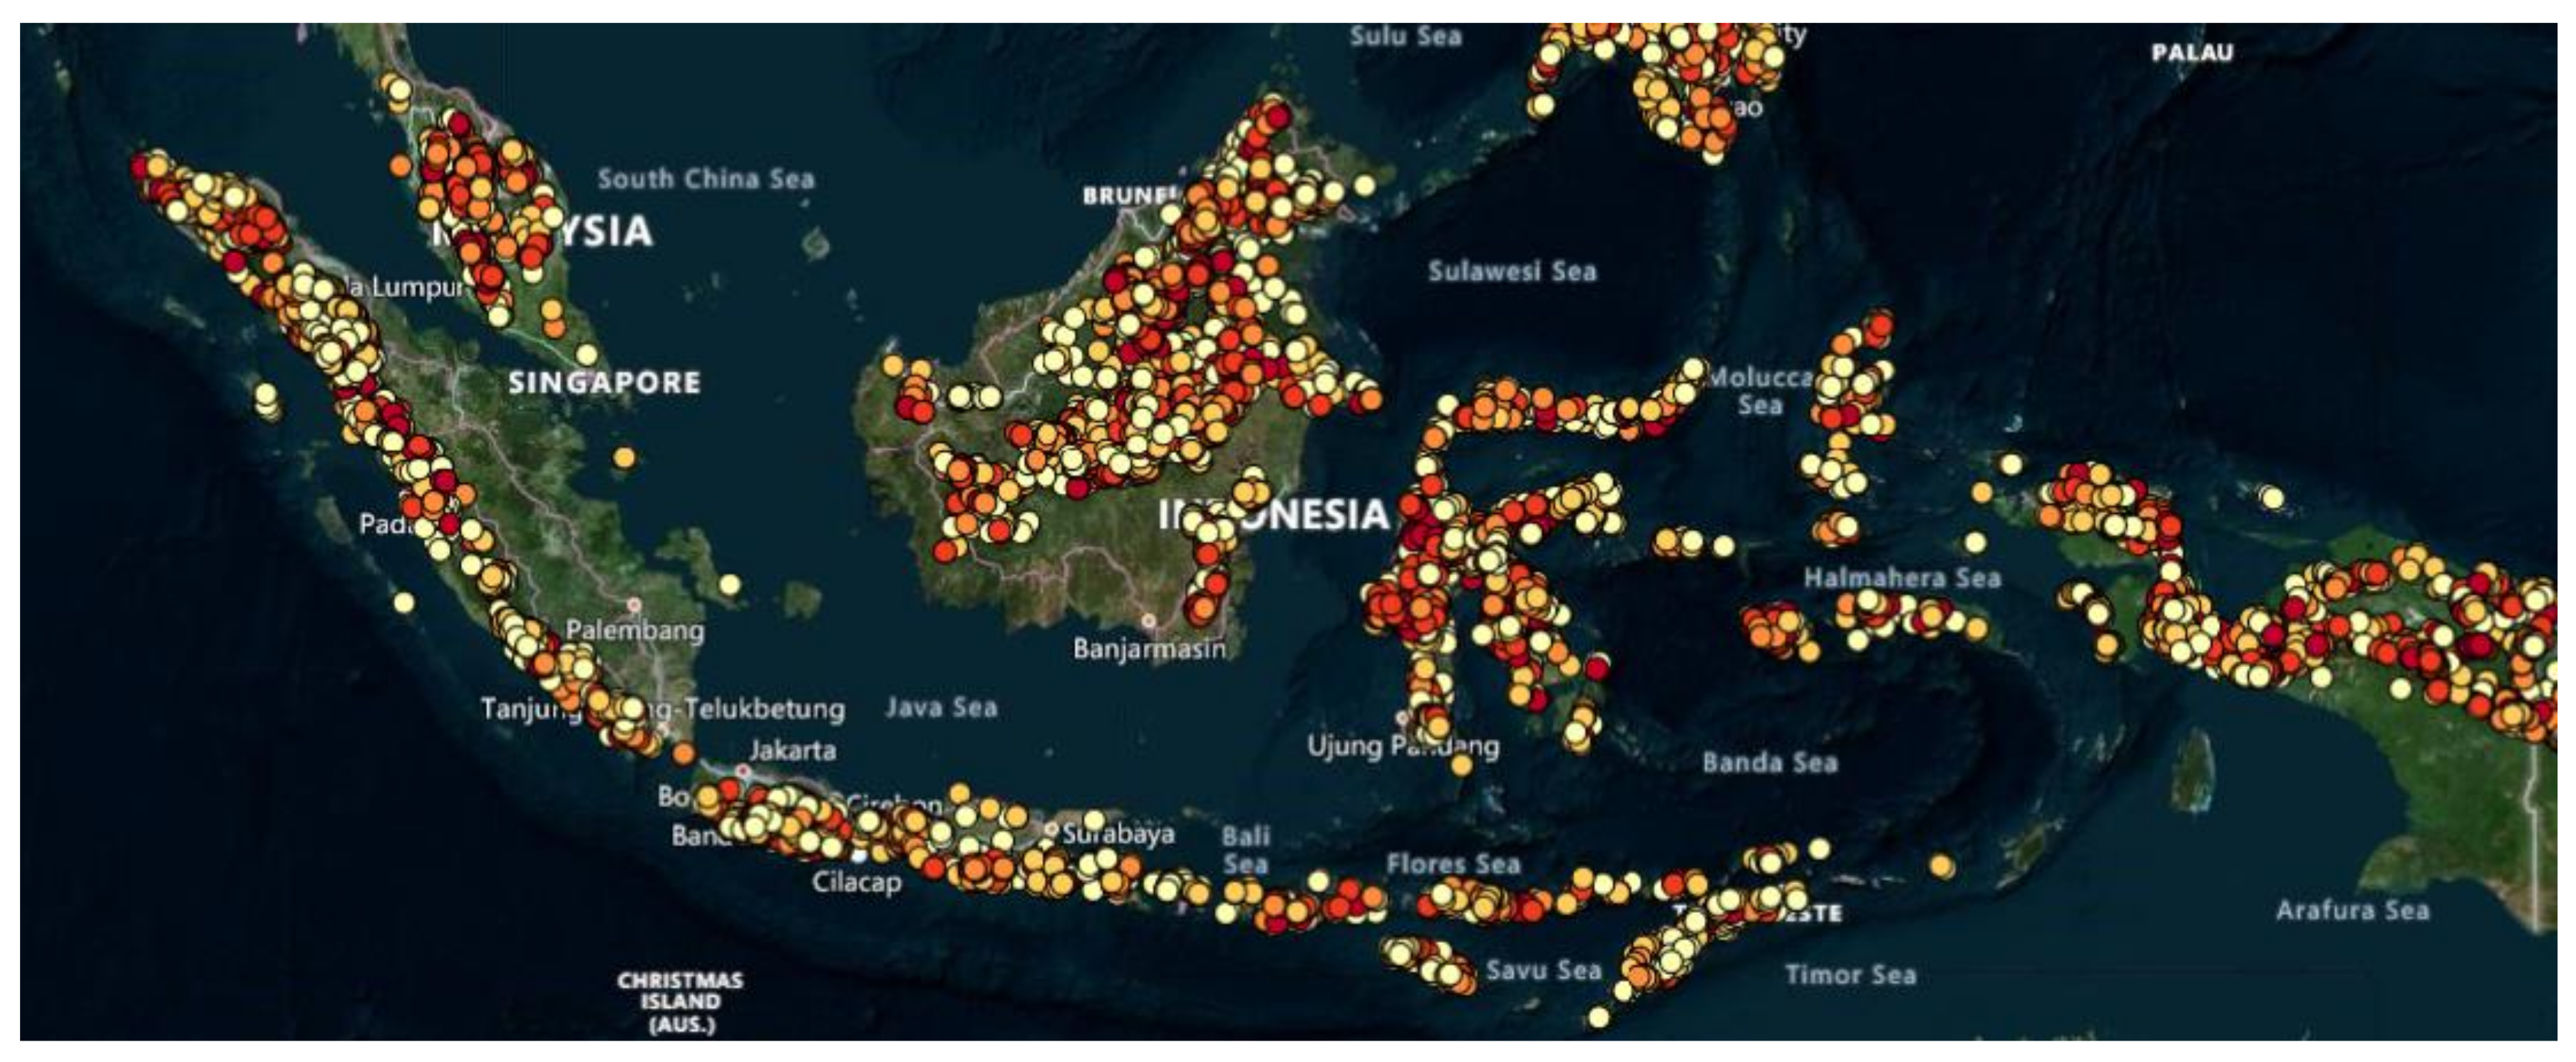
About 26,000 sites were identified in Indonesia (Figure 7) with an enormous combined storage potential of 800 TWh.
For context, a detailed analysis of the Australian electricity system suggests that storage of about one day of electricity consumption is sufficient to balance demand and supply [14,33] indicating about 25 TWh will be needed in Indonesia in our 2050 scenario. A detailed analysis is planned to refine this rough estimate.
Indonesia has 30 times more potential pumped hydro storage than required, and only about 3% of the available sites will be needed to cover solar variability. The area of land required to be flooded (combined upper and lower reservoirs) is small: about 2 km2 for a 1 GW system with 24 h of storage, a head of 500 metres, and an average depth of 25 m. Thus, storage of 25 TWh requires about 2000 km2. This represents 6% of the area occupied by the corresponding solar panels (35,000 km2) and 0.1% of the land area of Indonesia.
5. Siting Solar Panels
Indonesia is an archipelagic country with more than 17,000 islands. Geospatial Information Agency’s data shows that Indonesia consists of a land area of 1.9 million km2 and a maritime area of 6.4 million km2 [37].
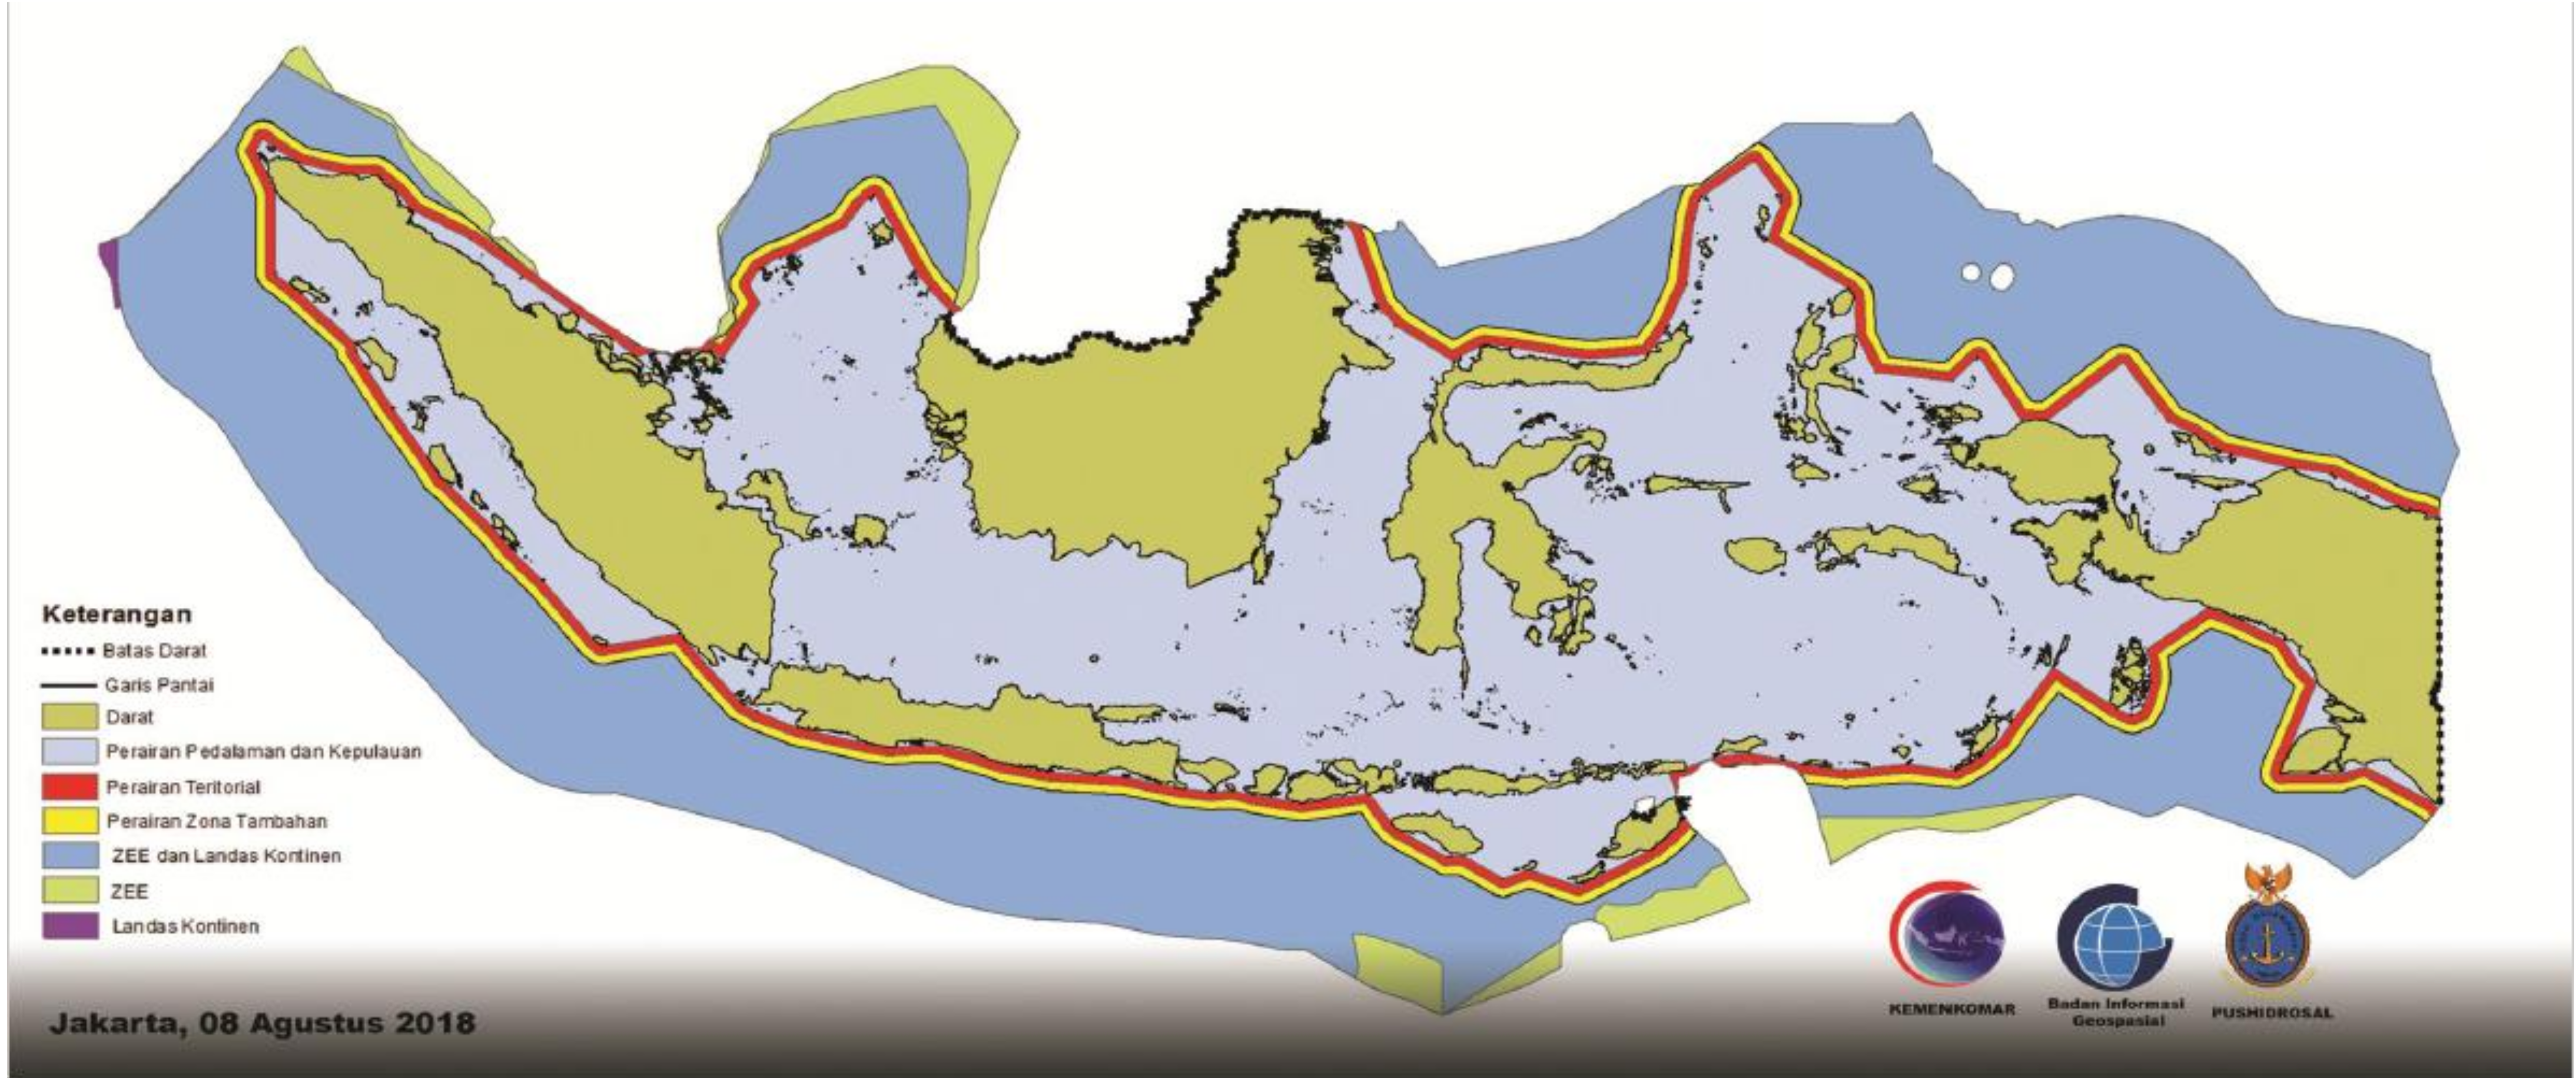
Much of Indonesia’s maritime area is protected by Sumatera, Java, Kalimantan, Sulawesi and Papua, as shown by Figure 8. About 80% of the population resides in Java and Sumatera [38], pp. 89–90. In the sections below, siting options for PV panels are systematically explored.
5.1. Ground-Mounted PV
5.1.1. Unused Land
GIS surveying of Indonesia’s land categorisation [39] shows Indonesia has 232 thousand km2 of unused land (barren, bush/shrub, swamp/marsh, littoral) excluding protected areas (Table 3). This is 6.6 times more land than the 35,000 km2 required based on earlier calculations.
However, a large fraction of this land may conflict with environmental values. A detailed site-by-site analysis would be required, which is beyond the scope of this study. This land is not further considered.
5.1.2. Mined Regions
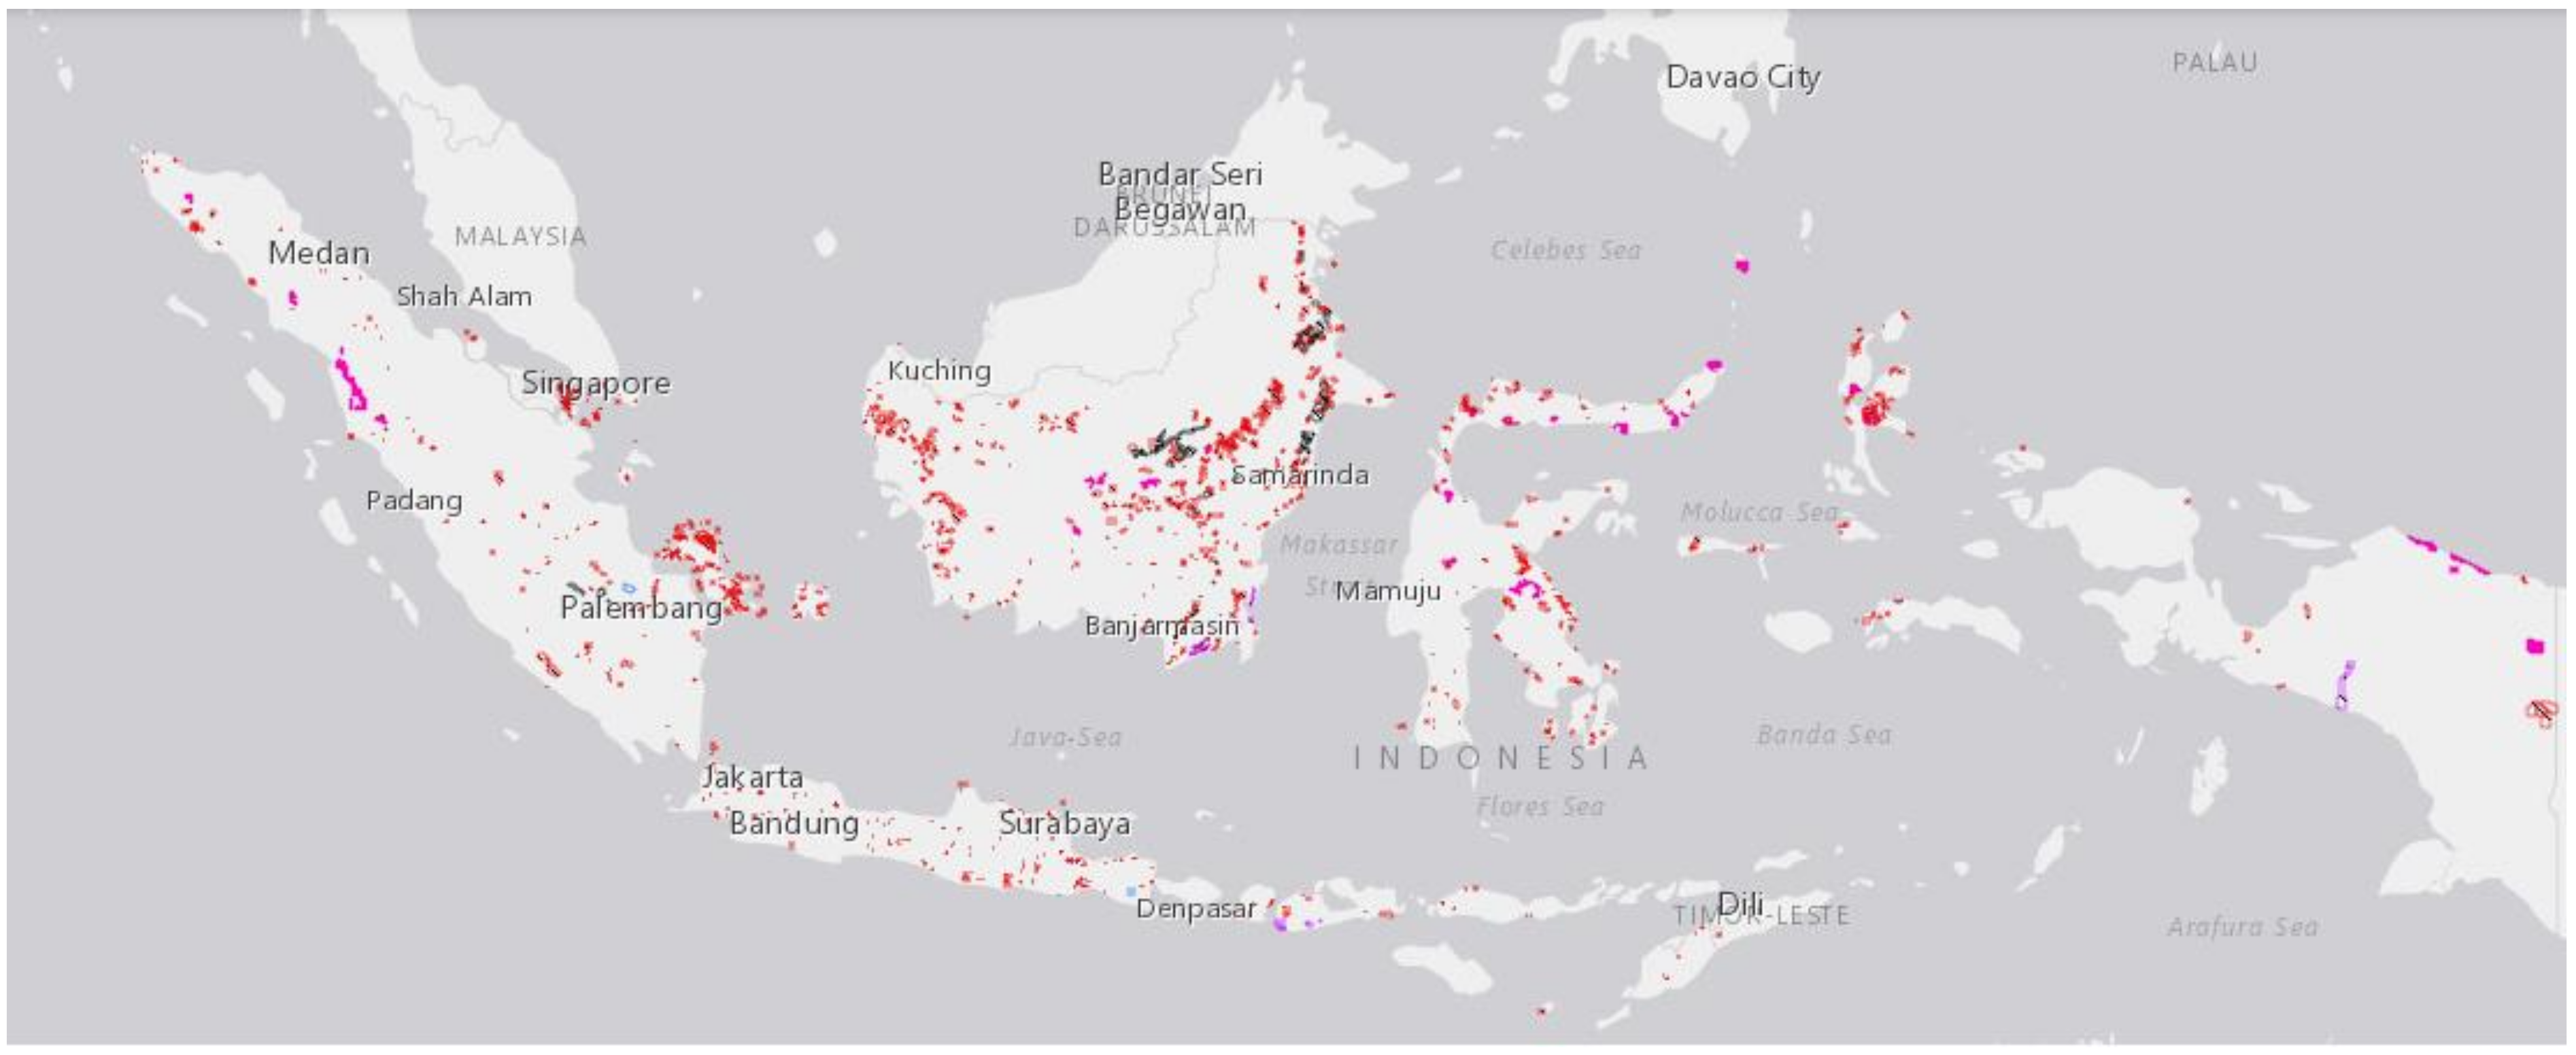
Solar energy projects located at abandoned mining sites offer the potential for low environmental impact. For example, a 50 MW solar PV power is located on tailings from an abandoned gold mine at Kidston in Australia [40] which also hosts a 0.25 GW pumped hydro project under construction. Anhui Province in China has the world’s largest floating solar PV installations to date, ranging from 20 MW to 150 MW per site on former mining sites [41]. Indonesia has about 106,000 km2 of land [42] licensed for mining activities (Figure 9).
As mining ceases, land could be progressively converted to solar farms. Some of this land may be flooded and could be occupied by floating PV. This mining area is 3 times larger than required to supply 100% of electricity demand (35,000 km2). However, much of this area may not be available to host PV panels.
According to Open Street Map [43], Indonesia has a quarry area of 734 km2. In a recently produced global data set of mining [44], Maus et al. estimated a total of 3681 km2 of active mine area in Indonesia. Combining both, and eliminating overlaps, we find a total disturbed area of 3900 km2. Table 4 shows the summary of licensed area and active mining area for each region in Indonesia.
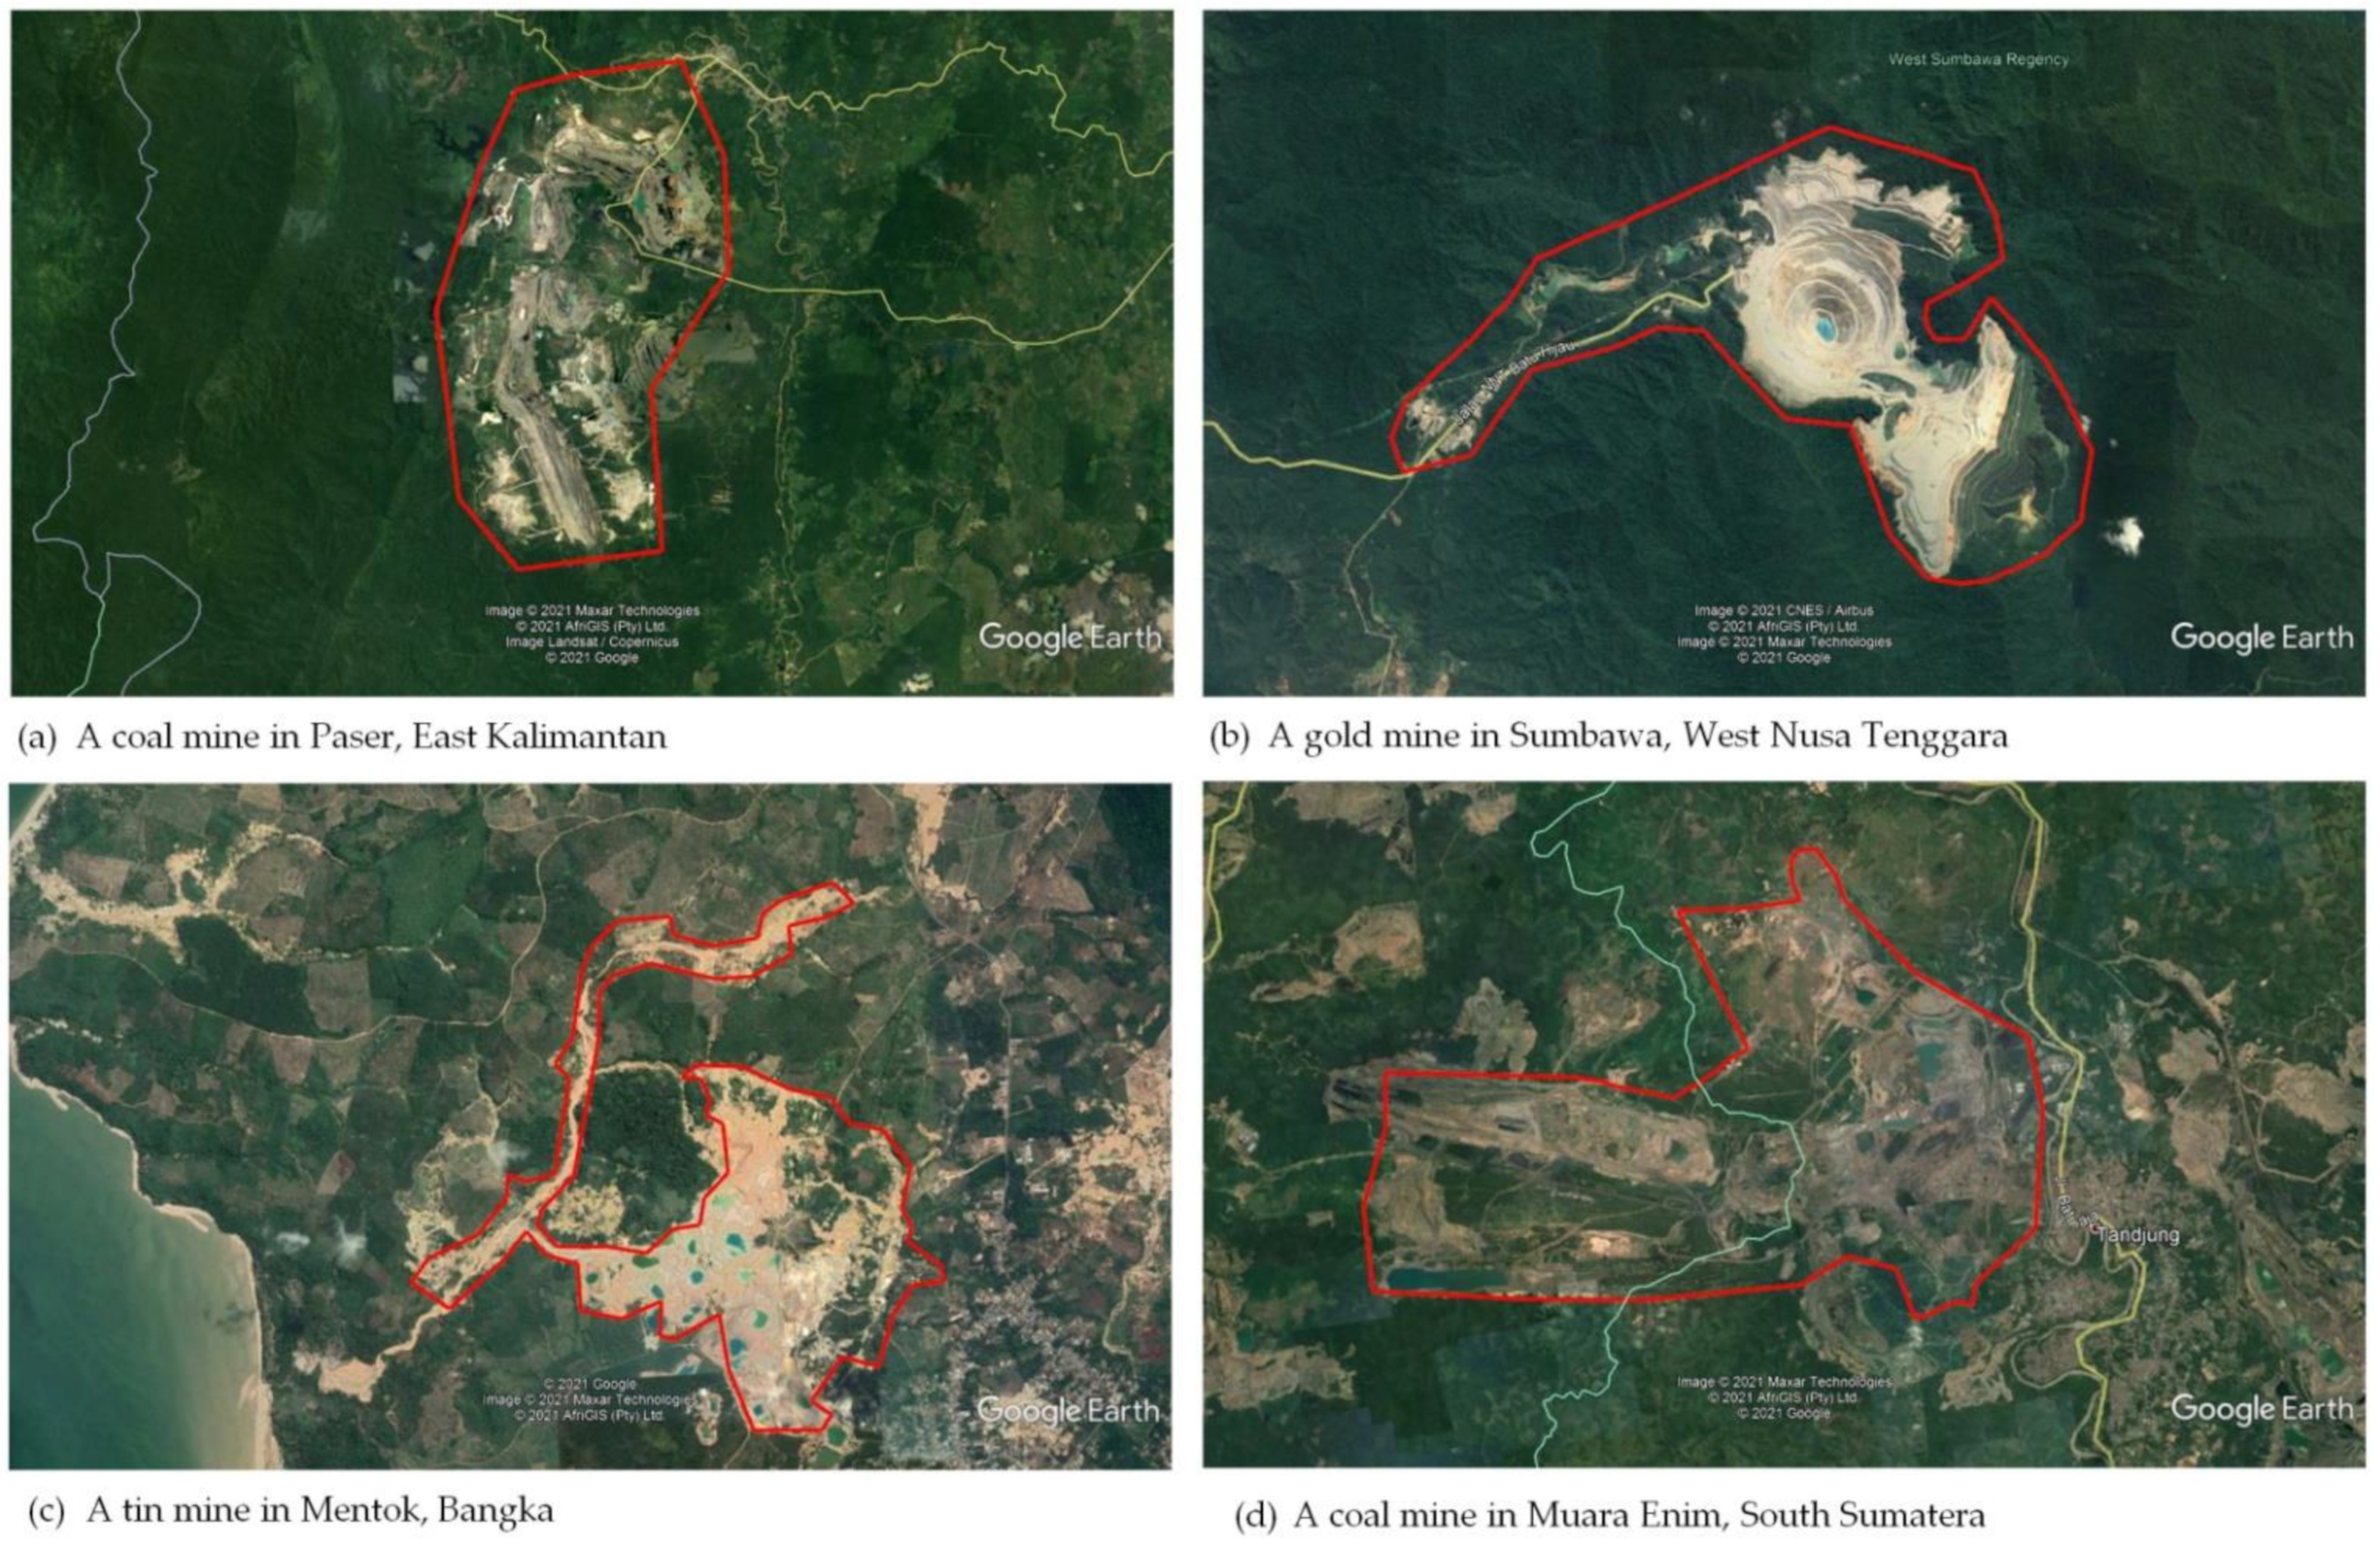
We surveyed Indonesia’s mining leases to estimate the area of disturbed land that could be available. Example aerial views of mining sites are depicted in Figure 10. To minimise conflict with environmental values, vegetated areas in mining leases were excluded. Each lease was classified as vegetation (forested or reforested), disturbed land (road, building, degraded land), and water surface (mining pit or tailings dams).
Based on Landsat-8 images ranging from 2018–2020 [46], representative sites were examined using QGIS (a free and open-source Geographic Information System). For example, the land coverage of a mining area in Paser, East Kalimantan (Figure 11) comprises 55% of vegetation cover, 4% water, and 41% bare soil.
All large mining sites in Indonesia and representative selection (sampling) of smaller mining sites were analysed. Sixty-seven sites with an area above 10 km2 were examined (amounting to 70% of the total area), while 499 out of 1250 sites were assessed to represent all sites below 10 km2. On average, vegetation cover is about 40%, water surface is 10%, and disturbed land is about 50% as summarised in Table 5.
5.1.3. Agricultural Photovoltaics
Agrophotovoltaics (APV) entails the co-location of PV systems with pasture or crops [47]. Typically, a solar farm operator will lease land from a farmer, in a similar fashion to wind farm operators. This dual use of land allows a second income stream for farmers and confers the benefits of income diversification. Japan, South Korea, France, Australia, Netherland, India, and China, have developed APV systems up to grid-scale [48].
Allowing animals to graze between PV panels has been widely adopted. This practice has the dual benefit of providing animal fodder and suppressing grass growth between the panels. Cropping around panels has also become common. Some crops show increased yield because of reduced wind speeds, temperature, and evaporation losses, while others show decreased crop yields because of reduced sunlight as discussed more below.
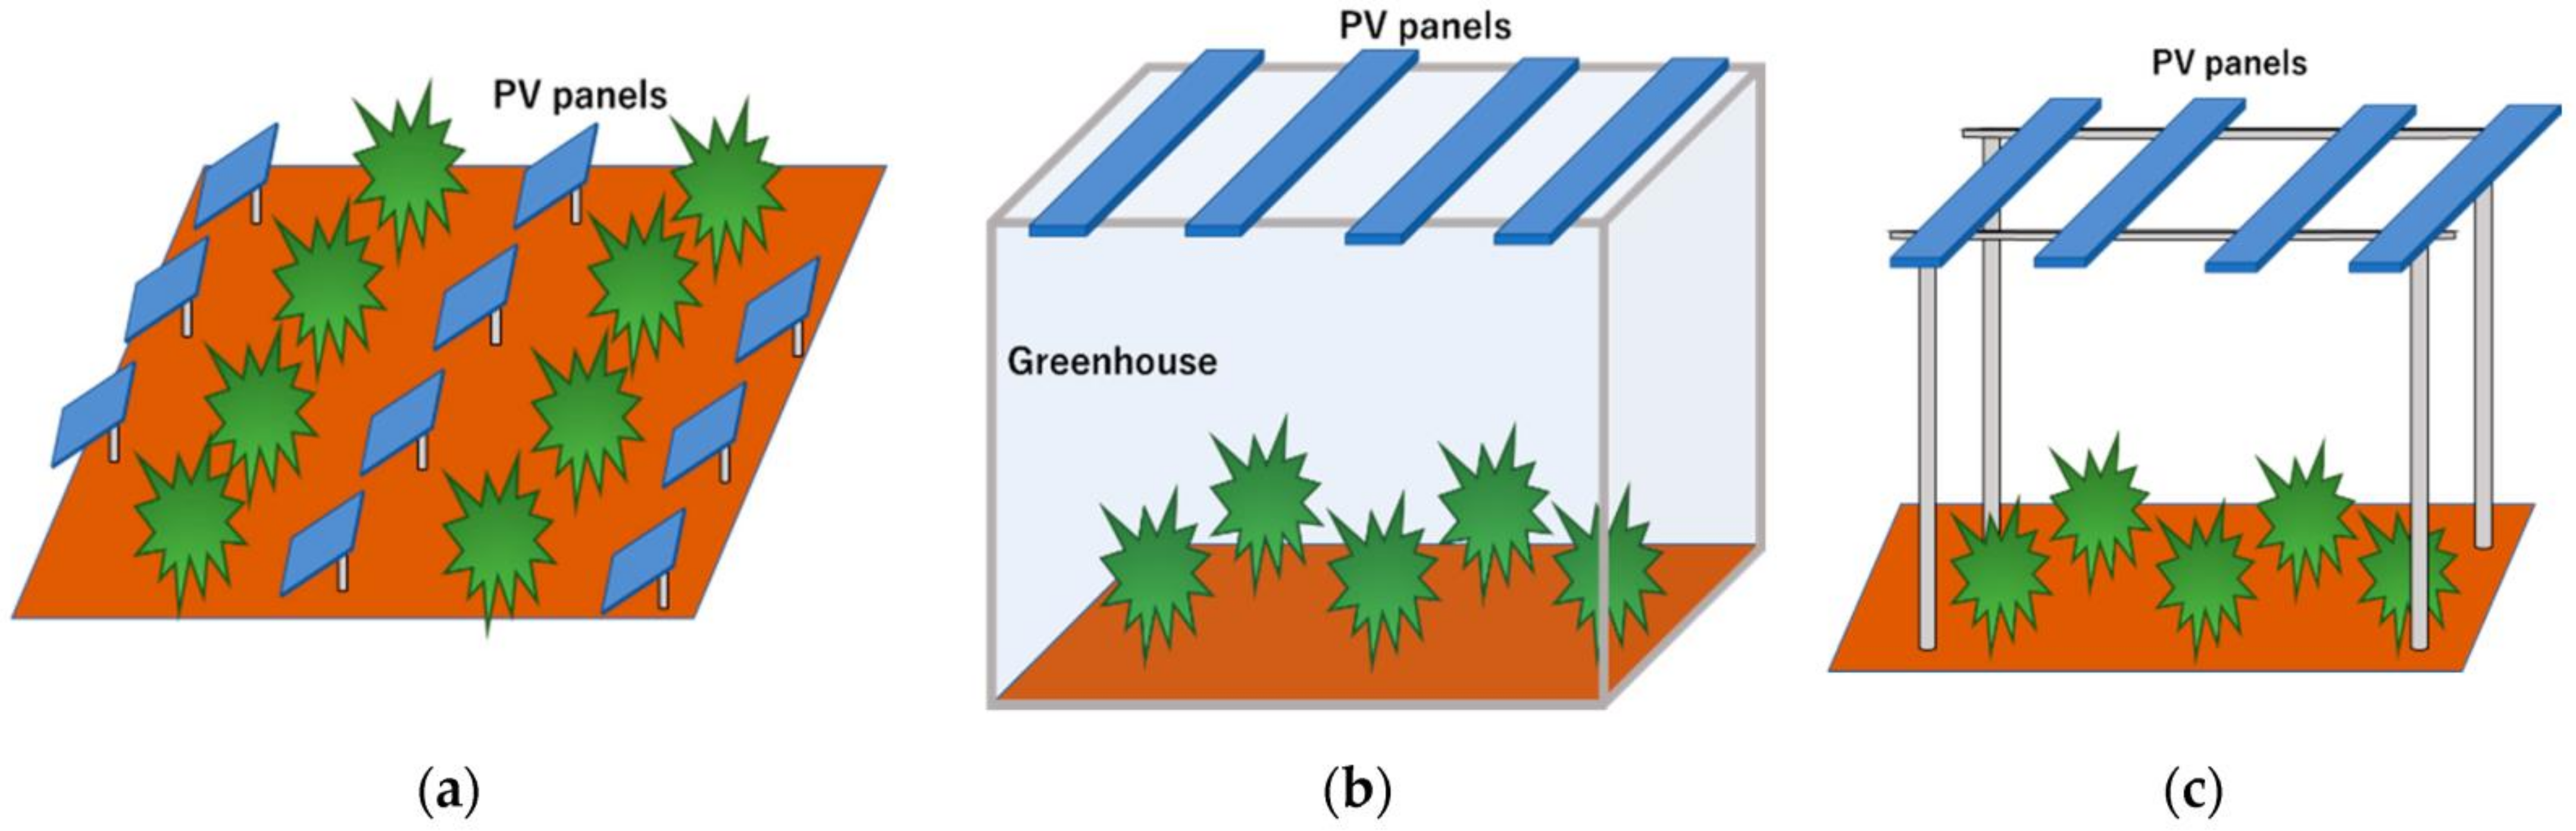
Three principal designs for APV cropping systems are illustrated in Figure 12. The first design places PV between the rows of crops. The second is a PV greenhouse in which part of its transparent roof is covered by PV panels. The third is a stilt-mounted PV structure above and partially shading the crops [49]. The stilts are commonly in the height range of 3 to 5 m, to allow farming machines to move freely under the solar modules.
The expected capital cost of a stilt-mounted APV system is about two thirds higher than a corresponding conventional ground-mounted PV system, primarily because of increased land preparation costs and the cost of high mounting stilts [50]. The cost of land is reduced in an APV system which is important in a densely populated country such as Indonesia. The overall economic potential of APV compared with conventional PV depends mostly upon the response of the crop to the presence of the panels and associated shading.
Indonesia is a fertile equatorial country with an abundance of rainfall and sunshine. The major agricultural commodities are palm oil, rubber, cocoa, coffee, tea, cassava, rice, and tropical spices [51]. Of these, palm oil, rubber and cacao trees grow to 6 metres in height or more and are too tall for APV.
Indonesia is the world’s third-largest producer of rice [52]. Rice is the most important Indonesian crop that could be grown as part of an APV system. It was reported in a Japanese study that 20% shading of a rice crop causes a 20% reduction in yield [53]. Since food supply is a critical land use (more so than energy supply), a reduction in rice yield due to APV simply means that land elsewhere must be brought under cultivation, and so no net additional land is made available.
Shade tolerant crops suitable for APV systems include arugula, Asian greens, chard, collard greens, kale, mustard greens, parsley, sorrel, spinach, scallions, broccoli, kohlrabi, cabbage, hog peanut, alfalfa, yam, taro, cassava, and sweet potato [54]. Sekiyama and Nagashima reported no significant yield reduction for a typical shade-intolerant crop such as corn [49] when the shading ratio of the solar panels was about 20%. In a report by Engie [55], potato yield increased by 3% under solar panels with a 30% decrease in sunlight.
To date, there are relatively few published studies about the shading effect of plants yields under PV panels, especially for significant Indonesian crops. Coffee plants are traditionally grown under a canopy of assorted shade trees. Most coffee varieties are intolerant of direct sunlight [56,57]. Similarly, tea plants are also typically grown in a shaded environment (Ripley 1967 in [58]). Soto-Pinto et al. showed that a 50% reduction of sunshine did not affect the yield of coffee plants [59]. A Japanese experiment of placing tea under a solar panel with a 50% shading ratio reduced the yield by only 15% [60]. Peanuts are shade-intolerant: Rao and Mitra observed a 65% yield reduction due to a reduction of 50% in sunlight during the flowering to pod filling stage [61].
Masabni et al. [62] studied partial shading of chilli pepper and found that there was no difference between growing under 50% shading compared to the full sun control yield. Kittasa et al. [63] found that tomato grown under shading of 34% to 50% produced a marketable yield about 50% higher compared to under non-shading conditions. In a study by Okoli and Wilson [64], it was observed that compared to the full sunlight control, 20%, 50% and 70% shade levels reduced cassava yield by 43%, 59%, and 80% respectively which suggests it is unsuitable for APV. Islam et al. assessed that there was almost no difference between the control and 15% shaded mungbean plants [38], pp. 266–301.
We explored the availability of agricultural land for deploying APV in Indonesia. We selected crops with a maximum height of 5 m or less. Indonesia has 210,000 km2 of low-growing crops [65]. The “Others” category represents several important crops with each total planted area larger than 500 km2 including chilli, pepper, sugar cane, soybean, peanut, tobacco, mungbean, shallot, tea, sweet potato, potato, cabbage, welch onion, Chinese cabbage, tomato, yardlong bean, citrus, and shallots.
In this study, a nominal average APV coverage fraction of 10% or 30% is applied to all low-growing crops except rice, noting that there is insufficient information to calculate the appropriate figure. With this assumption, a panel area of 11–31 thousand km2 would become available (Table 6), which is 30–90% of the required land area of 35,000 km2. An average APV coverage of 30% would be sufficient to meet Indonesia’s future energy needs. This suggests that APV could play a significant role in renewable energy generation in Indonesia. Systematic exploration of APV in relation to Indonesia cropping would accelerate uptake.
Vidinopoulus et al. [25] identified 3600 km2 of Indonesian land allocated to palm oil production which is a very inefficient method of harvesting solar energy because the overall efficiency (sunlight to biomass to electricity) is far below that of a solar cell. This area of land could host 700 GW of solar PV and yield 900 TWh per year.
5.2. Floating PV
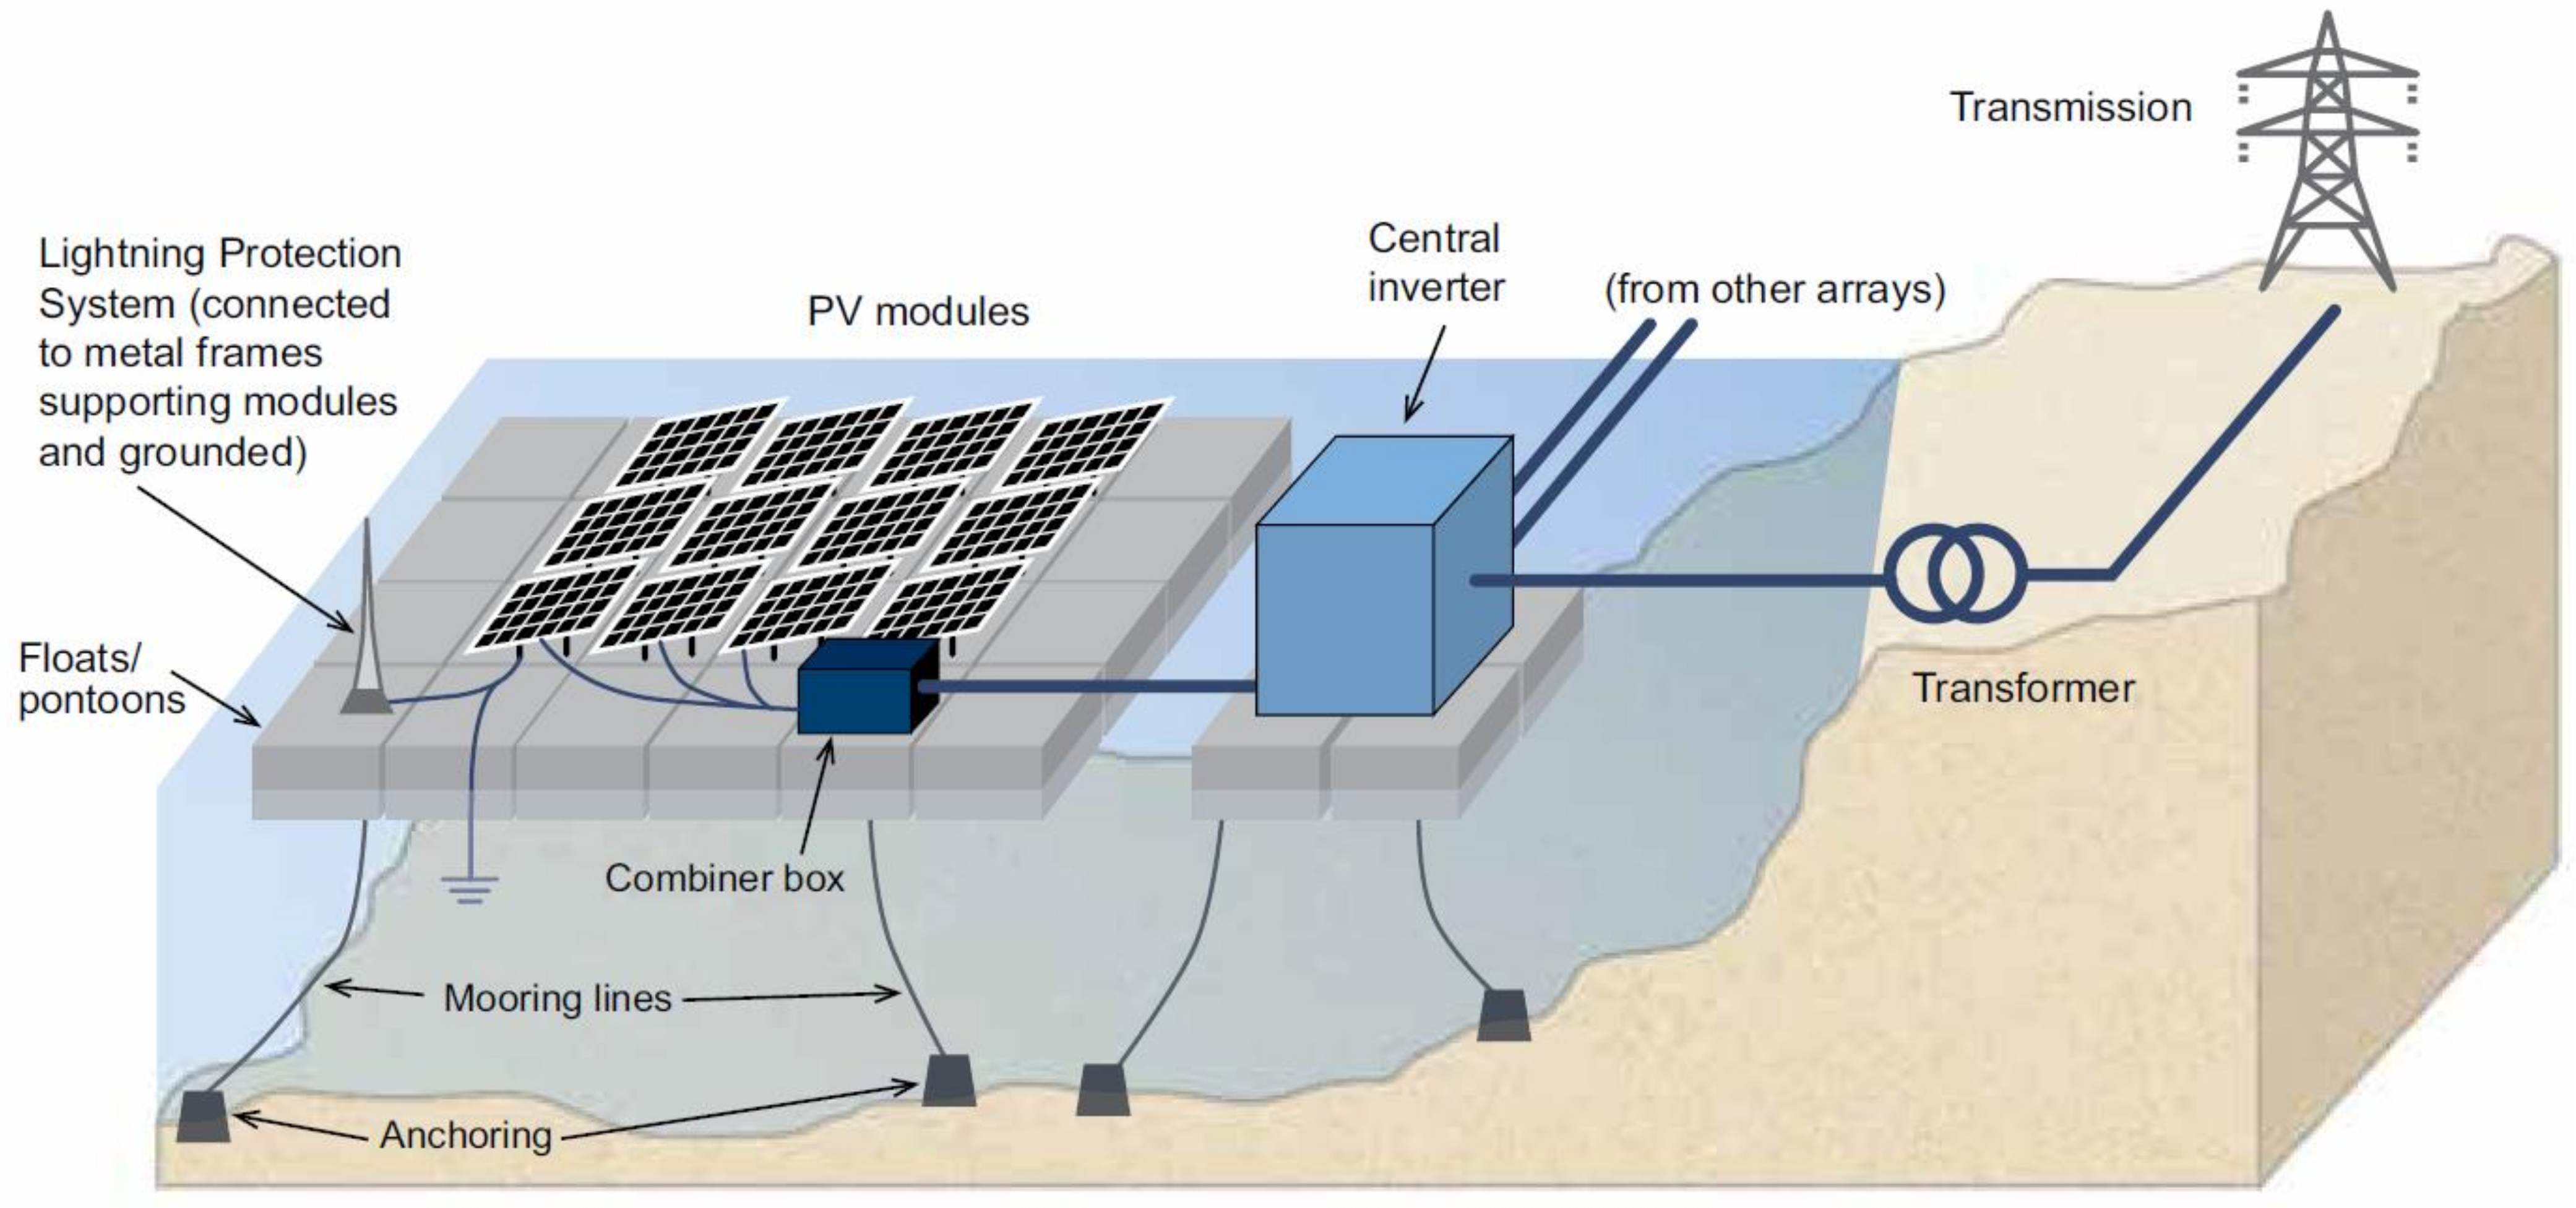
Floating PV minimises competition for land. Areas with low wind speeds and small wave heights are strongly preferred for floating PV (Figure 13) to operate safely.
Floating PV (FPV) is rapidly growing around the world. The first pilot FPV system was installed in 2007 in Aichi, Japan, and the first commercial FPV was built in California in 2008, a 175 kWp system at the Far Niente Winery [41]. The China-based firm Three Gorges New Energy is developing a 70 MW floating solar project at an ex-coal-mining area of Anhui Province, which is claimed to be the largest floating PV to date [66]. Sembcorp Singapore will install a 60 MW on the Tengeh Reservoir in Tuas after signing a 25-year power purchase agreement [67]. At the end of 2019, the global cumulative installed capacity of FPV reached about 1.9 GW [68].
5.2.1. Freshwater Floating PV
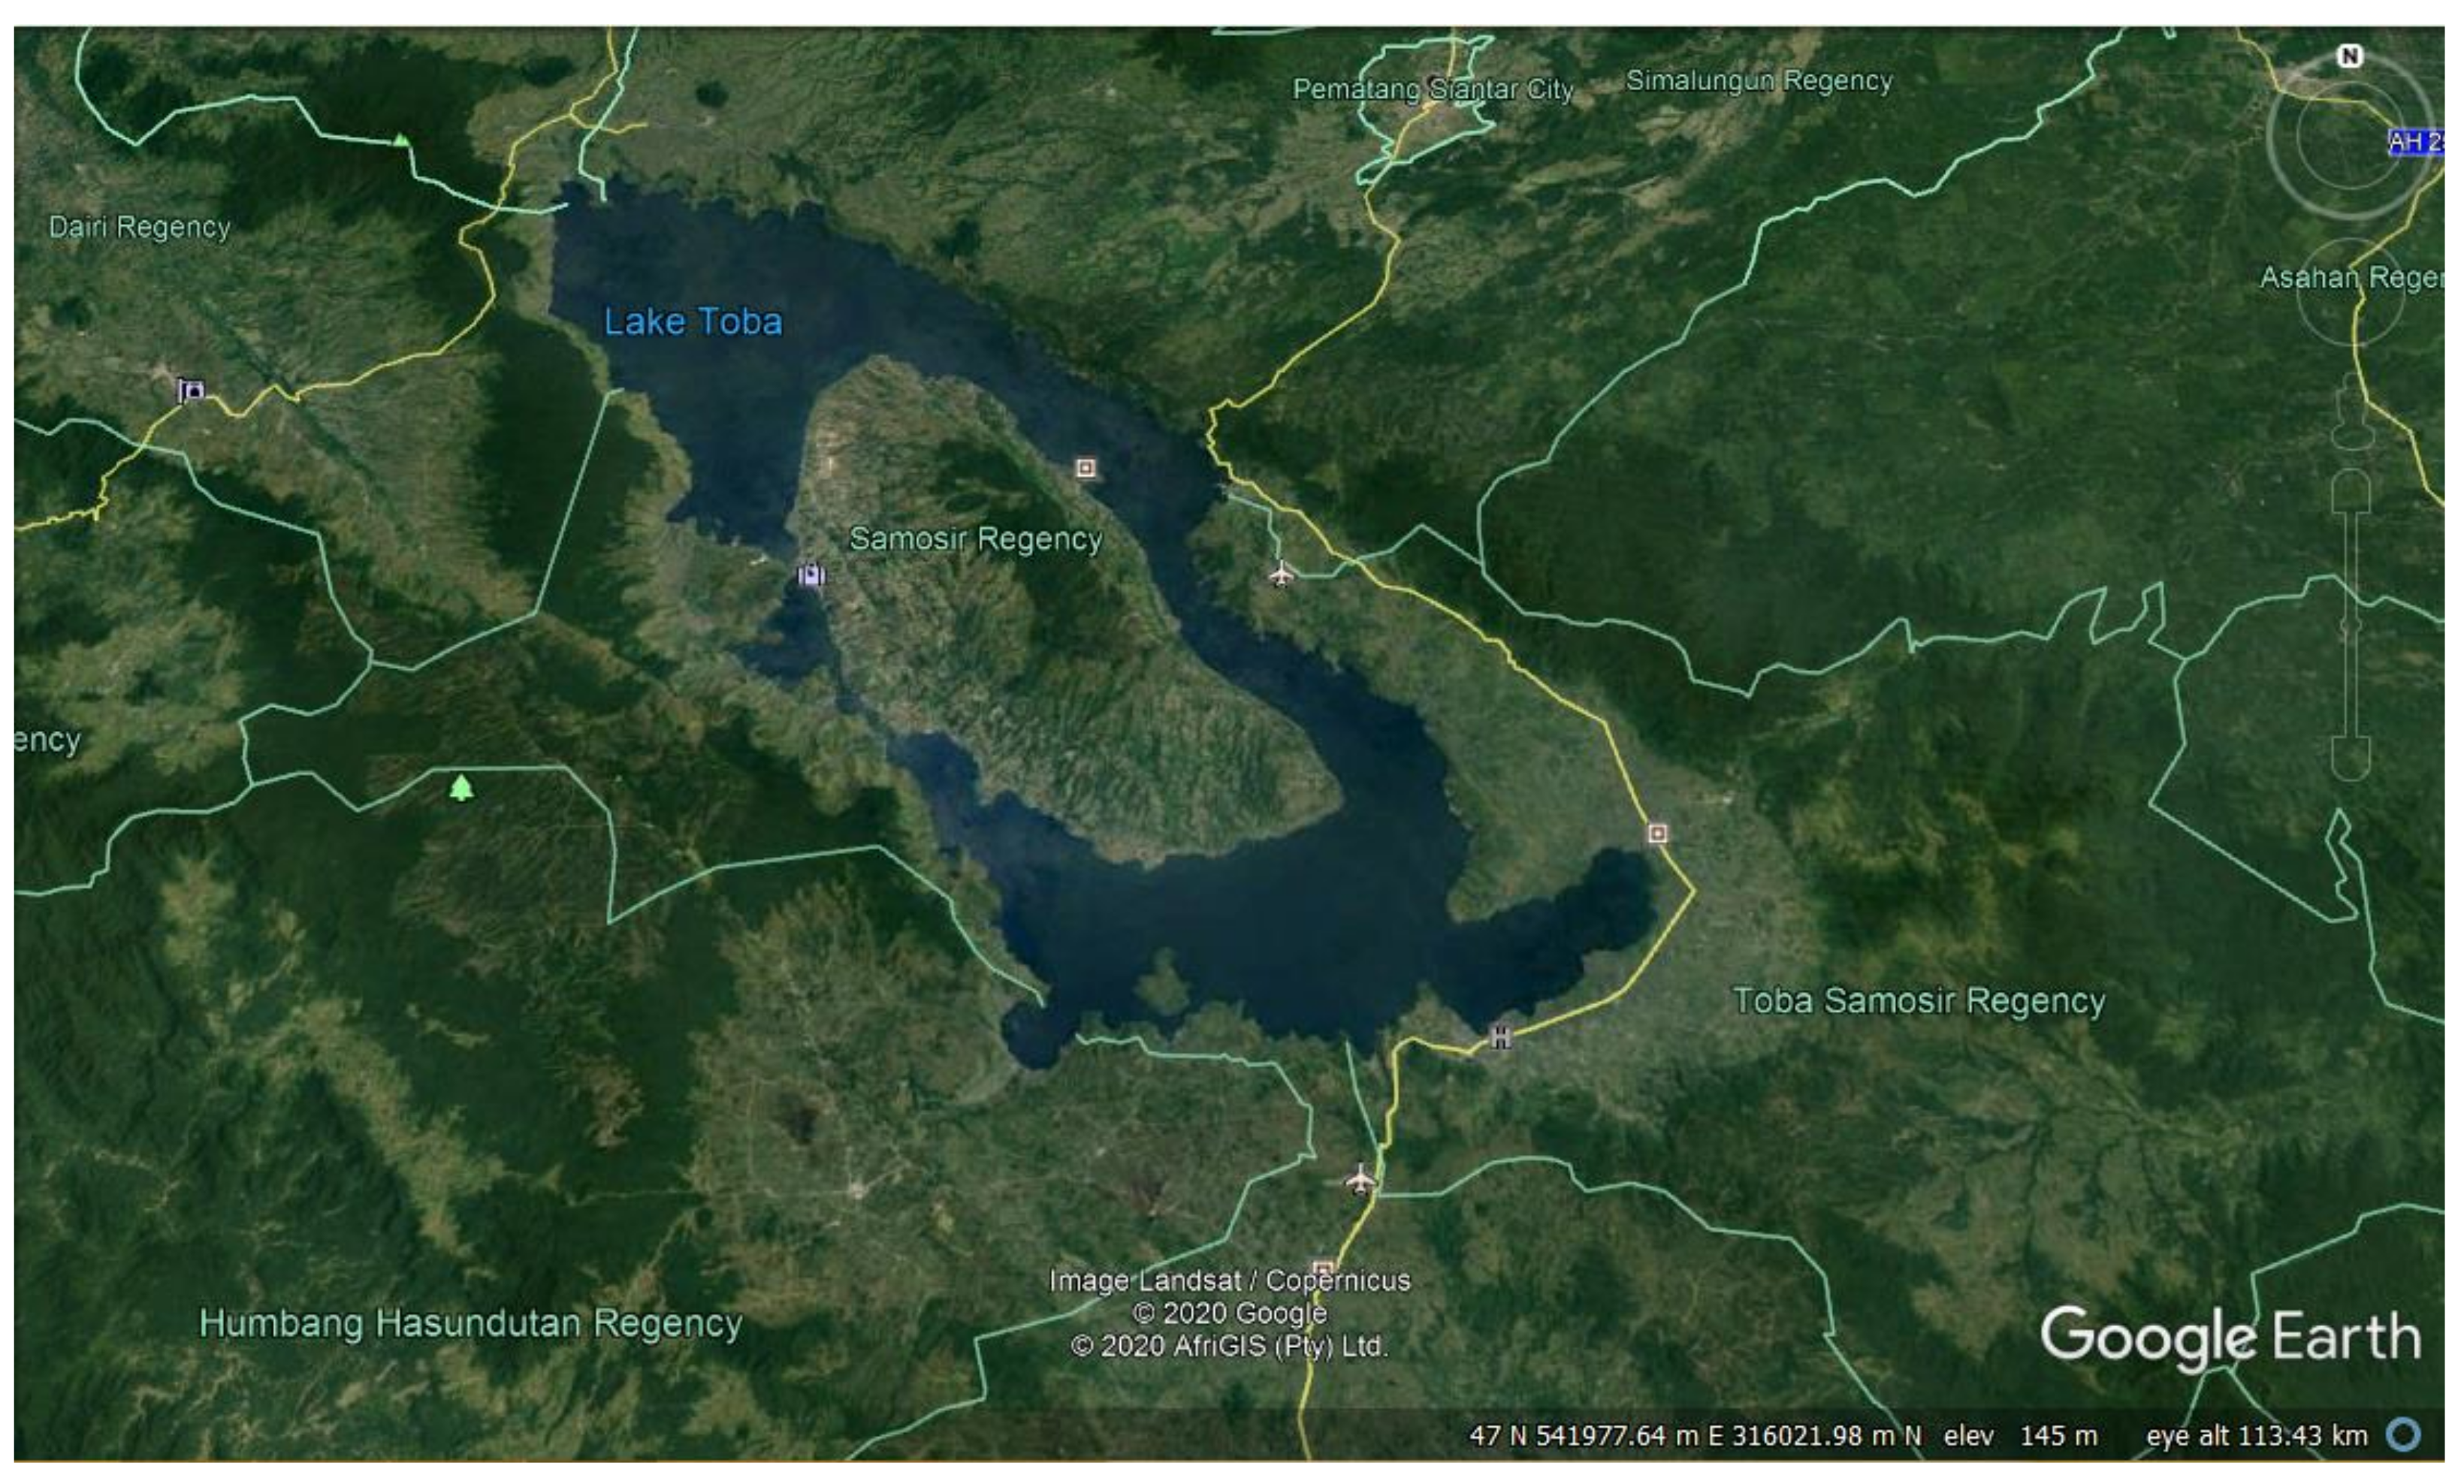
Floating PV on freshwater lakes and reservoirs has the advantage over maritime FPV of avoiding saltwater and significant waves. There are several large lakes in Indonesia including Lake Toba in North Sumatera (Figure 14), Lake Maninjau in West Sumatera, and Lake Sentani in Papua.
There are also significant hydropower reservoirs, such as Cirata reservoir and Jatiluhur reservoir in West Java. A newly signed FPV project on Cirata reservoir with a 145 MW capacity on a 225 hectares area will be the first commercial-scale floating PV in Indonesia. Indonesia is planning a further 60 floating PV installations [69].
A GIS survey [39] identified a combined area of freshwater lakes and reservoirs of about 5000 km2 excluding protected areas. Table 7 summarises the combined area of freshwater lakes and reservoirs for each region.
Lakes host tourism, sports, water transport, and fishery activities. They also have important ecological values. Under current regulations issued by Indonesia’s Ministry of Public Works, the maximum area of the reservoir surface that can be used for floating PV is 5% [70]. Under this restriction, the available freshwater lake area for PV systems is about 250 km2, sufficient for 50 GW PV capacity. This is a small fraction of future requirements (0.7%).
5.2.2. Maritime PV
Indonesia’s maritime area is 6.4 million km2 [37], which is triple its land area. Because of its equatorial location, Indonesia’s maritime area is relatively calm compared to neighbouring archipelagic countries such as the Philippines and Japan. This is particularly true for the 3.1 million km2 internal sea area lying between the largest islands.
Protecting maritime floating PV from strong winds and large waves is a matter of engineering and adds to the cost of FPV. A typhoon in Japan’s Chiba prefecture in 2019 produced an average wind speed of 41 m/s and destroyed two-thirds of the Kyocera TCL Solar’s 13.7 MW floating PV plant [71]. Maximum wave heights and wind speeds are more relevant than averages.
Sunasia Energy, a renewable energy developer in the Philippines, is constructing a floating solar PV testbed on Laguna Lake in a region that has on average 20 storms each year and aims to demonstrate how the technology combined with a screw piling method can withstand typhoons [72]. Sungrow Power built a 1.9 MW floating solar plant in southern Taiwan in 2018. It was hit by super typhoon Maria (30 m/s wind speeds) that caused some damage but survived relatively unscathed [73]. Winaico, Taiwan’s largest PV module brand, has created a typhoon-resistant product that can protect the solar installations in typhoon-prone markets such as Taiwan and Japan. It is tested in conditions similar to a Category 4 typhoon [74]. Ocean Sun, a Norway based solar energy company, has developed floating solar technology based on biomimicry which is capable of withstanding a Category 4 typhoon, 76 m/s windspeeds [75].
There is relatively little public information as yet on the trade-off between FPV cost and tolerance of large waves and strong winds. Floating PV in Indonesia will be at the low end of cost because of its benign wind and wave environment. Indonesia is the only large equatorial archipelago and has by far the world’s largest potential for low-cost maritime FPV.
Maximum rather than average wind speed is relevant for designing FPV. We analysed a 40-year period (1980–2019) of ERA5 data, the fifth generation European Centre for Medium-Range Weather Forecasts (ECMWF) atmospheric reanalysis of the global climate covering the period from January 1950 to present [76], to survey Indonesia’s maritime area for suitability of FPV. We excluded protected marine/coastal areas. The wind speed data is on a 31 km × 31 km grid. Table 8 presents data on the maritime area that experienced a maximum wind speed below a given level in the range of 10 m/s up to 35 m/s. It is evident that Indonesia has a vast maritime area where wind speeds are rarely, if ever, larger than 15 m/s. Since the force exerted by wind scales with the square of wind speed, the destructive wind forces in Indonesia are generally small, and the Indonesian maritime wind environment is benign for FPV.
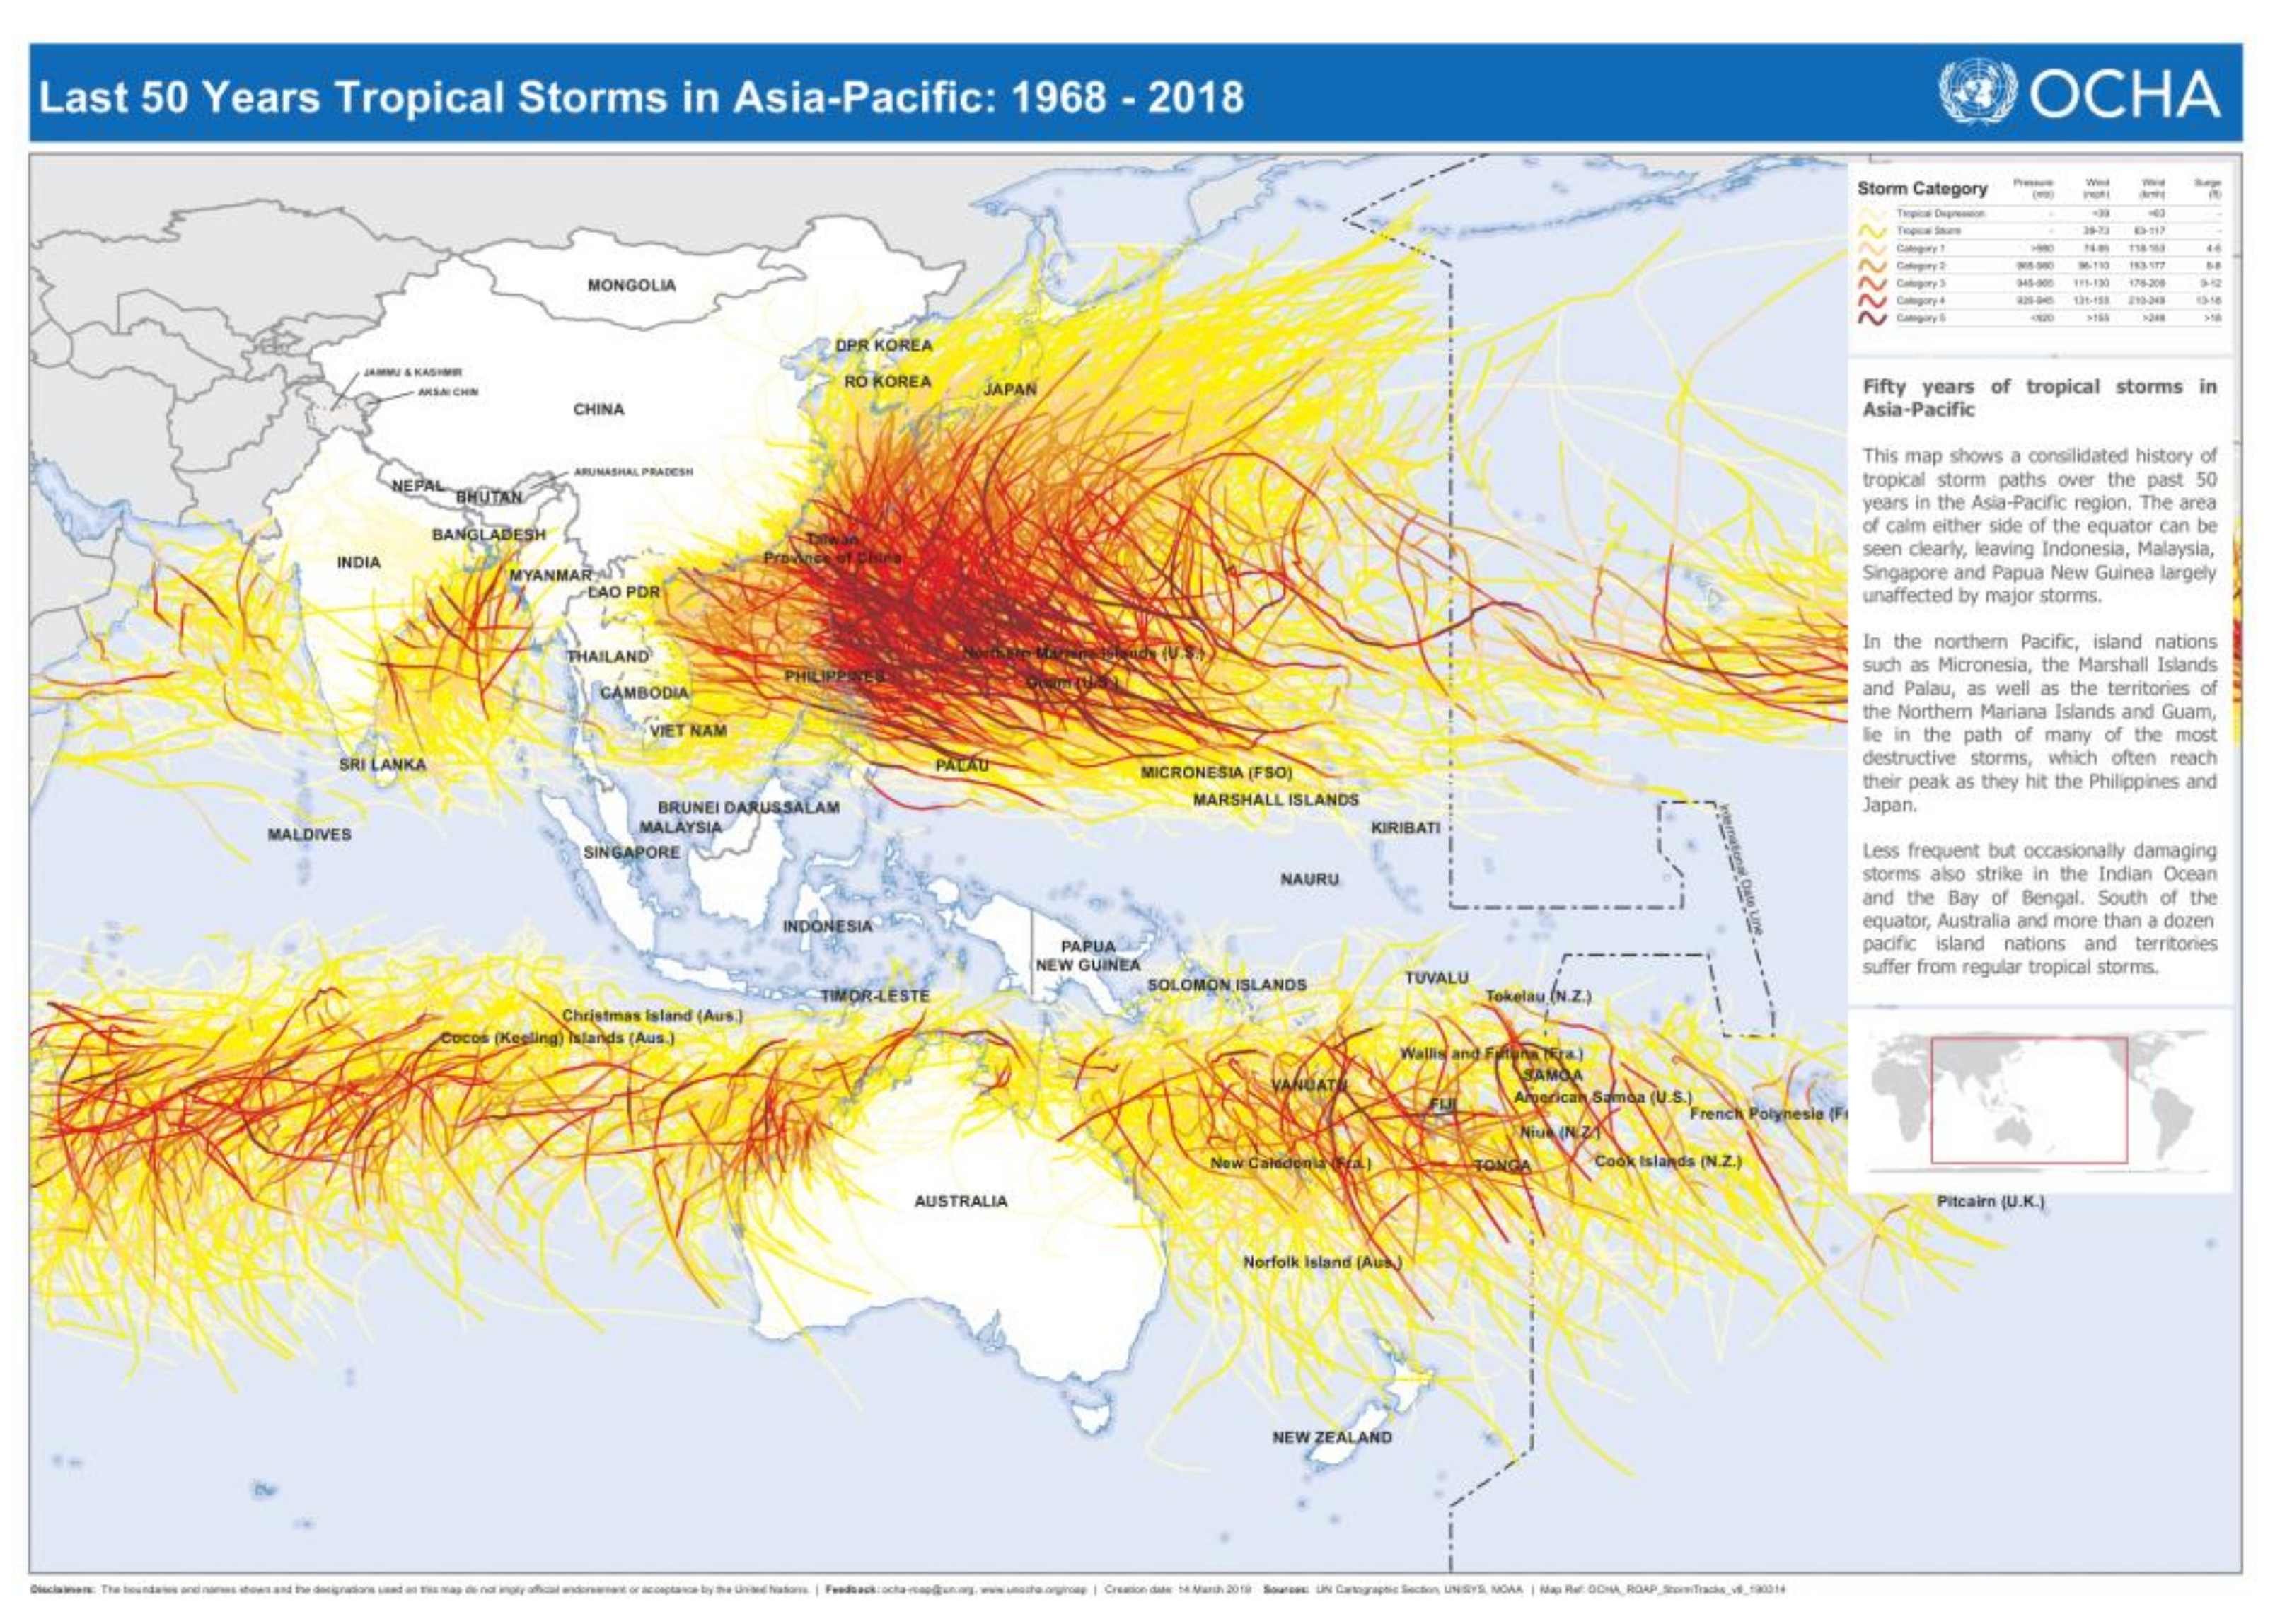
The absence of tropical storms for the last 50 years [77] increases the confidence that installing solar PV panels in Indonesia is safe. Figure 15 shows the tracks of tropical storms near Indonesia over 1968–2018. None have significantly impacted Indonesia, Malaysia, Singapore, or Papua New Guinea.
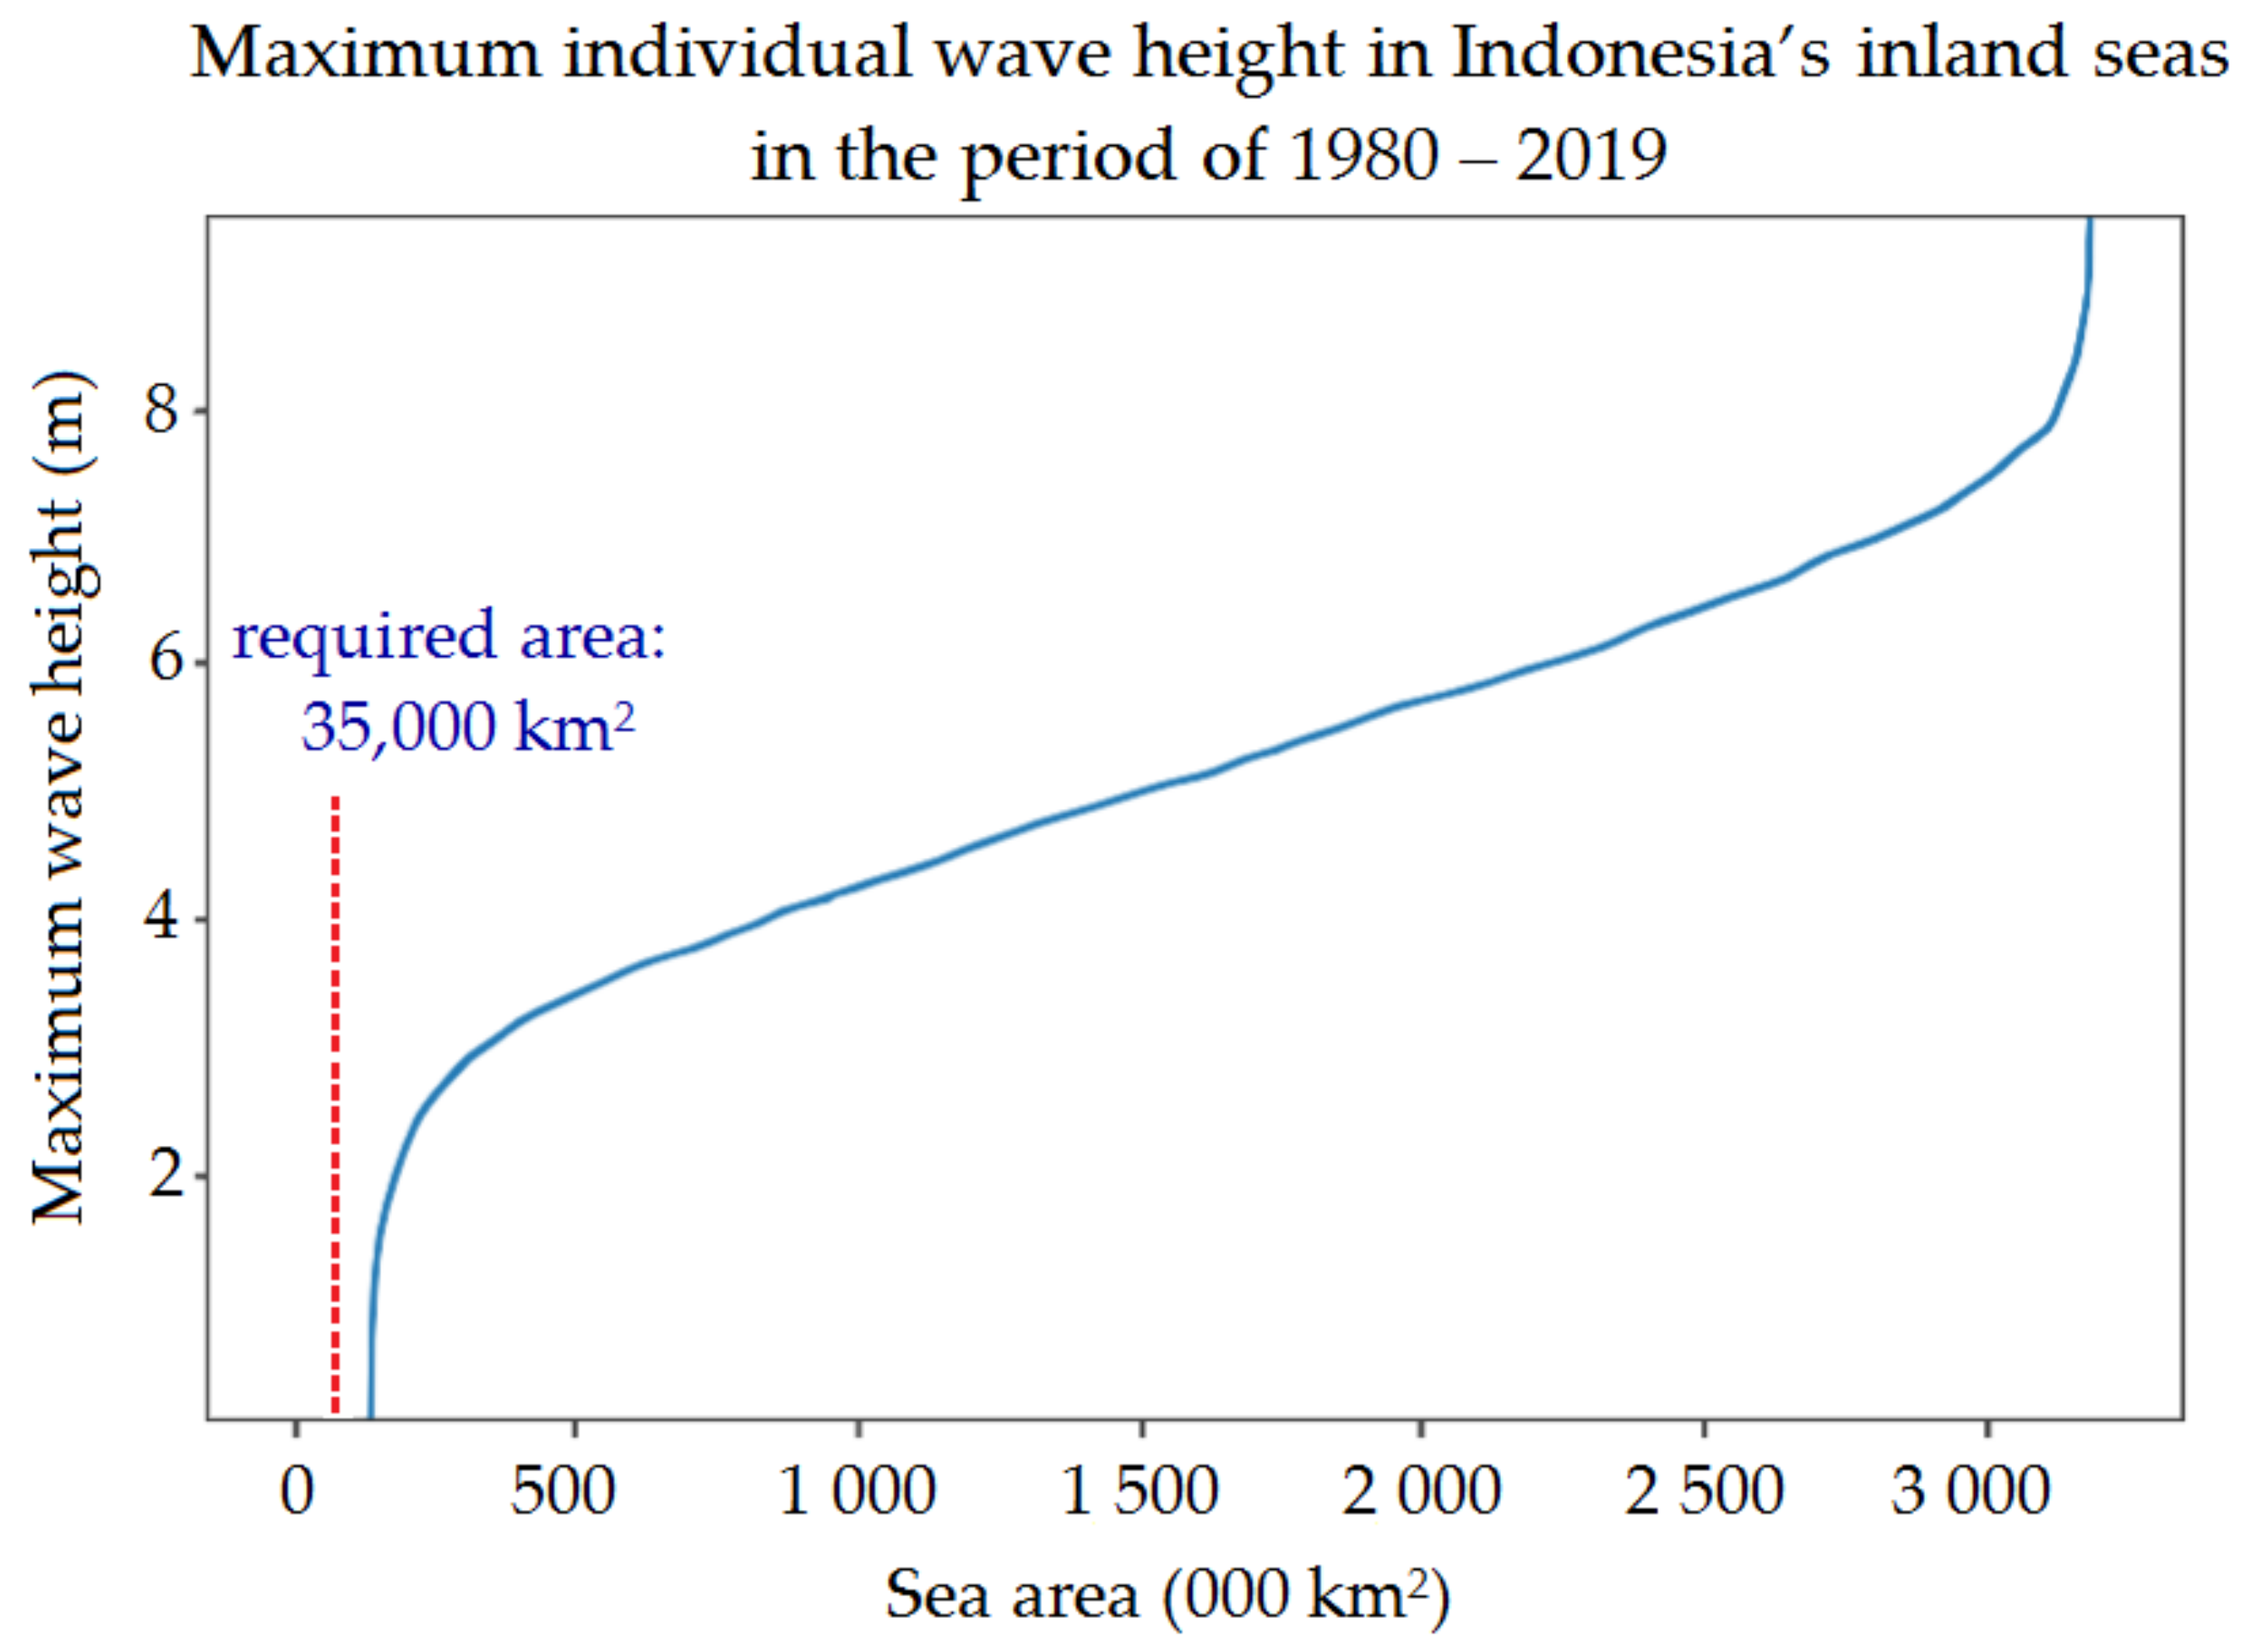
Maximum rather than average wave height is relevant for designing floating PV. We analysed a 40-year period (1980–2019) of ERA5 data [78] from the ECMWF to find maximum wave heights. A total of 2438 pixels were analysed spanning Indonesia’s maritime area with each pixel representing 0.5 degrees by 0.5 degrees (3080 km2). The cumulative area with increasing maximum wave height is shown in Figure 16. The data shows that most of the internal sea area of Indonesia had a relatively low wave height.
Table 9 tabulates the maritime area as a function of the maximum wave height experienced over 1980–2019. An area of 0.18 million km2 never experienced a 2-meter wave and an area of 0.85 million km2 never experienced a 4-meter wave. This demonstrates that Indonesia has vast potential for maritime floating PV.
A design of a floating PV system might require a certain maximum windspeed and maximum wave height for its safety. We assigned a maximum windspeed and wave height by the closest wind speed and wave height grid point, respectively, for each location in Indonesia’s seas. We found a maritime area with a combination of both maximum wind speed and wave height which is represented in Table 10 below.
5.3. Urban Solar PV Potential
Large amounts of solar can be accommodated on residential, commercial and industrial rooftops, building facades, and other urban areas. This is an important early market in many countries because private cash is mobilised with relatively few regulatory barriers. Additionally, the resulting electricity competes with retail rather than wholesale tariffs. For example, Australia has so far installed 3 million rooftop solar systems with a combined capacity of about 14 GW (500 Watts per person) [79]. Most of this is located on residential buildings, although rooftop solar is also starting to be deployed on commercial and industrial buildings quickly.
Most Australians live in single-storey dwellings with much more rooftop space per person than in Asian cities. Current Australian rooftop deployment is equivalent to 140 GW in Indonesia in 2020 (after accounting for its larger population). The amount of rooftop solar in Australia may increase to 75 GW in 2050 in the National Electricity Market (covering 20 million people), according to the Step Change scenario of the Australian Energy Market Operator [80]. This is equivalent to 3750 Watts per person and translates to 1250 GW in Indonesia, assuming a population of 335 million in 2050.
The residential rooftop solar PV potential in Indonesia has been studied by the Institute for Essential Services Reform in Indonesia, covering about 66 million residential buildings. The amount of floor space was converted to the size of roof space assuming that Indonesia’s households have pitched roofs of 18° and or flat roofs of 5°. Assuming an average of 33% suitable roof space for PV resulting, the study estimated a technical potential of residential rooftop solar PV capacity in the range of 194 GW to 655 GW distributed across 34 provinces [20].
The estimation of Indonesia’s maximum energy requirements in this paper assumes growth in electricity demand by a factor of 30. This implies an enormous increase in per capita economic activity and wealth, to levels found in Indonesia’s neighbours Singapore and Australia. The pattern of residential, commercial, and industrial rooftops found today in Indonesia would likely be greatly altered under this scenario. Urbanisation is likely to increase. Dwelling space per person may rise, taller buildings (with less roof space per person) may become common, and the commercial and industrial sectors will become much more extensive.
A good analogue of urban areas of a future developed and industrialised Indonesia is present-day Singapore. A comprehensive Solar PV Roadmap for Singapore was recently published [81] that estimates the technical PV potential of Singapore as 8.6 GW (1500 Watts per person). Indonesia and Singapore have population densities of 150 and 8000 people per km2, respectively. Thus, Indonesian urban areas may have a lower density than Singapore with more opportunities for urban solar.
Vidinopoulus et al. [25] reported that Indonesia’s urban solar potential is about 1000 TWh of electricity production per year (equivalent to about 3000 Watts per person).
In this study, we adopt a range of 1500–3750 Watts per person of urban PV in Indonesia. This will generate 2–5 MWh per person per year, assuming a capacity factor of 15%. This amounts to 7–19% of the upper bound energy requirement for Indonesia in 2050.
6. Discussion
In this study, we estimate that the upper bound area of PV systems required to meet all of Indonesia’s energy requirements in 2050 is 35,000 km2 (100 m2 per person), with a nameplate power capacity of 7 TW and generating 9000 TWh per year. This is 30 times larger than current electricity consumption. This upper bound estimate includes continued population growth; per capita energy consumption rising to match consumption in neighbouring Singapore and Australia; complete solar electrification causing complete displacement of all fossil fuel use including in transport, heating, and industry; and negligible contributions from other low-emission sources such as wind, hydro, bio, nuclear, and geothermal energy.
It is uncertain that all of these boundary conditions will be met. However, they rest on reasonable propositions: that Indonesia’s population will continue to grow; that Indonesia will catch up with neighbouring Singapore in terms of energy consumption, and that the world will decarbonize by mid-century, primarily through the deployment of solar and wind.
It is useful to explore the question as to whether Indonesia could in principle derive all of its energy from solar PV. In Table 11, we summarise the practical places to place solar panels in Indonesia. The categories of available space shown in the table can all contribute significantly.
Urban PV, primarily on rooftops, is an important early market. This market fuelled the growth of PV in the two largest per capita PV markets in the world (Australia and Germany). Although the area of rooftops is only a fraction of the required total, experience gained in servicing this market leads directly to the acquisition of deployment experience, lower deployment costs, and accelerated deployment in other markets.
Deployment of solar panels in farming regions allows the same land to be used for both agriculture and clean energy production without excessive impact on agricultural output. Since this amounts to an additional and diversified income to farmers, it could become important in Indonesia. Extensive local experience will be needed to determine the economically optimum coverage fraction for locally important crops. Financial support to encourage early APV development will facilitate long term energy and agricultural planning. Replacement of palm oil crops with solar panels would be a far more effective way to harvest solar energy.
The use of disturbed land in mining areas to host PV systems has a low environmental impact. Former mine sites often already have existing electricity distribution/transmission lines and transport infrastructure which could help developers reduce capital costs in solar PV deployment. Such regions have clear potential to host most ground-mounted solar systems in the early years of a transition to a fully renewable energy system. It might be an interesting option for mining operators to invest in solar PV farms upon completion of mining instead of restoring to its approximate original state or converting to alternative post-mining land use. This would offset some of the rehabilitation costs. However, a change in government policy could be required.
So-called unused land (barren, bush, swamp, littoral) is large in extent but is likely to have substantial environmental value. A detailed inspection would be required for each proposed solar farm to determine the ecological cost of development.
Floating solar PV is a nascent technology with enormous potential. Indonesia has extensive freshwater lakes that could host large areas of solar panels. However, there would be substantial ecological and economic costs from doing so. The current Government restriction of 5% coverage of freshwater surface still allows them to host 0.7% of the required panel area.
The opportunities for maritime floating solar PV are effectively unlimited. Indonesia is uniquely well suited to deploying maritime PV because it is by far the world’s largest equatorial archipelago. Strong winds and large waves almost never impact the Indonesian inland sea. This means that relatively little engineering protection is required for floating panels, allowing low-cost deployment. There are sufficient calm seas to produce far more electricity than required by the whole world. Recently, Sunseap Group, a Singaporean solar energy company, and Batam free zone authority signed a memorandum of understanding for a 2.2 GW floating solar farm project located on the Duriangkang Reservoir in Batam Island, Indonesia. The project will be equipped with energy storage system to enable non-intermittent supply solar energy. A portion of the energy will be exported to Singapore via 50 km submarine cable [82].
The cost of solar PV generation in Indonesia, when deployed at very large scale (tens of Gigawatts), is likely to be competitive with costs in other countries: Indonesia has consistently good insolation; economies of scale will apply, and there are large areas for which deployment costs (including land access) will be low—particularly in Indonesia’s calm inland sea.
7. Conclusions
We estimate that 35,000 km2 (100 m2 per person) of solar PV systems are required to meet an upper bound of Indonesian energy requirements in 2050, assuming continued population growth, large-scale industrialisation and large increases in per capita energy consumption. This includes the elimination of all fossil fuels through electrification of services currently provided by fossil fuels, including transport, heating and industry, leading to an electricity demand of 9000 TWh per year (30 times larger than at present).
The available Indonesian solar energy resource is vastly larger than all other energy resources combined—generation in excess of 200,000 TWh per year is practical in the sense of there being a sufficient calm maritime area. In the early stages of a transition to dependence on solar energy, rooftops and disused mining areas offer large-scale opportunities with low environmental impact. Together, they would allow a six-fold increase in electricity generation compared with the current generation.
Solar PV in agricultural areas allows diversification of farming income. For many crops, partial shading by solar panels has little impact on yield. Agricultural PV has the potential to supply a large fraction of Indonesia’s future energy needs.
Maritime floating PV offers Indonesia the potential to generate an effectively unlimited amount of solar energy at low cost and with low ecological impact.
This work shows that Indonesia is able to generate vastly more solar energy than needed to meet current and future needs. It provides a basis for future work looking in detail at feasible transition pathways to 100% renewable energy.
Author Contributions
Conceptualization, methodology, writing—original draft preparation, formal analysis, data curation, visualization: D.F.S.; Conceptualization, methodology, supervision, writing—reviewing and editing: A.B.; Supervision, writing—reviewing and editing: M.S.; Supervision, writing—reviewing and editing: B.L.; Writing—reviewing and editing: C.C.; Data curation, visualization: L.H. All authors have read and agreed to the published version of the manuscript.
Funding
This research received no external funding.
Data Availability Statement
Not applicable.
Acknowledgments
D.F.S.’s ongoing PhD study is funded by the Indonesia Endowment Fund for Education (LPDP). We thank Solcast for kindly providing ten years of Indonesia’s solar irradiance data.
Conflicts of Interest
The authors declare that they have no known competing financial interests or personal relationships that could have appeared to influence the work reported in this paper.
References
- Worldometer. Indonesia Population 2021. Available online: https://www.worldometers.info/world-population/indonesia-population/ (accessed on 15 July 2021).
- Ministry of Energy and Mineral Resources Republic of Indonesia. National Energy General Plan. (Rencana Umum Energi Nasional: RUEN); Ministry of Energy and Mineral Resources: Jakarta, Indonesia, 2017. [Google Scholar]
- EMA: Singapore Energy Statistics. Energy Consumption. Available online: https://www.ema.gov.sg/singapore-energy-statistics/Ch03/index3 (accessed on 15 July 2021).
- Worldometer. Singapore Population 2021. Available online: https://www.worldometers.info/world-population/singapore-population/ (accessed on 15 July 2021).
- UNFCC First Nationally Determined Contribution-Republic of Indonesia. Available online: https://www4.unfccc.int/sites/NDCStaging/Pages/Party.aspx?party=IDN (accessed on 15 July 2021).
- Ministry of Energy and Mineral Resources. Capaian Kinerja 2019 & Program 2020; Ministry of Energy and Mineral Resources: Jakarta, Indonesia, 2020. [Google Scholar]
- Ministry of Energy and Mineral Resources Republic of Indonesia. National General Electricity Plan (Rencana Umum Ketenagalistrikan Nasional 2019-2038: RUKN); Ministry of Energy and Mineral Resources: Jakarta, Indonesia, 2019. [Google Scholar]
- Renewables Global Status Report-REN21. Available online: https://www.ren21.net/reports/global-status-report/ (accessed on 15 July 2021).
- End Coal. Summary Statistics. Available online: https://endcoal.org/global-coal-plant-tracker/summary-statistics/ (accessed on 15 July 2021).
- World Nuclear Power Reactors. Uranium Requirements. Future Nuclear Power-World Nuclear Association. Available online: https://www.world-nuclear.org/information-library/facts-and-figures/world-nuclear-power-reactors-and-uranium-requireme.aspx (accessed on 15 July 2021).
- Renewable Capacity Statistics 2018. Available online: https://0-www-sciencedirect-com.brum.beds.ac.uk/science/article/pii/S2210670717301397 (accessed on 19 May 2021).
- Dewan Energi Nasional Bauran Energi Nasional 2020. Available online: https://www.den.go.id/index.php/publikasi/index/BauranEnergi (accessed on 15 July 2021).
- Ministry of Energy and Mineral Resources. Capaian Kinerja 2020 & Program 2021; Ministry of Energy and Mineral Resources: Jakarta, Indonesia, 2021. [Google Scholar]
- Blakers, A.; Stocks, M.; Lu, B.; Cheng, C.; Stocks, R. Pathway to 100% Renewable Electricity. IEEE J. Photovolt. 2019, 9, 1828–1833. [Google Scholar] [CrossRef]
- Lu, B.; Blakers, A.; Stocks, M.; Cheng, C.; Nadolny, A. A zero-carbon, reliable and affordable energy future in Australia. Energy 2021, 220, 119678. [Google Scholar] [CrossRef]
- Veldhuis, A.J.; Reinders, A.H.M.E. Reviewing the potential and cost-effectiveness of grid-connected solar PV in Indonesia on a provincial level. Renew. Sustain. Energy Rev. 2013, 27, 315–324. [Google Scholar] [CrossRef]
- Kunaifi, K.; Veldhuis, A.; Reinders, A. The Electricity Grid in Indonesia: The Experiences of End-Users and Their Attitudes Toward Solar Photovoltaics; Springer: Berlin/Heidelberg, Germany, 2020; ISBN 978-3-030-38341-1. [Google Scholar]
- IRENA. Renewable Energy Prospects: Indonesia, A REmap Analysis; International Renewable Energy Agency (IRENA): Abu Dhabi, Unitated Arab Emirates, 2017; ISBN 1026-1141. [Google Scholar]
- Renewable Energy Development: Large Potential of Solar Power Underoptimised. Available online: https://www.pwc.com/id/en/media-centre/infrastructure-news/march-2019/large-potential-of-solar-power-underoptimised.html (accessed on 15 July 2021).
- IESR. Residential Rooftop Solar Technical and Market Potential in 34 Provinces in Indonesia; IESR: Jakarta, Indonesia, 2019; pp. 1–17. [Google Scholar]
- Pv Magazine International. Indonesia’s Vast Rooftop Potential. Available online: https://www.pv-magazine.com/2019/08/19/indonesias-vast-rooftop-potential/ (accessed on 15 July 2021).
- Guenther, M. Challenges of a 100% Renewable Energy Supply in the Java-Bali Grid. Int. J. Technol. 2018, 9, 257. [Google Scholar] [CrossRef] [Green Version]
- Simaremare, A.A.; Bruce, A.; Macgill, I. Least Cost High Renewable Energy Penetration Scenarios in the Java Bali Grid System. Available online: http://apvi.org.au/solar-research-conference/ (accessed on 15 July 2021).
- Wang, C.; Dargaville, R.; Jeppesen, M. Power system decarbonisation with Global Energy Interconnection-A case study on the economic viability of international transmission network in Australasia. Glob. Energy Interconnect. 2018, 1, 507–519. [Google Scholar] [CrossRef]
- Vidinopoulos, A.; Whale, J.; Fuentes Hutfilter, U. Assessing the technical potential of ASEAN countries to achieve 100% renewable energy supply. Sustain. Energy Technol. Assess. 2020, 42, 100878. [Google Scholar] [CrossRef]
- Verband Deutscher Maschinen- und Anlagenbau (VDMA). International Technology Roadmap for Photovoltaic; VDMA Verlag: Frankfurt, Germany, 2019. [Google Scholar]
- Projects-5B. Available online: https://5b.com.au/projects/ (accessed on 15 July 2021).
- Solargis. Solar Resource Maps and GIS Data for 200+ Countries. Available online: https://solargis.com/maps-and-gis-data/download/indonesia (accessed on 15 July 2021).
- Global Solar Atlas. Available online: https://globalsolaratlas.info/global-pv-potential-study (accessed on 15 July 2021).
- Home-System Advisor Model (SAM). Available online: https://sam.nrel.gov/ (accessed on 15 July 2021).
- Solar Forecasting & Solar Irradiance Data. Available online: https://solcast.com/ (accessed on 14 February 2021).
- Blakers, A.; Stocks, M.; Lu, B.; Anderson, K.; Nadolny, A. An atlas of pumped hydro energy storage. The Complete Atlas. Victoria 2017, 4400, 300. [Google Scholar]
- Blakers, A.; Lu, B.; Stocks, M. 100% renewable electricity in Australia. Energy 2017, 133, 471–482. [Google Scholar] [CrossRef]
- Global Energy Storage Database. Energy Storage Systems. Available online: https://www.sandia.gov/ess-ssl/global-energy-storage-database-home/ (accessed on 15 July 2021).
- Blakers, A.; Stocks, M.; Lu, B.; Cheng, C. A review of pumped hydro energy storage. Prog. Energy 2021, 3, 022003. [Google Scholar] [CrossRef]
- Stocks, M.; Stocks, R.; Lu, B.; Cheng, C.; Blakers, A. Global Atlas of Closed-Loop Pumped Hydro Energy Storage. Joule 2021, 5, 270–284. [Google Scholar] [CrossRef]
- Menko Maritim Luncurkan Data Rujukan Wilayah Kelautan Indonesia. Available online: https://maritim.go.id/menko-maritim-luncurkan-data-rujukan-wilayah-kelautan-indonesia/ (accessed on 15 July 2021).
- Badan Pusat Statistik. Statistical Year Book of Indonesia 2020. Available online: https://www.bps.go.id/publication/2020/04/29/e9011b3155d45d70823c141f/statistik-indonesia-2020.html (accessed on 15 July 2021).
- Indonesia Geospatial Portal. Available online: https://tanahair.indonesia.go.id/portal-web (accessed on 15 July 2021).
- 50MW Kidston Solar Project (KS1). Available online: https://www.genexpower.com.au/ks1-project-details.html (accessed on 15 July 2021).
- Solar Energy Research Institute of Singapore (SERIS). Where Sun Meets Water: Floating Solar Market Report-Executive Summary; Solar Energy Research Institute of Singapore (SERIS): Singapore, 2018. [Google Scholar]
- Minerba One Map Indonesia. Available online: https://momi.minerba.esdm.go.id/public/ (accessed on 15 July 2021).
- OpenStreetMap. Available online: https://www.openstreetmap.org/relation/304751#map=4/-5.57/121.38 (accessed on 15 July 2021).
- Maus, V.; Giljum, S.; Gutschlhofer, J.; da Silva, D.M.; Probst, M.; Gass, S.L.B.; Luckeneder, S.; Lieber, M.; McCallum, I. A global-scale data set of mining areas. Sci. Data 2020, 7, 1–13. [Google Scholar] [CrossRef]
- Google Earth. Available online: https://www.google.com/earth/ (accessed on 15 July 2021).
- EarthExplorer. Available online: https://earthexplorer.usgs.gov/ (accessed on 14 February 2021).
- Goetzberger, A.; Zastrow, A. On the Coexistence of Solar-Energy Conversion and Plant Cultivation. Int. J. Sol. Energy 1982, 1, 55–69. [Google Scholar] [CrossRef]
- Schindele, S.; Trommsdorff, M.; Schlaak, A.; Obergfell, T.; Bopp, G.; Reise, C.; Braun, C.; Weselek, A.; Bauerle, A.; Högy, P.; et al. Implementation of agrophotovoltaics: Techno-economic analysis of the price-performance ratio and its policy implications. Appl. Energy 2020, 265. [Google Scholar] [CrossRef]
- Sekiyama, T.; Nagashima, A. Solar Sharing for Both Food and Clean Energy Production: Performance of Agrivoltaic Systems for Corn, A Typical Shade-Intolerant Crop. Environments 2019, 6, 65. [Google Scholar] [CrossRef] [Green Version]
- GREENID. Dual-Use Approaches for Solar Energy and Food Production International Experience and Potentials for Viet Nam; Green Innovation and Development Centre (GreenID): Hanoi, Vietnam, 2018. [Google Scholar]
- Indonesia Investments. Agriculture Sector of Indonesia-Indonesian Agriculture Products. Available online: https://www.indonesia-investments.com/culture/economy/general-economic-outline/agriculture/item378 (accessed on 15 July 2021).
- WorldAtlas. Largest Rice-Producing Countries. Available online: https://www.worldatlas.com/articles/largest-rice-producing-countries.html (accessed on 15 July 2021).
- A Field Experiment and the Simulation on Agrivoltaic-Systems Regarding to Rice in a Paddy Field. Available online: https://www.jstage.jst.go.jp/article/jjser/37/6/37_23/_article/-char/en (accessed on 15 July 2021).
- Dinesh, H.; Pearce, J.M. The potential of agrivoltaic systems. Renew. Sustain. Energy Rev. 2016, 54, 299–308. [Google Scholar] [CrossRef] [Green Version]
- ENGIE Laborelec. Growing in the Shade of Solar Power. Available online: https://www.laborelec.com/growing-in-the-shade-of-solar-power/ (accessed on 15 July 2021).
- Alemu, M.M. Effect of Tree Shade on Coffee Crop Production. J. Sustain. Dev. 2015, 8, 66. [Google Scholar] [CrossRef]
- Shade-Grown vs Sun-Grown Coffee: Why It Matters. Available online: https://theexoticbean.com/blog/coffee-types/shade-grown-vs-sun-grown-coffee-matters/ (accessed on 15 July 2021).
- Misra, T.K.; Saha, A.; Biswas, R.; Mandal, P. Shade trees in tea plantations in different soil conditions of North Bengal. Pleione 2009, 3, 219–223. [Google Scholar]
- Soto-Pinto, L.; Perfecto, I.; Castillo-Hernandez, J.; Caballero-Nieto, J. Shade effect on coffee production at the northern Tzeltal Zone of the state of Chiapas, Mexico. Agric. Ecosyst. Environ. 2000, 80, 61–69. [Google Scholar] [CrossRef]
- Ministry of Agriculture Forestry and Fisheries (MAFF). Promotion of Introduction of Renewable Energy. Available online: https://www.maff.go.jp/j/shokusan/renewable/energy/attach/pdf/einou-51.pdf (accessed on 15 July 2021).
- Rao, L.J.; Mittra, B.N. Growth and Yield of Peanut as Influenced by Degree and Duration of Shading. J. Agron. Crop. Sci. 1988, 160, 260–265. [Google Scholar] [CrossRef]
- Masabni, J.; Sun, Y.; Niu, G.; Del Valle, P. Shade effect on growth and productivity of tomato and chili pepper. Horttechnology 2016, 26, 344–350. [Google Scholar] [CrossRef] [Green Version]
- Kittasa, C.; Rigakis, N.; Katsoulas, N.; Bartzanas, T. Influence of shading screens on microclimate, growth and productivity of tomato. Acta Hortic. 2009, 807, 97–102. [Google Scholar] [CrossRef]
- Okoli, P.S.O.; Wilson, G.F. Response of cassava (Manihot esculenta Crantz) to shade under field conditions. Field Crop. Res. 1986, 14, 349–359. [Google Scholar] [CrossRef]
- Islam, M.T.; Kubota, F.; Mollah, F.H.; Agata, W. Effect of Shading on the Growth and Yield of Mungbean (Vigna radiata [L.] Wilczek). J. Agron. Crop. Sci. 1993, 171, 274–278. [Google Scholar] [CrossRef]
- PV Tech. World’s Largest Floating Solar Plant Connected in China. Available online: https://www.pv-tech.org/news/worlds-largest-floating-solar-plant-connected-in-china (accessed on 15 July 2021).
- RenewEconomy. Massive 60MW Floating Solar Plant Secures 25-Year PPA in Singapore. Available online: https://reneweconomy.com.au/massive-60mw-floating-solar-plant-secures-25-year-ppa-in-singapore-25262/ (accessed on 15 July 2021).
- PVPS Trends in Photovoltaic Applications 2020. Available online: www.iea-pvps.org (accessed on 5 May 2021).
- PV Tech. Masdar and PLN to Develop Indonesia’s First Floating Solar Plant. Available online: https://www.pv-tech.org/news/masdar-and-pln-partner-to-develop-indonesias-first-floating-solar-project (accessed on 15 July 2021).
- Indonesian Center for Environmental Law (ICEL). Antara PLTS Terapung dan Perlindungan Kualitas Air. Available online: https://icel.or.id/isu/lain-lain/antara-plts-terapung-dan-perlindungan-kualitas-air/?utm_source=rss&utm_medium=rss&utm_campaign=antara-plts-terapung-dan-perlindungan-kualitas-air (accessed on 17 July 2021).
- PV Magazine. The Weekend Read: Don’t Throw Caution to The Wind. Available online: https://www.pv-magazine.com/2020/02/22/the-weekend-read-dont-throw-caution-to-the-wind/ (accessed on 15 July 2021).
- PV Tech. Floating Solar Testbed to Battle Filipino Typhoons. Available online: https://www.pv-tech.org/news/floating-solar-testbed-to-battle-filipino-typhoons (accessed on 15 July 2021).
- PV Tech. Sungrow Highlights Robust Floating Solar System After Drought and Typhoon Season in Taiwan. Available online: https://www.pv-tech.org/sungrow-highlights-robust-floating-solar-system-after-drought-and-typhoon-s (accessed on 15 July 2021).
- Deutschland, W. GmbH WINAICO Launches Typhoon—Resistant Solar Modules and Achieves 315 W in 60 Cell PERC Modules at PV EXPO. Available online: https://www.winaico.com/fileadmin/redaktion/press_release/2017/EN/PM_WINAICO_WINAICO_solar_modules_on_floating_solar_system_in_UK_Jul2017_EN.pdf (accessed on 15 July 2021).
- Cleanenergyauthority.com. Biomimicked Floating Solar from Ocean Sun. Available online: https://www.cleanenergyauthority.com/solar-energy-news/biomimicked-floating-solar-073019 (accessed on 15 July 2021).
- Browse Reanalysis Datasets ECMWF. Available online: https://www.ecmwf.int/en/forecasts/datasets/browse-reanalysis-datasets (accessed on 14 December 2020).
- United Nations Office for the Coordination of Humanitarian Affairs (OCHA). Available online: https://reliefweb.int/sites/reliefweb.int/files/resources/OCHA_ROAP_StormTracks_v8_190314.pdf (accessed on 15 July 2021).
- Copernicus Climate Change Service Climate Data Store. Available online: https://cds.climate.copernicus.eu/#!/home (accessed on 14 February 2021).
- Postcode Data for Small-Scale Installations. Available online: http://www.cleanenergyregulator.gov.au/RET/Forms-and-resources/Postcode-data-for-small-scale-installations (accessed on 15 July 2021).
- Green Energy Market Pty Ltd. Projections for Distributed Energy Resources-Solar PV and Stationary Energy Battery Systems; Green Energy Markets Pty Ltd.: Hawthorn, VIC, Australia, 2020. [Google Scholar]
- Solar Energy Research Institute of Singapore. Update of the Solar Photovoltaic (PV) Roadmap for Singapore; Solar Energy Research Institute of Singapore (SERIS): Singapore, 2020. [Google Scholar]
- Sunseap to Build $2 bln Floating Solar Farm in Indonesia, World’s Largest. Available online: https://www.reuters.com/business/energy/sunseap-build-2-bln-floating-solar-farm-indonesia-worlds-largest-2021-07-22/ (accessed on 26 August 2021).
Figure 1.
Net global generation capacity additions showing the dominance of solar and wind [8,9,10,11].

Figure 2.
Deployment speed of renewable electricity capacity (Watts per person per year) [11].
Figure 2.
Deployment speed of renewable electricity capacity (Watts per person per year) [11].

Figure 3.
Projected module energy yield for different c-Si solar cell technologies [26].
Figure 3.
Projected module energy yield for different c-Si solar cell technologies [26].

Figure 4.
A ground mounted 1 MW system (Nomadic Energy, Western Australia). Reprinted with permission from [27]. Copyright 5B Australia Pty Ltd., 2021.
Figure 4.
A ground mounted 1 MW system (Nomadic Energy, Western Australia). Reprinted with permission from [27]. Copyright 5B Australia Pty Ltd., 2021.

Figure 5.
The Global Horizontal Irradiation map by Solargis [28].
Figure 5.
The Global Horizontal Irradiation map by Solargis [28].

Figure 6.
PV output potential (kWh/kWp) daily average for 2010–2019.

Figure 7.
Potential off-river pumped hydro energy storage sites in Indonesia (Source: [32]).
Figure 7.
Potential off-river pumped hydro energy storage sites in Indonesia (Source: [32]).

Figure 8.
Map of Indonesia’s territorial area [39].
Figure 8.
Map of Indonesia’s territorial area [39].

Figure 9.
Map of Indonesia mining areas from the Ministry of Energy and Mineral Resources [42].
Figure 9.
Map of Indonesia mining areas from the Ministry of Energy and Mineral Resources [42].


Figure 11.
Classification of a Landsat-8 image of a coal site in Paser, East Kalimantan to vegetation (green), water (blue), and disturbed land (brown).
Figure 11.
Classification of a Landsat-8 image of a coal site in Paser, East Kalimantan to vegetation (green), water (blue), and disturbed land (brown).

Figure 12.
Three different types of APV system: (a) using the space between photovoltaics (PV) panels for crops, (b) a PV greenhouse, and (c) a stilt-mounted system [49].
Figure 12.
Three different types of APV system: (a) using the space between photovoltaics (PV) panels for crops, (b) a PV greenhouse, and (c) a stilt-mounted system [49].

Figure 13.
Schematic representation of typical FPV systems [41].
Figure 13.
Schematic representation of typical FPV systems [41].

Figure 14.
Aerial view of Lake Toba in North Sumatera, Indonesia [45].
Figure 14.
Aerial view of Lake Toba in North Sumatera, Indonesia [45].

Figure 15.
Last 50 years of tropical storms in Asia-Pacific; 1968–2018 [77].
Figure 15.
Last 50 years of tropical storms in Asia-Pacific; 1968–2018 [77].

Figure 16.
Cumulative area with maximum individual wave height lower than a given number in Indonesia’s maritime area (Data source: ERA5 [78]).
Figure 16.
Cumulative area with maximum individual wave height lower than a given number in Indonesia’s maritime area (Data source: ERA5 [78]).


Table 1.
Renewable energy potential in Indonesia and installed capacity.
| Renewable Energy Sources | Potential (GW) | Installed Capacity (GW) | Ratio (%) |
|---|---|---|---|
| Geothermal | 30 | 2.1 | 7.2 |
| Large hydropower | 75 | 5.6 | 7.4 |
| Small hydropower | 19 | 0.5 | 2.6 |
| Bioenergy * | 33 | 1.9 | 5.8 |
| Solar energy | 208 | 0.2 | 0.1 |
| Wind | 61 | 0.2 | 0.3 |
| Ocean | 18 | - | - |
| Total | 443 | 10.5 | 2.4 |
Table 2.
Comparison of daily averages, minimum and maximum for Sumatera, Kalimantan, Sulawesi, Java-Bali-Nusa Tenggara, Maluku-Papua, and Indonesia.
Table 2.
Comparison of daily averages, minimum and maximum for Sumatera, Kalimantan, Sulawesi, Java-Bali-Nusa Tenggara, Maluku-Papua, and Indonesia.
| 2010–2019 | Global Horizontal Irradiation (kWh/m2) | |||||
|---|---|---|---|---|---|---|
| Sumatera (10 Cities) | Kalimantan (5 Cities) | Sulawesi (6 Cities) | Java-Bali-Nusa Tenggara (9 Cities) | Maluku-Papua (4 Cities) | Indonesia (34 Cities) | |
| Average | 4.8 | 5.0 | 5.4 | 5.2 | 5.1 | 5.1 |
| Worst day/average | 38% | 24% | 22% | 36% | 22% | 50% |
| Worst 2 days/average | 51% | 43% | 43% | 57% | 50% | 63% |
| Worst 7 days/average | 71% | 72% | 68% | 63% | 64% | 78% |
| Worst month/average | 81% | 84% | 81% | 81% | 78% | 85% |
(Data source: Solcast [30]).
Table 3.
Unused land areas per regions (in 000 km2) and fraction of requirements.
| Type of Land | Barren | Bush/Shrub | Swamp/Marsh | Littoral | Total | Fraction of Requirements |
|---|---|---|---|---|---|---|
| Sumatera | 1.3 | 35 | 0.7 | 0.1 | 37 | 105% |
| Kalimantan | 6 | 73 | 9 | 0.03 | 88 | 253% |
| Sulawesi | 2 | 23 | 0.1 | 0.1 | 25 | 71% |
| Jawa-Bali-Nusa Tenggara | 11 | 23 | 0.2 | 0.1 | 34 | 98% |
| Maluku-Papua | 5 | 35 | 7 | 0.2 | 47 | 136% |
| Indonesia | 25 | 189 | 18 | 0.6 | 232 | 663% |
Table 4.
Licensed and active mining area in Indonesia (in km2).
| Region | Sumatera | Kalimantan | Sulawesi | Jawa-Bali- Nusa Tenggara | Maluku-Papua | Indonesia |
|---|---|---|---|---|---|---|
| Licensed area [42] | 26,802 | 49,425 | 11,621 | 4951 | 12,864 | 105,663 |
| Active area [43,44] | 207 | 3442 | 131 | 69 | 53 | 3902 |
Table 5.
Result of visual inspection of mining areas for solar PV.
| Mining Area Cluster | Number of Site/Polygon | Area (km2) | Vegetation (%) | Water (%) | Land (%) | Visual Inspection |
|---|---|---|---|---|---|---|
| >100 km2 | 7 | 1,189 | 33 | 18 | 49 | all sites |
| 50–100 km2 | 7 | 428 | 44 | 12 | 45 | all sites |
| 10–50 km2 | 53 | 1117 | 47 | 8 | 45 | all sites |
| 1–10 km2 | 296 | 951 | 41 | 4 | 55 | 168 sample |
| <1 km2 | 954 | 218 | 38 | 6 | 56 | 331 sample |
| Total | 1317 | 3902 | 40.4 | 10.4 | 49.2 |
Defunct mines are important early sites for PV as the water and bare soil area can host solar panels with low additional environmental impact. A site availability average figure of 60% (disturbed land and water bodies) translates to about 2300 km2 of available area for siting PV panels, corresponding to 7% of the 35,000 km2 target or 460 GW.
Table 6.
Planted area of crops lower than 5 m and potential of coverage area (000 km2).
| Type of Crops | Sumatera | Kalimantan | Sulawesi | Jawa-Bali-Nusa Tenggara | Maluku-Papua | Total | APV Coverage (%) | Potential of Coverage Area |
|---|---|---|---|---|---|---|---|---|
| Rice | 23 | 9 | 15 | 60 | 1 | 107 | 0 | 0 |
| Maize | 12 | 1 | 15 | 27 | 0 | 55 | 10–30 | 6–17 |
| Coffee | 8 | 0 | 1 | 3 | 0 | 13 | 10–30 | 1–4 |
| Others | 8 | 1 | 2 | 24 | 1 | 35 | 10–30 | 4–10 |
| Total | 50 | 11 | 33 | 114 | 2 | 210 | 11–31 |
(Data source: [65]).
Table 7.
Lake and reservoir surface area available in Indonesia’s regions.
| Region | Combined Lake and Reservoir Surface Area (000 km2) |
|---|---|
| Sumatera | 2.1 |
| Kalimantan | 0.8 |
| Sulawesi | 0.7 |
| Java-Bali-Nusa Tenggara | 0.5 |
| Maluku-Papua | 0.9 |
| Total | 5.0 |
Table 8.
Maritime area with forty years of historical maximum windspeed.
| Maximum Windspeed | Area (000 km2) | Multiple of 35,000 km2 Requirement |
|---|---|---|
| 10 m/s | 40 | 1.1 |
| 15 m/s | 1256 | 36 |
| 20 m/s | 3118 | 89 |
| 25 m/s | 3185 | 91 |
| 30 m/s | 3187 | 91 |
| 35 m/s | 3188 | 91 |
Table 9.
Maritime area with forty years historical maximum individual wave height.
| Maximum Wave Height | Area (000 km2) | Multiple of 35,000 km2 Requirement |
|---|---|---|
| 2 m | 183 | 5 |
| 3 m | 346 | 10 |
| 4 m | 847 | 24 |
| 6 m | 2230 | 64 |
| 8 m | 3134 | 90 |
Table 10.
Maritime area with a combination of maximum windspeed and wave height.
| Maximum Wave Height | Maximum Windspeed | Area (000 km2) | Multiple of 35,000 km2 Requirement |
|---|---|---|---|
| 2 m | 10 m/s | 23 | 0.7 |
| 15 m/s | 131 | 4 | |
| 20 m/s | 179 | 5 | |
| 35 m/s | 182 | 5 | |
| 3 m | 10 m/s | 32 | 0.9 |
| 15 m/s | 277 | 8 | |
| 20 m/s | 342 | 10 | |
| 35 m/s | 345 | 10 | |
| 4 m | 10 m/s | 38 | 1.1 |
| 15 m/s | 708 | 20 | |
| 20 m/s | 843 | 24 | |
| 35 m/s | 846 | 24 | |
| 6 m | 10 m/s | 40 | 1.1 |
| 15 m/s | 1224 | 35 | |
| 20 m/s | 2224 | 64 | |
| 35 m/s | 2229 | 64 | |
| 8 m | 10 m/s | 40 | 1.1 |
| 15 m/s | 1255 | 36 | |
| 20 m/s | 3077 | 88 | |
| 35 m/s | 3132 | 89 |
Table 11.
Summary of potential area, multiple of the 9000 TWh per year, 35,000 km2 requirement, and potential annual energy generation (in brackets).
Table 11.
Summary of potential area, multiple of the 9000 TWh per year, 35,000 km2 requirement, and potential annual energy generation (in brackets).
| Potential Space for PV Panels | Area (000 km2) | Multiple of Area Requirement (TWh/Year) | |
|---|---|---|---|
| 1 | Urban solar PV | - | 7–19% (50–1700) |
| 2 | Ground-mounted PV | ||
| (a) Agricultural PV (10–30% coverage) | 11–31 | 30–90% (2700–8100) | |
| (b) Mined area | 2.3 | 7% (600) | |
| 3 | Floating PV | ||
| (a) Freshwater (5% coverage) | 0.25 | 0.7% (64) | |
| (b) Ocean (<2 m waves, 15 m/sec wind) | 131 | 400% (34,000) | |
| (c) Ocean (<4 m waves, 15 m/sec wind) | 708 | 2000% (180,000) |
Publisher’s Note: MDPI stays neutral with regard to jurisdictional claims in published maps and institutional affiliations. |
© 2021 by the authors. Licensee MDPI, Basel, Switzerland. This article is an open access article distributed under the terms and conditions of the Creative Commons Attribution (CC BY) license (https://creativecommons.org/licenses/by/4.0/).
Share and Cite
MDPI and ACS Style
Silalahi, D.F.; Blakers, A.; Stocks, M.; Lu, B.; Cheng, C.; Hayes, L. Indonesia’s Vast Solar Energy Potential. Energies 2021, 14, 5424. https://0-doi-org.brum.beds.ac.uk/10.3390/en14175424
AMA Style
Silalahi DF, Blakers A, Stocks M, Lu B, Cheng C, Hayes L. Indonesia’s Vast Solar Energy Potential. Energies. 2021; 14(17):5424. https://0-doi-org.brum.beds.ac.uk/10.3390/en14175424
Chicago/Turabian StyleSilalahi, David Firnando, Andrew Blakers, Matthew Stocks, Bin Lu, Cheng Cheng, and Liam Hayes. 2021. "Indonesia’s Vast Solar Energy Potential" Energies 14, no. 17: 5424. https://0-doi-org.brum.beds.ac.uk/10.3390/en14175424
Note that from the first issue of 2016, this journal uses article numbers instead of page numbers. See further details here.