
Reliability Updating of Offshore Wind Substructures by Use of Digital Twin Information


1
Department of the Built Environment, Aalborg University, 9220 Aalborg, Denmark
2
Ramboll Energy, 6700 Esbjerg, Denmark
3
Department of Energy Technology, Aalborg University, 6700 Esbjerg, Denmark
*
Author to whom correspondence should be addressed.
Energies 2021, 14(18), 5859; https://0-doi-org.brum.beds.ac.uk/10.3390/en14185859
Submission received: 5 August 2021
/
Revised: 2 September 2021
/
Accepted: 9 September 2021
/
Published: 16 September 2021
(This article belongs to the Topic Marine Renewable Energy)
Abstract
:This paper presents a probabilistic framework for updating the structural reliability of offshore wind turbine substructures based on digital twin information. In particular, the information obtained from digital twins is used to quantify and update the uncertainties associated with the structural dynamics and load modeling parameters in fatigue damage accumulation. The updated uncertainties are included in a probabilistic model for fatigue damage accumulation used to update the structural reliability. The updated reliability can be used as input to optimize decision models for operation and maintenance of existing structures and design of new structures. The framework is exemplified based on two numerical case studies with a representative offshore wind turbine and information acquired from previously established digital twins. In this context, the effect of updating soil stiffness and wave loading, which constitute two highly uncertain and sensitive parameters, is investigated. It is found that updating the soil stiffness significantly affects the reliability of the joints close to the mudline, while updating the wave loading significantly affects the reliability of the joints localized in the splash zone. The increased uncertainty related to virtual sensing, which is employed to update wave loading, reduces structural reliability.
1. Introduction
The offshore wind industry has experienced significant growth over the last decade [1]. As a result, the number of offshore wind turbines operating in Europe has reached 5402 in 2020 [2], with much more planned to be installed worldwide in the close future [3]. The typical lifetime of an offshore wind turbine ranges between 20 and 25 years, which means that over the coming years a large number of these structures reach their intended lifetime, and operators will have to take actions regarding their assets. Potential actions, denoted as decision models, can be to decommission, re-power, perform inspections, or extend lifetime. An optimal decision depends on what specific business model the operator pursues, but, regardless of the business aspect, an accurate and precise estimation of the structural reliability is key in making such a decision [4].
A digital twin-defined as a digital replica of a physical asset [5,6]-can help us to assess the structural integrity of existing structures more accurately and precisely compared to predictions from generic design practices because consistent and updated information of the structure is available. This has been successfully demonstrated in the oil and gas industry [7,8], in aerospace engineering [9], and in the offshore wind industry as well [10]. In fact, a number of wind standardization committees, including Det Norske Veritas (DNV) [11,12], International Electrotechnical Commission (IEC) [13], and Federal Maritime and Hydrographic Agency (BSH) [14], are working on design recommendations on how to use measurement data and inspection information to optimize decision models for existing wind turbines. Currently, a key missing aspect is how to use the improved structural models contained in digital twins to subsequently improve the decision models.
Although fully physics-based digital twins have not yet been applied to improve decision models for wind turbines, some publications already indicate how measurement data can be used to achieve such an improvement. Nielsen and Sørensen [15] applied dynamic Bayesian networks to calibrate a Markov deterioration model based on past inspection data of wind turbine blades. Ziegler and Muskulus [16] investigated the feasibility of lifetime extension for offshore wind monopile substructures, with particular focus on identifying important parameters to monitor during the operational phase of the turbines. Leser et al. [17] presented a general framework for fatigue damage estimation based on in situ measurements. Mai et al. [18] focused on prediction of the remaining useful lifetime of wind turbine support structure joints using met-ocean in situ data. Augustyn et al. [19] extended a conceptual framework for updating decision models based on information from a digital twin, initially proposed by Tygesen et al. [7], to be applied to offshore wind substructures. In the framework, a digital twin is established with an updated structural and load model, and subsequently the digital twin is used to quantify uncertainty and update the structural reliability.
In the present paper, we outline the framework by Augustyn et al. [19] beyond its conceptual level and propose a probabilistic method for updating the structural reliability of offshore wind turbine substructures based on new information obtained from digital twins. Depending on the information type available, various methods for updating reliability can be used [20]. If information on the structural integrity becomes available, for example, by an inspection of joints to identify potential cracks, risk-based inspection methods can be applied [21,22,23,24]. Even though the inspection planning methodology is matured and well-proven in industrial applications [25], its feasibility for the majority of offshore wind applications is questionable due to the profound inspection costs [26]. A more economically feasible alternative, in the form of condition-based monitoring, is typically investigated for offshore wind applications [27,28]. In this context, condition monitoring data can be applied to identify structural damage, and then the resulting integrity information can be employed for updating reliability [29]. Application studies have been presented for mechanical components in turbine [30] and wind turbine blades [4]. However, in these studies, the condition monitoring data merely provide structural integrity information at a global level-that is, if damage is present or not. In the present study, we aim at enhancing the spatial resolution of the integrity assessment and hereby provide information at a local (joint) level. Consequently, this paper proposes a framework where condition monitoring data are used to update structural models; these updated models are subsequently used to update structural reliability, including uncertainty stemming from the updating procedure.
The contribution of this paper consists of: (1) proposing a method on how the uncertainties related to the structural dynamics and load modeling in fatigue damage accumulation can be quantified and updated based on updated distribution functions of model parameters, which can be acquired with the aid of a digital twin. Subsequently, (2) we present a framework where the updated uncertainty is used to update the structural reliability based on a well-established probabilistic model [31,32]. Generally, the framework can be used for optimization of operation and maintenance of existing turbines and design of new structures. The framework is exemplified based on two numerical case studies, in which digital twins established in previous studies by the authors [33,34] are included.
The remainder of this paper is organized as follows. In Section 2, we outline the concept of structural reliability estimation and convey the motivation for the proposed structural reliability updating framework, which is presented in Section 3. The two following sections address the numerical case studies used to exemplify the framework for existing and new substructures; Section 4 describes the setup of the case studies and Section 5 presents the appertaining results. Finally, this paper closes with concluding remarks in Section 6.
2. Background and Problem Statement
A wind turbine consists of structural components, for which reliability analysis is performed using structural reliability theory [35], and electrical/mechanical components, for which classical reliability models can be used, with the main descriptor being the failure rate or the mean time between failure (MTBF). Regardless of the component type being addressed in the reliability analysis, a probabilistic model describing the component’s integrity is required. The reliability of electrical/mechanical components is typically modeled by a Weibull model for the time to failure and the components are assumed to be statistically independent. Using, for example, failure tree analysis (FTA) and failure mode and effect analysis (FMEA), system reliability models can be established and the reliability update can be performed when new information becomes available [36,37,38]. In the present paper, jacket-type steel wind turbine substructures are considered, so structural reliability techniques are required to model loads, resistances, and model uncertainties and to account for the correlation between the components. The fatigue damage is often design driving for the structural components of offshore wind substructures, such as joints. In this instance, fatigue damage accumulation can be expressed in terms of probability of failure or, equivalently, by the reliability index [39].
Let be the fatigue limit state at year for an offshore wind substructure; then [32,40],
where is the fatigue resistance and the double summation expresses the accumulated fatigue damage. In particular, is a stochastic variable representing the limit value of the accumulated fatigue damage estimated using, for example, SN curves, including the uncertainty related to application of Miner’s rule for linear fatigue damage accumulation. In the expression for the fatigue damage, is the yearly probability of occurrence for sea state i (including wind and wave parameters), is the number of cycles for the ith sea state and jth stress range , and K and m are the parameters related to the SN curve, with m being the Wöhler exponent [41]. The uncertainties related to the SN curve approach are included by modeling K as a stochastic variable. , , and are stochastic variables that model the uncertainties associated with the structural dynamics, load modeling and stress concentration.
If , the limit state is exceeded and the structure fails, while implies that the structure is safe. The probability of fatigue failure in the time interval , can be estimated by first-order and second-order reliability methods [39] or, as is the case in this paper, by Monte Carlo methods [42]. The corresponding reliability index, , can be computed as , where is the standard normal distribution function. The annual reliability index, , can be calculated analogically assuming a reference period of one year.
We note that (1) and may be correlated, and, in this instance, they should be modeled by a joint probability density function with correlation coefficient and (2) a linear formulation of the limit state equation can be readily generalized for a bi-linear formulation of the SN curve. The parameters in model (1) are elaborated in Section 2.1.
2.1. Uncertain Parameters and Their Modeling
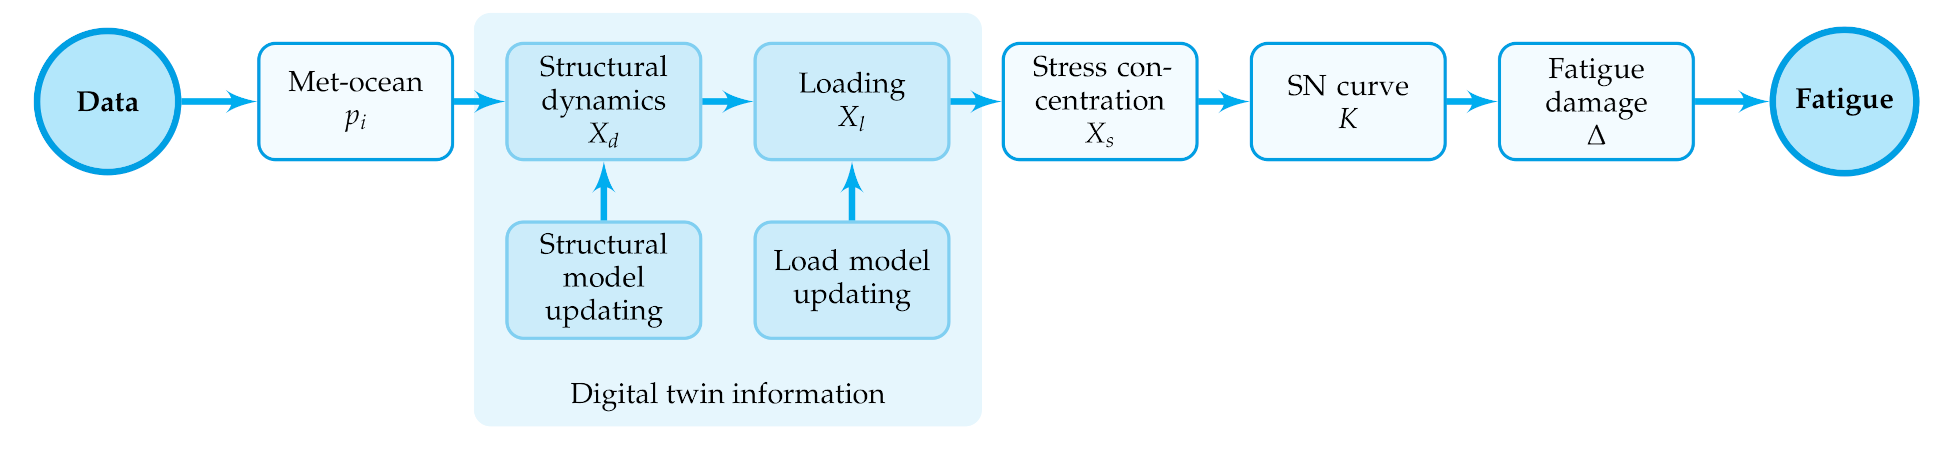
The uncertainty modeling related to structural reliability due to fatigue damage is summarized in Figure 1. In the framework proposed in Section 3, we focus on updating stochastic variables related to structural dynamics and loading uncertainty, as schematically indicated by the dark blue boxes in Figure 1. The remaining part of the uncertainty (the light blue boxes in Figure 1) can be quantified based on experiments and data. This is not considered in the proposed framework, but a brief discussion is provided in the present subsection for the sake of completeness.
2.1.1. Met-Ocean Model
The joint probability distributions of the wind-wave climate is discretized by a finite number of short-term sea state simulations including random wind and wave seeds to model a stochastic process [40]. Met-ocean uncertainty is included in (1) by the yearly probability of each sea state, denoted . The met-ocean uncertainty can be quantified if long-term climate parameters are monitored [18,43].
2.1.2. Structural Dynamics
Estimating dynamic system properties is associated with uncertainties [44]. The uncertainties stem from environmental and operational variability, non-stationary sea states (fluctuating mean sea water level), time-variant structural conditions (corrosion, scour), output noise, and the formulation of the structural model, including modeling of highly uncertain parameters such as soil stiffness, joint stiffness and damping. We note that the output noise relates to the noise in the acceleration and/or strain signals, which is propagated through system identification procedures and results in uncertainty of the updated structural model parameters [44]. The structural dynamics uncertainty is included in (1) through the stochastic variable .
2.1.3. Loading
Depending on the location of the wind turbine, the loading may include the following exogenous sources and their inherent uncertainties:
- Hydrodynamic loading-uncertainty related to calculating wave loads that stems from different wave theories (linear vs. non-linear), Morison’s equation, stretching and mass and drag coefficients.
- Aerodynamic loading-uncertainty related to calculating wind loads that stems from wind turbulence, wake model, and shear coefficient.
- Ice loading-uncertainty related to calculating ice loads, for example, ice thickness, ice crushing strength and ice failure regime.
- Earthquake loading-uncertainty related to calculating earthquake loads, for example, earthquake acceleration profile, structural response, soil-structure integration, and force transfer.
If loading uncertainty is quantified based on information from digital twins, the main part of the uncertainty is related to obtaining the structural response due to external loading. This response is typically estimated based on virtual sensing methods, which are associated with uncertainties [34,45]. The loading uncertainty is included in (1) through the stochastic variable .
2.1.4. Stress Concentration
Stress ranges in specific locations can be estimated based on simplified parametric equations, for example, Efthymiou [46] or detailed finite element (FE) models. The stress concentration uncertainty is included in (1) through the stochastic variable . The stress concentration uncertainty can be quantified if a detailed FE model is used to establish hot spot stresses [47] or if hot spot stresses are measured directly.
2.1.5. SN Curve
The uncertainty in parameter estimation from the SN curve approach [48] is included in (1) through the stochastic variable K and the deterministic parameter m. If a bi-linear SN curve is used, then stochastic variables are used to model the two branches of the SN curve. The SN curve uncertainty can be quantified if fatigue testing is performed [48].
2.1.6. Fatigue Damage
2.2. Current State-of-Practice for Reliability Updating
Design standards define a specific level of reliability that offshore wind substructures must fulfill, for example, a target annual reliability index of in IEC 61400-1 [31,40]. Reliability levels indicated in standards assume a generic level of uncertainty representative for all types of substructures and locations. Because the uncertainty is assumed to cover a wide range of structures and locations, the resulting design is, in many cases, conservative. The level of conservatism can be quantified when new information specific to a particular structure becomes available. One way of obtaining such information is by means of digital twins, which can be used to quantify the uncertainty and subsequently update the structural reliability.
3. Structural Reliability Updating Framework
In this paper, we propose a probabilistic framework in which digital twin information is used to update the uncertainties associated with the fatigue damage accumulation, which are then used to update the structural reliability. In particular, we use the updated parameters from the established digital twins to quantify the model uncertainties of the structural dynamics, , and load modeling, . The updated uncertainties are quantified based on a forward propagation method, which allows quantifying separate uncertainty sources stemming from specific model parameters. Having updated the relevant uncertainty contributions from the updated model parameters, the reliability is updated based on the linear probabilistic limit state Equation (1). Finally, the updated reliability serves as a decision basis for a decision model update. A schematic illustration of the framework is seen in Figure 2, and steps one to six are described in Section 3.1, Section 3.2, Section 3.3, Section 3.4, Section 3.5 and Section 3.6.
3.1. Model Updating
It is assumed that an updated structural model (step one) is available, which can be obtained based on well-established model formulation and updating procedures [51].
3.2. Input Parameters
The distribution functions of the updated model parameters (available from step one) are used in step two as input for the uncertainty quantification procedure. The stochastic variables reflect both the aleatory and epistemic uncertainties, which constitute the updated and uncertainties.
3.3. Uncertainty Propagation
The effect of the updated model parameters on the fatigue damage accumulation is established by a Monte Carlo uncertainty propagation method [52], as indicated in step three in Figure 2. Based on the uncertainty in the input parameters (i.e., the distribution functions of the updated numerical model parameters), we obtain the distribution of fatigue damage, hence quantifying the uncertainties in fatigue damage due to the updated model parameters. The uncertainty quantification procedure is described next. The aim is to express the uncertainty as a stochastic variable multiplied to the fatigue stress ranges.
The uncertainty in fatigue damage accumulation due to an uncertain parameter, , can be quantified by simulating n realizations from this parameter’s distribution function and calculating the corresponding fatigue damage. When calculating fatigue damage, the remaining parameters are assumed to be deterministic. Moreover, the fatigue damage is calculated assuming one sea state parameter. In this way, the introduced uncertainty is solely governed by the variability of , hence quantifying this parameter’s contribution to the fatigue damage accumulation uncertainty. For example, a distribution function of updated soil stiffness implies structural dynamics uncertainty, while a distribution function of an updated inertia coefficient in Morison’s equation implies loading uncertainty.
Among a number of uncertainty quantification methods [53], a Bayesian framework [54] is recommended by a number of standard committees, for example, IEC and Joint Committee on Structural Safety (JCSS), due to its sound theoretical basis and wide range of applicability. However, a main challenge in the Bayesian framework is the requirement of a prior distribution on the parameters to be quantified. In the context of offshore wind uncertainties, information on prior distributions is not available in the background documents for the above mentioned standards and committees. Consequently, in the proposed framework, we implemented a simplified method where we start with the uncertainty modeling consistent with the design standard of wind turbines [40], and subsequently we quantify the uncertain parameters already included in (1) using the maximum likelihood method.
Assuming the fatigue damage, modeled as a stochastic variable depending on the uncertain parameter , is normally distributed, , the fatigue damage distribution (mean value and standard deviation ) can be found through the maximum likelihood method, where the likelihood is defined as
with being the fatigue damage associated with the ith realization of computed based on the updated structural model contained in the digital twin.
The log-likelihood function becomes
and the optimal parameters are found to be
3.4. Uncertainty Quantification
The procedure outlined in the previous subsection quantifies uncertainty in fatigue damage accumulation. However, the probabilistic model (1) requires uncertainty in stress ranges rather than in the fatigue damage. Therefore, it is now described how uncertainty in fatigue damage can be transformed into uncertainty in stress ranges, as indicated in step four in Figure 2.
The fatigue damage accumulation, D, is proportional to the stress ranges, , according to (assuming a linear SN curve), from which it follows . The stress range distribution parameters can be computed from Monte Carlo simulations. Alternatively, assuming the damage distribution function is normal, the stress range distribution’s mean, , and coefficient of variation (CoV), , can be approximated as
and
where and are the mean and CoV of the fatigue damage distribution due to the uncertainty associated with .
3.5. Reliability Update
The quantified and updated uncertainties can be consistently included in the probabilistic framework to update the reliability level. The probabilistic model (1) is used to derive an annual reliability level, , given the updated uncertainties. This procedure is indicated in the fifth step in Figure 2, where two reliability curves (with and without using information from a digital twin) are schematically presented. The outcome of the reliability update (increase or decrease) depends on the outcome of uncertainty quantification (increased or decreased).
3.6. Decision Models
Given new information from digital twins becomes available (either during operation or already in the design stage), the decision models can be updated as indicated by the last step in Figure 2. The digital twin information can be included based on Bayesian decision theory [24,55]. For existing structures, an operation and maintenance decision plan can be optimized based on an updated reliability level, for example, an updated inspection plan or lifetime reassessment. More specifically, a reliability-based inspection planning technique can be implemented [56] and some of the inspections can be removed (if any were planned during the lifetime of the structure in question) or new inspections can be included if the structural integrity is compromised. For new structures, the expected outcome of a future digital twin can be used to optimize structures already at the design stage (before the digital twin information becomes available) by the use of Bayesian pre-posterior theory [54].
4. Case Study Setup
To demonstrate an application of the proposed framework, we consider an example where information from a digital twin of an offshore wind jacket substructure is used to update the structural reliability of the substructure. The numerical models of the substructure and the turbine are described in Section 4.1.1 and Section 4.1.2, followed by a description of the analyzed load case scenarios in Section 4.1.3. Based on the simulation results (in the form of stress range distributions), the structural reliability of selected joints is calculated in Section 4.2.1 by assuming a generic level of uncertainty. The results are nominal and are, in Section 5, compared with the results obtained by using digital twin information.
4.1. Modeling
We simulate a numerical model of a 7 MW jacket-supported turbine using the procedure outlined by Nielsen et al. [57] and applied by, e.g., Augustyn et al. [34]. The simulation procedure consists of the following steps: (1) the substructure model and corresponding wave loading are reduced to a Craig–Bampton superelement [58] with 30 internal modes accounting for internal substructure dynamics. A convergence study has been performed to ascertain that the reduced model (including 30 modes) adequately captures the relevant modal parameters of the non-reduced system. Subsequently, (2) the wind loading is computed through aero-elastic analyses, in which the substructure superelement is included. Finally, (3) the force-controlled recovery run outlined by Nielsen et al. [59] is performed, where the response of the substructure is recovered and relevant measurements are extracted. The applied model is formulated using state-of-the-art modeling approaches included in a typical design procedure for jacket substructures, and the model has been validated to accurately and precisely represent the structural dynamics of a combined substructure and wind turbine system [60,61].
4.1.1. Substructure
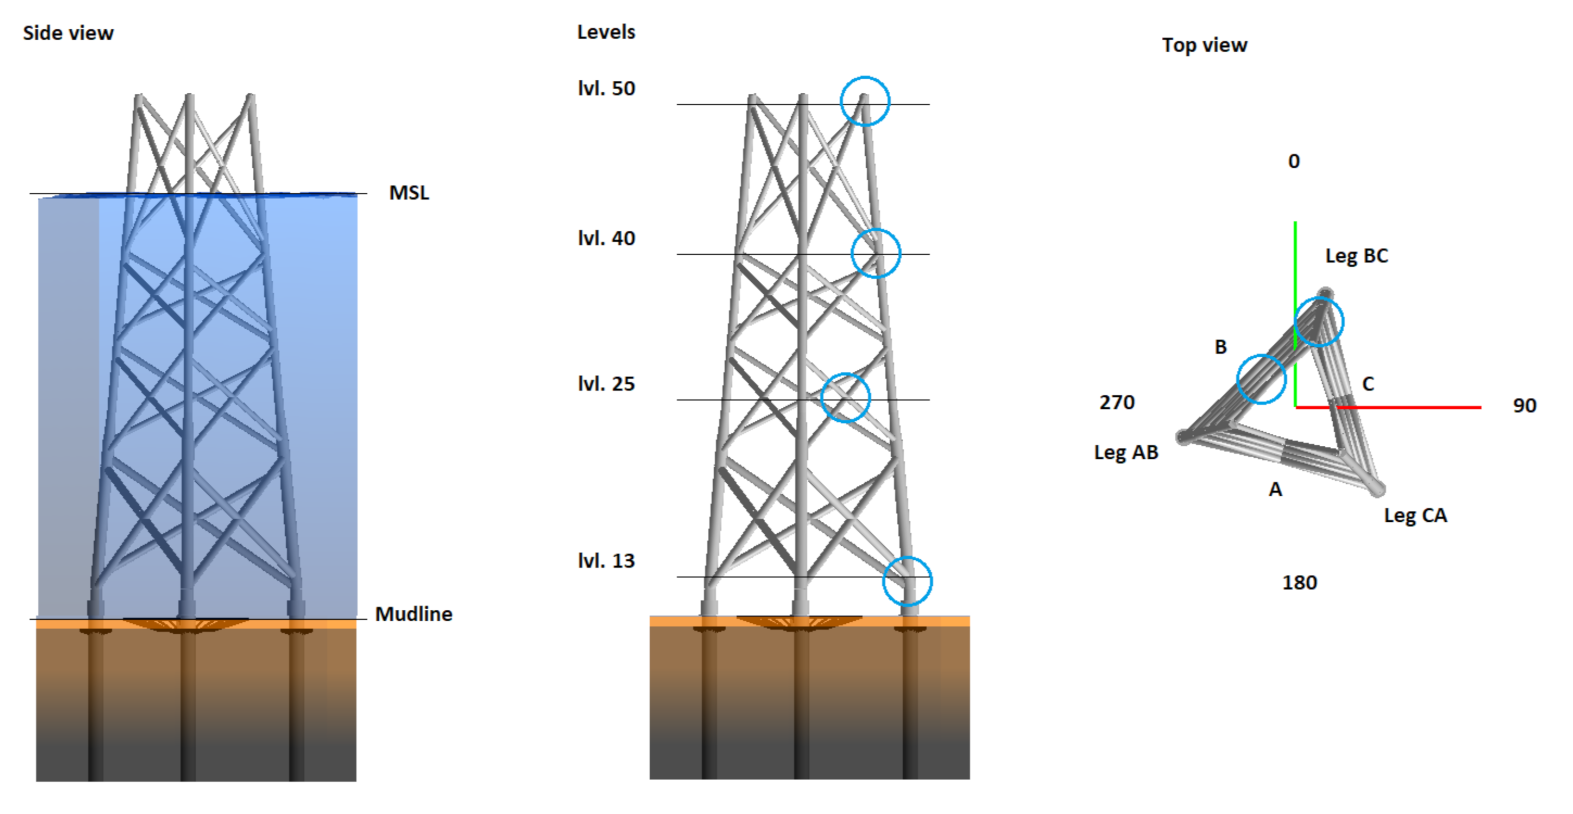
The jacket substructure and its appertaining wave loading were modeled using ROSAP (Ramboll Offshore Structural Analysis Programs), version 53 [62]. The jacket substructure considered in this study, which is depicted in Figure 3, has a total height of approximately 75 m. The substructure comprises three legs, each with a diameter ranging between 1.2 and 1.7 m, and four brace bays, each with a diameter ranging between 0.8 and 1.1 m. The substructure model includes, i.a., soil-pile interaction, local joint flexibility, scour, marine growth and appurtenance masses. The water depth is 55 m and the soil conditions are characterized as clay. The substructure includes 50 m grouted piles. The soil-structure interaction is modeled by the use of soil curves linearized according to the API method [63]. The structural damping was modeled according to a Rayleigh model [64] with 0.5% and 1% modal damping in the first and second bending modes, respectively.
The locations of the selected joints considered in the case studies are indicated in Figure 3B. The joint levels range between 13 (mudline) to 50 (top of the jacket). Results for sides B and C of the jacket, see Figure 3C, are provided. The joints are named in the following way: 50CL, where 50 indicates the level, C is the jacket side, and L indicates the lower element in the joint.
4.1.2. Wind Turbine
The substructure carries a representative 7 MW turbine, which is modeled in LACflex aero-elastic code [65]. The turbine includes a 90 m tubular tower with a diameter ranging between 4 and 6 m. Along the tower, three concentrated masses are assumed to emulate the effect of secondary-structures. The aero-elastic code employs a modal-based representation of the turbine (including the tower, rotor and blades). An aerodynamic damping contribution is included through the fluid-structure interaction when calculating aero-elastic forces. The wind turbine model was originally developed for industrial purposes, where it was applied in commercial projects. A rather similar model (albeit a 5 MW turbine instead of 7 MW), which adheres to the same modeling principles, has been applied in other studies on structural dynamics of wind turbines [34,66].
4.1.3. Load Cases
In this study, we consider the fatigue failure mode in the normal operating condition (design load case (DLC) 1.2 [40]). For a typical offshore wind jacket substructure, this DLC accounts for most of the fatigue damage [67].
The met-ocean parameters applied in this study are derived based on measurements from a representative North Sea site [68] and are summarized in Table 1. The wind speed ranges between 4 and 31 ms, resulting in wind speed bins. For each wind speed bin, representative wave parameters, i.e., the significant wave height and peak period, are assigned. The significant wave height ranges from 0.1 to 7.9 m while the peak period ranges from 3.0 to 9.6 s. The met-ocean parameters along with their yearly probability of occurrence are derived from a site-specific joint probability distribution function, which is a common design practice [40]. A total of wind directions are analyzed (wind and waves are assumed fully aligned). For each wind speed, a total of turbulence intensity quantiles, namely, , are considered. The quantiles for each wind speed are calculated based on the Weibull distribution according to the IEC standard [40] for turbulence class B. The turbulence intensities for the given site ranges from 0.09 to 0.31. The fatigue damage is scaled with the corresponding turbulence intensity quantile probability, hence representing the target Weibull distribution. Every load case (wind speed, wave height, peak period and turbulence intensity) is simulated with seeds. The total number of load cases analyzed is .
4.2. Nominal Results
The structural reliability of selected joints of the jacket substructure is evaluated based on model (1) and the variables are summarized in Table 2. The stress ranges, , and number of cycles, N, were obtained from simulations. The SN curves for tubular joints in air and in seawater with cathodic protection are used according to [48]. The SN curve for the air environment are applied to the joint at level 50. For the remaining joints, the SN curve for seawater with cathodic protection is applied. For tubular joints exposed to seawater with cathodic protection, negative inverse slopes of = 3 and = 5 and intercepts of and are assumed to calculate the characteristic SN curve. For tubular joints in air environment, the following values can be used: = 12.48 and = 16.13, while assuming the same m values as for seawater environment. The mean SN curve for the probabilistic analysis was calculated from the characteristic SN curve’s intercepts assuming a standard deviation of 0.20 [48].
4.2.1. Annual Reliability
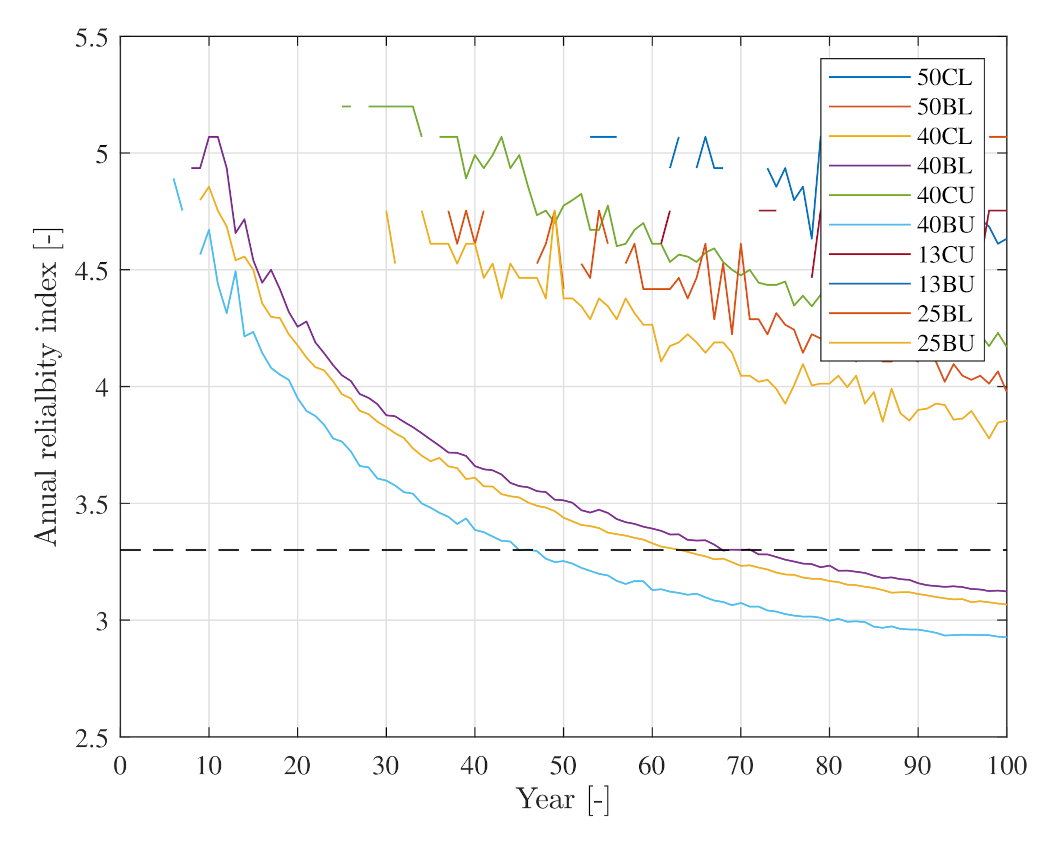
The annual reliability index as a function of time, , is calculated based on the state-of-the-art probabilistic methods described in Section 2. The limit state Equation (1) was applied using the standard-based variables provided in Table 2. The reliability indices are presented in Figure 4 and Table 3 and are denoted as the nominal results. The results represent the situation where no additional knowledge from a digital twin is available. The results are provided for 10 selected joints, which are typically critical for a jacket design.
The structure is designed to have a fatigue lifetime of 25 years. The fatigue lifetime ends when the annual reliability index reaches the target value , which serves as the basis for reliability-based calibration of safety factors in recognized design codes [31,40]. For the considered case study, the design driving joints are 13BU and 40CU with a lifetime of 25 and 27 years. Joint 13BU is located close to the mudline, while joint 40CU is located slightly below the splash zone. Joints 40CL, 40BL, 25BU and 25BL have a lifetime between 50 and 100 years, while the remaining joints have a lifetime above 100 years.
5. Case Study Results
In this section, we exemplify how new information from digital twins can be included in the proposed framework to quantify uncertainty and subsequently update structural reliability for the particular case study. We use information from previously established digital twins [33,34]. The effect of structural dynamics uncertainty, , is investigated based on a model updating study presented in [33], where the soil stiffness, , was calibrated based on in situ measurements. The effect of loading uncertainty, , is investigated based on a virtual sensing study [34], where modal expansion was used to estimate unmeasured field quantities. The results are presented and discussed based on two design driving joints, namely, 13CU and 40BU.
5.1. Updating Structural Dynamics Uncertainty
In this subsection, we present the updated structural reliability based on an updated structural dynamics uncertainty. First, we present a sensitivity study on updating soil stiffness, followed by a case study based on in situ soil stiffness calibration [33].
5.1.1. Soil Stiffness Sensitivity
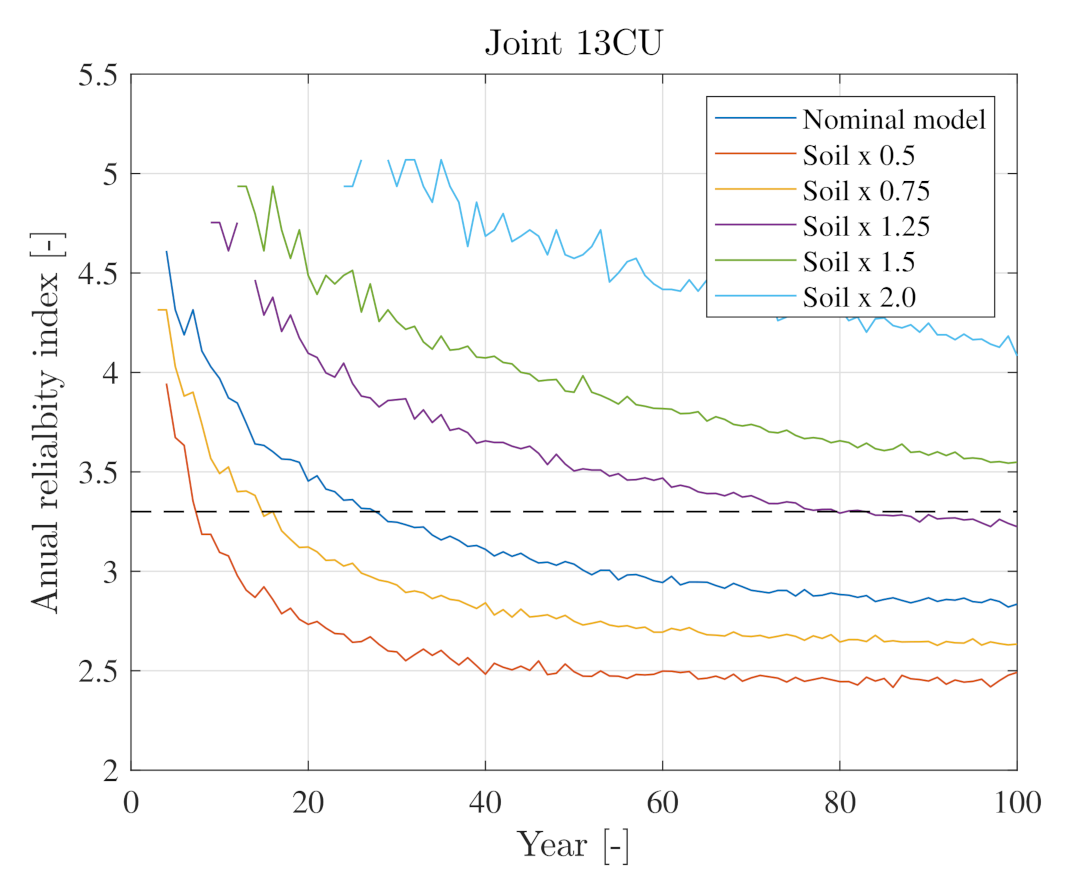
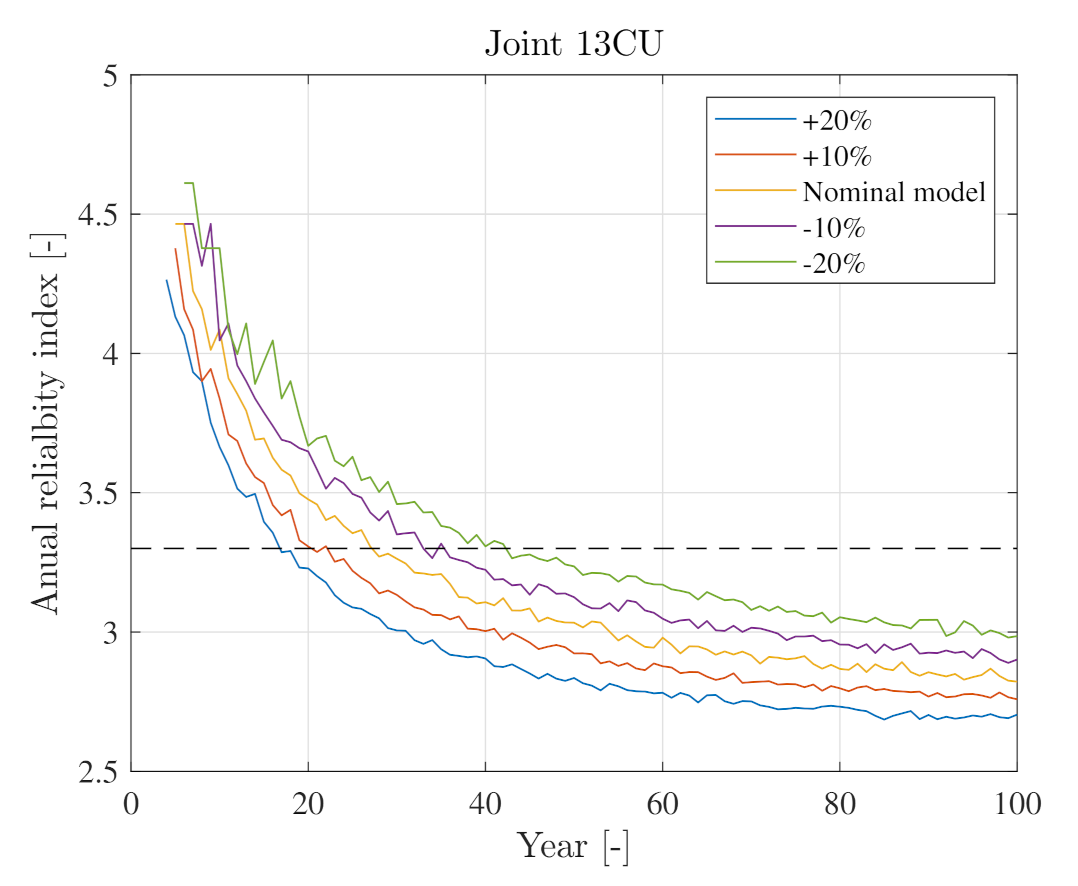
The effect of updating thesoil stiffness mean value, , for joint 13CU is presented in Figure 5 and in Table 4. It is assumed that new information from a digital twin is obtained; in this particular case, the mean value of uncertainty related to structural dynamics, , is updated. The results are derived by using the limit state Equation (1) with the standard-based variables provided in Table 2 and updated values for .
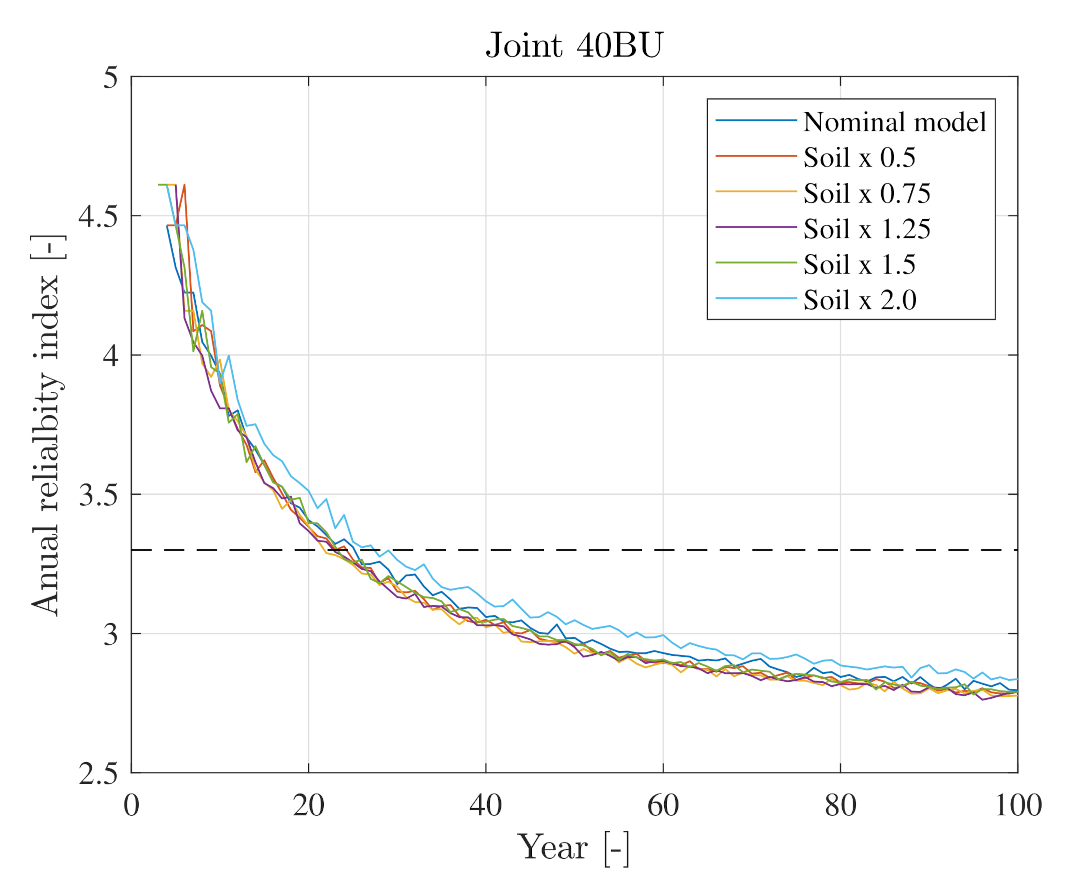
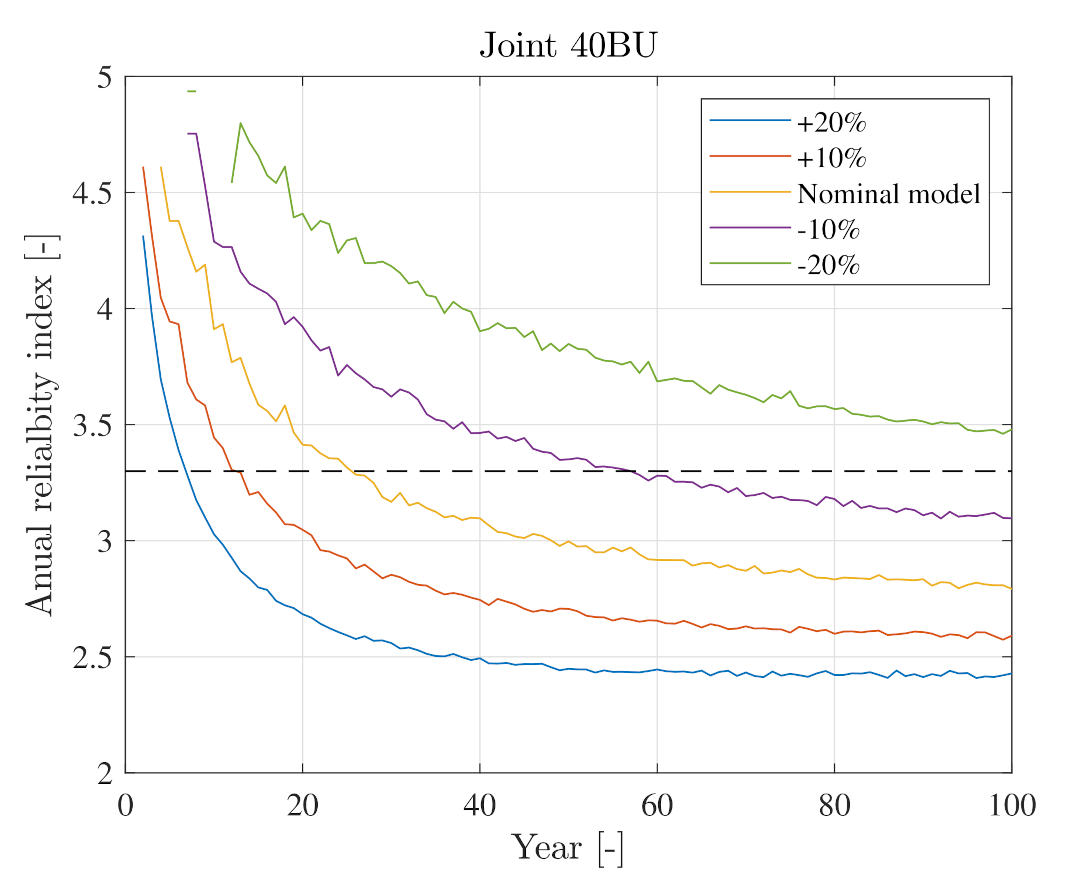
As seen in Figure 5, the soil stiffness has a significant impact on the fatigue lifetime. Updating the soil stiffness by a factor of 0.5 (resulting in reducing the mudline pile stiffness by half) results in a reduction in lifetime by a factor of 0.3. In contrast, increasing the soil stiffness by a factor of 2.0 results in a lifetime increase by more than fourfold (>100 years). The effect of updating soil stiffness on joint 40BU is negligible, as indicated in Figure 6.
Note that in Figure 5 and Figure 6 (and the other figures describing structural reliability as a function of time), the reliability generally decreases with time, albeit non-monotonically in some cases. For example, consider the green curve in Figure 5, where a local increase in reliability around year 20 is observed. This is due to a limited number of Monte Carlo simulations, but we note that this limitation does not qualitatively affect the conclusions drawn from the analyses.
5.1.2. Reliability Update-Soil Stiffness
Based on the results presented in [33], we assume the soil stiffness distribution function after the update can be approximated by a normal distribution with mean value of 4.7 and CoV = 0.12, i.e., . The soil stiffness uncertainty is propagated through the numerical model, and the uncertainty on stress ranges was estimated according to the method presented in Section 3.3. It was assumed, for illustrative purposes, that the soil stiffness is the only uncertain parameter affecting the uncertainty, i.e., . The uncertainty is quantified and its updated value was applied together with the nominal uncertainty values for the remaining stochastic variables in (1). The updated distribution (mean value and CoV) as a result of the soil updating is presented in Table 5.
The soil stiffness update results in a reduction in the mean value of for all joints except three joints in the splash zone (joints 40CL, 40BL and 40CU). The CoV of is reduced for all joints because the CoV of is reduced from the initial value of 0.10 for all joints. The structural reliability after the soil update is presented in Figure 7 alongside the lifetime compared to the nominal model presented in Table 5. After the soil update, we can observe an increase in fatigue life in four joints close to the mudline (13CU and 13BU) and in the lowest X-joint (25BL and 25BU). Compared to the nominal model, we can conclude that for both critical joints (40BU and 13CU), the fatigue lifetime is increased after the update. Note that the fatigue lifetime in joint 40BL is reduced despite a reduced CoV. That is due to the fact that for this joint, two opposite effects of the soil update are merged; namely, the positive effect of the reduced CoV (0.006 vs. 0.10) and the negative effect of the increased mean value (1.07 vs. 1.00).
The general conclusion holds that if both the mean value and CoV are reduced, then the fatigue lifetime is increased, while if both of the values are increased, then the opposite result holds. If either mean or CoV is reduced while the other is increased, the fatigue lifetime can either increase or decrease depending on the extent of the increase/decrease in mean value and CoV.
5.2. Loading Uncertainty Update
In this subsection, we investigate the effect of updating loading uncertainty on the structural reliability. First, we present a sensitivity study on wave loading calibration, followed by updating the reliability based on load calibration using two virtual sensing configurations. The virtual sensing study is presented based on uncertainty quantified in [34]. In this subsection, the uncertainty is updated based on an updated parameter. It is assumed, similarly as in Section 5.1, that only one uncertain parameter affects the uncertainty modeling, i.e., .
5.2.1. Wave Loading Sensitivity
The effect of updating the wave loading coefficient, , on the structural reliability of joint 13CU is presented in Figure 8 and in Table 6. The mean value of the wave loading coefficient is modified by a factor of 0.8–1.2, which results in modifications of the loading uncertainty. It is assumed that new information from the digital twin is obtained; in this particular case, the mean value of uncertainty related to loading uncertainty, , is updated. The results are derived by using the limit state Equation (1) with the standard-based variables provided in Table 2 and updated values for .
The wave loading modification has a medium impact on the fatigue lifetime. Updating the wave loading by a factor of 0.8 (reducing the inertia-induced wave loading by 20%) results in an increased lifetime by a factor of 1.6. Increasing the wave loading by a factor of 1.2 results in reducing the lifetime by a factor of 0.7. The effect of updating wave loading on joint 40BU is more pronounced, as indicated in Figure 9. For this joint, reducing the wave loading by 20% results in a lifetime increase by more than fourfold (>100 years), while a wave loading increase by 20% results in a lifetime reduction by a factor of 0.3.
5.2.2. Reliability Update-Virtual Sensing Uncertainty
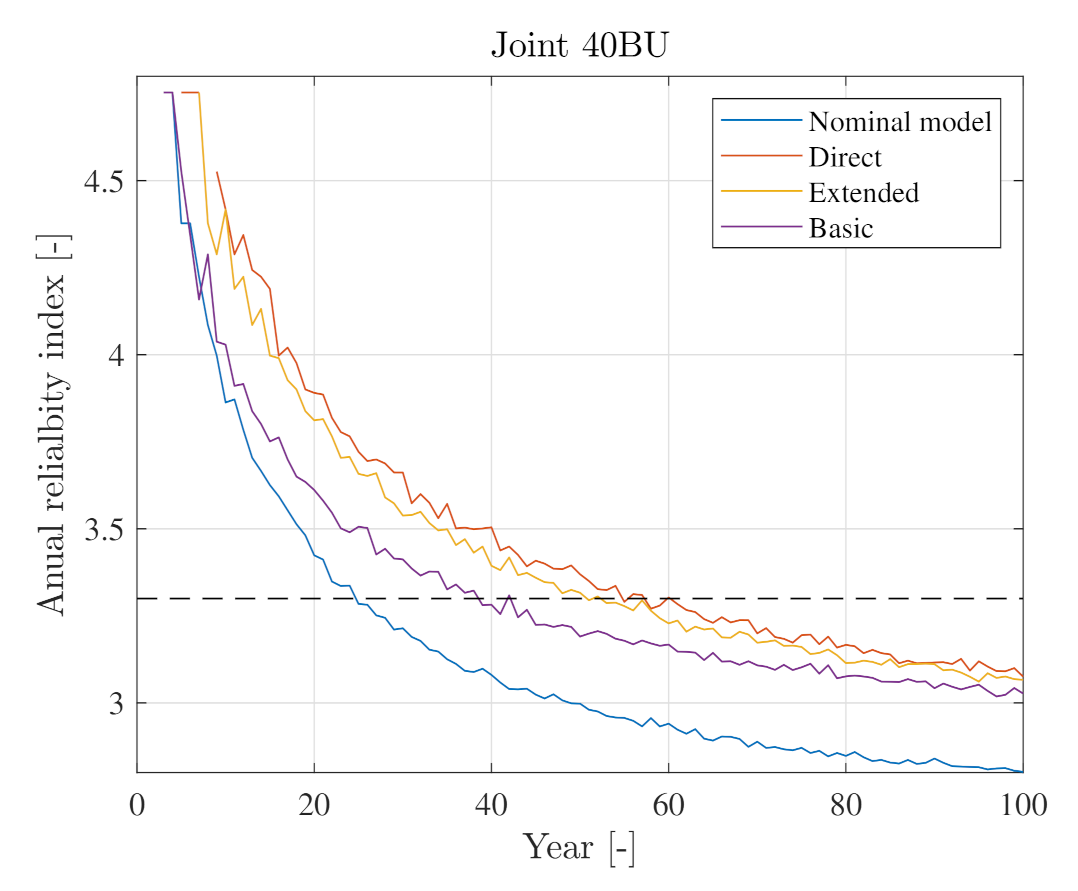
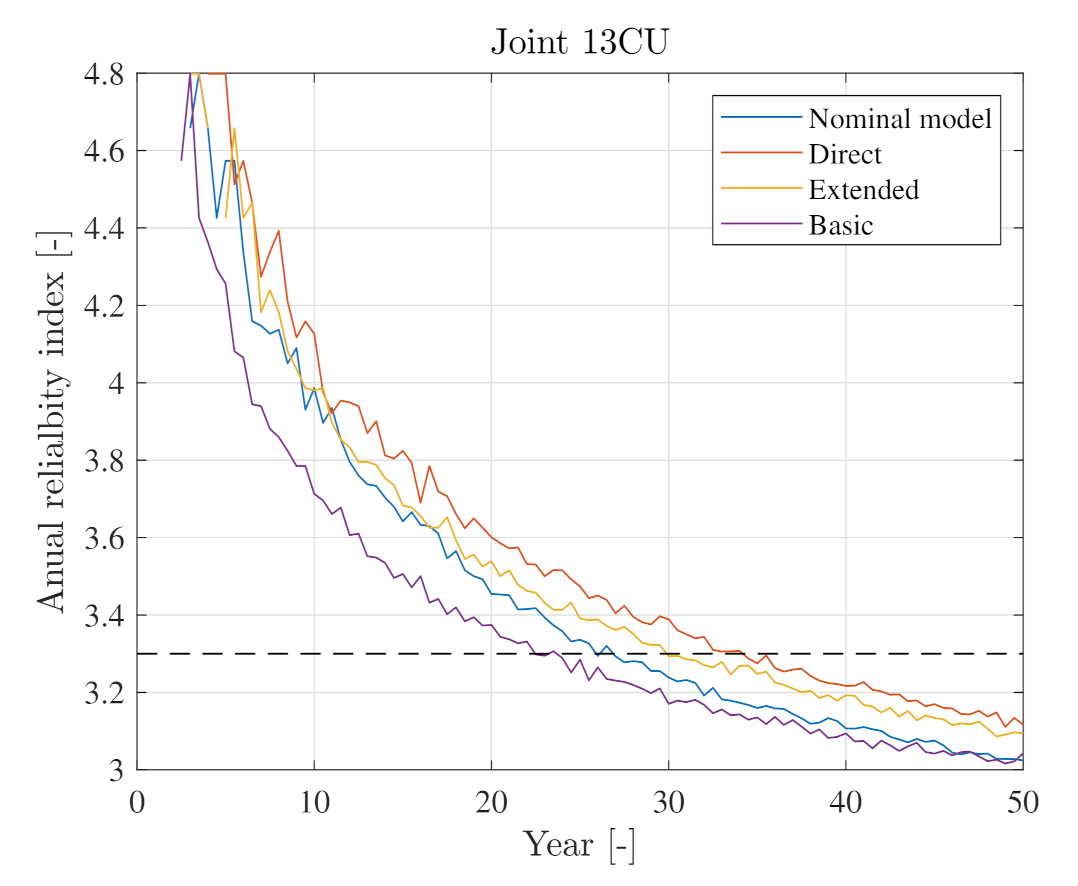
The virtual sensing uncertainty quantified for two virtual sensing configurations are considered based on results presented in [34]. The following virtual sensing uncertainty configurations are used: (1) basic setup: CoV = 0.10 and (2) extended setup: CoV = 0.05, while the mean value for both setups is assumed to be 1.00. The basic setup includes only acceleration sensors above the water level, while the extended one, in addition, includes sub-sea acceleration sensors and a wave radar sensor. It is assumed that the virtual sensing uncertainty are combined with the nominal uncertainty. Furthermore, it is assumed, for illustrative purposes, that the mean value of equals 0.9. The distribution parameters used in this study are summarized in Table 7 for joints 40CU and 13BU.
The results for joint 40BU are presented in Figure 10. As each model update configuration results in the same mean value update so the only difference in the stochastic model is the CoV, the higher the CoV, the shorter lifetime we should derive. This is confirmed in the results as the direct sensing method (measuring directly), with CoV = 0.00 resulting in a lifetime of 60 years, followed by the extended virtual sensing method (lifetime of 50 years and CoV = 0.05), while the most uncertain method (basic virtual sensing with CoV = 0.10) results in a fatigue lifetime of 40 years. In this case, each configuration derives a fatigue lifetime larger than the nominal one, i.e., 25 years. However, this is not the case for joint 13CU, where the fatigue lifetime using the basic virtual sensing configuration is 22 years, as depicted in Figure 11. Even though the mean value of the update results in reduced fatigue damage ( for this case), the negative effect of increased uncertainty (CoV ) results in a fatigue lifetime reduction of 3 years.
5.3. Uncertainty Correlation
In the previous subsections, the and uncertainties were investigated separately, hence neglecting a potential correlation. In this subsection, we consider updating both and with varying correlation coefficients. The correlation can stem from interaction between the structural dynamics and loading parameters. For example, the loading parameters can be calibrated based on responses from a previously updated structural model.
We assume the structural and loading uncertainties are quantified based on new information from a digital twin, resulting in updated mean values of structural and load uncertainties: and and using the reference uncertainty level CoV = 0.10. The updated uncertainty value corresponds to increasing the soil stiffness by 50%, , and reducing the wave loading coefficient by 10%, . The results are presented for joint 13CU.
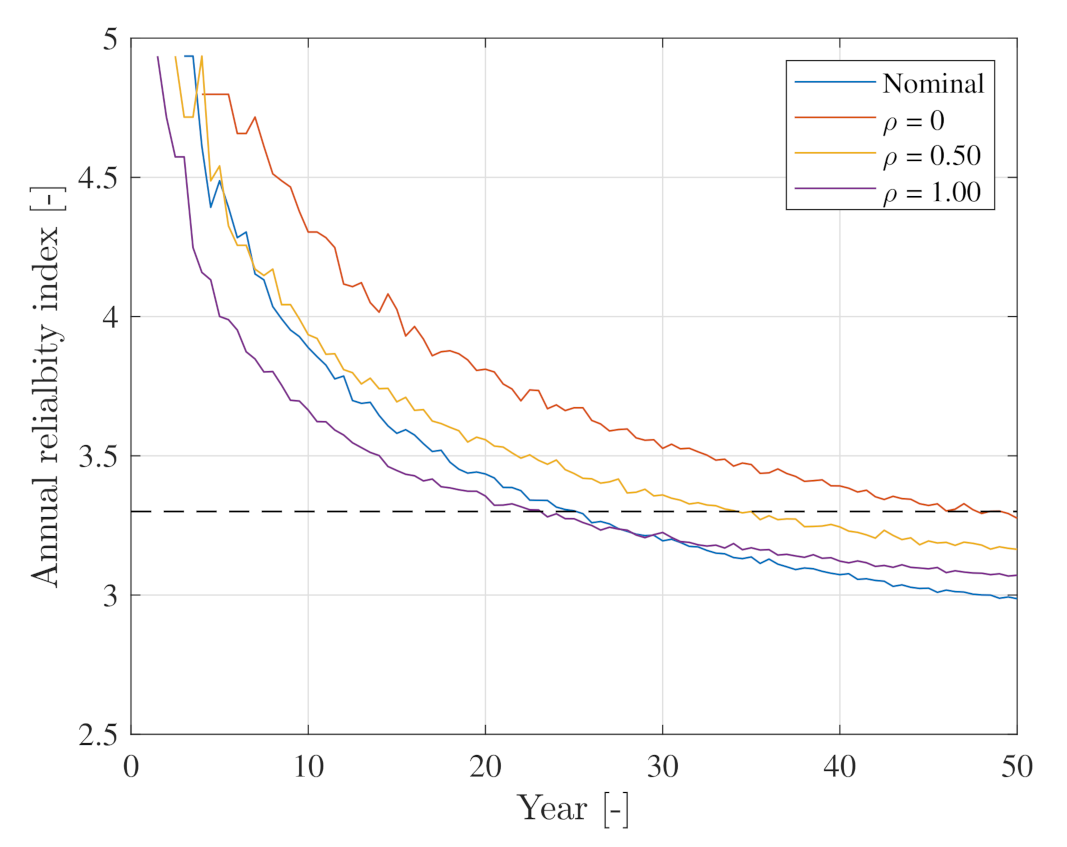
Three scenarios of correlation between and are investigated: (1) (no correlation), which can be the case if the load calibration was performed without using information from the updated structural model, (2) (full correlation), when, for example, load calibration using mode shapes from an updated structural model and (3) an intermediate case with , where both analytical and measured mode shapes were used for load calibration.
The structural reliability calculated for various scenarios is presented in Figure 12. The nominal setup yields a fatigue lifetime of 25 years, while the updated uncertainty results in a fatigue lifetime ranging between 23 and 48 years, where the difference stems solely from varying correlations. The largest fatigue lifetime is obtained when assuming no correlation, while the lowest lifetime is derived for full correlation. Note that despite reducing the mean values of and , the fatigue lifetime is reduced compared to the nominal result for the full correlation case. The results are in line with expectations, because positive correlation increases the combined uncertainty.
5.4. Application for New Structures
Assuming a number of digital twins for similar structures have been established in the past, we can, by applying the proposed framework, obtain a distribution function of , which indicates what is the expected outcome of updating the structural and load model. This knowledge can be used at the design stage, resulting in an optimized design given the expected model update is realized. However, the updated information may be at a preliminary stage of validation and therefore subject to some degree of uncertainty, i.e., the expected model update outcome only represents our (best) knowledge. Hence, we must confirm our expectation by performing model updates during the structural lifetime and consider all potential outcomes of the experiment (model update) in the design stage. This is accounted for by preparing a decision rule, which for any outcome introduces an action that guarantees that the wind turbine has a sufficient reliability level until the intended lifetime is reached. The proposed application is based on Bayesian pre-posterior decision theory [54] and has, in the offshore wind industry, been applied in, for example, optimization of operation and maintenance of wind turbines [55].
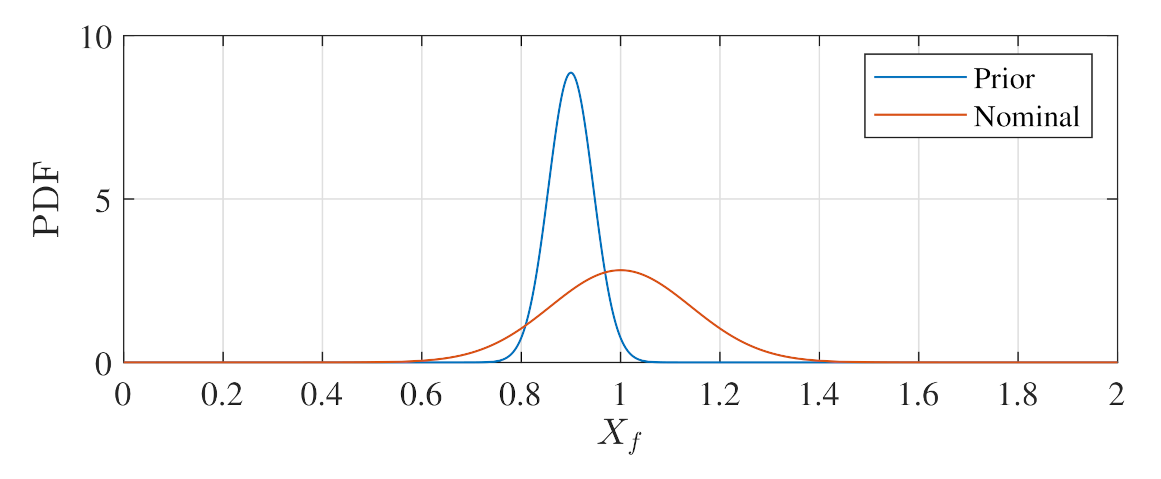
In the following, an illustrative example is presented for this application to new structures. Assume that, based on previous digital twins, we obtain a prior distribution function of quantified uncertainties, . This prior distribution can be regarded as the future (yet to be realized) distribution of the updated uncertainties and can be used already at the design stage.
For the sake of illustration, we assume that the future outcome of model updates can be modeled as , as depicted in Figure 13. The prior distribution is used together with model (1) to design the optimized structure. This is obtained by assuming that the generic structural dynamics and loading uncertainty are substituted with the expected uncertainty quantified based on the future experiment, . The decision models are derived based on (1), where, depending on the outcome of the model update, different values of are assumed. The values are summarized in Table 8. As a result, we derive an optimized structure, which has sufficient reliability until the intended lifetime is reached. This is indicated in Figure 14 by the blue curve. In the design, we have used the prior distribution of the updated uncertainty and assumed that updating the model is performed during the operation of the structure to confirm our expectation (obtain the posterior distribution). The point in time when updating the model must be performed can be derived by applying model (1) with the nominal uncertainty from Table 2, as shown in Figure 13 with the orange curve. Finally, we derive a point when the structure reaches the target reliability level and some action is needed to confirm its structural reliability. This is indicated by the orange curve in Figure 14.
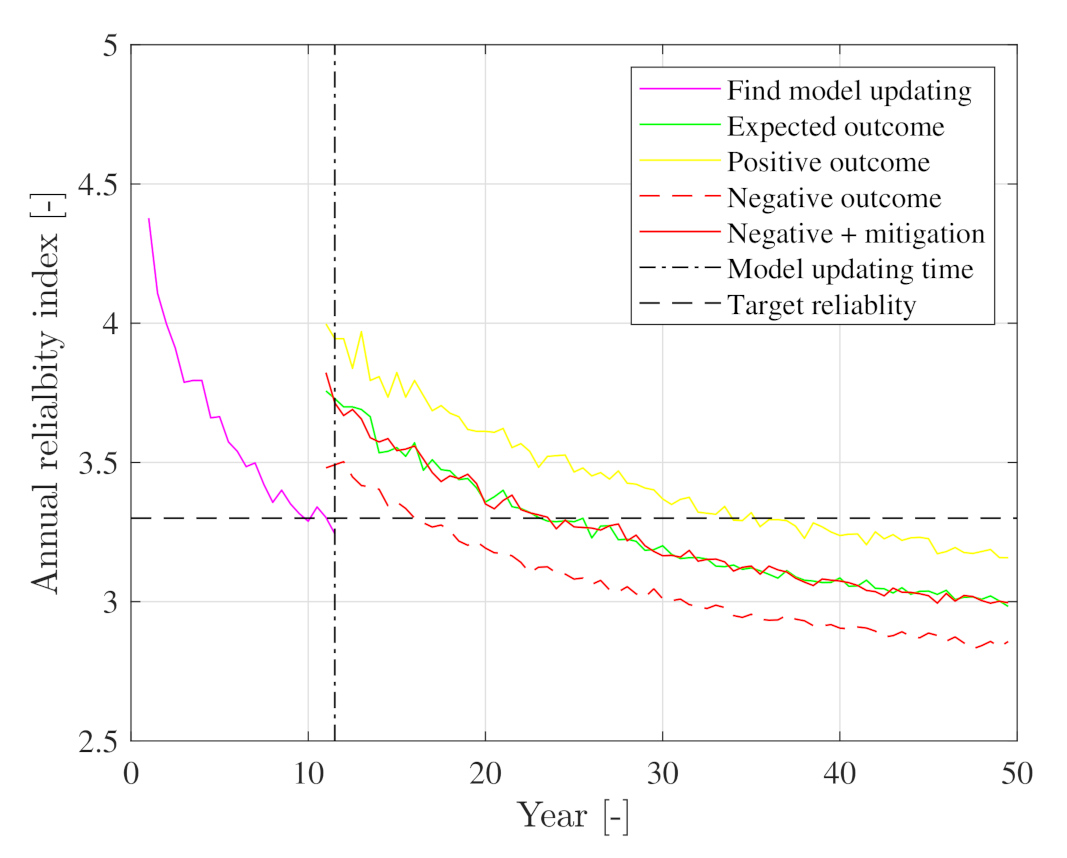
When the model update time is reached, updating of the model is performed. As a result of model update, we can obtain one of the three outcomes for , which will have an impact on the decision models, as depicted in Figure 15. In particular, we have the following potential outcomes:
- Most likely: the mean value of the derived model update is close to the mean value of the prior distribution assumed in the design stage, . In such a case, the structure is fit for operation for the intended lifetime and no further action is required. This scenario is indicated by the green line in Figure 15.
- Unlikely positive: the mean value is less than the value assumed in the design stage, . This results in a longer lifetime than expected and no further action is required. This scenario is indicated by the yellow line in Figure 15.
- Unlikely negative: the mean value is greater than the value assumed in the design stage, . This results in a shorter lifetime than expected and action is required to ensure a sufficient reliability during the intended lifetime of the structure. This scenario is indicated by the dashed red line in Figure 15.
Given the expected or positive outcome of updating the model is realized, no further action is required. However, if the outcome of updating the model is unexpectedly negative, the following mitigation actions can be considered to ensure the required level of reliability during the intended lifetime: (1) strengthening or (2) curtailing of the wind turbine (thereby reducing fatigue damage) and operating until the end of the intended lifetime. If it is economically infeasible to continue the operation of a particular turbine given the model updating outcome, one can consider premature decommissioning. The reliability level after the mitigation action is performed as indicated by the solid red line in Figure 15.
6. Conclusions
In this paper, we propose a probabilistic framework for updating structural reliability of offshore wind substructures based on new information from digital twins. The digital twin information is consistently included in the framework by updating the uncertainty related to structural dynamics and load modeling and propagating this uncertainty to the fatigue damage accumulation. The resulting uncertainty is then converted into uncertainty of the stress ranges, which is included in a probabilistic model on structural reliability. The proposed framework is applicable to offshore wind substructures whose lifetimes are governed by fatigue damage accumulation.
The framework is applied to two case studies, where the potential for improved decision models for existing and new structures is demonstrated. In the former case, updating soil stiffness and wave loading is considered to investigate the potential for lifetime extension of fatigue critical joints. In the latter case, the framework is applied to optimize new structures by using Bayesian pre-posterior theory for future wave load calibration.
Author Contributions
Conceptualization, D.A., M.D.U. and J.D.S.; methodology, D.A., M.D.U. and J.D.S.; formal analysis, D.A., M.D.U. and J.D.S.; writing—original draft preparation, D.A., M.D.U. and J.D.S.; writing—review and editing, D.A., M.D.U. and J.D.S. All authors have read and agreed to the published version of the manuscript.
Funding
Innovationsfonden: 8053-00146B; Rambøll Fonden: A0.
Institutional Review Board Statement
Not applicable.
Informed Consent Statement
Not applicable.
Data Availability Statement
The study does not report any data.
Acknowledgments
The work presented herein is financially supported by Ramboll Foundation, Ramboll Energy and Innovation Fund Denmark. The financial support is highly appreciated. The first author would like to thank colleagues from Ramboll for their continuous support.
Conflicts of Interest
The authors declare no conflict of interest.
References
- U.S. Department of Energy. 2018 Offshore Wind Technologies Market Report; Technical Report; U.S. Department of Energy: Washington, DC, USA, 2018.
- Wind Europe. Offshore Wind in Europe. Key Statistics 2020; Technical Report; Wind Europe: Brussels, Belgium, 2020. [Google Scholar]
- Global Wind Energy Council. Global Offshore Wind Report 2020; Technical Report; Global Wind Energy Council: Brussels, Belgium, 2020. [Google Scholar]
- Nielsen, J.S.; Tcherniak, D.; Ulriksen, M.D. A case study on risk-based maintenance of wind turbine blades with structural health monitoring. Struct. Infrastruct. Eng. 2021, 17, 302–318. [Google Scholar] [CrossRef]
- Grieves, M. Digital Twin: Manufacturing Excellence through Virtual Factory Replication; White Paper; Michael W. Grieves, LLC: Winooski, VT, USA, 2015. [Google Scholar]
- Grieves, M.; Vickers, J. Digital Twin: Mitigating Unpredictable, Undesirable Emergent Behavior in Complex Systems. In Transdisciplinary Perspectives on Complex Systems: New Findings and Approaches; Springer International Publishing: Cham, Switzerland, 2017; pp. 85–113. [Google Scholar] [CrossRef]
- Tygesen, U.; Jepsen, M.; Vestermark, J.; Dollerup, N.; Pedersen, A. The True Digital Twin Concept for Fatigue Re-Assessment of Marine Structures. In Proceedings of the ASME 2018 37th International Conference on Ocean, Offshore and Arctic Engineering OMAE2018, Madrid, Spain, 17–22 June 2018. [Google Scholar] [CrossRef]
- Pedersen, E.B.; Jørgensen, D.; Riber, H.J.; Ballani, J.; Vallaghé, S.; Paccaud, B. True Fatigue Life Calculation Using Digital Twin Concept and Operational Modal Analysis. In Proceedings of the Twenty-Ninth (2019) International Offshore and Polar Engineering Conference, Honolulu, HI, USA, 16–21 June 2019; Volume 1. [Google Scholar]
- Kritzinger, W.; Karner, M.; Traar, G.; Henjes, J.; Sihn, W. Digital Twin in manufacturing: A categorical literature review and classification. IFAC-PapersOnLine 2018, 51, 1016–1022. [Google Scholar] [CrossRef]
- Sivalingam, K.; Sepulveda, M.; Spring, M.; Davies, P. A Review and Methodology Development for Remaining Useful Life Prediction of Offshore Fixed and Floating Wind turbine Power Converter with Digital Twin Technology Perspective. In Proceedings of the 2018 2nd International Conference on Green Energy and Applications (ICGEA), Singapore, 24–26 March 2018; pp. 197–204. [Google Scholar] [CrossRef]
- DNVGL-ST-0262. Lifetime Extension of Wind Turbines; Technical Report; Det Norske Veritas Germanischer Lloyd: Høvik, Greater Oslo, Norway, 2016. [Google Scholar]
- DNVGL-ST-0263. Certification of Lifetime Extension of Wind Turbines; Technical Report; Det Norske Veritas Germanischer Lloyd: Høvik, Greater Oslo, Norway, 2016. [Google Scholar]
- IEC 61400-28 ED1. Wind Energy Generation Systems-Part 28: Through Life Management and Life Extension of Wind Power Assets (Committee Draft); Technical Report; International Electrotechnical Commission: Geneva, Switzerland, 2021. [Google Scholar]
- BSH-7005. Standard Design. Minimum Requirements Concerning the Constructive Design of Offshore Structures within the Exclusive Economic Zone (EEZ); Technical Report; Bundesamt für Seeschifffahrt und Hydrographie: Hamburg, Germany, 2015. [Google Scholar]
- Nielsen, J.S.; Sørensen, J.D. Bayesian Estimation of Remaining Useful Life for Wind Turbine Blades. Energies 2017, 10, 664. [Google Scholar] [CrossRef] [Green Version]
- Ziegler, L.; Muskulus, M. Fatigue reassessment for lifetime extension of offshore wind monopile substructures. J. Phys. Conf. Ser. 2016, 753, 092010. [Google Scholar] [CrossRef]
- Leser, P.E.; Warner, J.E.; Leser, W.P.; Bomarito, G.F.; Newman, J.A.; Hochhalter, J.D. A digital twin feasibility study (Part II): Non-deterministic predictions of fatigue life using in-situ diagnostics and prognostics. Eng. Fract. Mech. 2020, 229, 106903. [Google Scholar] [CrossRef]
- Mai, Q.A.; Weijtjens, W.; Devriendt, C.; Morato, P.G.; Rigo, P.; Sørensen, J.D. Prediction of remaining fatigue life of welded joints in wind turbine support structures considering strain measurement and a joint distribution of oceanographic data. Mar. Struct. 2019, 66, 307–322. [Google Scholar] [CrossRef]
- Augustyn, D.; Tygesen, U.T.; Ulriksen, M.D.; Sørensen, J.D. Data-Driven Design and Operation of Offshore Wind Structures. In Proceedings of the Twenty-Ninth (2019) International Offshore and Polar Engineering Conference, Honolulu, HI, USA, 16–21 June 2019; Volume 1, pp. 491–498. [Google Scholar]
- Straub, D. Reliability updating with equality information. Probabilistic Eng. Mech. 2011, 26, 254–258. [Google Scholar] [CrossRef] [Green Version]
- Zhang, R.; Mahadevan, S. Model uncertainty and Bayesian updating in reliability-based inspection. Struct. Saf. 2000, 22, 145–160. [Google Scholar] [CrossRef]
- Schneider, R.; Thöns, S.; Straub, D. Reliability analysis and updating of deteriorating systems with subset simulation. Struct. Saf. 2017, 64, 20–36. [Google Scholar] [CrossRef] [Green Version]
- Straub, D.; Faber, M.H. Risk based inspection planning for structural systems. Struct. Saf. 2005, 27, 335–355. [Google Scholar] [CrossRef]
- Sørensen, J.D. Framework for risk-based planning of operation and maintenance for offshore wind turbines. Wind Energy 2009, 12, 493–506. [Google Scholar] [CrossRef]
- Singh, M.; Markeset, T. A methodology for risk-based inspection planning of oil and gas pipes based on fuzzy logic framework. Eng. Fail. Anal. 2009, 16, 2098–2113. [Google Scholar] [CrossRef]
- Hevia-Koch, P.; Klinge Jacobsen, H. Comparing offshore and onshore wind development considering acceptance costs. Energy Policy 2019, 125, 9–19. [Google Scholar] [CrossRef]
- Netland, Ø.; Sperstad, I.B.; Hofmann, M.; Skavhaug, A. Cost-benefit Evaluation of Remote Inspection of Offshore Wind Farms by Simulating the Operation and Maintenance Phase. Energy Procedia 2014, 53, 239–247. [Google Scholar] [CrossRef] [Green Version]
- Ulriksen, M.D. Damage Localization for Structural Health Monitoring: An Exploration of Three New Vibration-Based Schemes. Ph.D. Dissertation, Aalborg University, Aalborg, Denmark, 2018. [Google Scholar]
- Simoen, E.; De Roeck, G.; Lombaert, G. Dealing with uncertainty in model updating for damage assessment: A review. Mech. Syst. Signal Process. 2015, 56–57, 123–149. [Google Scholar] [CrossRef] [Green Version]
- Nielsen, J.S.; Sørensen, J.D. Computational framework for risk-based planning of inspections, maintenance and condition monitoring using discrete Bayesian networks. Struct. Infrastruct. Eng. 2018, 14, 1082–1094. [Google Scholar] [CrossRef] [Green Version]
- Sørensen, J.D.; Toft, H.S. Safety Factors-IEC 61400-1 ed. 4-Background Document; Technical Report, DTU Wind Energy-E-Report-0066(EN); Technical University of Denmark (DTU): Lyngby, Denmark, 2014. [Google Scholar]
- Velarde, J.; Kramhøft, C.; Sørensen, J.D.; Zorzi, G. Fatigue reliability of large monopiles for offshore wind turbines. Int. J. Fatigue 2020, 134, 105487. [Google Scholar] [CrossRef]
- Augustyn, D.; Smolka, U.; Tygesen, U.T.; Ulriksen, M.D.; Sørensen, J.D. Data-Driven Model Updating of an Offshore Wind Jacket Substructure. Appl. Ocean. Res. 2020, 104, 102366. [Google Scholar] [CrossRef]
- Augustyn, D.; Pedersen, R.R.; Tygesen, U.T.; Ulriksen, M.D.; Sørensen, J.D. Feasibility of modal expansion for virtual sensing in offshore wind jacket substructures. Mar. Struct. 2021, 79, 103019. [Google Scholar] [CrossRef]
- Madsen, H.; Krenk, S.; Lind, N. Methods of Structural Safety, 2nd ed.; Dover Publications: New York, NY, USA, 2006. [Google Scholar]
- Tavner, P. Offshore Wind Turbines: Reliability, Availability and Maintenance; Institution of Engineering and Technology: Stevenage, UK, 2012. [Google Scholar]
- Arabian-Hoseynabadi, H.; Oraee, H.; Tavner, P. Failure Modes and Effects Analysis (FMEA) for wind turbines. Int. J. Electr. Power Energy Syst. 2010, 32, 817–824. [Google Scholar] [CrossRef] [Green Version]
- Nguyen, T.A.; Min, D.; Choi, E.; Lee, J.W. Dependability and Security Quantification of an Internet of Medical Things Infrastructure based on Cloud-Fog-Edge Continuum for Healthcare Monitoring using Hierarchical Models. IEEE Internet Things J. 2021. [Google Scholar] [CrossRef]
- Madsen, H.O.; Krenk, S.; Lind, N.C. Methods of Structural Safety; Courier Corporation: Washington, DC, USA, 2006. [Google Scholar]
- IEC-61400-1:2019. Wind Energy Generation Systems-Part 1: Design Requirements; Technical Report; International Electrotechnical Commission: Geneva, Switzerland, 2019. [Google Scholar]
- Szala, G.; Ligaj, B. Effect of the Exponent in the Description of Wöhler Fatigue Diagram on the Results of Calculations of Fatigue Life. Key Eng. Mat. 2014, 598, 231–236. [Google Scholar] [CrossRef]
- Naess, A.; Leira, B.; Batsevych, O. System reliability analysis by enhanced Monte Carlo simulation. Struct. Saf. 2009, 31, 349–355. [Google Scholar] [CrossRef]
- Hübler, C.; Gebhardt, C.G.; Rolfes, R. Methodologies for fatigue assessment of offshore wind turbines considering scattering environmental conditions and the uncertainty due to finite sampling. Wind Energy 2018, 21, 1092–1105. [Google Scholar] [CrossRef]
- Reynders, E.; Pintelon, R.; Roeck, G. Uncertainty bounds on modal parameters obtained from stochastic subspace identification. Mech. Syst. Signal Process. 2008, 22, 948–969. [Google Scholar] [CrossRef]
- Iliopoulos, A.; Weijtjens, W.; Van Hemelrijck, D.; Devriendt, C. Fatigue assessment of offshore wind turbines on monopile foundations using multi-band modal expansion. Wind Energy 2017, 20, 1463–1479. [Google Scholar] [CrossRef]
- Efthymiou, M.; Durkin, S. Stress concentrations in T/Y and gap/overlap K-joints. In Proceedings of the 4th International Conference on Behaviour of Offshore Structures, Delft, The Netherlands, 1–5 July 1985; p. 12. [Google Scholar]
- Lee, J.M.; Seo, J.K.; Kim, M.H.; Shin, S.B.; Han, M.S.; Park, J.S.; Mahendran, M. Comparison of hot spot stress evaluation methods for welded structures. Int. J. Nav. Archit. Ocean Eng. 2010, 2, 200–210. [Google Scholar] [CrossRef] [Green Version]
- DNVGL-RP-C203. Fatigue Design of Offshore Steel Structures; Technical Report; Det Norske Veritas Germanischer Lloyd: Høvik, Greater Oslo, Norway, 2016. [Google Scholar]
- Miner, M.A. Cumulative Damage in Fatigue. J. Appl. Mech. 2021, 12, A159–A164. [Google Scholar] [CrossRef]
- Paris, P.; Erdogan, F. A Critical Analysis of Crack Propagation Laws. J. Basic Eng. 1963, 85, 528–533. [Google Scholar] [CrossRef]
- Friswell, M.I.; Mottershead, J.E. Finite Element Model Updating in Structural Dynamics; Kluwer Ademic Publishers: Amsterdam, The Netherlands, 1995. [Google Scholar]
- Anderson, G. Error propagation by the Monte Carlo method in geochemical calculations. Geochim. Cosmochim. Acta 1976, 40, 1533–1538. [Google Scholar] [CrossRef]
- ISO 13587:2012. Three Statistical Approaches for the Assessment and Interpretation of Measurement Uncertainty; Technical Report; International Electrotechnical Commission: Geneva, Switzerland, 2012. [Google Scholar]
- Raiffa, H.; Schlaifer, R. Applied Statistical Decision Theory; Wiley & Sons: Hoboken, NJ, USA, 2000. [Google Scholar] [CrossRef]
- Nielsen, J.J.; Sørensen, J.D. On risk-based operation and maintenance of offshore wind turbine components. Reliab. Eng. Syst. Saf. 2011, 96, 218–229. [Google Scholar] [CrossRef]
- Onoufriou, T. Reliability based inspection planning of offshore structures. Mar. Struct. 1999, 12, 521–539. [Google Scholar] [CrossRef]
- Nielsen, M.B.; Jensen, J.F.; Harper, C.; Knudsen, L.S.; Pedersen, R.R. State-of-the-art framework for design of offshore wind jacket foundations. Steel Constr. 2019, 12, 209–214. [Google Scholar] [CrossRef]
- Craig, R.R.; Bampton, M.C.C. Coupling of substructures for dynamic analyses. AIAA J. 1968, 6, 1313–1319. [Google Scholar] [CrossRef] [Green Version]
- Nielsen, M.B.; Jensen, J.F.; Augustyn, D.; Pedersen, R.R. Efficient response recovery procedures for detailed design of jacket foundations. In Insights and Innovations in Structural Engineering, Mechanics and Computation, 1st ed.; Taylor & Francis: London, UK, 2016; Volume 1, pp. 2060–2065. [Google Scholar] [CrossRef]
- van der Valk, P.; Voormeeren, S. An overview of modeling approaches for complex offshore wind turbine support structures. In Proceedings of the ISMA2012-USD2012, Leuven, Belgium, 17–19 September 2012; pp. 1–4. [Google Scholar]
- Passon, P. Offshore Wind Turbine Foundation Design. Ph.D. Thesis, DTU Wind Energy: Roskilde, Denmark, 2015. [Google Scholar]
- Ramboll. ROSAP-Ramboll Offshore Structural Analysis Package, Version 53; Technical Report; Ramboll: Esbjerg, Denmark, 2018. [Google Scholar]
- API-RP-2A. Recommended Practice for Planning, Designing and Constructing Fixed Offshore Platforms; Technical Report; American Petroleum Institute: Washington, DC, USA, 2014. [Google Scholar]
- Liu, M.; Gorman, D. Formulation of Rayleigh damping and its extensions. Comput. Struct. 1995, 57, 277–285. [Google Scholar] [CrossRef]
- Ramboll. LACflex-Aeroelastic Simulation Tool; Technical Report; Ramboll: Aarhus, Denmark, 2018. [Google Scholar]
- Augustyn, D.; Cosack, N.; Ulriksen, M. On the influence of environmental and operational variability on modal parameters of offshore wind support structures. Mar. Struct. 2021. submitted. [Google Scholar]
- Kelma, S.; Schaumann, P. Probabilistic Fatigue Analysis of Jacket Support Structures for Offshore Wind Turbines Exemplified on Tubular Joints. Energy Procedia 2015, 80, 151–158. [Google Scholar] [CrossRef] [Green Version]
- Anonymous. Met-Ocean Report; Technical Report; Confidential Publisher: New York, NY, USA, 2016. [Google Scholar]
- Rasmus Folsø, S.O.; Parmentier, G. Reliability-based calibration of fatigue design guidelines for ship structures. Mar. Struct. 2002, 15, 627–651. [Google Scholar] [CrossRef]
- Sørensen, J. Reliability-based calibration of fatigue safety factors for offshore wind turbines. Int. J. Offshore Pol. Eng. 2012, 22, 234–241. [Google Scholar]
- JCSS. Probabilistic Model Code; Technical Report; Joint Committee on Structural Safety: Copenhagen, Denmark, 2001. [Google Scholar]
Figure 1.
Stochastic variables modeling uncertainty in fatigue damage accumulation. The stochastic variables from the probabilistic model (1) are represented by separate boxes. The light blue boxes indicate stochastic variables estimated based on generic, design-based recommendations. The dark blue boxes indicate stochastic variables that can be quantified and updated based on new information from a digital twin.

Figure 2.
Structural reliability updating framework based on information from a digital twin. Updated parameters from the digital twin are used to quantify uncertainty in fatigue damage accumulation. Subsequently, the structural reliability is updated.
Figure 2.
Structural reliability updating framework based on information from a digital twin. Updated parameters from the digital twin are used to quantify uncertainty in fatigue damage accumulation. Subsequently, the structural reliability is updated.

Figure 3.
Substructure model used in the case studies. (A) Side view, (B) side view with indication of levels (blue circles indicate joints analyzed in the case studies) and (C) top view with indication of directions, side and leg names. NB: a wind turbine model is not shown in the figure.
Figure 3.
Substructure model used in the case studies. (A) Side view, (B) side view with indication of levels (blue circles indicate joints analyzed in the case studies) and (C) top view with indication of directions, side and leg names. NB: a wind turbine model is not shown in the figure.

Figure 4.
Structural reliability as function of time for the nominal model.

Figure 5.
Impact of updating soil stiffness on structural reliability-joint 13CU.

Figure 6.
Impact of updating soil stiffness on structural reliability-joint 40BU.

Figure 7.
Structural reliability after the soil stiffness update. ( update based on the study in [33]).
Figure 7.
Structural reliability after the soil stiffness update. ( update based on the study in [33]).

Figure 8.
Impact of updating wave loading on structural reliability-joint 13CU.

Figure 9.
Fatigue lifetime derived for different distributions of -joint 40BU.

Figure 10.
Impact of updating wave loading based on uncertain virtual sensing methods-40BU.

Figure 11.
Impact of updating wave loading based on uncertain virtual. sensing methods-13CU.

Figure 12.
Impact of and correlation on structural reliability.

Figure 13.
Stochastic model for pre-posterior design.

Figure 14.
Benefit of including pre-posterior design (including prior knowledge on ).

Figure 15.
Pre-posterior design at inspection time.


Table 1.
Load case definitions according to IEC [40] and representative site-specific parameters.
Table 1.
Load case definitions according to IEC [40] and representative site-specific parameters.
| Turbine State | DLC | Wind Speed, U (ms) | Turbulence, TI (-) | Wave Height, (m) | Wave Period, (s) | Direction (deg) |
|---|---|---|---|---|---|---|
| Operational | 1.2 | 4–31 | 0.31–0.09 | 0.1–7.9 | 3.0–9.6 | 0–330 |
Table 2.
Variables used in the probabilistic model to estimate fatigue damage accumulation in the nominal case [32].
Table 2.
Variables used in the probabilistic model to estimate fatigue damage accumulation in the nominal case [32].
| Variable | Distribution | Mean | CoV | Std. Dev. | Ref. |
|---|---|---|---|---|---|
| N | 1.00 | 0.30 | N/A | [69] | |
| log | N | 12.58 | N/A | 0.20 | [48] |
| log | N | 16.53 | N/A | 0.20 | [48] |
| log | N | 12.88 | N/A | 0.20 | [48] |
| log | N | 16.53 | N/A | 0.20 | [48] |
| D | 3 | N/A | N/A | [48] | |
| D | 5 | N/A | N/A | [48] | |
| LN | 1.00 | 0.10 | N/A | [31] | |
| LN | 1.00 | 0.10 | N/A | [70,71] | |
| LN | 1.00 | 0.05 | N/A | [70] |
Distribution: N-normal, LN-logNormal, D-deterministic.
Table 3.
Fatigue lifetime derived based on probabilistic model (1) and stochastic variables presented in Table 2.
| Joint | Fatigue Lifetime (Years) |
|---|---|
| 50CL | >100 |
| 50BL | >100 |
| 40CL | 54 |
| 40BL | 77 |
| 40CU | >100 |
| 40BU | 25 |
| 13CU | 27 |
| 13BU | >100 |
| 25BL | 98 |
| 25BU | 86 |
Table 4.
Fatigue lifetime derived for different distributions of .
| 13CU | 40BU | |||||
|---|---|---|---|---|---|---|
| CoV | Lifetime | CoV | Lifetime | |||
| 0.50 | 1.20 | 0.10 | 7 | 0.98 | 0.10 | 26 |
| 0.75 | 1.10 | 0.10 | 15 | 0.99 | 0.10 | 25 |
| 1.00 | 1.00 | 0.10 | 25 | 1.00 | 0.10 | 25 |
| 1.25 | 0.90 | 0.10 | 85 | 1.01 | 0.10 | 25 |
| 1.50 | 0.80 | 0.10 | >100 | 1.02 | 0.10 | 24 |
| 2.00 | 0.70 | 0.10 | >100 | 1.04 | 0.10 | 22 |
Table 5.
Effect of updating soil stiffness on fatigue lifetime.
| Joint | CoV | Lifetime (Years) | Compared to Table 3 | |
|---|---|---|---|---|
| 50CL | 0.98 | 0.004 | >100 | N/A |
| 50BL | 0.98 | 0.005 | >100 | N/A |
| 40CL | 1.04 | 0.004 | 62 | +8 |
| 40BL | 1.07 | 0.006 | 69 | −8 |
| 40CU | 1.05 | 0.003 | >100 | N/A |
| 40BU | 0.98 | 0.005 | 44 | +19 |
| 13CU | 0.65 | 0.058 | >100 | + |
| 13BU | 0.56 | 0.057 | >100 | N/A |
| 25BL | 0.90 | 0.013 | >100 | + |
| 25BU | 0.92 | 0.012 | >100 | + |
Table 6.
Fatigue lifetime derived for different distributions of .
| 13CU | 40BU | |||||
|---|---|---|---|---|---|---|
| CoV | Lifetime | CoV | Lifetime | |||
| 1.2 | 1.06 | 0.10 | 17 | 1.20 | 0.10 | 7 |
| 1.1 | 1.03 | 0.10 | 21 | 1.10 | 0.10 | 12 |
| 1.0 | 1.00 | 0.10 | 25 | 1.00 | 0.10 | 25 |
| 0.9 | 0.97 | 0.10 | 33 | 0.90 | 0.10 | 55 |
| 0.8 | 0.94 | 0.10 | 42 | 0.80 | 0.10 | >100 |
Table 7.
Fatigue lifetime updated based on various uncertain wave loading calibration methods. distribution is updated (mean and CoV).
Table 7.
Fatigue lifetime updated based on various uncertain wave loading calibration methods. distribution is updated (mean and CoV).
| Configuration | 13CU | 40BU | ||||
|---|---|---|---|---|---|---|
| CoV | Lifetime | CoV | Lifetime | |||
| Nominal | 1.00 | 0.10 | 25 | 1.00 | 0.10 | 25 |
| Basic | 0.97 | 0.14 | 22 | 0.90 | 0.14 | 40 |
| Extended | 0.97 | 0.11 | 30 | 0.90 | 0.11 | 50 |
| Direct sensing | 0.97 | 0.10 | 35 | 0.90 | 0.10 | 60 |
Table 8.
Pre-posterior stochastic model.
| Case | CoV | Comment | Information | |
|---|---|---|---|---|
| Pre-posterior design | 0.9 | 0.05 | Prior knowledge on | Generic design |
| Determine model update time | 1.0 | 0.14 | Using no extra information from digital twin | Generic design |
| Model updating (expected outcome) | 0.9 | 0.05 | The same as prior knowledge, lifetime as expected, no action | Digital twin |
| Model updating (positive outcome) | 0.85 | 0.05 | Positive outcome, longer lifetime than expected, potential for lifetime extension | Digital twin |
| Model updating (negative outcome) | 0.95 | 0.05 | Negative outcome, shorter lifetime than expected | Digital twin |
| Model updating (negative outcome + mitigation) | 0.9 | 0.05 | Mitigation (extra cost) required, after mitigation expected (or longer) lifetime achieved | Digital twin + mitigation |
Publisher’s Note: MDPI stays neutral with regard to jurisdictional claims in published maps and institutional affiliations. |
© 2021 by the authors. Licensee MDPI, Basel, Switzerland. This article is an open access article distributed under the terms and conditions of the Creative Commons Attribution (CC BY) license (https://creativecommons.org/licenses/by/4.0/).
Share and Cite
MDPI and ACS Style
Augustyn, D.; Ulriksen, M.D.; Sørensen, J.D. Reliability Updating of Offshore Wind Substructures by Use of Digital Twin Information. Energies 2021, 14, 5859. https://0-doi-org.brum.beds.ac.uk/10.3390/en14185859
AMA Style
Augustyn D, Ulriksen MD, Sørensen JD. Reliability Updating of Offshore Wind Substructures by Use of Digital Twin Information. Energies. 2021; 14(18):5859. https://0-doi-org.brum.beds.ac.uk/10.3390/en14185859
Chicago/Turabian StyleAugustyn, Dawid, Martin D. Ulriksen, and John D. Sørensen. 2021. "Reliability Updating of Offshore Wind Substructures by Use of Digital Twin Information" Energies 14, no. 18: 5859. https://0-doi-org.brum.beds.ac.uk/10.3390/en14185859
Note that from the first issue of 2016, this journal uses article numbers instead of page numbers. See further details here.