
Criticality Analysis and Maintenance of Solar Tower Power Plants by Integrating the Artificial Intelligence Approach


1
Laboratoire Energétique—Mécanique & Ingénieries (LEMI), Université M’Hamed Bougara de Boumerdes, Boumerdes 35000, Algeria
2
School of Engineering, University of Greenwich, Kent ME4 4TB, UK
*
Author to whom correspondence should be addressed.
Energies 2021, 14(18), 5861; https://0-doi-org.brum.beds.ac.uk/10.3390/en14185861
Submission received: 3 July 2021
/
Revised: 23 August 2021
/
Accepted: 13 September 2021
/
Published: 16 September 2021
(This article belongs to the Special Issue Maintenance Management in Solar Energy Systems)
Abstract
:Maintenance of solar tower power plants (STPP) is very important to ensure production continuity. However, random and non-optimal maintenance can increase the intervention cost. In this paper, a new procedure, based on the criticality analysis, was proposed to improve the maintenance of the STPP. This procedure is the combination of three methods, which are failure mode effects and criticality analysis (FMECA), Bayesian network and artificial intelligence. The FMECA is used to estimate the criticality index of the different elements of STPP. Moreover, corrections and improvements were introduced on the criticality index values based on the expert advice method. The modeling and the simulation of the FMECA estimations incorporating the expert advice method corrections were performed using the Bayesian network. The artificial neural network is used to predicate the criticality index of the STPP exploiting the database obtained from the Bayesian network simulations. The results showed a good agreement comparing predicted and actual criticality index values. In order to reduce the criticality index value of the critical elements of STPP, some maintenance recommendations were suggested.
1. Introduction
The growth of industries in several parts of the world has positively affected the increasing demand for electrical energy. Power plants are classified as the important basic unit of power systems and are responsible for producing energy to be transmitted and distributed to end customers. Electricity generation has to be conducted in the most efficient way, safe, at minimal cost and in a reliable manner. The effective maintenance of the power station is highly needed to achieve these goals and to ensure sufficient electricity is supplied to the customers. If the power plants are not well-taken care of and are not reliable to be operated, a significant amount of damages would be possibly imposed to the society as a sequence of power shortages.
Several papers were published on the maintenance of conventional thermal power stations [1]. Das et al. [2] diagnosed the turbine blade failure in a thermal power plant. As a result, they found that probably the ultimate failure was due to corrosion fatigue. Lee et al. [3] presented a failure analysis of a boiler in an ultra-supercritical coal power plant. From those investigations, the creep rupture may be caused by the softened structure induced by carbide coarsening and accelerated by the metal temperature increment by the impediment of heat transfer due to voids. Luo and Zhang [4] provided a brief study on the leakage causes and corresponding preventive measures for the power plant boilers. However, according to the authors’ knowledge, little work was found in the literature on the maintenance and fault analysis of STPP. Benammar and Khellaf [5] analyzed the performance and the reliability of STPP using either analytical and artificial intelligence (AI) methods. The authors also published another work [6] on the reliability of STPP taking into account the uncertainties in the parameters of the system design. Benammar and Tee [7,8] estimated the failure probability of the heliostat systems under wind loads. They found that, for the same material investment, the design and dimensions of the heliostat unit may affect its failure probability.
It can be known from all the published papers that the maintenance of power plants is very important to ensure the continuity of electricity production. However, it is important to pay attention to the maintenance cost, which must be as minimum as possible [9]. Efficient criticality analysis and good diagnosis are the main factors in minimizing this maintenance cost. Therefore, combining the strong points (advantages) of different methods seems to be a good idea.
Failure mode effects and criticality analysis (FMECA) is one of the most widely used methods to analyze the failure modes in industrial systems. It is a very flexible method; consequently, it can also be applied to solar power plants. It focuses on identifying failure modes in the system and enables prioritization of the risk for recommending corrective actions [10]. On the other hand, failure data are missing due to confidentiality controls and the short history of CSP facilities. In addition, the formula used to estimate the risk priority number (RPN) for each failure mode, which is based on the multiplication of three indices called severity, occurrence and detectability, can sometimes lead to an underestimation or overestimation of this RPN. The risk prioritization is based on the RPN score [11]. The most critical disadvantage of the traditional FMECA is that it gives several failure modes the same RPN value, and it poses difficulty in prioritization. In fact, they might have different risk implications, but traditional FMECA assigns equal priority for them. This problem is due to the assumption used in the RPN method, i.e., it assumes the three failure mode indexes are equally weighted [12]. The only way to resolve this issue is to call for expert advice. However, seeking expert advice for each failure analysis requires sufficient time and additional cost, especially for complex systems. The solution is to find a new method that allows combining FMECA analysis with expert advice, but this new method must be applied only once to reduce the cost of analysis. Artificial intelligence (AI) methods can be a good candidate for solving this problem as they have an important learning capacity. Artificial Neural Networks (ANN) is one of the methods of artificial intelligence that was used to analyze the failure of industrial systems, especially conventional power plants [13]. On the other hand, the ANN method was used by several authors in the field of solar energy; for modeling and design of a solar steam generating plant, for the estimation of a parabolic-trough collector’s intercept factor and local concentration ratio, and for the modeling and performance prediction of solar water-heating systems [14,15,16], for prediction of solar irradiance [17,18], for the modeling of the solar collectors [18,19] and the modeling of STPP receivers [20].
In this article, a criticality analysis was performed to provide an efficient and correct decision regarding the maintenance of STPP. The criticality indices of different elements of the STPP subsystems were calculated using FMECA. Bayesian network (BN) was used to model and simulate the different scenarios of the STPP criticality, taking into account the expert knowledge. The database obtained from the BN simulation was used to train an ANN to predicate the STPP criticality. Recommendations regarding the maintenance actions to be taken into account for the STPP were proposed to reduce its criticality index.
2. Solar Tower Power Plant
As shown in Figure 1, solar tower power plants use hundreds to thousands of large, sun-tracking flat heliostats (mirrors) to concentrate sunlight onto a receiver placed on top of a tall tower. Computer-controlled heliostats track the sun and reflect the sunlight to the receiver. The complete group of heliostats is called the collector field. The collected solar radiation is converted to heat in the receiver via a heat transfer fluid (HTF). The energy in the HTF must be transferred to water/steam by means of heat exchangers before being used to generate electricity in the turbine generator [21].
Molten salt is the most used fluid not only as heat transfer fluid but also as storage fluid. Power tower systems would use molten salt primarily because of its superior heat transfer and energy-storage capabilities. Molten salt is typically a mixture of sodium nitrate, potassium nitrate, calcium nitrate and/or lithium nitrate. By means of storage tanks, the molten salt is stored so that it can be used in the absence of sunlight. Molten salt is the most suitable HTF for tower systems because it can withstand higher temperatures. As a result, the efficiency of the turbine can be improved by 2.4%. The capacity of the storage tank needed to meet the power distribution requirements must be optimized when designing the central receiver [22,23].
2.1. Collector Subsystem
The collector subsystem (CS) is composed of hundreds of heliostats. The role of the heliostat is to collect the sunlight and reflect it to a receiver. The heliostat follows the movement of the sun thanks to electric motors. These are regulated and controlled to make the mirror turn following the sun’s trajectory during the 365 days of the year.
In most cases, the heliostat consists of a support structure (pedestal); a torque tube; a mirror and its support, electrical and electronic devices; and a drive mechanism. The pedestal is a column fixed on soil; its role is to support the mirror. The mirror contains different layers of materials and can take many forms depending on the type of technology. The reflecting layer of a heliostat is usually a thin and low-iron glass mirror. The mirror turns on the pedestal by means of a gearing system.
2.2. Receiver Subsystem
The receiver subsystem is a heat exchanger that is used to convert the solar energy reflected from the collector into thermal energy. When sunlight reaches the surface of the receiver, it heats the receiver wall. As the FTH passes through the tubes in the wall, it absorbs some of the solar energy while the other part is lost to the atmosphere by convection and emission. This energy will be transported by the FTH into the hot fluid storage tank. The design of the receiver must take into account the heat losses and mitigate them as much as possible. Three main central receiver designs regarding the heat transfer fluid were studied: solid particle receivers, gas receivers and liquid receivers. This last category (liquid receivers) is mostly used [20,23].
2.3. Thermal Storage Subsystem
The thermal storage subsystem (TSS) is one of the most practiced technologies to store energy in the form of heat to eliminate the gap between the energy supply and demand. Thermal energy can be stored in three different ways: sensible heat based on temperature change, latent heat by phase change and thermochemical heat.
The storage process usually relies on two different tanks: one for the hot fluid and one for the cold fluid. The hot tank receives the HTF from the high-temperature receiver. Then, the HTF leaves the hot tank to the steam generator subsystem, where it will exchange its energy with water and decrease its temperature. Therefore, the low-temperature HTF will be led into the cold tank for storage. From this tank, the cold fluid is transported to the receiver to be heated again.
2.4. Steam Generator Subsystem (SGS)
The steam generator subsystem is another exchanger whose role is to transfer heat from the HTF to the working fluid (water). The low-temperature working fluid absorbs the thermal heat given by the HTF to generate superheated steam at 552 °C. In this case, the thermal energy of the steam can be converted into kinetic energy in the pipe. The kinetic energy is used to drive the turbine to produce mechanical energy on the turbine shaft. The turbine is directly coupled to a power generator for electricity production.
3. Criticality Assessment of the Different Parts of STPP
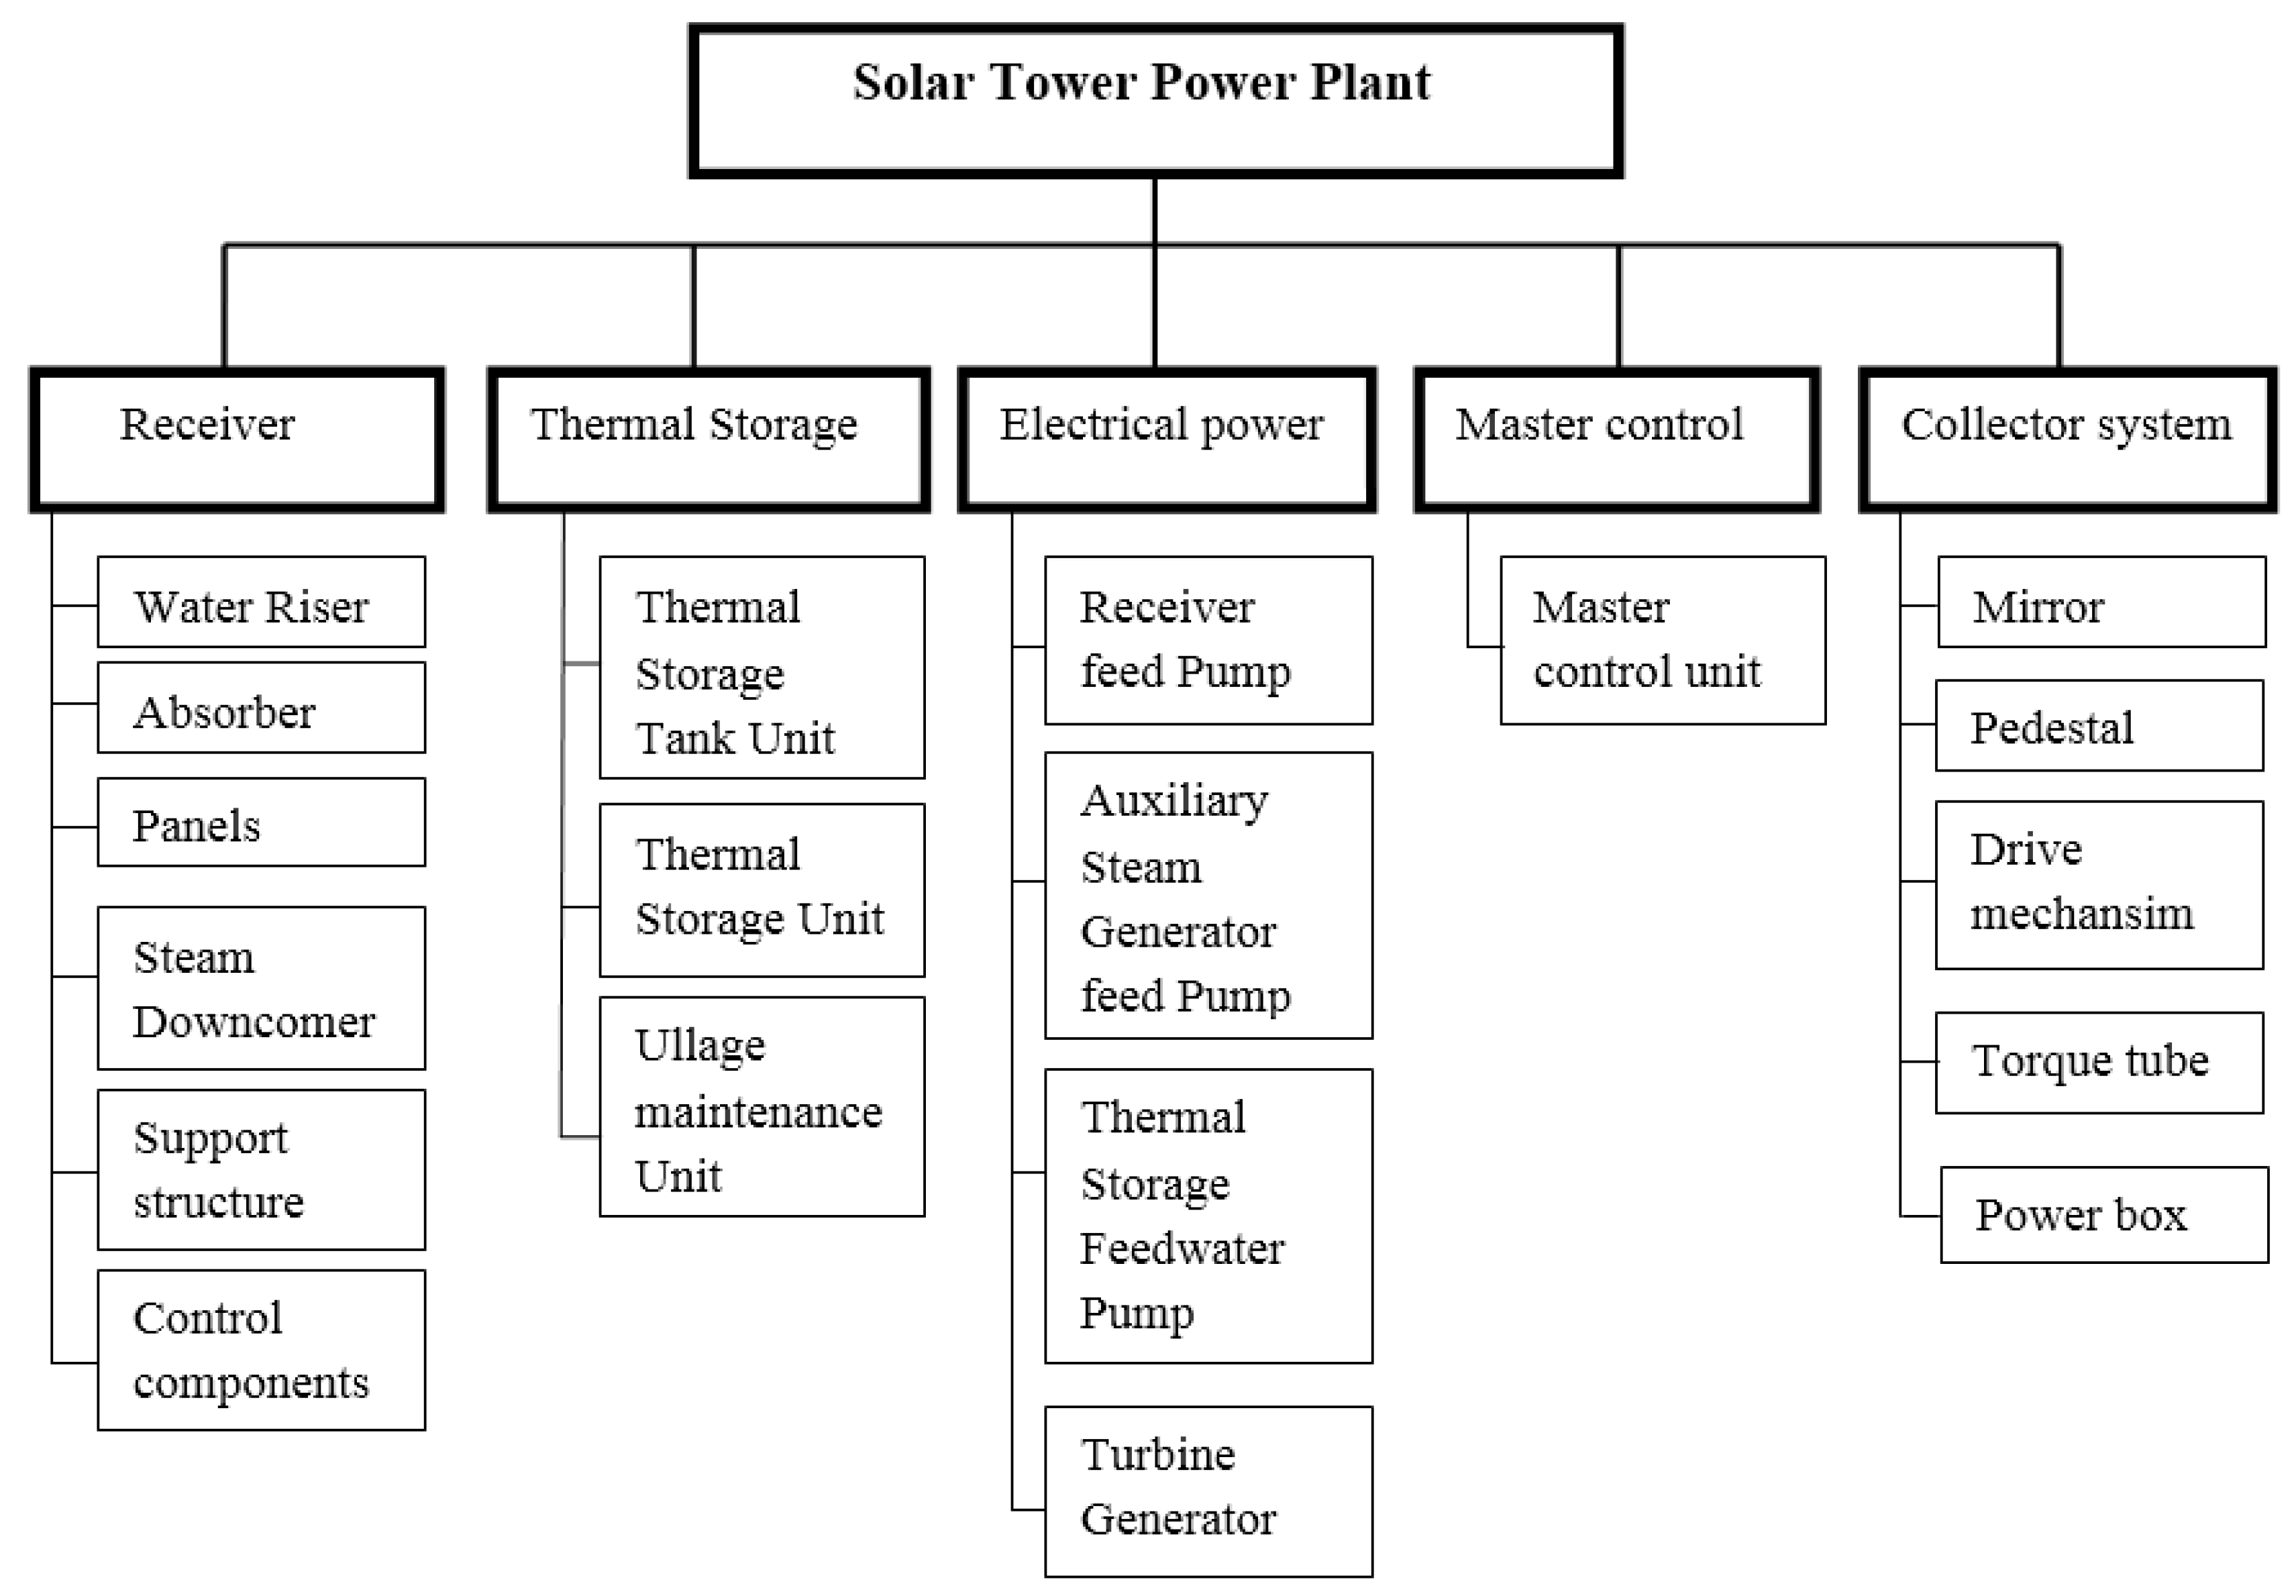
The STPP system is composed of five main subsystems, and each of these subsystems is composed of several components (elements), as shown schematically in Figure 2.
3.1. Failure Mode Effects and Criticality Analysis (FMECA)
FMECA is a qualitative and inductive method aimed at identifying the risks of potential failures contained in a draft product or system, regardless of the technologies, to eliminate or control them.
Each identified failure mode will be characterized by its criticality index:
CI = S × O × D
- -
- S is the severity index. It is evaluated from the failure effects by an estimated score of 1 (minor) to 5 (catastrophic). Depending on the system, the “relative” severity can be estimated on several criteria: safety of people, goods, quality of defects, loss of availability, penalization of production, etc.;
- -
- O is the occurrence index. It is evaluated from the probabilities of the failure causes by an estimated score of 1 (improbable) to 5 (frequent). It is sometimes possible to match these indices to numerical values. For example, estimate O as a function of the failure rate λ expressed in failure per hour according to Table 1;
- -
- D is the non-detectability index. It is assessed from the failure mode by an estimated score ranging from 1 (degradation) to 4 (sudden failure).
In this case, CI will be between 1 × 1 × 1 = 1 and 5 × 5 × 4 = 100. The criticality index is used to establish the order of priority (RPN) of the corrective actions to be taken. To illustrate the use of FMECA for the STPP systems, a hypothetical STPP was proposed. The different subsystems and components of this STPP are presented in Figure 2. Table 2, Table 3, Table 4, Table 5 and Table 6 show the FMECA analysis of the different subsystems. The most important issue when using the FMECA is the lack of reliable and complete failure data, which are limited due to confidentiality control and the short history of STPP facilities. In order to overtake this lack of data, different sources were involved, such as domain knowledge, similarity with conventional power plants and some scientific references. As presented at the beginning of this section, the major goal of FMECA is to identify the risks of potential failures contained in a draft product by evaluating its CI and then eliminating or controlling them. This means that the system may need improvement if its CI is relatively high. This improvement is either intrinsic if the failure mode is related to the design or extrinsic when the failure is associated with the preventive maintenance operations. It is also important to know that the FMECA is useful for the first stage of the system development (conception phase) or when the system is in operation (operational phase). In this study, the STPP is supposed to be in operational mode. Therefore, FMECA is provided to improve the STPP design and the applied preventive maintenance. The first FMECA scenario, before taking into account the improvement actions, is presented in Table 2, Table 3, Table 4, Table 5 and Table 6. However, the second part related to the design improvements is presented separately in Section 5.
3.2. Expert Advice Method
The expert advice method or expert knowledge method (EAM) is based on expert suggestions. This phase is performed by interviewing experts about the different results given by FMECA. Therefore, EAM is used to resolve the problem of the difficulty in prioritization (RPN) posed by FMECA. EAM is only applied for the most critical failure mode and for the elements, which represent the same CI to reduce the time and the cost of the analysis. In this case, a new RPN will be affected by each CI. The procedure of EAM prioritization are summarized in these main steps:
- Select only the most critical failure modes from FMECA tables;
- Select the elements that have the same CI or the same FMECA priority;
- The components with the same CI and have a maximum severity index (S) are in the priority; for example, the components from 7 to 12 take priority over component 13;
- The components with the same CI and the same S are classified according to their accessibility in maintenance. The component that has less access for the maintenance operator or that requires more time and more tools for maintenance is ranked as the priority. For example, component 8 will be in the priority than components 7, 9, 10, 11 and 12; because the latter is more accessible in terms of their maintenance;
- The components that have the same S and the largest detectability index (D) are ranked in the priority. For example, component 6 is ranked before component 5 because it has the largest D.
Table 7 represents the new prioritization of the different STPP components using EAM.
4. Criticality Assessment and Prediction of the Whole System (STPP)
The criticality of the whole system (STPP) is assessed and predicted using the Bayesian network (BN) and artificial neural network (ANN), respectively. These two methods are well detailed in the following sections.
4.1. Bayesian Network
Bayesian networks are a graphical architecture that contains more than one node connected to each other. Each node represents a variable and corresponds to a probability value. The calculation of conditional probabilities between the different nodes is based on Bayesian theory [29]. Generally, the Bayesian formula is written as [30,31]:
where is the posterior probability, is the conditional probability density function, is the prior probability and is the probability of the event x.
4.1.1. Construction of a Bayesian Network Model for the STPP
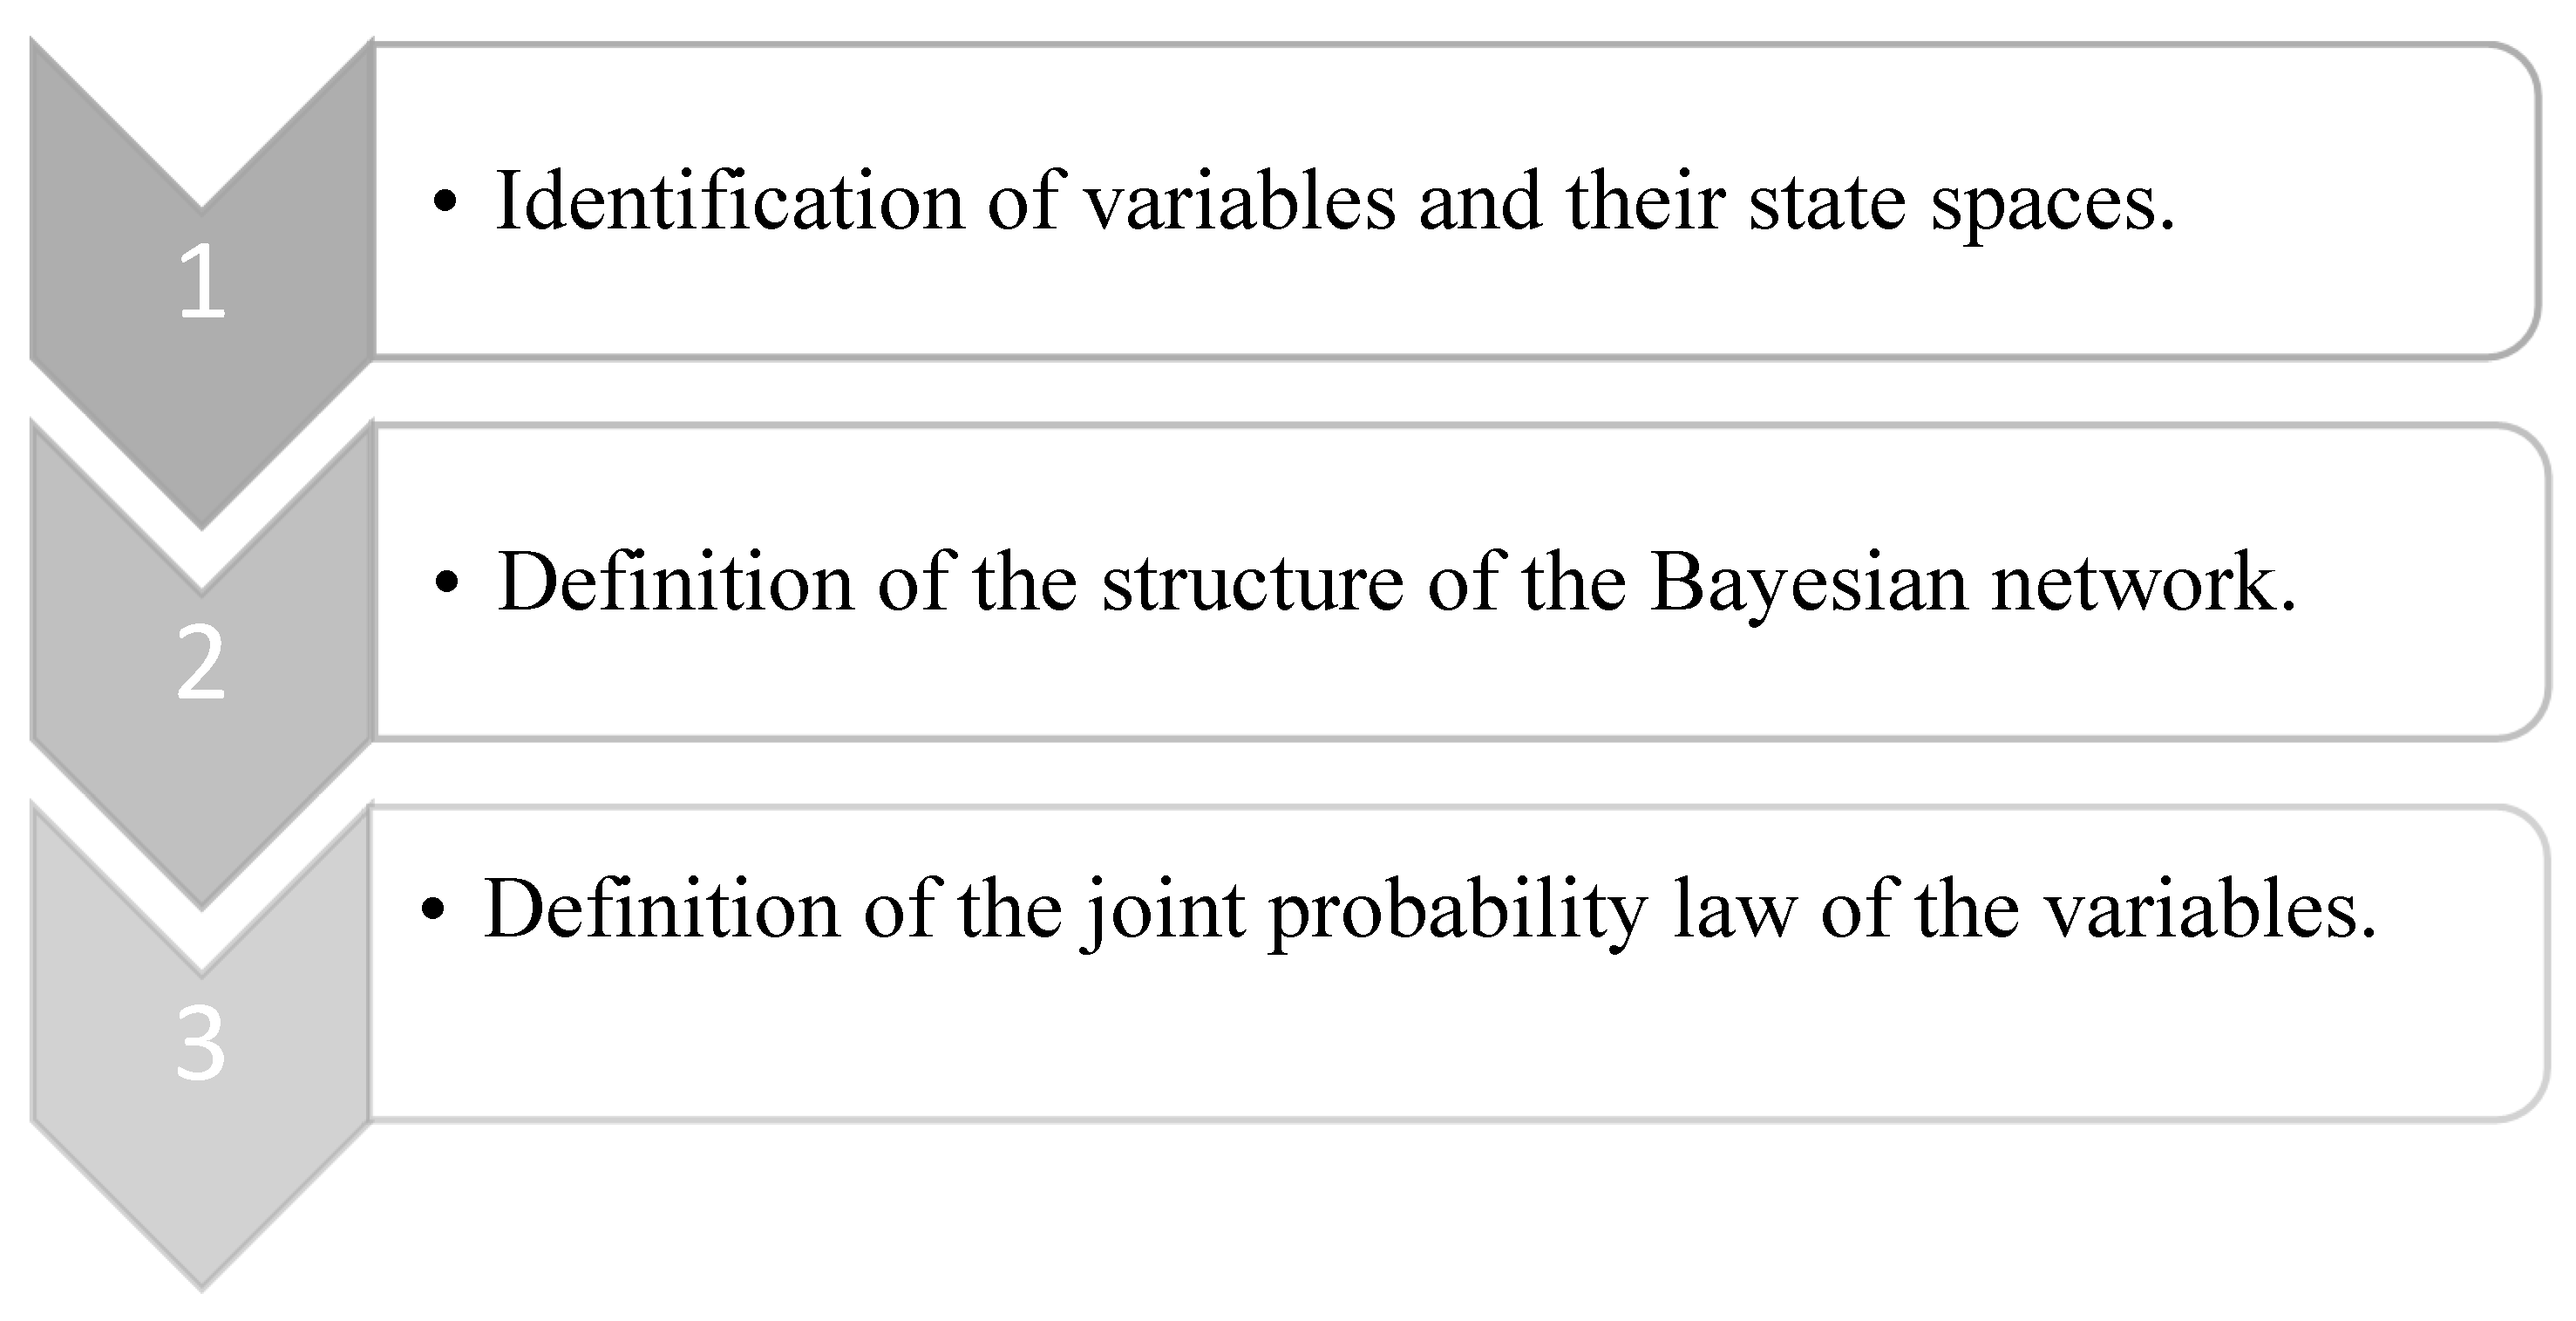
There are three basic steps to building a Bayesian network, which are shown in Figure 3. Each of the three steps may involve gathering expertise through written questionnaires, individual interviews, or brainstorming sessions (consisting of generating new ideas in a group activity).
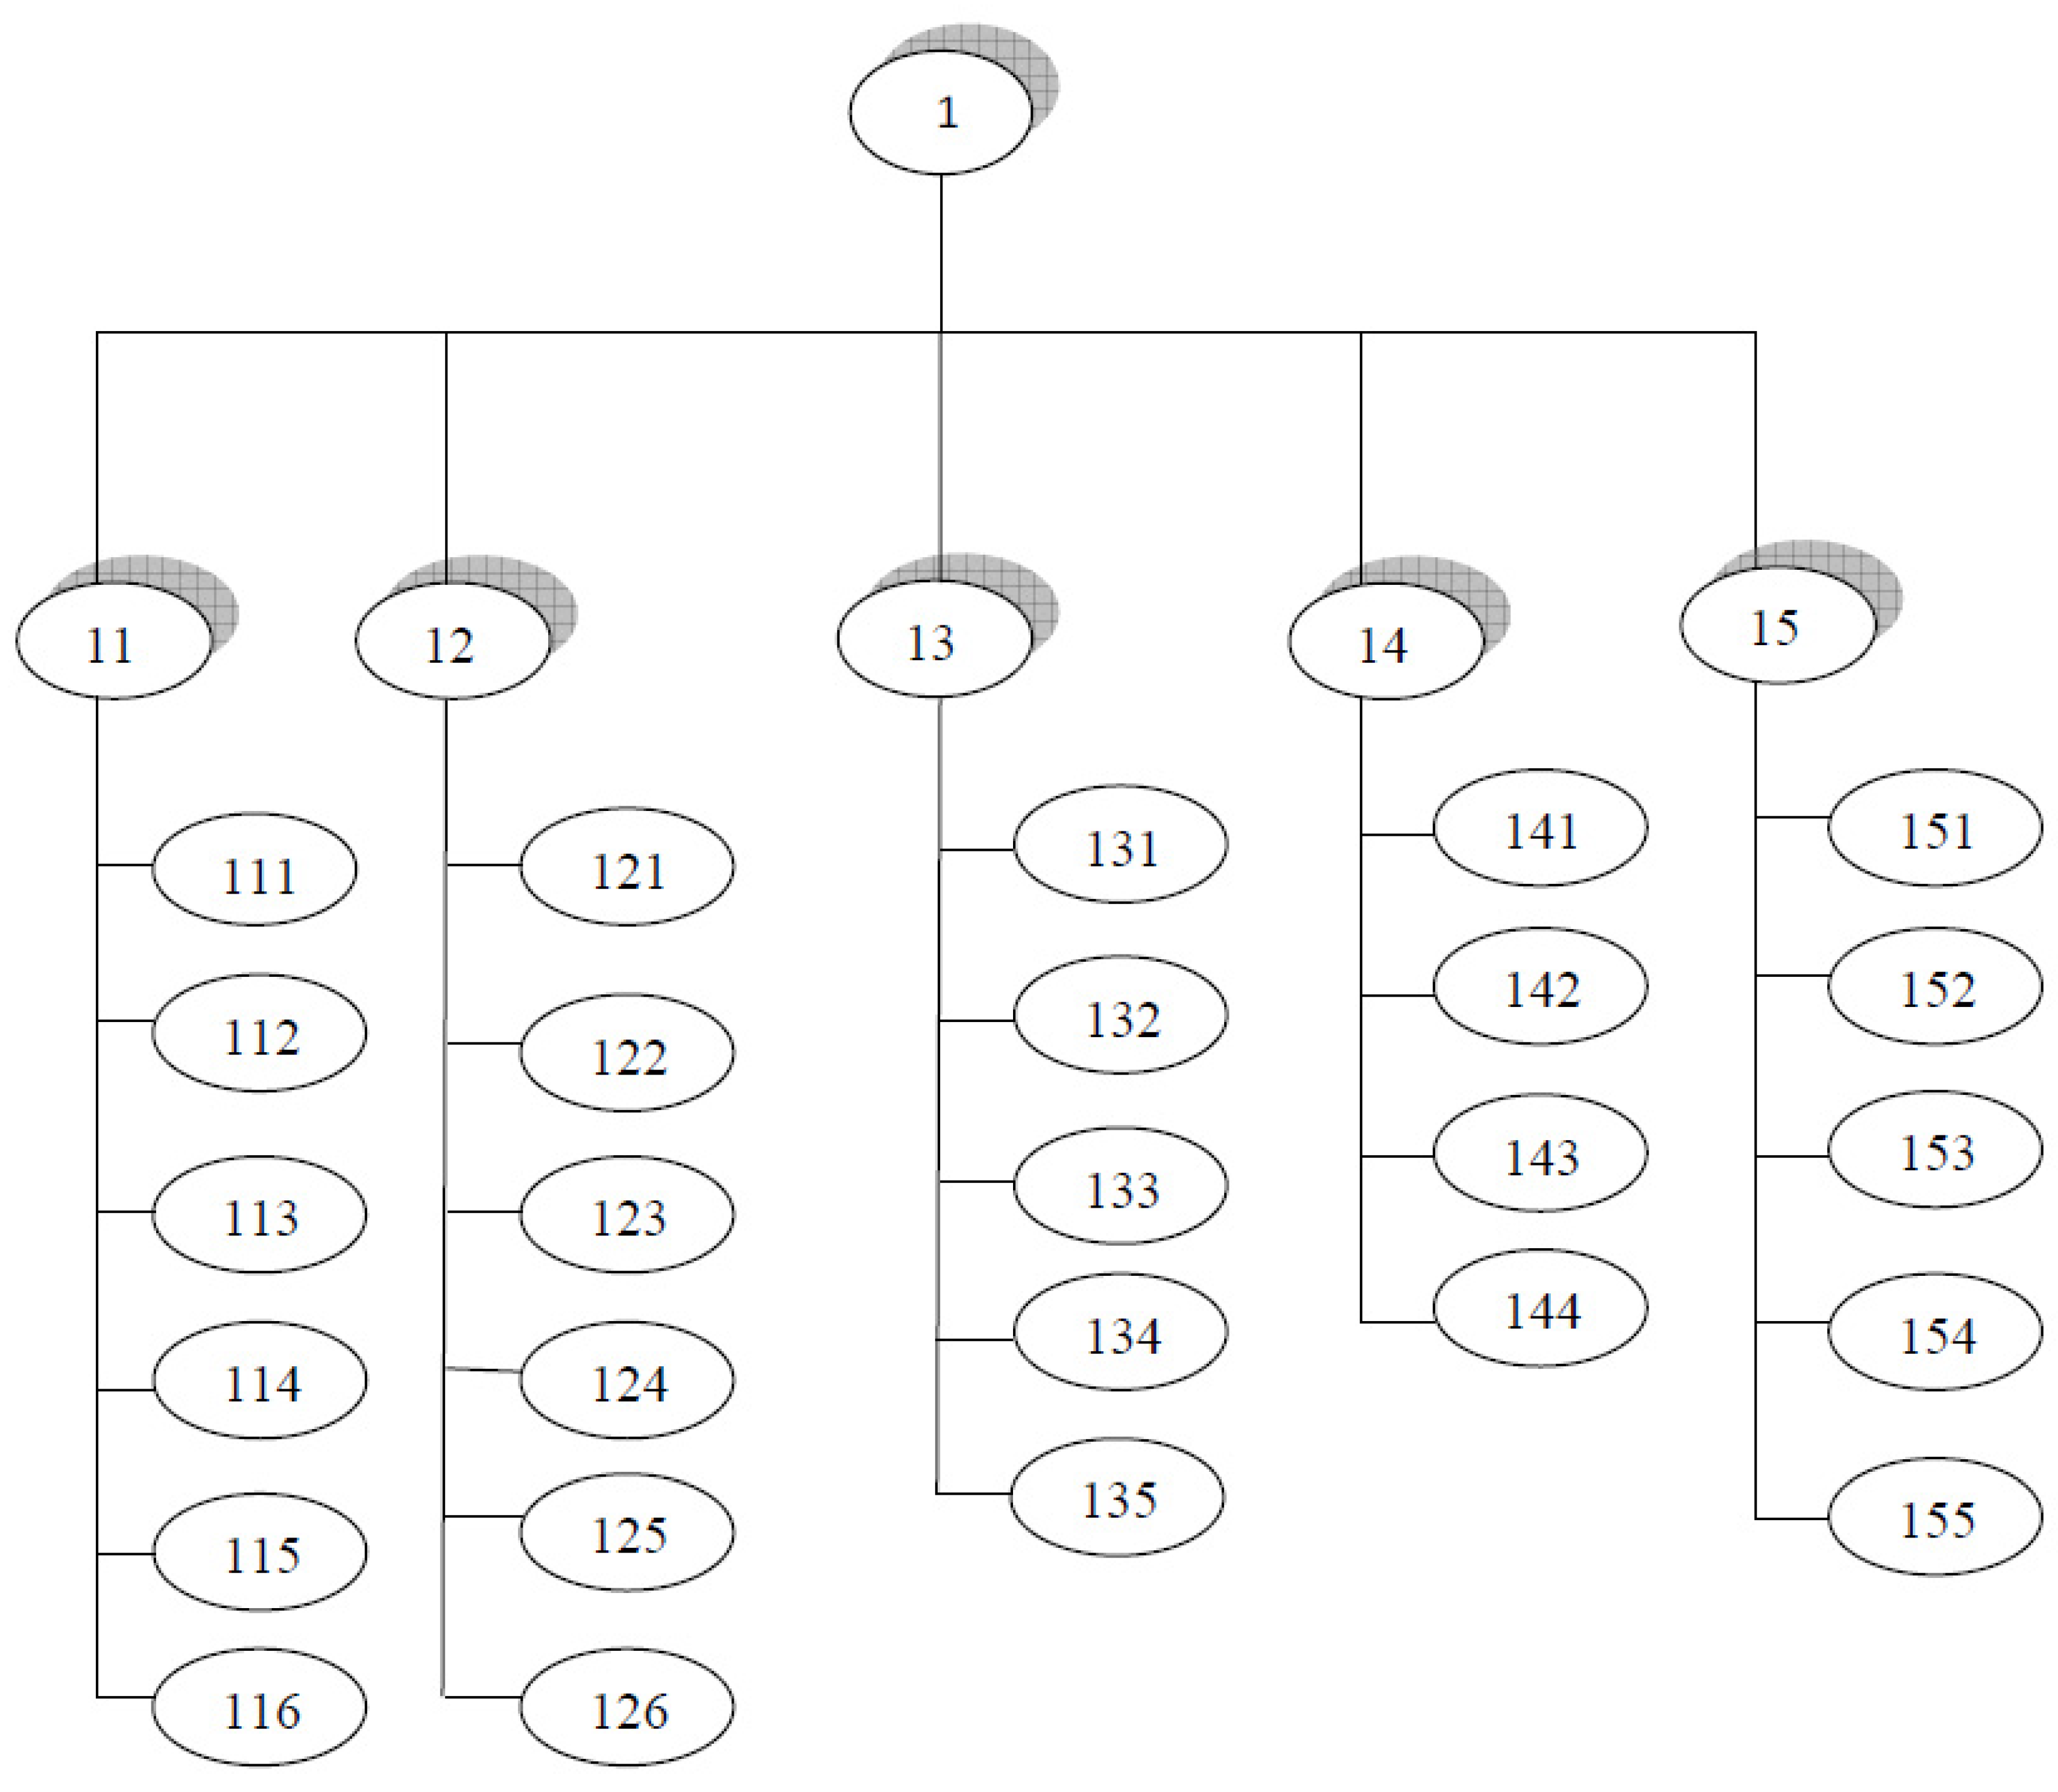
The first step in building a Bayesian network is to identify the variables and their state spaces. In this step, human intervention is essential. Therefore, the set of variables (severity, occurrence and detectability) characterizing the STPP subsystems should be determined. As in all modeling work, a compromise must be found between the accuracy of the representation and the workability of the model through a discussion between experts and the modeler. The second step consists of the definition of the BN structure by identifying the links between the different variables. In most applications, this step is performed by interviewing experts. In addition, it may be necessary to perform a functional and structural analysis of the system to identify the link between the variables. Figure 4 shows the structure of the Bayesian network for the STPP system. In order to simplify the schematic of this figure, the variables (nodes) were presented in the form of numerical codes or identifiers (ID). For example, the whole system (STPP) is identified by 1, while the receiver subsystem is identified by 11. The definition of the different IDs is shown in Table 8. It was noted that the different subsystems were placed in series. To this end, when one subsystem from the five subsystems is critical, the whole system will be considered critical. This information should be taken into account when filling in the conditional probability tables.
The last stage in the construction of the BN consists of filling in the prior CI tables associated with the different variables. This operation is performed using the joint probability law of variables. Expert knowledge and reliability laws of the STPP variables are also taken into account in the model. Table 8 represents the prior CI values of STPP.
4.1.2. Criticality Assessment Using NETICA Software
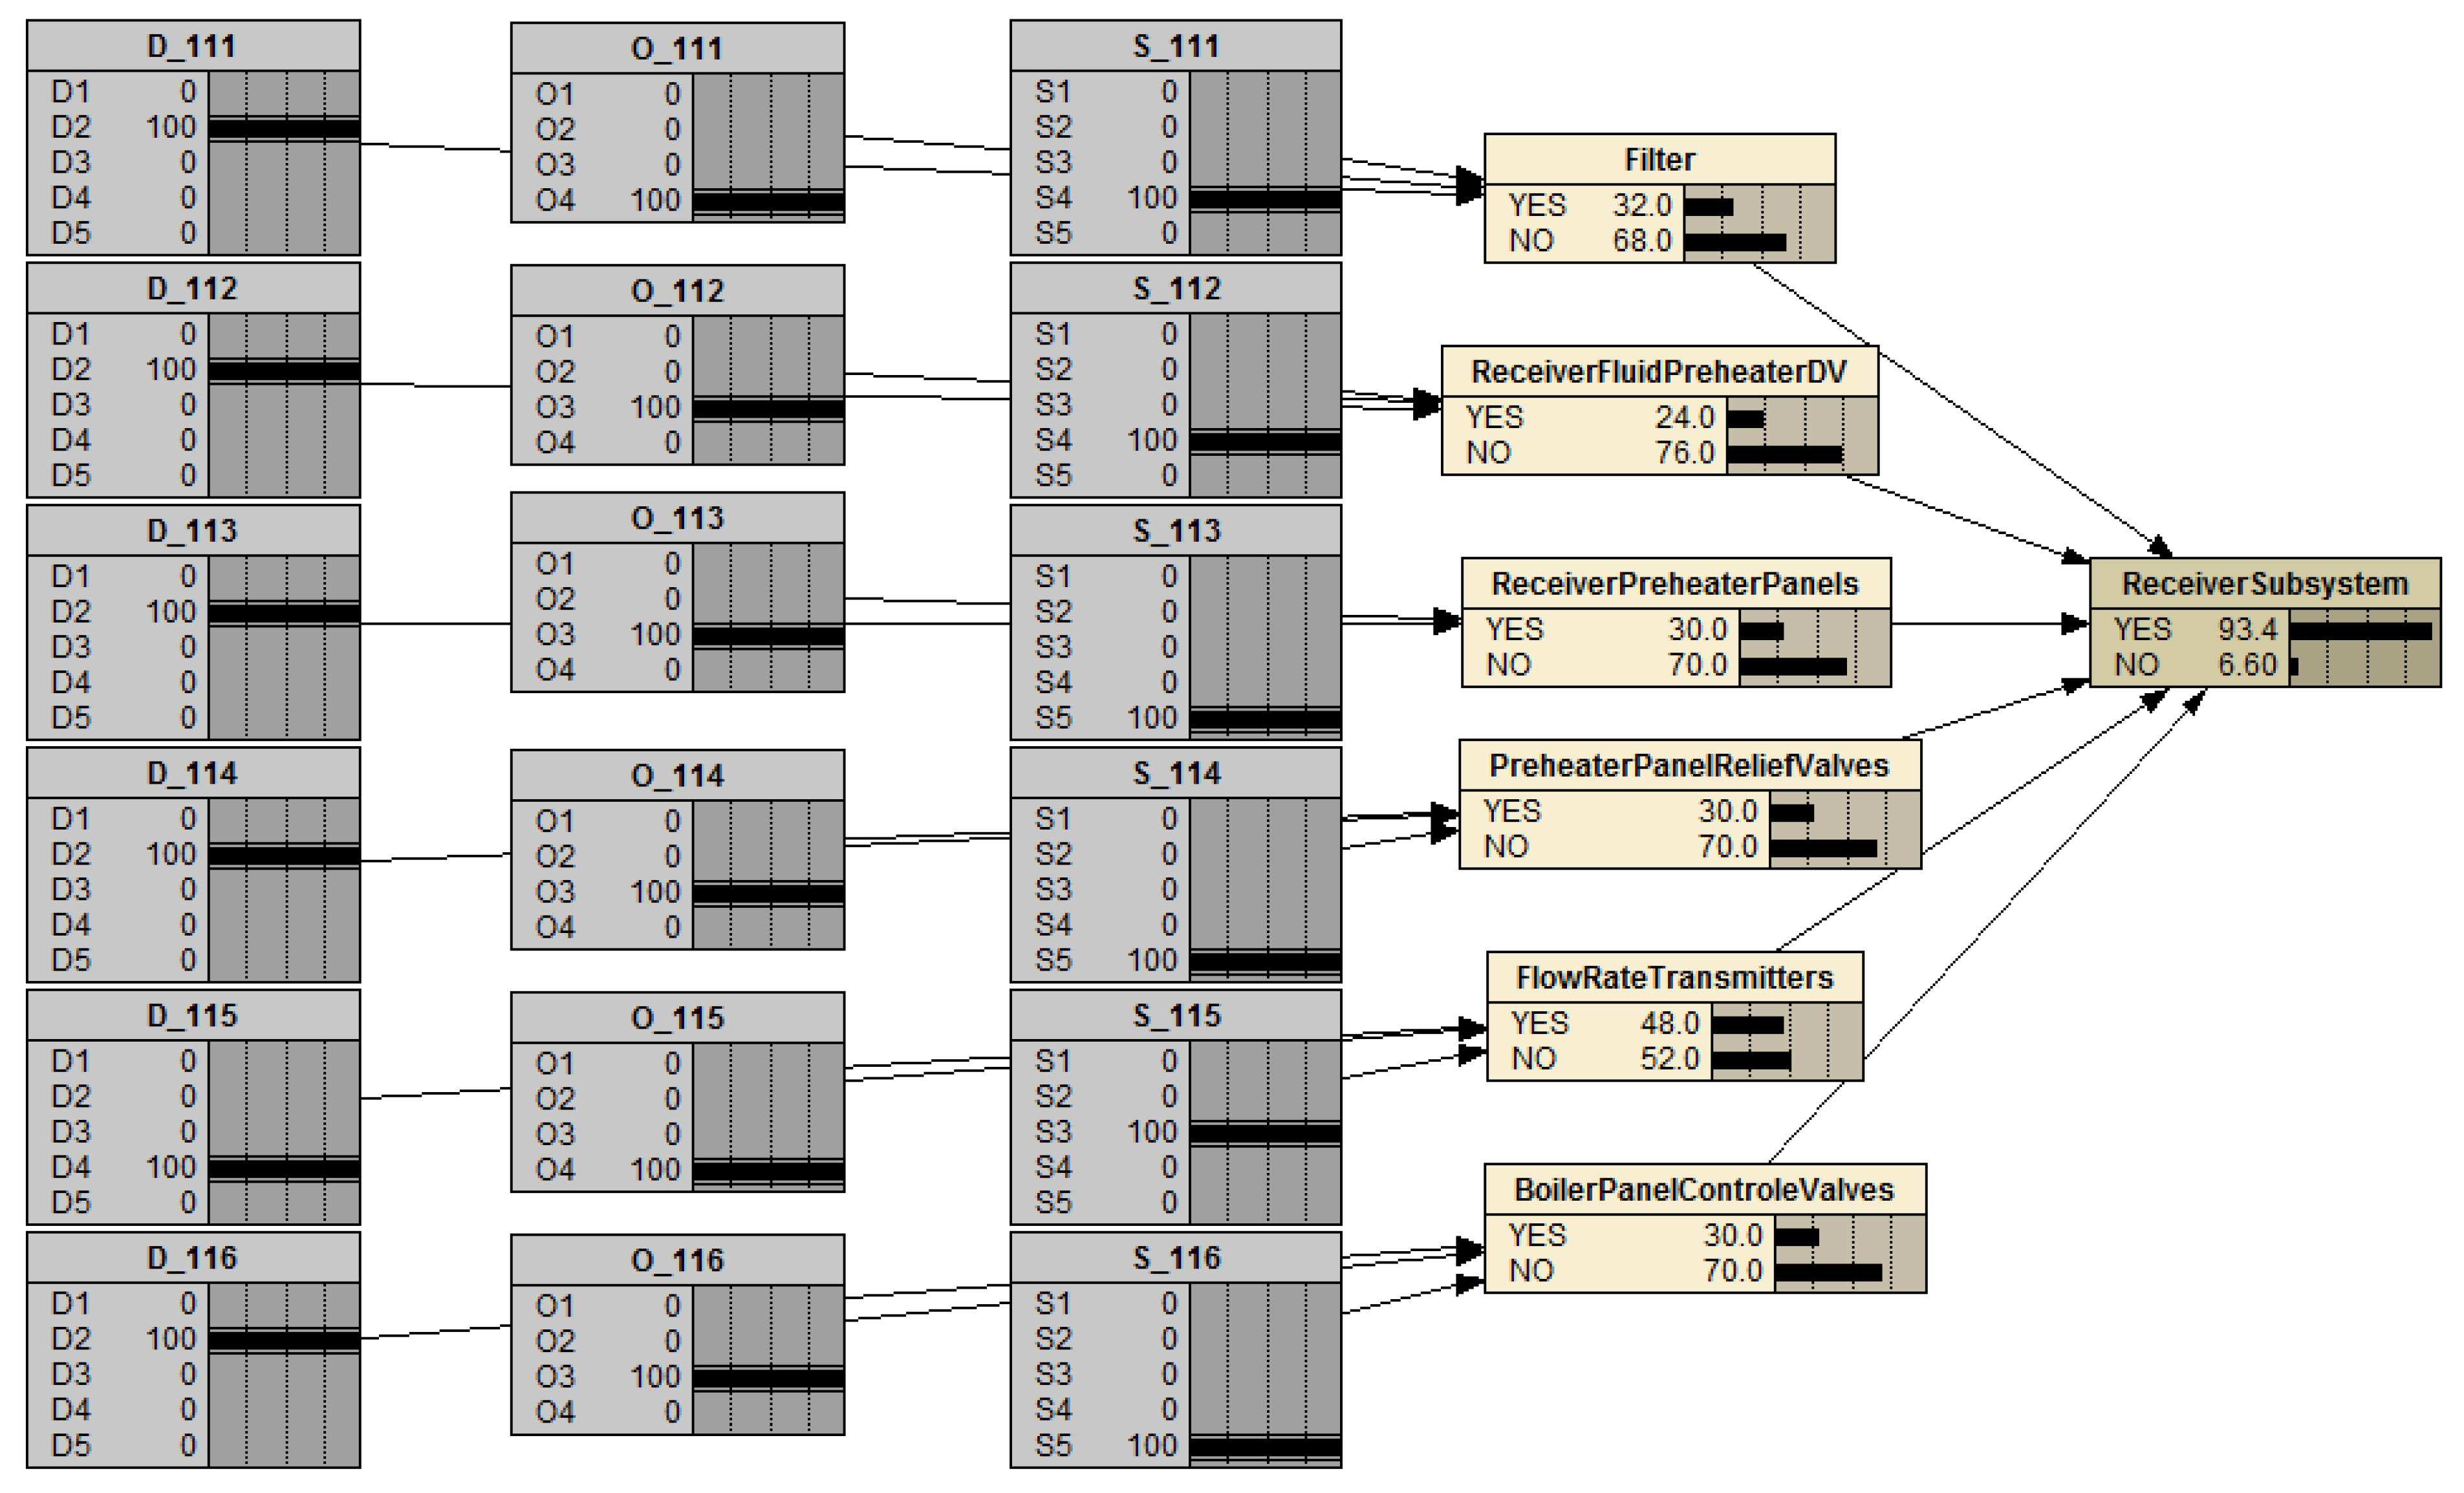
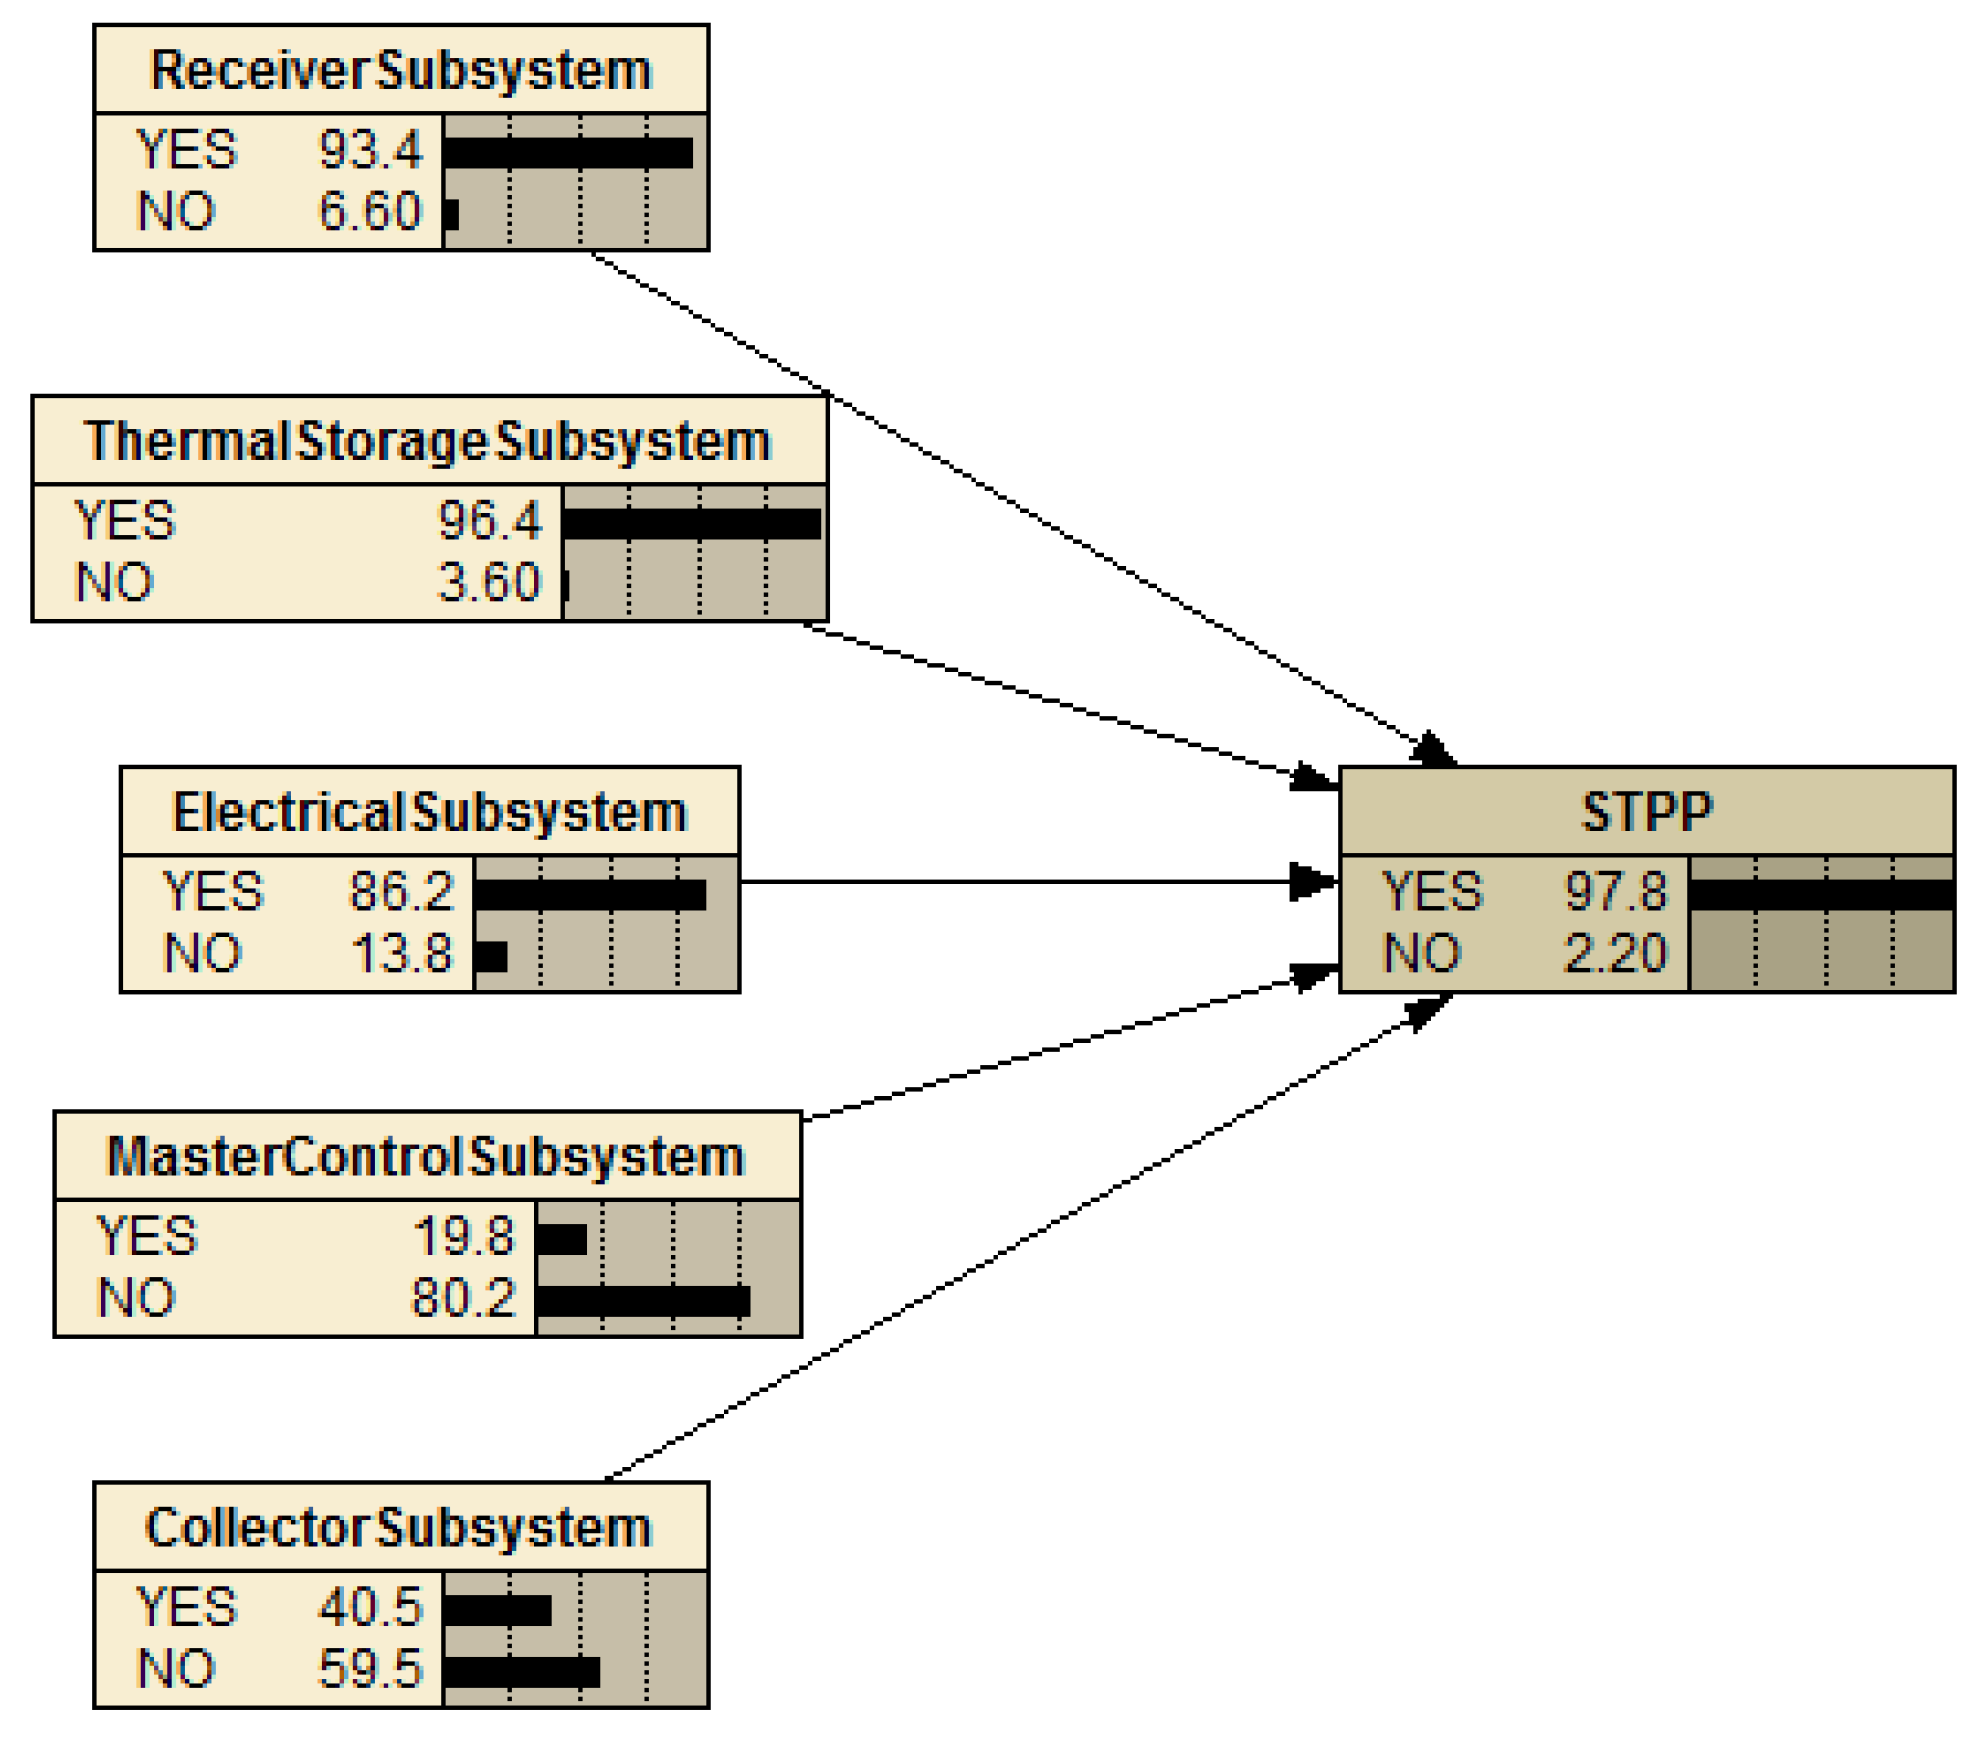
The NETICA software is used to determine the posterior criticality of the STPP system and subsystems. The values of the posterior criticality are presented in the last column of Table 8. The first and the second column in this table show the ID and its definition of each STPP component. The values SOD in columns 3, 4 and 5 are obtained from Table 2, Table 3, Table 4, Table 5 and Table 6. To reduce the number of variables and then simplify the simulation by NETICA, only those failure modes that represent the highest CI should be considered. For example, for the filter component, only the second (clogged) and the third (leakage) failure modes were considered; these failure modes represent the highest CI (32). The SOD values of each component were introduced into NETICA software, such as those presented in Figure 5. For example, the SOD score for component 111 (filter) is 442. The sixth column in the table shows the values of the prior CI. This is later calculated from the multiplication of the three indices S, O and D as presented by Equation (1). This multiplication calculation was added to the probability table in NETICA; therefore, the CI value is calculated automatically, as shown in Figure 5. For example, the CI for the filter is 4 × 4 × 2 = 32. The last column in the table represents the posterior CI of the different subsystems as well as the whole system (STPP). In this case, NETICA uses Bayes’ formula (Equation (2)) to compute the posterior probabilities. Therefore, the same procedure is followed to calculate the rest of the subsystems. Then, the posterior CI of the STPP is computed, based on the posterior CI of the five subsystems, using NETICA, as shown in Figure 6.
4.2. Artificial Neural Network
The artificial neural network is the mathematical modeling of the functioning of the human brain neuron (biological nervous system). The biological nervous system consists of neurons where each neuron contains dendrites, an axon and a synapse. However, the artificial neural network consists of inputs, an activation function and an output. Like the biological neuron, the artificial network receives information (input data) and compares it to the target by adjusting the weights between the inputs and outputs [32]. The multilayer perceptron (MLP) is the most used ANN architecture in the prediction domain. The MLP is composed of one input layer, one or more hidden layers and one output layer. The general formulas used to calculate the hidden layer and output layer neurons are shown below, respectively:
where F1 and F2 are the activation functions, w is the weight matrix and b is the bias vector.
In reality, there are several activation functions. In this study, only the sigmoid (Equation (5)) and linear (Equation (6)) activation functions were used.
4.2.1. Designing ANN Models
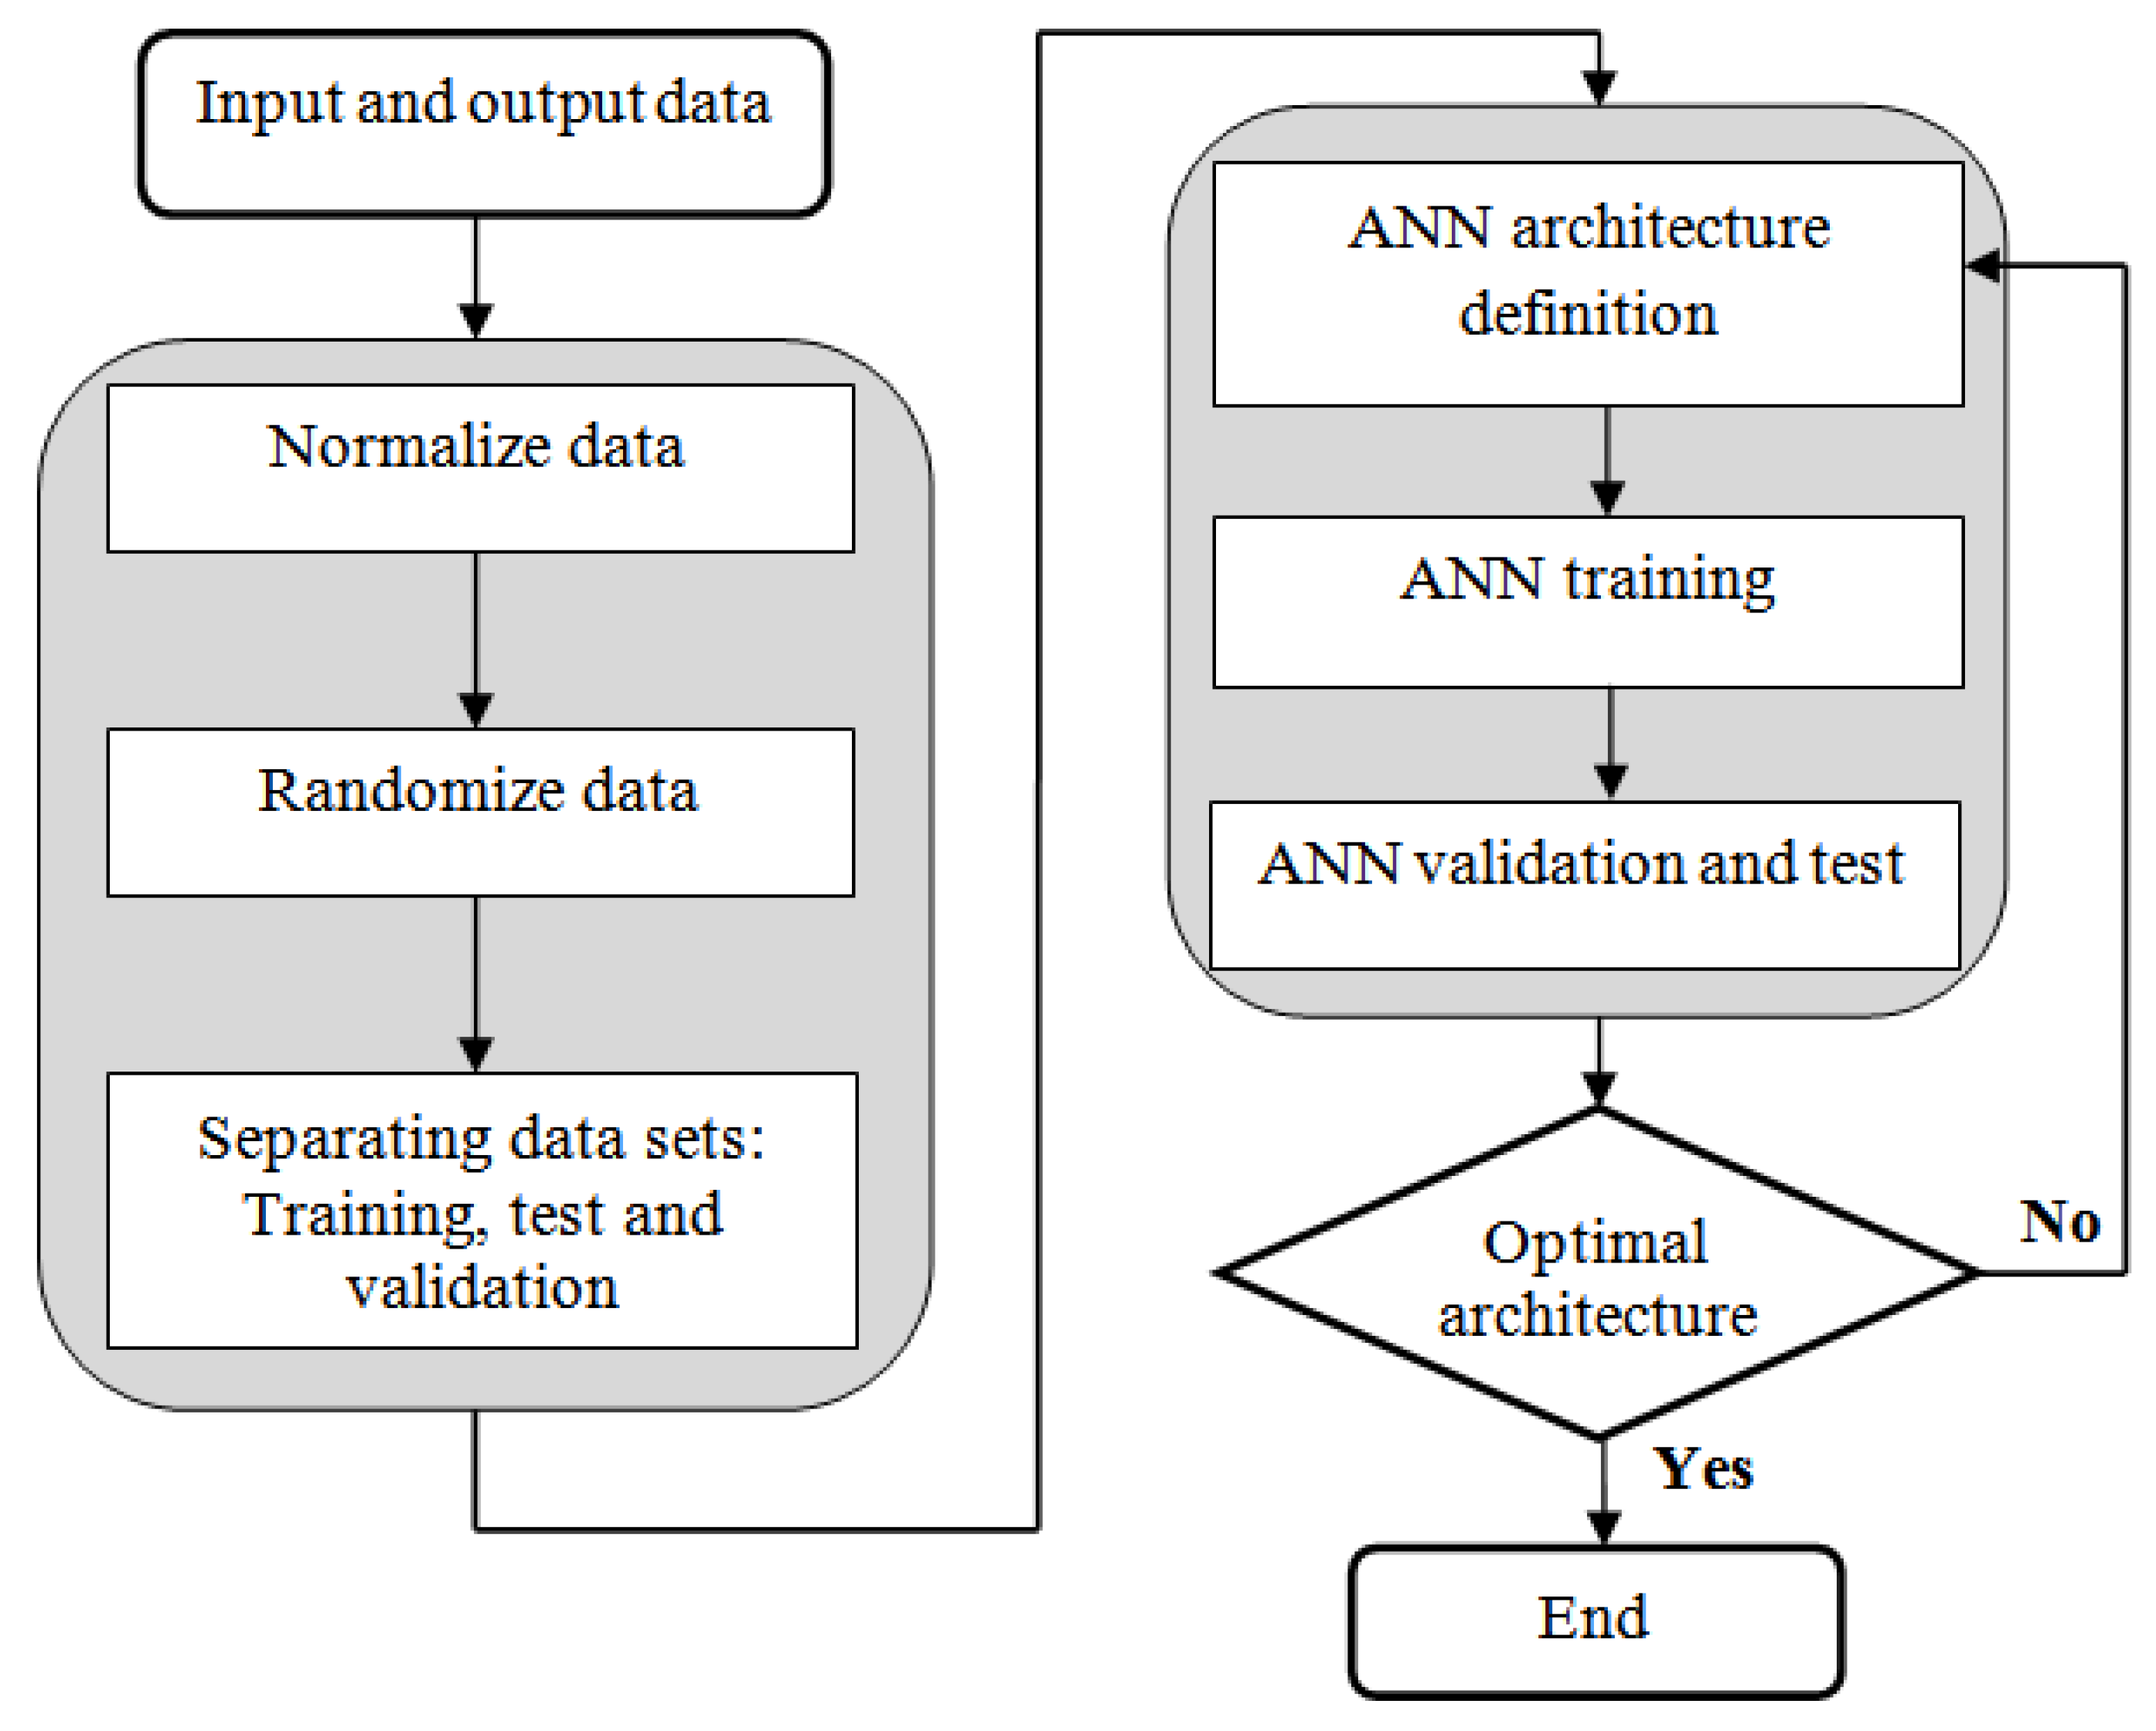
After the preparation and the collection of input and output data, three data pre-processing procedures are conducted to train the ANNs more efficiently. These procedures are (1) normalization of the data, (2) randomization of the data and (3) separation of the data set. Normalization consists of making all data sets lie between −1 and +1. The existing discrepancy between the vectors of some data can make the training very difficult. Therefore, the normalization procedure is an important step to simplify the training of the network [33]. Randomization of the data is necessary to ensure the best learning and validation of the network. The prepared data must be separated into test data (20%) and training data (80%).
The training phase consists of adjusting the weights to bring the output of the ANN closer to the target output. Then, the developed model is tested in the next step.
At this stage, unseen data are exposed to the model. The flowchart presented in Figure 7 shows the main steps for the designing of ANN models.
To evaluate the performance of the developed ANN models quantitatively and check whether there is an underlying trend in the performance of ANN models, statistical analysis involving the coefficient of determination (R2), sum squared errors (SSE), the root mean square error (RMSE) and the mean relative errors (MRE) were conducted. The mathematical formulas of these statistical measures are presented as follows:
where Tk is the kth output target or observed value, Yk is the kth predicted value and n is the number of output data.
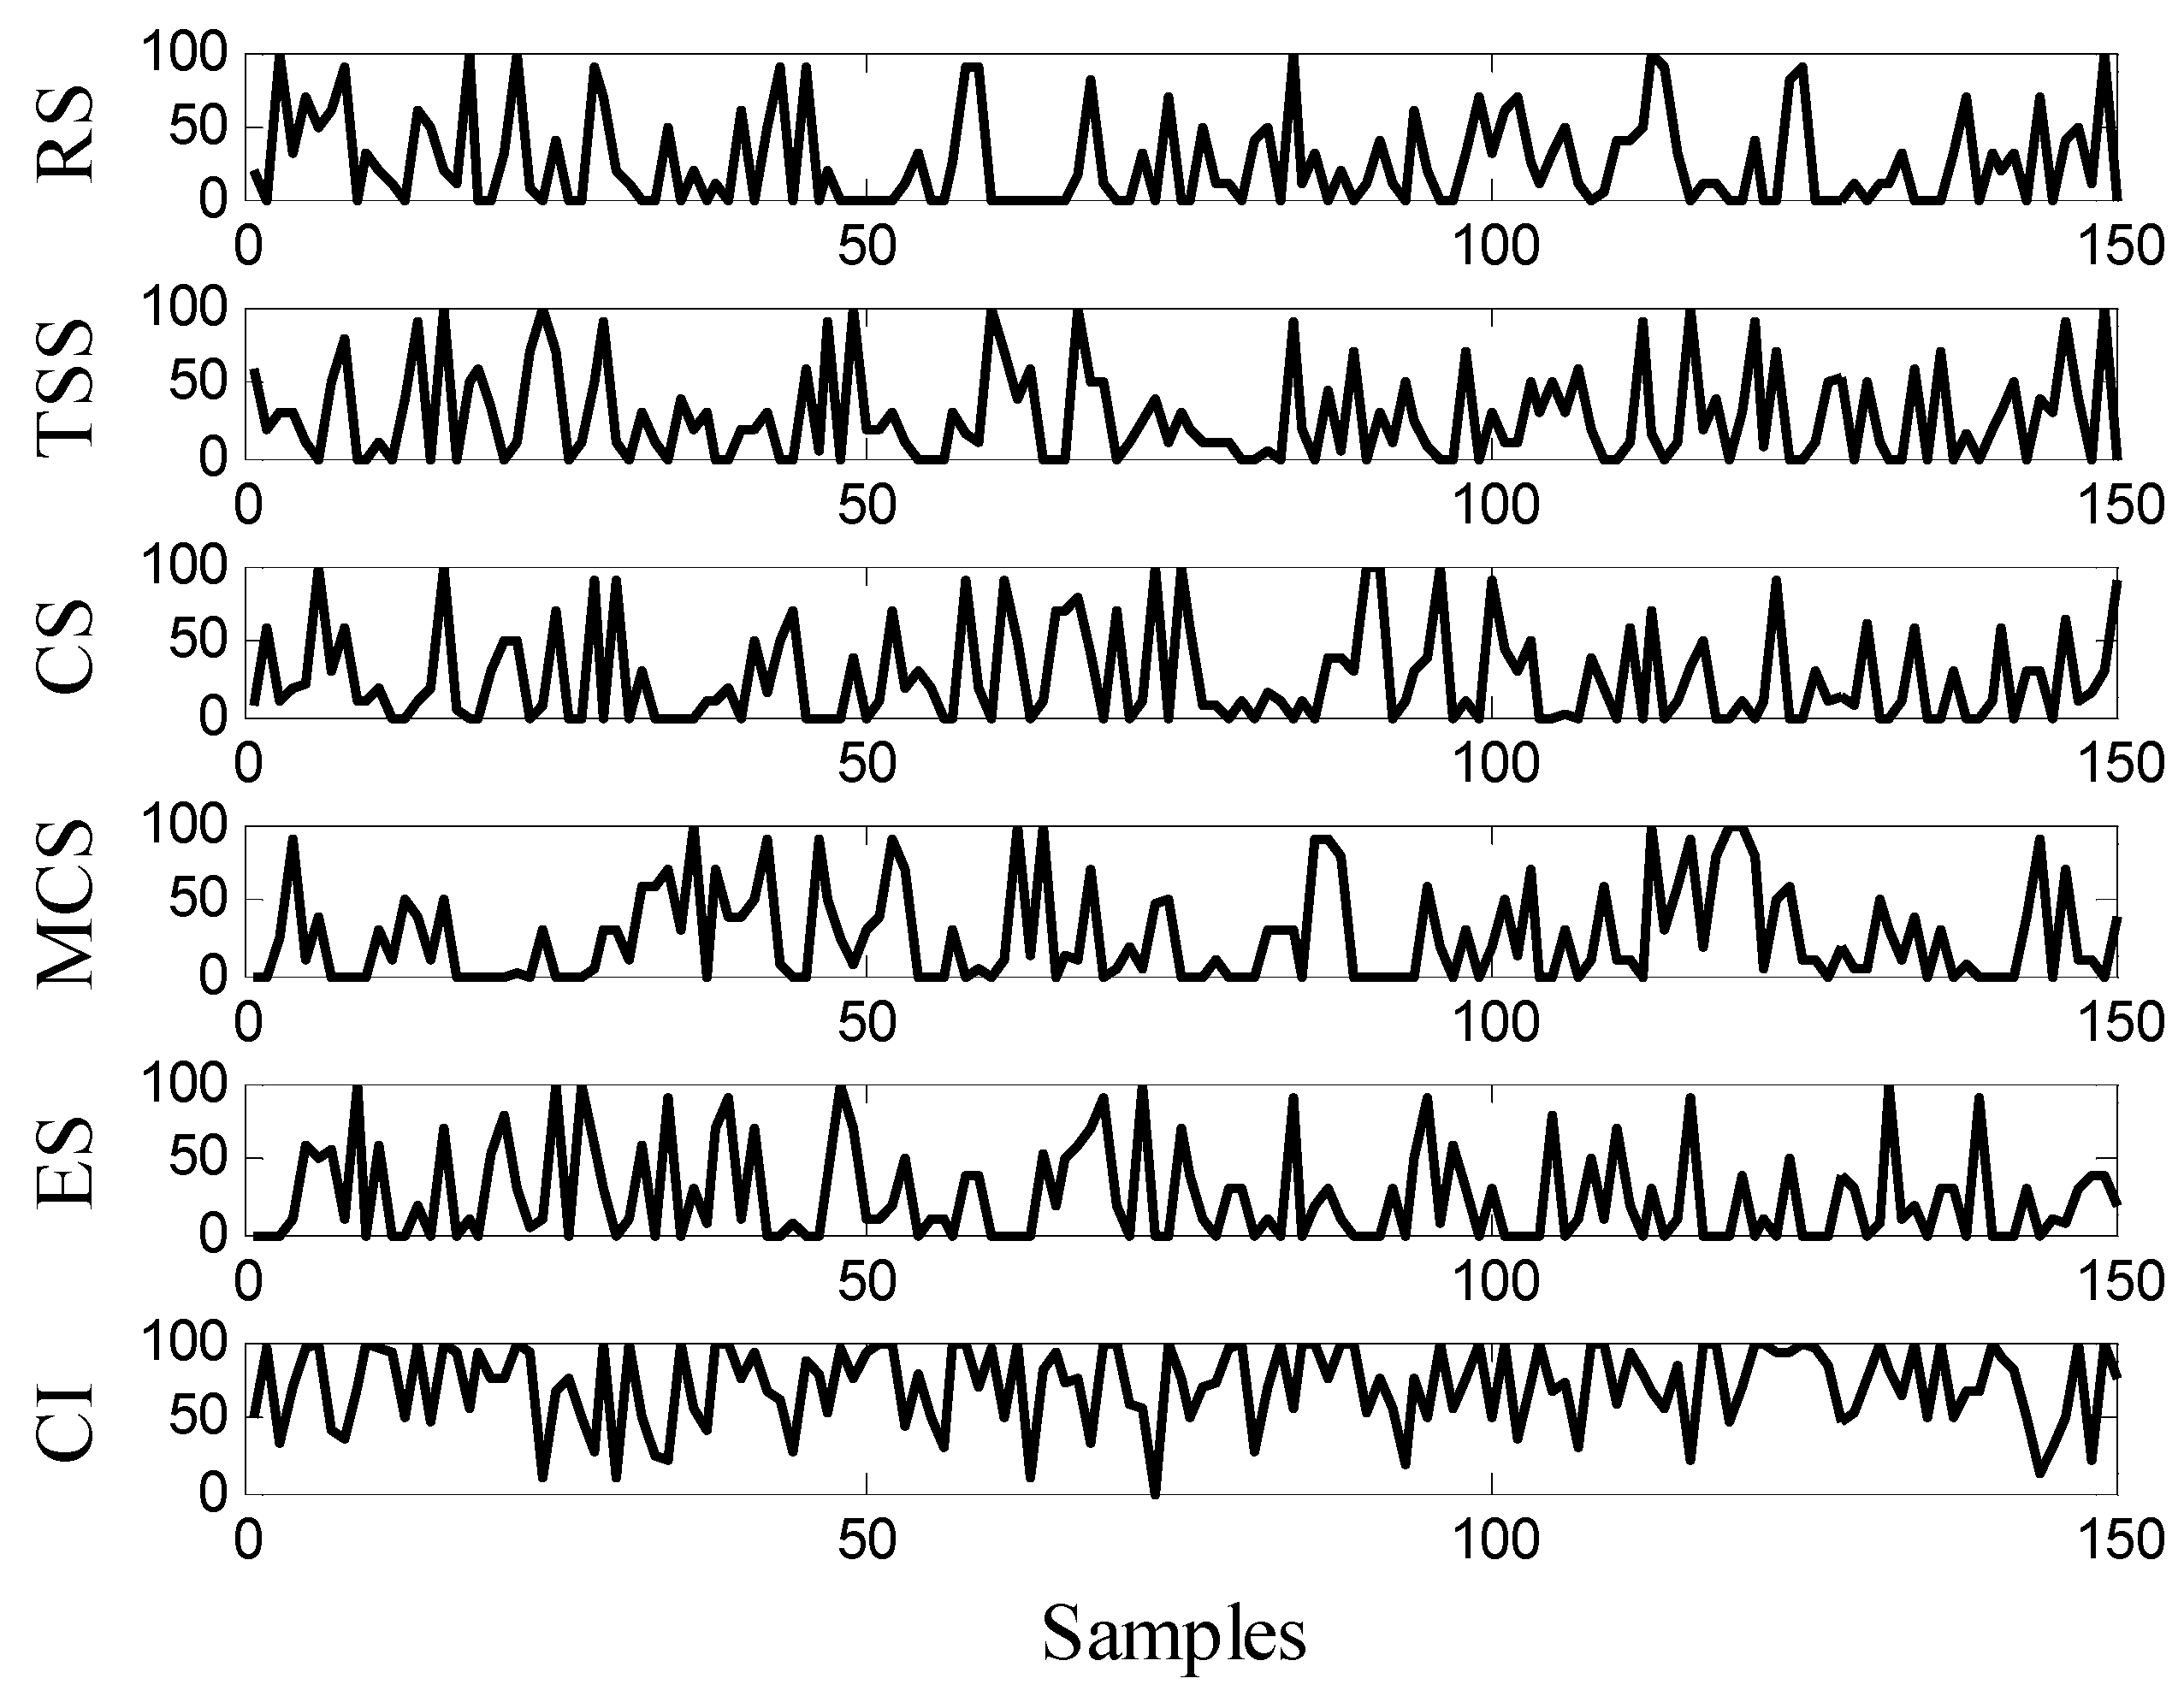
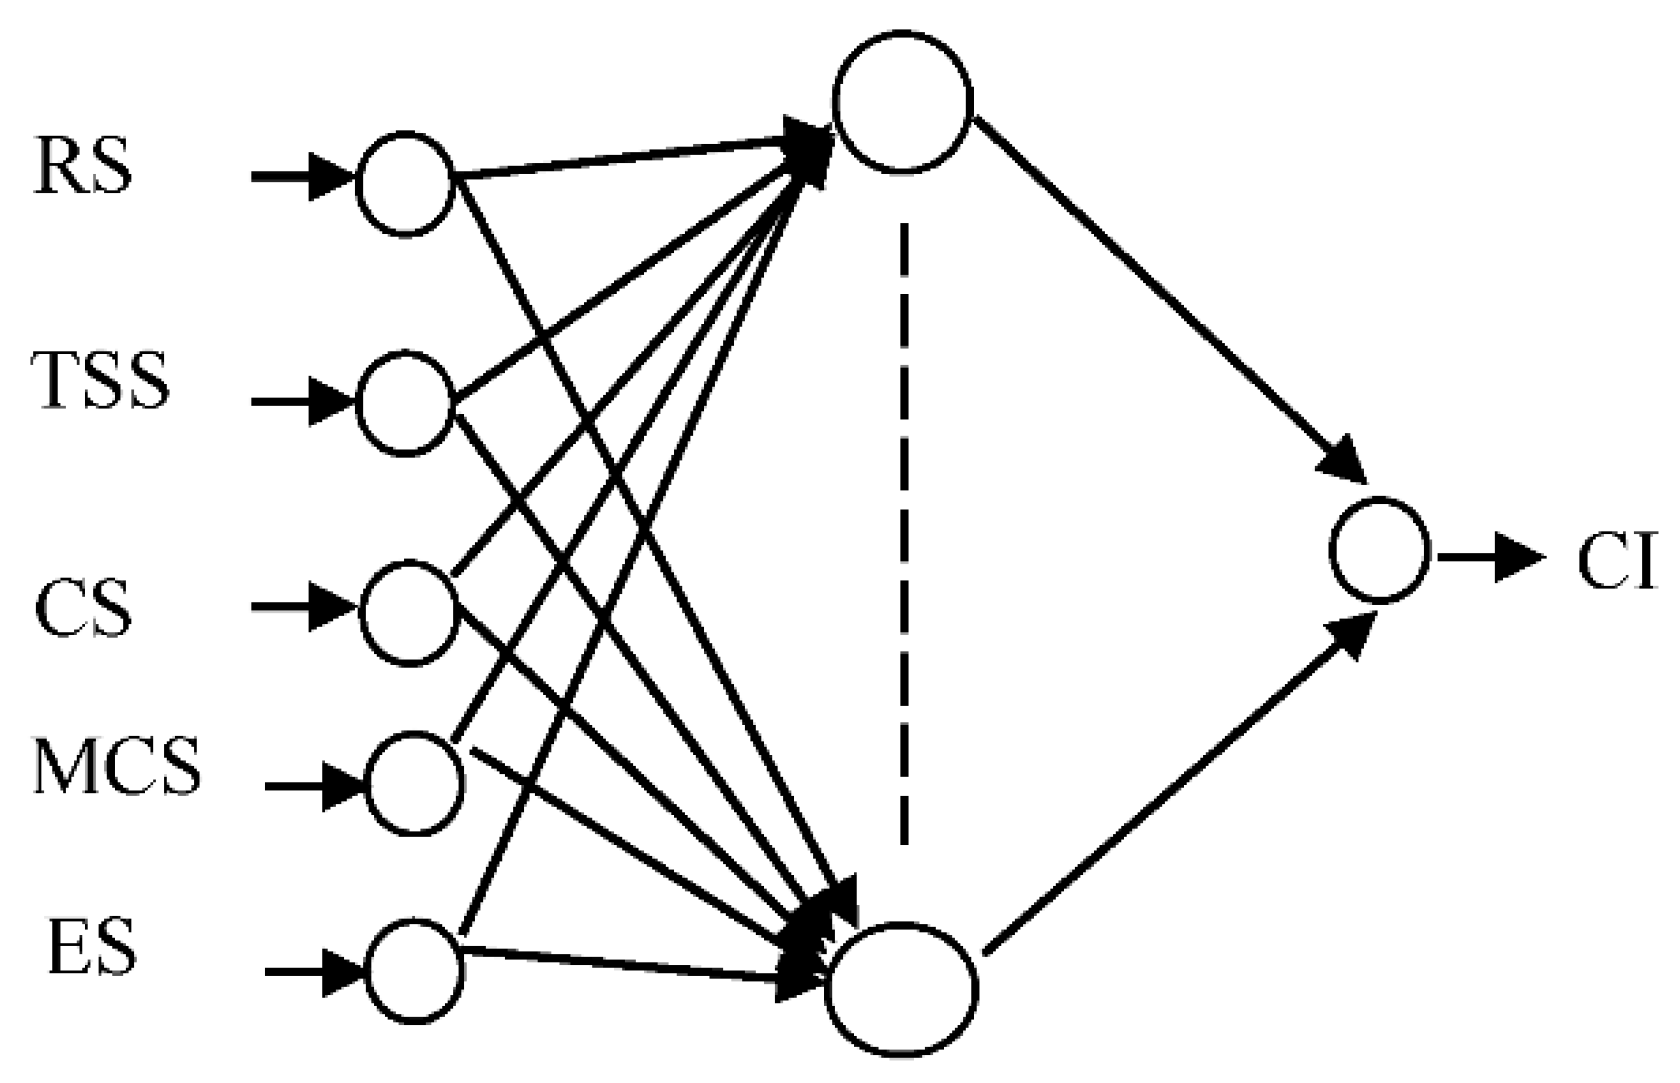
In this work, the prediction ANN system contains five input vectors (receiver subsystem criticality index, thermal storage subsystem criticality index, collector subsystem criticality index, master control subsystem criticality index and electrical subsystem criticality index), and the STPP criticality index was selected as the output vector. In other words, the criticality indices of the different subsystems are the ANN inputs, and the criticality index of the whole system is the ANN output (target). The input and output data are obtained from simulated results given previously by BN. Figure 8 shows the input and output datasets used to train and test the ANN, where RS is the receiver subsystem, TSS is the thermal storage subsystem, CS is the collector subsystem, MCS is the master control subsystem, ES is the electrical subsystem, and CI is the criticality index. The data set consists of 150 values; 80% of these data are randomly selected to be used for ANN training, and the remaining 20% of these data are used for ANN testing. The ANN architecture used in this study is illustrated in Figure 9.
4.2.2. ANN Training and Definition of the Statistical Error Parameters
The algorithm used to train the ANN developed in this study is the Levenberg–Marquardt algorithm (LMA). The updating of the weights using LMA is given by:
where w represents connection weights, μ is the damping term (μ = 0.05), I is the identity matrix, J is the Jacobian matrix, and e is the error calculated from the difference between the target and the ANN output. For more details about the LMA, the reader is referred to [34,35].
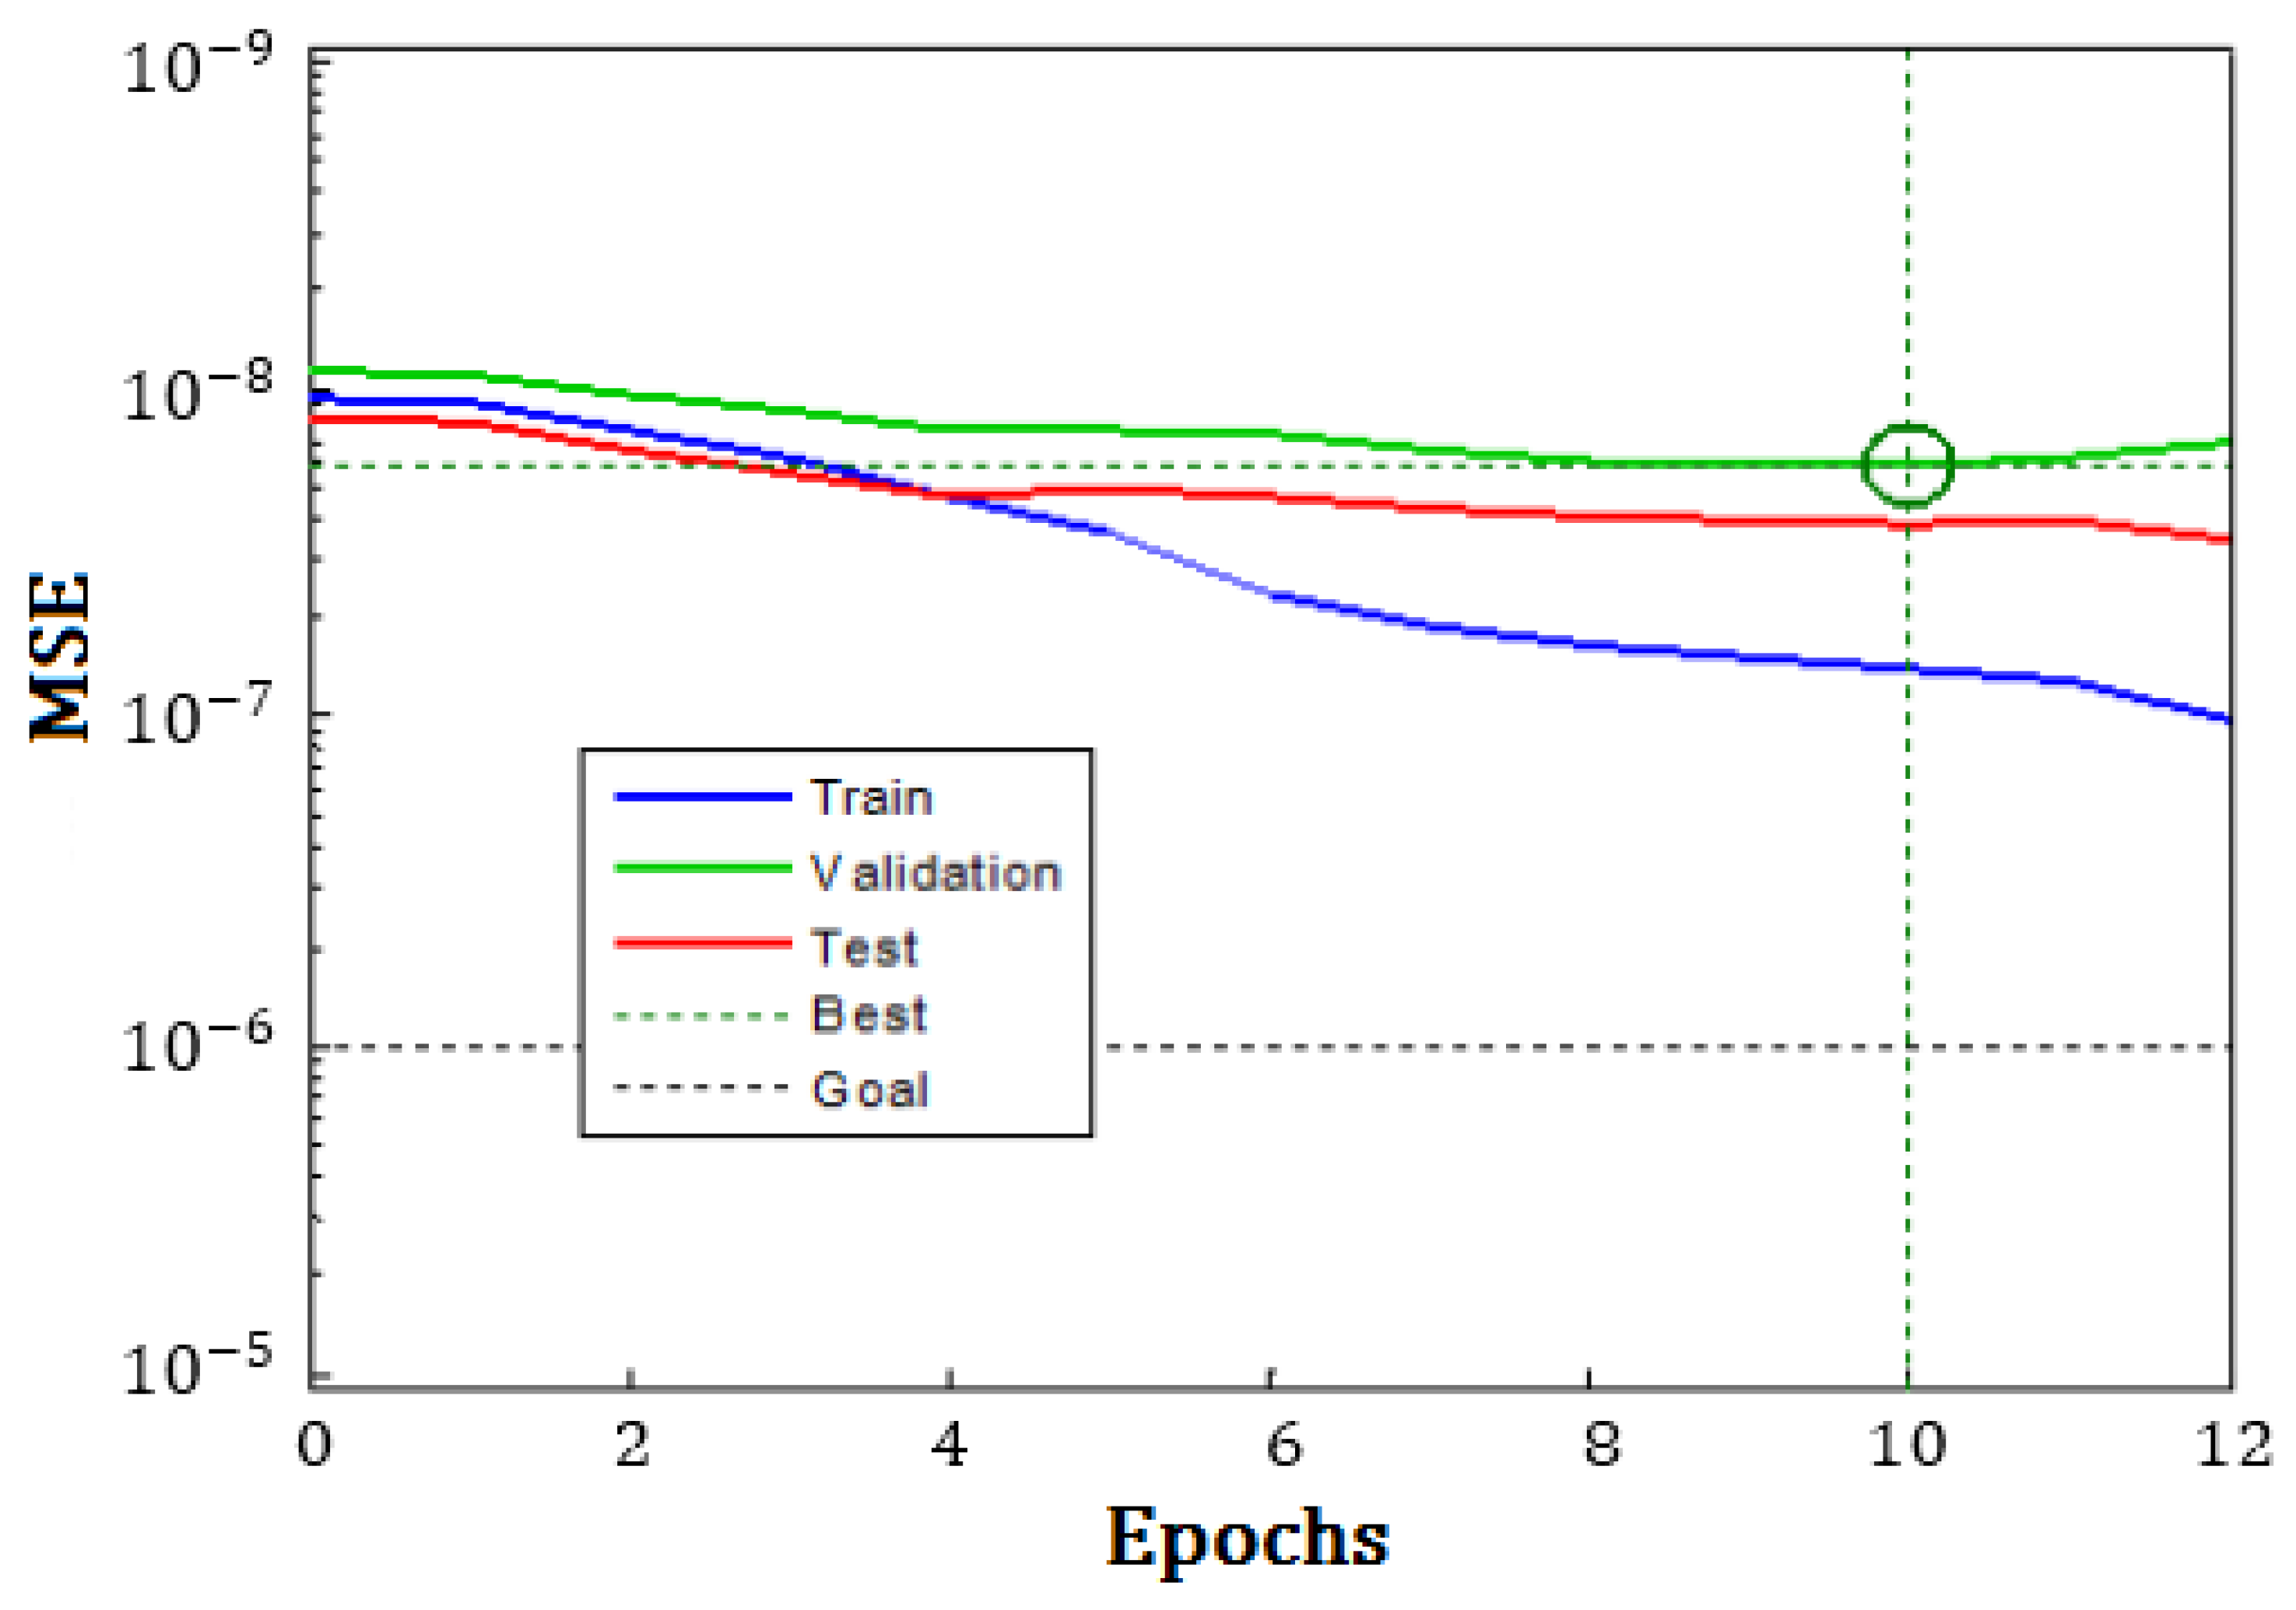
In order to find the optimal ANN architecture, it is important to variate the number of the hidden layers until obtaining the highest value of R2 and the lowest values of SSE, RMSE and MRE. It was noticed from Table 9 that (05-17-01) should be the optimal architecture to predicate the STPP criticality. The maximum error goal and the maximum gradient values are 10−8 and 10−7, respectively. However, the learning rate is 5 × 10⁻¹⁰ at epoch 12.
Figure 10 shows the variation in mean square error (MSE) with the number of iterations during the network training. It was noticed that the graph of simulation converges, after 12 iterations, to an error of about 10−7.
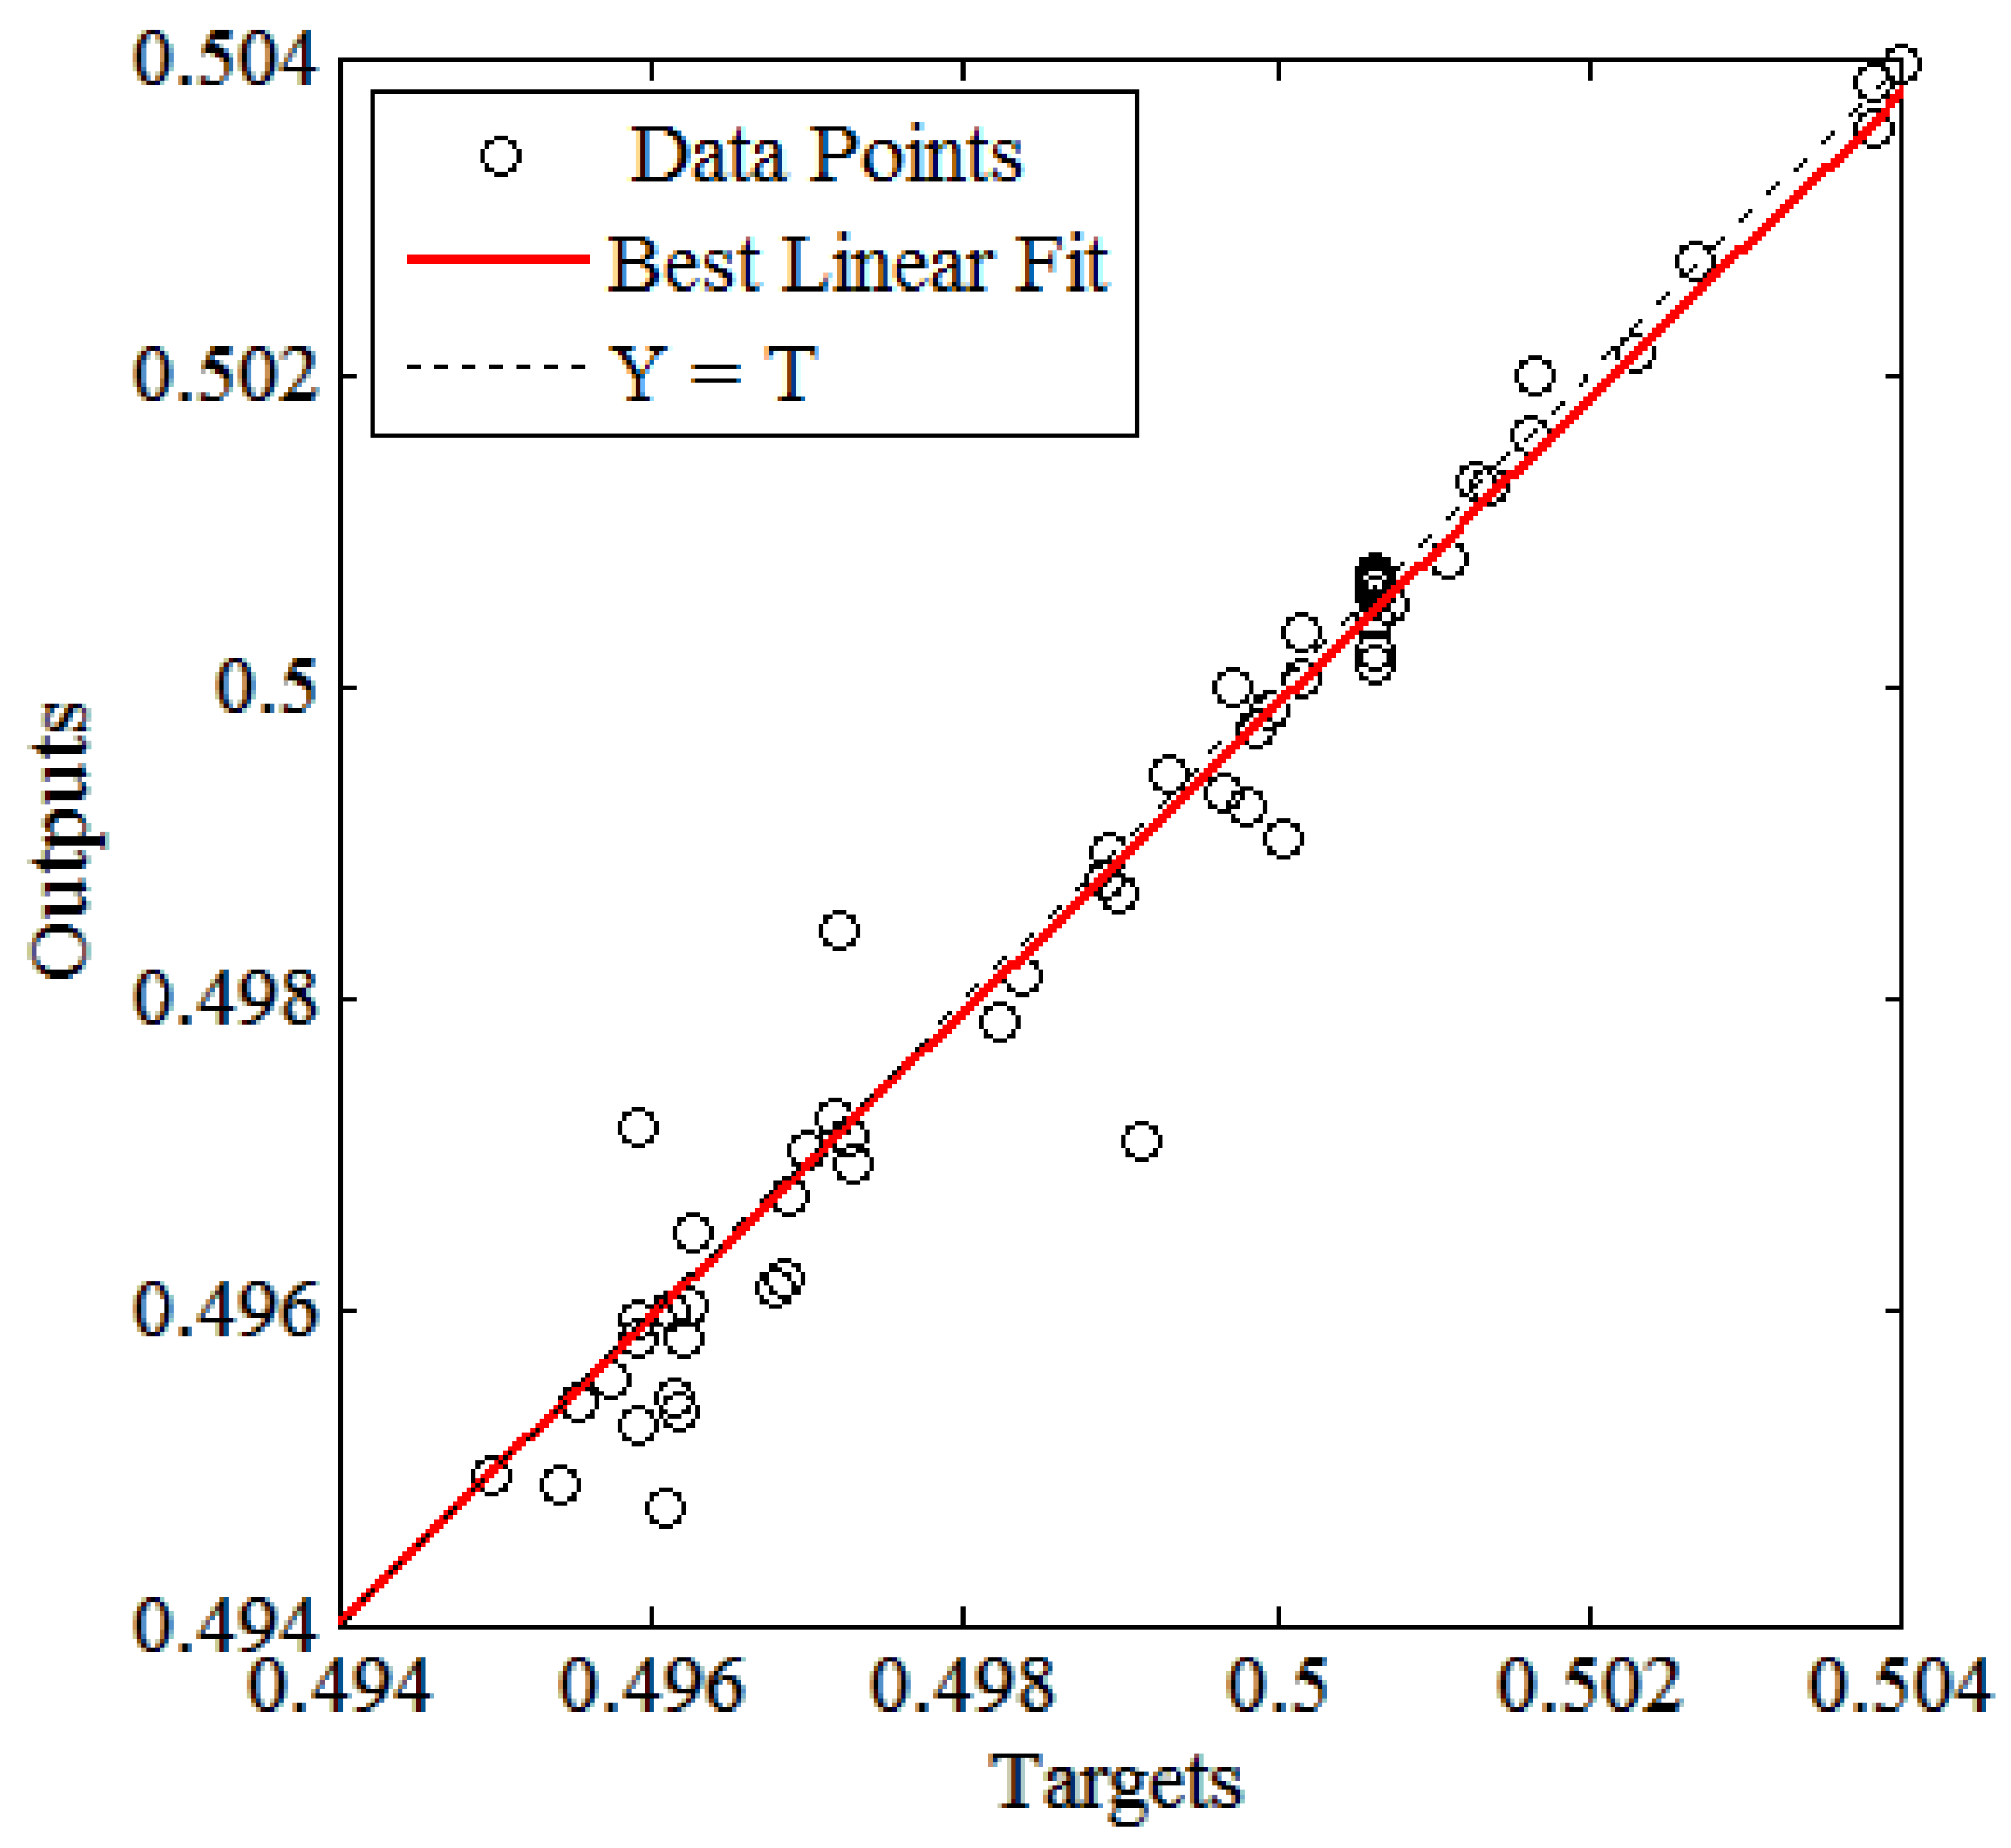
In order to ensure that the ANN has been well trained, it is suitable to perform a linear regression between the ANN outputs (predicted CI) and the targets (simulated CI), as shown in Figure 11. In this figure, the dashed line represents the perfect fit line where ANN output and target values are equal to each other. However, the continuous line represents the best fit for the ANN outputs. It can be noticed from this figure that the continuous line is close to the dashed line. According to this result, it can be deduced that the proposed ANN predicts very well the STPP criticality index.
4.2.3. ANN Testing
Testing the ANNs is an important step in confirming whether the learning or the training is performed correctly. The test consists of using a part of the data that was not used in the learning. The test data are used to be the input vector for the optimal architecture obtained in the learning phase. However, there is no output vector to be declared in advance during the testing phase; therefore, the output must be predicted by the ANN itself. The predicted ANN vector is compared with the real data to check whether the two vectors are close or not.
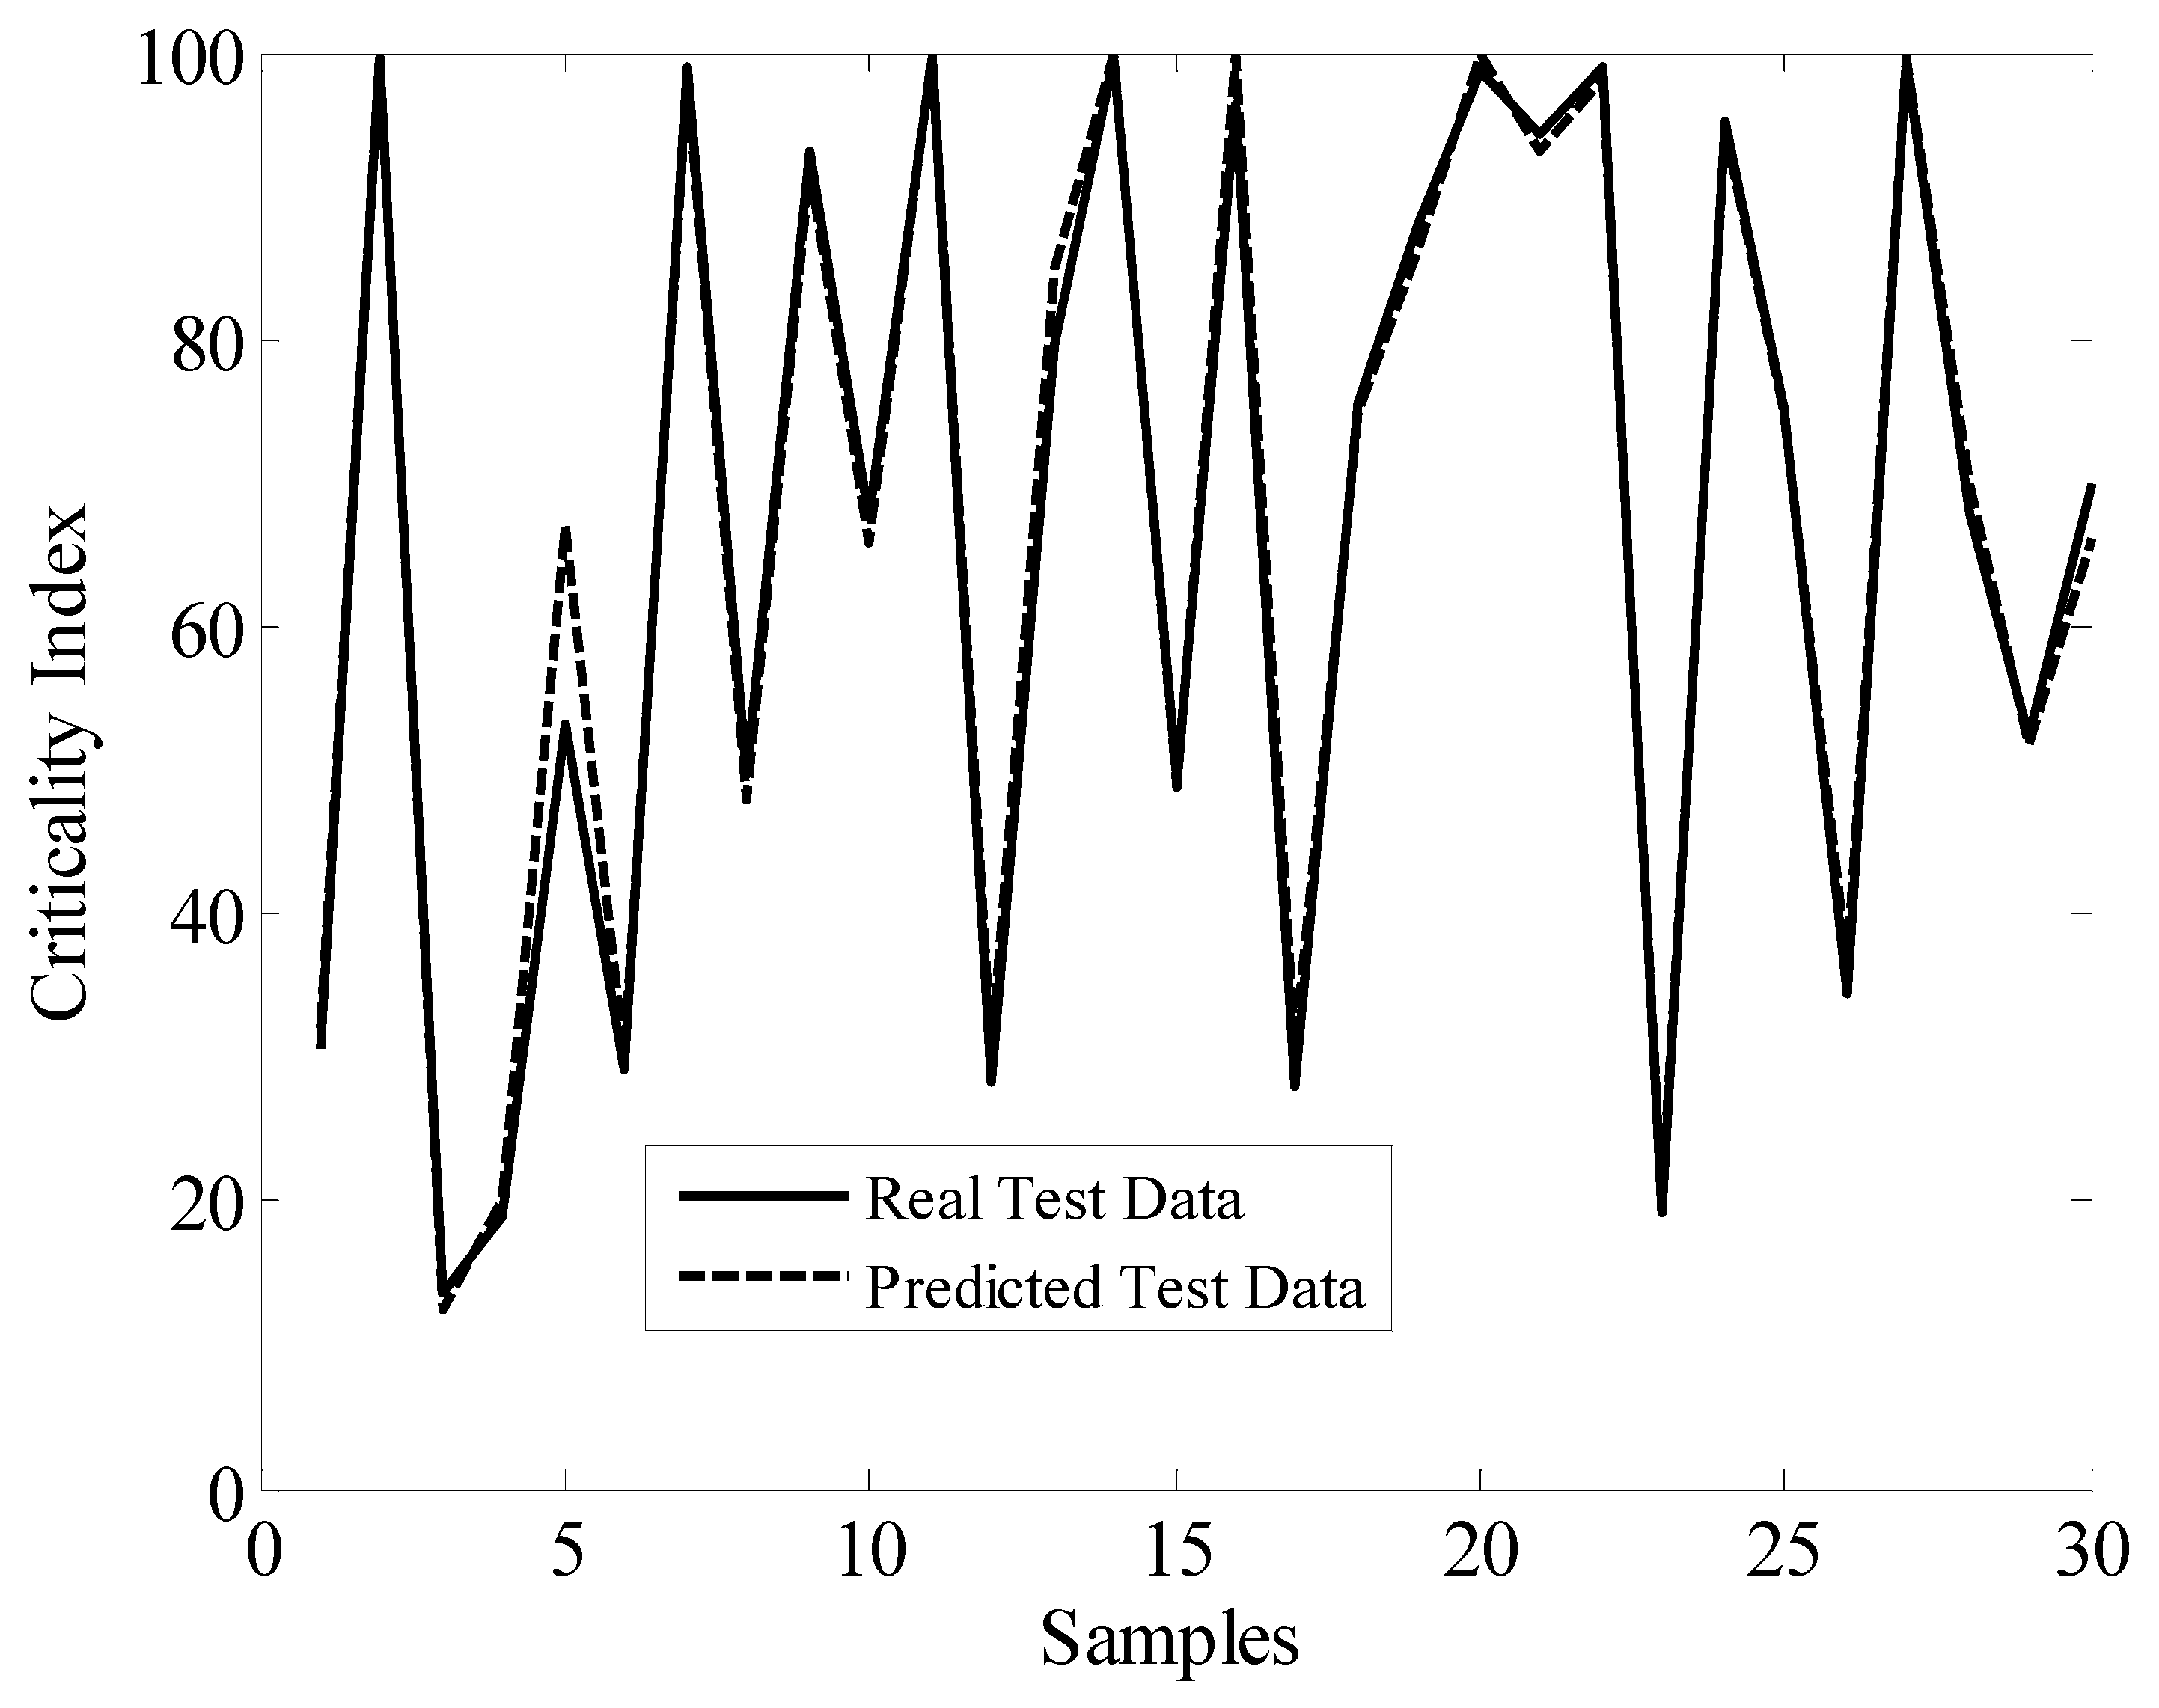
Figure 12 shows the test of the optimal configuration (05-17-01); the network was tested for a sample of 30 values (20%). As can be seen in this figure, the curves representing the actual network output (target) and the predicated network output are close. This convergence demonstrates the best training of the network. Therefore, the proposed ANN can predicate the criticality of STPP.
5. Maintenance Decision
As discussed in Section 3, the minimum value of CI is 1, and the maximum is 100. The CI value represents the order of priority of the corrective actions to be taken. It makes sense that for failures appearing to be critical (CI > 75), a redesign of the whole system is necessary. On the other hand, it is possible to neglect certain failures considered but which are neither probable nor serious (CI < 20). At the same time, corrective measures must be proposed. In general, the planned measures are summarized under these main headings:
- Design changes;
- Detection tools, monitoring instructions or periodic inspections;
- Replacement device, reconfiguration and fallback components;
- Observations and recommendations.
However, considering only the CI value will not lead to a better analysis. Therefore, it is important to evaluate and deeply analyze the three indices (S, O and D).
The recommended maintenance actions for the STPP system and the re-evaluation of CI are presented in Table 10. The new SOD score and CI value are presented in bold. As reported previously, FMECA aims to estimate the CI of the actual STPP design then reduce it as much as possible. Since the CI is directly related to the SOD score, minimizing the SOD score is, therefore, the only way to reduce the CI value. However, this minimization in SOD score must be stopped at a certain level due to various constraints summarized as follows:
Investment cost: Sometimes, when exaggerating in reducing the SOD score under a certain limit value, the operation will be subject to supplement investment cost. For example, it is possible to reduce the occurrence (O) of the “flow rate transmitters” to one instead of two by intensifying the frequency of the periodic calibration; if this later is conducted once monthly, it is possible to increase the frequency to twice. It is good to remember from Section 3.1 that O depends on the failure cause, which is a “calibration problem” in the case of “flow rate transmitters” (Table 2). Therefore, fixing the problem of calibration (Table 2) by increasing the number of verifications could be a good solution. However, this solution needs more money because this operation requires devices and operators to be paid.
Design limitations: Some designs and installations are complicated or limited, making it difficult to control the failure with sensors or monitoring instruments. For example, the maintenance action that has been recommended to decrease the O score (from 3 to 2) of the “control valve” in the “electrical subsystem” is to add a flowmeter at the outlet of the valve. The idea is to measure the outlet fluid flow; if the measure is different than the nominal value, it can be automatically concluded that the control valve fails to work correctly. However, it cannot be possible to reduce the O score to 1 by adding, for example, another flowmeter because it will serve for nothing. On the other hand, the design is limited to only one flowmeter.
External loads and natural disasters: Storms, lightning, thunder, earthquake, floods, accidents, etc., are mostly inevitable. Whatever the system’s reliability and safety, it is impossible to resist the severe natural factors. For example, it can be possible to preserve the “power box” in the “collector subsystem” from rain or floods by using a good sealing system to prevent water from entering the box. In this case, there is electric power and no disjunction in the “power box”. On the contrary, when there is a severe storm, the system disjuncts automatically because of the security system placed in electrical stations. It can be concluded from this example that it is impossible to reduce a severity index (S) to a minimal value (1) because severe natural factors are unavoidable.
Failure mode: Some failure modes occur quickly and are sometimes sudden, making these modes difficult to detect. It is, therefore, difficult to reduce their non-detectability index (D) below a certain level, despite all the detection tools.
Example 1: although it is suggested that detection sensors be installed in the “thermal storage tank”, it is not possible to decrease the D-index below three because some crack modes are less detectable.
Example 2: for the three components in the master control subsystem (peripheral tape units, line printers and printers/loggers), it was impossible to reduce the D-index because the failure modes are non-detectible.
6. Conclusions
In this study, a new approach was provided to predicate the criticality index and to improve the maintenance of hypothetical STPP. The goal of calculating the criticality index of the STPP is to determine the risk priority number of each failure mode. In other words, most system failure modes are not the same in terms of their criticality; therefore, they will not be handled in the same way. Therefore, the maintainer or designer (if the system is still under construction) must address these failures in the order of priority of their criticality, from highest to lowest CI. The most popular method used to date to address this concern is FMECA. However, this traditional method has failed to effectively prioritize CI for certain failure modes. Moreover, FMECA is a static method and cannot predict or estimate the criticality of the system in real-time. In order to resolve this problem definitively, three other methods were combined with FMECA; these methods are the expert advice method (EAM), the Bayesian network method (BN) and the artificial neural network method (ANN). The EAM is used to correct the criticality index priorities that were incorrectly estimated by the FMECA. Since FMECA and EAM can only estimate the prior CI of components, BN is used to estimate the posterior CI of subsystems and the whole system (STPP). All this static operation of determining the STPP criticality index was transformed to a dynamic system using ANN. The opportunity is to determine the CI of the STPP in real-time.
From the BN simulation, it can be noted that the CI of the STPP is 97.8. From a reliability point of view, this value is very high; therefore, the STPP needs some improvements. These later may be intrinsic (related to the design change) or extrinsic (related to the preventive maintenance operations). The most critical subsystems in this STPP are the receiver (94.3), thermal storage subsystem (96.4) and the electrical subsystem (86.2).
From FMECA and EAM, it can be found that the most critical components in these three subsystems are: the thermal storage flow rate transmitters, the receiver flow rate transmitters, the thermal storage heaters and the shutoff valves. The criticality indices of these four components are from 40 to 68; these values are very high. Therefore, the conception and the maintenance of these components must be taken seriously. However, the maintenance actions for the rest of the components that have a CI of more than 20 should not be neglected. All the maintenance actions and system improvements must follow the priority order given by the EAM method.
From the ANN method, it can be concluded that the developed ANN architecture can predict the whole system CI very well. A sample of thirty data was used to test the ANN, and the results were very good when compared to the real data. In order to reduce the overall CI of the STPP, some maintenance recommendations were proposed in this study. The overall CI of the prototype STPP was 622. Therefore, this CI was reduced to 423 after considering the suggested maintenance recommendations; it was reduced by about 30%.
Author Contributions
Conceptualization, S.B. and K.F.T.; methodology, S.B.; software, S.B.; validation, S.B. and K.F.T.; formal analysis, S.B.; investigation, K.F.T.; resources, K.F.T.; data curation, S.B.; writing—original draft preparation, S.B.; writing—review and editing, K.F.T.; visualization, S.B.; supervision, K.F.T.; project administration, S.B. and K.F.T. All authors have read and agreed to the published version of the manuscript.
Funding
This research received no external funding.
Institutional Review Board Statement
Not applicable.
Informed Consent Statement
Not applicable.
Conflicts of Interest
The authors declare no conflict of interest.
References
- Idoniboyeobu, D.C.; Ojeleye, J.A. Maintenance and management of thermal power stations Case study: The Egbin Thermal Power Station, Nigeria. NJEM 2011, 12, 29–39. [Google Scholar]
- Das, G.; Chowdhury, S.G.; Ray, A.K.; Das, S.K.; Bhattacharya, D.K. Turbine blade failure in a thermal power plant. Eng. Fail. Anal. 2003, 10, 85–91. [Google Scholar] [CrossRef]
- Lee, N.-H.; Kim, S.; Choe, B.-H.; Yoon, K.-B.; Kwon, D.-I. Failure analysis of a boiler tube in USC coal power plant. Eng. Fail. Anal. 2009, 16, 2031–2035. [Google Scholar] [CrossRef]
- Luo, X.; Zhang, Z. Leakage Failure Analysis in a Power Plant Boiler. IERI Procedia 2013, 5, 107–111. [Google Scholar] [CrossRef] [Green Version]
- Benammar, S.; Khellaf, A.; Mohammedi, K. Solar tower power plants performance and reliability analysis. In Solar Power; Bailey, S., Ed.; Nova Science Publishers, Inc.: Hauppauge, NY, USA, 2014; ISBN 978-1-63321-317-3. [Google Scholar]
- Benammar, S.; Khellaf, A. Solar Tower Power Plant Reliability Analysis using FORM method. In Proceedings of the 3ème Conférence Internationale de Mécanique (ICM’ 2017), Annaba, Algeria, 26–27 April 2017. [Google Scholar]
- Benammar, S.; Tee, K.F. Structural reliability analysis of a heliostat under wind load for concentrating solar power. Sol. Energy 2019, 181, 43–52. [Google Scholar] [CrossRef]
- Benammar, S.; Tee, K.F. Failure probability analysis of heliostat systems. Int. J. Crit. Infrastruct. 2020, 16, 342–366. [Google Scholar] [CrossRef]
- Rosende, S.B.; Sánchez-Soriano, J.; Muñoz, C.Q.G.; Andrés, J.F. Remote Management Architecture of UAV Fleets for Maintenance, Surveillance, and Security Tasks in Solar Power Plants. Energies 2020, 13, 5712. [Google Scholar] [CrossRef]
- Dinmohammadi, F.; Shafiee, M. A Fuzzy-FMEA Risk Assessment Approach for Offshore Wind Turbines. Int. J. Progn. Health Manag. 2013, 4. [Google Scholar] [CrossRef]
- Sharma, R.K.; Kumar, D.; Kumar, P. Systematic failure mode effect analysis (FMEA) using fuzzy linguistic modelling. Int. J. Qual. Reliab. Manag. 2005, 22, 986–1004. [Google Scholar] [CrossRef]
- Narayanagounder, S.; Gurusami, K. A new approach for prioritization of failure modes in design FMEA using ANOVA. World Acad. Sci. Eng. Technol. 2009, 49, 77. [Google Scholar]
- Benazzouz, D.; Benammar, S.; Adjerid, S. Fault Detection and Isolation Based on Neural Networks Case Study: Steam Turbine. Energy Power Eng. 2011, 3, 513–516. [Google Scholar] [CrossRef] [Green Version]
- Esen, H.; Ozgen, F.; Esen, M.; Sengur, A. Artificial neural network and wavelet neural network approaches for modelling of a solar air heater. Expert Syst. Appl. 2009, 36, 11240–11248. [Google Scholar] [CrossRef]
- Chaouachi, A.; Kamel, R.M.; Ichikawa, R.; Hayashi, H.; Nagasaka, K. Neural Network Ensemble-based Solar Power Generation Short-Term Forecasting. World Acad. Sci. Eng. Technol. 2009, 54, 54–59. [Google Scholar] [CrossRef] [Green Version]
- Mellit, A.; Pavan, A.M. A 24-h forecast of solar irradiance using artificial neural network: Application for performance prediction of a grid-connected PV plant at Trieste, Italy. Sol. Energy 2010, 84, 807–821. [Google Scholar] [CrossRef]
- Martin, J.; Vitko, J., Jr. ASCUAS: A Solar Central Receiver Utilizing a Solid Thermal Carrier; United States Department of Energy: Washington, DC, USA, 1982. [CrossRef]
- Kalogirou, S. Solar thermal collectors and applications. Prog. Energy Combust. Sci. 2004, 30, 231–295. [Google Scholar] [CrossRef]
- Caner, M.; Gedik, E.; Keçebaş, A. Investigation on thermal performance calculation of two type solar air collectors using artificial neural network. Expert Syst. Appl. 2011, 38, 1668–1674. [Google Scholar] [CrossRef]
- Benammar, S. Contribution to the Dependability of Hybrid Solar/Gas Tower Power Plants. Ph.D. Thesis, University M’Hemd Bougara-Boumerdes, Boumerdes, Algeria, 2015. [Google Scholar]
- Benammar, S.; Khellaf, A.; Mohammedi, K. Contribution to the modeling and simulation of solar power tower plants using energy analysis. Energy Convers. Manag. 2014, 78, 923–930. [Google Scholar] [CrossRef]
- Falcone, P. A Handbook for Solar Central Receiver Design; United States Department of Energy: Washington, DC, USA, 1986. [CrossRef] [Green Version]
- Benammar, S. A review study on the modeling and simulation of solar tower power plants. J. Sol. Energy Res. 2020, 7, 100–121. [Google Scholar]
- Hubballi, B.; Sondur, V. Investigation into the Causes of Pressure Relief Valve Failure. Int. J. Emerg. Technol. Adv. Eng. 2014, 4. Available online: https://1library.net/document/zw59pm1z-investigation-causes-pressure-relief-valve-failure.html#fulltext-content (accessed on 14 September 2021).
- Ivanov, V.; Oleinikov, A.; Denisevich, D.; Pektimirov, B. Emergency Shut-Off Valve for Pipelines. Chem. Pet. Eng. 2013, 49, 400–402. [Google Scholar] [CrossRef]
- Karpenko, M.; Sepehri, N.; Scuse, D. Diagnosis of process valve actuator faults using a multilayer neural network. Control. Eng. Pract. 2003, 11, 1289–1299. [Google Scholar] [CrossRef]
- Athanasatos, P.; Costopoulos, T. Proactive fault finding in a 4/3-way direction control valve of a high-pressure hydraulic system using the bond graph method with digital simulation. Mech. Mach. Theory 2012, 50, 64–89. [Google Scholar] [CrossRef]
- Fernández-García, A.; Juaidi, A.; Sutter, F.; Martínez-Arcos, L.; Manzano-Agugliaro, F. Solar Reflector Materials Degradation Due to the Sand Deposited on the Backside Protective Paints. Energies 2018, 11, 808. [Google Scholar] [CrossRef] [Green Version]
- Pesinis, K.; Tee, K.F. Bayesian analysis of small probability incidents for corroding energy pipelines. Eng. Struct. 2018, 165, 264–277. [Google Scholar] [CrossRef]
- Tee, K.F.; Pesinis, K. Bayesian Updating and Reliability Analysis for High-pH Stress Corrosion Cracking in Gas Pipelines. J. Eng. Mech. 2020, 146, 04020074. [Google Scholar] [CrossRef]
- Pesinis, K.; Tee, K. Bayesian updating of stochastic process-based models for corroding gas pipelines based on imperfect inspection information. In Safety and Reliability—Safe Societies in a Changing World; Taylor & Francis Group: London, UK, 2018; pp. 2219–2226. [Google Scholar] [CrossRef]
- Benammar, S.; Mohammedi, K.; Khellaf, A. Prediction of the Central Cavity Receiver’s Performance Using Artificial Neural Network. In Proceedings of the 1st International Conference on Applied Automation and Industrial Diagnostics (ICAADI’ 2015), Djelfa, Algeria, 29–30 March 2015. [Google Scholar]
- Benammar, S.; Benazzouz, D. Fault Detection and Isolation using Levenberg-Marquardt algorithm. In Proceedings of the 6th International Sym-posium on Hydrocarbons & Chemistry, Boumerdes, Algeria, 13–15 October 2012. [Google Scholar]
- Lv, C.; Xing, Y.; Zhang, J.; Na, X.; Li, Y.; Liu, T.; Cao, D.; Wang, F.-Y. Levenberg–Marquardt Backpropagation Training of Multilayer Neural Networks for State Estimation of a Safety-Critical Cyber-Physical System. IEEE Trans. Ind. Inform. 2017, 14, 3436–3446. [Google Scholar] [CrossRef] [Green Version]
- Arthur, C.K.; Temeng, V.A.; Ziggah, Y.Y. Performance Evaluation of Training Algorithms in Backpropagation Neural Network Approach to Blast-Induced Ground Vibration Prediction. Ghana Min. J. 2020, 20, 20–33. [Google Scholar] [CrossRef]
Figure 1.
Schematic of a solar tower power plant.

Figure 2.
STPP components.

Figure 3.
The steps of building a Bayesian network for STPP.

Figure 4.
Structure of the BN for STPP.

Figure 5.
Determination of the prior and posterior criticality of receiver subsystem using NETICA software.
Figure 5.
Determination of the prior and posterior criticality of receiver subsystem using NETICA software.

Figure 6.
Determination of the posterior criticality of the STPP using NETICA software.

Figure 7.
Flowchart with data pre-processing and artificial neural network training.

Figure 8.
Input and output datasets used to train and test ANN.

Figure 9.
The architecture of ANN is used for STPP.

Figure 10.
Training of the network (MSE).

Figure 11.
ANN performances.

Figure 12.
ANN testing.


Table 1.
Occurrence index.
| Failure Rate λ (Failure/h) | λ < 10−6 | 10−6 < λ < 10−5 | 10−5 < λ < 10−4 | 10−4 < λ < 10−3 | λ > 10−3 |
|---|---|---|---|---|---|
| Occurrence index (O) | 1 | 2 | 3 | 4 | 5 |
| Qualitative estimate | Improbable | Very rare | Quite rare | Rare | Frequent |
Table 2.
Receiver subsystem FMECA.
| Component | Function | Failure Mode | Failure Effect | Failure Cause | S | O | D | CI |
|---|---|---|---|---|---|---|---|---|
| Filter | Filtration of the receiver input fluid | Fails to filter | A large amount of contaminated fluid enters the receiver, which may decrease the performance of the system |
| 3 | 4 | 2 | 24 |
| Clogged | Clogging of the receiver’s inlet pipe can cause the system shutdown |
| 4 | 4 | 2 | 32 | ||
| Leakage | 4 | 4 | 2 | 32 | ||||
| Receiver Fluid Preheater Drain Valves | Draining of the receiver preheater panels | The valve does not close or stay close | Cessation of the operation of the receiver due to the lack of fluid at the inlet of the panels. |
| 5 | 3 | 2 | 30 |
| The valve does not open or stay open | Cessation of the operation of the receiver due to the lack of fluid at the inlet of the panels. | 5 | 3 | 1 | 15 | |||
| Receiver Preheater Panels | Provide for initial heating of receiver fluid | Overheating | Malfunctioning of the preheater panels causes the system to shut down. |
| 5 | 3 | 2 | 30 |
| Preheater Panel Relief Valves | Prevent preheater overpressure | Leakage | A fluid flow below the required value causes the receiver to stop | Abrade the mating surfaces until a valve leaks. | 5 | 3 | 2 | 30 |
| Flow Rate Transmitters | Measure boiler panel input fluid flow rate | Fails to operate | When the flow transmitters are not working, it creates a disturbance in the operation of the system. In this case, the system must be shut down immediately. |
| 3 | 4 | 4 | 48 |
| False output | 3 | 4 | 4 | 48 | ||||
| Boiler Panel Control Valves | Individual control of the fluid flow from the boiler panel | The valve does not open or stay open | Cessation of the operation of the receiver due to the incorrect supply pressure of the fluid. |
| 4 | 3 | 2 | 24 |
| Leakage | Failure of the seals | 4 | 3 | 2 | 24 | |||
| Fails to provide proper control | When the control valve fails to provide clean control, the system alarm sounds, and the receiver shuts down. |
| 5 | 3 | 2 | 30 |
Table 3.
Thermal Storage Subsystem FMECA.
| Component | Function | Failure Mode | Failure Effect | Failure Cause | S | O | D | CI |
|---|---|---|---|---|---|---|---|---|
| Flow Rate Transmitters | Measure system pressure | Fail to operate | When the flow transmitters are not working, it creates a disturbance in the operation of the system. In this case, the system must be shut down immediately. |
| 4 | 4 | 4 | 64 |
| False output | 4 | 4 | 4 | 64 | ||||
| Relief Valves | Protect from overpressure | The valve cannot operate when required | Potential safety hazard; reduced load capacity by the thermal storage subsystem. |
| 5 | 3 | 2 | 30 |
| Leakage | Reduced thermal storage carrying capacity, resulting in a possible inability to meet total energy requirements. | 4 | 3 | 2 | 24 | |||
| Thermal Storage Tank | Storage of heat transfer fluid | Structural failure (Leakage, crack) | Potential safety hazard; reduced load capacity by the thermal storage subsystem. |
| 5 | 2 | 4 | 40 |
| Shutoff Valves | Provide for isolation of the thermal-storage heater | The valve does not open or stay open | Reduced thermal storage capacity, resulting in an eventual inability to meet total energy requirements, which adversely affects system performance. |
| 4 | 3 | 2 | 24 |
| Leakage | 4 | 3 | 2 | 24 | ||||
| Shutoff Valve | Insulate thermal storage unit | The valve does not open or stay open | When the shutoff valve does not open or stay open, it can create a potential risk and disturbance in the system functioning. The storage system must be stopped. |
| 3 | 2 | 4 | 24 |
| Leakage or Blockage | Loss of HTF flow from thermal storage subsystem; potential safety hazard due to fluid leakage. | 4 | 2 | 4 | 32 | |||
| Output Valve | Controls Fluid output of thermal Storage unit | Leakage | Loss of HTF flow from thermal storage subsystem; potential safety hazard due to fluid leakage. | Error entering the liquid level value from the remote multiplex unit | 4 | 3 | 2 | 24 |
Table 4.
Electrical Subsystem FMECA.
| Component | Function | Failure Mode | Failure Effect | Failure Cause | S | O | D | CI |
|---|---|---|---|---|---|---|---|---|
| Control Valve | Controls feedwater flow to high-pressure heater number 2 | The valve does not open or stay open | When the electrical subsystem control valve does not open or remains open, the alarm system is triggered and the electrical subsystem stops. | Incorrect supply pressure, actuator vent blockage and diaphragm leakage [26] | 5 | 3 | 2 | 30 |
| Leakage | Loss of proper water flows from the subsystem, causing the receiving subsystem to shut down. | 5 | 3 | 2 | 30 | |||
| Angle Valve | Allows flow to the level glass of the high-pressure heater. | The valve does not open or stay open | Not a significant effect on the electrical subsystem. | Failure can be caused by a combination of increased fluid pressure as well as shear stress | 2 | 3 | 4 | 24 |
| Leakage | Loss of flow to the level glass causing the heater to shut down; the heater can be bypassed, which does not affect system performance. | 2 | 3 | 4 | 24 | |||
| 3-way Valves | Allows flow to the level glass of the high-pressure heater. | The valve does not stay open | Not a significant effect on the electrical subsystem. |
| 2 | 3 | 4 | 24 |
| Leakage | Loss of flow to the level glass causing the heater to shut down; the heater can be bypassed, which does not affect system performance. | 2 | 3 | 4 | 24 | |||
| Shutoff Valves | Insulate level controllers and switches | Leakage | Loss of proper flow to controllers or switches; as these control a number of drains in the plant, this would result in a system shutdown. |
| 5 | 2 | 4 | 40 |
| Level Switches | Provide alarm points for turbine exhaust ports | False alarm | Closing the turbine exhaust port is not necessary; the system balances itself, which does not affect system performance. | More time to react throughout the network when a switch failure is reported to the control application. | 2 | 3 | 4 | 24 |
Table 5.
Master Control Subsystem FMECA.
| Component | Function | Failure Mode | Failure Effect | Failure Cause | S | O | D | CI |
|---|---|---|---|---|---|---|---|---|
| Operational Control System Computer (CSC) | Provides central control for the entire MCS function | No output | No effect on system performance | Failure of control system computer | 2 | 1 | 1 | 2 |
| False or constant output | No effect on system performance |
| 2 | 1 | 1 | 2 | ||
| Loss of grid data | Loss of information on the network interface resulting in possible inability to commission the unit; will not affect system operation. |
| 2 | 2 | 1 | 4 | ||
| Loss of weather data | The system can be unbalanced; the manual mode will be activated. | 3 | 3 | 1 | 9 | |||
| Loss of Electrical power | No effect on system performance. | 2 | 1 | 1 | 2 | |||
| Software failure | Subsystem shutdown; however, the whole system can still be operated in a manual mode. |
| 4 | 1 | 1 | 4 | ||
| Peripheral Tape Units | Record information on magnetic tape | Fails to operate | Peripheral tape units are used for data collection only; therefore, they do not affect system performance. | Main memory is a volatile storage device. It loses its content in the case of system failure. | 1 | 1 | 4 | 4 |
| Peripheral Line Printer | Provides means for hard-copy data production | Fails to operate | Peripheral line printers are used for data collection only; therefore, they do not affect system performance. | Short-circuit may cause failure and reliability problems in Peripheral Line Printer. | 1 | 1 | 4 | 4 |
| Peripheral Printer/Loggers | Provides means for hard-copy data production | Fails to operate | Peripheral printers/loggers are used for data collection only; therefore, they do not affect system performance. | Short-circuit may cause failure and reliability problems in Peripheral Line Printer. | 1 | 1 | 4 | 4 |
Table 6.
Collector subsystem FMECA.
| Component | Function | Failure Mode | Failure Effect | Failure Cause | S | O | D | CI |
|---|---|---|---|---|---|---|---|---|
| Mirror unit | Collects and reflects the sunlight onto a receiver | Fails to collect or reflect | Insufficiency of energy to be absorbed by the receiver (loss of performance) |
| 3 | 2 | 1 | 6 |
| Cracking or shearing of mirror | Loss of performances |
| 3 | 1 | 2 | 6 | ||
| Pedestal | Supports the mirror unit and the torque tube | Structural Failure | Serious damage of the heliostat unit leads to a decrease in the energy to be reflected onto the receiver |
| 4 | 3 | 1 | 12 |
| Drive mechanism | Generate the movement of the mirror around the azimuth and elevation axis | Motors fail to move | The mirror cannot track the sun |
| 3 | 2 | 2 | 12 |
| Locking of gears or bearings | The mirror cannot track the sun |
| ||||||
| Torque tube | Supports the trusses and the mirror unit | Structural failure | Serious damage to the mirror leads to a decrease in the energy to be reflected onto the receiver |
| 4 | 3 | 1 | 12 |
| Powerbox | Provides power to electrical motors and control systems | Overheating or disjunction | Heliostat stop working.Possibility of causing a fire |
| 3 | 1 | 3 | 9 |
Table 7.
EAM prioritization.
| Component | Component Order | S | O | D | CI | FMECA Priority | EAM Priority |
|---|---|---|---|---|---|---|---|
| Flow Rate Transmitters (thermal storage subsystem) | 1 | 4 | 4 | 4 | 64 | 1 | 1 |
| Flow Rate Transmitters (receiver subsystem) | 2 | 3 | 4 | 4 | 48 | 2 | 2 |
| Thermal Storage Heaters | 3 | 5 | 2 | 4 | 40 | 3 | 3 |
| Shutoff Valves | 4 | 5 | 2 | 4 | 40 | 3 | 4 |
| Filter | 5 | 4 | 4 | 2 | 32 | 4 | 6 |
| Shutoff Valve | 6 | 4 | 2 | 4 | 32 | 4 | 5 |
| Receiver Fluid Preheater Drain Valves | 7 | 5 | 3 | 2 | 30 | 5 | 7 |
| Receiver Preheater Panels | 8 | 5 | 3 | 2 | 30 | 5 | 6 |
| Preheater Panel Relief Valves | 9 | 5 | 3 | 2 | 30 | 5 | 7 |
| Boiler Panel Control Valves | 10 | 5 | 3 | 2 | 30 | 5 | 7 |
| Relief Valves | 11 | 5 | 3 | 2 | 30 | 5 | 7 |
| Control Valve | 12 | 5 | 3 | 2 | 30 | 5 | 7 |
| Level Switches | 13 | 2 | 3 | 5 | 30 | 5 | 8 |
| Shutoff valves | 14 | 4 | 3 | 2 | 24 | 6 | 9 |
| Output Valve | 15 | 4 | 3 | 2 | 24 | 6 | 9 |
| Angle Valve | 16 | 2 | 3 | 4 | 24 | 6 | 10 |
| 3-way Valves | 17 | 2 | 3 | 4 | 24 | 6 | 10 |
| Pedestal | 18 | 4 | 3 | 1 | 12 | 7 | 11 |
| Drive mechanism | 19 | 3 | 2 | 2 | 12 | 7 | 12 |
| Torque tube | 20 | 4 | 3 | 1 | 12 | 7 | 11 |
| Power box | 21 | 1 | 3 | 3 | 9 | 8 | 13 |
| Operational Control System Computer | 22 | 3 | 3 | 1 | 9 | 8 | 12 |
| Mirror | 23 | 3 | 2 | 1 | 6 | 9 | 14 |
| Peripheral Tape Units | 24 | 1 | 1 | 4 | 4 | 10 | 15 |
| Peripheral Line Printer | 25 | 1 | 1 | 4 | 4 | 10 | 15 |
| Peripheral Printer/Loggers | 26 | 1 | 1 | 4 | 4 | 10 | 15 |
Table 8.
Identification of variables and criticality assessment of STPP.
| ID | Component (Variable) | S | O | D | A Prior CI | A Posterior CI |
|---|---|---|---|---|---|---|
| 1 | STPP | 97.8 | ||||
| 11 | Receiver Subsystem | 94.3 | ||||
| 111 | Filter | 4 | 4 | 2 | 32 | |
| 112 | Receiver Fluid Preheater Drain Valves | 4 | 3 | 2 | 24 | |
| 113 | Receiver Preheater Panels | 5 | 3 | 2 | 30 | |
| 114 | Preheater Panel Relief Valves | 5 | 3 | 2 | 30 | |
| 115 | Flow Rate Transmitters | 3 | 4 | 4 | 42 | |
| 116 | Boiler Panel Control Valves | 5 | 3 | 2 | 30 | |
| 12 | Thermal Storage Subsystem | 96.4 | ||||
| 121 | Flow Rate Transmitters | 4 | 4 | 4 | 64 | |
| 122 | Relief Valves | 5 | 3 | 2 | 30 | |
| 123 | Thermal Storage Heaters | 5 | 2 | 4 | 40 | |
| 124 | Shutoff valves | 4 | 3 | 2 | 24 | |
| 125 | Shutoff Valve | 4 | 2 | 4 | 32 | |
| 126 | Output Valve | 4 | 3 | 2 | 24 | |
| 13 | Electrical Subsystem | 86.2 | ||||
| 131 | Control Valve | 5 | 3 | 2 | 30 | |
| 132 | Angle Valve | 2 | 3 | 4 | 24 | |
| 133 | 3-way Valves | 2 | 3 | 4 | 24 | |
| 134 | Shutoff Valves | 5 | 2 | 4 | 40 | |
| 135 | Level Switches | 2 | 3 | 5 | 30 | |
| 14 | Master Control Subsystem | 19.8 | ||||
| 141 | Operational Control System Computer | 3 | 3 | 1 | 9 | |
| 142 | Peripheral Tape Units | 1 | 1 | 4 | 4 | |
| 143 | Peripheral Line Printer | 1 | 1 | 4 | 4 | |
| 144 | Peripheral Printer/Loggers | 1 | 1 | 4 | 4 | |
| 15 | Collector Subsystem | 40.5 | ||||
| 151 | Mirror | 3 | 2 | 1 | 6 | |
| 152 | Pedestal | 4 | 3 | 1 | 12 | |
| 153 | Drive mechanism | 3 | 2 | 2 | 12 | |
| 154 | Torque tube | 4 | 3 | 1 | 12 | |
| 155 | Power box | 3 | 1 | 3 | 9 |
Table 9.
Statistical values of main simulated architectures.
| Architecture | SSE (×10−5) | RMSE (×10−4) | MRE (×10−4) | R2 |
|---|---|---|---|---|
| 5-5-1 | 2.5684 | 4.6264 | 4.6855 | 0.9951 |
| 5-6-1 | 5.6083 | 6.8364 | 7.9738 | 0.9912 |
| 5-7-1 | 3.8922 | 5.6952 | 4.9516 | 0.9939 |
| 5-8-1 | 2.9190 | 4.9002 | 3.5121 | 0.9944 |
| 5-9-1 | 3.7971 | 5.6252 | 5.6959 | 0.9936 |
| 5-10-1 | 10.137 | 9.1912 | 9.6966 | 0.9833 |
| 5-11-1 | 5.3341 | 6.6671 | 6.6264 | 0.9905 |
| 5-12-1 | 7.2435 | 7.7693 | 9.8525 | 0.9876 |
| 5-13-1 | 2.9415 | 4.9797 | 5.2408 | 0.9952 |
| 5-14-1 | 12.480 | 10.00 | 10.00 | 0.9800 |
| 5-15-1 | 12.589 | 10.00 | 12.00 | 0.9786 |
| 5-16-1 | 37.211 | 5.5686 | 6.2180 | 0.9942 |
| 5-17-1 | 2.9284 | 4.9400 | 5.3905 | 0.9954 |
| 5-18-1 | 2.8887 | 4.9064 | 4.4387 | 0.9949 |
| 5-19-1 | 5.0658 | 6.49 | 7.8502 | 0.9916 |
| 5-20-1 | 2.9226 | 4.9351 | 3.4569 | 0.9947 |
Table 10.
Recommended maintenance actions for STPP to reevaluate the CI.
| Receiver Subsystem | |||||
|---|---|---|---|---|---|
| Recommended Action | Re-Evaluation | ||||
| Component | Action | S | O | D | CI |
| Filter |
| 4 | 2 | 2 | 16 |
| Receiver fluid preheater drain valves |
| 5 | 3 | 2 | 30 |
| Receiver preheater panels |
| 5 | 3 | 2 | 30 |
| Preheater panel relief valves |
| 5 | 3 | 2 | 30 |
| Flow rate Transmitters |
| 3 | 2 | 4 | 24 |
| Boiler panel control valves |
| 5 | 1 | 2 | 10 |
| Thermal Storage Subsystem | |||||
| Component | Action | S | O | D | CI |
| Flow Rate Transmitters |
| 4 | 2 | 2 | 16 |
| Relief Valves |
| 5 | 3 | 2 | 30 |
| Thermal Storage Tanks |
| 5 | 1 | 3 | 15 |
| Shutoff valves |
| 4 | 3 | 2 | 24 |
| Shutoff Valve |
| 4 | 2 | 4 | 32 |
| Output Valve |
| 4 | 3 | 2 | 24 |
| Collector Subsystem | |||||
| Component | Action | S | O | D | CI |
| Mirror |
| 3 | 1 | 1 | 3 |
| Pedestal |
| 4 | 1 | 1 | 4 |
| Drive mechanism |
| 3 | 2 | 2 | 12 |
| Torque tube |
| 4 | 1 | 1 | 4 |
| Powerbox |
| 1 | 2 | 3 | 6 |
| Electrical Subsystem | |||||
| Component | Action | S | O | D | CI |
| Control Valve |
| 5 | 2 | 2 | 20 |
| Angle Valve |
| 2 | 2 | 4 | 16 |
| 3-way Valves |
| 2 | 2 | 4 | 16 |
| Shutoff Valves |
| 5 | 1 | 4 | 20 |
| Level Switches |
| 2 | 3 | 5 | 30 |
| Master Control Subsystem | |||||
| Component | Action | S | O | D | CI |
| Operational Control System Computer |
| 3 | 1 | 1 | 3 |
| Peripheral Tape Units |
| 1 | 1 | 4 | 4 |
| Peripheral Line Printer |
| 1 | 1 | 4 | 4 |
| Peripheral Printer/Loggers |
| 1 | 1 | 4 | 4 |
Publisher’s Note: MDPI stays neutral with regard to jurisdictional claims in published maps and institutional affiliations. |
© 2021 by the authors. Licensee MDPI, Basel, Switzerland. This article is an open access article distributed under the terms and conditions of the Creative Commons Attribution (CC BY) license (https://creativecommons.org/licenses/by/4.0/).
Share and Cite
MDPI and ACS Style
Benammar, S.; Tee, K.F. Criticality Analysis and Maintenance of Solar Tower Power Plants by Integrating the Artificial Intelligence Approach. Energies 2021, 14, 5861. https://0-doi-org.brum.beds.ac.uk/10.3390/en14185861
AMA Style
Benammar S, Tee KF. Criticality Analysis and Maintenance of Solar Tower Power Plants by Integrating the Artificial Intelligence Approach. Energies. 2021; 14(18):5861. https://0-doi-org.brum.beds.ac.uk/10.3390/en14185861
Chicago/Turabian StyleBenammar, Samir, and Kong Fah Tee. 2021. "Criticality Analysis and Maintenance of Solar Tower Power Plants by Integrating the Artificial Intelligence Approach" Energies 14, no. 18: 5861. https://0-doi-org.brum.beds.ac.uk/10.3390/en14185861
Note that from the first issue of 2016, this journal uses article numbers instead of page numbers. See further details here.