
Complex Design Method of Filtration Station Considering Harmonic Components


Department of Power Electronics, FEE, University of West Bohemia, 301 00 Plzeň 3, Czech Republic
*
Author to whom correspondence should be addressed.
Energies 2021, 14(18), 5872; https://0-doi-org.brum.beds.ac.uk/10.3390/en14185872
Submission received: 28 July 2021
/
Revised: 7 September 2021
/
Accepted: 8 September 2021
/
Published: 16 September 2021
(This article belongs to the Special Issue Power Quality in Electrified Transportation Systems)
Abstract
:The paper deals with a new methodology for calculating the filter parameters. The basis is respect for the fact that the real filter current consists of other harmonic components, which filter is tuned. The proposed methodology was used to design filters for traction substation 25 kV/50 Hz. The operation of the locomotives in the AC supply systems of 25 kV/50 Hz leads to a rising of higher order harmonic currents. Due to the 1-phase supply system, these are mainly the 3rd and 5th harmonics. By simulation and subsequent measurement of the proposed traction power station filters the proposed methodology was verified. Thus, the filter design can also be used for filter compensating stations of the standard 3-phase distribution network. The described method presents an optimal filter design without unnecessary oversizing. This fact reduces the size and cost of the filter. It is shown that it is possible to design a filter that meets the requirements for power quality under extreme load and to minimise distortion of line voltage.
1. Introduction
The amount and power of non-linear loads are growing steadily. Although the connection and converter control are also completed with respect to the reduction of harmonic currents, it is often necessary to equip the substations with equipment for harmonics minimization and power factor compensation. The classic solution is to install filters tuned to the desired harmonics. The integral (physical) property of the filters is also the power factor compensation.
The advantage of tuned filters is their low cost. Filters are usually tuned to the 5th and 7th harmonic, in exceptional cases, on the 11th and 13th harmonic. For single-phase systems, it is usually on the 3rd and 5th harmonic. The design of filters also for high powers is well described in the literature, for example [1,2]. They can also be used in a combination with a broadband filter, or other connection for high order harmonics [3,4]. In articles, filters are tuned to a characteristic harmonic. Their designs are based on fundamental relations of Theoretical Electrical Engineering. As the power filters also has compensation effect, overcompensation of the system can occur at high loads. Therefore, it is necessary to equip the substation with a quick decompensation unit [5,6]. Using filters and decompensation unit in the traction system is described in [7]. Another way is to use active filters or other types of electronic converters [8,9,10]. The advantage of these systems is a better filtering and compensating effect. The disadvantage is a considerably higher price. The effects of filters designed for resonant frequency, in addition to extreme loads, are described in [11]. Verification of the effect of the filter is achieved from the impedance ratio of the filter and the system or through simulations. At the same time, one can check the current load of the filter. Due to the load, it is necessary to change the parameters of the filter capacitor and repeat the calculations. Consequently, its compensation power is also checked. The second option is an under-tuning of the filter. This will reduce the current stress on the filter, but also reduces the filtering effect.
This article describes the derivation of a new filter design method for a traction power station. Electric traction is specific in its power level and single-phase character. In extreme cases, traction overhead lines can reach up to 50 km in length. This also produced harmonic voltages whose values significantly distorted the AC waveform [12].
For new types of locomotives, harmonic currents are significantly reduced. The reference [13] describes measurement of harmonic components of modern locomotives in the UK. In operation, however, a number of older types of locomotives are equipped with diode and thyristor 1-phase rectifiers, which take a considerably distorted current from an overhead line. It is estimated that 32% of diode and thyristor locomotives are still in operation. In the section where the proposed filters were installed (see Figure 1), the amount of these locomotives is an even 80%. Since it is necessary to accept new power quality requirements and reduce losses, many traction stations need to be supplemented by equipment for harmonics reduction and power factor compensation.
The basis of the new methodology is to determine the power of the filter capacitor so that the required filtering and compensating effect is already included directly in the filter design. Using this method does not overload the filter. The filter then has the greatest filtering effect at minimal financial costs.
Since the harmonic currents of the other orders are presented in the overhead line currents and the filter design does not respect this fact, due to the impedance conditions, these currents also pass through some filters. To avoid overloading the filters, it is necessary to design the filters even with respect to these harmonic currents. In the described calculations, these harmonics are also accepted in the design.
The proposed methodology describes the optimum filter design without unnecessary oversizing; thereby it reduces the price, weight, size, and filter losses. The filter tuned to a specific harmonic is also loaded by other harmonics. The standard design oversizes the filter to protect its damage. The described methodology enables optimal filter design considering the calculation of a specific harmonic and other main harmonics.
The method is applied in the design of the substation for traction overhead lines of 25 kV/50 Hz. The proposed methodology is verified simulations and measurements in real traffic.
2. The Method of Filter Compensation Unit Design
The issue of filter design for high voltage and high power (in order MVAr) is relatively difficult. It is solved e.g., in [14]. At present, it may be constructing the new traction power station also with the active filters, e.g., [15,16,17].
2.1. The Initial Data for the Filter Design
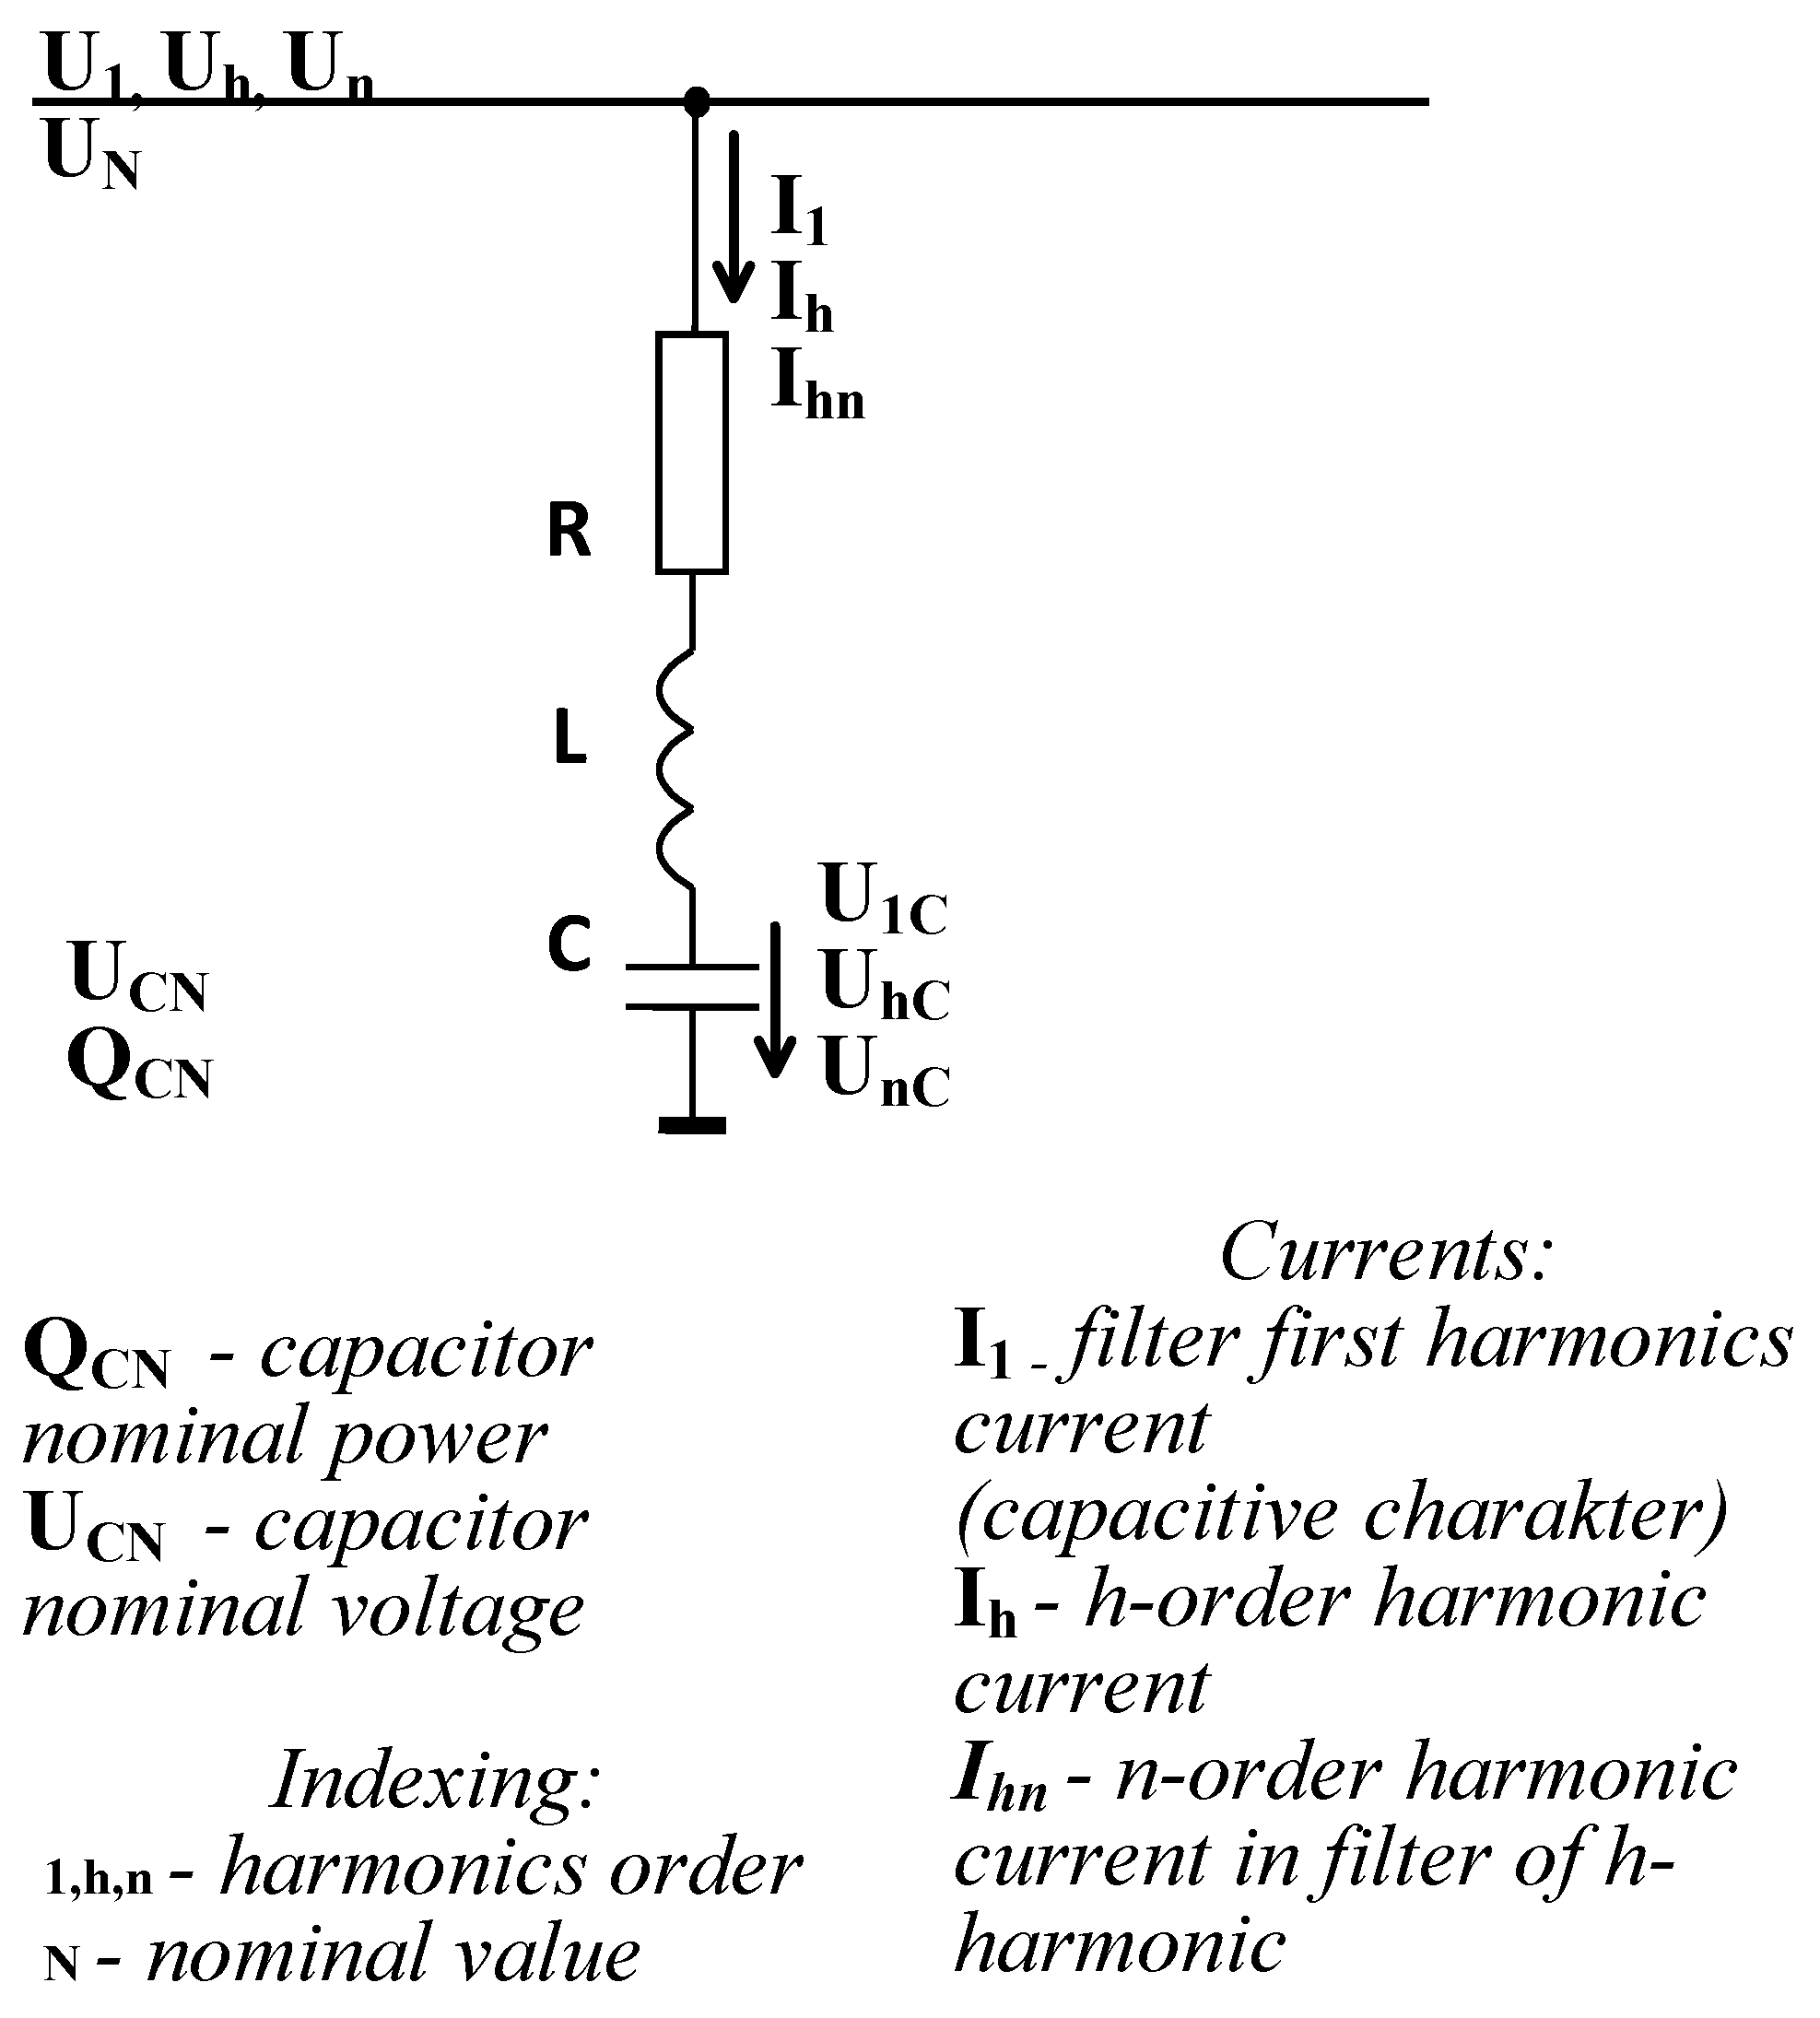
The design requires the following data (see Figure 2):
- The individual harmonic currents to be filtered, especially those of h-orders;
- The total compensating power required, Qkreq, to be supplied to the traction power network;
- The voltage U1 at the point where filters are going to be installed.
It is necessary to determine the following basic parameters:
- The nominal voltage UCN and the nominal installed power QCN of the capacitor;
- The current and inductance of the filter reactor, and the effective resistance R of the filter reactor.
2.2. Derivation of Basic Relations
The resonance condition for the h-th harmonic is:
Assuming that R = 0, the voltage of the first harmonic across the capacitor C for the filter of the h-th harmonic (important for the UCN determination → capacitor design) is:
By introducing the voltage increase coefficient of the first harmonic across the capacitor:
The following is valid:
The parameters of power capacitors are usually determined by the value of the nominal power QCN at the nominal voltage UCN. Then the nominal power of the capacitor is:
For the first harmonic current passing through the filter of the h-th harmonic, the following is valid:
This current has a capacitive character and the filter of the h-th harmonic supplies the traction overhead line with the compensating power:
2.3. Simplified Design of the Capacitor Battery
The equations mentioned above do not lead to the device dimensioning. The current passing through the individual filter elements determines the current dimensioning of the filter parts. Voltage drops across the filter impedances, caused by this current together with the supply voltage, determine the voltage load and thus the capacitor battery dimensioning.
In order to formulate the mathematical relations more easily, the following are first assumed:
- Only the compensating current and the h-order current, for which the filter is designed, pass through each filter;
- The traction overhead line voltage U1 can be permanently higher than the nominal voltage UN;
- The voltage across the capacitor UC can be permanently higher than its nominal voltage UCN;
- The capacitor current IC can be permanently higher than its nominal current ICN.
Based on these assumptions, it is necessary to prevent the capacitor from either current or voltage overload. It must comply with both current and voltage conditions of the solution. The following is valid:
where
- kus—the nominal voltage increase factor of the traction overhead line;
- κi—the nominal current increase factor of the capacitor;
- κu—the nominal voltage increase factor of the capacitor.
2.4. Basic Design of Capacitor Banks
In Equation (9) the kus constant is set by a standard (EN 50, 160 or national standards), the other two constants are set by the manufacturers of capacitors.
2.4.1. Calculation Based on the Current Conditions
The calculation is based on the assumptions mentioned above, i.e., only the compensating current and the h-order harmonic current which is to be eliminated pass through the filter. Then the following is valid:
By inserting the above-mentioned relations and after formal rearrangements, the relation for the value of the capacitor minimal power QCNmin is obtained:
The calculation of QCNmin ensures that the capacitor will not be overloaded with current. The resulting power of the capacitor then will be higher.
2.4.2. Calculation Based on the Voltage Condition
As in the previous section, it is possible to define the voltage condition for the determination of the minimal power of the capacitor battery:
Yielding the equation defining the value of the minimal power of the capacitor:
NB: The index “i” in (11) denotes the power calculated on the basis of the current condition. Similarly, the index “u” in (13) denotes the power calculated on the basis of the voltage condition.
2.4.3. Determination of the Minimal Installed Power
In order to achieve further simplification, it is possible to introduce auxiliary quantities, i.e., the apparent power Sh, caused by the harmonic current across an ideal voltage source, and coefficients ku and ki, taking into account the capacitors’ load:
When applying the introduced coefficients, the following are valid for the minimum values of power of capacitor:
The minimal value of the installed power is then acquired as the higher value obtained from Equation (17).
2.5. Calculation Taking into Account Non-Filtered Harmonics
The equations derived in the previous sections are derived for an ideal situation, when only the compensating current of the first harmonic I1 and the current of the h-order to which the filter is tuned pass through the filter. The actual voltage and current are distorted by a whole spectrum of characteristic and non-characteristic harmonics. This results in an additional load each capacitor is subjected to, as part of the current of other harmonics In to which the filter is not tuned, passes through the filter. The following section demonstrates the derivation of the influence of the current non-filtered harmonics on the power load of the filter.
The filter is tuned to the frequency f = h.f1. Here, the frequency f can be arbitrary. Part of the harmonic currents of other (non-filtered) orders pass through the filter at the same time. Now it is possible to rearrange Equation (10), and subsequently Equation (12), that they meet the new conditions for the determination of the minimal power of the capacitor:
The third part of the radicand in Equation (18) and Equation (19) corresponds to the proportion of the higher order harmonics (i.e., the non-filtered harmonics) which influence the filter load.
Taking into account the load of the capacitors, the coefficients kuC and kiC f from Equation (15) and Equation (16) can be rearranged as follows:
The subsequent procedure is the same; Equation (17) is used.
2.6. Selection of the Capacitor according to the Required Compensating Power
The relations mentioned above are used for the determination of the minimal power of a capacitor. The minimal compensating power expressed by means of Equation (8) is as follows:
where kh is the coefficient determined on the basis of the current or voltage condition by means of the relations of Equations (16) and (17), and Equations (20) and (21).
2.7. Calculation of Filter Inductance
From the resonance condition and the relation for the capacitor power, it is possible to derive:
3. Design of Filters for Traction Supply Stations
3.1. Determination of Key Parameters
3.1.1. The Required Compensating Power
The determination of the minimal compensating power of filters is based on the length of the traction overhead line and the track structure (thus the number of locomotives is determined together with their maximum power on the track). Based on the requirements of the track operator, as much as 110 A of inductive current needs to be smoothed out. The corresponding value of the compensating power required is Qkreq = 2970 kVAr.
3.1.2. Requirements for Filtering of Harmonic Currents
Harmonic currents can be determined by a calculation based on the amplitude law and an assumed load, or by measurements. If measurements cannot be performed, a method based on experience with similar existing devices is used. For a single-phase load, the selected filters will be tuned close to the third and fifth harmonics. The filter selected for the third harmonic will filter the third harmonic current and at the same time, it will exhibit the highest percentage of compensating power. In contrast, the fifth harmonic filter will exhibit low compensation, but it will also reduce currents of higher harmonic orders to some extent.
It is also necessary to install a decompensation reactor in the traction supply station. With respect to the required compensating power of filters, the selected nominal current is IDC = 120 A. This switching reactor is also a source of other harmonic currents, which need to be added to the harmonics in the traction overhead line. Table 1 shows the values of the currents measured under a maximum load of the traction overhead line, which need to be added to the values of harmonics produced by the decompensation element. Other harmonics exhibit negligible values from the viewpoint of the filter load.
3.1.3. Proportional Values of Higher Harmonic Voltages
In addition to the effects of the compensating current and the fifth harmonic current, the dimensioning of the fifth harmonic filter will also be affected by values of harmonic currents of higher orders. Table 2 shows values obtained by measurements performed at a maximum load. The values for the 7th to 13th harmonics are crucial for the design of a filter, taking into account the effect of the non-filtered harmonics.
3.2. Simplified Calculation of a Capacitor
3.2.1. Calculation of the Nominal Voltage UCN of a Capacitor
The nominal output voltage of the traction supply station is UN = 27,000 V. According to Equations (3) and (4), the first harmonic voltage across the capacitor is U1C3 = 30,375 V for the third harmonic filter and U1C5 = 28,125 V for the fifth harmonic filter. Taking into account the voltage and the requirement for the lowest possible number of capacitors connected in series, the selected value of the nominal voltage of capacitors is UCN = 2 × 20,000 = 40,000 V.
3.2.2. Calculation of the Minimum Power QCNmin of a Capacitor
First, coefficients are determined according to Equations (15) and (16):
kic3 = 1.594; kic5 = 1.508; kuc3 = 1.635; kuc5 = 0.508;
These values indicate that the third harmonic filter will be designed on the basis of the voltage condition in Equation (12), and the fifth harmonic filter on the basis of the current condition in Equation (10).
According to Equation (14), the apparent power of the filter for the selected harmonics is Sh3 = 1611.9 kVA; Sh5 = 567 kVA. By applying coefficients kuc3 and kic5, the value of the minimum installed power of a capacitor is QCN3 = 2635.4 kVAr; QCN5 = 855 kVAr.
3.3. Calculation of a Capacitor with Respect to Non-Filtered Harmonics
In this section, the calculation described in Section 2.4 is modified, e.g., in respect to the effects of harmonics to which the filter is not tuned.
Most harmonic currents of the fifth order and higher orders will pass through the fifth harmonic filter. According to Equations (20) and (21), the design takes into account a certain share of these harmonics in the load of the filter (actually, the third harmonic filter will not be loaded with these currents). To make the calculation clear, the value of the denominator of the fraction in the third part of Equation (20) is calculated first. Then the values of the whole fraction for the individual harmonics are calculated by applying Table 2. Table 3 shows the results. With respect to the designed power of the third harmonic filter, the design now focuses on the filter of the fifth harmonic.
The values in the second line of the table in fact show the proportional value of the filtration of the listed harmonics. The values that are taking into account the actual voltage distortion are listed in the bottom line of the table. By applying results from Table 3, the values of coefficients ki and ku are: kuc5 = 0.505; kic5 = 1.557;
Now the capacitor design is based on the current condition (18). By applying Equations (17) and (20), the calculated value of the minimum installed power of a capacitor is QCN5 = 883 kVAr.
3.4. Compensating Power of Filters
By means of Equation (22) and the necessary minimal power of the filter capacitor, the compensating power is determined: Qk3 = 1485.8 kVAr; Qk5 = 459 kVAr. The total compensating power of the traction supply station is Qk = 1485.8 + 459 = 1918 kVAr. This value is lower than the value required Qkreq = 2970 kVAr. As the main portion of the compensation will be achieved by the third harmonic filter (as required by the investor), its compensating power has to be the following: Qk3 = 2970 − 459 = 2511 kVAr. Then, by means of Equation (20), the following is true:
3.5. Compensating Power of Filters
Taking into account UCN = 40 kV and the minimal QCN required, the following are selected according to datasheets:
Filter F3: 8 units connected, UCN = 20 kV and QCN = 535.6 kVAr each. Then QCN3 = 4284.8 kVAr.
Filter F5: 4 units connected, UCN = 20 kV and QCN = 223.7 kVAr each. Then QCN5 = 894.8 kVAr.
For further calculations based on the voltages and powers mentioned above, the following is true: CF3 = 8.52 µF and CF5 = 1.78 µF.
The actual compensating power of installed filters will be Qk = 3171 kVAr, which is a higher value than the required Qkreq.
As the principle of the proposed method is to ensure the maximum exploitation of the filter power without concerns over overloading the filter with other harmonics, it is in this case possible to tune the filters to frequencies relatively close to the resonance frequency of harmonic currents. Filters will therefore be tuned to the frequencies of: fr3 = 147 Hz; fr5 = 247 Hz. Based on the resonance condition, values of filter inductance are then calculated: LF3 = 137.6 mH; LF5 = 233.25 mH.
Figure 3 gives an overall view of the traction substation, where the filters were designed according to this new method and installed. The filters themselves are housed with components in separate cells in a substation.
4. Simulation of Effects of Filters in the Traction System
4.1. Description of the Traction System and Its Parameters
Before the installation itself, the effects of filters were verified by simulations. The methods of modelling and the traction specifics are described in [18]. Article [19] is concerned with resonances occurring in the traction system, which can significantly influence the results. The following sections will deal with steady-state simulations and measurements. Transient phenomena are the concern of article [20].
Basic parameters of the system:
- Short-circuit power on high voltage (110 kV) line: SKS’’ = 19,702 MVA;
- The value calculated for the selected voltage level is then 27 kV: LES = 2.15 mH;
- The transformer in the substation: SNT = 12.5 MVA, 110/27 kV, 50 Hz, uk = 12.5%, Pk = 80 kW;
- By calculation, the following values are obtained: RNT = 0.373 [Ω], LNT = 22.88 mH.
The values of harmonic currents used in simulations are obtained from the measurements performed and are listed in Table 1. The length of the traction overhead line is extreme and reaches a length of up to 50 km from the traction substation. The line parameters per one kilometre are: Rvk = 0.26 Ω/km; Lvk = 1.43 mH/km; Cvk = 20.5 nF/km. The modelling principles and details are described in [21].
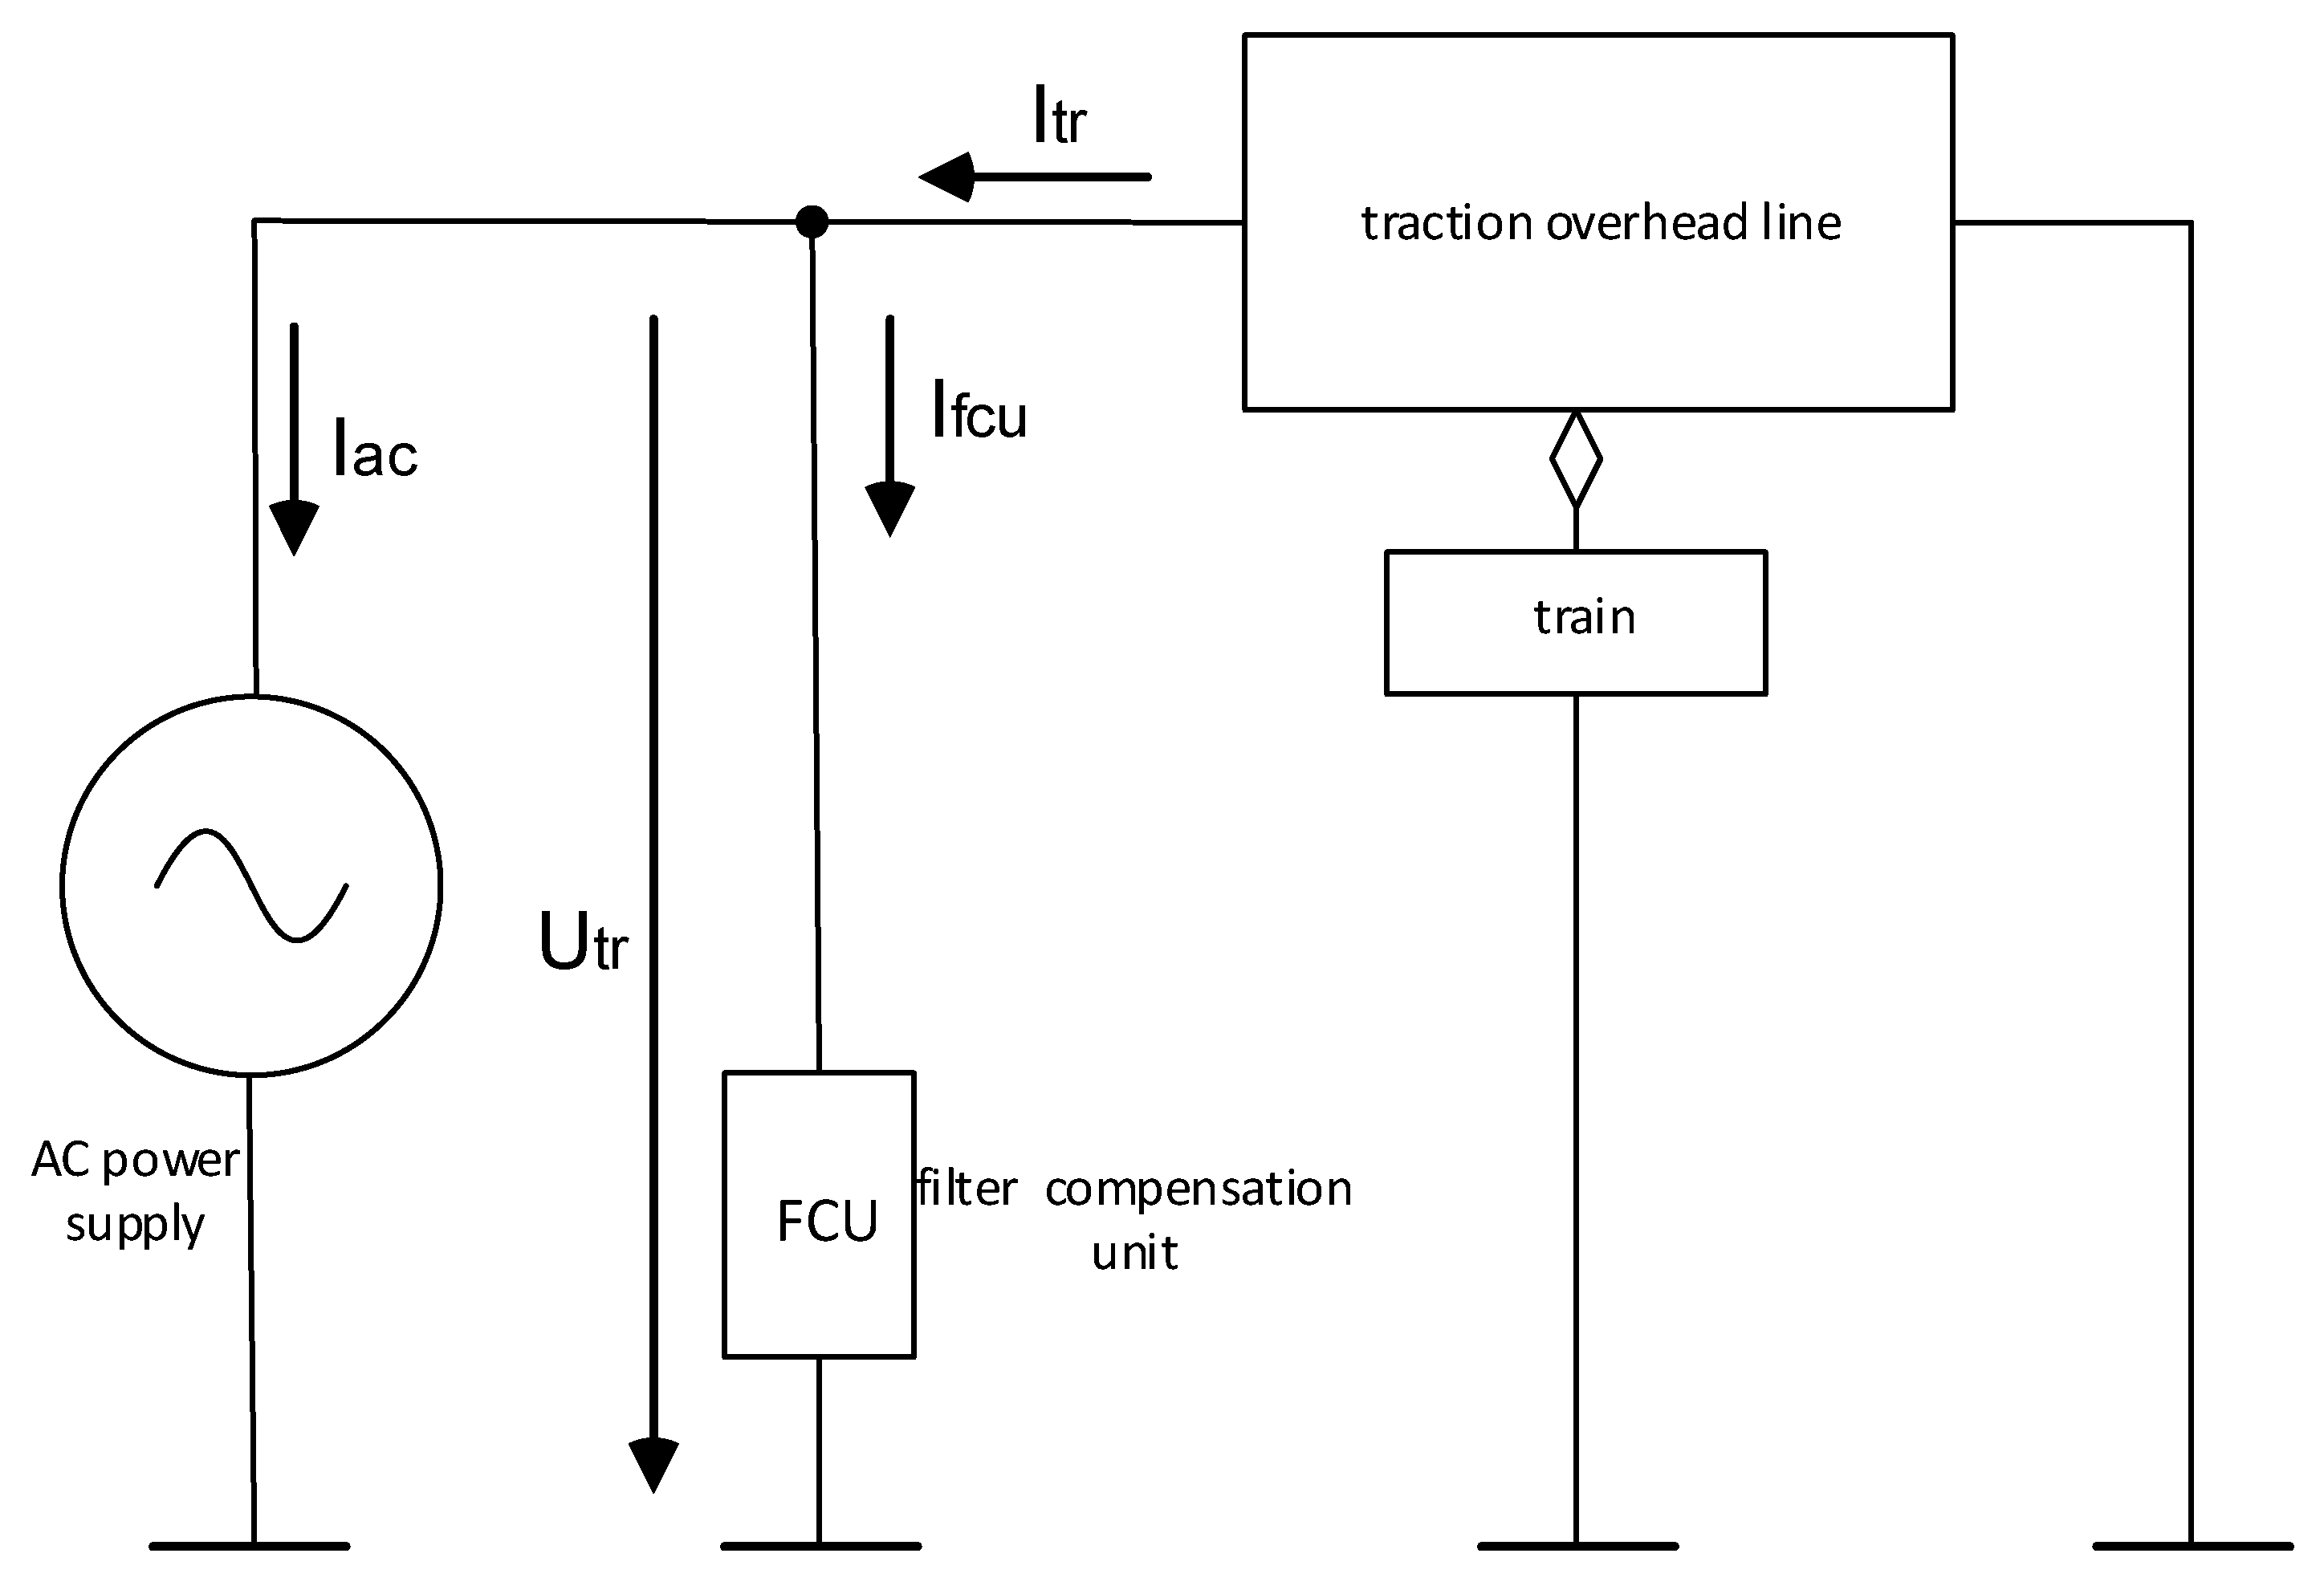
Overview scheme of the overall system presents the Figure 4. For research of a filtration traction station design, it is necessary to specify the individual parts of the system:
- Power supply network;
- Overhead line;
- Locomotive (train);
- Filter compensation unit (FCU).
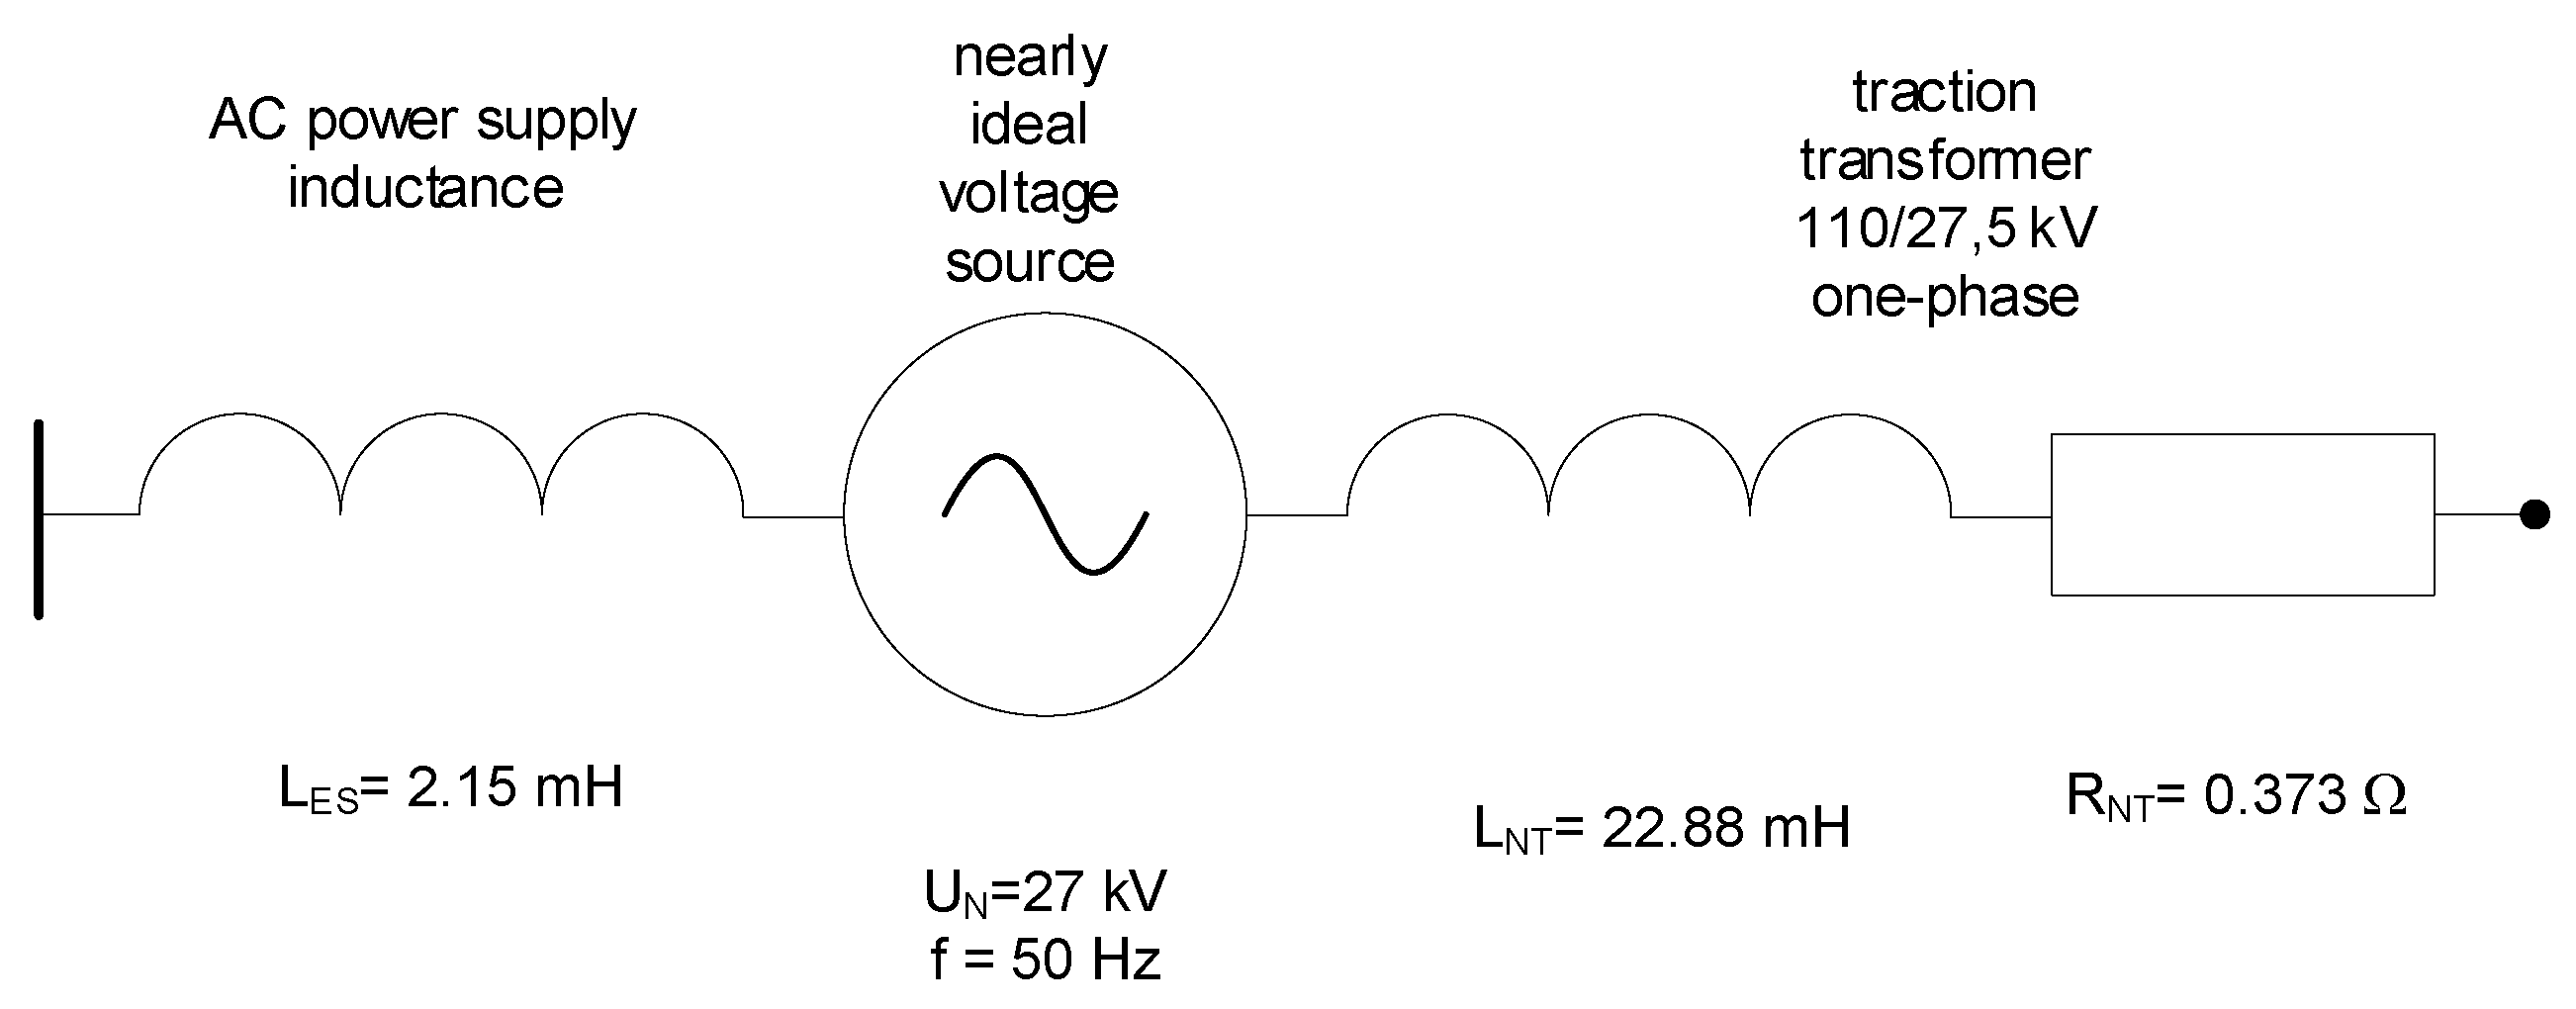
4.1.1. Power Supply Network (AC Power Supply)
Power supply network is characterised by inductance, which can be calculated by knowledge of the short-circuit power (at HV line 110 kV). Supply system 110 kV has a short-circuit power of SKS’’ = 10,000 MVA. The nominal overhead line voltage is considered 27.5 kV. The appropriate inductance of the overhead line is LES = 2.15 mH. The AC power supply 25 kV is assumed as ideal sinewave source by its first harmonic and constant amplitude.
The proportion of any harmonic voltage would be low in comparison to the voltage resulting from harmonic currents by locomotives. The traction substation transformer rated parameters are: SNT = 12.2 MVA, 110/27.5 kV, 50 Hz, uk = 12.5%, Pk = 80 kW. By the calculation, there are: ZNT = 7.23 Ω, RNT = 0.373 Ω, LNT = 22.88 mH.
The model of the power supply system is shown in the Figure 5.
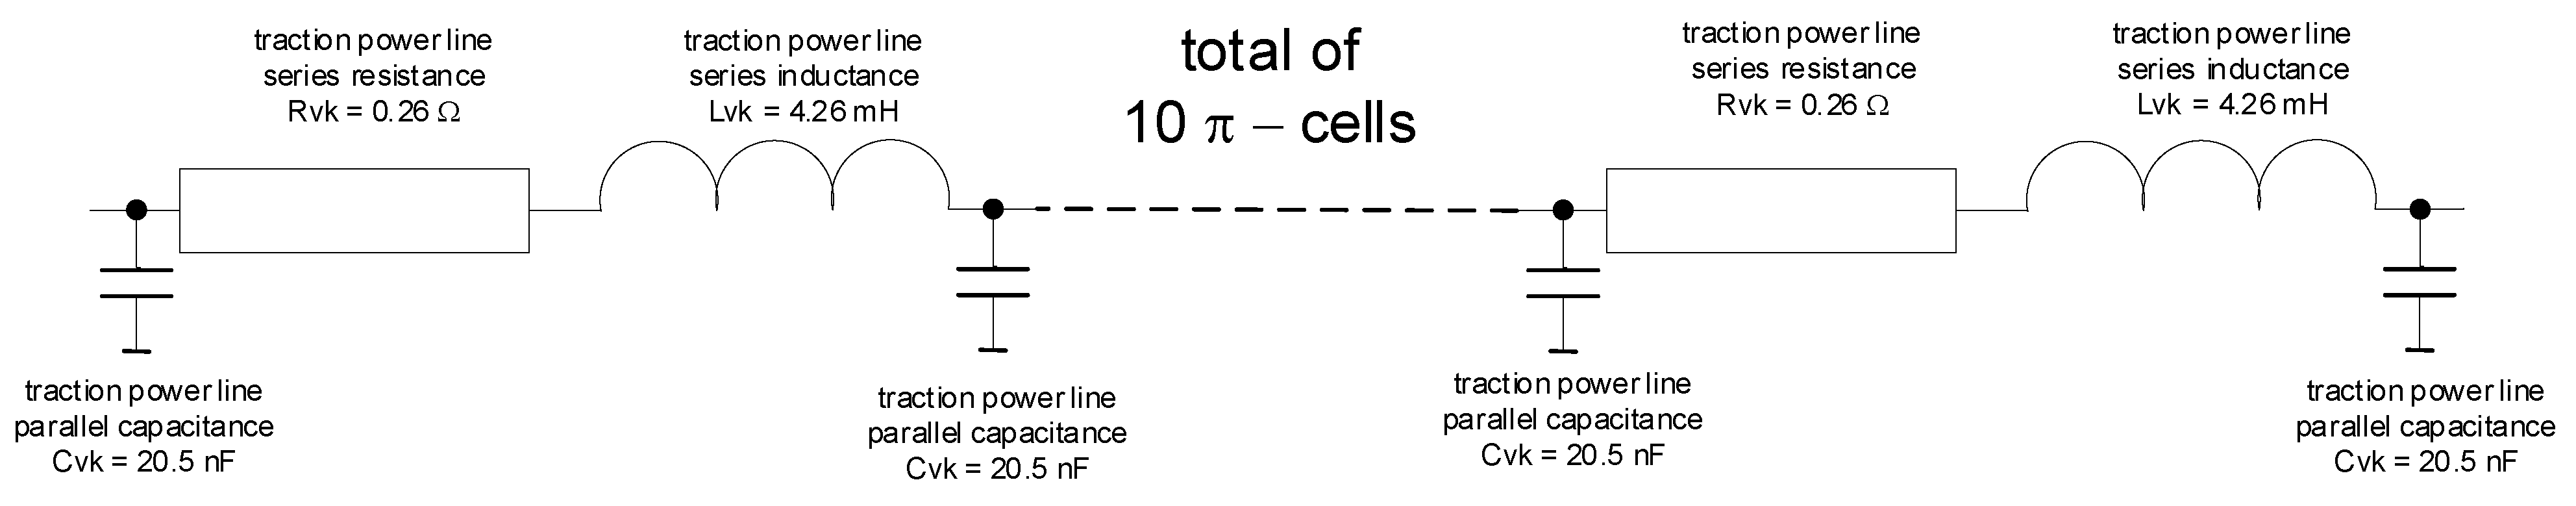
4.1.2. Overhead Line
The overhead line modelling is very specific. It is standardly one-way power supply; compare to distribution network the length is approx. 40 km. There are two ways to simulate the overhead line: use the distributed parameter theory or π-cells model.
The π-cells model enables to simulate the locomotive at any point of the overhead line; therefore, the π-cells model was selected. It is recommended to use one π-cell per each 4 km of the overhead line. We considered the total length of the overhead line up to 40 km; therefore, the model of the overhead line consists of 10 π-cells. Figure 6 shows the recalculated values of each parts of the model.
4.1.3. Locomotive (Train)
The locomotive (train) is modelled for harmonic detection purposes only as a current source. This current source contains a first harmonic of 157 A and other characteristic harmonics measured on the locomotives. The values of these harmonics are given in Table 1. The overhead line model described in Section 4.1.2 allows the connection of the locomotive at any point of the traction overhead line during the simulation.
4.1.4. Filter Compensation Unit (FCU)
The basic scheme of the filter is shown in Figure 2. As the filter always filters and compensates by its nature, it is referred to as FCU (filter compensation unit) in Figure 1 and Figure 4. The simulations were involved filters tuned to h = 3 and 5. The filter unit operates as a decompensation unit as well.
Calculated values of filter components are described in Section 3.5, including compensation filter power.
4.2. Results of the Simulation
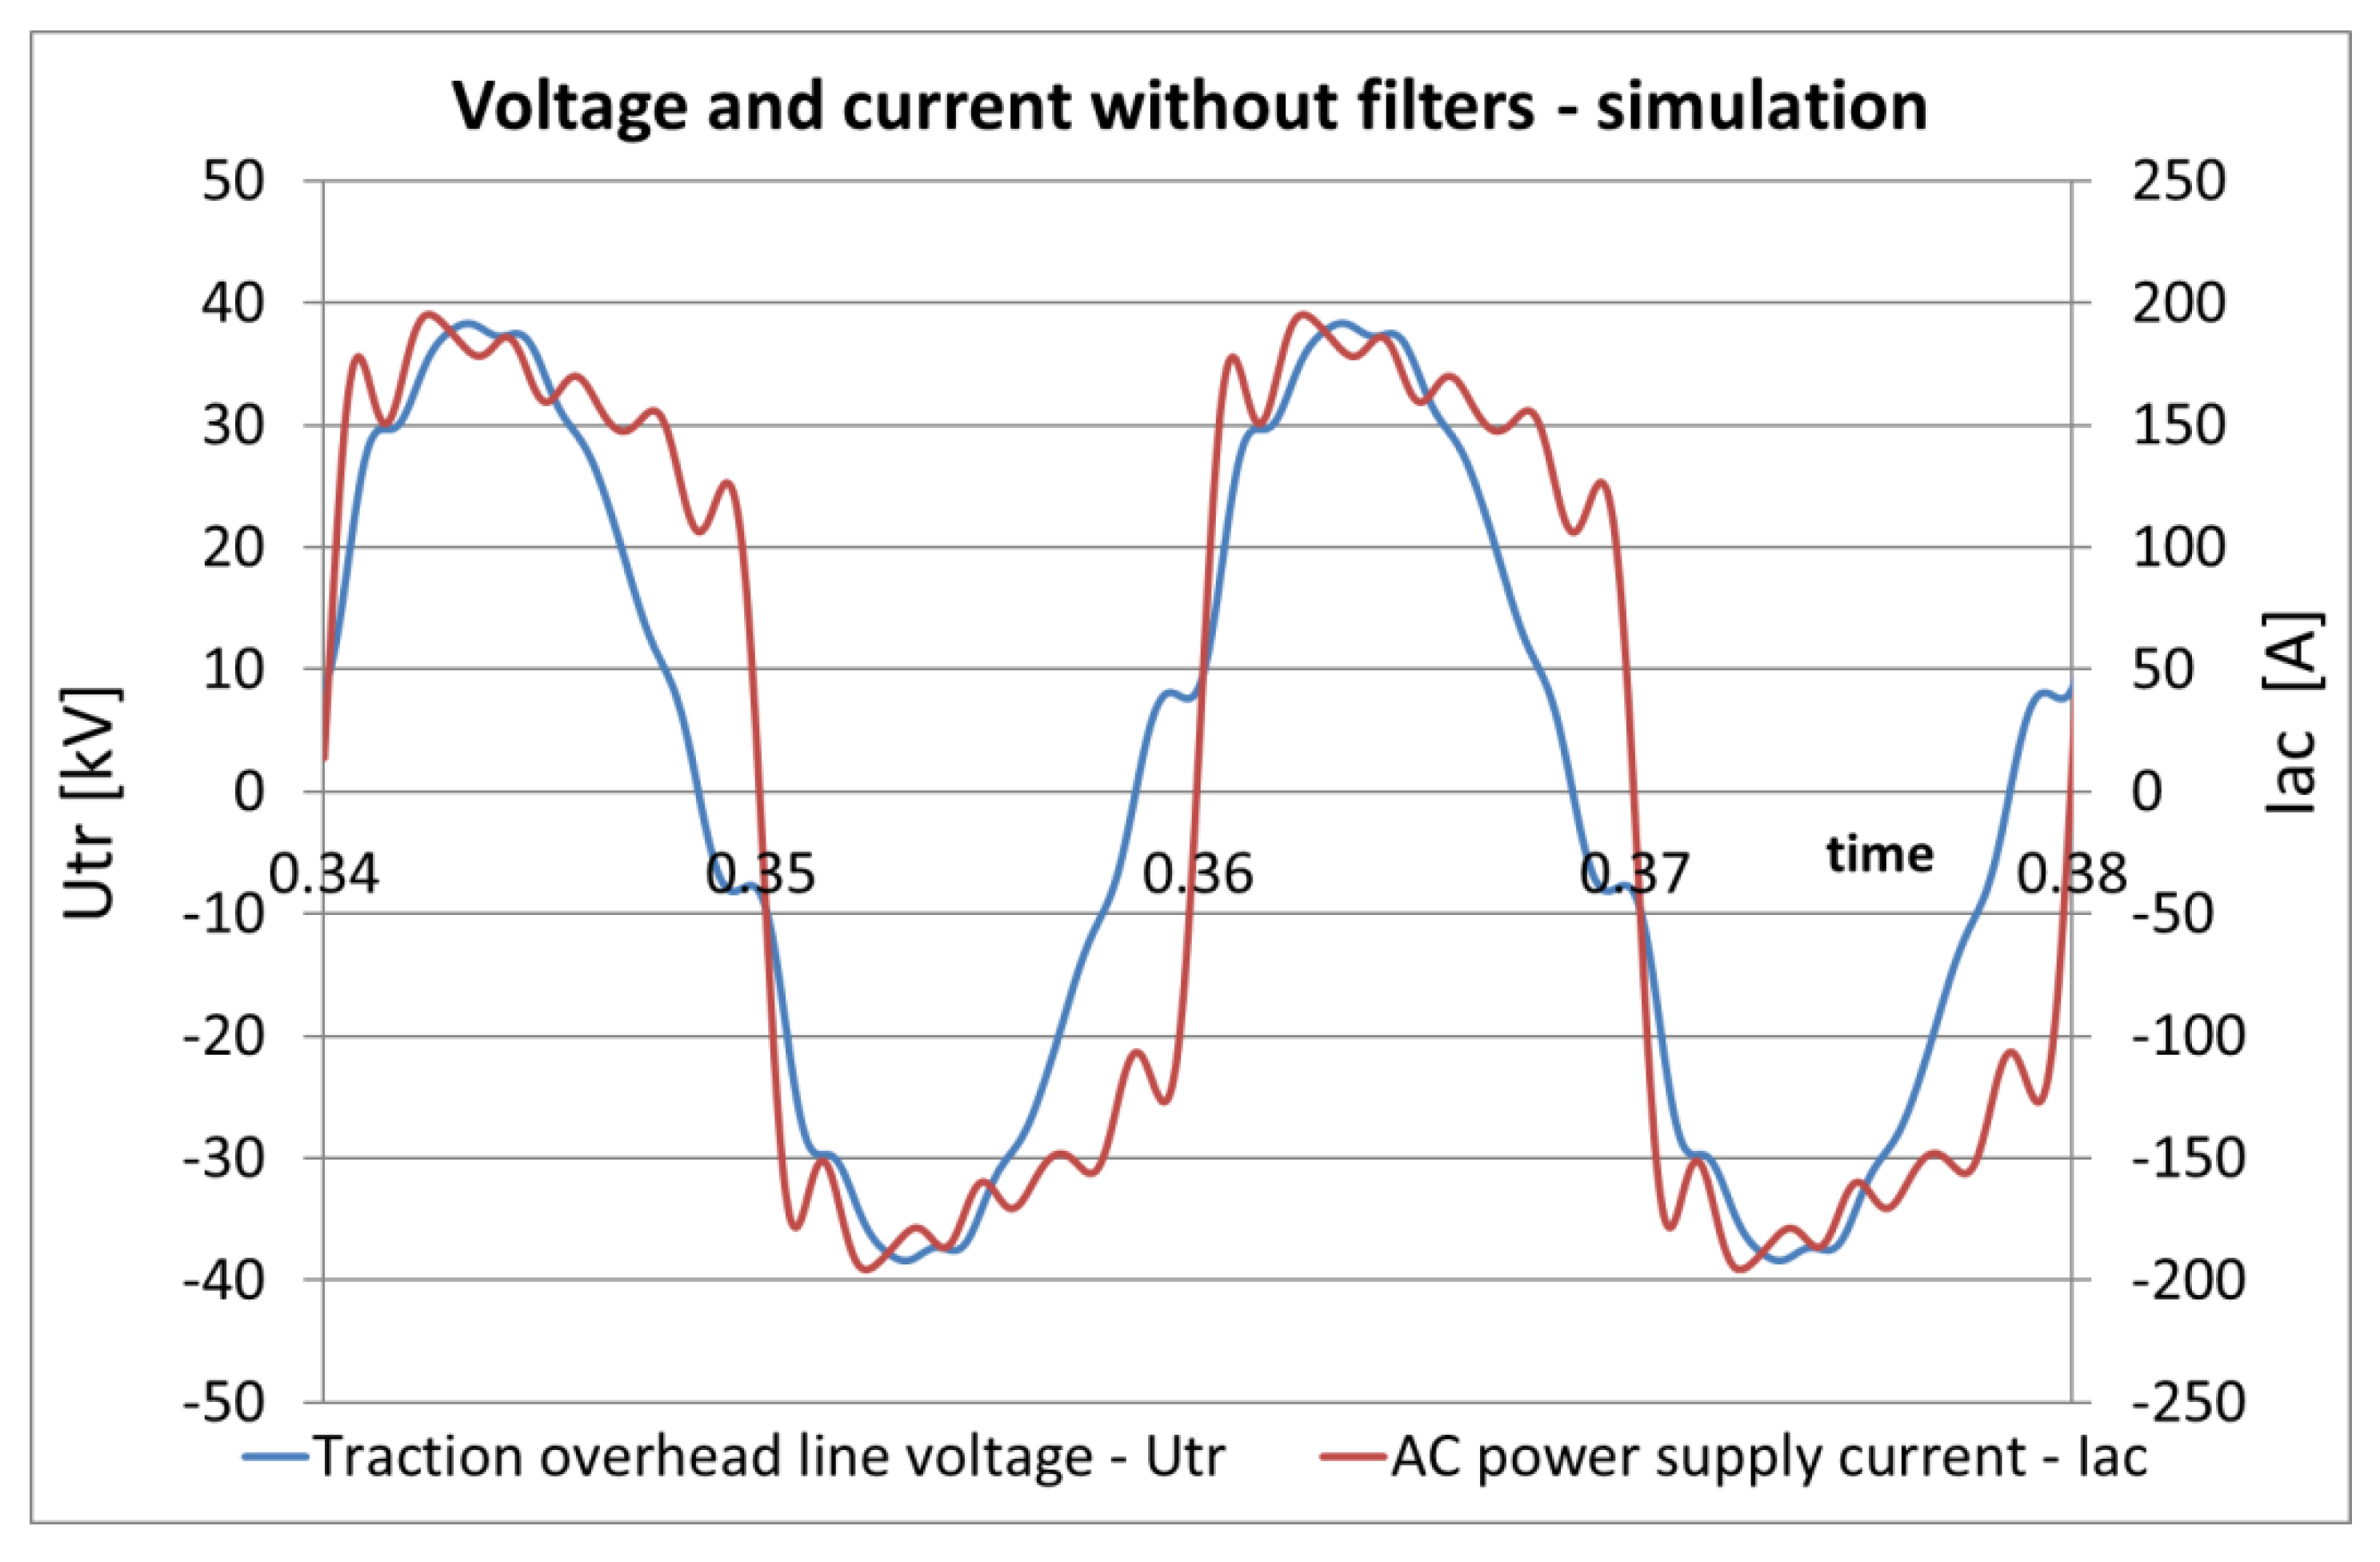
The voltage is monitored in the place of the connection to the traction overhead line and for all cases, it is denoted as Utr. The monitored currents are depicted in Figure 1, i.e., the current passing through the traction overhead line Itr, the current drawn from the AC power supply system Iac and the current passing through the filters Ifcu.
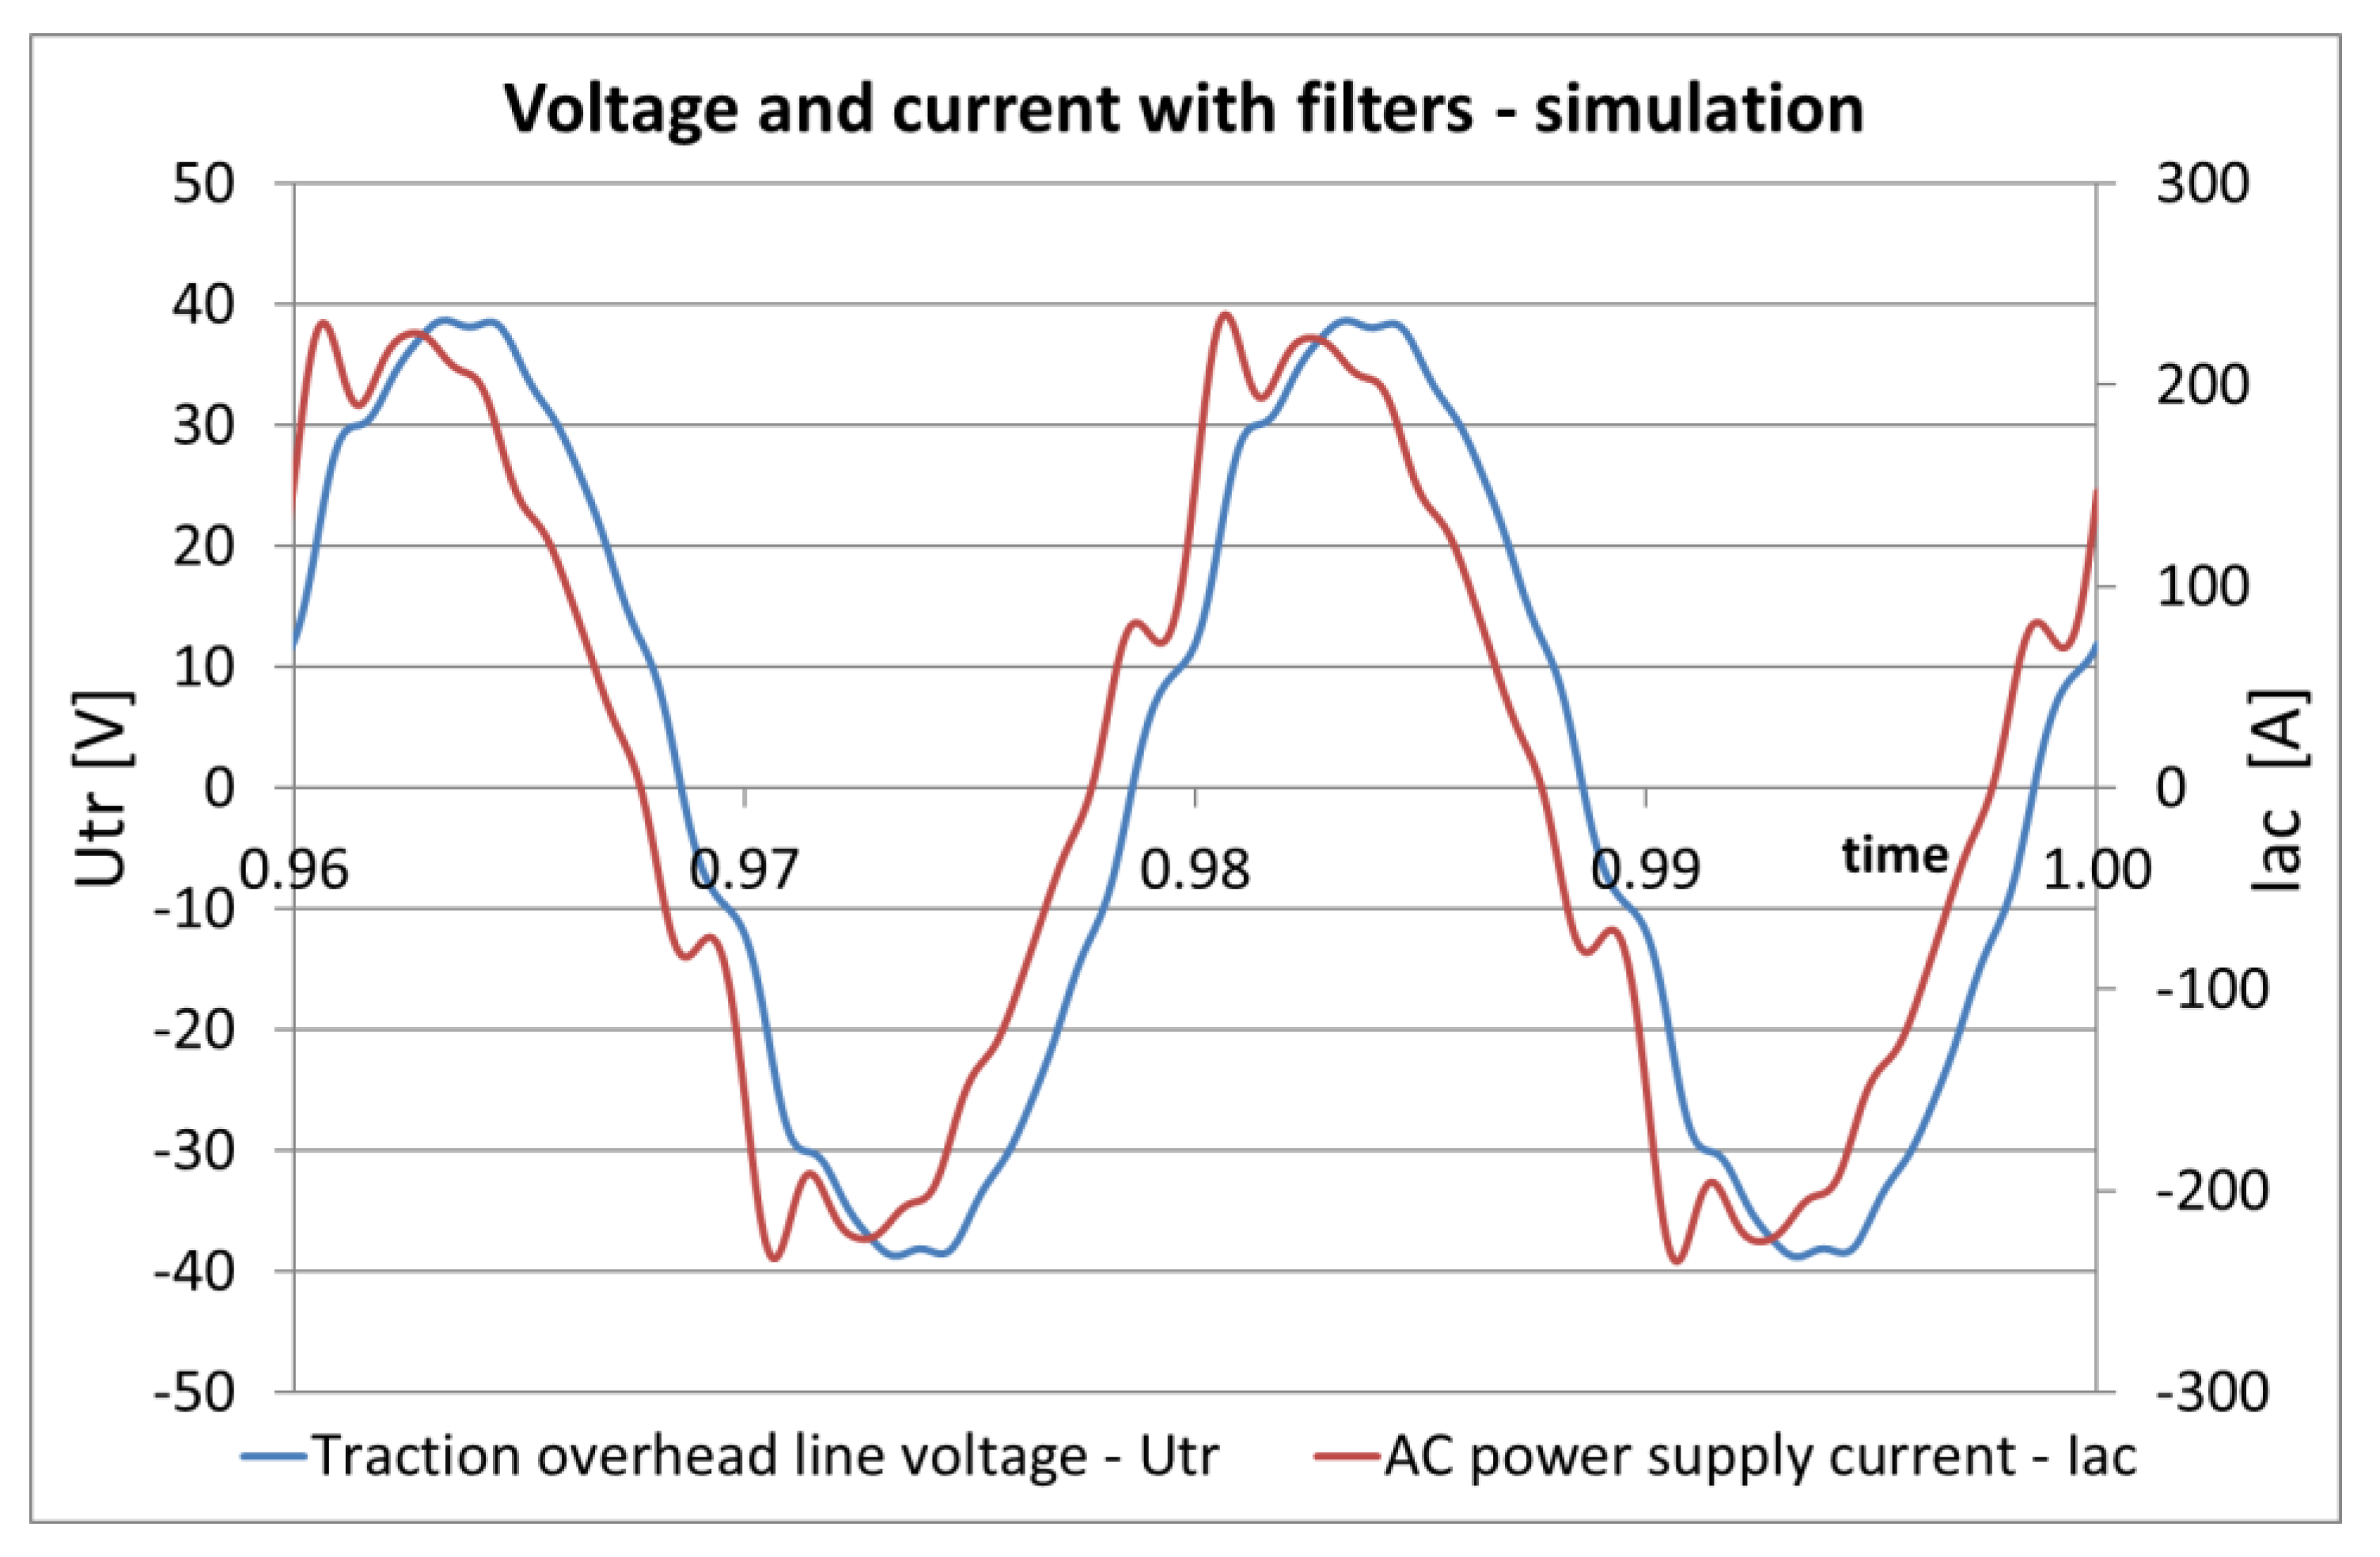
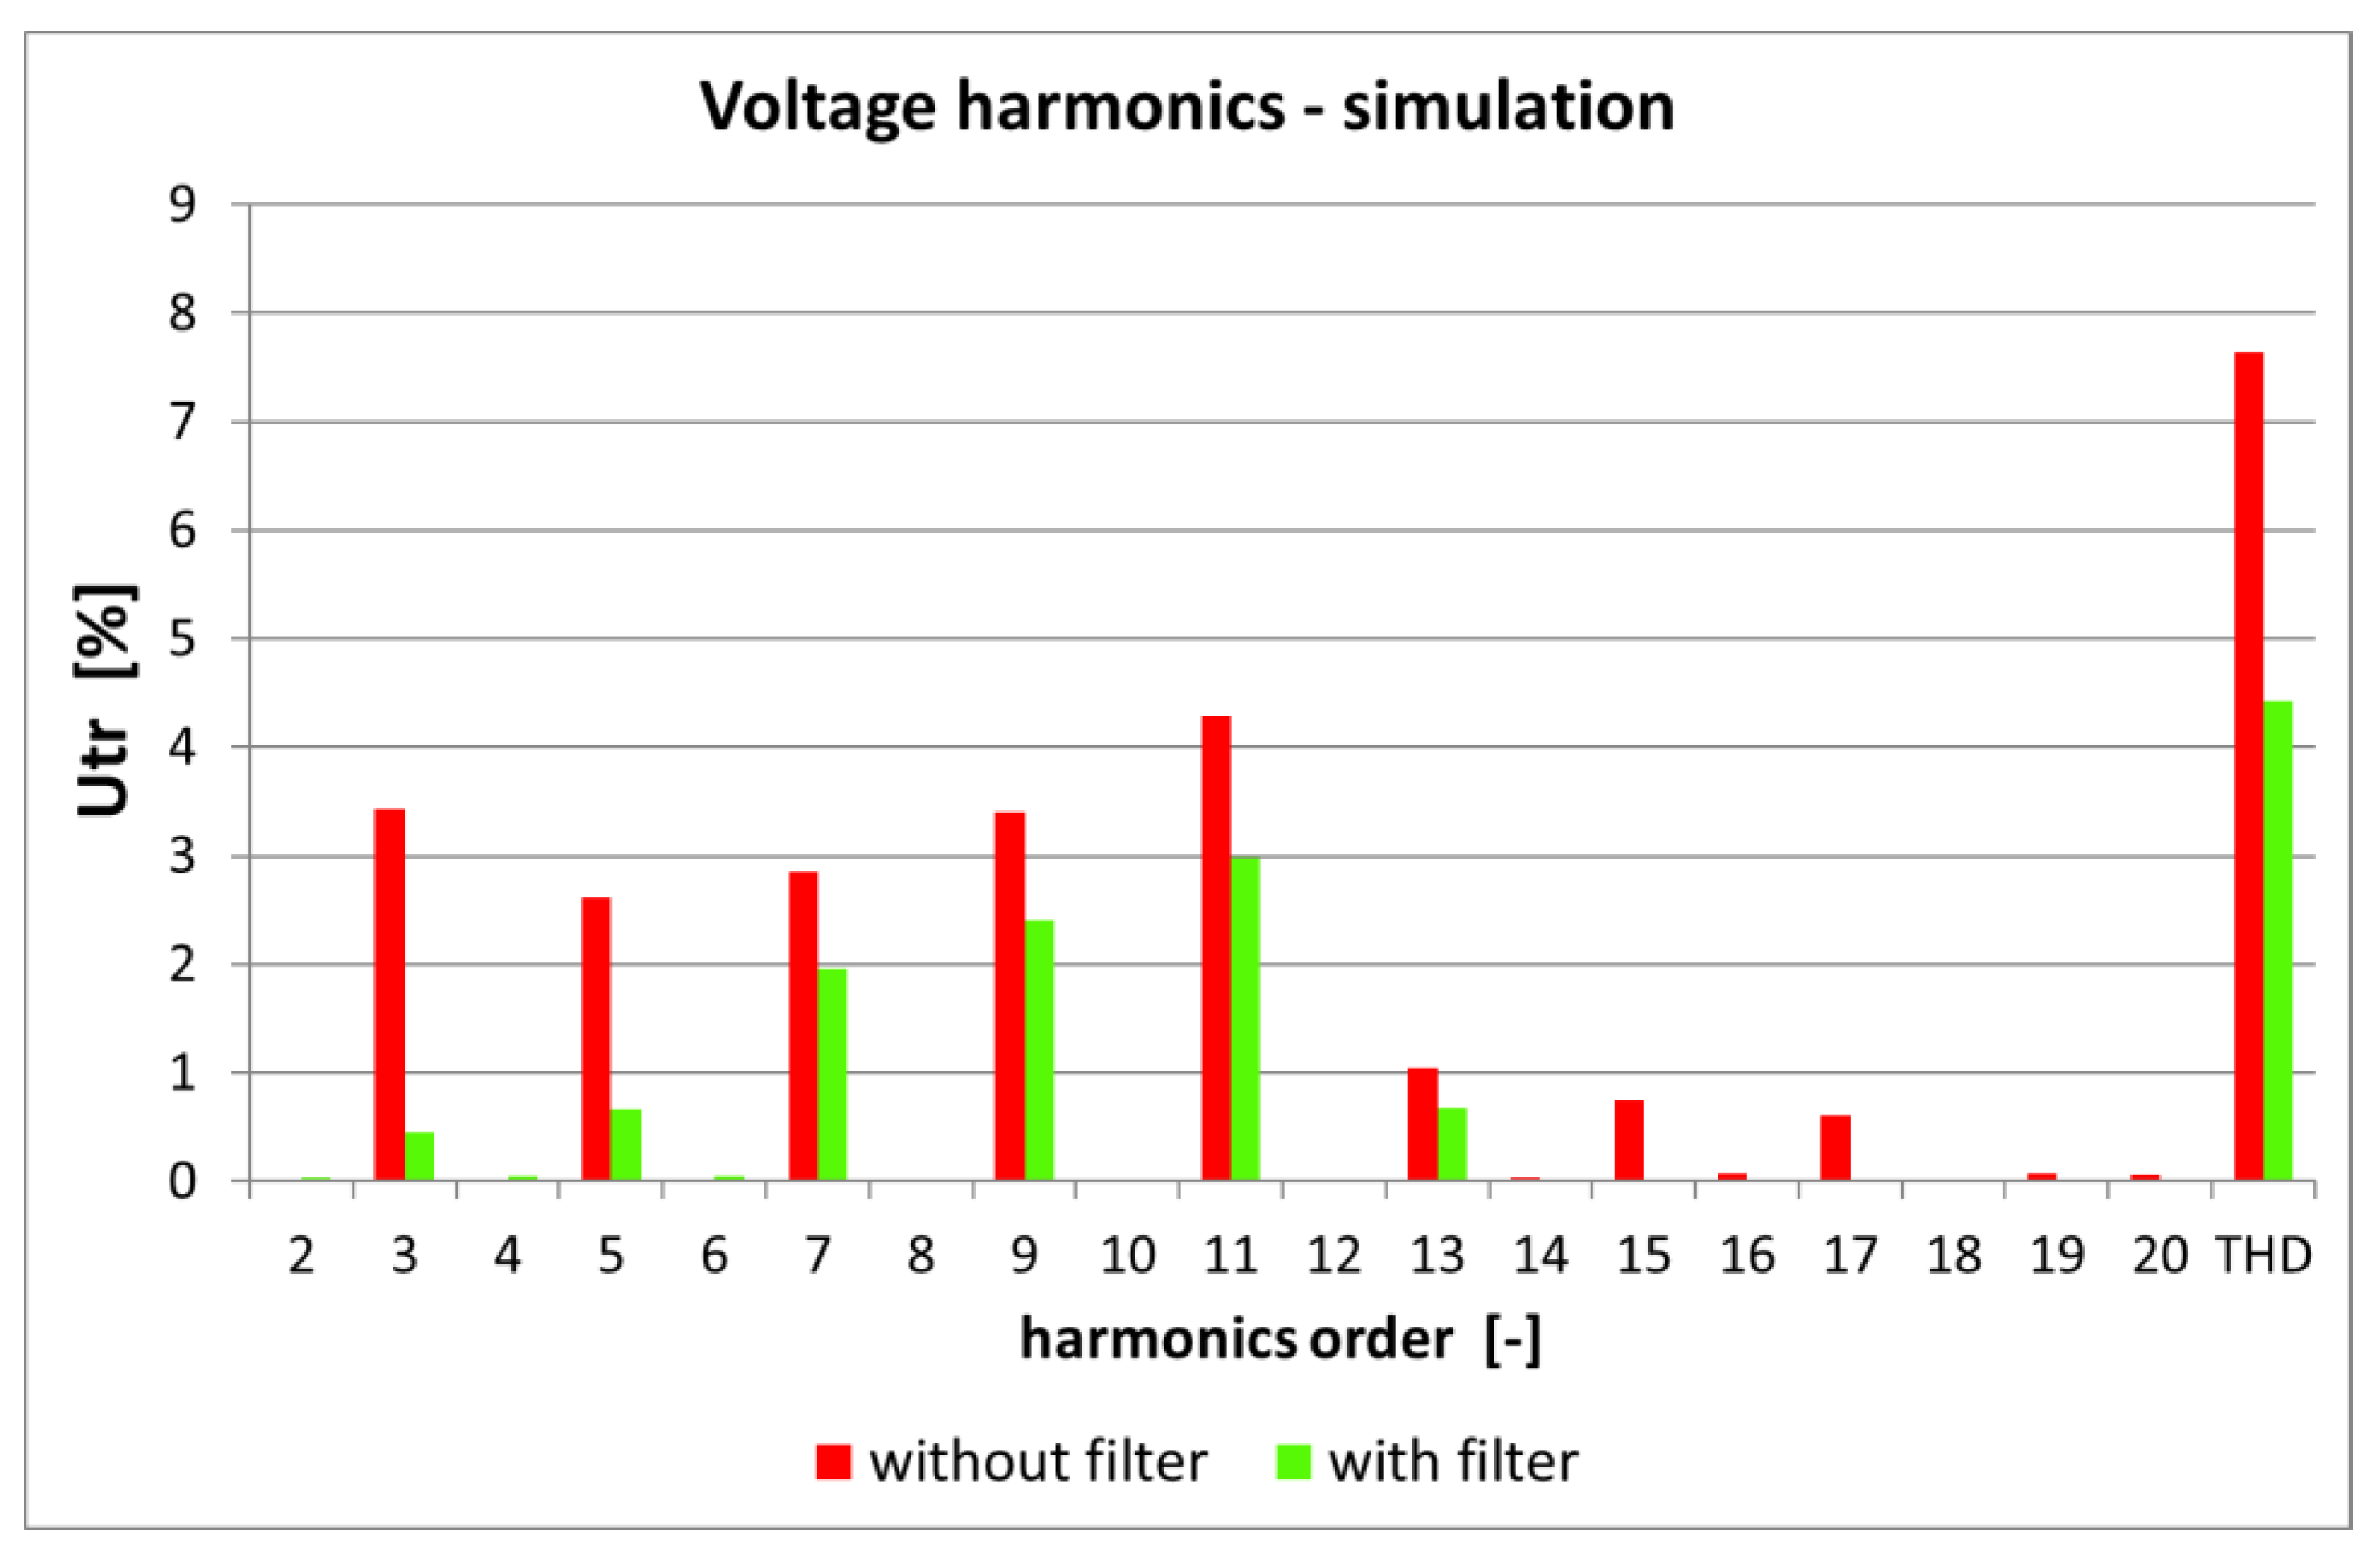
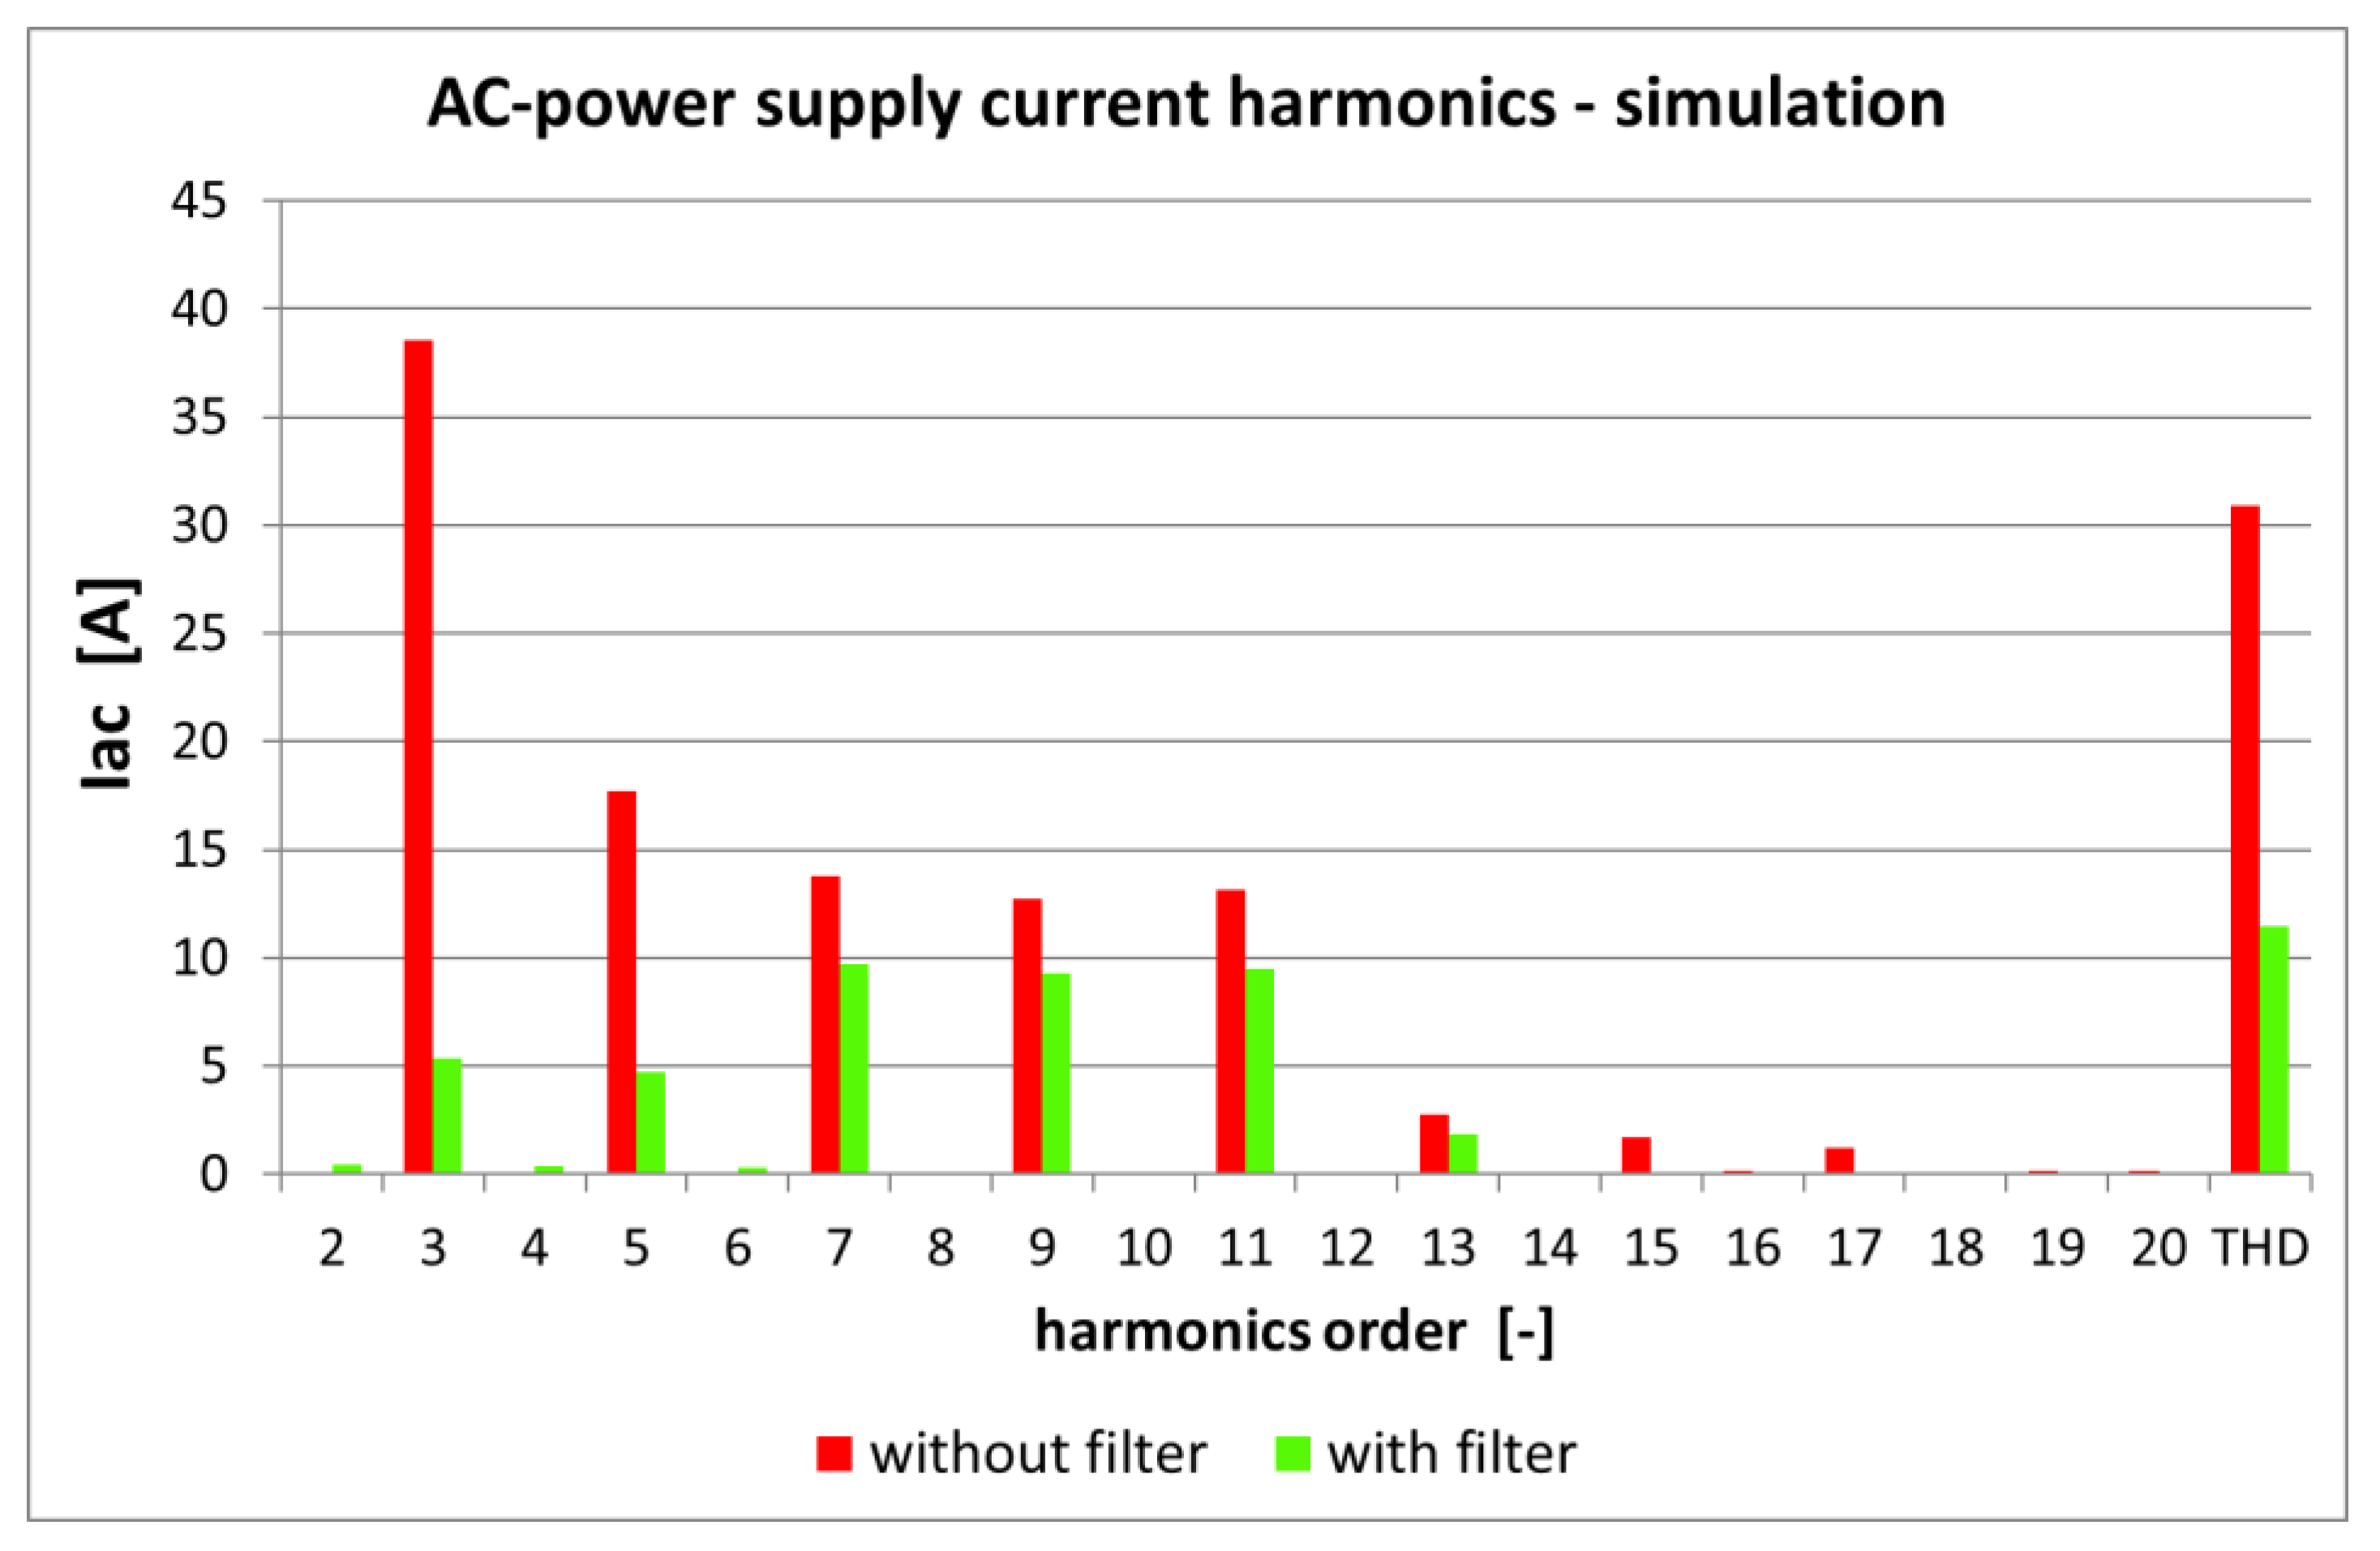
Figure 7 shows the waveforms of currents and voltages without the filters installed. Figure 8 depicts the waveforms with the filters installed. The waveforms indicate an active, reactive and distortion power, thus subjecting the traction system to an extreme load. What is apparent in the case of the filter application is both the system overcompensation and the significant reduction in the distortion of voltages and currents caused by higher-order harmonics. Figure 9 shows the values of the individual voltage harmonics and the total harmonic distortion (THD) factor for the traction overhead line. The values for the current drawn from the AC power supply network are depicted in Figure 10. Exact values and their comparison with the values obtained by measurements can be found in tables in Section 6.
5. The Harmonic Measurement of the Railway Substation
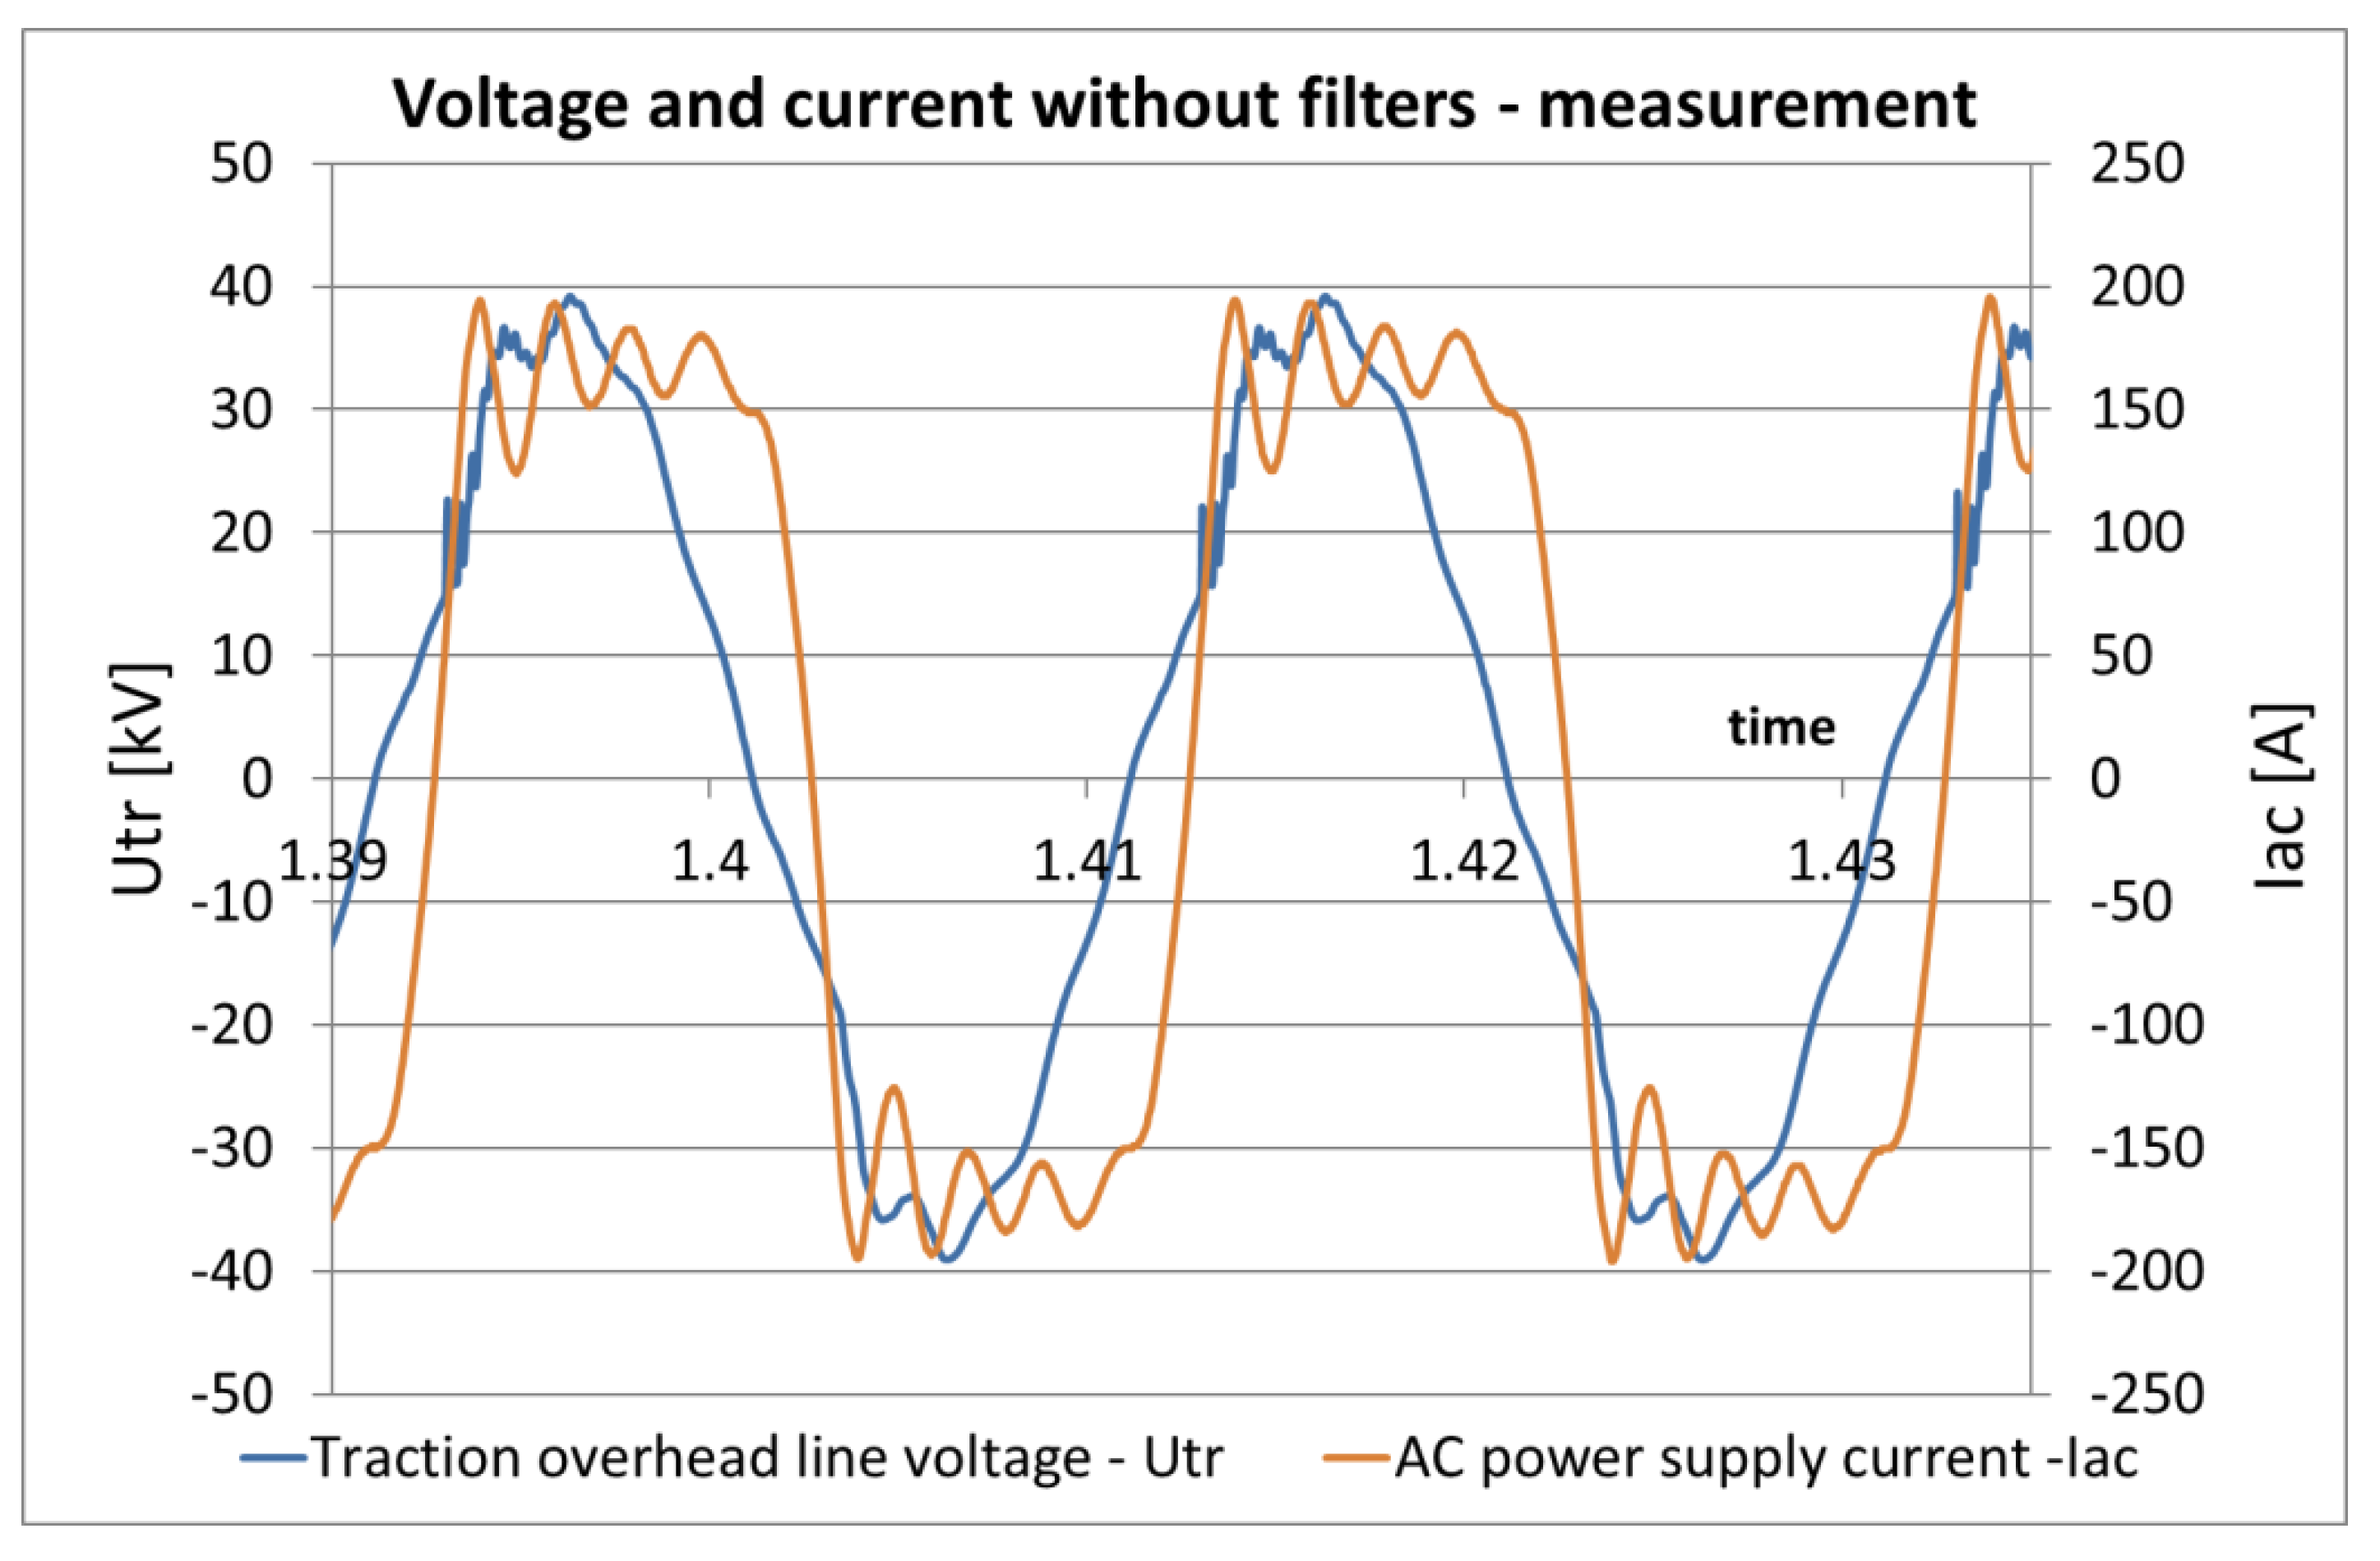
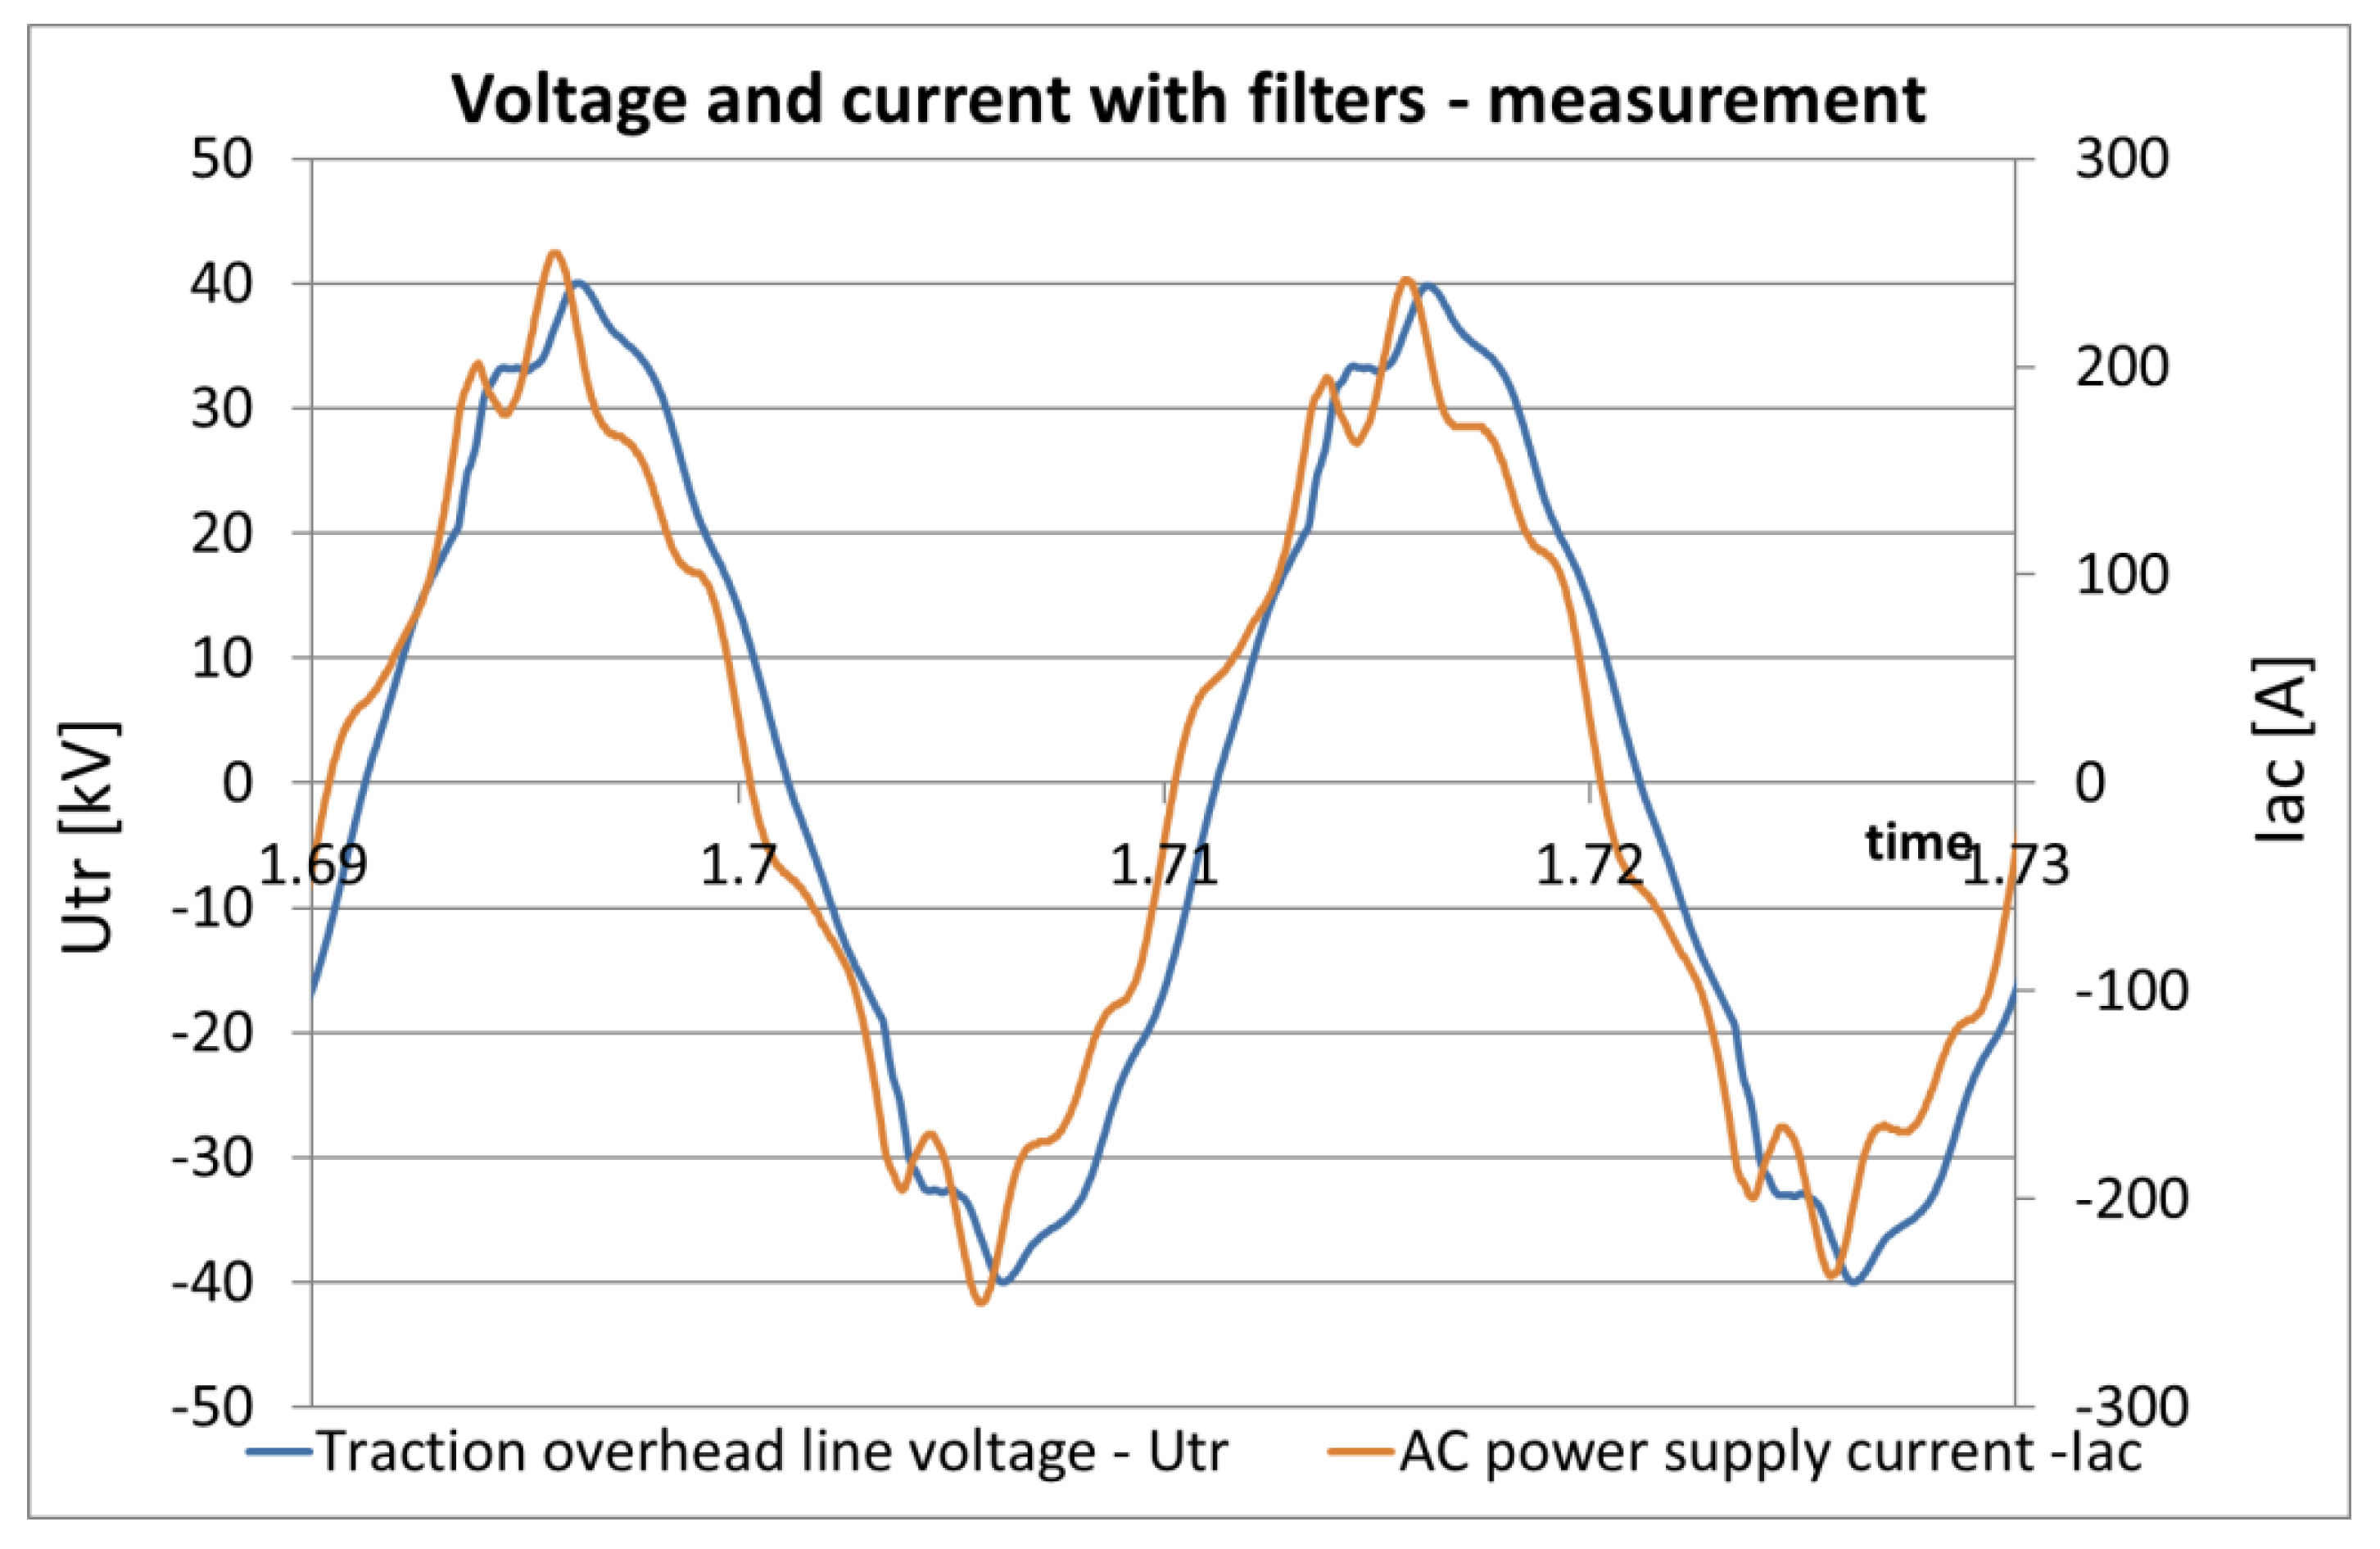
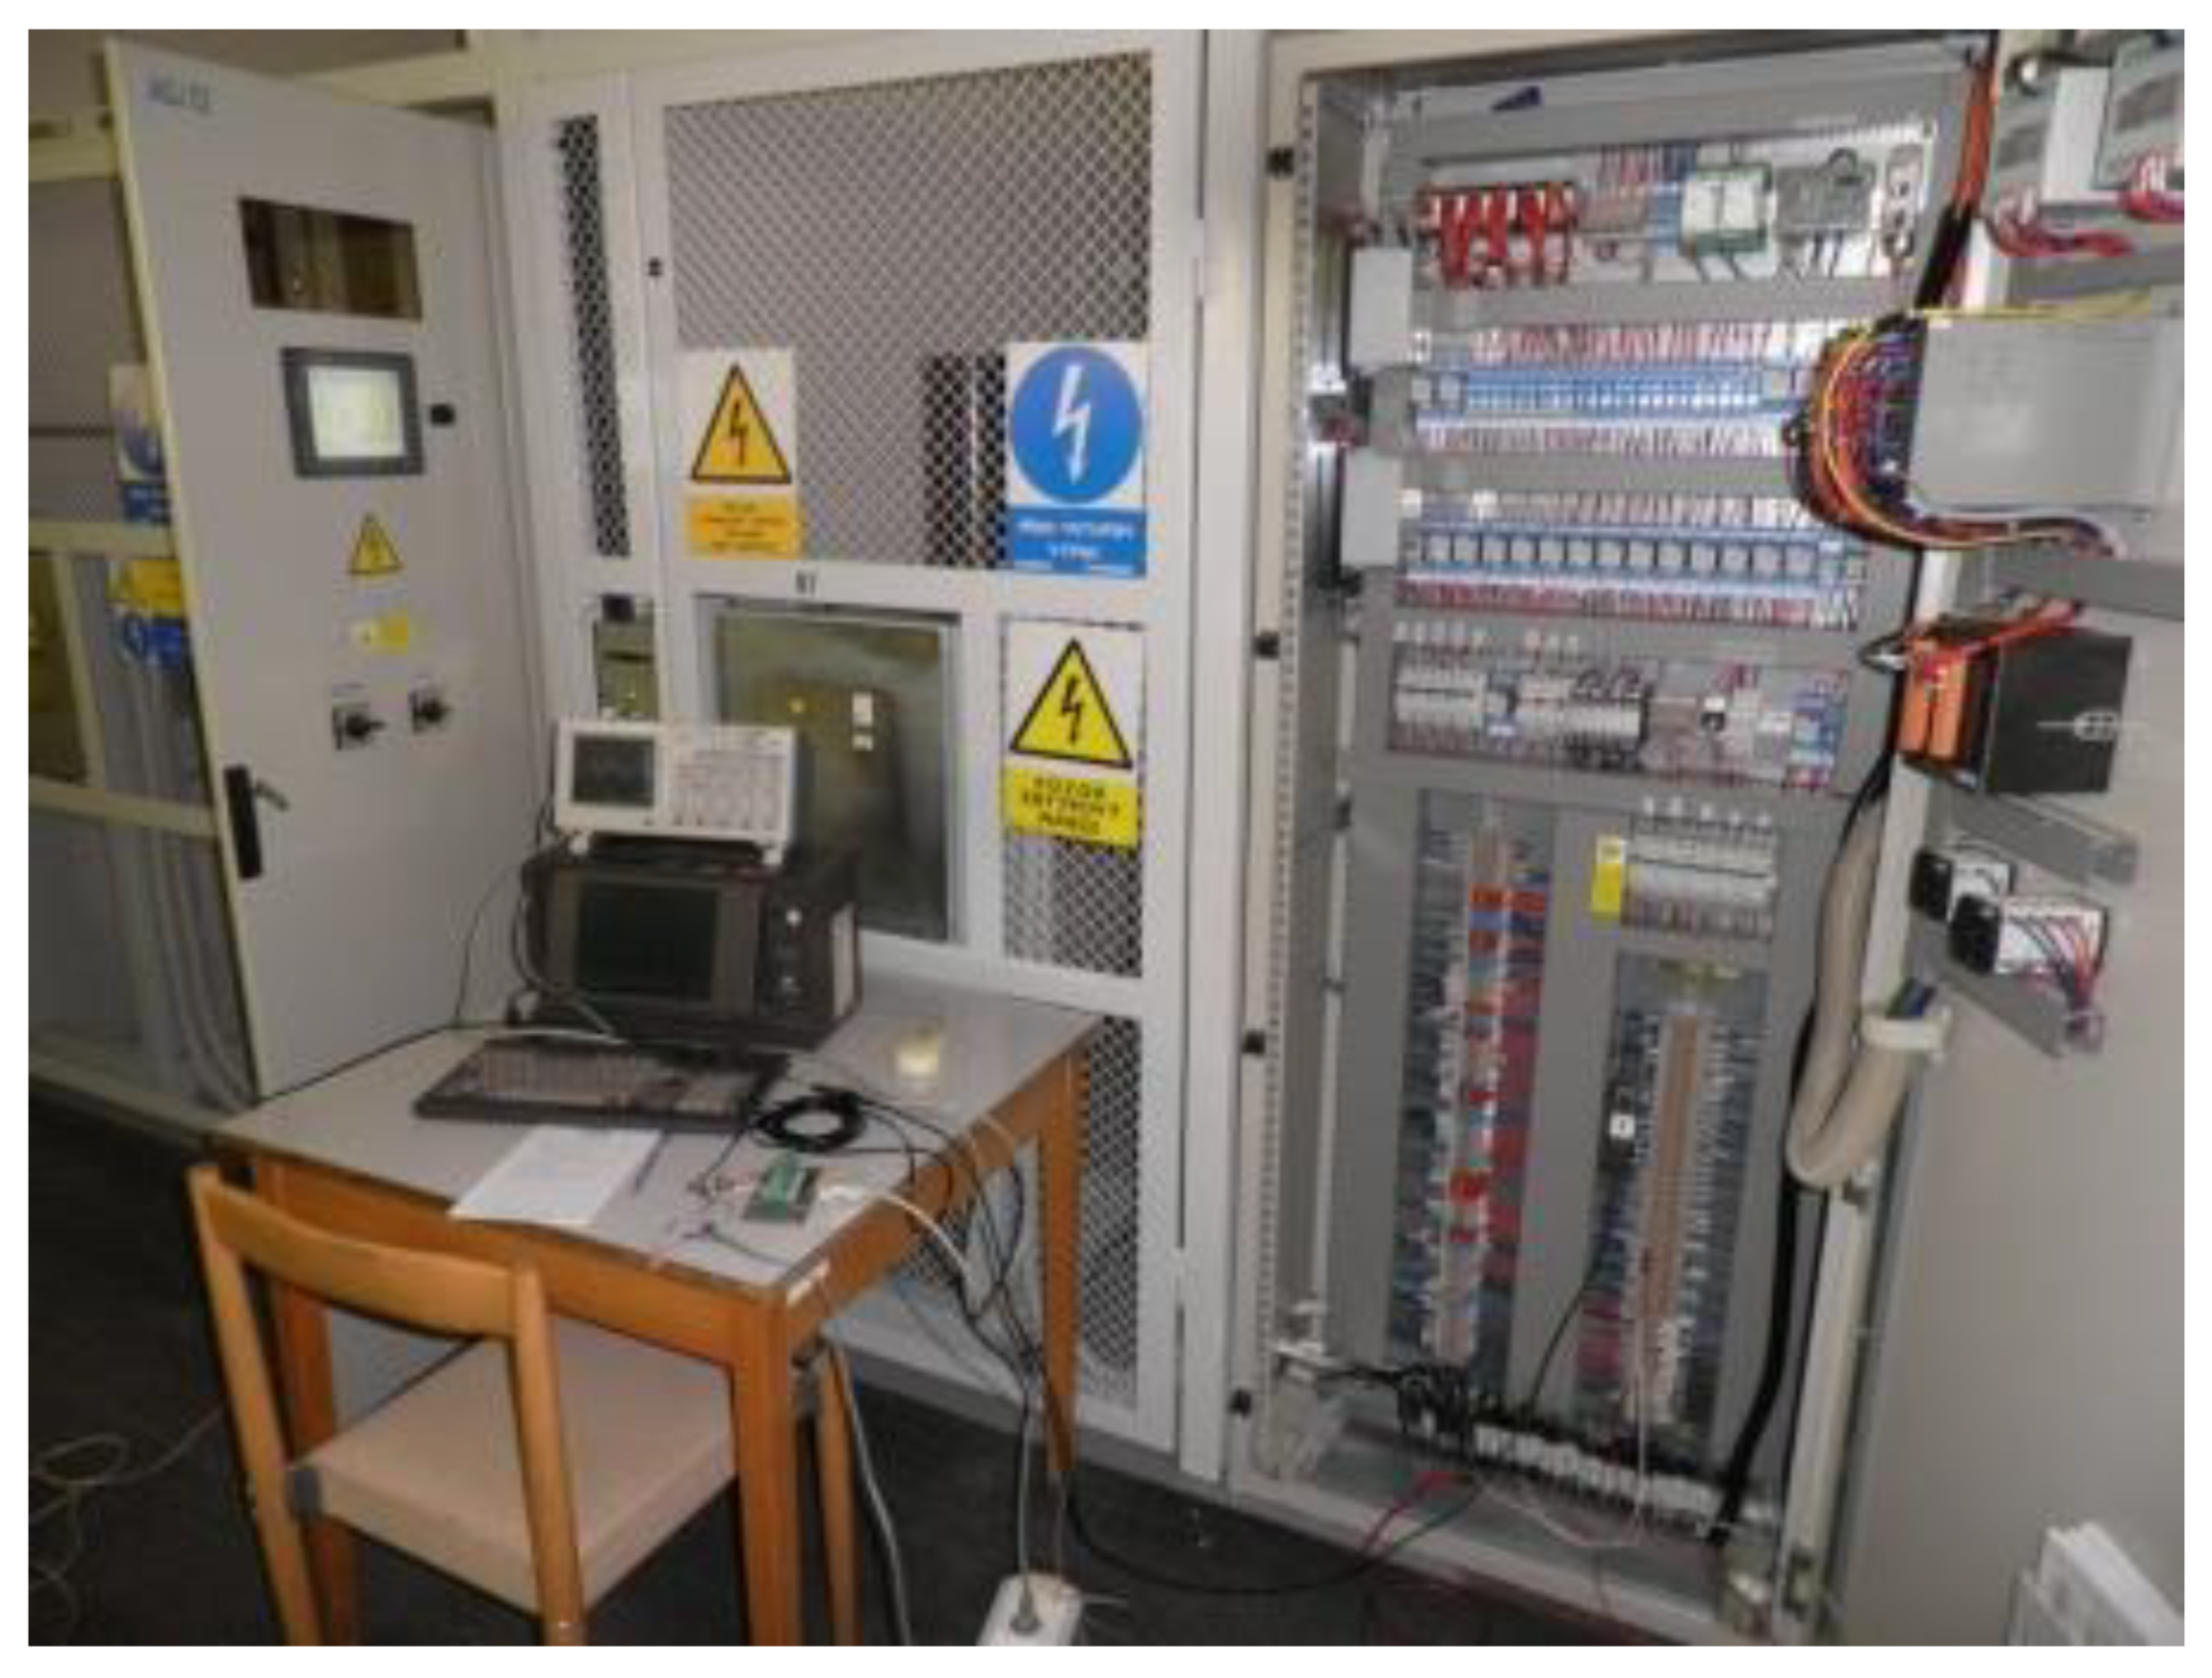
In order to verify the efficiency of filters at extreme load and at the same time their current stresses, a series of measurements were selected for load current harmonics of about 150 A. At a phase shift of 26 degrees, this corresponds to the active power P = 3.6 MW and reactive power Q = 1.77 MVAr. By using the filters, the total harmonic distortion (THD) of voltage is reduced from 7.63% to 4.45% and the Iac current from 33.6% to 12.65%. The measured voltages without the filters are shown in Figure 11 and with the attached filter in Figure 12. Figure 13 then presents the measurement equipment.
6. Evaluation of Filtration Efficiency
The effect of the filter on the current waveform is shown in the waveform in Figure 14. There is a significant reduction in the third and the fifth harmonic current. The fifth harmonic filter has also an effect on the reduction currents of other harmonics. In Table 4 the percent harmonic voltages in the system are listed without filter (index NF) and with filter (index WF). At the same time, the values of permitted distortion according to the standard [22] are shown here. Monitoring of harmonics of order h = 21 or higher has no practical significance. The filtration effect of the filters is evident from the tables. Measurements and simulations show excellent filtration efficiency at the third and fifth harmonic, and the influence of the fifth harmonic filter to reduce the values for the seventh, ninth and the eleventh harmonic components.
7. Conclusions
The paper described a new methodology for optimum filter design for harmonic low-order filtering of traction substations and reactive power compensation. A specific feature of the traction system is the single-phase system, which is the cause of the 3rd harmonic current. Another typical feature is the operation of older types of locomotives (diode or thyristor), which are a source of high harmonics and reactive power consumption.
The main goal of the paper was to propose a novel method for the design of a traction filtration unit. The mentioned method performed the design of the filter of the whole spectrum of harmonic loading filter and prevented unnecessary oversizing of the design of the filter, which, of course, had a major impact on minimizing the filter capacitor power and thus on the size and price of the capacitor. The methodology is designed in such a way that we accept the proportional part of harmonic currents of higher orders, which will flow through the filter and thus can overload the filter. Using filters greatly reduced the harmonic currents that were taken from the traction substation and reduced the voltage distortion.
The described method was applied for the design of filters for a 27 kV traction substation. The methodology was verified by simulations and measurements.
The results show that the harmonic currents taken from the supply system (see Table 1) and the voltage (see Table 2) are high without the use of filters. With the use of filters, these harmonics decrease. As can be seen from Figure 11, the current of the 3rd and 5th harmonics is significantly reduced. The total THDI current distortion coefficient is reduced from 33% to 12% using a filter.
It is shown that the filter of the 5th harmonic has a filter effect even at higher frequencies. The decrease in voltage distortion is evident up to the 11th harmonic. For this frequency the value allowed by the standard was exceeded when measuring without a filter (allowed 3.5%, measured 4.08%, see Table 4). Using a 5th harmonic filter, the 11th harmonic voltage is reduced to 2.79%.
The Table 4 shows the evident filtering effect of the 5th harmonic filter.
By comparing with other design methods, it is evident that the filters according to the proposed methodology show the highest filtration effect.
The proposed methodology was tested on the traction substation 25 kV/50 Hz, where dynamic states with a high proportion of harmonics occur. In the same way it can be used for design of common (three-phase) filter compensation stations.
Author Contributions
Investigation, V.K.; Methodology, B.S.; Validation, P.D. All authors have read and agreed to the published version of the manuscript.
Funding
This research has been supported by the Ministry of Education, Youth, and Sports of the Czech Republic under the project OP VVV Electrical Engineering Technologies with High-Level of Embedded Intelligence CZ.02.1.01/0.0/0.0/18_069/0009855 and project No. SGS-2021-021.
Institutional Review Board Statement
Not Applicable.
Informed Consent Statement
Not Applicable.
Acknowledgments
This research has been supported by the Ministry of Education, Youth, and Sports of the Czech Republic under the project OP VVV Electrical Engineering Technologies with High-Level of Embedded Intelligence CZ.02.1.01/0.0/0.0/18_069/0009855 and project No. SGS-2021-021.
Conflicts of Interest
The authors declare no conflict of interest.
References
- Chang, W.; Lin, H.W.; Chen, S.K. Modelling characteristics of harmonic currents generated by high-speed railway traction drive converters. IEEE Trans. Power Deliv. 2004, 19, 766–773. [Google Scholar] [CrossRef]
- Foiadelli, F.; Lazaroiu, G.C.; Zaninelli, D. Probabilistic method for harmonic analysis in railway system. In Proceedings of the IEEE Power Engineering Society General Meeting, San Francisco, CA, USA, 12–17 June 2005. [Google Scholar]
- Arrillaga, J. Power System Harmonic Analysis; John Wiley & Sons: New York, NY, USA, 1997. [Google Scholar]
- Sollazzo, A.; Testa, A.; Carbone, R.; Rosa, F. Modeling Waveform Distortion Produced by High Speed AC Locomotive Converters. In Proceedings of the IEEE Bologna Power Tech Conference, Bologna, Italy, 23–26 June 2003. [Google Scholar]
- Shu, Z.; Xie, S.; Li, Q. Single-Phase Back-To-Back Converter for Active Power Balancing, Reactive Power Compensation, and Harmonic Filtering in Traction Power System. IEEE Trans. Power Electron. 2010, 26, 334–343. [Google Scholar] [CrossRef]
- Cecati, C.; Dell Aquila, A.; Monopoli, V.G. Design of h-bridge multilevel active rectifier for traction systems. IEEE Trans. Ind. Appl. 2003, 39, 1541–1550. [Google Scholar] [CrossRef]
- Boora, A.A.; Zare, F.; Ghosh, A.; Ledwich, G. Applications of power electronics in railway systems. In Proceedings of the Australasian Universities Power Engineering Conference, Perth, WA, Australia, 9–12 December 2007; pp. 1–9. [Google Scholar]
- Luo, A.; Ma, F.; Wu, C.; Ding, S.Q.; Zhong, Q.-C.; Shuai, Z.K. A Dual-Loop Control Strategy of Railway Static Power Regulator Under V/V Electric Traction System. IEEE Trans. Power Electron. 2011, 26, 2079–2091. [Google Scholar] [CrossRef]
- Luo, A.; Wu, C.; Shen, J.; Shuai, Z.; Ma, F. Railway Static Power Conditioners for High-speed Train Traction Power Supply Systems Using Three-phase V/V Transformers. IEEE Trans. Power Electron. 2011, 26, 2844–2856. [Google Scholar] [CrossRef]
- Zanotto, L.; Piovan, R.; Toigo, V.; Gaio, E.; Bordignon, P.; Consani, T.; Fracchia, M. Filter Design for Harmonic Reduction in High-Voltage Booster for Railway Applications. IEEE Trans. Power Deliv. 2005, 20, 258–263. [Google Scholar] [CrossRef]
- Hu, H.; He, Z.; Gao, S. Passive Filter Design for China High-Speed Railway With Considering Harmonic Resonance and Characteristic Harmonics. IEEE Trans. Power Deliv. 2015, 30, 505–514. [Google Scholar] [CrossRef]
- Hammond, P.W. A harmonic filter installation to reduce voltage distortion from static power converters. IEEE Trans. Ind. Appl. 1988, 24, 53–58. [Google Scholar] [CrossRef]
- Seferi, Y.; Blair, S.M.; Mester, C.; Stewart, B.G. Power Quality Measurement and Active Harmonic Power in 25 kV 50 Hz AC Railway Systems. Energies 2020, 13, 5698. [Google Scholar] [CrossRef]
- Yao, X. The method for designing the third order filter. In Proceedings of the 8th International Conference on Harmonics and Quality of Power (ICHQP), Athens, Greece, 14–16 October 1998; Volume 1, pp. 139–142. [Google Scholar]
- Tyll, H.K.; Schettle, F. Historical overview on dynamic reactive power compensation solutions from the begin of AC power transmission towards present applications. In Proceedings of the IEEE/PES Power Systems Conference and Exposition, Seattle, WA, USA, 15–18 March 2009. [Google Scholar]
- Hafner, J.; Aredes, M.; Heumann, K.A. A shunt active power filter applied to high voltage distribution lines. IEEE Trans. Power Deliv. 1997, 12, 266–272. [Google Scholar] [CrossRef]
- Tan, P.C.; Morrison, R.E.; Holmes, D.G. Voltage Form Factor Control and Reactive Power Compensation in a 25-kV Electrified Railway System Using a Shunt Active Filter Based on Voltage Detection. IEEE Trans. Ind. Appl. 2003, 39, 575–581. [Google Scholar]
- Han, Z.; Zhang, Y.; Liu, S.; Gao, S. Modeling and Simulation for Traction Power Supply System of High-Speed Railway. In Proceedings of the Asia-Pacific Power and Energy Engineering Conference (APPEEC), Wuhan, China, 25–28 March 2011. [Google Scholar]
- Kolář, V.; Paleček, J.; Kocman, S. Interference between Electric Traction Supply Network and Distribution Power Network–Resonance Phenomenon. In Proceedings of the 14th International Conference on Harmonics and Quality of Power—ICHQP, Politecnico di Milano, Bergamo, Italy, 26–29 September 2010; ISBN 978-1-4244-7245-1. [Google Scholar]
- Varetsky, Y. Transient Overvoltages during Filter Circuit Switching-off. In Proceedings of the International Symposium Modern Electric Power Systems (MEPS), Wroclaw, Poland, 20–22 September 2010; ISBN 978-83-921315-7-1. [Google Scholar]
- Kus, V.; Skala, B. Effect of Filter and Compensation Unit in the Traction Power Supply at Extreme Distortion. In Proceedings of the CPE—International Conference-Workshop Compatibility And Power Electronics, Ljubljana, Slovenia, 5–7 June 2013; pp. 1–6. [Google Scholar]
- Standard: IEC 61000-2-12: Electromagnetic compatibility (EMC)—Part 2-12. Environment—Compatibility Levels for Low-Frequency Conducted Disturbances and Signaling in Public Medium-Voltage Power Supply Systems. Available online: https://webstore.iec.ch/publication/4130 (accessed on 14 September 2021).
Figure 1.
Block scheme of traction substation with filter compensation unit.

Figure 2.
Schematic diagram of proposed symbols.

Figure 3.
View of traction substation 25 kV/50 Hz.

Figure 4.
Overview scheme for simulations.

Figure 5.
Power supply system model.

Figure 6.
The overhead line simulation model.

Figure 7.
Voltage and current waveforms of the system without filter—simulation.

Figure 8.
The voltage and current waveforms of the system in operation with connected filters—simulation.
Figure 8.
The voltage and current waveforms of the system in operation with connected filters—simulation.

Figure 9.
Filters influence on harmonic voltages of the substation system—simulation.

Figure 10.
Filters Influence on harmonic currents of the substation system—simulation.

Figure 11.
Voltage and current waveforms of the system without filter—measurement.

Figure 12.
Voltage and current waveforms of the system in operation with connected filters—measurement.
Figure 12.
Voltage and current waveforms of the system in operation with connected filters—measurement.

Figure 13.
View of the measuring stand at the traction substation.

Figure 14.
Comparison of taken current under load without filters and with filters.


Table 1.
Values of harmonic currents measured in the traction overhead line and across the decompensation element.
Table 1.
Values of harmonic currents measured in the traction overhead line and across the decompensation element.
| h [-] | 3 | 5 | 7 | 9 | 11 | 13 |
| Ih [A] | 42.7 | 17.5 | 14.2 | 12.1 | 11.4 | 1.8 |
Table 2.
Proportional values of harmonic voltages (without filters).
| h [-] | 3 | 5 | 7 | 9 | 11 | 13 |
| uh [%] | 4.24 | 2.99 | 3.02 | 3.45 | 4.08 | 1.03 |
Table 3.
Auxiliary table used for the calculation of coefficients k.
| n [-] | 7 | 9 | 11 | 13 |
|---|---|---|---|---|
| 53.16 | 16.14 | 8.2 | 5.09 | |
| 0.0501 | 0.0204 | 0.0157 | 0.0005 |
Table 4.
Percent values of harmonic voltages by measurement and simulation and limits by standard IEC.
Table 4.
Percent values of harmonic voltages by measurement and simulation and limits by standard IEC.
| Percentages. | Measurement | Simulation | IEC Standard | ||
|---|---|---|---|---|---|
| harmonics order | Utrnf | Utrwf | Utrnf | Utrwf | Uh |
| 2 | 0.03 | 0.03 | 0.00 | 0.03 | 2 |
| 3 | 4.24 | 0.42 | 3.42 | 0.45 | 5 |
| 4 | 0.05 | 0.08 | 0.00 | 0.05 | 1 |
| 5 | 2.99 | 0.66 | 2.62 | 0.67 | 6 |
| 6 | 0.11 | 0.08 | 0.01 | 0.04 | 0.5 |
| 7 | 3.02 | 2.00 | 2.85 | 1.95 | 5 |
| 8 | 0.11 | 0.11 | 0.01 | 0.02 | 0.5 |
| 9 | 3.45 | 2.34 | 3.40 | 2.40 | 1.5 |
| 10 | 0.14 | 0.16 | 0.01 | 0.01 | 0.5 |
| 11 | 4.08 | 2.79 | 4.28 | 2.98 | 3.5 |
| 12 | 0.11 | 0.16 | 0.01 | 0.01 | 0.46 |
| 13 | 1.03 | 0.68 | 1.05 | 0.68 | 3 |
| 14 | 0.14 | 0.13 | 0.03 | 0.00 | 0.43 |
| 15 | 0.27 | 0.29 | 0.75 | 0.00 | 0.4 |
| 16 | 0.14 | 0.12 | 0.08 | 0.02 | 0.41 |
| 17 | 0.24 | 0.24 | 0.60 | 0.02 | 2 |
| 18 | 0.11 | 0.09 | 0.02 | 0.02 | 0.39 |
| 19 | 0.22 | 0.20 | 0.07 | 0.01 | 1.76 |
| 20 | 0.11 | 0.11 | 0.06 | 0.01 | 0.37 |
| THD | 7.63% | 4.45% | 7.64% | 4.42% | 8% |
note: nf = filter off, wf = filter on.
Publisher’s Note: MDPI stays neutral with regard to jurisdictional claims in published maps and institutional affiliations. |
© 2021 by the authors. Licensee MDPI, Basel, Switzerland. This article is an open access article distributed under the terms and conditions of the Creative Commons Attribution (CC BY) license (https://creativecommons.org/licenses/by/4.0/).
Share and Cite
MDPI and ACS Style
Kus, V.; Skala, B.; Drabek, P. Complex Design Method of Filtration Station Considering Harmonic Components. Energies 2021, 14, 5872. https://0-doi-org.brum.beds.ac.uk/10.3390/en14185872
AMA Style
Kus V, Skala B, Drabek P. Complex Design Method of Filtration Station Considering Harmonic Components. Energies. 2021; 14(18):5872. https://0-doi-org.brum.beds.ac.uk/10.3390/en14185872
Chicago/Turabian StyleKus, Vaclav, Bohumil Skala, and Pavel Drabek. 2021. "Complex Design Method of Filtration Station Considering Harmonic Components" Energies 14, no. 18: 5872. https://0-doi-org.brum.beds.ac.uk/10.3390/en14185872
Note that from the first issue of 2016, this journal uses article numbers instead of page numbers. See further details here.