Article

Adsorption of Reactive Dye onto Uçá Crab Shell (Ucides cordatus): Scale-Up and Comparative Studies

by
Maria Eduarda Araújo Pessoa
*,
Karla Silvana Menezes Gadelha de Sousa
,
Genaro Zenaide Clericuzi
,
Andrea Lopes de Oliveira Ferreira
,
Maria Clara de Souza Soares
and
José Cavalcante de Queiroz Neto
Chemical Engineering Department, Campus I, Federal University of Paraíba (UFPB), João Pessoa 58051-900, PB, Brazil
*
Author to whom correspondence should be addressed.
Submission received: 9 July 2021 / Revised: 24 July 2021 / Accepted: 2 August 2021 / Published: 17 September 2021
(This article belongs to the Special Issue Wastewater, Water and Energy)

Abstract

:
The growing interest in using low-cost methods that use natural sources makes the study of adsorption processes increasingly frequent and common. Thus, the use of uçá crab shell (Ucides cordatus) in the adsorption of reactive dye (reactive blue 222) was studied in two systems (S1 and S2) in a finite bath, with a scale-up of 12 times and considering different forms of agitation. The biosorbent material was previously characterized from FTIR and EDX spectroscopies, SEM, physical adsorption of N2, and point of zero charge. The kinetic study allowed modeling the experimental data and defining the equilibrium time for the S1 system as 400 min, and the S2 system as 360 min. The equilibrium adsorption capacities are 3.623 mg·g−1 (S1) and 4.191 mg·g−1 (S2). The pseudo-second-order (PSO) model best described the experimental data. The favorable multilayer adsorption was confirmed for the isothermal analysis, and the Freundlich and Sips models represented the experimental data of S1 and S2, respectively. The results obtained are positive indications of the scale-up of the S2 system.

1. Introduction

Although water covers 70% of the world’s surface—10% being concentrated in Brazilian territory freshwater—availability is becoming increasingly scarce. In addition to the fact that access and distribution of this resource are not homogeneously conducted, the degradation process arises due to natural and anthropogenic pollution, which interferes with its availability. The accelerated use of substances that are infused with pollutants (pesticides, heavy metals, anions, pharmaceuticals, phenolics, dyes, and hydrocarbons), from activities carried out by man, which include the inappropriate use of the soil, discharge of waste and sewage into the bodies of water, inadequate disposal of household waste, pesticides, among others, aggravate this problem [1,2].
Each year, industrial activity increases a growing need to dispose of waste and wastewater correctly. In the textile industry, the effluents that are generated are highly complex, with varied composition and concentration; more often, organic salts, acids, bases, and dyes are present [3]. The excessive volume of water that is used in the processes, combined with the presence of dyes—which have a high degree of toxicity—demands the use of methodologies that ensure the necessary efficiency in the degradation of recalcitrant pollutants, without the formation of toxic intermediates and within a perspective of economic viability. The problem regarding the incorrect disposal of this type of effluent transcends the visual aspect, since it directly affects the development of aquatic life, limiting the sunlight penetration and promoting a delay in the photosynthesis process [1,3,4].
Different methods have been developed for wastewater treatment, including biological [5,6], membrane technology [7,8], electrochemistry [9,10], and adsorption. Adsorption has become a competitive method in the field of wastewater treatment, because most of these methods are not widely used due to their high costs, additional environmental effects, and very low efficiency [11]. It consists of a mass transfer operation that studies the ability of certain solids to concentrate certain substances in fluids on their surface, enabling the separation of the components of these fluids [2,12]. The reuse of waste represents an essential strategy for reducing the extraction of natural resources, and reducing its accumulation in garbage and landfills. Materials without commercial importance, which would typically be discarded, can be used as an efficient raw material in the treatment of industrial effluents containing dyes, through adsorption processes, including macroalgae [13], microalgae [14,15], sludge [16], bacteria [17,18], chitosan [3,19,20].
The uçá crab (Ucides cordatus) is a species of mangrove that is found in tropical and sub-tropical regions, being the most important crustacean that inhabits the mangrove forests of the Brazilian coast [21]. This crustacean is commonly used in human consumption, and the shells have been used as an adsorbent material for water pollutants [22,23]. Crab shell is a highly resistant material, consisting mainly of calcium carbonate and chitin, associated with protein and mineral salts [24]. Due to its versatility, this biopolymer may be used as an agent in the treatment of effluents, especially in the production of chitosan. Chitosan is a cationic polysaccharide that is composed of glucosamine and N-acetyl glucosamine, obtained by partial N-deacetylation of chitin [21,25]. Porpino et al. [26] confirmed the deacetylation of chitin in cooked crab shells, to produce chitosan by FTIR analyses. The low cost, combined with its primary composition of chitin and calcium carbonate [27,28], enhance the use of crab shells as an economically viable bioadsorbent.
The present work aims to study Ucides cordatus crab shell usage in reactive blue 222 dye biosorption, which is present in an aqueous solution. For this, the following two different systems were evaluated at 25 °C: one on a smaller scale (tests carried out in Dubnoff shaker bath—system S1) and another on a larger scale (tests carried out in a mixing reactor that was developed in the laboratory—system S2). The kinetics and isotherms studies were carried out.

2. Materials and Methods

2.1. Preparation of Materials

The second most common portion of biomass comes from a polysaccharide, chitin, which is produced by a variety of marine animals, insects, and fungi. Chitosan is a partially acetylated glucosamine biopolymer, which mainly results from deacetylation of chitin [29], and it is a widely used sorbent for transition metals and organic species because it has amino (-NH2) and hydroxy (-OH) groups in its structure. Therefore, the boiled uçá crab shell was studied as a potential material for reactive dye adsorption, since the possible deacetylation of chitin to obtain chitosan can be observed in other references through FTIR spectroscopy [21,26,29]. The crustacean powder was obtained from the shells of the uçá crab (Ucides cordatus), provided by several commercial points in the city of João Pessoa-PB. The largest carapaces were selected and washed with boiling water to eliminate residues and then washed at least three times with deionized water and oven-dried at 100 °C for 24 h. The husks underwent a grinding procedure in the SOLAB brand knife mill, model SL-31. Subsequently, the particle size analysis was performed on sieves with diameters ranging from 24 to 200 mesh.
The dye used for the synthetic preparation of the effluent was the reactive dye blue quimifix bf 115% (reactive blue 222), provided by the company Matesa Têxtil—João Pessoa/PB. Reactive dyes proved attractive to dyers due to the bright colors and the excellent fastness properties of this dye class. They are water soluble anionic dyes and various physical forms of these dyes are available [30]. In Table 1, it is possible to observe the properties and chemical structure of reactive blue 222. The pH adjustment of the aqueous solutions was made using a LUCADERMA brand pH meter, model LUCA-210.

2.2. Characterization and Analysis of Materials

2.2.1. Particle Size Analysis

The granulometric analysis of the crab shells was conducted after the milling step. For this, sieves with diameters ranging from 24 to 200 mesh were used, and the retained material was weighed.

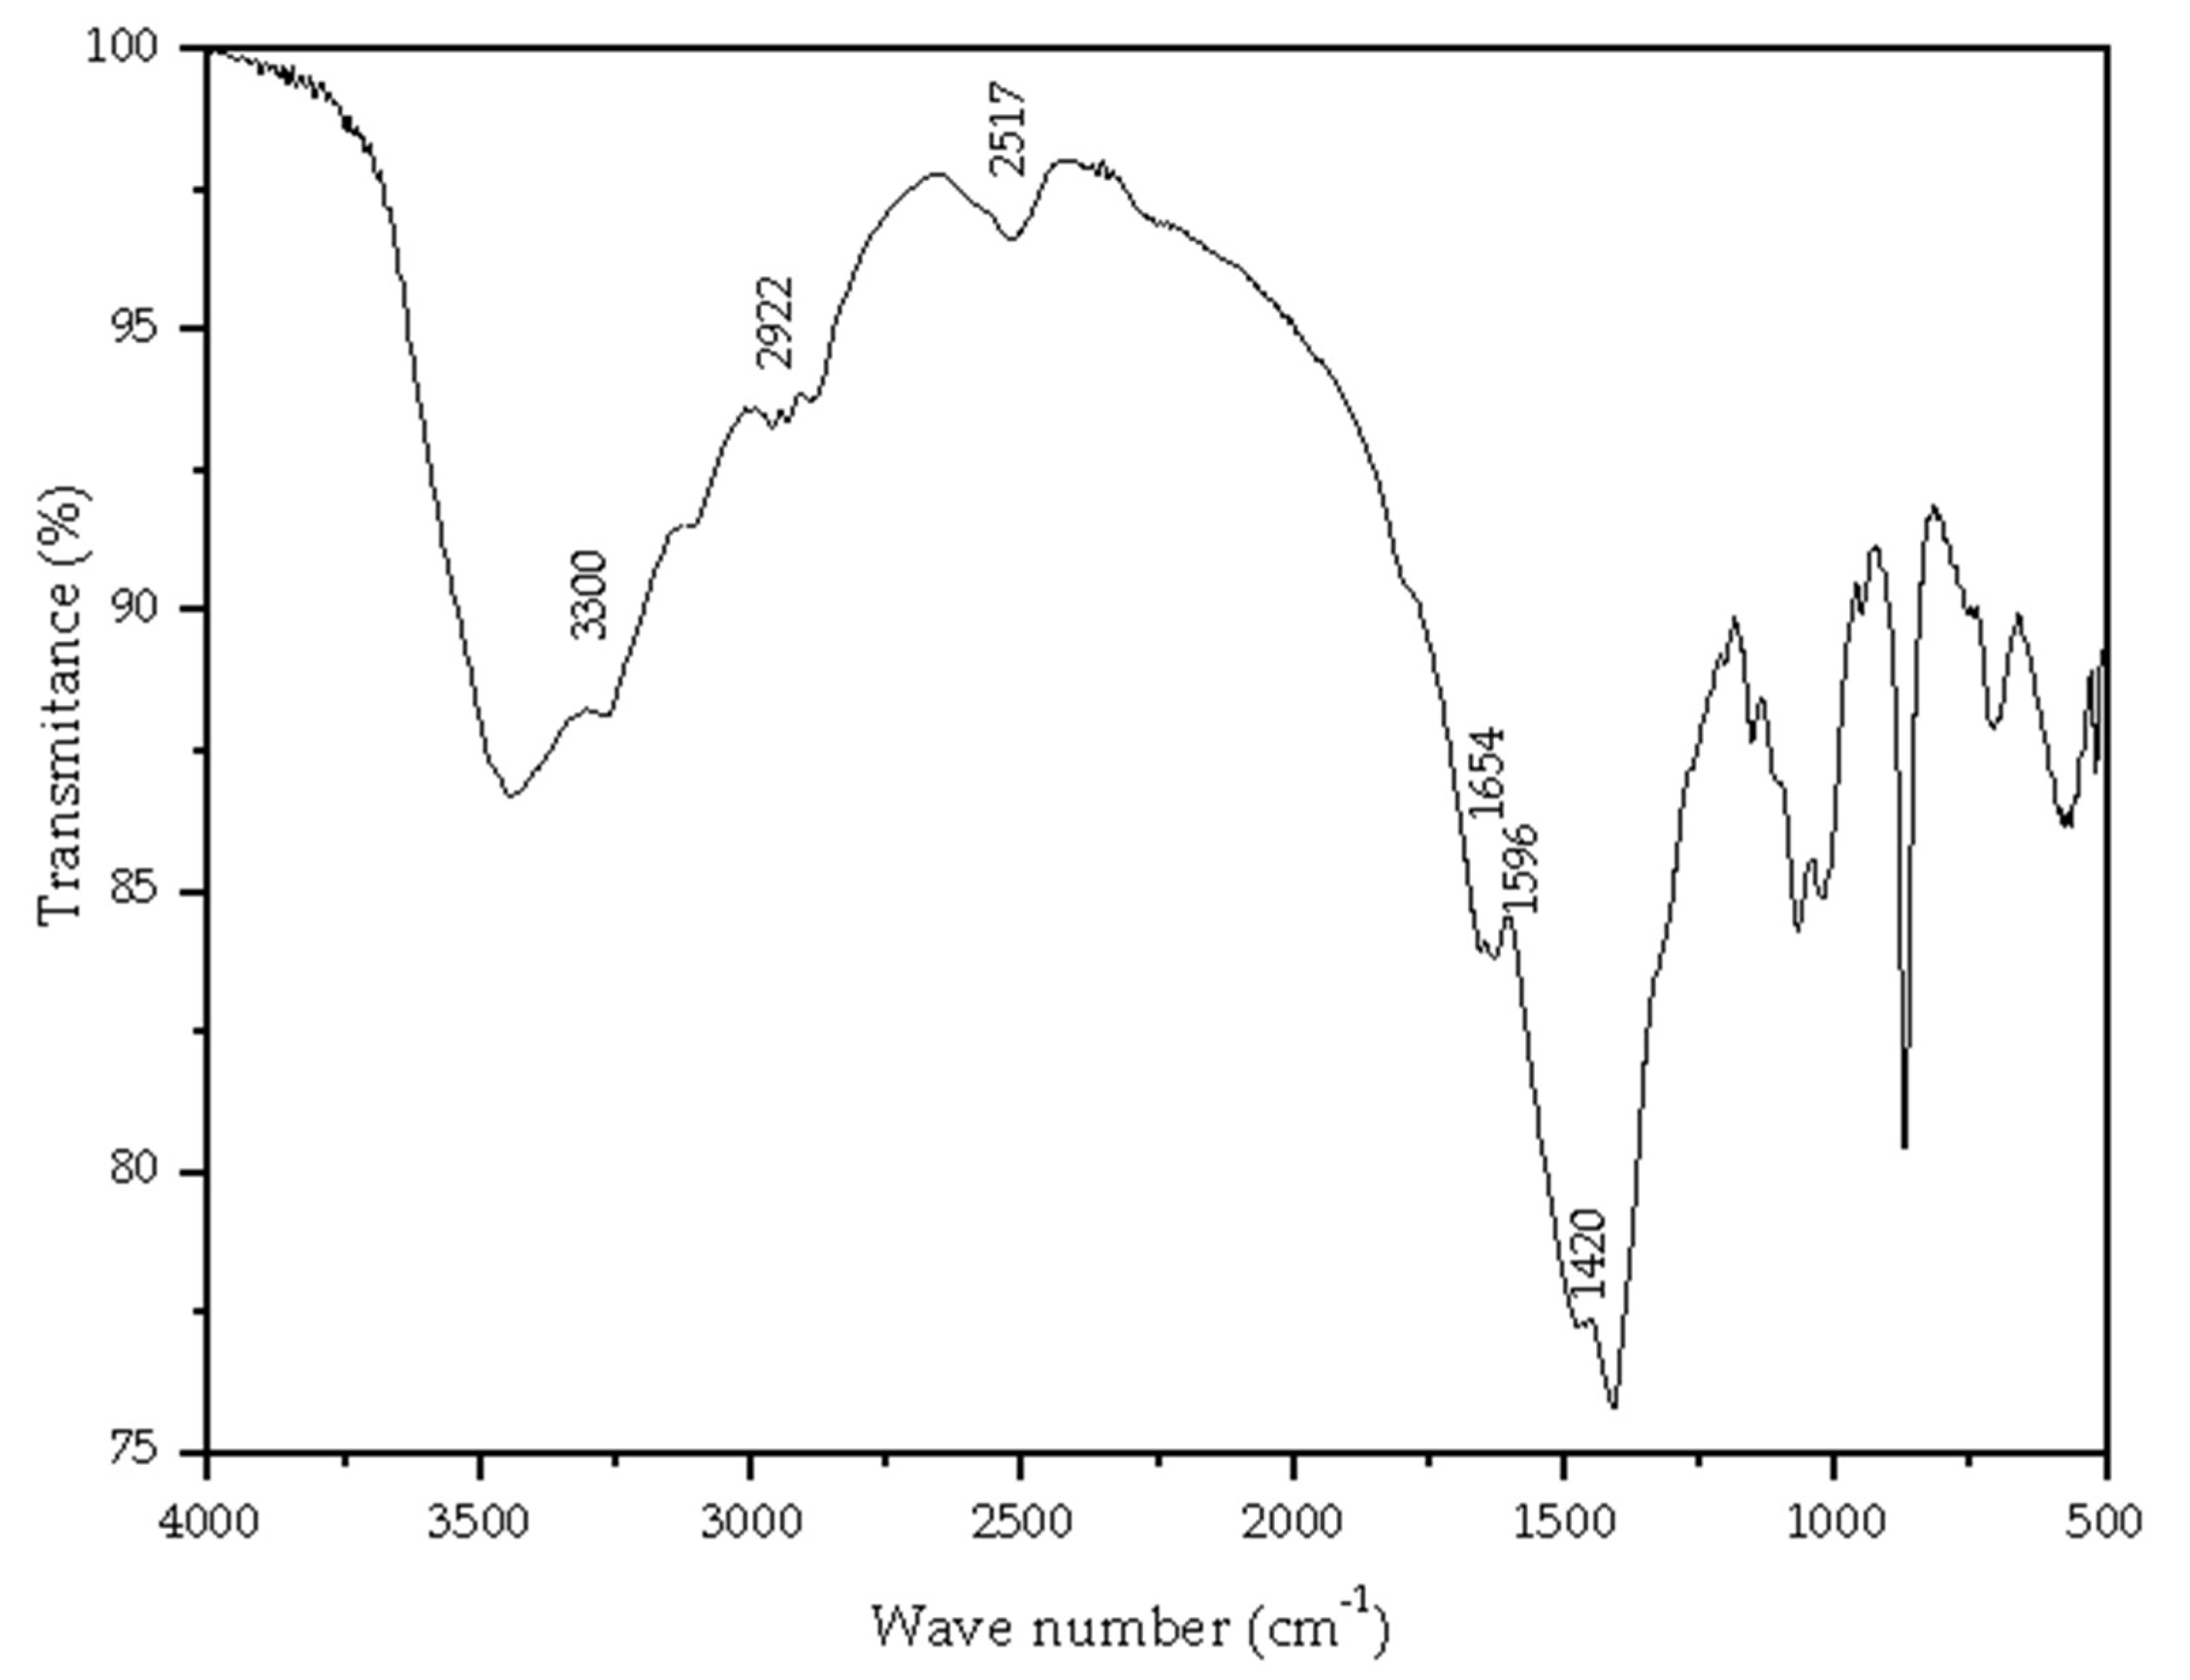
2.2.2. Fourier Transform Infrared Spectroscopy (FT-IR) and Data Analysis

Functional groups present in adsorbent materials are essential in discovering the adsorption mechanisms. FT-IR analysis allows identifying the covalent bonds of compounds through absorption in the infrared range. A Shimadzu model IR Prestige-21 was used, in transmittance mode, with a resolution of 4 cm−1, with accumulations of 20 scans and a wavelength in the range of 4000 to 500 cm−1.

2.2.3. Energy-Dispersive X-ray Spectroscopy (EDX) Analysis

Energy-dispersive X-ray spectroscopy (EDX or EDS) is a semi-quantitative method used for the elemental analysis or chemical characterization of a sample, allowing the identification of its global chemical composition from its excitation by X-ray irradiation [31]. The tablets prepared for analysis were supported in boric acid, and the elements analyzed were from Na to U in the EDX 8000 equipment of the Shimadzu brand.

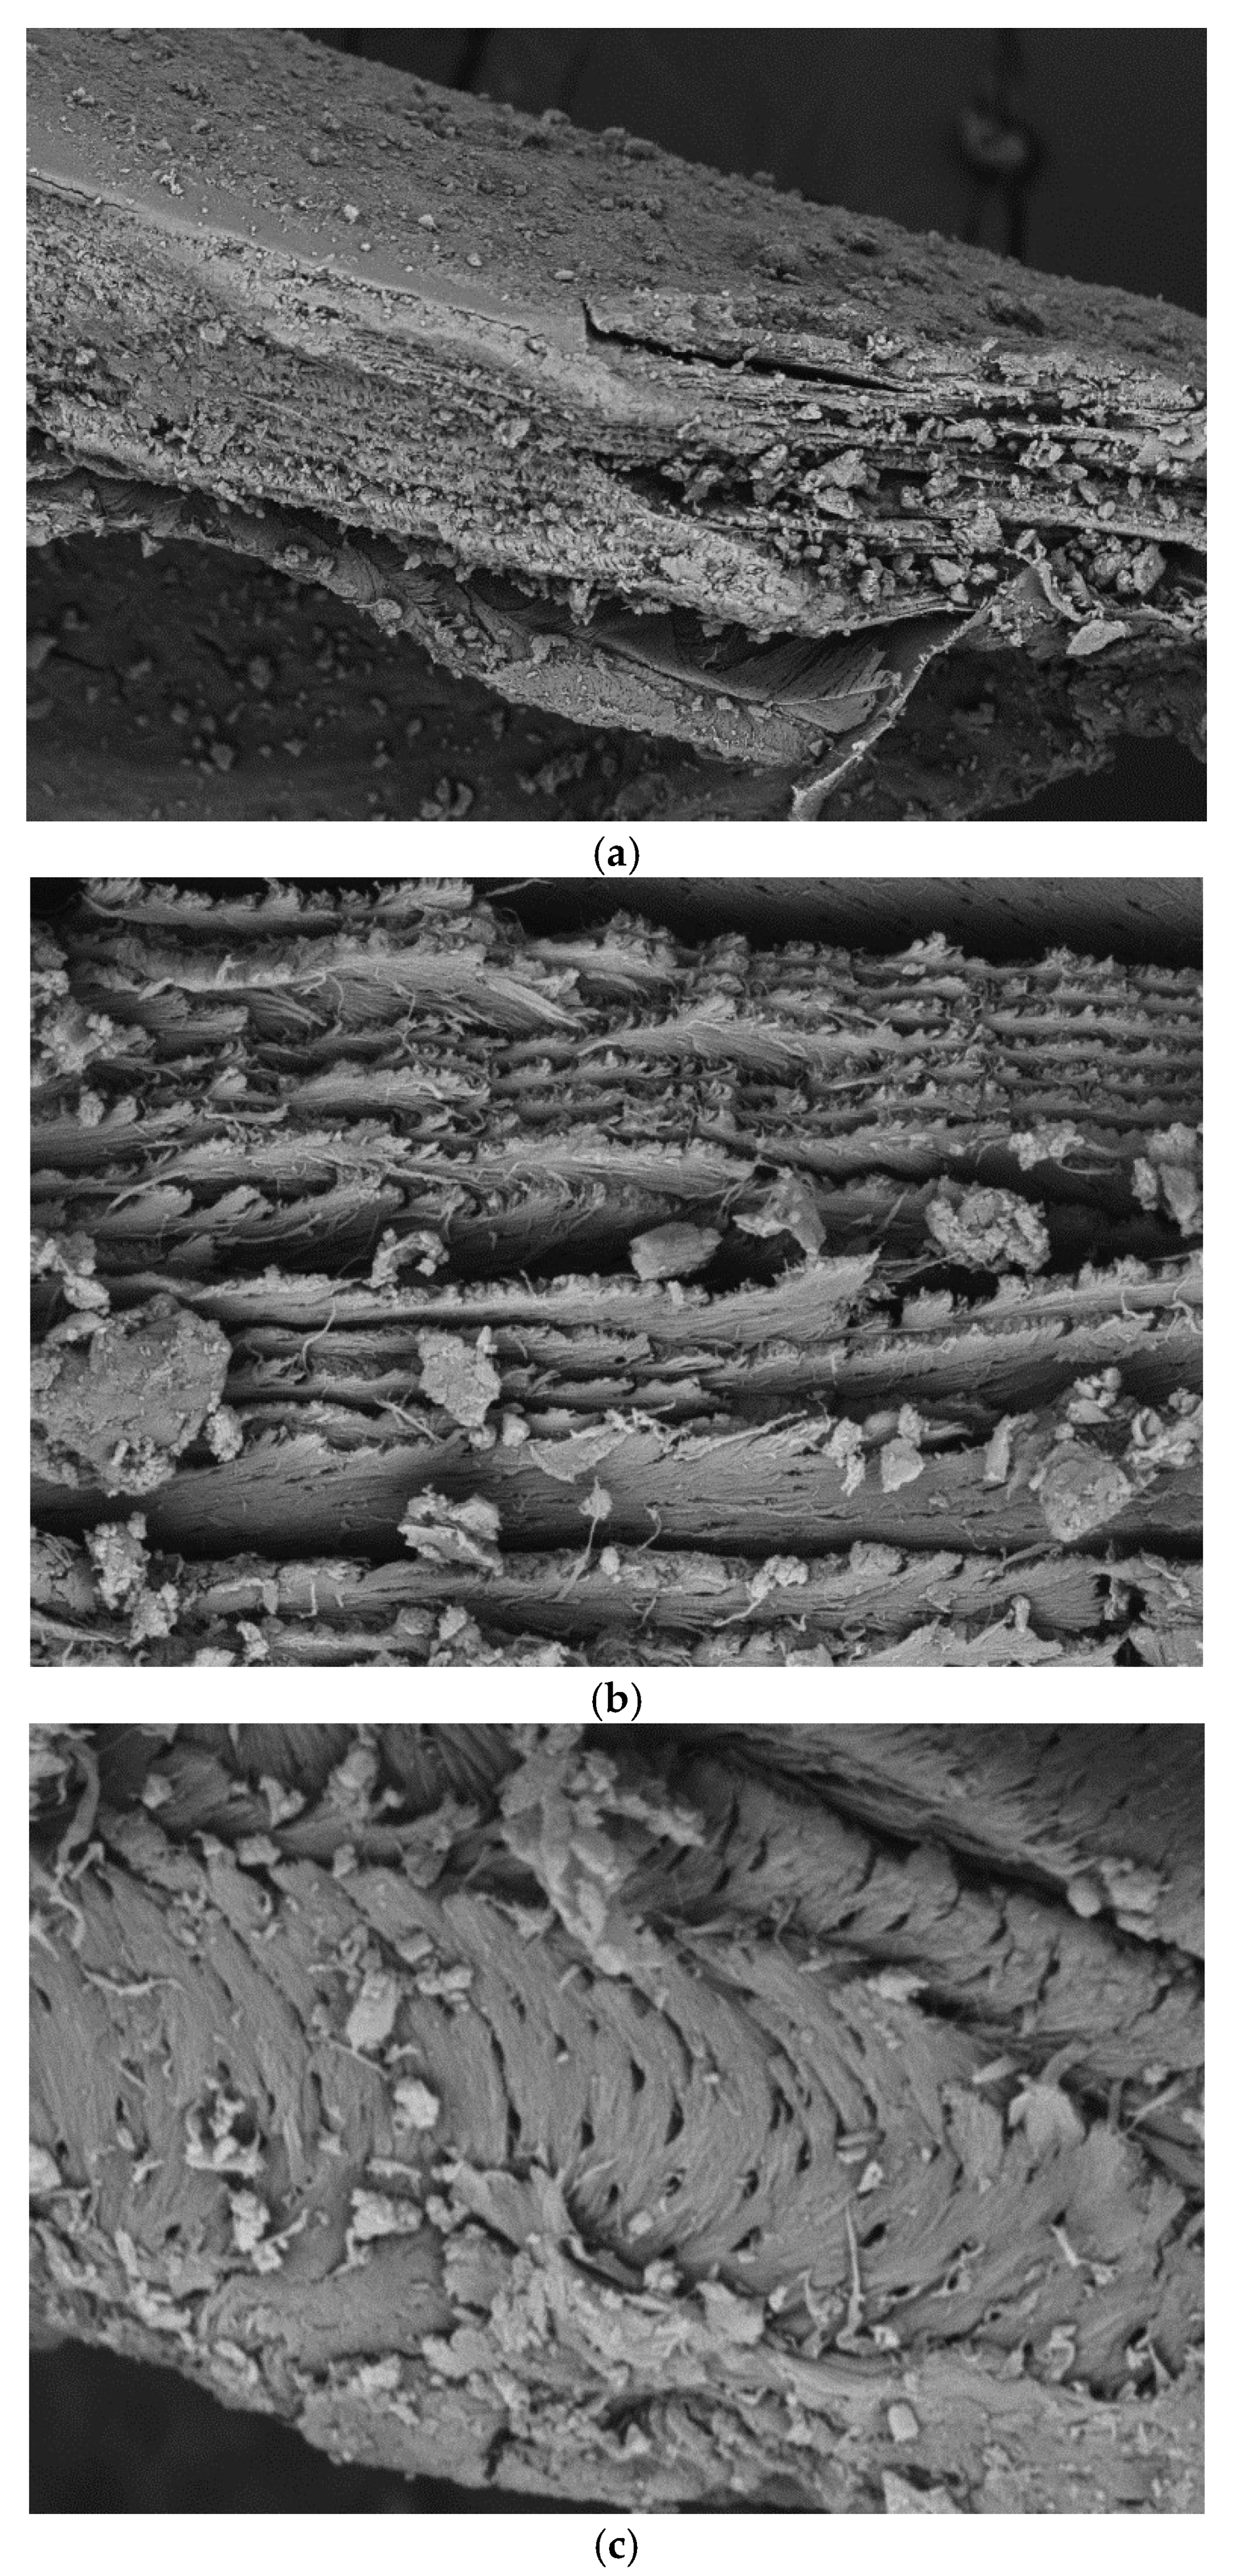
2.2.4. Scanning Electron Microscopy (SEM)

The analyses were performed in the Rapid Solidification Laboratory of the Technology Center of the Federal University of Paraíba, using a scanning electron microscope, model Zeiss LEO 1430, at 15 kV, and backscattered electron diffraction. The adsorbent used was deposited in a sample holder with graphite adhesive tape and covered with a gold film so as not to be discharged during the analysis.

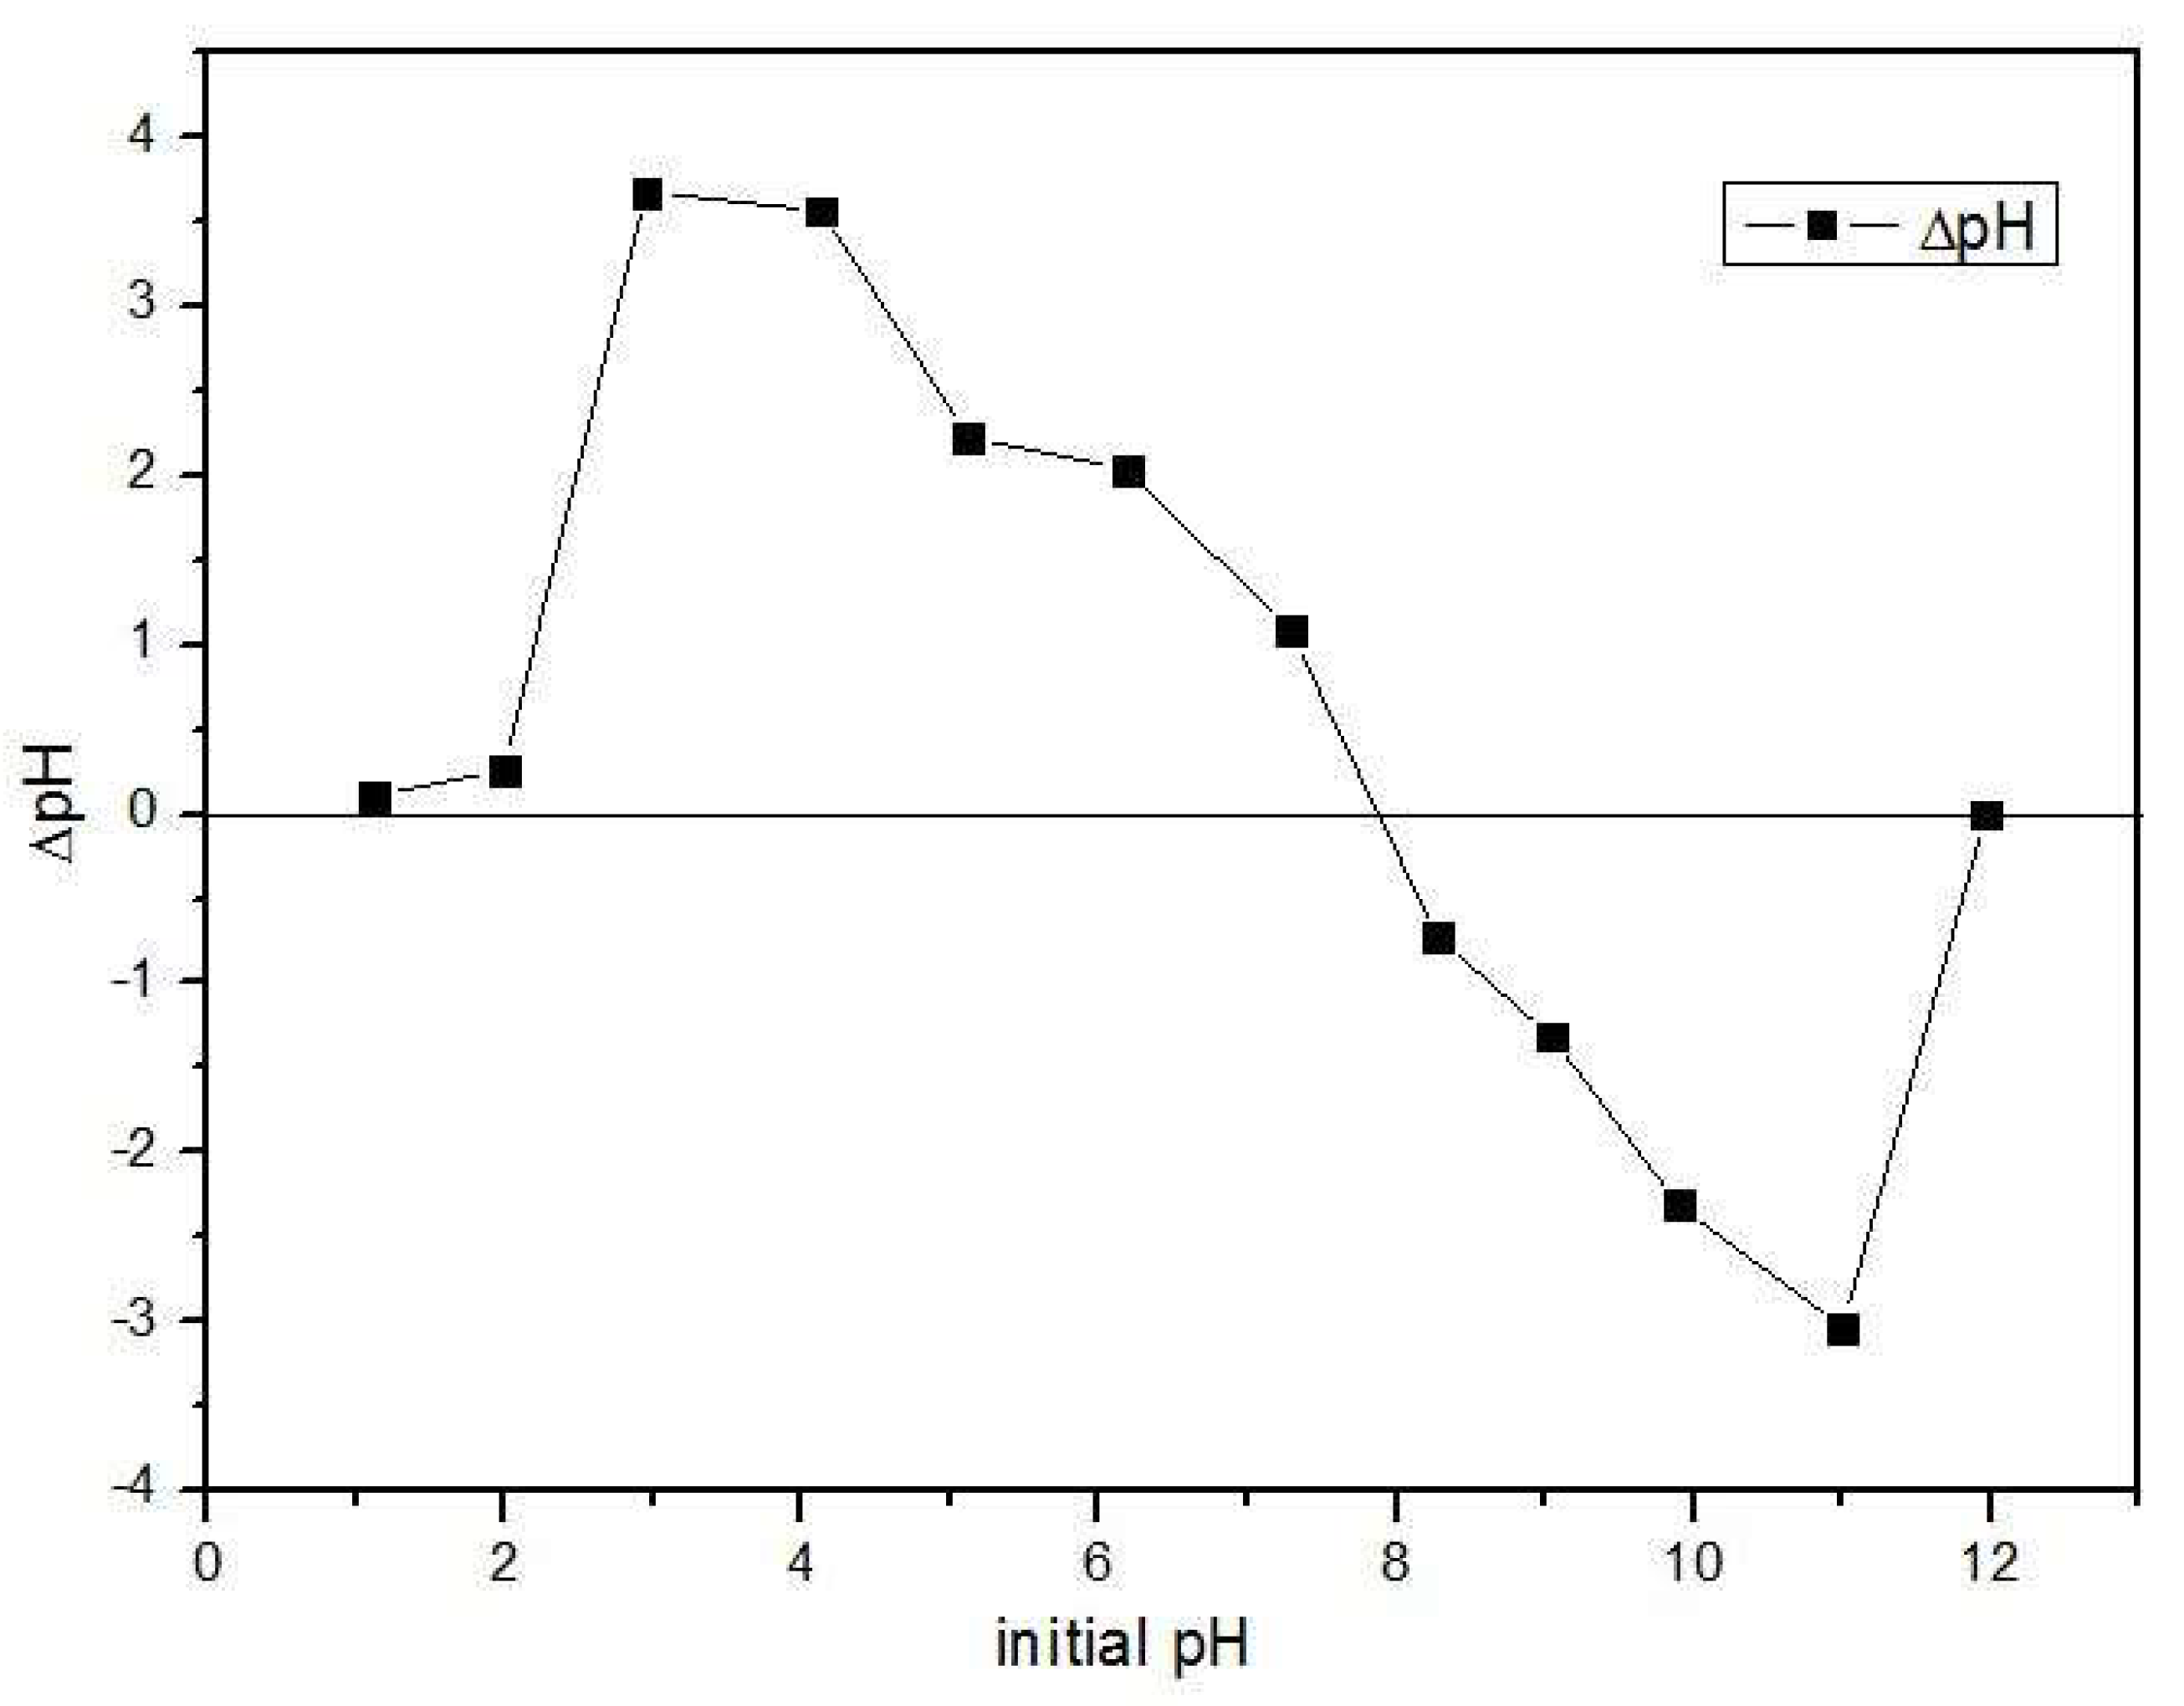
2.2.5. Point of Zero Charge (PCZ)—Salt Addition Method

The point of zero charge gives the pH value at which a solid has zero electrical charges on its surface. That is, the number of positive charges is equal to the number of negative charges. The method of determining the pH of the zero-charge point was the salt addition method, which the experimental procedure consists of adding 20 mg of the adsorbent to 20 mL of 0.1 mol·L−1 NaCl aqueous solution under 12 different initial pH conditions, adjusted with 0.1 mol·L−1 HCl or NaOH solutions. After 24 h of equilibrium in a thermostatic bath, under stirring at 100 rpm, at 25 °C, the final pH of the solution is noted [32,33,34,35].

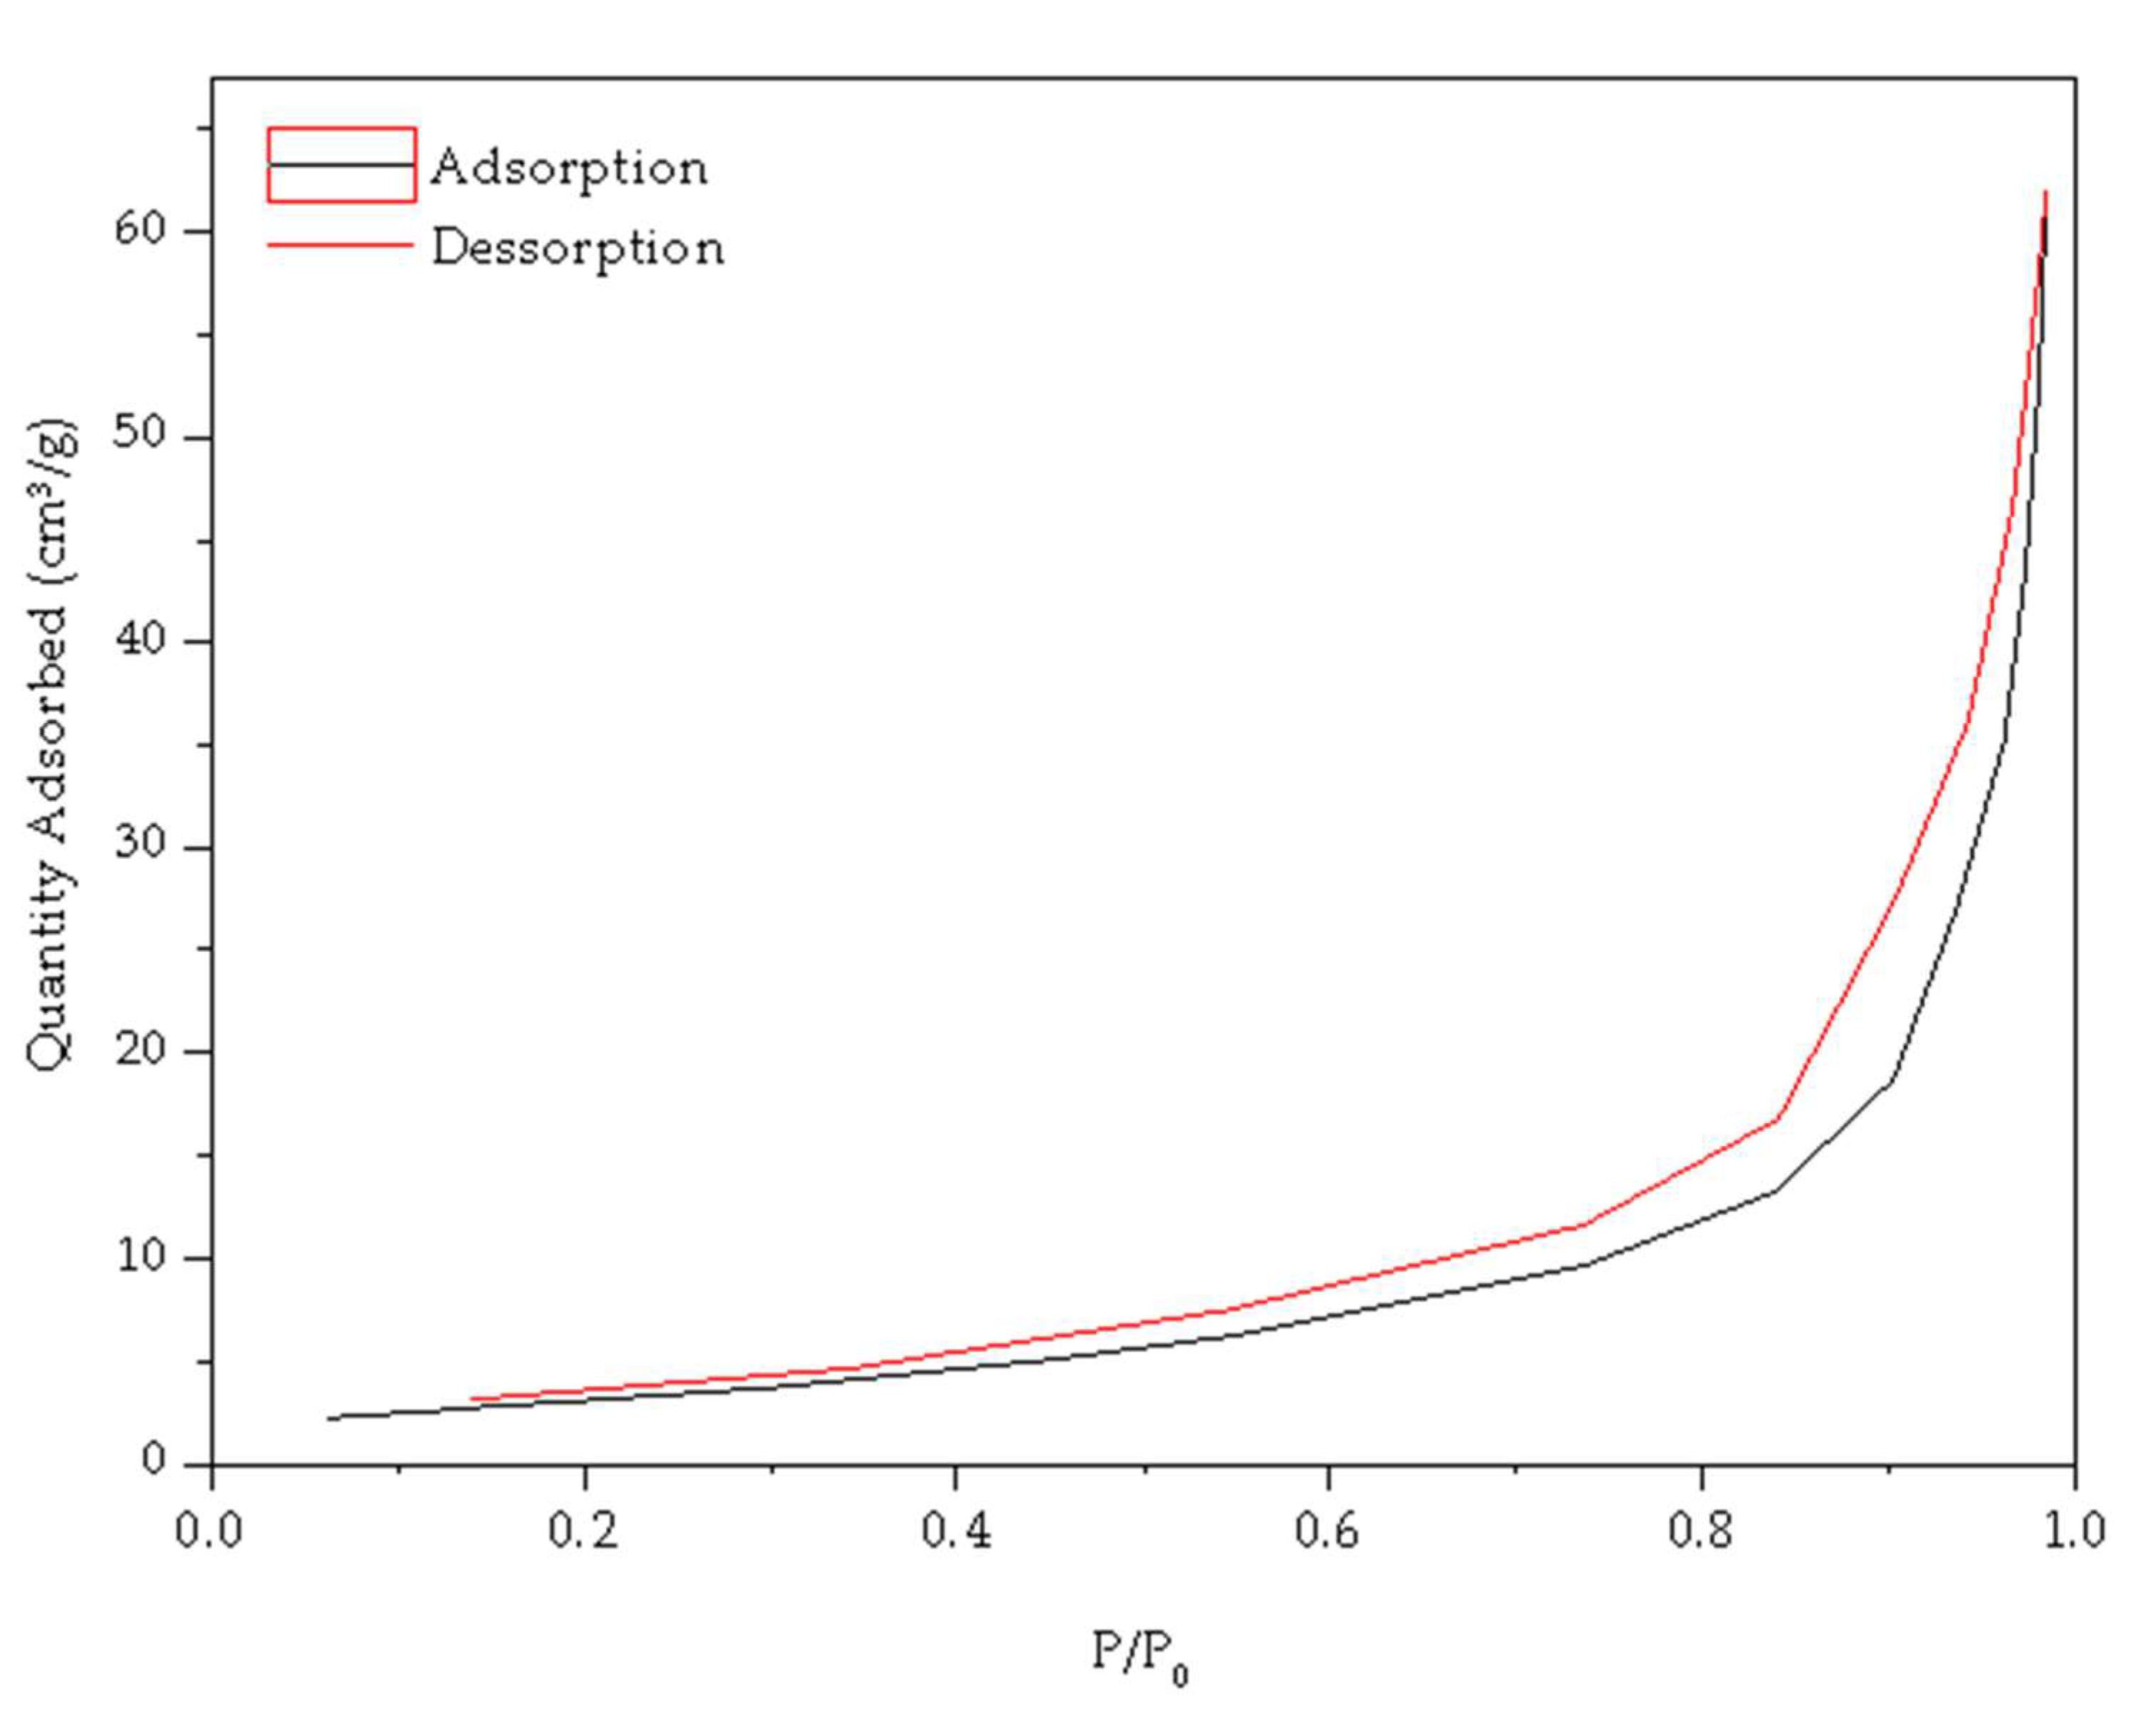
2.2.6. Physical Adsorption of N2

Analyses of specific surface area and pore size for uçá crab shells were performed by determining the volume of N2 adsorbed at various relative pressures, at 77 K, in the analyzer ASAP® 2020 (Micromeritics, Brazil). Brunauer–Emmett–Teller (BET) method was employed to assess the textural properties by the N2 adsorption–desorption isotherm. In this context, pores can be classified according to their size in macropores (pores with widths exceeding about 50 nm), mesopores (pores of widths between 2 nm and 50 nm) and micropores (pores with widths not exceeding about 2 nm) [36].

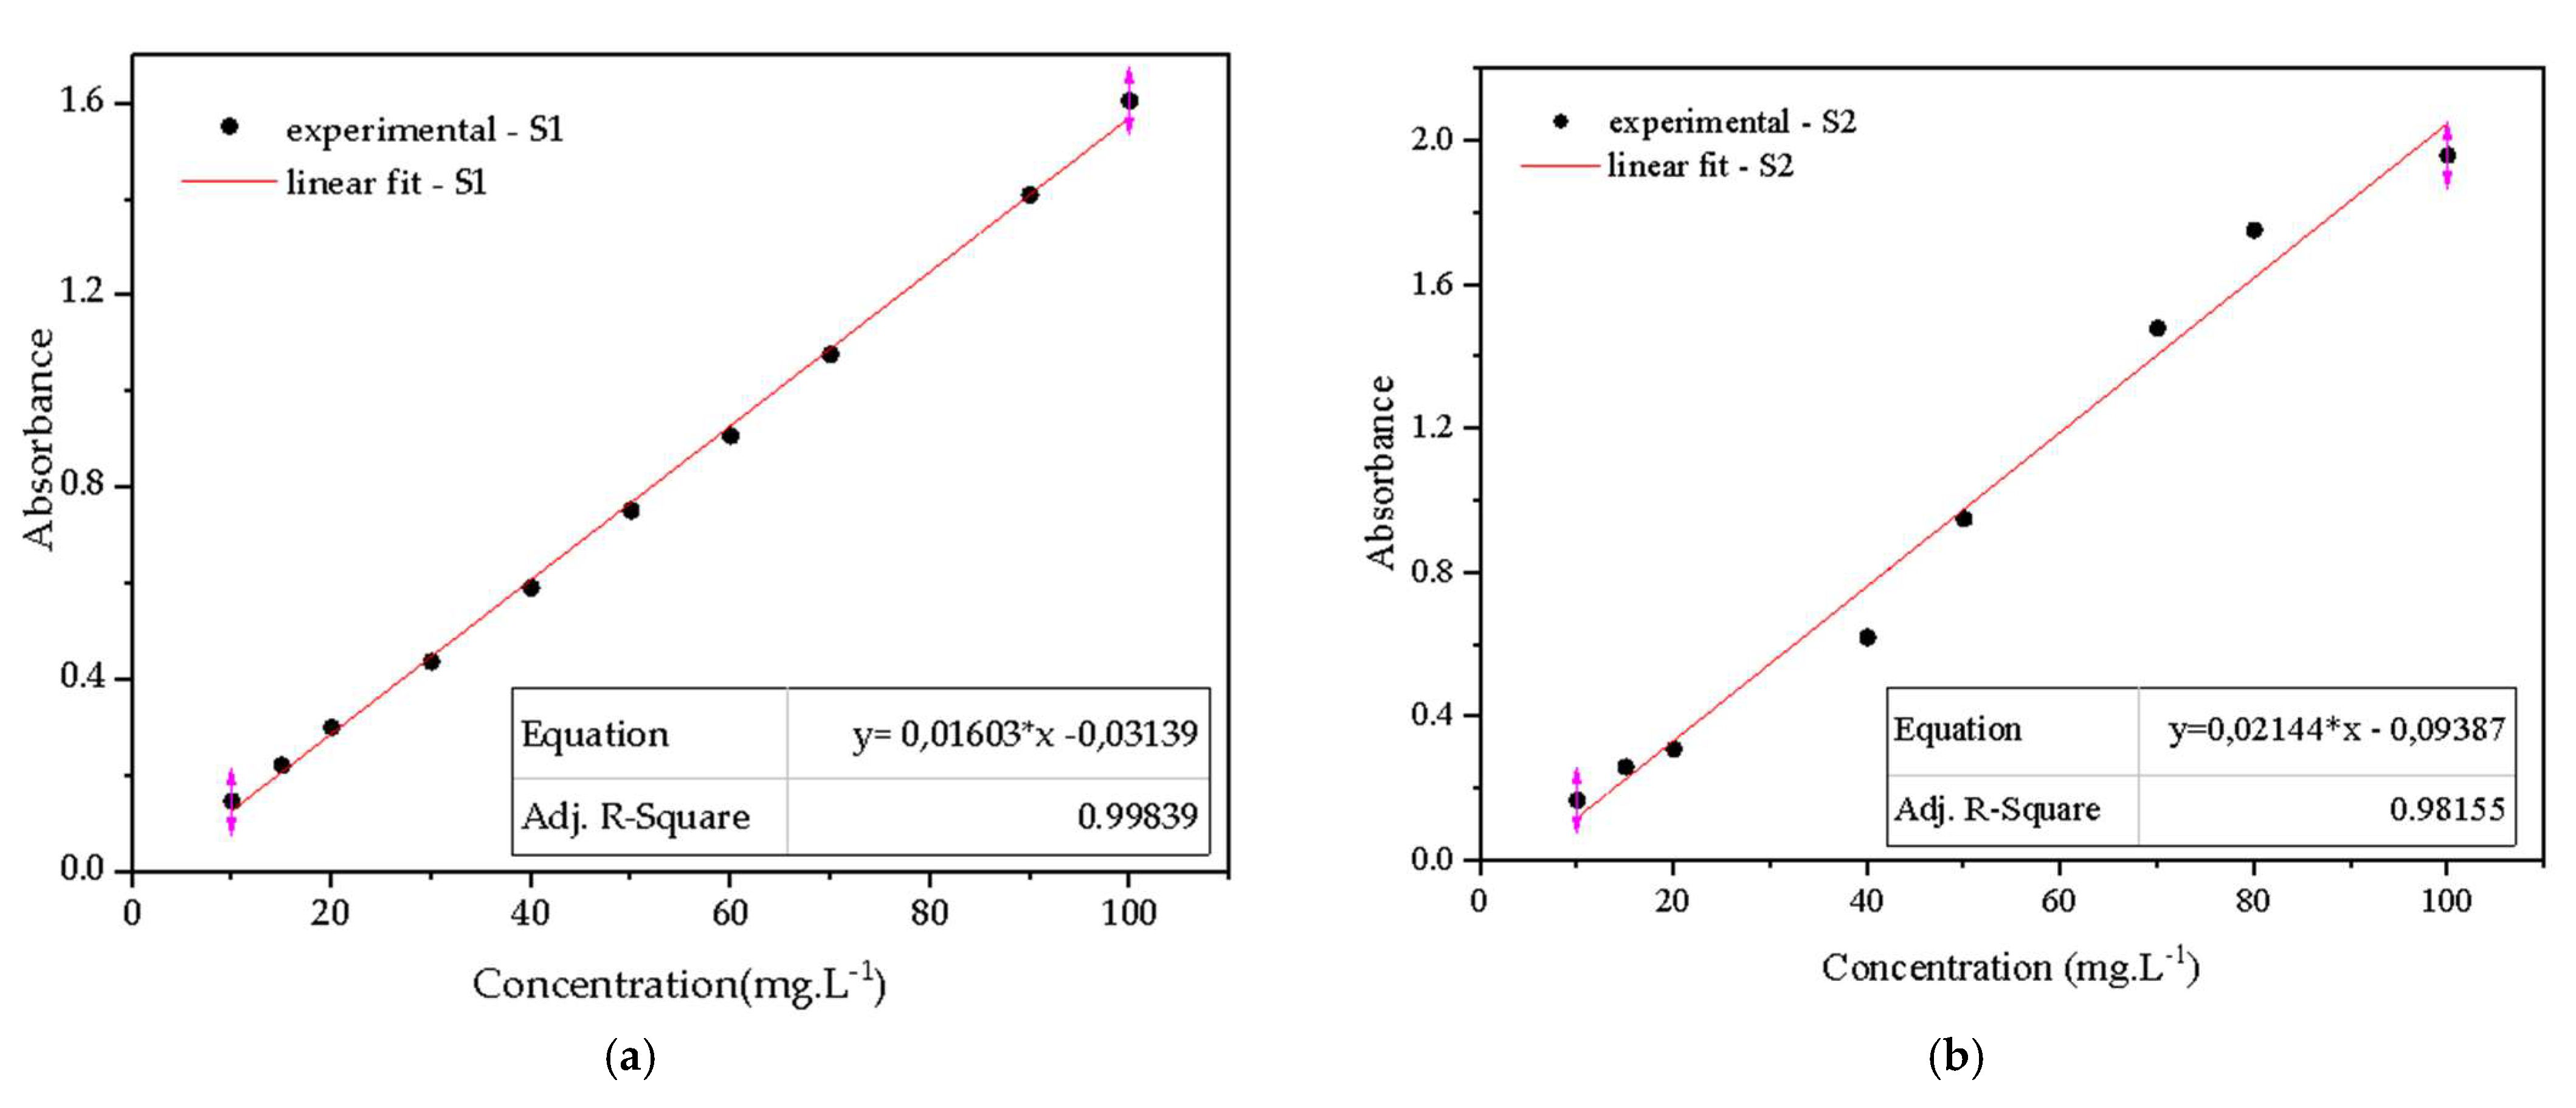
2.2.7. Spectrophotometric Method

The spectrophotometric method studies the interaction of light with the sample. It is based on the quantitative measurement of light absorption by solutions, with the solution concentration being proportional to the amount of light absorbed. For this purpose, synthetic solutions containing dye were prepared at concentrations ranging from 10 to 100 mg·L−1, using an EDUTEC spectrophotometer, model EEQ-9005, with a characteristic wavelength (λ = 614 nm). Two standard curves were obtained, as the experiments were carried out firstly in Dubnoff shaker bath and, secondly, with scale-up in the developed reactor. Individualized calibration curves were used for each system. The very stable electronic arrangement of the reactive dyes provides good resistance to the degrading effect of sunlight. There are, however, some reactive dyes with only fair light fastness. Reactive dyes with azo chromophore show lower light fastness [30]. So, as the experiments were carried out at different time intervals, as well as the preparation of the solutions, two calibration curves were adapted in order to minimize the experimental errors.

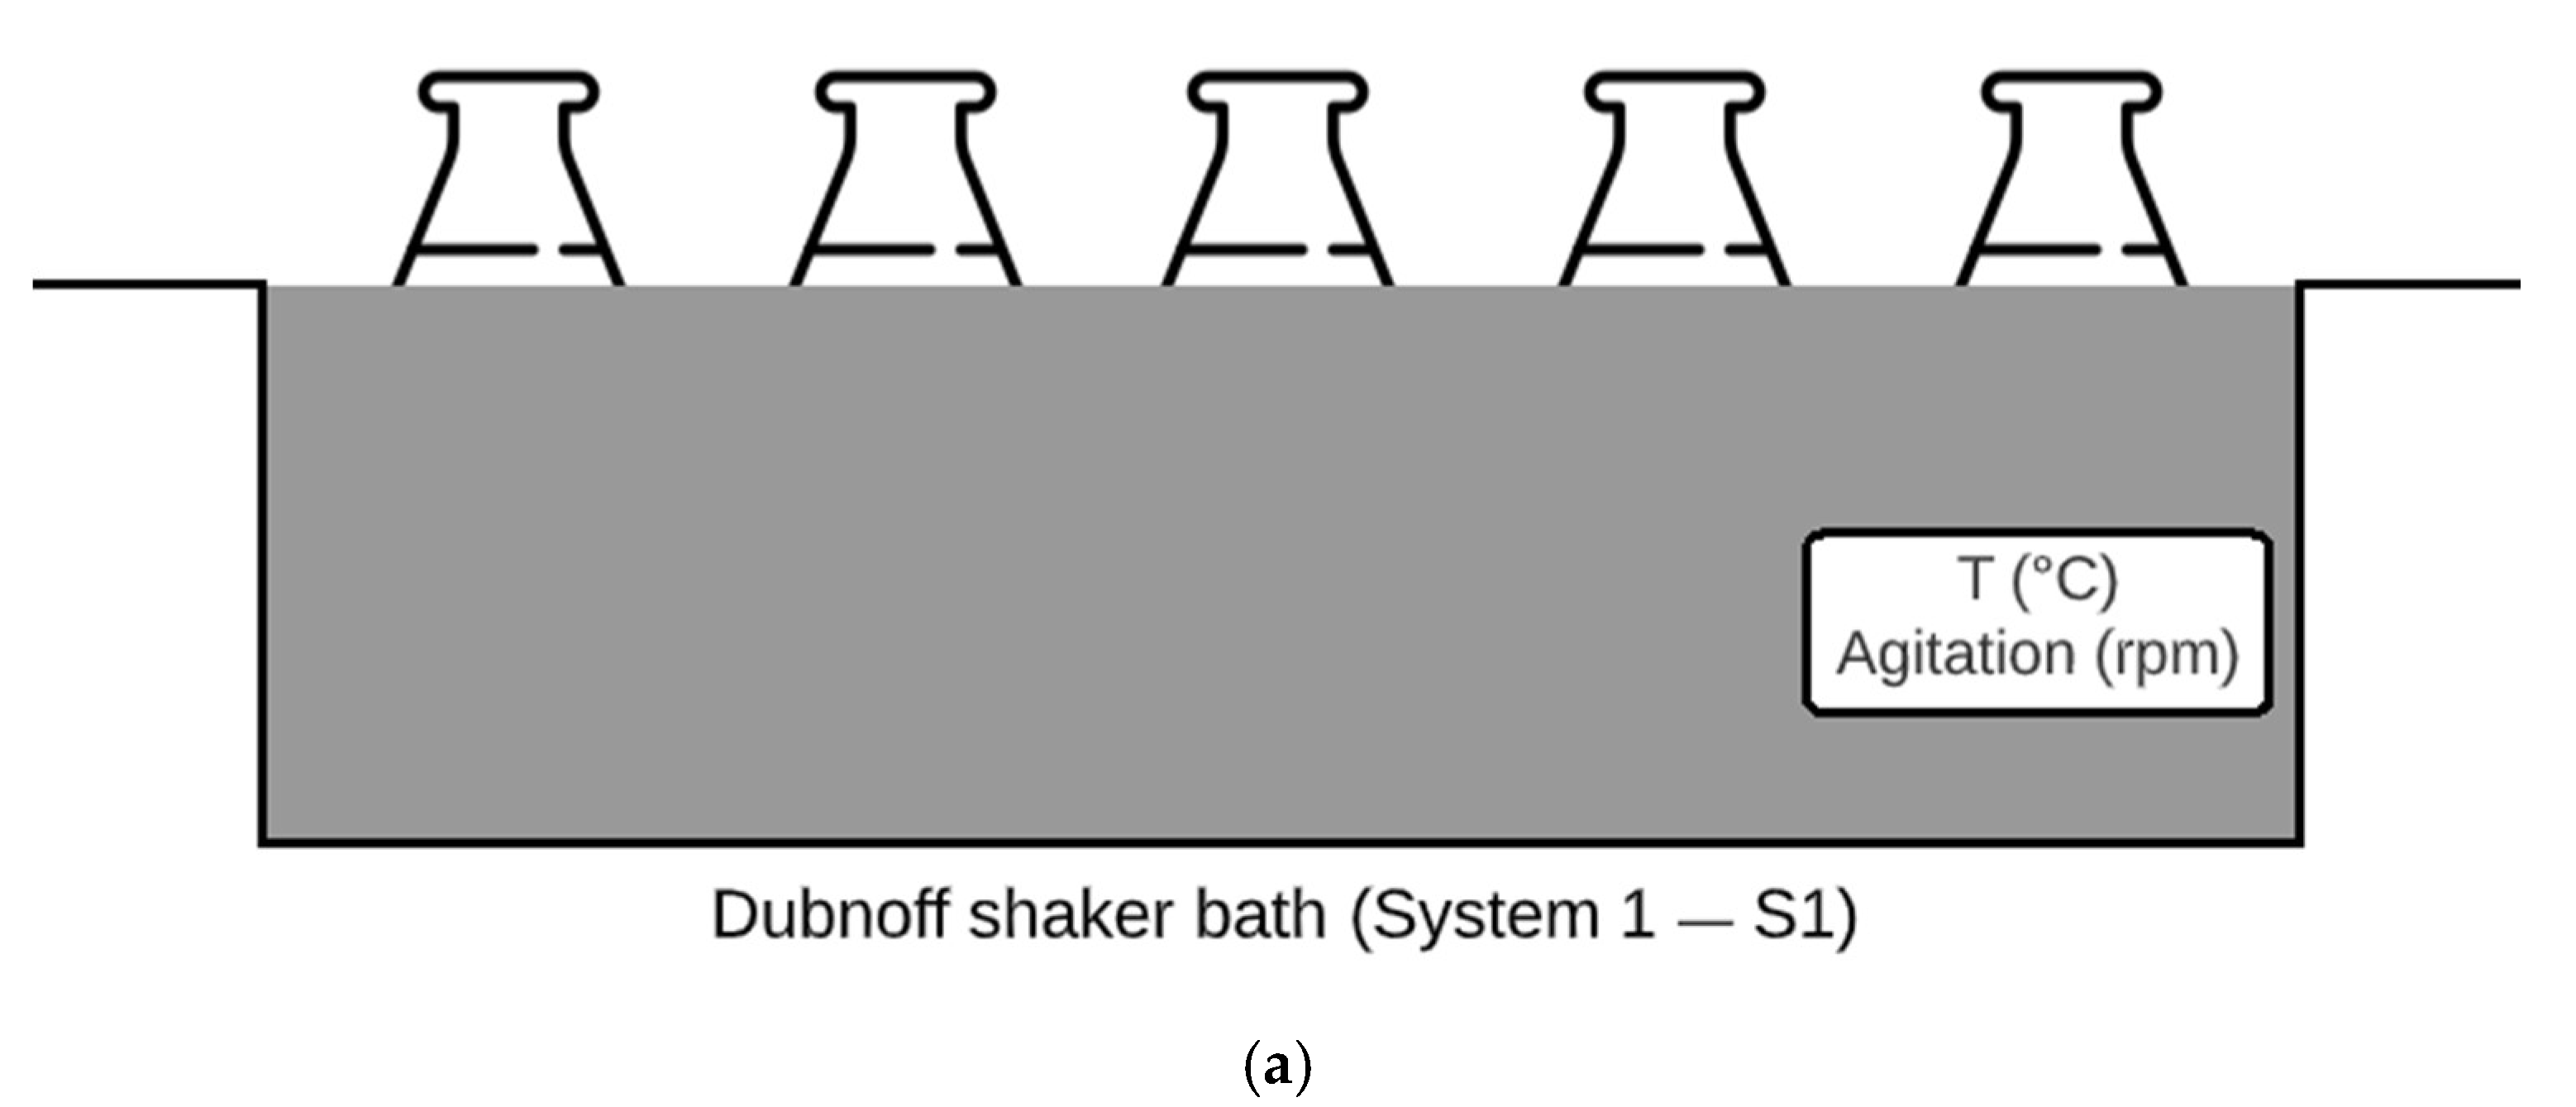
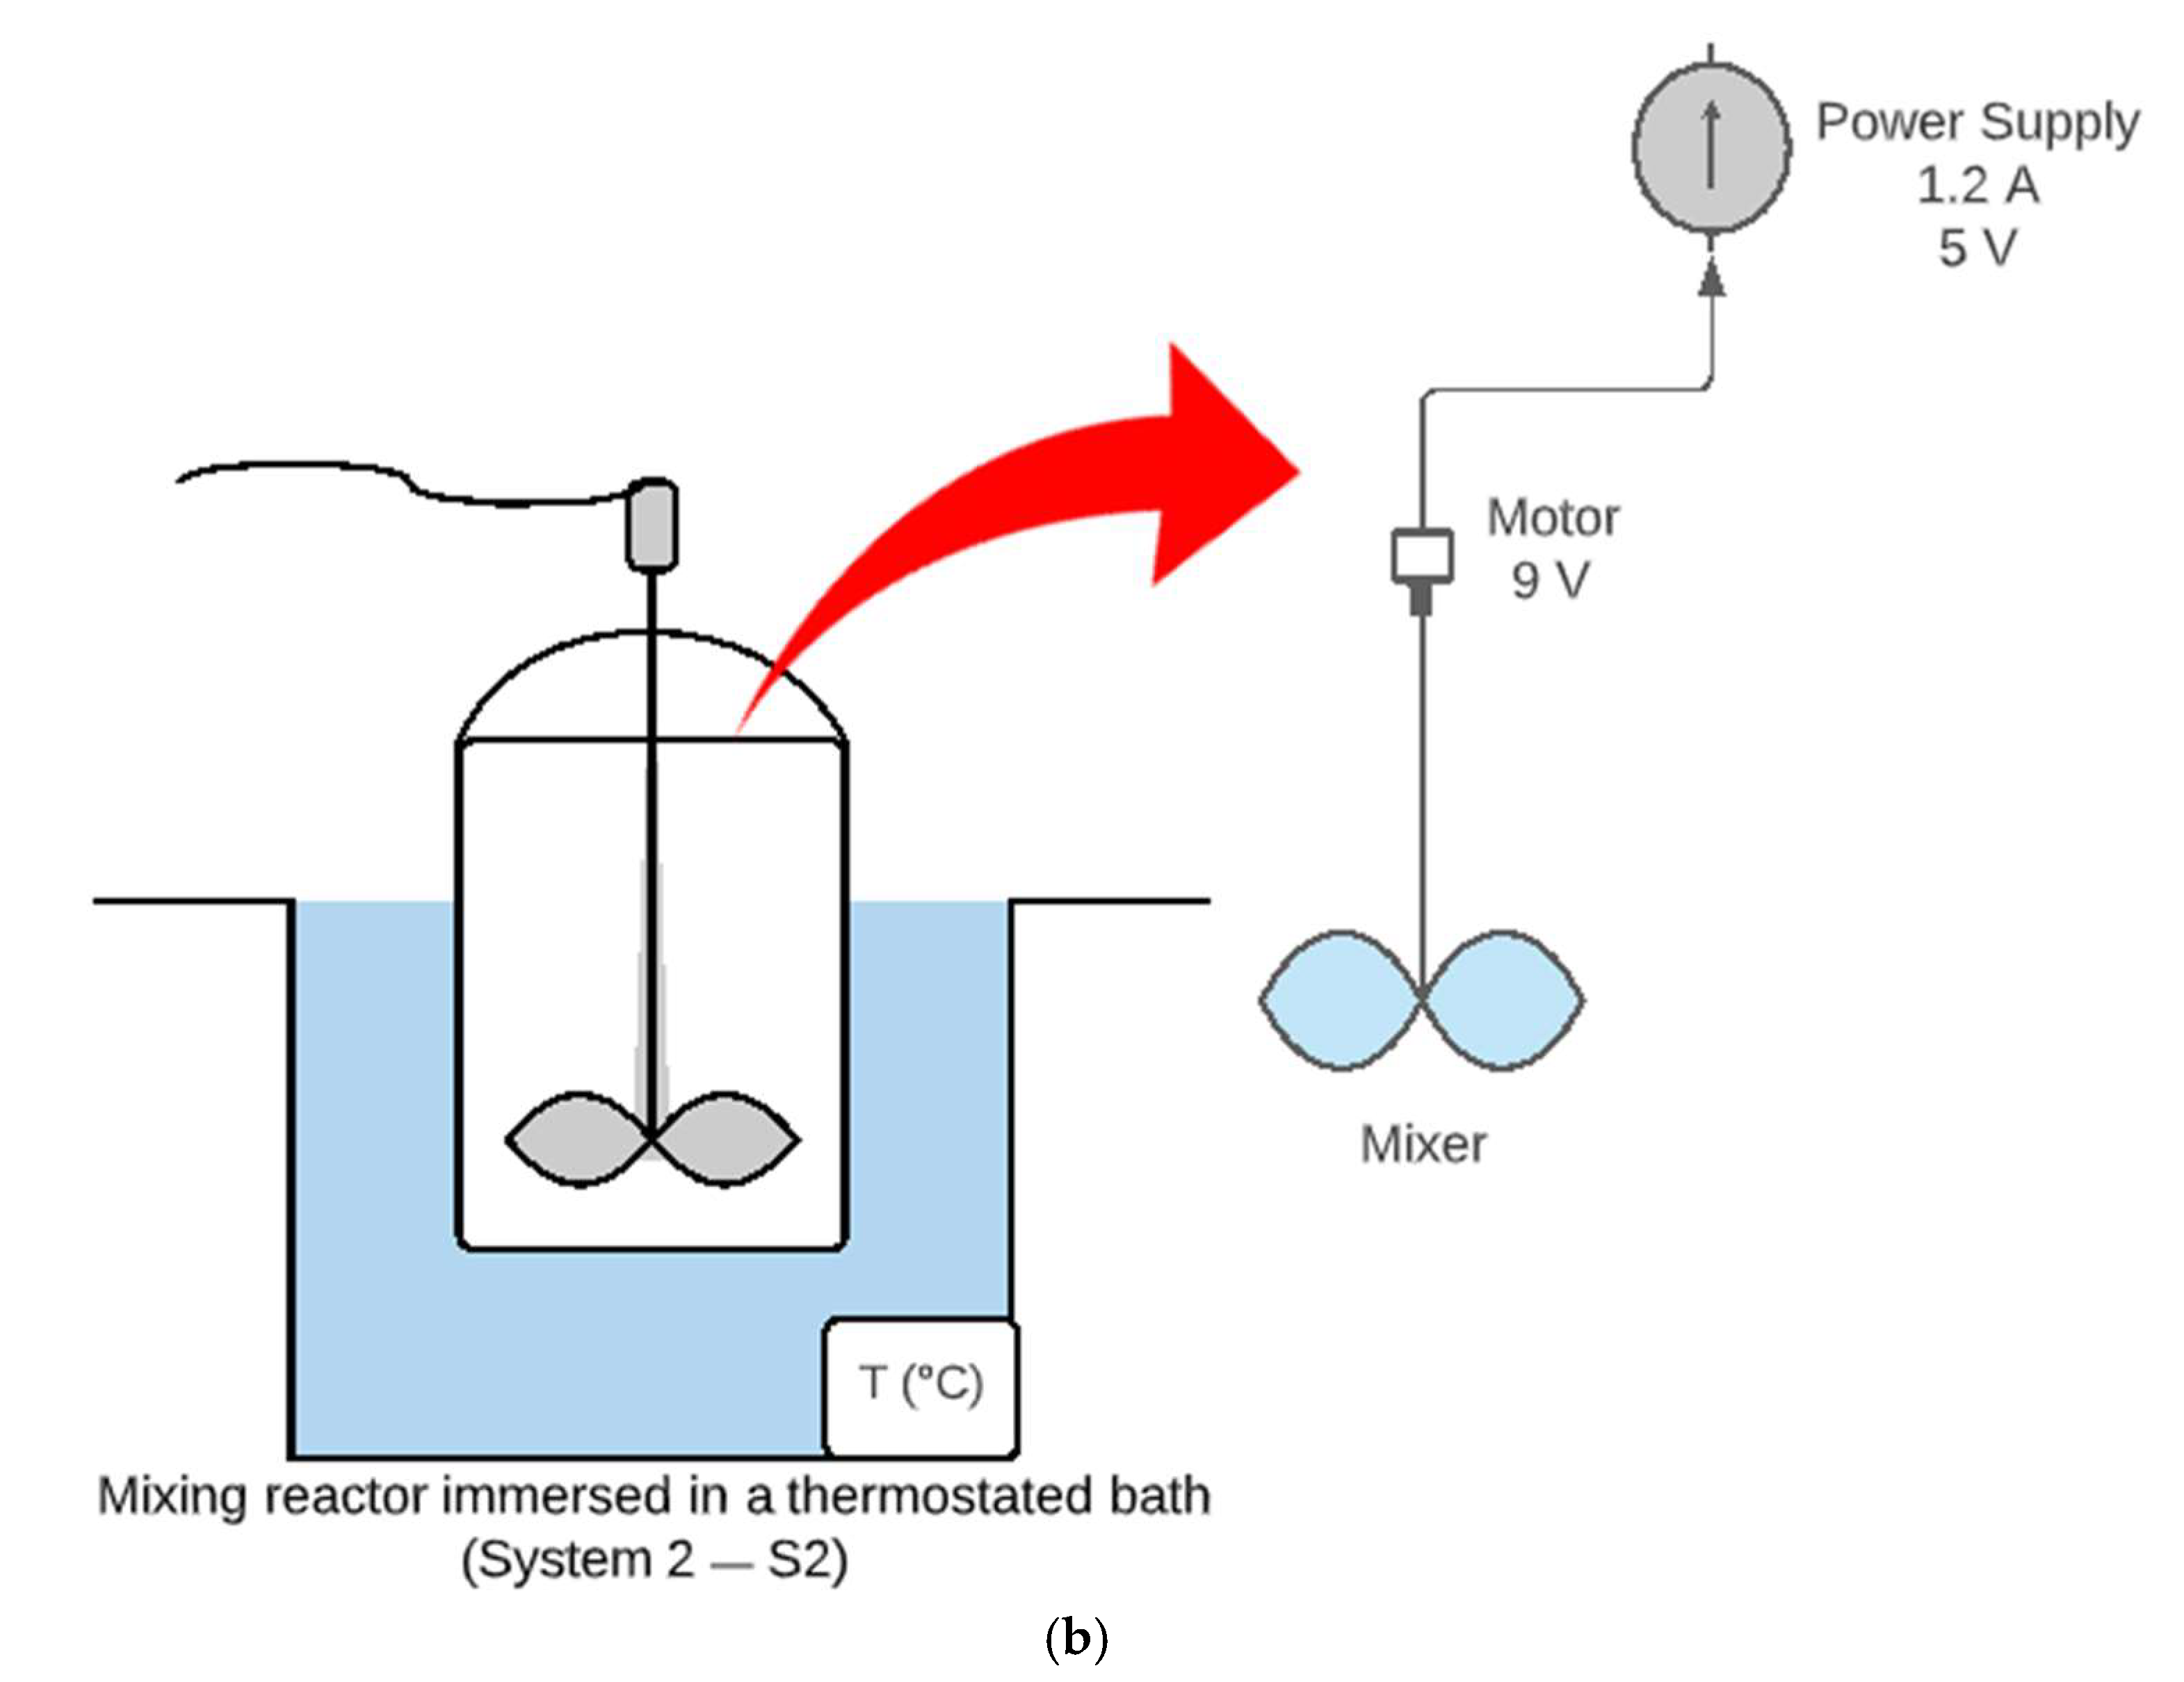
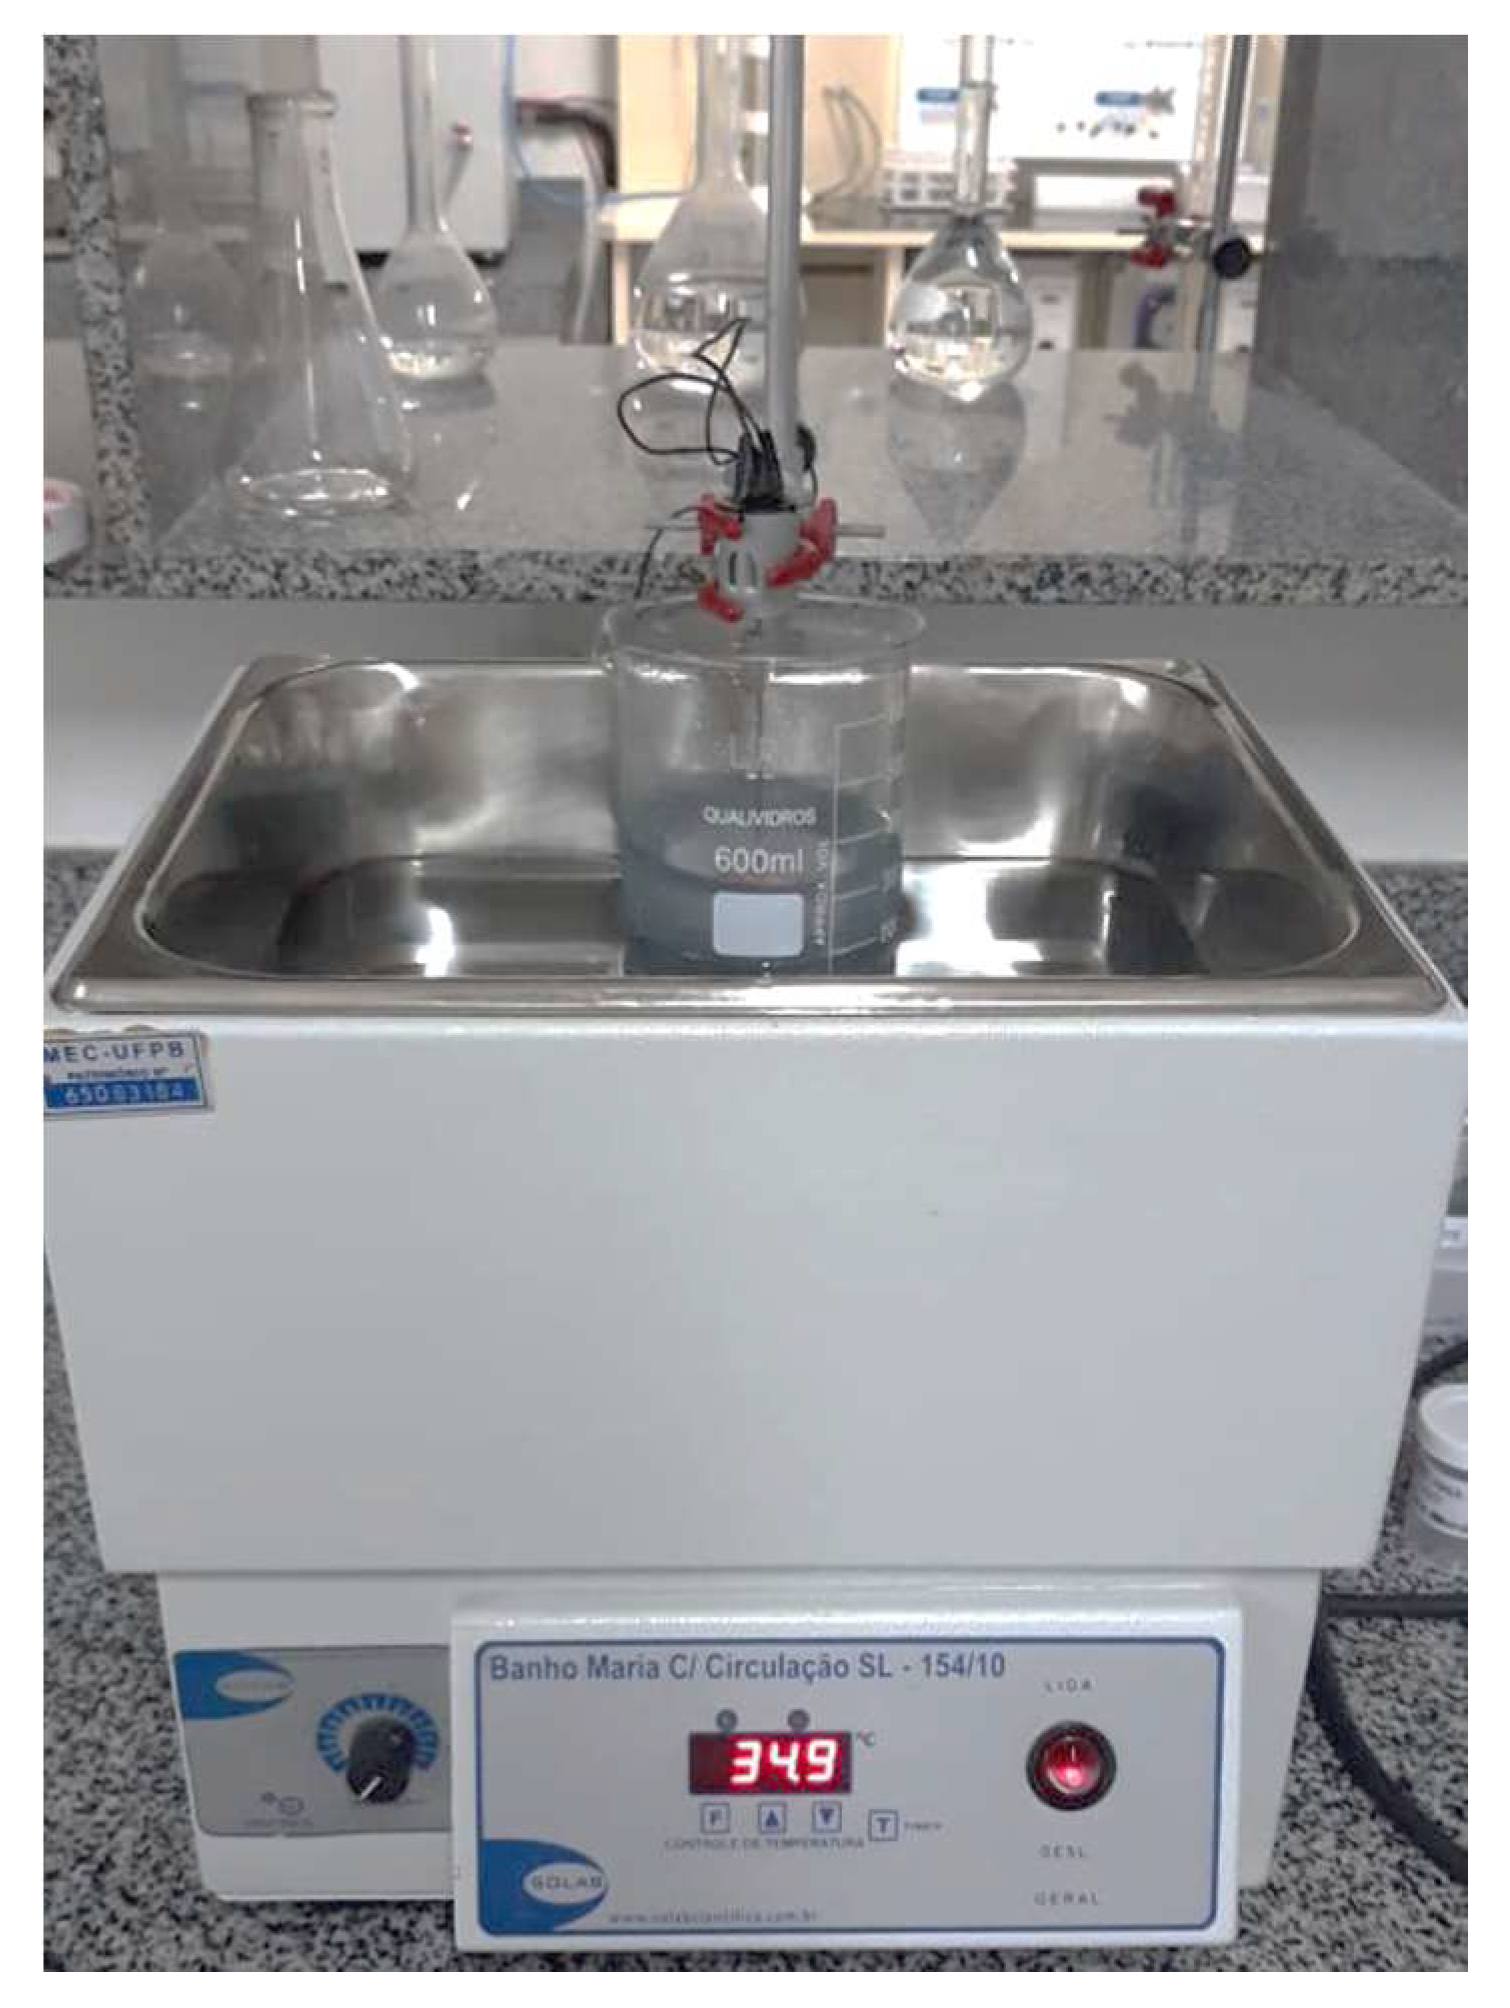
2.3. Description of Systems

Finite bath tests were performed in duplicate. The two systems used were Dubnoff shaker bath—system 1 (S1), and a mixing reactor immersed in a thermostated bath, model SL-154/10, from the Solab brand—system 2 (S2). In Figure 1, it is possible to observe the schematic representation used to develop the experiments.
In Figure 2, there is a demonstration of the operation scheme of the mixing reactor developed for the tests immersed in a thermostatized bath.
System S2 was made to simulate a mixing reactor and guarantee the homogeneity of the system on a larger scale. The agitation works on the basis of direct current motors with a voltage of 9 V. The motors were powered through USB cables and 5 V and 1.2 A. Bronze connectors were used to extend the motor shaft. The extension was produced from semi-flexible wires with a diameter of 1.7 mm composed of a metallic alloy of copper and zinc. The wires were mounted on aluminum pins to ensure shaft stability and provide rotational strength. This technique allowed the forces imposed by the engine, in contrast to the resistance suffered by the liquid of the mixture to which the agitator would be subjected, which did not cause structural damage to the shaft. The impeller was molded from 0.6-mm-thick polyethylene (PE) plates. The shape of the manufactured impeller was of the naval type with 4 equidistant blades, providing low shear, which is compensated by the impeller speed provided by the engine. The total impeller diameter was 8 cm.

2.4. Adsorption Kinetics

The study of adsorption kinetics provides information about the adsorption rate, the adsorbent’s performance, and the mass transfer mechanisms. Knowing the adsorption kinetics is essential for the design of adsorption systems [37].
Experimentally, a fixed amount of solution and adsorbent was used and analyzed at different time intervals. Table 2 shows the experimental conditions for the kinetic assay.
The tests were analyzed at time intervals ranging from 2 to 600 min, and the adsorption capacity was obtained through Equation (1), as follows:
q = V m ( C 0 C f )
where V is the volume of solution used (L), m is the mass of adsorbent (uçá crab) (g), C0 is the initial concentration of the solutions (mg·L−1), and Cf is the final concentration (mg·L−1).
Modeling was performed with the kinetic test results to determine the model that best fits the experimental data. Equation (2) represents the integrated model of the pseudo-first-order (PFO) [38], as follows:
q t = q e ( 1 e k 1 t )
where qe and qt (mg·g−1) are the adsorption capacities of the solute at equilibrium and at time t (min), respectively, and k1 (min−1) is the rate constant of the pseudo-adsorption reaction of the first order.
The pseudo-second-order model was initially applied to lead adsorption studies [39] and started to be used in other adsorption processes [37]. Equation (3) describes the integrated form of the PSO model, as follows:
q t = q e 2 k 2 t ( 1 + q e k 2 t )
where qe and qt (mg·g−1) are the adsorption capacities of the solute at equilibrium and at a time t (min), respectively, k2 (g·mg−1·min−1) is the pseudo adsorption kinetic constant of the second order.

2.5. Adsorption Isotherms

The adsorption isotherm is the equilibrium ratio between the fluid phase concentration and the concentration of the adsorbent particles at a given temperature. For liquids, the concentration is usually expressed in mass units, such as mg·L−1 [40]. Obtaining an adsorption isotherm is a simple process in which a mass of adsorbent is added into a given volume of a series of solutions with different and known initial concentrations. Table 3 contains the parameters used for the adsorption tests at 25 °C in both systems.
The initial concentrations of the synthetic dye solution ranged from 10 to 100 mg·L−1. For the experimental data analysis, Langmuir, Freundlich, and Sips models were used.
The Langmuir model considers that adsorption occurs in a monolayer on a uniform surface and that all adsorption sites are equivalent [41]. Equation (4) describes this model, as follows:
q = q max K L C e 1 + K L C e
where q is the adsorption capacity (mg·g−1), Ce is the equilibrium adsorbate concentration (mg·L−1), qmax is the maximum adsorption capacity (mg·g−1), KL is the Langmuir equilibrium constant (L·mg−1).
Furthermore, Chakravorti and Weber [42] defined the separation factor (RL) as a dimensionless constant. When RL = 0, the adsorption is reversible, 0 < RL < 1 the adsorption is favorable, RL = 1 the adsorption is linear, and RL > 1 the adsorption is unfavorable. Equation (5) shows the formula for obtaining this parameter, as follows:
R L = 1 1 + C 0 K L
The empirical model proposed by Freundlich can be applied to non-ideal systems, formed by heterogeneous surfaces and multilayer adsorption, and is represented in Equation (6), as follows:
q = K F C e 1 / n F
where nF is the heterogeneity constant of the adsorbent surface, Ce is the equilibrium concentration of the adsorbate (mg·L−1), and KF is the Freundlich adsorption capacity constant.
Further, 1/nF is the adsorption intensity or surface heterogeneity, indicating the adsorption sites’ relative energy distribution and heterogeneity. Table 4 shows the physical meaning of this heterogeneity parameter.
The Sips model is considered a hybrid because it combines the Langmuir and Freundlich equations and is a 3-parameter model. At low concentrations, it is effectively reduced to the Freundlich isotherm, not obeying Henry’s law; at high concentrations, the model predicts a monolayer adsorption capacity, characteristic of the Langmuir isotherm [43]. Equation (7) describes this model, as follows:
q = q max K S C e n s 1 + K S C e n s
where q max is the maximum adsorption capacity (mg·g−1), Ce is the equilibrium adsorbate concentration (mg·L−1), and KS and ns are the constants of the Sips isotherm.

3. Results

3.1. Characterization and Analysis of Materials

The particle size analysis was performed, obtaining a majority mass in the mesh of 42, corresponding to 52% of the total mass, as shown in Table 5. Therefore, this was the chosen range for the adsorption tests.
The IR spectrum is shown in Figure 3, and shows characteristic bands, due to axial deformation, in the ranges 3700–3000, 3000–2880, 1630–1400, and 1100–1000 cm−1. The wavelength range from 3700 cm−1 to 3000 cm−1 indicates NH2 and OH groups in the sample structure, since the uçá crab shell is mainly formed by proteins, chitin, and calcium carbonate. Amino groups are capable of making covalent bonds, where the electronegativity of the bonds generates sites of high polarity, making the rearrangement of molecules and water around these sites favorable [44]. In the CH axial strain region, corresponding to the 3000–2880 cm−1 interval, the uçá crab shells spectrum presents characteristic bands at 2922 cm−1. The presence of carbonate ions (CO3)2- can be verified in the range of 2517 cm−1. In the spectrum of chitosan, there are two amide-type adsorption bands at 1654 and 1596 cm−1, corresponding to the symmetric and asymmetric deformation of amide I and II, respectively, which are present in this characterization of the uçá crab shells. The band whose absorption is centered at 1420 cm−1 corresponds to the angular deformation of the glucosamine group [45]. The CO connections are confirmed by the axial deformation existing in the range of 1100–1000 cm−1. The polysaccharide bands, which are typical of chitosan, can be observed in the region between 890 and 1150 cm−1. The carbonyl amide group gives rise to strong absorption in the region of 1700–1600 cm−1, which also appear in the chitin spectrum, which is indicative of the partial deacetylation of chitin’s acetamido groups. The deacetylation of chitin in crab shells, to produce chitosan, was possible, and was confirmed by the absence of characteristic bands in this range [21,26,46].
Table 6 shows the results for the EDX analysis, which allows the identification of chemical elements that are present in various types of samples, and determines their concentrations with great precision. Chitin is present in the skin or shell of arthropods, as a composite with proteins, lipids, and calcium carbonate. On a dry basis, the shells of crustaceans contain 15–20% chitin, 25–40% proteins, and 40–55% calcium carbonate [29]. It can be observed that, for the most part, the shells of the uçá crab present calcium oxide in their composition, possibly coming from CaCO3, which forms the exoskeleton of many arthropods. The calcination process decreases the carbon content and increases the oxide content (CaCO3 → CaO + CO2) [47].
Analysis by scanning electron microscopy (SEM) allows information about the morphology to be obtained, by observing and analyzing the microstructural characteristics of solid surfaces. In arthropods, the exoskeleton consists of the following two layers: the procuticle, known as flexible chitin, which is the inner part, composed of proteins and chitin, where there is a disposition of amorphous calcite, and calcium carbonate, arranged in parallel lamellae and the epicuticle, also called rigid chitin, which is an outer layer that is formed by a complex of proteins and lipids, providing protection and waterproofing to the procuticle [48,49,50]. Through the SEM images in Figure 4, it was possible to observe successive parallel fibrous layers and channels (pores) crossing these lamellae, which can favor the diffusion of the dye into the adsorbent.
Figure 5 graphically represents the results that were obtained, to determine the zero-charge point of the material under study, which is the uçá crab biosorbent. When the pH of the solution is lower than the pH of PCZ of the solid material, its surface will be positively charged. In comparison, if the pH of the solution is higher than the pH of PCZ of the solid material, its surface will be negatively charged. It is possible to infer that this point occurs around pH = 8. In its structure, the reactive dye molecule has, in addition to the chromophore group, a sulfonate group, which is responsible for the solubility and anionic character, and a reactive group that chemically reacts [30,51]. The interaction between the dye’s anionic group and the adsorbent’s surface’s cationic group is part of the adsorptive process. In an acidic medium, the surface of the material presents positive charges, due to the protonation of the amino groups (NH3+); a substrate with a high density of negative sites immersed in this solution will behave as an adequate support for attraction [29]. Thus, pH = 5 was chosen for the adsorption study, because, since it is a value that is lower than that found for the zero-charge point, it favors the adsorption of the anionic dye, reactive blue 222, on the positively charged adsorbent surface.
Brunauer–Emmett–Teller (BET) method was employed to assess the textural properties by the N2 adsorption–desorption isotherm. Figure 6 shows the N2 adsorption–desorption isotherms for the uçá crab shells.
The BET plots were tracible to type V isotherms, since they showed a hysteresis cycle between the adsorption and desorption processes. Therefore, at the same partial pressure, during the desorption, more nitrogen was desorbed than gas adsorbed in the adsorption process. In the low P/P0 range, the type V isotherm shape is very similar to that of type III, and this can be attributed to relatively weak adsorbent–adsorbate interactions. At higher P/P0, molecular clustering is followed by pore filling. Type V isotherms are observed for adsorption on microporous and mesoporous adsorbents. The average pore size found by this characterization was 29,765 nm, which was classified as a mesoporous [36]. The BET isotherms made it possible to determine the BET surface area. The surface area of BET found was 11,048 m2·g−1.
The spectrophotometric method studies the interaction of light with matter. It is based on the quantitative measurement of light absorption by the solutions, in which the solution concentration is proportional to the amount of light absorbed. This relationship is expressed through the calibration curve. The graphs in Figure 7 were obtained for each system individually, by plotting the experimental data of absorbance versus concentration.

3.2. Adsorption Kinetics

Kinetic curves allow the modeling of experimental data to determine adsorption rate factors, and thus assist in evaluating the mechanisms or limiting stages of adsorption [52]. Figure 8 shows that the adsorption capacity increased over time, until it reached an equilibrium state. At this point, the amount of dye adsorbed inside the crab was in dynamic equilibrium with the amount of dye desorbed. The time required to reach this point is called the equilibrium time, and the amount of dye removed by the biosorbent at that moment indicates the maximum adsorption capacity. Kinetic data were fitted to the models from the Solver tool in the Excel software.
For system S1, the time of 400 min corresponds to the equilibrium adsorption capacity point of 3.623 mg·g−1. In this time, the dye removal percentage reaches 75%. As for the S2 system, the time required to obtain the equilibrium adsorption capacity of 4.191 mg·g−1 occurred in 360 min. For that time, approximately 84% of the dye has been removed from the aqueous solution. The difference in time and adsorption capacity observed between the two processes may be explained by the better homogeneity of the S2 system. The stirrer that was immersed in the solution promoted more effective contact between the adsorbent and its various points, increasing the probability of the dye molecules binding to the active sites of the adsorbent materials. A more effective agitation allows the process of mass transfer to be facilitated, since there is a decrease in the boundary layer [53].
Figure 8 shows the kinetic curves for pseudo-first-order, pseudo-second-order models, and experimental data for both systems. The analysis of the experimental curve allows us to say that there was no significant difference in the adsorption capacity after 300 min. The adsorption tests for the study of isotherms were carried out in this period to minimize the operating time.
The coefficient of determination (R2) measures the agreement between the observed and predicted values, and may be conclusive for the adequacy of the experimental values to the model. According to Table 7, the pseudo-second-order model best described the two systems under study, with the best results for the coefficient of determination.
The PSO model could represent the following three conditions [52]: low initial concentration values [54], the final stage of the adsorption process, and the abundance of active sites in the adsorbent material. The concentration that was used for the adsorption tests in this work (100 mg·L−1) can be considered low compared to those used in other studies [37]. It can also be observed, by analyzing the experimental curves and models in Figure 8, that in the initial time intervals, both systems present data that better fit the PFO model. In contrast, in the final adsorption intervals, both systems (S1 and S2) fit the curve of the PSO model better. The fraction of active adsorbent sites that are occupied increases with time. A similar result was obtained in dye adsorption on chitosan-based polymer [20].

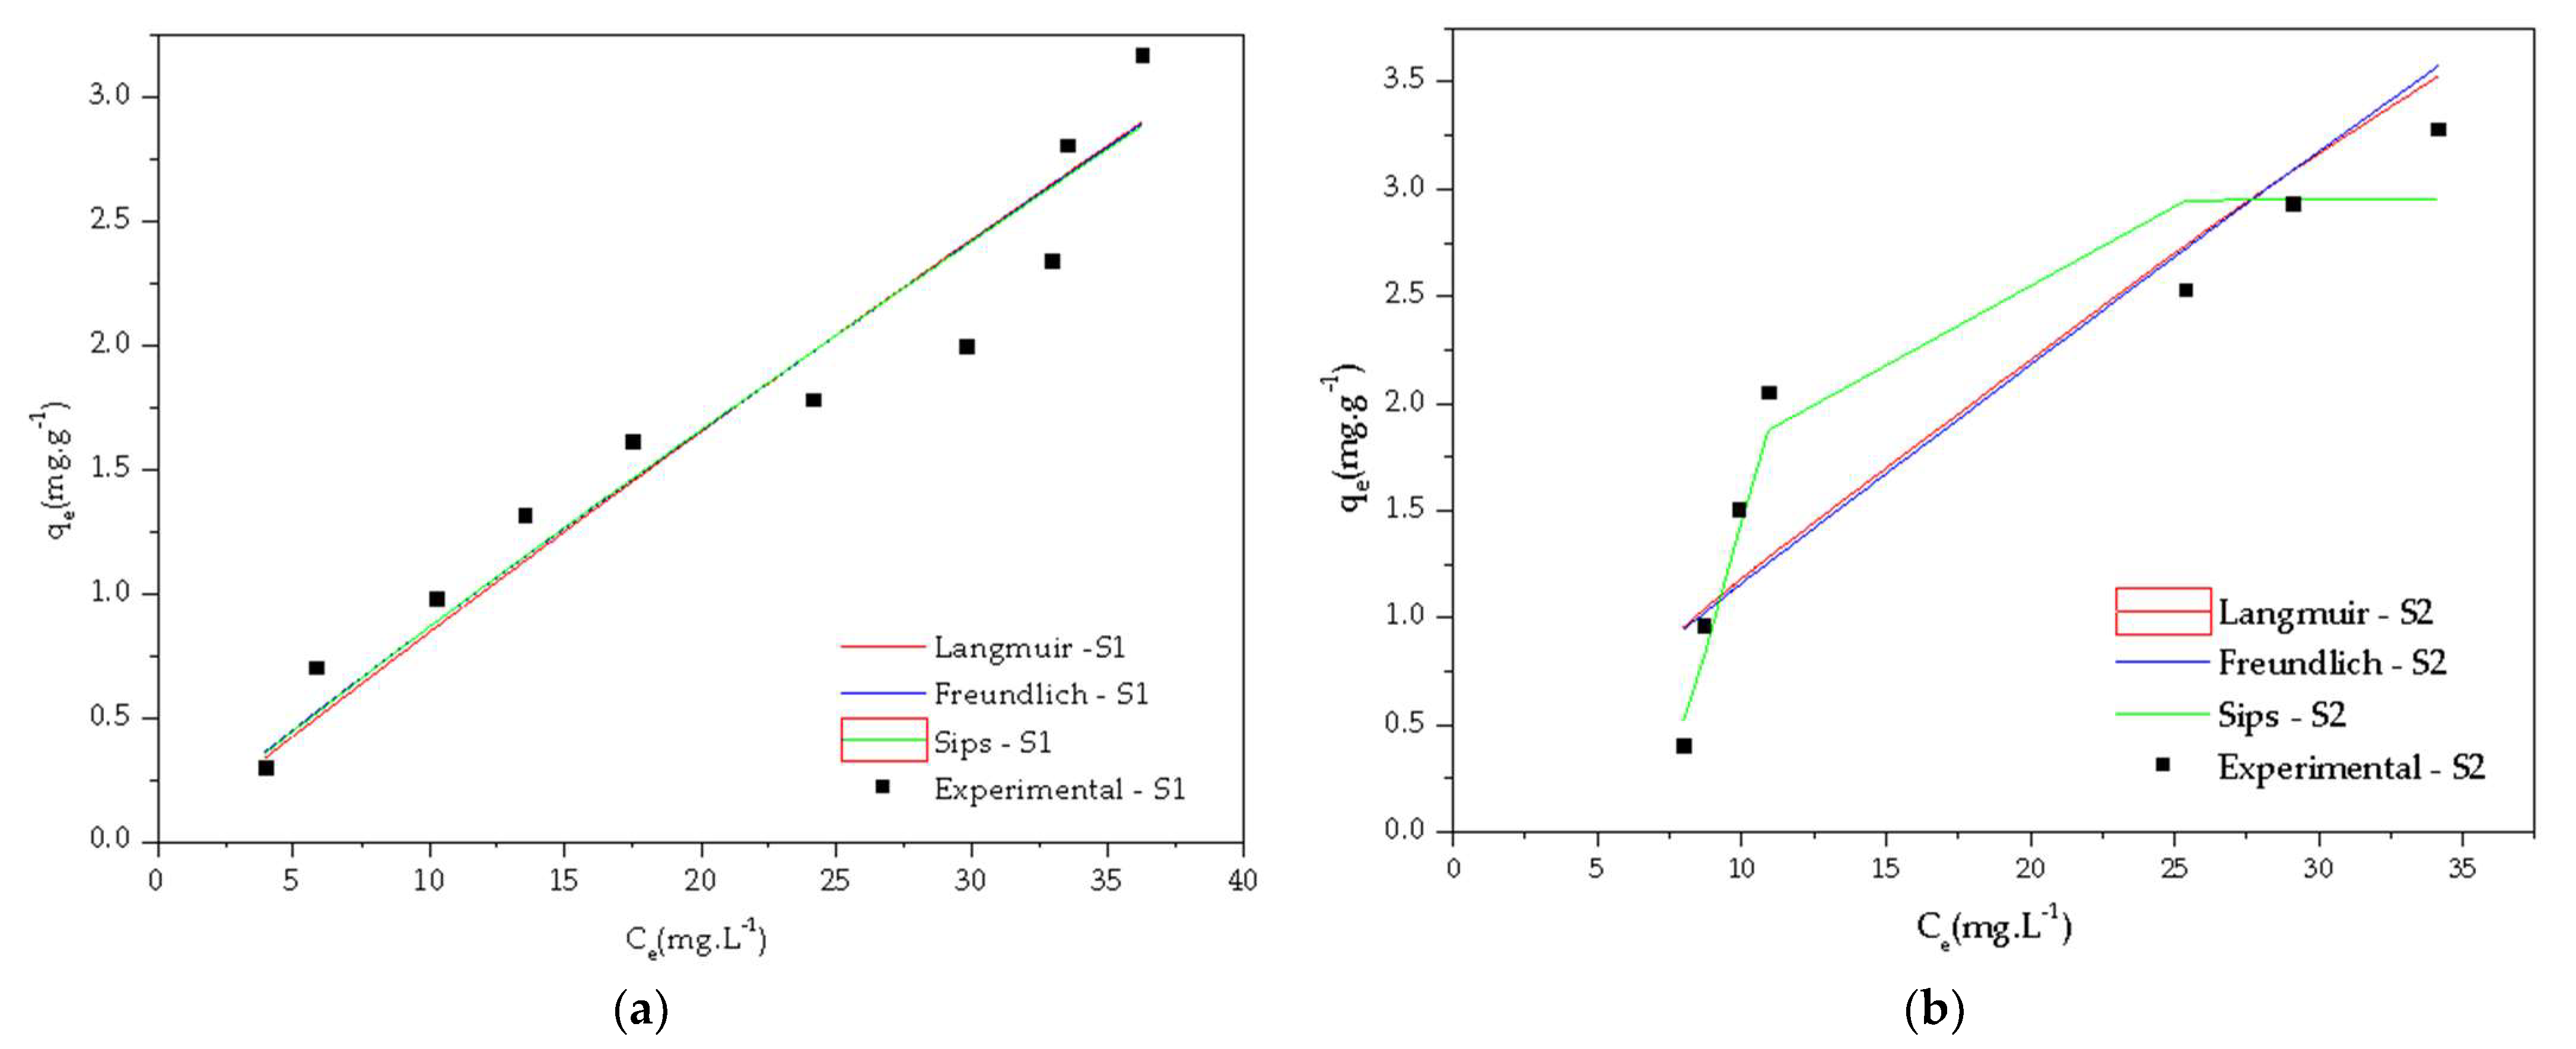
3.3. Adsorption Isotherms

The adsorption isotherm is an indication of the presence of adsorbate in the liquid and the solid (adsorbent) phases at a certain temperature. Investigating the adsorption isotherms will allow us to understand the type of adsorption, whether it is monolayer adsorption (Langmuir) or multilayer adsorption (Freundlich). The tangent of the angle, relative to the y-axis, of any portion of these curves, represents the increment of concentration of solute in the external phase, which is necessary to maintain a constant increment of concentration, at equilibrium, in the substrate. The complement of this angle, i.e., the slope of the isotherm at any point, may thus be regarded as a measure of the ease with which bombarding solute molecules can find vacant sites in the surface. The isotherms shown in Figure 9 were classified as L-type, which corresponds to the Langmuir isotherm. This type of isotherm is characterized by a decreasing slope, with the increase in concentration, as the vacant sites of the adsorbent decrease as it becomes covered by the adsorbate. This adsorption behavior could also be explained by the high affinity of the adsorbent at low concentrations, which decreases further as the concentration increases.
Table 8 shows the constants and values of R2 obtained by the non-linear analysis of the models. Values close to R2 for S1 do not allow a model that best fits the experimental data to be stated. In S2, the Sips model better describes the data.
In Table 9, the values of 1/nF between zero and one, obtained for both systems, characterize the adsorption of the system as being favorable, and the RL values obtained to corroborate the favorable adsorption of the reactive dye on the uçá crab shell (Ucides cordatus).

4. Conclusions

Through the results of this study, it was possible to see that the 12 times scale-up of the S1 system concerning the S2 system, as well as the use of a more effective stirring sys-tem, made it possible to replicate the results that were obtained on a smaller scale, and characterize the adsorption of reactive blue 222 dye in uçá crab shell (Ucides cordatus) as favorable. The results of the physical adsorption characterizations of N2 and SEM point out the porosity of the adsorbent, allowing the classification of the pore as mesoporous. The presence of the characteristic functional groups of chitosan in the FTIR spectrum demonstrates a possible interaction between the amino groups present on the shell surfaces and the anionic groups of the reactive dye molecule. The zero-charge point study allowed the identification of the pH range that favors the adsorption of the reactive dye on the surface of crab shells, by the interaction between the anionic group of the dye and the cationic group of the biosorbent. An average time of 400 min was enough to guarantee the adsorption equilibrium, with an adsorption capacity of 3.623 mg·g−1 for the S1 system and 4.191 mg·g−1 for the S2 system. The studies of the kinetic models showed better adequacy to the pseudo-second-order (PSO). The isotherm data that were obtained experimentally could confirm an L-type isotherm, but it was not possible to adapt them to a single isotherm model that was capable of describing these data.

Author Contributions

Writing—original draft presentation and results discussion, M.E.A.P., K.S.M.G.d.S., G.Z.C., A.L.d.O.F.; data curation and experimental analyses, M.E.A.P., M.C.d.S.S.; mixing reactor development, J.C.d.Q.N. All authors have read and agreed to the published version of the manuscript.

Funding

This research received no external funding.

Data Availability Statement

Not applicable.

Conflicts of Interest

The authors declare no conflict of interest.

References

  1. Queiroz, M.T.A.; Queiroz, C.A.; Alvim, L.B.; Sabará, M.G.; Leão, M.M.D.; de Amorim, C.C. Restructuring in the flow of textile wastewater treatment and its relationship with water quality in Doce River, MG, Brazil. Gest. Prod. 2019, 26. [Google Scholar] [CrossRef]
  2. Kajjumba, G.W.; Emik, S.; Öngen, A.; Kurtulus Özcan, H.; Aydın, S. Modelling of Adsorption Kinetic Processes—Errors, Theory and Application. In Advanced Sorption Process Applications; IntechOpen: London, UK, 2019. [Google Scholar]
  3. Freire, L.F.A.; Formiga, W.J.F.; Lagden, M.G.; De, A.S. Avaliação da Adsorção de Efluente Têxtil por Compósitos de Quitosana Artigos Convidados. Rev. Process. Químicos 2018, 12, 9–17. [Google Scholar] [CrossRef] [Green Version]
  4. Kunz, A.; Peralta-Zamora, P.; De Moraes, S.G.; Durán, N. Novas tendências no tratamento de efluentes têxteis. Quim. Nova 2002, 25, 78–82. [Google Scholar] [CrossRef]
  5. Vitali, V.M.V.; Ballaminut, N.; Matheus, D.R. Decolorization of CI Reactive Blue 222 by immobilized basidiomycetes in response to different carbon and nitrogen inputs. Hoehnea 2018, 45, 352–360. [Google Scholar] [CrossRef]
  6. Alam, M.Z.; Khan, M.J.H.; Kabbashi, N.A.; Sayem, S.M.A. Development of an Effective Biosorbent by Fungal Immobilization Technique for Removal of Dyes. Waste Biomass Valorization 2018, 9, 681–690. [Google Scholar] [CrossRef]
  7. Alardhi, S.M.; Albayati, T.M.; Alrubaye, J.M. A hybrid adsorption membrane process for removal of dye from synthetic and actual wastewater. Chem. Eng. Process. Process Intensif. 2020, 157, 108113. [Google Scholar] [CrossRef]
  8. Kadhim, R.J.; Al-Ani, F.H.; Al-Shaeli, M.; Alsalhy, Q.F.; Figoli, A. Removal of dyes using graphene oxide (Go) mixed matrix membranes. Membranes 2020, 10, 366. [Google Scholar] [CrossRef]
  9. Mukimin, A.; Vistanty, H.; Zen, N. Oxidation of textile wastewater using cylinder Ti/β-PbO2 electrode in electrocatalytic tube reactor. Chem. Eng. J. 2015, 259, 430–437. [Google Scholar] [CrossRef]
  10. Cotillas, S.; Llanos, J.; Cañizares, P.; Clematis, D.; Cerisola, G.; Rodrigo, M.A.; Panizza, M. Removal of Procion Red MX-5B dye from wastewater by conductive-diamond electrochemical oxidation. Electrochim. Acta 2018, 263, 1–7. [Google Scholar] [CrossRef] [Green Version]
  11. Shokoohi, R.; Torkshavand, Z.; Mahmoudi, M.M.; Behgoo, A.M.; Ghaedrahmati, E.; Hosseini, F.M. Effective Removal of Azo Dye Reactive Blue 222 from Aqueous Solutions Using Modified Magnetic Nanoparticles with Sodium Alginate/Hydrogen Peroxide. Environ. Prog. Sustain. Energy 2019, 38, S205–S213. [Google Scholar] [CrossRef]
  12. Ruthven, D.M. Principles of Adsorption and Adsorption Processes; John Wiley: Hoboken, NJ, USA, 1984; ISBN 978-0-471-86606-0. [Google Scholar]
  13. Sulyman, M.; Al-Marog, S.; Al-Azabi, K. Greener Cleaner: Liquid-Phase Adsorption of Dye Using Macroalgae Based Biosorbent Materials. Acta Sci. Agric. 2019, 3, 30–38. [Google Scholar] [CrossRef]
  14. Chin, J.Y.; Chng, L.M.; Leong, S.S.; Yeap, S.P.; Yasin, N.H.M.; Toh, P.Y. Removal of Synthetic Dye by Chlorella vulgaris Microalgae as Natural Adsorbent. Arab. J. Sci. Eng. 2020, 45, 7385–7395. [Google Scholar] [CrossRef]
  15. Kumar, S.; Ahluwalia, A.S.; Charaya, M.U. Adsorption of Orange-G dye by the dried powdered biomass of Chlorella vulgaris Beijerinck. Curr. Sci. 2019, 116, 604–611. [Google Scholar] [CrossRef]
  16. Wei, H.; Sun, J.; Zhang, B.; Liu, R. Comparative study of cationic dye adsorption using industrial latex sludge with sulfonate and pyrolysis treatment. Sustainability 2020, 12, 10048. [Google Scholar] [CrossRef]
  17. Sari, I.P.; Simarani, K. Decolorization of selected azo dye by Lysinibacillus fusiformis W1B6: Biodegradation optimization, isotherm, and kinetic study biosorption mechanism. Adsorpt. Sci. Technol. 2019, 37, 492–508. [Google Scholar] [CrossRef] [Green Version]
  18. Roy, U.; Sengupta, S.; Das, P.; Bhowal, A.; Datta, S. Integral approach of sorption coupled with biodegradation for treatment of azo dye using Pseudomonas sp.: Batch, toxicity, and artificial neural network. 3 Biotech 2018, 8, 192. [Google Scholar] [CrossRef]
  19. Vithanage, A.H.; Madhushanka, A.K.D.N.; Ariyadasa, T.; Gunavardena, S.H.P. Textile Dye Removal in Wastewater Using Chitosan. Annu. Sess. IESL 2015, 283–289. [Google Scholar]
  20. Murcia-Salvador, A.; Pellicer, J.A.; Fortea, M.I.; Gómez-López, V.M.; Rodríguez-López, M.I.; Núñez-Delicado, E.; Gabaldón, J.A. Adsorption of Direct Blue 78 using chitosan and cyclodextrins as adsorbents. Polymers 2019, 11, 1003. [Google Scholar] [CrossRef] [Green Version]
  21. do Vale, D.A.; Vieira, C.B.; Vidal, M.F.; Claudino, R.L.; Andrade, F.K.; Sousa, J.R.; Souza Filho, M.D.S.M.; da Silva, A.L.C.; de Souza, B.W.S. Chitosan-Based Edible Films Produced from Crab-Uçá (Ucides cordatus) Waste: Physicochemical, Mechanical and Antimicrobial Properties. J. Polym. Environ. 2021, 29, 694–706. [Google Scholar] [CrossRef]
  22. Francis, A.O.; Zaini, M.A.A.; Muhammad, I.M.; Abdulsalam, S.; El-Nafaty, U.A. Adsorption dynamics of dye onto crab shell chitosan/neem leaf composite. Water Pract. Technol. 2020, 15, 673–682. [Google Scholar] [CrossRef]
  23. Rao, T.M.; Rao, V.V.B. Biosorption of congo red from aqueous solution by crab shell residue: A comprehensive study. Springerplus 2016, 5, 537. [Google Scholar] [CrossRef] [Green Version]
  24. Vijayaraghavan, K.; Palanivelu, K.; Velan, M. Crab shell-based biosorption technology for the treatment of nickel-bearing electroplating industrial effluents. J. Hazard. Mater. 2005, 119, 251–254. [Google Scholar] [CrossRef]
  25. Wu, F.C.; Tseng, R.L.; Juang, R.S. Enhanced abilities of highly swollen chitosan beads for color removal and tyrosinase immobilization. J. Hazard. Mater. 2001, 81, 167–177. [Google Scholar] [CrossRef]
  26. Porpino, K.K.P.; Barreto, M.d.C.S.; Cambuim, K.B.; Carvalho Filho, J.R.; Toscano, I.A.S. Fe (II) Adsorption on Ucides cordatus crab shells. Quim. Nova 2011, 34, 928–932. [Google Scholar] [CrossRef] [Green Version]
  27. Chong, K.Y.; Chia, C.H.; Zakaria, S.; Sajab, M.S. Vaterite calcium carbonate for the adsorption of Congo red from aqueous solutions. J. Environ. Chem. Eng. 2014, 2, 2156–2161. [Google Scholar] [CrossRef]
  28. Zhao, M.; Chen, Z.; Mei, X.; Chen, Z.; Lv, X.; Zhou, K. Preparation of core—Shell structured CaCO 3 microspheres as rapid and recyclable adsorbent for anionic dyes. R. Soc. Open Sci. 2017, 4, 170697. [Google Scholar] [CrossRef] [PubMed] [Green Version]
  29. Mathur, N.K.; Narang, C.K. Chitin and chitosan, versatile polysaccharides from marine animals. J. Chem. Educ. 1990, 67, 938–942. [Google Scholar] [CrossRef]
  30. Chattopadhyay, D.P. Chemistry of Dyeing; Woodhead Publishing Limited: Cambridge, UK, 2011; Volume 1, ISBN 9780857093974. [Google Scholar]
  31. Ewing, G.W. Métodos Instrumentais de Análise Química; BLUCHER: São Paulo, Brazil, 1972; Volume 2, ISBN 9788521201250. [Google Scholar]
  32. Mahmood, T.; Saddique, M.T.; Naeem, A.; Westerhoff, P.; Mustafa, S.; Alum, A. Comparison of different methods for the point of zero charge determination of NiO. Ind. Eng. Chem. Res. 2011, 50, 10017–10023. [Google Scholar] [CrossRef]
  33. Órfão, J.J.M.; Silva, A.I.M.; Pereira, J.C.V.; Barata, S.A.; Fonseca, I.M.; Faria, P.C.C.; Pereira, M.F.R. Adsorption of a reactive dye on chemically modified activated carbons—Influence of pH. J. Colloid Interface Sci. 2006, 296, 480–489. [Google Scholar] [CrossRef]
  34. Giacomni, F.; Menegazzo, M.A.B.; da Silva, M.G.; da Silva, A.B.; de Barros, M.A.S.D. Importância da determinação do ponto de carga zero como característica de tingimento de fibras proteicas. Rev. Mater. 2017, 22. [Google Scholar] [CrossRef] [Green Version]
  35. Pouretedal, H.R.; Sadegh, N. Effective removal of Amoxicillin, Cephalexin, Tetracycline and Penicillin G from aqueous solutions using activated carbon nanoparticles prepared from vine wood. J. Water Process Eng. 2014, 1, 64–73. [Google Scholar] [CrossRef]
  36. Thommes, M.; Kaneko, K.; Neimark, A.V.; Olivier, J.P.; Rodriguez-Reinoso, F.; Rouquerol, J.; Sing, K.S.W. Physisorption of gases, with special reference to the evaluation of surface area and pore size distribution (IUPAC Technical Report). Pure Appl. Chem. 2015, 87, 1051–1069. [Google Scholar] [CrossRef] [Green Version]
  37. Wang, J.; Guo, X. Adsorption kinetic models: Physical meanings, applications, and solving methods. J. Hazard. Mater. 2020, 390, 122156. [Google Scholar] [CrossRef] [PubMed]
  38. Lagergren, S. About the theory of so-called adsorption of soluble substances. Sven. Vetensk. Handingarl 1898, 24, 1–39. [Google Scholar]
  39. Ho, Y.S.; Wase, D.A.J.; Forster, C.F. Removal of lead ions from aqueous solution using sphagnum moss peat as absorbent. Water SA 1996, 22, 219–224. [Google Scholar]
  40. McCabe, W.L.; Smith, J.C.; Harriott, P. Unit Operations of Chemical Engineering; McGraw Hill: New York, NY, USA, 2001. [Google Scholar]
  41. Armbruster, M.H.; Austin, J.B. The Adsorption of Gases on Plane Surfaces of Mica. J. Am. Chem. Soc. 1938, 60, 467–475. [Google Scholar] [CrossRef]
  42. Chakravorti, R.K.; Weber, T.W. Pore and Solid Diffusion Models for fixed-bed adsorbers. AIChE J. 1974, 20, 228–238. [Google Scholar]
  43. Sips, R. On the structure of a catalyst surface. J. Chem. Phys. 1948, 16, 490–495. [Google Scholar] [CrossRef]
  44. Assis, O.B.G.; da Silva, V.L. Caracterização estrutural e da capacidade de absorção de água em filmes finos de quitosana processados em diversas concentrações. Polímeros 2003, 13, 223–228. [Google Scholar] [CrossRef] [Green Version]
  45. Abreu, F.O.M.; Cavalcante, L.G.; Doudement, P.V.; Castro, A.M.; Nascimento, A.P.; Matos, J.E.X. Development of new method to obtain chitosan from the exoskeleton of Crabs using microwave radiation|Propriedades e Características da Quitosana Obtida a Partir do Exoesqueleto de Caranguejo-Uçá Utilizando Radiação de Microondas. Polimeros 2013, 23, 630–635. [Google Scholar] [CrossRef]
  46. Bhattacharjee, B.N.; Mishra, V.K.; Rai, S.B.; Parkash, O.; Kumar, D. Structure of Apatite Nanoparticles Derived from Marine Animal (Crab) Shells: An Environment-Friendly and Cost-Effective Novel Approach to Recycle Seafood Waste. ACS Omega 2019, 4, 12753–12758. [Google Scholar] [CrossRef]
  47. Haryati, E.; Dahlan, K.; Togibasa, O.; Dahlan, K. Protein and Minerals Analyses of Mangrove Crab Shells (Scylla serrata) from Merauke as a Foundation on Bio-ceramic Components. J. Phys. Conf. Ser. 2019, 1204, 012031. [Google Scholar] [CrossRef]
  48. Roer, R.; Dillaman, R. The Structure and Calcification of the Crustacean Cuticle. Am. Zool. 1984, 24, 893–909. [Google Scholar] [CrossRef]
  49. Dillaman, R.; Hequembourg, S.; Gay, M. Early pattern of calcification in the dorsal carapace of the blue crab, Callinectes sapidus. J. Morphol. 2005, 263, 356–374. [Google Scholar] [CrossRef]
  50. Chen, P.Y.; Lin, A.Y.M.; McKittrick, J.; Meyers, M.A. Structure and mechanical properties of crab exoskeletons. Acta Biomater. 2008, 4, 587–596. [Google Scholar] [CrossRef] [PubMed]
  51. Guaratini, C.C.I.; Zanoni, M.V.B. Revisão: Corantes têxteis. Quim. Nova 2000, 23, 71–78. [Google Scholar] [CrossRef]
  52. Guo, X.; Wang, J. A general kinetic model for adsorption: Theoretical analysis and modeling. J. Mol. Liq. 2019, 288, 111100. [Google Scholar] [CrossRef]
  53. McKay, G.; Otterburn, M.S.; Sweeney, A.G. The removal of colour from effluent using various adsorbents-III. Silica: Rate processes. Water Res. 1980, 14, 15–20. [Google Scholar] [CrossRef]
  54. Azizian, S. Kinetic models of sorption: A theoretical analysis. J. Colloid Interface Sci. 2004, 276, 47–52. [Google Scholar] [CrossRef] [PubMed]
Figure 1. Experimental scheme of (a) system 1—(S1) (b) system 2—(S2).
Energies 14 05876 g001aEnergies 14 05876 g001b
Figure 2. System 2 (S2) in operation.
Energies 14 05876 g002
Figure 3. FTIR spectrum of the uçá crab shells (Ucides cordatus).
Energies 14 05876 g003
Figure 4. SEM images for uçá crab shell (Ucides cordatus) enlarged (a) 1 KX; (b) 5 KX; and (c) 10 KX.
Energies 14 05876 g004
Figure 5. Zero-charge point for uçá crab shell (Ucides cordatus).
Energies 14 05876 g005
Figure 6. N2 adsorption–desorption isotherms for the uçá crab shells (Ucides cordatus).
Energies 14 05876 g006
Figure 7. Blue reactive 222 dye solution calibration curves for (a) system 1—S1; (b) system 2—S2.
Energies 14 05876 g007
Figure 8. Experimental and model-calculated data for the adsorption kinetics of blue reactive 222 dye for (a) system 1—S1; (b) system 2—S2.
Energies 14 05876 g008
Figure 9. Experimental and model-calculated data for the adsorption isotherms of blue reactive 222 dye for (a) system 1—S1 and (b) system 2—S2.
Energies 14 05876 g009
Table 1. Properties and chemical structure of reactive blue 222.
Chemical Structure Energies 14 05876 i001
Chemical FormulaC37H24N10Na6O22S7
Molecular Weight (g/mol)1,323,006
CAS Number93051-44-6
Maximum Wavelength (nm)614
Table 2. Experimental conditions of the kinetic assay.
Experimental ConditionsDubnoff Shaker Bath
(System 1—S1)
Mixing Reactor
(System 2—S2)
Volume of solution (mL)25300
Adsorbent material mass (g)0.56
Mesh4242
pH55
Concentration (mg·L−1)100100
Table 3. Experimental conditions of adsorption isotherm tests.
Experimental ConditionsDubnoff Shaker Bath
(System 1—S1)
Mixing Reactor
(System 2—S2)
Volume of solution (mL)25300
Adsorbent material mass (g)0.56
Mesh4242
pH55
Temperature (°C)2525
Time (min)300300
Table 4. Freundlich isotherm heterogeneity coefficient (1/nF).
1/nFMeaning
0 < 1/nF < 1Favorable adsorption
1/nF > 1Unfavorable adsorption
1/nF = 1Irreversible and unfavorable adsorption
Table 5. Grain grading data for uçá crab (Ucides cordatus).
MeshRetained Material Mass (g)Retained Material Fraction (%)
24200,23120,174
42523,11252,704
60123,02312,395
8070,8537139
10030,3443057
20010,0711015
tray34,90323517
Table 6. Chemical composition of the uçá crab (Ucides cordatus).
Composition(%)
(CaO)84.3
MgO8.47
P2O54.02
SO31.51
SrO1.45
Fe2O30.16
TiO20.09
CuO0.02
Br0.02
Table 7. Kinetic parameters of the PFO and PSO models for the S1 and S2 systems and the respective coefficients of determination.
SystemsKinetic Models
Pseudo-First-Order (PFO)Pseudo-Second-Order (PSO)
k1 (min−1)qeexp 1 (mg/g)qecalc 2 (mg/g)R2k2 (g.mg−1.min−1)qeexp 1 (mg/g)qecalc 2 (mg/g)R2
System 1 (S1)0.012833.6233.6330.9689 0.0037463.6234.1790.9839
System 2 (S2)0.025514.1914.0420.84410.011744.1914.2400.8987
1 qeexp = experimental adsorption capabilities. 2 qecalc = adsorption capacities calculated by the model.
Table 8. Parameters obtained for the Langmuir, Freundlich, and Sips models for the S1 and S2 systems.
ModelsParametersSystem 1—S1System 2—S2
Langmuir q max (mg·g−1)40.1219.67
KL (L.mg−1)0.0021470.006399
R20.93920.8424
FreundlichnF1.0661.091
KF 0.099790.1407
R20.94060.8397
Sips q max (mg·g−1)66.942.953
KS0.0014362.004 × 10−7
nS0.95956.681
R20.93980.9457
Table 9. Separation factor (RL) and heterogeneity coefficient (nF) of systems S1 and S2.
SystemsInitial Concent. (mg·L−1) RLnF
System 1—S1100.9789800040.938
200.958825495
300.939484099
400.920907582
500.903051451
600.885874599
700.869338989
800.853409371
900.83805303
1000.823239569
System 2—S2160.907130.917
280.8480604
400.7962135
520.7503407
760.6728141
880.6397633
1000.6098076
Publisher’s Note: MDPI stays neutral with regard to jurisdictional claims in published maps and institutional affiliations.

