Liquid Air as an Energy Carrier for Liquefied Natural Gas Cold Energy Distribution in Cold Storage Systems

1
Department of Mechanical Engineering, Korea Advanced Institute of Science and Technology, Daehak-ro 291, Yuseong-gu, Daejeon 34141, Korea
2
Energy Systems Research Division, Korea Institute of Machinery and Materials, Gajeongbuk-ro 156, Yuseong-gu, Daejeon 34103, Korea
*
Author to whom correspondence should be addressed.
†
These authors contributed equally to this work.
Energies 2021, 14(2), 272; https://0-doi-org.brum.beds.ac.uk/10.3390/en14020272
Submission received: 21 December 2020
/
Revised: 2 January 2021
/
Accepted: 4 January 2021
/
Published: 6 January 2021
(This article belongs to the Section B: Energy and Environment)
Abstract
:Liquid air can be employed as a carrier of cold energy obtained from liquefied natural gas (LNG) and surplus electricity. This study evaluates the potential of liquid air as a distributed source with a supply chain for a cold storage system using liquid air. Energy storing and distributing processes are conceptually designed and evaluated considering both the thermodynamic and economic aspects. Further, the proposed supply chain is compared with a conventional NH3/CO2 cascade refrigeration system. The thermodynamic analysis demonstrates that the exergy efficiency and the coefficient of performance of the proposed supply chain are 22% and 0.56, respectively. Economic analysis is based on a life cycle cost (LCC) evaluation. From the economic analysis, the liquid air production cost and the LCC of a liquid air cold storage system (LACS) are estimated to be 40.4 USD/ton and 34.2 MMUSD, respectively. The LCC is reduced by 19% in the LACS compared with the conventional refrigeration system. The proposed supply chain is economically feasible, although its thermodynamic performances are lower than those of the conventional system. The sensitivity analysis indicates that LNG mass flow rate in the air liquefaction system and the cold storage operating time are dominant parameters affecting the economic performance.
1. Introduction
In recent years, climate change has become a global concern. As environmental issues can cause many problems for human beings, extensive research has been conducted to attempt and limit the increase in global temperatures. Energy storage systems (ESSs) and natural gas (NG) have been highlighted as means of reducing greenhouse gas emissions. ESSs make it possible to decarbonize power generation sites by storing surplus energy from power plants and various renewable sources [1]. The primary component of NG is methane; thus, using NG can significantly reduce the emission of pollutants that cause environmental problems [2].
Liquid air energy storage (LAES) is a bulk energy storage system that stores surplus energy using liquid air. The LAES system uses surplus or off-peak electricity to produce liquid air, which is then stored in a cryogenic tank. This solves the geographical limitations faced by other major bulk energy storage systems such as pumped hydro-energy storage (PHES) or compressed air energy storage (CAES), which use nature as a reservoir. In addition, LAES requires less storage volume than PHES or CAES because of the high energy density of liquid air [3,4]. Moreover, when the air liquefaction process is integrated with cold sources, LAES can store wasted cold in addition to electricity. Thus, LAES provides an opportunity to utilize surplus power and wasted cold energy [5].
Further, LAES has the potential to function as an energy carrier for microgrid systems using liquid air. Microgrid systems are local energy networks that obtain energy from various distributed energy resources such as distributed generation units, photovoltaic panels, fuel cells, or wind power plants [6,7]. Microgrid systems have many advantages; they supply thermal energy and electricity to users [8], reduce power loss during electricity distribution [9], and operate in either a grid-connected mode or as isolated islands to improve grid efficiency [7]. However, microgrid systems can occasionally suffer from an imbalance in the power demand and generation due to fluctuations in the environmental conditions and load profile [10]. Liquid air in LAES can provide both power and cold energy to microgrid systems, thereby acting as a reliable distributed energy resource for the system. Hence, LAES makes it possible to connect energy demand- and macro-grids, as liquid air can easily be transferred between them.
There has been a considerable amount of research that focuses on the development of LAES as an energy storage system rather than a distributed source production system. Kishimoto et al. developed a generator for use in LAES systems [11]; Guzzi et al. analyzed the thermodynamic aspects of LAES [12]; Morgan et al. performed experimental tests with a pilot-plant-scale LAES system [13]; and Sciacovelli et al. combined a packed bed cold energy storage system with LAES and analyzed the combined system using dynamic modeling [14]. She et al. integrated LAES into an organic Rankine cycle to use excess compression heat from an air compressor; and then, they analyzed thermodynamic and economic aspects of their proposed system [15]. Borri et al. compared various cycles of air liquefaction systems with microgrid scale LAES [16]; Antonelli et al. suggested various cycles that utilized liquid air in combustion processes [17]; and Kim et al. combined LAES with a gas turbine to utilize the chemical energy of LNG and to improve thermodynamic and economic efficiencies [18].
Research was also conducted to explore the application of liquid air as an energy carrier. Ahmad et al. investigated the possibility of using liquid nitrogen in residential air conditioning systems. They proposed five different cycles and showed that cascade Rankine cycle could save energy consumption by up to 36% compared to that of the conventional air conditioning system [19]. Further, they suggested two factors—modified coefficient of performance (COP) and recovery efficiency—to evaluate the performance of the system [20]. Ahmad et al. also performed a case study on a commercial building, and they showed that the price of liquid air or liquid nitrogen is an important parameter for determining and saving energy costs. The results showed that liquid air has a high potential for application as an energy carrier.
Liquefied natural gas (LNG) is preferred to transport and store NG because of its high volumetric capacity [21]. LNG terminals receive and store transported LNG; they contain regasification facilities to send the LNG to end users. In the regasification system, seawater is used to warm the LNG up to the ambient temperature, which in turn cools the seawater. A significant amount of cold energy is emitted into the environment; the cold energy released by one ton of LNG is equivalent to 200 kWh of electricity [22]. Industries that use refrigeration or cryogenic processes can reduce their energy consumption by utilizing wasted LNG cold energy.
Other researchers have attempted to utilize wasted cold energy from LNG for industrial applications, especially in cold storage systems. Researchers focused on using LNG directly as a heat sink of the refrigerant. Yang and Wu proposed a configuration for a cold storage system using LNG cold energy and performed a feasibility analysis in terms of electricity cost [23]. Lian et al. suggested a cascade system that could deliver LNG cold energy to a storage system, preventing explosion hazards [24]; Lian et al. suggested possible refrigerants that could decrease the operating temperature to −60 °C, and they designed a process of a cold warehouse using LNG cold energy and conducted a thermodynamic analysis of the process [22]. Dispenza et al. integrated an LNG regasification system into a power cycle and cold storage [25].
The wasted LNG cold energy can be utilized more efficiently if the medium stores the cold energy and transfers the energy to industries. The LAES allows storing the LNG cold energy in liquid air by integrating LNG regasification and air liquefaction. Further, many researchers have attempted to integrate LNG regasification in the LAES. Zhang et al. integrated LNG regasification, LAES, and two organic Rankine cycles [26]. Peng et al. integrated the LAES and the LNG regasification process with pressurized propane to consider operation flexibility [27]. Lee et al. integrated the LAES and LNG regasification processes, and they generated additional power from the organic Rankine cycle and NG expansion to enhance efficiency [28]. These studies focused on enhancing the LAES efficiency with the LNG cold energy; however, they still show that the LAES can convert wasted LNG cold energy to liquid air effectively.
This prior research has shown that LNG cold energy could improve the efficiency of cold energy systems by reducing energy consumption. However, several points should be considered when using LNG cold energy directly: the system should not be affected by the demand fluctuations of NG; the system should be installed close to the LNG terminal; the system should use a base load of LNG to satisfy variations in the amount of LNG regasification [21]. Many studies have also shown that LAES could store off-peak electricity efficiently, and they have suggested that liquid air could be utilized for energy distribution. However, the use of liquid air as an energy carrier for wasted LNG cold energy has not been evaluated quantitatively or qualitatively.
This study proposes the use of liquid air as a carrier of waste LNG cold energy and electricity. Liquid air can transport energy from the energy releasing site to the energy consuming site. A conceptual design of a supply chain for the cold storage system using liquid air is presented. The performance of the proposed supply chain is evaluated in terms of thermodynamic and economic analysis. As a case study, the performance of the supply chain is compared with that of a conventional ammonia/carbon dioxide (NH3/CO2) cascade refrigeration system. The advantages and limitations of the proposed supply chain are discussed through the case study.
The remainder of this paper is organized as follows: Section 2 describes the conceptual design of the energy supply chain consisting of the air liquefaction system, and the cold storage system. Section 3 provides details on the methodologies used to evaluate the systems. The results for these evaluation methods are presented in Section 4. Finally, the conclusions of this study are described in Section 5.
2. Conceptual Design of Energy Storing and Distributing Systems
2.1. Description of the Supply Chain for the Energy Storing and the Utilizing System
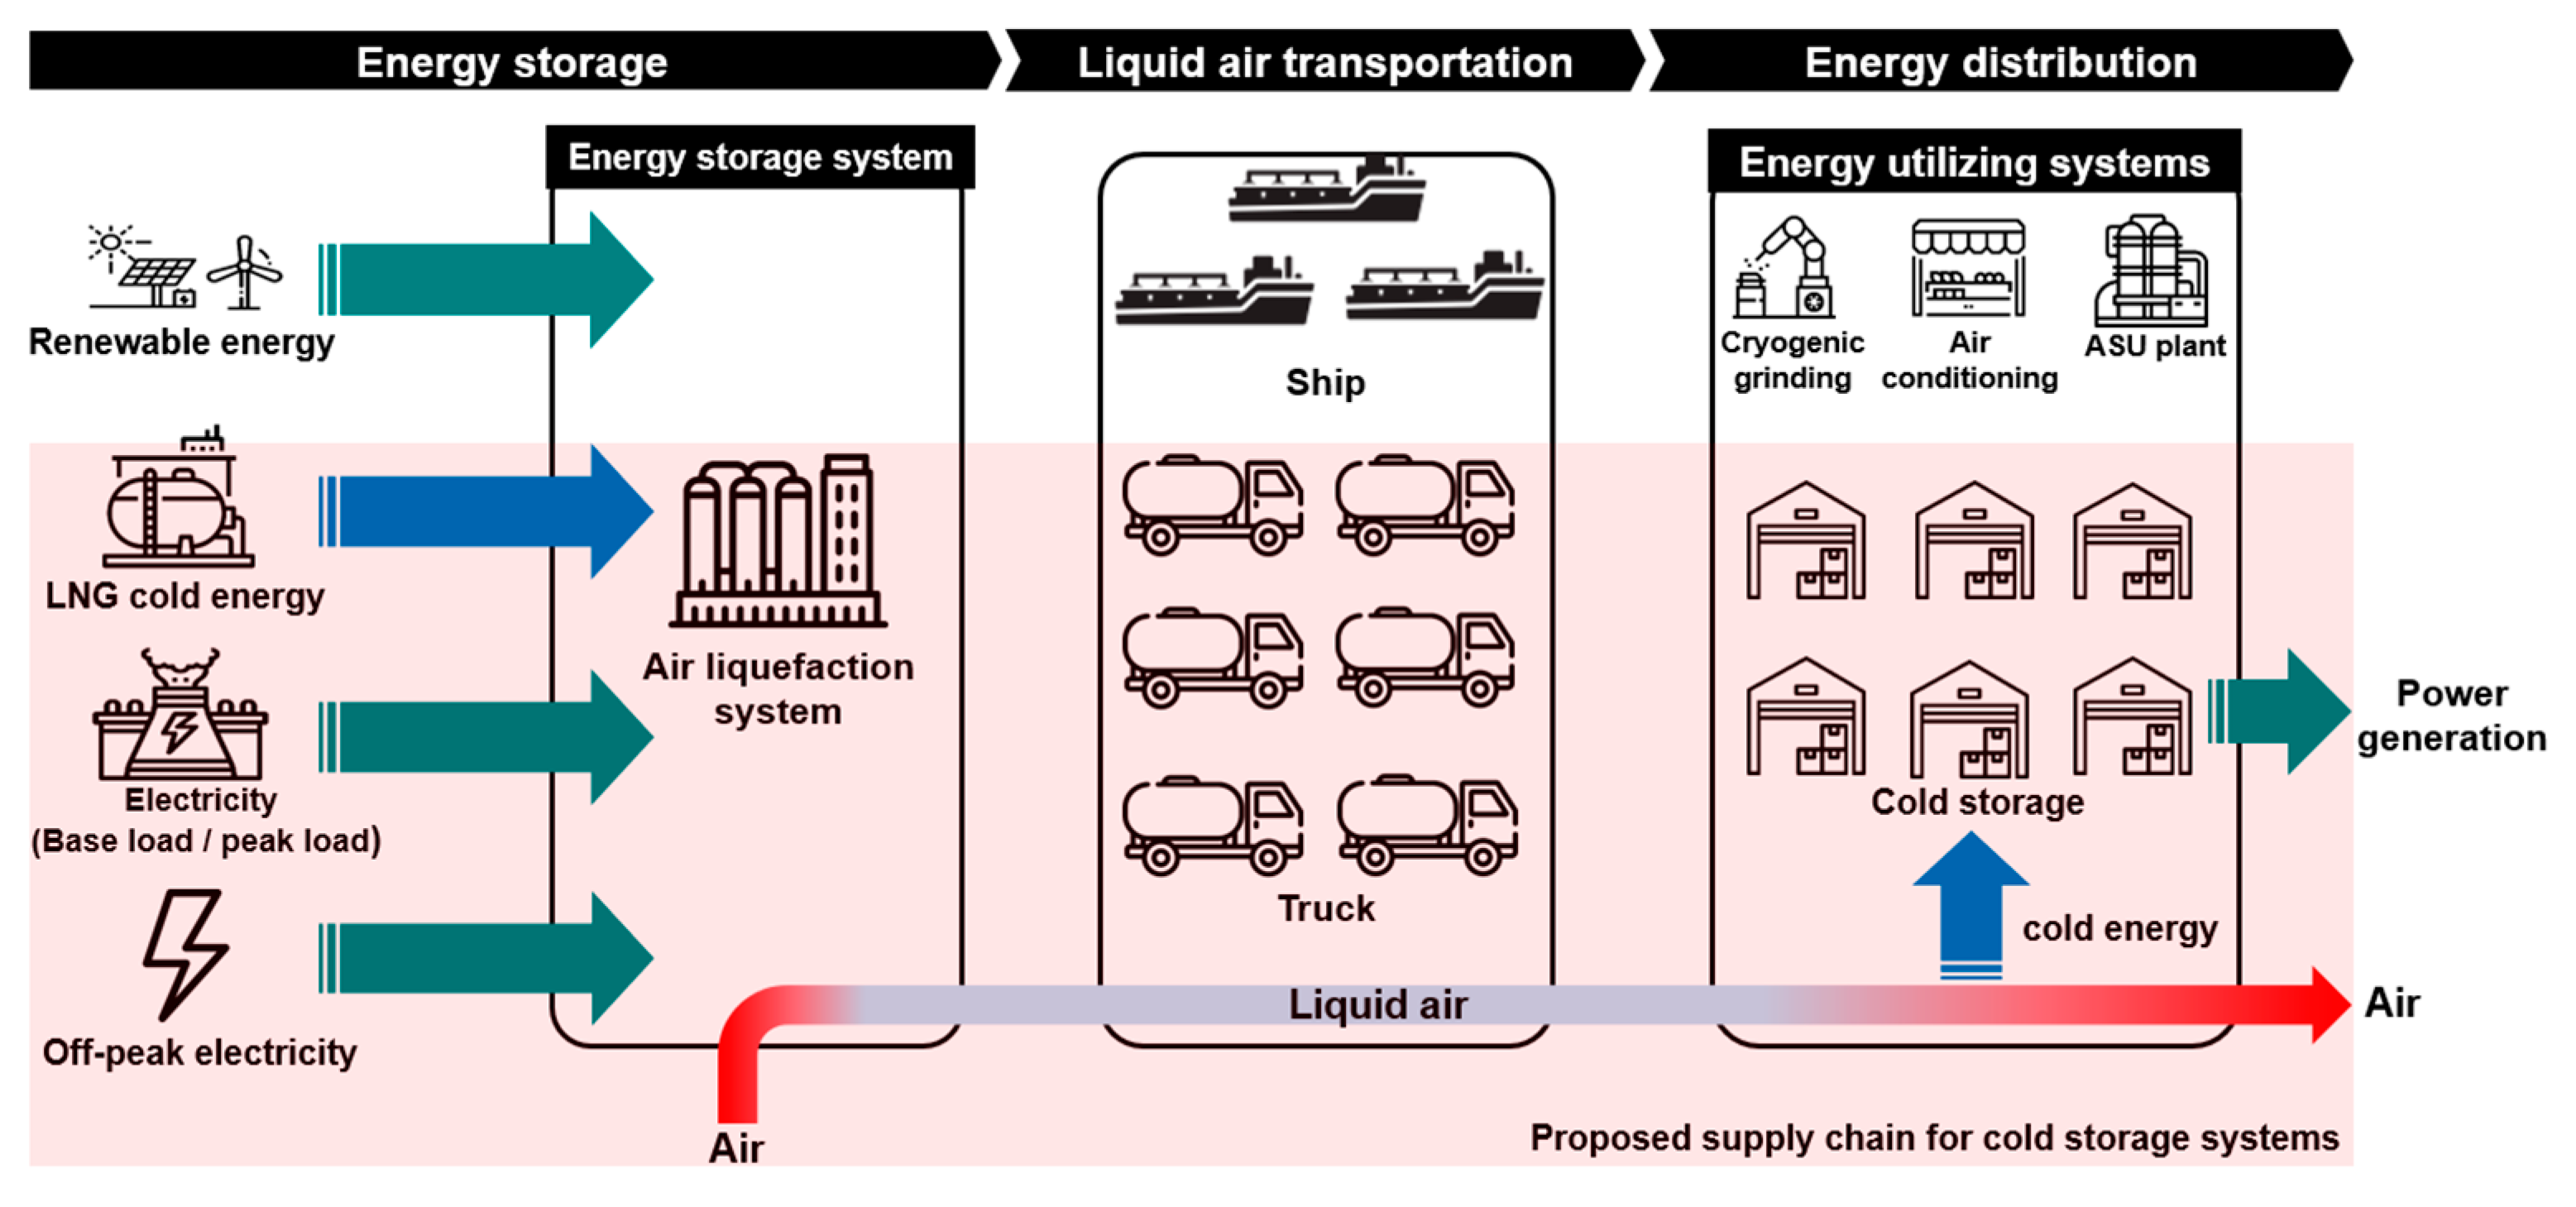
Figure 1 shows a schematic of the overall liquid air supply chain. Energy from multiple sources can be stored using liquid air. The air liquefaction system is powered by surplus energy from renewable sources, base/peak load, or off-peak electricity from power plants. Further, cold energy from LNG is supplied to the liquefaction system, and the LNG regasification process is integrated into the air liquefaction process. The air liquefaction system captures the energy that would otherwise be wasted. Many forms of transportation, such as trucks and ships, can be used to transport liquid air to energy distribution sites. These sites may include residential areas or industrial districts for applications such as cryogenic grinding, air separation units, cold storage, dry ice production, or commercial buildings. One air liquefaction system can be connected to several distribution sites; hence, liquid air produced by grid-scale energy storage can provide energy to multiple microgrid systems.
The red area in Figure 1 represents a schematic of the proposed supply chain for the cold storage system. In the energy storage section, the air liquefaction system converts the cold energy from LNG and electricity into liquid air. In the transportation section, heavy trucks deliver liquid air to the cold storage systems via roads. In the energy distribution section, liquid air releases cold energy and generates power in the cold storage systems. Through this process, liquid air acts as carrier for LNG cold energy and electricity.
All designed processes are simulated with Aspen HYSYS v.10. The Peng–Robinson equation of state is employed to estimate the stream properties. The design assumptions for the proposed supply chain are:
- Both base/peak loads and off-peak electricity are used to store the LNG cold energy.
- The air liquefaction system operates 24 h/day, as the purpose of the system is storing the LNG cold energy.
- Only a cold storage system is considered as the energy distribution site subsystem.
- To use liquid air entirely, multiple cold storage systems are connected to one air liquefaction system.
- All cold storage systems have the same operating conditions.
- Dry air is liquefied in the energy storing system.
- There are no pressure drops during the energy storing and the energy distributing processes.
- Cold losses are neglected in the overall processes.
2.1.1. Air Liquefaction System for Energy Storage
Figure 2 shows a process flow diagram of the air liquefaction system from the energy storage section. A precooled Linde–Hampson cycle is adopted to the liquefaction system to store the LNG cold energy. The main components of this system are a multistage compressor, intercoolers, a multistream heat exchanger, an LNG pump, a phase separator, a Joule–Thomson valve, and a cryogenic tank. The purified air passes through the three-stage compressor, and the air is compressed by the same compression ratio at each stage. At the end of each compression stage, seawater is used to cool the compressed air to the ambient temperature. The cold energy from the LNG and flashed air further cool the compressed air in the plate fin type multistream heat exchanger. The compressed air expands and liquefies as it passes through the Joule–Thomson valve. The separator divides the expanded air into liquid air and flashed air. Liquid air is stored in the storage tank, and the flashed vapor is sent back to the multistream heat exchanger. The LNG cold energy and electricity are stored in liquid air through this process.
Table 1 lists the design assumptions applied to the liquefaction system. The pinch point temperature (Tpinch,hx) in the multistream heat exchanger is assumed to be 4 °C. The isentropic efficiencies of the compressor (ηcomp) and pump (ηpump,liq) are 0.88 and 0.80, respectively [15,18]. The LNG mass flow rate () is 200 ton/h, the LNG pump pressurizes the LNG to 77 bar, and the NG exits the multistream heat exchanger at a temperature of 0 °C; these are the operating conditions of the vaporizers in the Pyeongtaek LNG terminal in Korea [29]. Liquid air is stored in the cryogenic storage tank at ambient pressure. Table 2 lists the composition of the LNG and the inlet air. The LNG composition is based on results from the Pyeongtaek LNG terminal [30].
Table 3 summarizes the stream conditions in the air liquefaction system when the air compression pressure () is 130 bar. The value of determines the thermodynamic performance of the air liquefaction system. This is because the thermodynamic properties, particularly the heat capacity per unit mass, of the compressed air and the Joule–Thomson effect in the valve are dependent on . The effect of on the thermodynamic performance of the air liquefaction system was investigated by varying from 40 to 200 bar.
2.1.2. Liquid Air Transportation
Liquid air products are delivered to the LACS by road via heavy trucks. The formulae used to determine the total number of trucks required to deliver liquid air [31] are given as:
where N, V, RT, and represent the total number of trucks required, the volume capacity of a truck, the round-trip operation time of a truck, and liquid air production rate of the liquefaction system, respectively. In addition, D, U, and L represent liquid air delivery distance, the average velocity of a truck, and the loading/unloading time for a truck, respectively. The volumetric capacity of a truck and the loading/unloading time were assumed to be 48 m3 and 4 h, respectively [31]. The average velocity of a truck was assumed to be 50 km/h, considering traffic conditions. The delivery distance was varied to investigate the effect of distance on the feasibility of the supply chain.
2.1.3. Cold Storage System for Energy Distribution
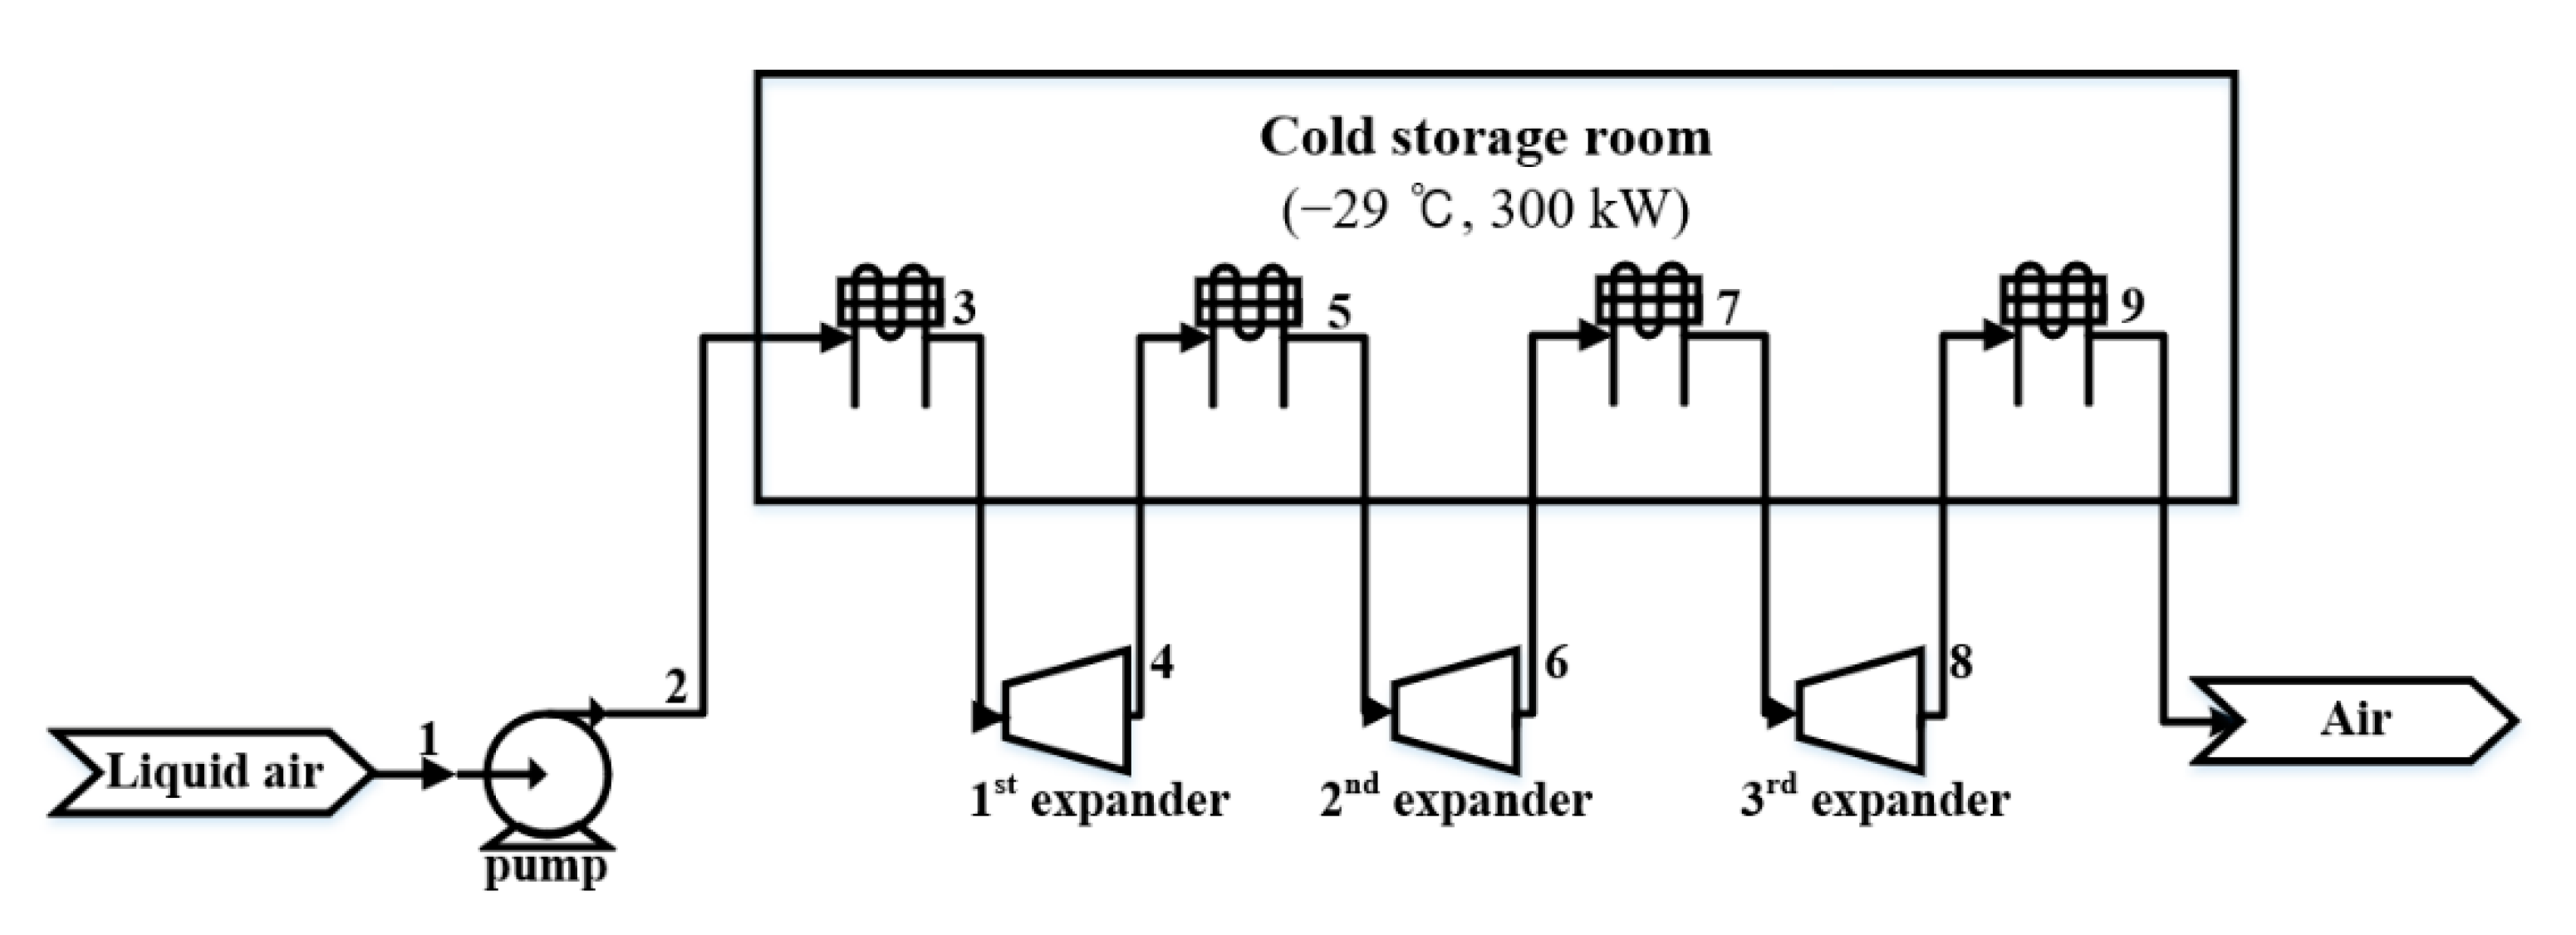
Figure 3 shows a schematic of the cold storage system using liquid air. This liquid air cold storage (LACS) system consists of a liquid air storage tank, a cryogenic pump, evaporators, and a multistage expander. The cryogenic pump pressurizes liquid air, which then emits the cold energy and vaporizes at the first evaporator; the vaporized air then passes through an expander and generates electricity; and then, the air undergoes a three-stage expansion process with the same expansion ratio at each stage. In the second, third, and fourth evaporators, the cold energy that remains in the vaporized air is transferred to the LACS. The air is emitted into the environment once it has passed through the fourth evaporator.
Table 4 lists the design assumptions applied to LACS. The isentropic efficiencies of the expander (ηexp,LACS) and cryogenic pump (ηpump,LACS) were 0.8 each [17,32]. The Tpinch,hx in each of the evaporators was assumed to be 4 °C. The cold storage room temperature (Tstorage) and the cooling load (Qcooling) of the cold storage system were assumed to be −29 °C and 300 kW, respectively. The operating time was assumed to be 10 h/day [33].
Table 5 shows the stream data for the LACS when the outlet pressure of liquid air at the pump () was 100 bar. The thermodynamic performance of the LACS is determined by as the thermodynamic properties of liquid air, particularly the heat capacity per unit mass, and the power generation in the expander are dependent on . In this study, was varied from 10 to 200 bar to investigate its effect on performance.
3. Method of System Evaluation
3.1. Thermodynamic Analysis
3.1.1. Energy Analysis
Specific Energy Consumption and Liquid Yield in the Air Liquefaction System
The specific energy consumption of the air liquefaction system is given by
Equation (3) represents the total electricity required to produce one ton of liquid air. Here, , , and are the power consumption rate of the air compressor, the power consumption rate of the LNG pump, and the liquid air production rate of the air liquefaction system, respectively.
The liquid yield of the air liquefaction system is given by:
Equation (4) is the ratio of the liquid production rate to the mass flow rate of the compressed air in the air liquefaction system; it shows how much compressed air is converted into liquid air. These parameters help in the thermodynamic evaluation of the air liquefaction system as varies.
Liquid Air Consumption Rate and Power Generation of the LACS
The LACS consumes liquid air during the operation and generates power using vaporized air. The liquid air consumption rate () and power generation rate () are, respectively, given as:
where denotes the enthalpy difference between the air at the inlet and the outlet of the heat exchanger while denotes the enthalpy difference between the air at the inlet and the outlet of the expander. These parameters are used in the thermodynamic evaluation of the cold storage system as varies.
Coefficient of Performance (COP) and Recovery Efficiency of LACS
The LACS recovers cold energy and provides power from liquid air, and thus, it is different compared to the conventional heat pump or heat engine systems. Ahmed et al. proposed two factors—COP (COPLACS) and recovery efficiency ()—to evaluate the performance of cycles that provide both cooling and power [20]. They converted the generated power into heat or cooling load into power with the COP of conventional air conditioning system (COPconv).
In this study, the same parameters were used to evaluate the performance of the LACS. The COPLACS and are given as:
Denominators in Equations (7) and (8) represent the total energy consumption required to produce in the air liquefaction system. The COPconv was assumed to be 1.79, which is the value for the NH3/CO2 refrigeration system used in the case study. COPconv was estimated considering design assumptions from the LACS, such as zero pressure drop or cooling capacity. Prior studies have shown that the COPconv for the NH3/CO2 refrigeration system is within 1.1–1.8, depending on operating conditions [34,35,36].
3.1.2. Exergy Analysis
Exergy is the maximum theoretical work available from a system or a stream when they reach equilibrium with the environment. The total exergy consists of physical and chemical exergy and is equated as [37]:
where is the physical exergy, which represents the maximum theoretical work available when the system or stream with a given (T, P) state reaches the environmental (T0, P0) state through physical processes. The physical exergy consists of enthalpy, entropy, kinetic exergy, and potential exergy. We assumed that the kinetic and potential exergy in this study were negligible. Thus, the physical exergy of the stream can be calculated using the enthalpy and entropy values as:
where is the chemical exergy, which represents the maximum useful energy that can be obtained from the chemical processes as the stream components in the environmental state reach chemical equilibrium. It should be noted that the enthalpy and entropy values for each stream in the designed processes were obtained from Aspen HYSYS. The chemical exergy was also negligible in this study because the processes do not involve chemical reactions. The exergy of the electricity is given by
The exergy of the electricity is identical to the electrical energy, as the power is totally converted into work. The exergy balance for each piece of equipment in the designed processes is determined by
The exergy efficiency is the ratio of the exergy input to the exergy output of the system. This parameter evaluates the system in terms of the second law of thermodynamics, showing how efficiently the system consumes energy. The exergy destruction is the ratio of the exergy destroyed to the exergy input. This helps to compare the degree of exergy destruction in each piece of equipment in the processes. The exergy efficiency and exergy destruction ratio are, respectively, given as:
The exergy efficiencies of the air liquefaction system, LACS, supply chain, and NH3/CO2 refrigeration system were considered in this study.
Equations (15)–(18) express the corresponding exergy efficiencies. Here, the is the LNG cold exergy. In addition, the in the LACS is the exergy of the power generation. For the exergy efficiency of the supply chain, all LACSs that are connected to the one air liquefaction system should be considered. In Equation (18), denotes the total number of cold storage systems connected to the air liquefaction system. This graphical representation helps identify major equipment that destroys exergy significantly during the energy storage and energy recovery processes.
3.2. Economic Analysis
3.2.1. Life-Cycle Cost Analysis
The proposed supply chain was economically evaluated based on a life-cycle cost (LCC) analysis. This is an economical evaluation method used to estimate the total expenditure required to operate a system throughout its lifetime. The LCC includes both the capital expenditure (CAPEX) and operational expenditure (OPEX). The lifetime of the system was assumed to be 20 years for the LCC estimates in this study.
Many of the LACSs receive liquid air from a single liquefaction system, which implies that those systems share in the expenditure required for liquid air production and delivery processes. In this study, the liquid air production cost was adopted to evaluate the LCC of the LACS in terms of the supply chain, considering both the LCCs of the air liquefaction system and the transportation that one cold storage system would cover. The liquid air production cost was estimated based on the CAPEX and OPEX of the air liquefaction and transportation systems. The liquid air production cost is reflected in OPEX of the LACS.
CAPEX
CAPEX is the initial capital investment required to install a system. The percentage of delivery equipment method was adapted to estimate the CAPEX, excluding the transportation system. This method estimates the items in the CAPEX as a percentage of the purchased equipment costs as [38]
Here, E and f are the total delivered equipment cost and the multiplying factor, respectively. Table 6 lists the detailed information regarding the multiplying factors. Table 7 summarizes the methods used to evaluate the cost of the delivered equipment. The Aspen process economic analyzer (APEA) was used to estimate the equipment cost for all components, except the air compressor and the air expander. The APEA estimated the equipment costs based on process simulation results from the HYSYS simulator. The CAPEX for the air compressor and the air expander were estimated based on previous studies [18,32]. The CAPEX for transportation was calculated assuming that the price of one truck is 500,000 USD as [31]
OPEX
The OPEX is defined as the total cost required to operate a system annually. Table 8 provides details of the items in the OPEX for each of the systems. Maintenance and repairs, operating supplies, local taxes, insurance, and plant overhead costs were estimated based on the CAPEX. The labor cost was assumed to be 35,000 USD/labor, which is the average annual salary for a full-time employee in Korea [39]. The cost of electricity was assumed to be 0.07 USD/kWh, which is the average industrial cost in Korea [39]. In the LACS, the liquid air cost was estimated based on economical results of the liquid air production cost. The OPEX of a truck was assumed to be 0.86 USD/km [31]. Several items such as fuel, maintenance, insurance, and driver wages are included in the OPEX of a truck. The OPEX of transportation was calculated using [31]
Liquid Air Production Cost
The liquid air production cost was estimated to evaluate the liquid air cost required for LACS. The capital recovery factor (CRF) was used to convert the CAPEX of the air liquefaction system and the transportation into annual payments over the lifetime; this is defined as:
Here, r and n denote the interest rate and the lifetime of the system, respectively. In this study, r was set to 8%, which is a conservative value in Korea [39]. The liquid air production cost is the payment required to produce one ton of liquid air, as given by
3.3. Case Study: Comparison between Conventional NH3/CO2 Refrigeration System and Proposed Supply Chain
In this study, the proposed supply chain is compared with a conventional refrigeration system for the case study. The NH3/CO2 cascade refrigeration system is selected as the conventional refrigeration system. The process and operating conditions of the NH3/CO2 cascade refrigeration system were based on previous research, which designed the cold storage with a capacity of 240 ton/day of frozen fishes [34]. The cooling capacity and cold storage temperature of the comparison system is equivalent to the LACS.
The proposed supply chain and the NH3/CO2 cascade refrigeration system are compared in terms of thermodynamics and economics. Table 9 lists the operating parameters of the supply chain for the case study. The delivery distance is assumed as 100 km, which is the distance between Pyeongtaek LNG terminal and Daejeon in South Korea. The operating time of the cold storage system was assumed to be 10 h/day [33].
4. Results and Discussion
4.1. Thermodynamic Analysis of the Proposed Supply Chain
4.1.1. Air Liquefaction System
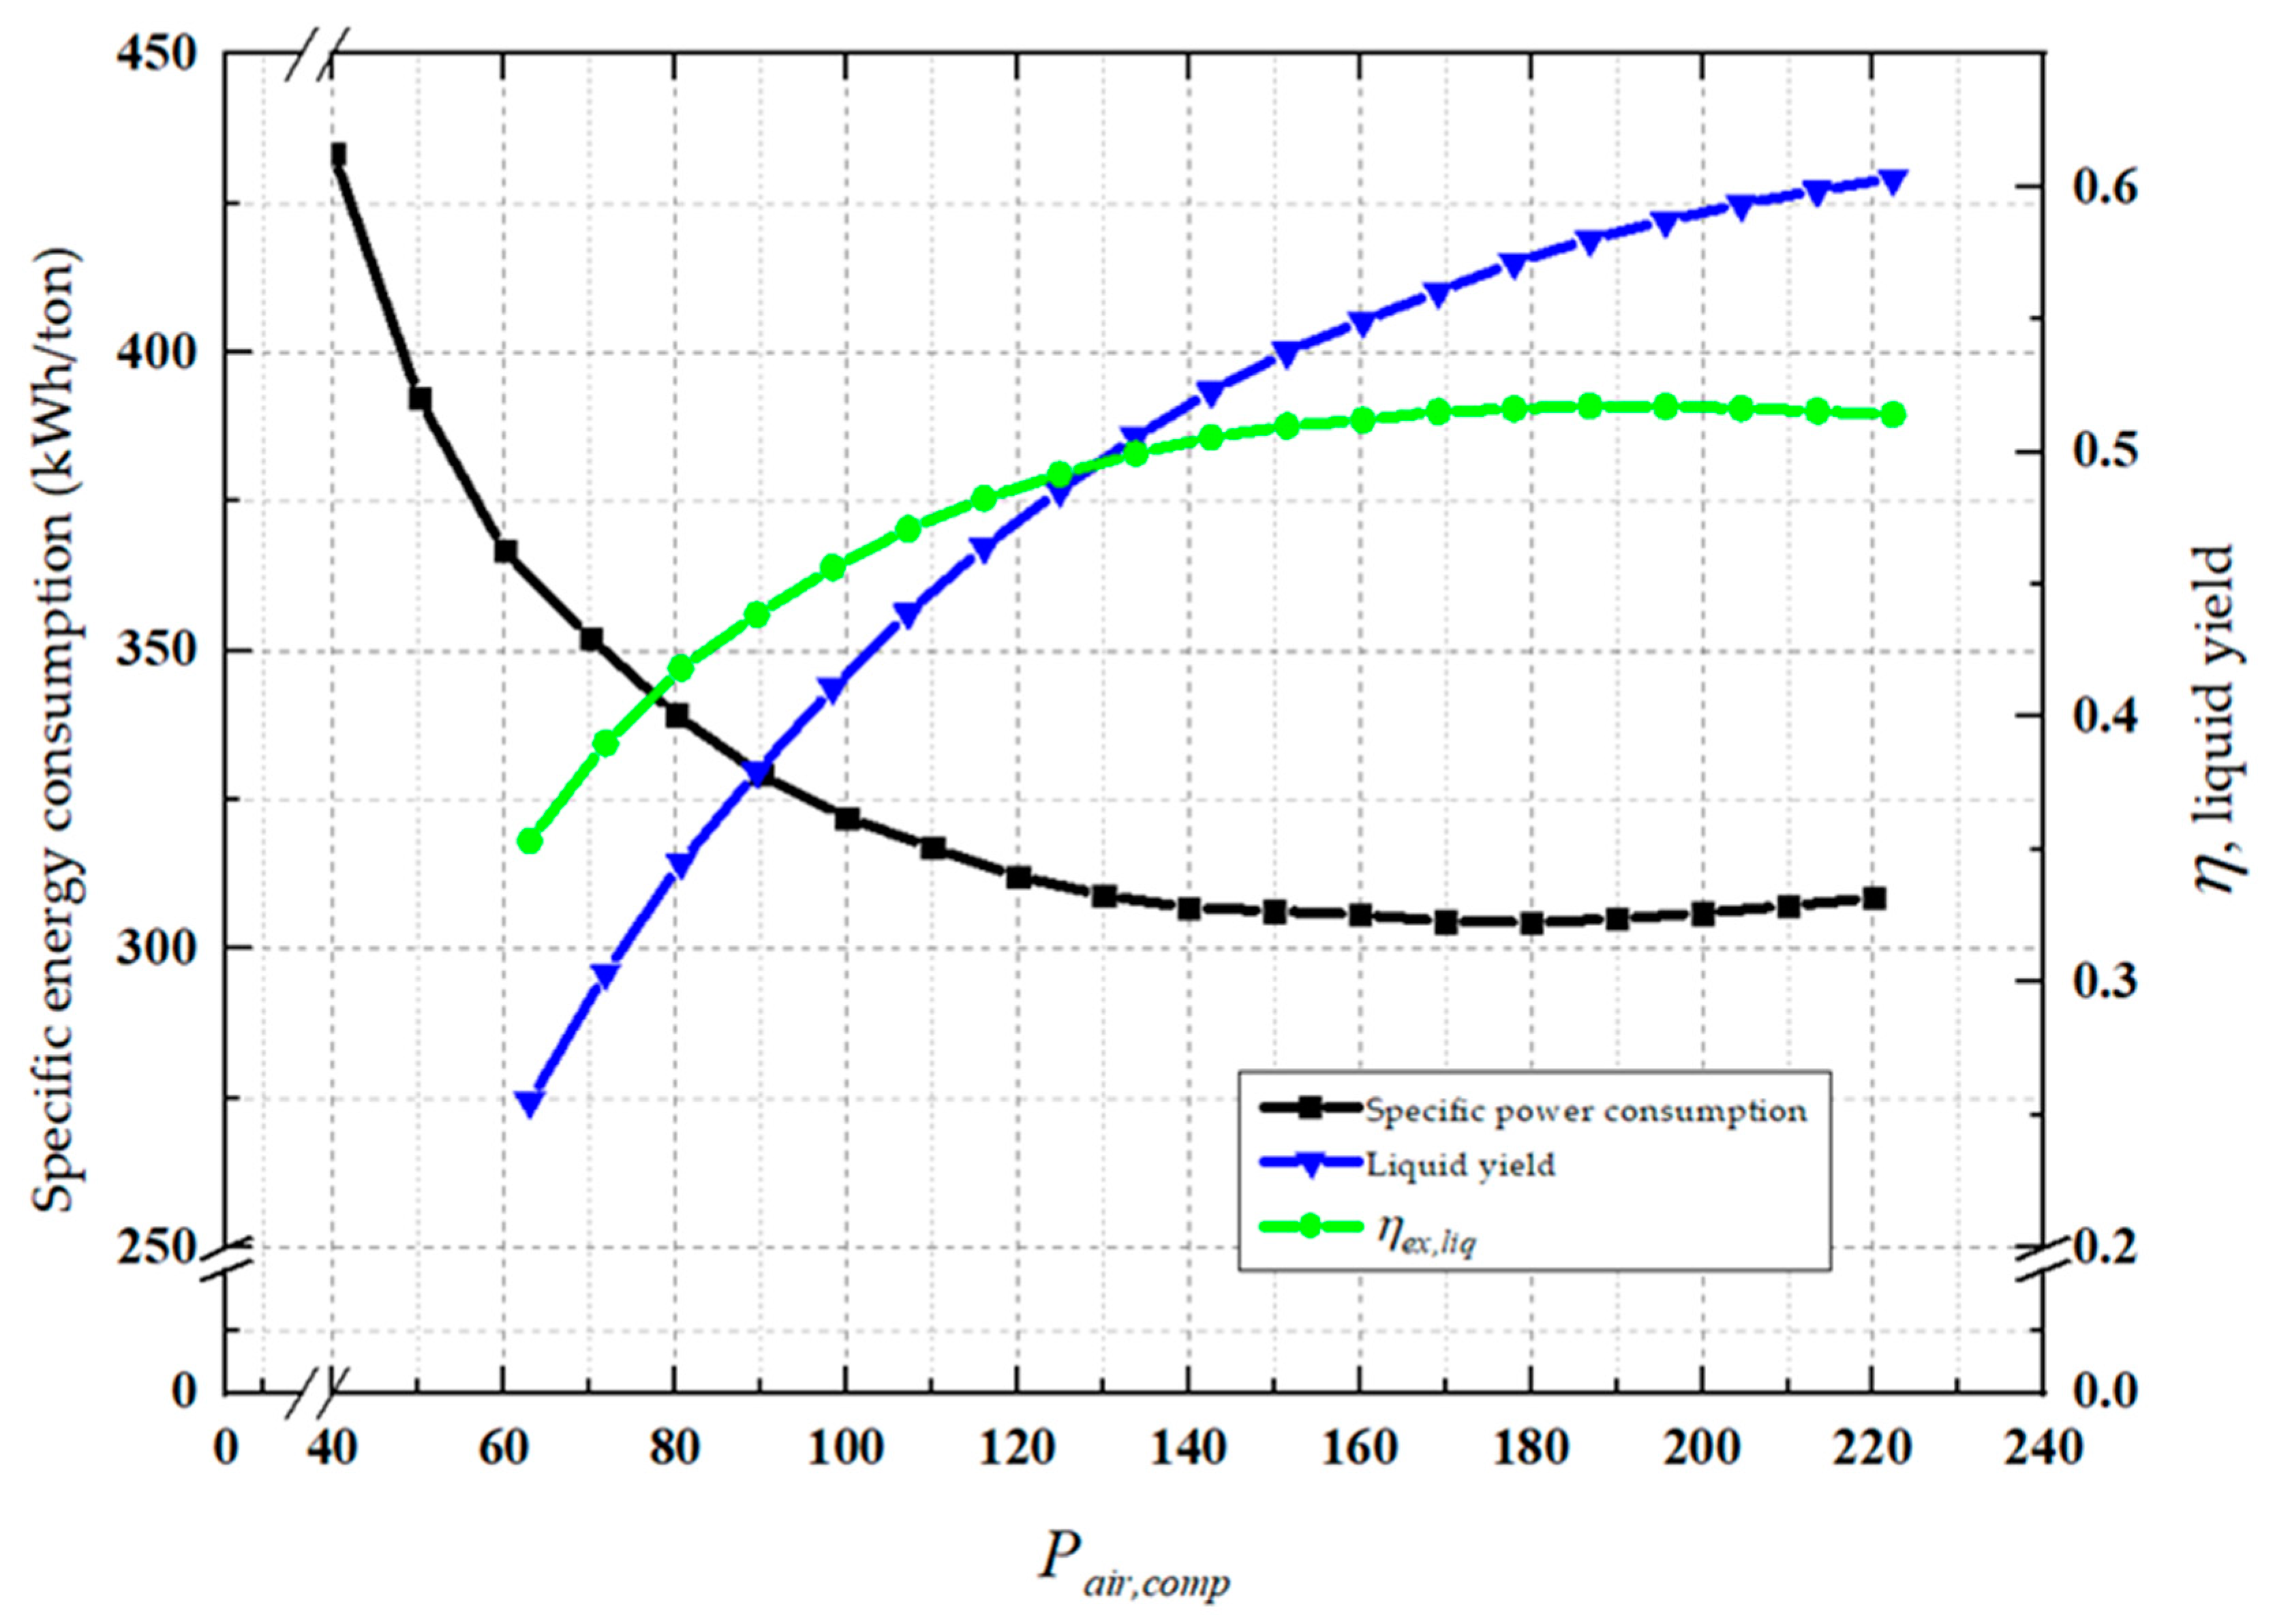
Figure 4 shows the specific energy consumption, liquid yield, and exergy efficiency of the air liquefaction system with respect to . The specific power consumption was minimized, and the exergy efficiency was maximized when was 180 bar. The heat capacity of the air is an important factor that explains these results. Heat capacity is proportional to pressure and inversely proportional to temperature. When air is compressed at high pressure, it is cooled to a lower temperature by the LNG cold energy than when it is compressed at low pressure; this is because of the heat capacity. The liquid yield is improved when the air is at low temperature and high pressure, which means the specific power consumption can be reduced by decreasing . The specific power consumption starts to increase again once exceeds 180 bar. This is because the energy required to raise the pressure becomes more significant than the reduction of in the compressor. The exergy efficiency also shows that the system consumes energy less efficiently when exceeds 180 bar; this is because of the increase in the specific power consumption.
Figure 4 shows that the air liquefaction system is most effective when is 180 bar. However, the working pressure of the system is limited to 130 bar because of the maximum pressure of the cryogenic plate-fin heat exchanger [40]. When is 130 bar, the specific power consumption, liquid yield, and exergy efficiency of the air liquefaction system are approximately 304 kWh/ton, 0.58, and 52%, respectively. The thermodynamic performance of the air liquefaction system can be improved by using other types of heat exchangers that can endure high pressure, allowing the air liquefaction system to operate close to 180 bar.
4.1.2. LACS in Proposed Supply Chain
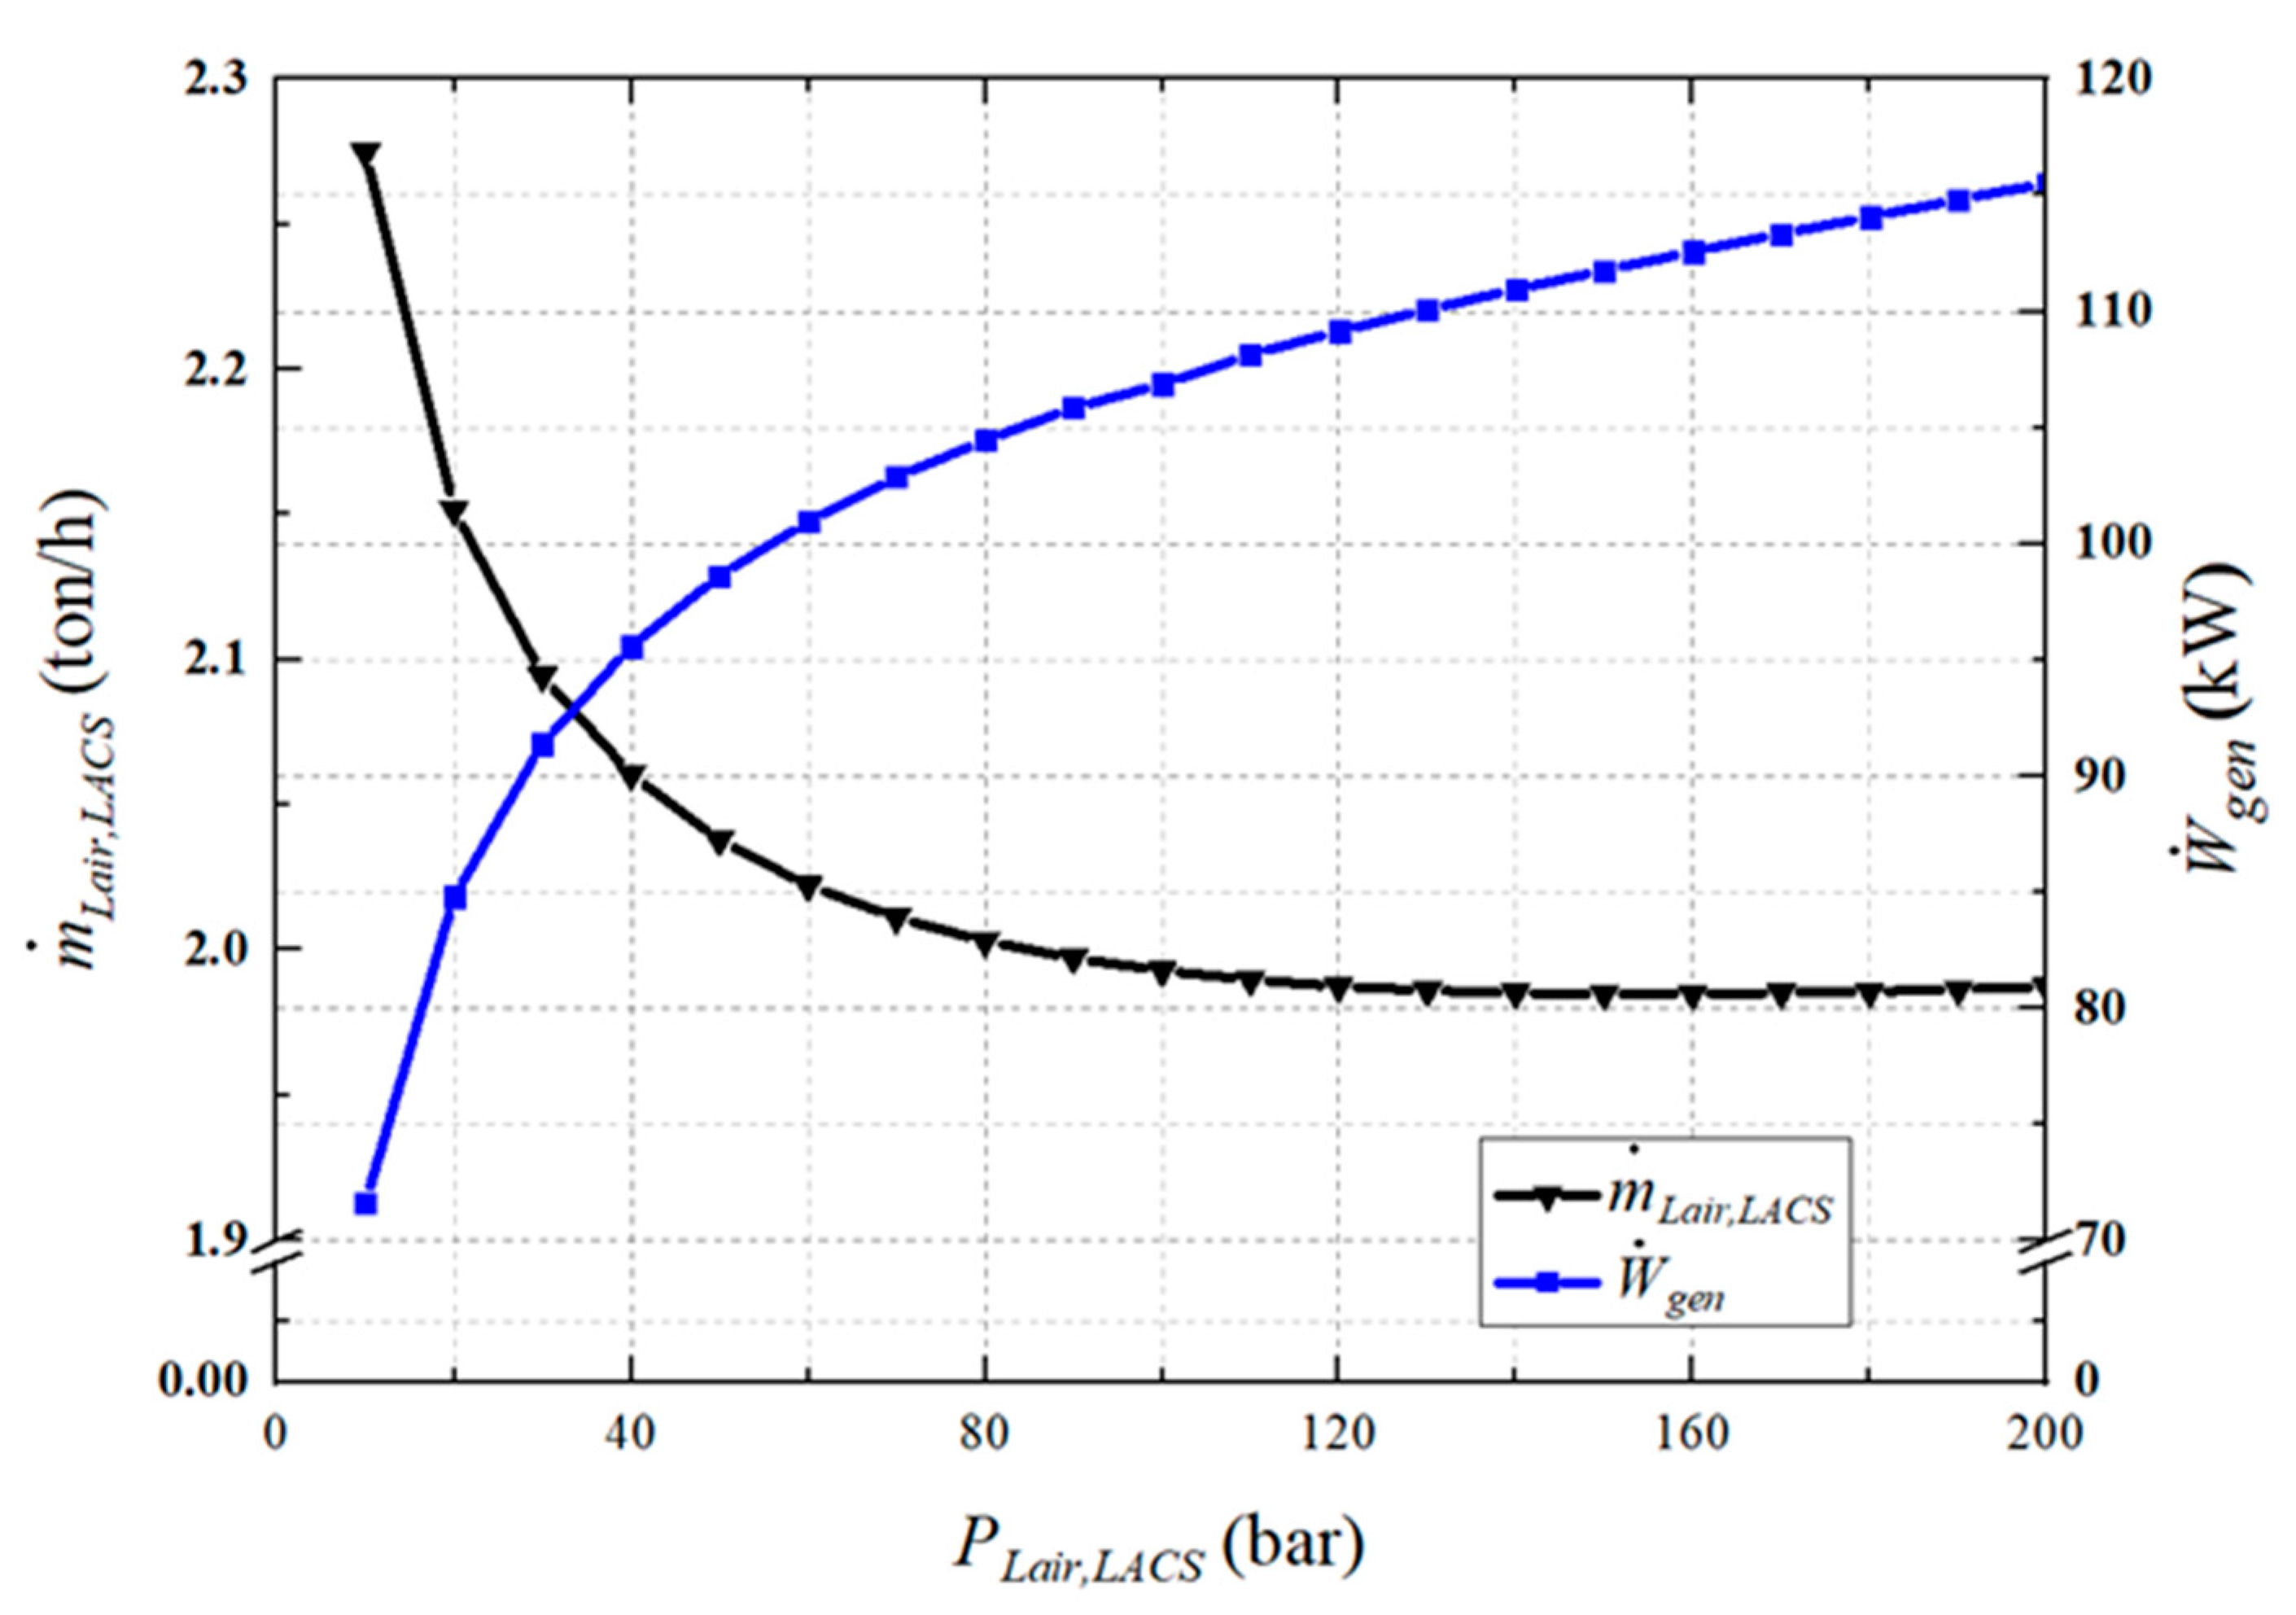
Figure 5 shows the and of the LACS with respect to . When is 160 bar, reaches a minimum value of 1.98 ton/h. As increases from 10 to 200 bar, the value of decreases in the first evaporator and increases in the second, third, and fourth evaporators. Once exceeds 160 bar, the change in in the first evaporator becomes dominant over then other evaporators, so starts to increase again. In terms of , becomes the dominant term in Equation (6), and therefore, increases with an increase in .
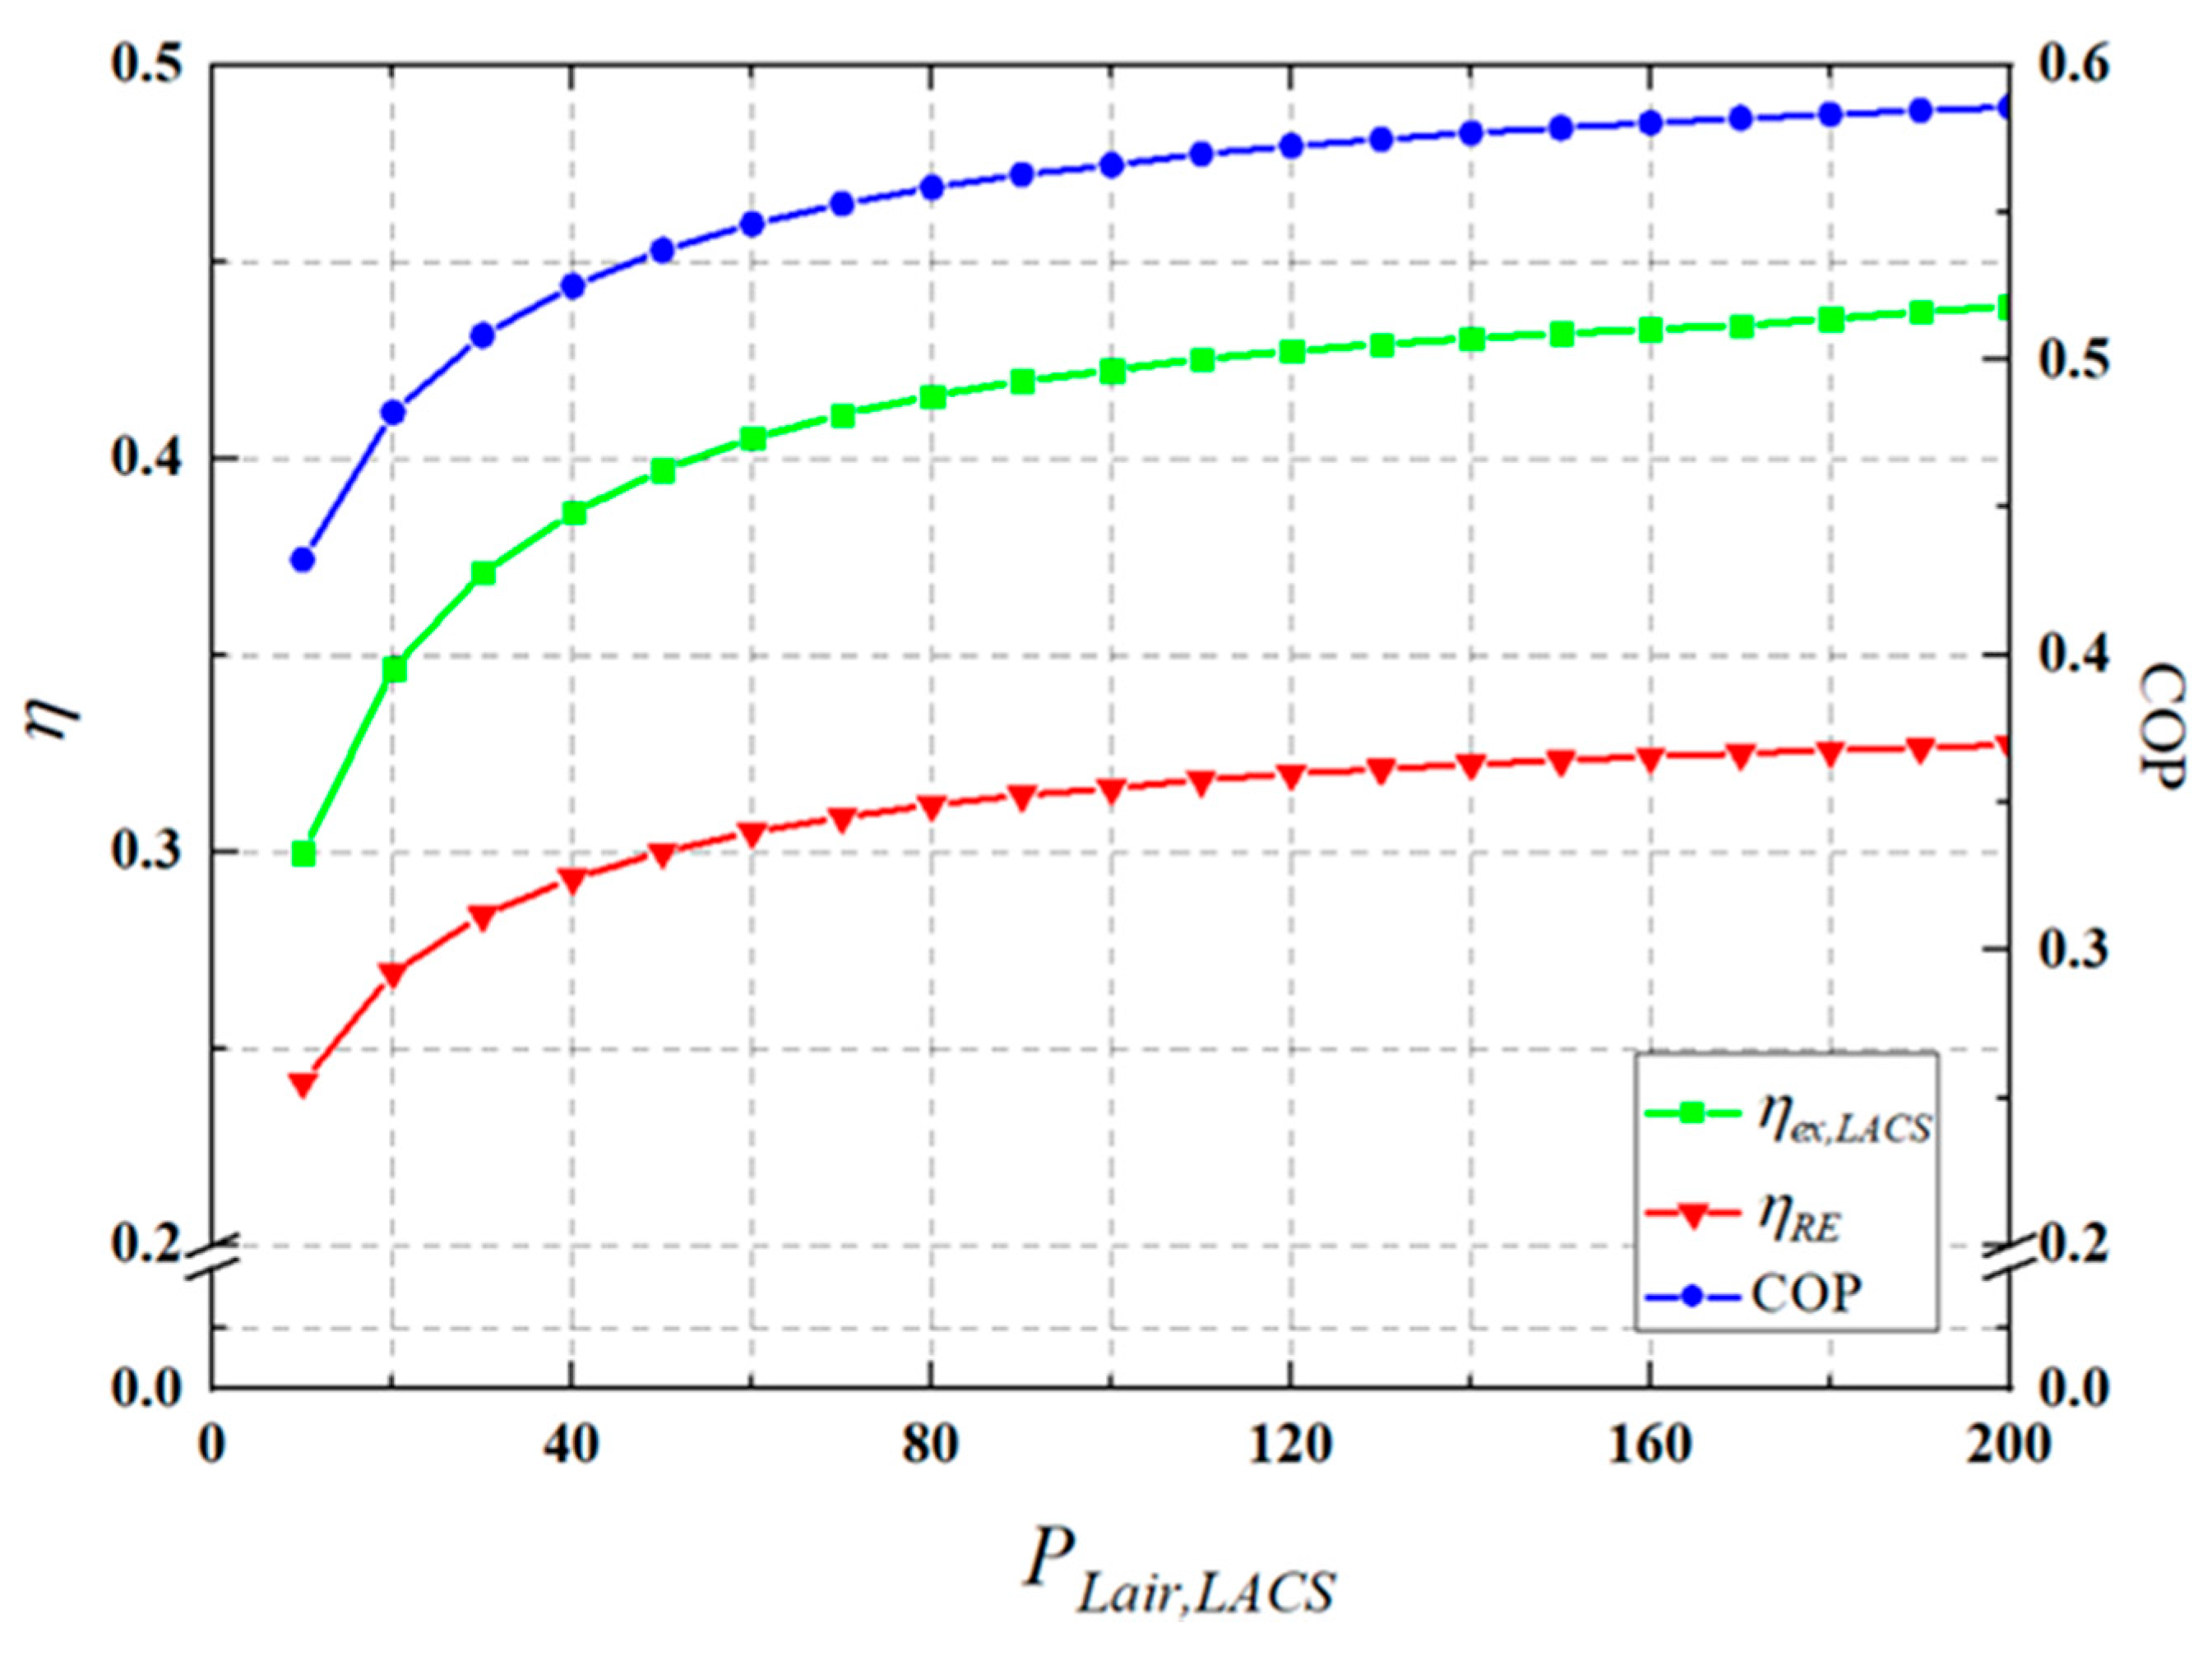
Figure 6 shows the COP, the recovery efficiency, and the exergy efficiency of the LACS. In the figure, the COP and the recovery efficiency have same tendency with prior study [20]. However, since the LACS covers air conditioning for the cold storage rather than the residential area, COP and recovery efficiency values are lower than those in the prior study. This figure also indicates that the system shows better thermodynamic performance at a higher . When the is higher than 100 bar, there are no noticeable changes in the thermodynamic performances. When is 100 bar, , , COP, recovery efficiency, and the exergy efficiency of the LACS are 1.99 ton/h, 107 kW, 0.56, 32%, and 41%, respectively.
Figure 5 and Figure 6 indicate that the high is favorable to make the LACS thermodynamically efficient. However, high operating pressure leads to an increase in equipment costs, thereby causing the system to become economically uncompetitive. Therefore, when the LACS is selected as the energy distribution system, the operating conditions must be determined considering economic aspects.
4.1.3. Exergy Efficiency and Exergy Flow Diagram of the Proposed Supply Chain
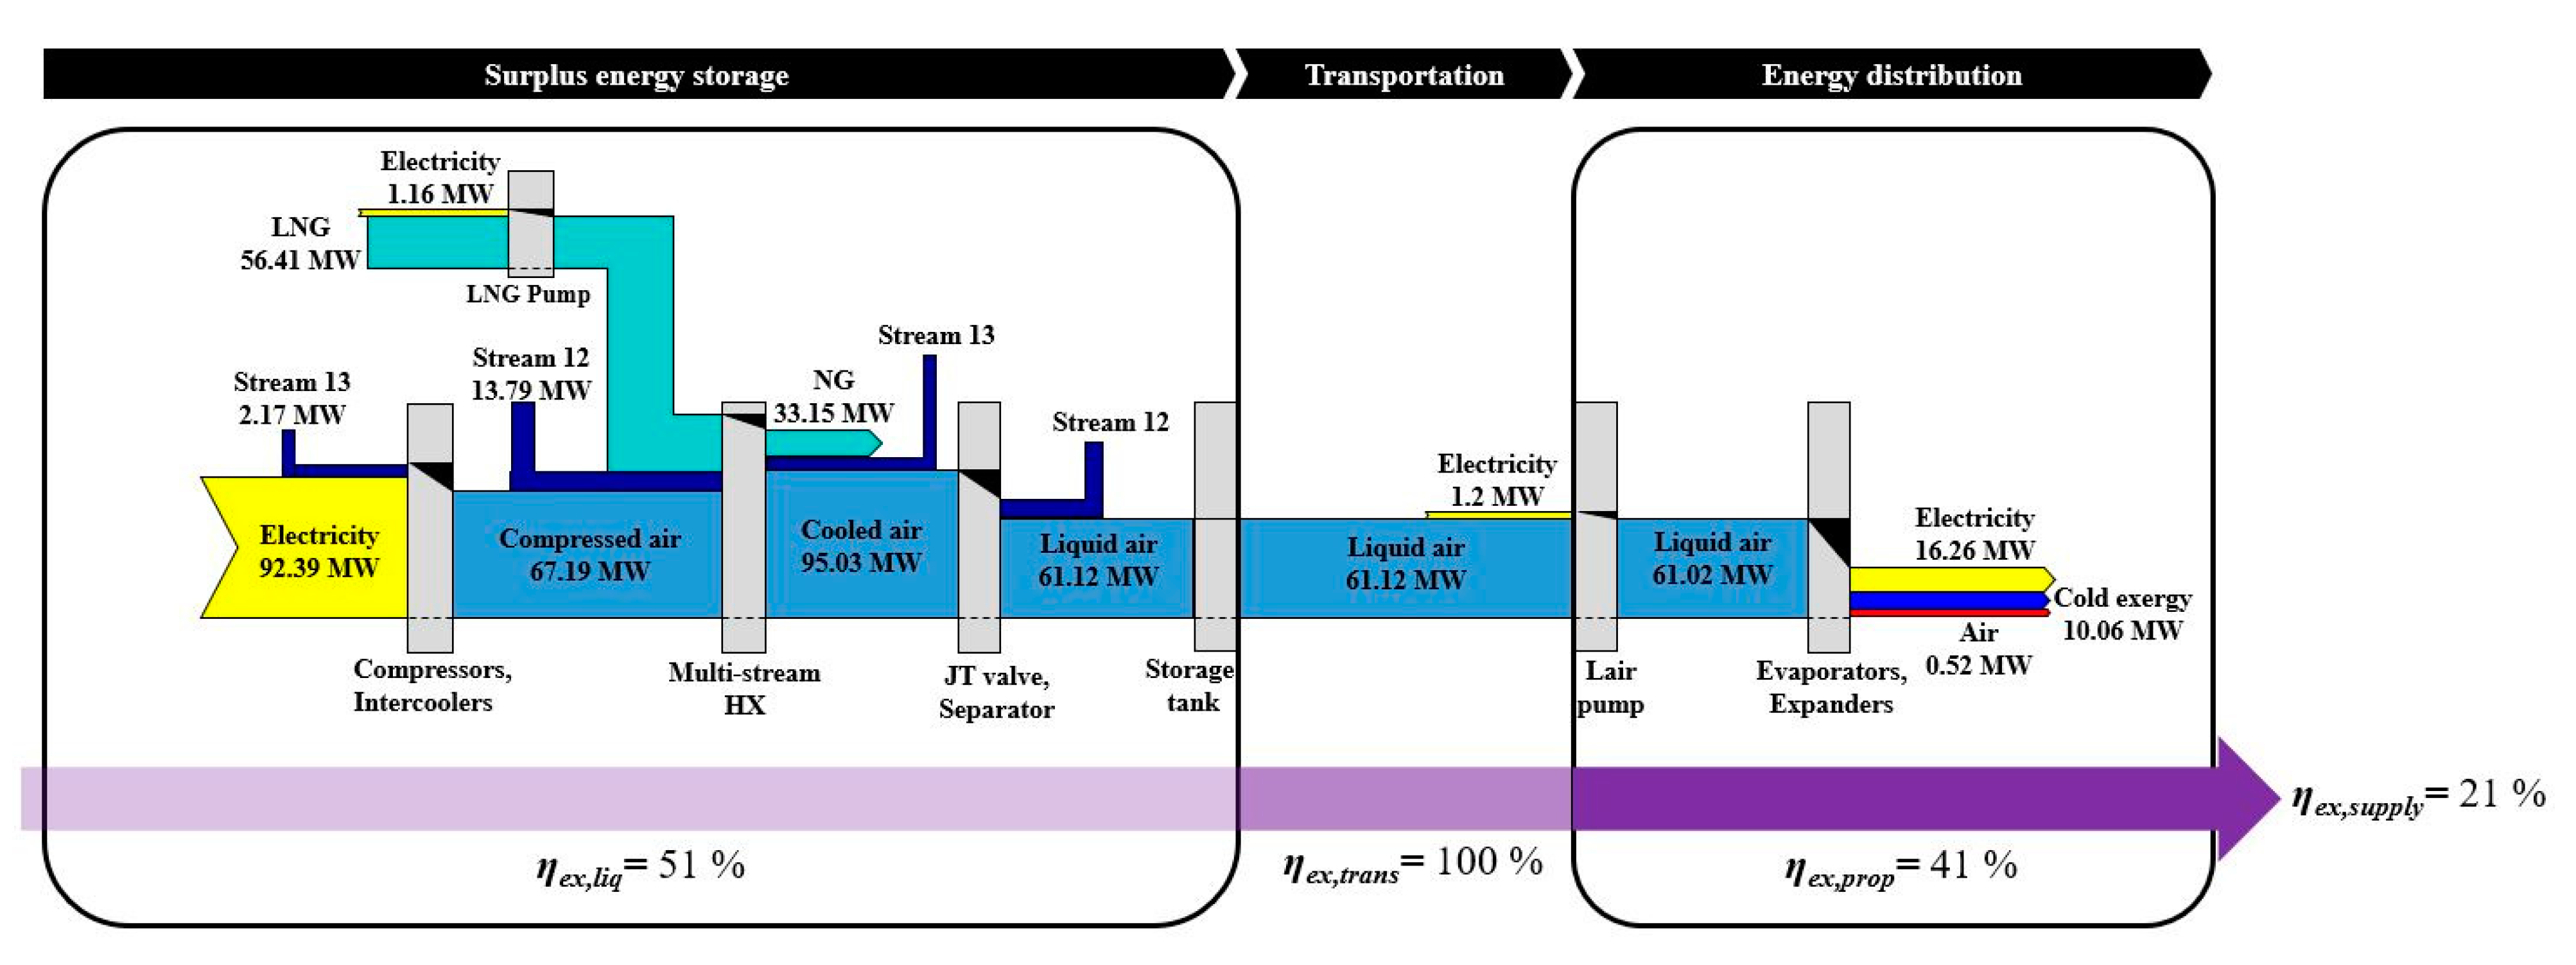
Figure 7 represents the exergy flow diagram of the supply chain. The band width in the diagram indicates the magnitude of exergy flow; the black triangle on each piece of the equipment indicates exergy destruction. The exergy efficiencies of the energy storage, energy transportation, energy distribution, and overall processes are also noted in the graph. In the energy storage process, the air liquefaction system converts 51% of the LNG cold exergy and the surplus electricity into liquid air. In the energy distribution process, 41% of the liquid air exergy is recovered from the evaporators and the expanders. However, when the energy storage and the distribution processes are considered simultaneously, the exergy efficiency of the overall process becomes 22%. A significant amount of useful energy from the LNG cold energy and the electricity are destroyed during the storing and recovering processes.
Understanding exergy flow conditions for each equipment is necessary to improve the efficiency of the overall processes. Table 10 summarizes the detailed exergy flow information for each equipment. Intercoolers, the compressor, and evaporators are major equipment that destroy exergy in the overall process. The first evaporator in the proposed system is the main piece of equipment responsible for the low exergy efficiency of the supply chain. This is because the temperature difference between liquid air and the LACS in the first evaporator is so large that the exergy of liquid air is not recovered effectively. Moreover, constraints on in the air liquefaction system also lower the exergy efficiency of the supply chain.
The exergy flow diagram also helps liquid air become competitive as an energy carrier by indicating potential locations that can improve the supply chain performance. For example, the diagram demonstrates air compression process and liquid air evaporation process are two major locations that can enhance the supply chain efficiency. Changing air liquefaction cycle into Claude cycle or increasing will improve the thermodynamic efficiency of the supply chain. Setting the LACS temperature similar to the boiling point of liquid air can also enhance the performance of the supply chain by preventing significant exergy destruction. Optimization parameters for the supply chain improvement can be selected efficiently by checking the exergy flow diagram.
4.1.4. Case Study: Thermodynamic Comparison between Proposed Supply Chain and NH3/CO2 Cascade Refrigeration System
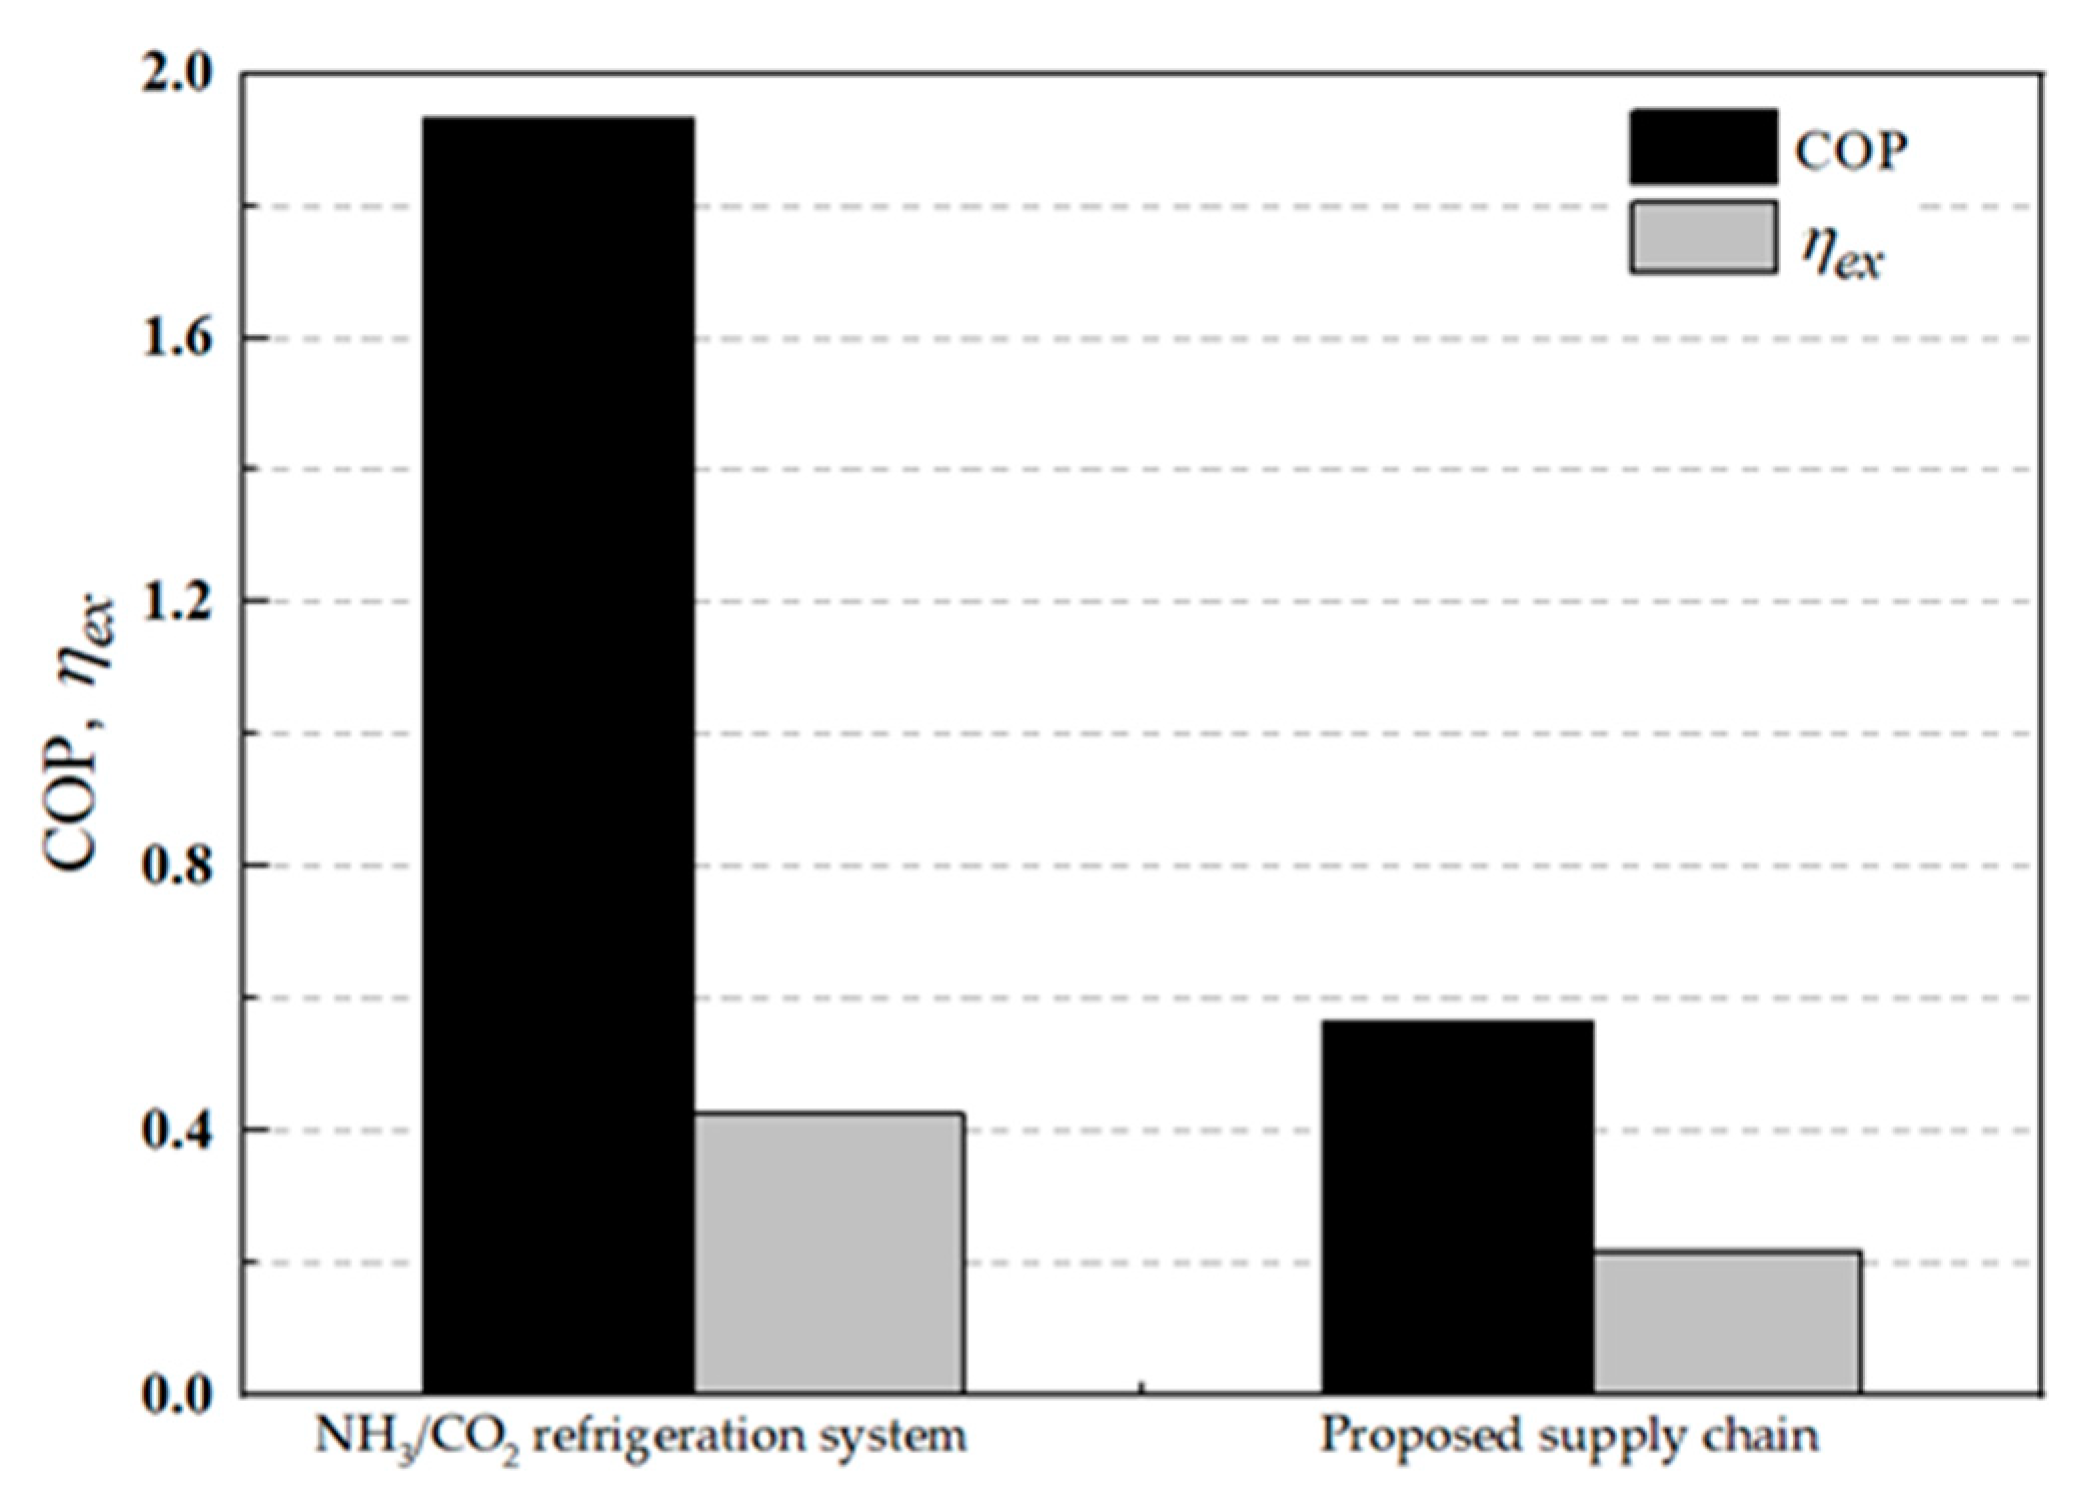
Figure 8 compares the COP and the exergy efficiency of the proposed supply chain and the NH3/CO2 cascade refrigeration system. The COP of the supply chain and the NH3/CO2 system are 0.56 and 1.79, respectively. The exergy efficiencies of the proposed supply chain and the NH3/CO2 system are 22% and 41%, respectively. These results show that the conventional refrigeration system shows better thermodynamic performance than the proposed supply chain. Exergy destruction occurs not only in the energy distribution process but also in the energy storage process in the supply chain. Moreover, the temperature difference between two working fluids at the heat exchangers is so large that the heat transfer occurs inefficiently in the energy distribution process. Therefore, to make the energy distribution system thermodynamically competitive, the operating temperature should be close to the liquid air temperature to prevent a significant amount of exergy destruction.
4.2. Economic Evaluation
4.2.1. Liquid Air Production Cost
Figure 9 shows the liquid air production cost, specific LCC of transportation (LCCtrans), and specific LCC of air liquefaction system (LCCliq). The liquid air production cost is estimated to be 35 USD/ton without considering transportation to the utilization sites. The LCCtrans is proportional to delivery distance, because the total number of trucks is increased to cover liquid air produced during a roundtrip delivery. Moreover, the LCCtrans in Figure 9 does not increase linearly because of the discrete number of trucks for liquid air transportation. The liquid air production cost is the sum of LCCtrans and LCCliq. The production cost varies from 36 to 129 USD/ton, depending on the delivery distance. The deviation from linearity also occurs for the liquid air production cost, which shows the results from the LCCtrans.
4.2.2. LCC of Cold Storage Systems
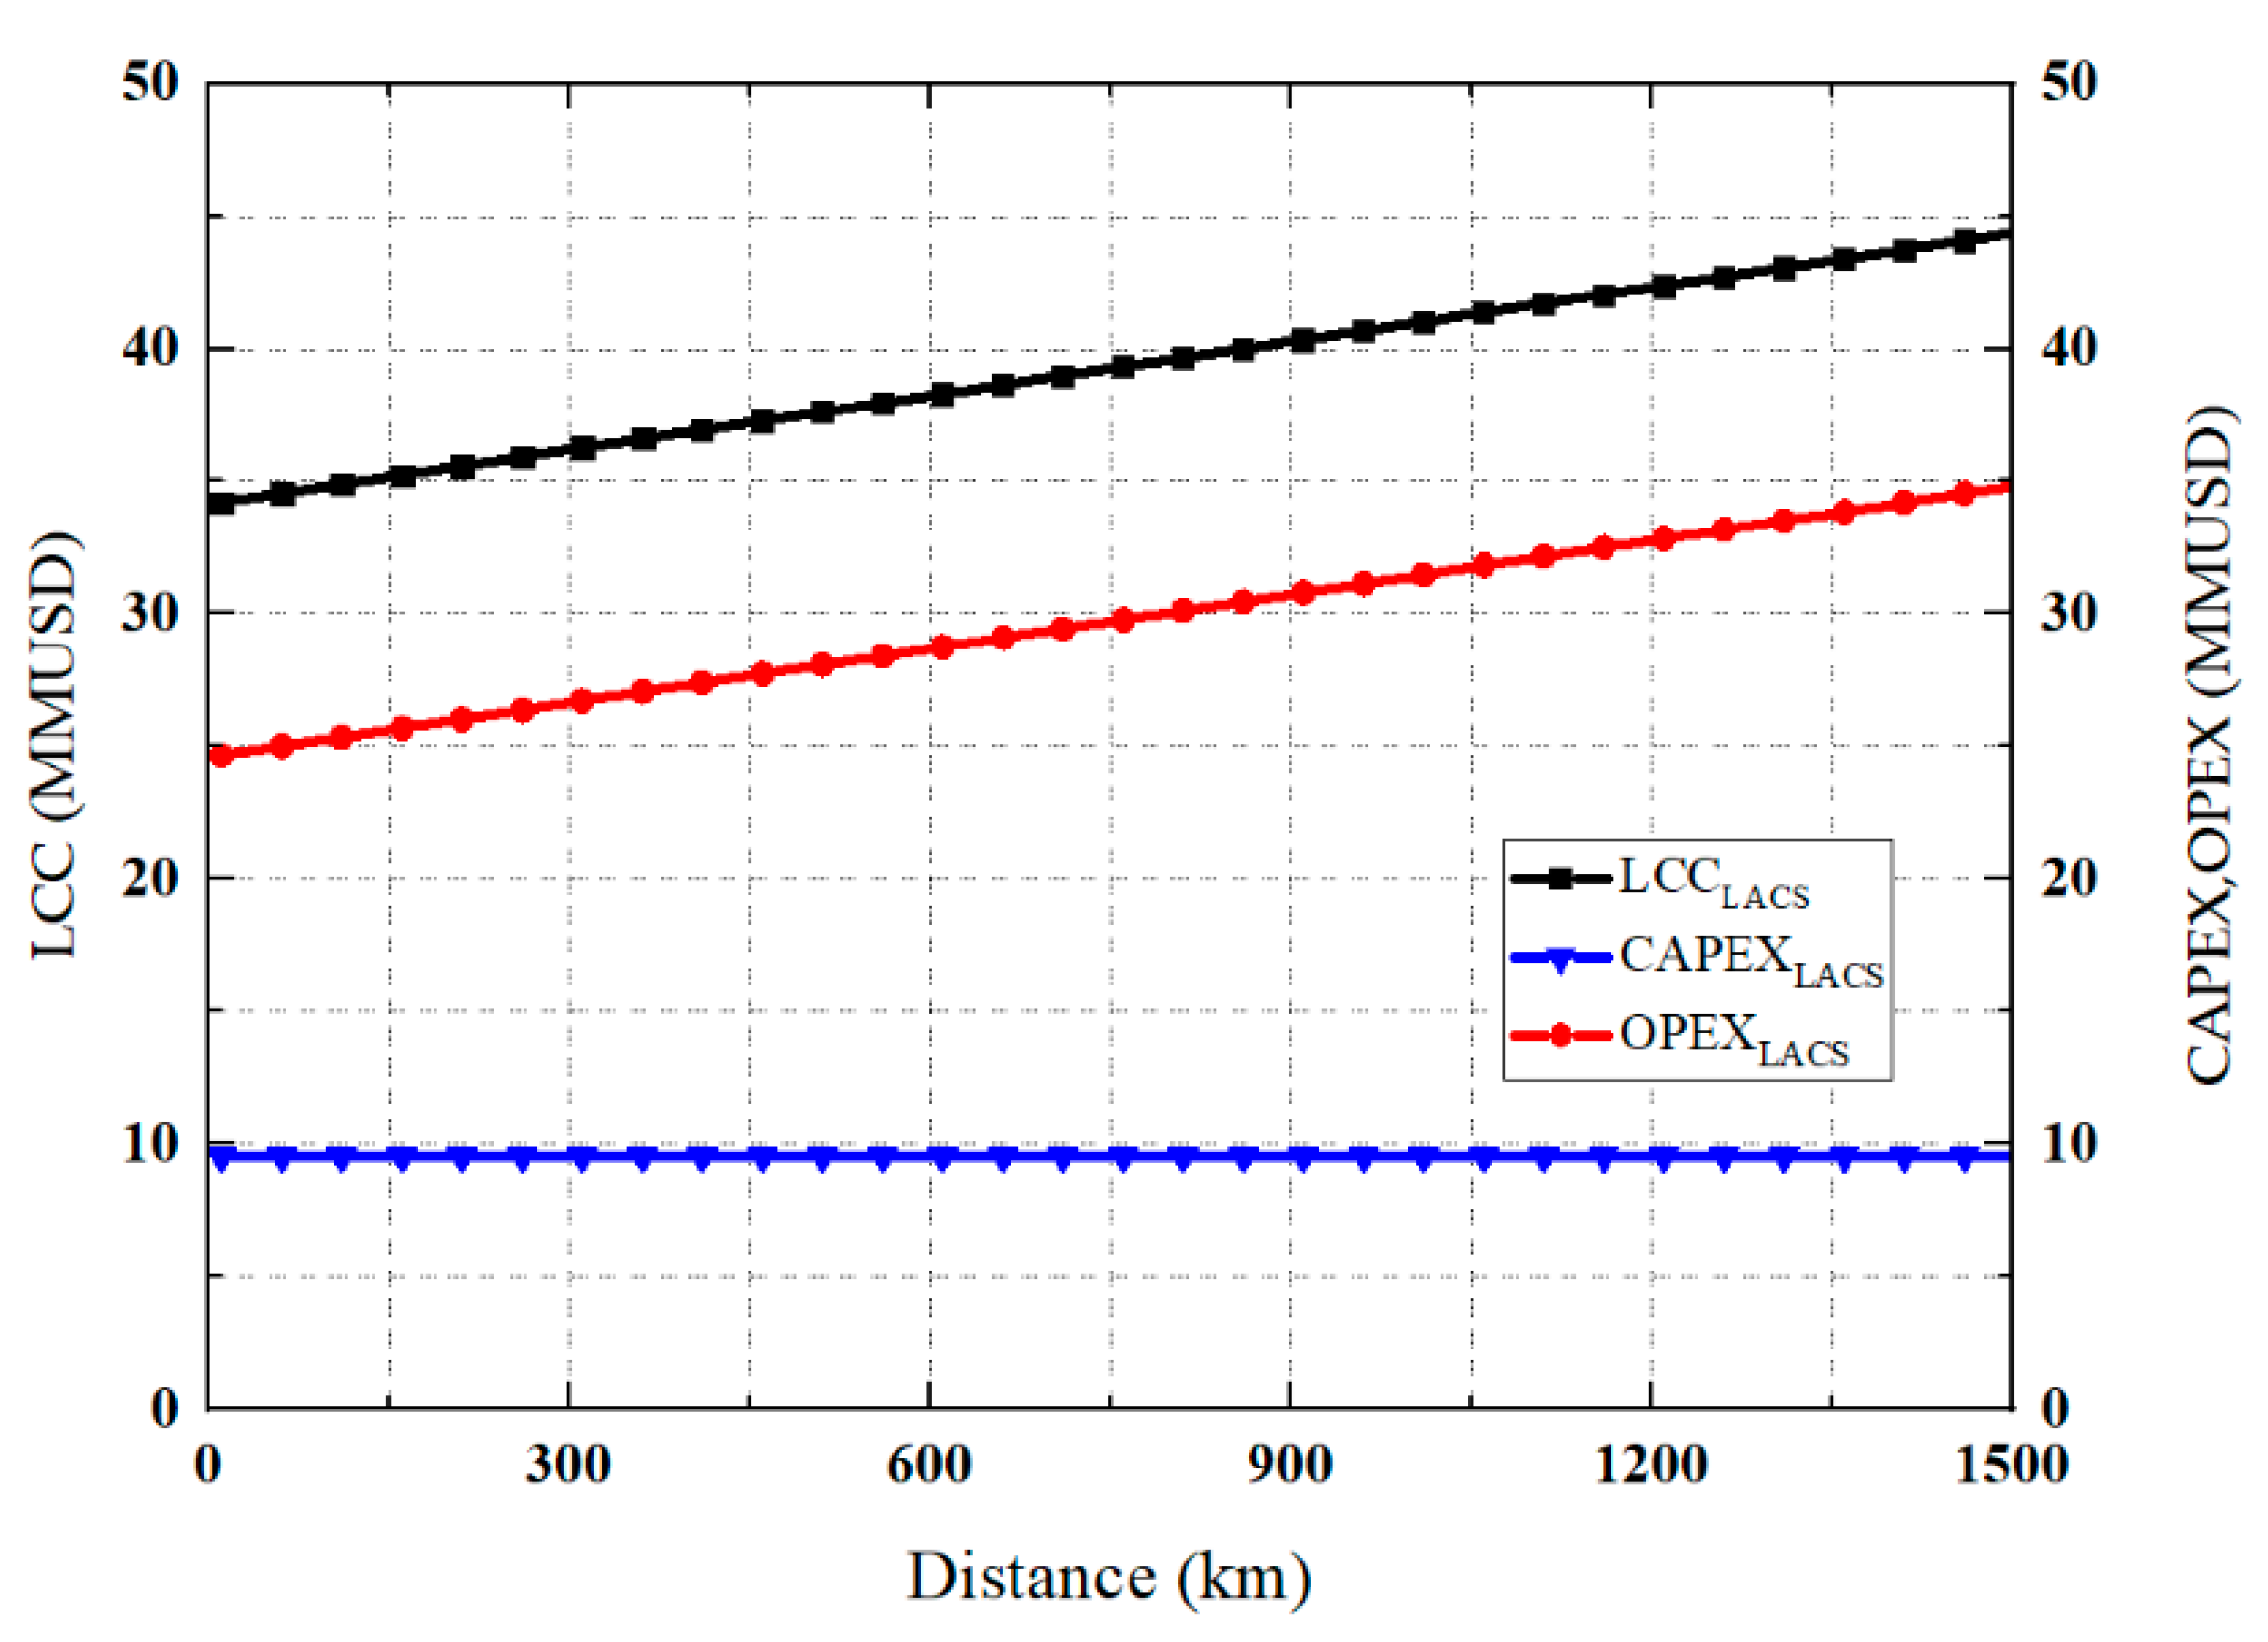
Figure 10 shows the CAPEX, OPEX, and LCC of the LACS. The LCC and OPEX show nonlinear characteristics, which occurs because of a discrete number of trucks. The LCC increases with an increase in liquid air delivery distance. Thus, to make liquid air an economically competitive energy carrier, breakeven distance analysis is necessary. The distance between the energy storage site and energy distribution site should be determined by comparing the LCCs of the LACS and the conventional refrigeration system.
4.2.3. Case Study: LCC Comparison between NH3/CO2 Refrigeration System and LACS
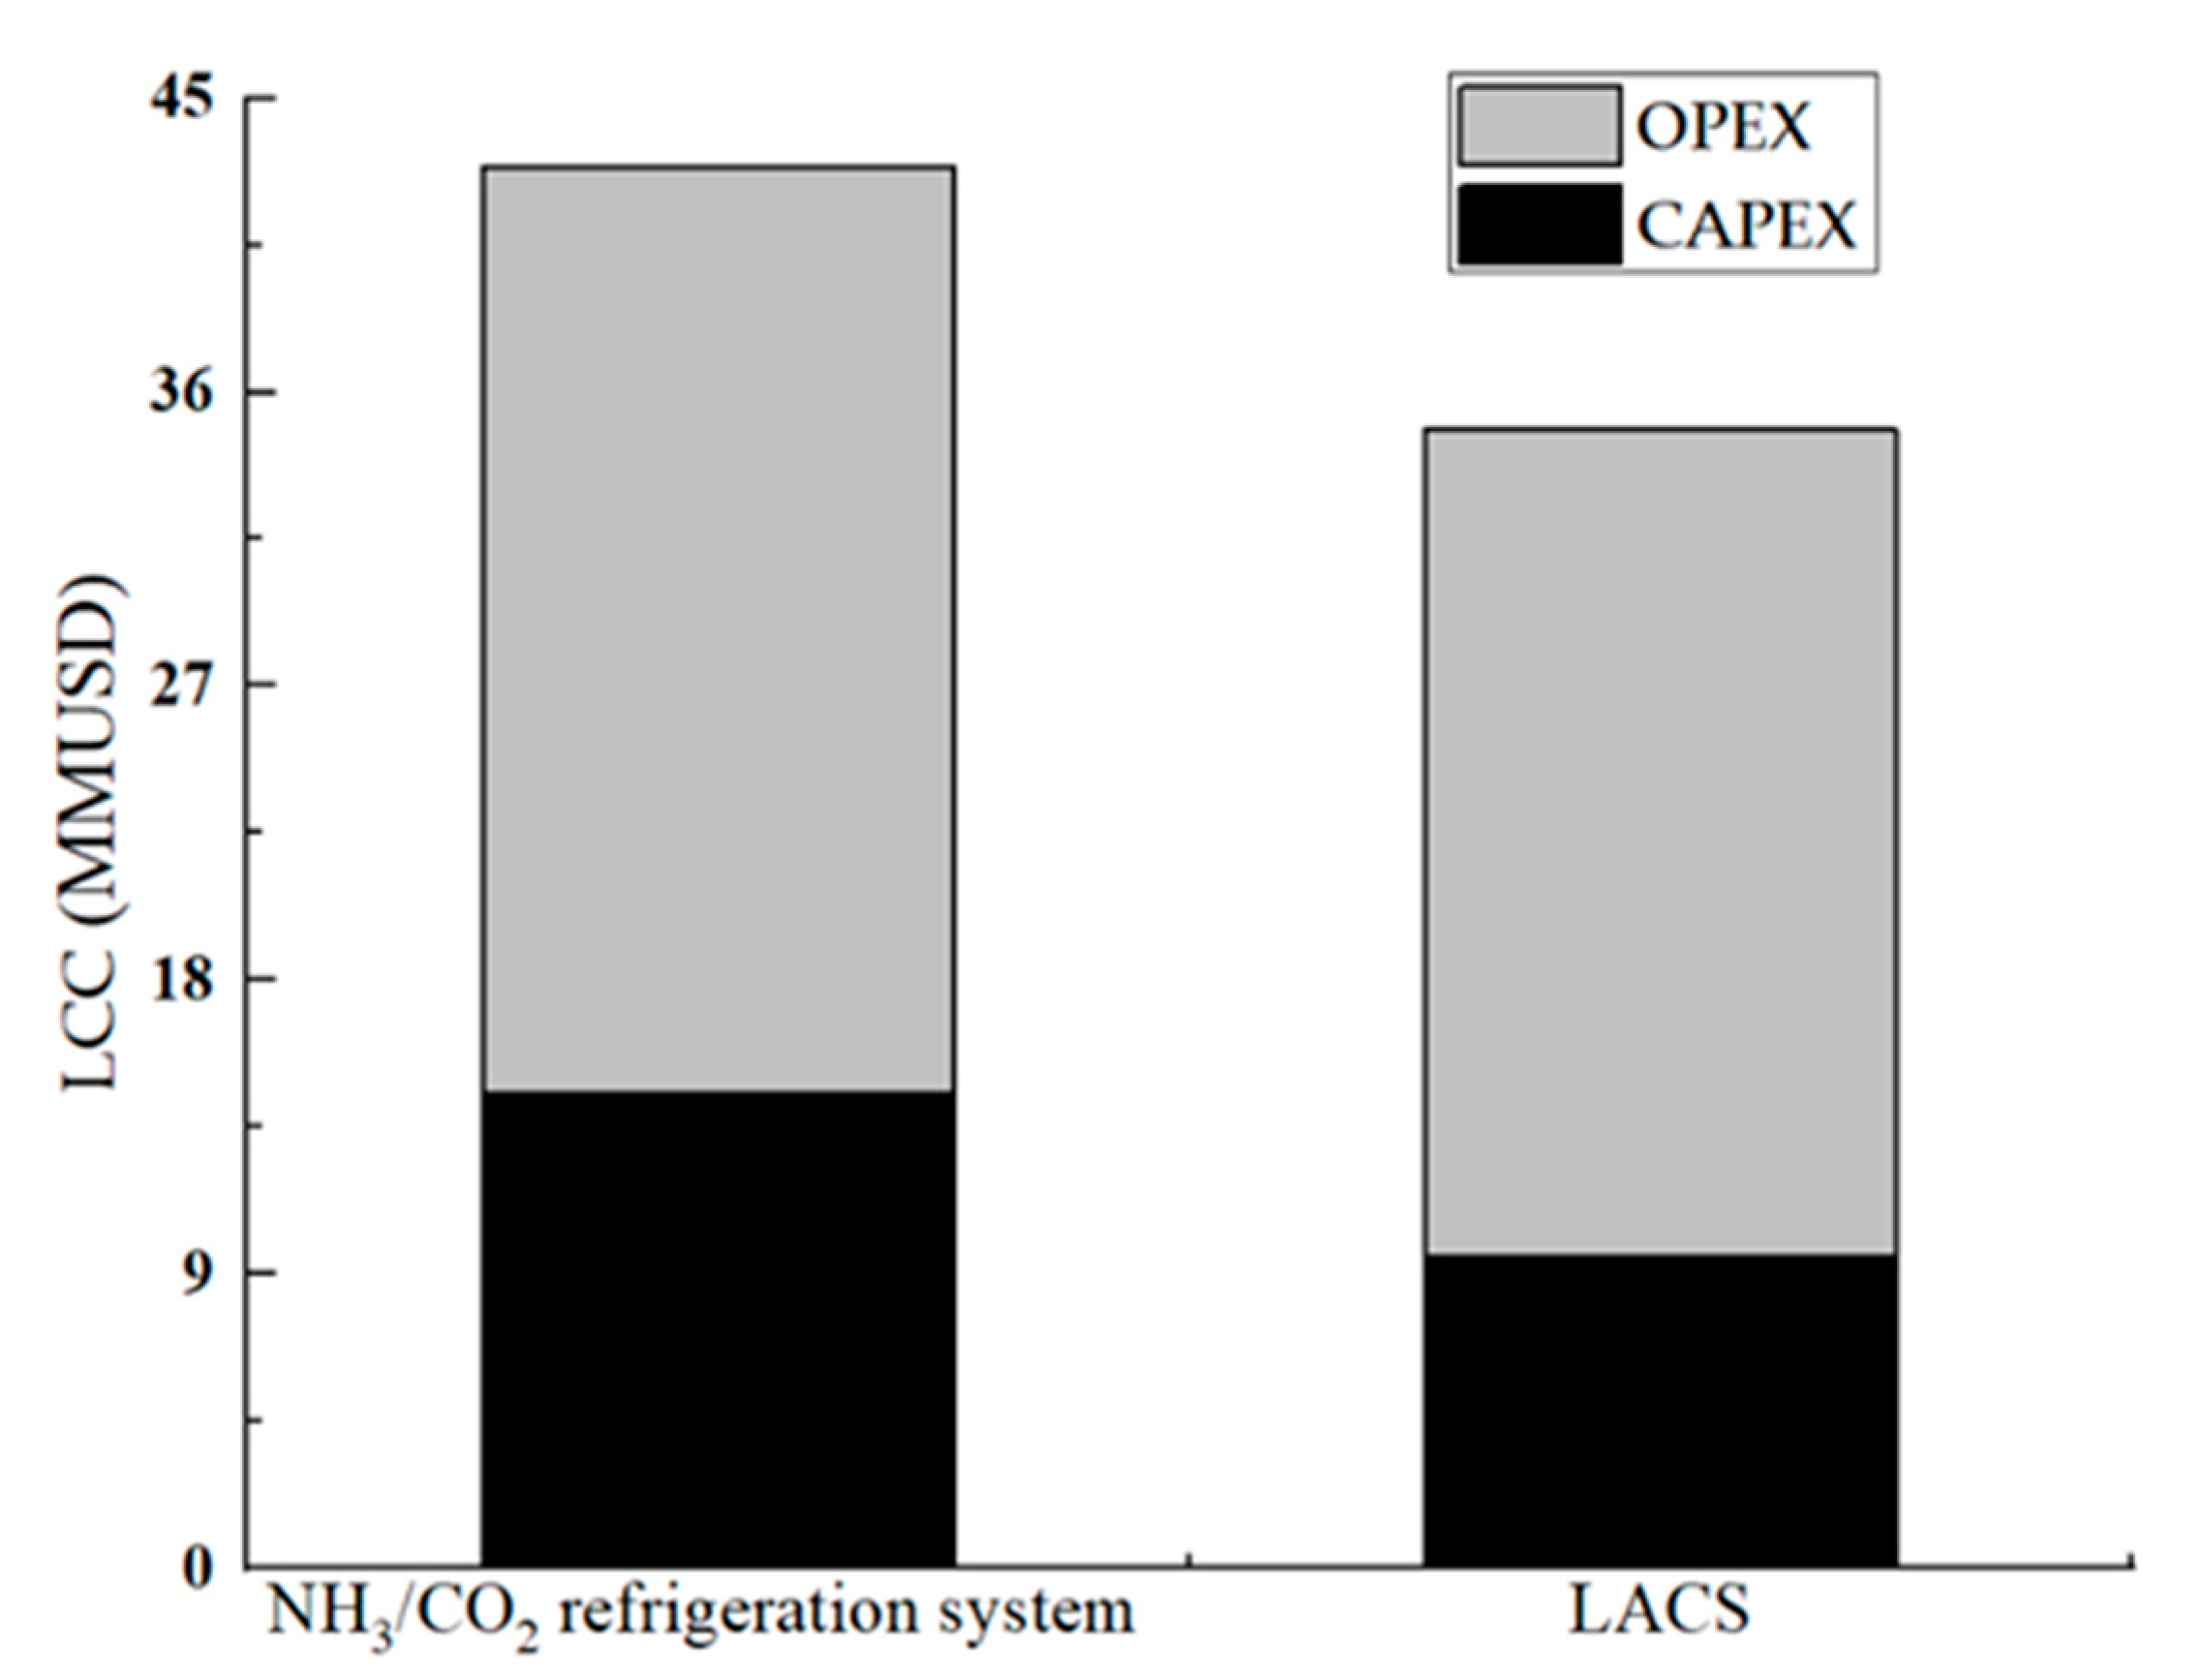
Figure 11 shows the LCC comparison between the NH3/CO2 refrigeration system and the LACS. The LCC of the LACS and NH3/CO2 cascade system are 34.2 MMUSD and 43.1 MMUSD, respectively. The result shows that 19% of the LCC can be reduced in the LACS compared to that in the NH3/CO2 refrigeration system; further, the LACS does not use compressors, which leads to a reduction in the CAPEX compared to the NH3/CO2 refrigeration system. The OPEX of the LACS is higher than that of the conventional system, because the LCC of the air liquefaction system is evaluated as the OPEX in the LACS in terms of liquid air production cost. The reduction in the CAPEX of the LACS results in an overall reduction in LCC, which makes the proposed system more economical than the NH3/CO2 refrigeration system.
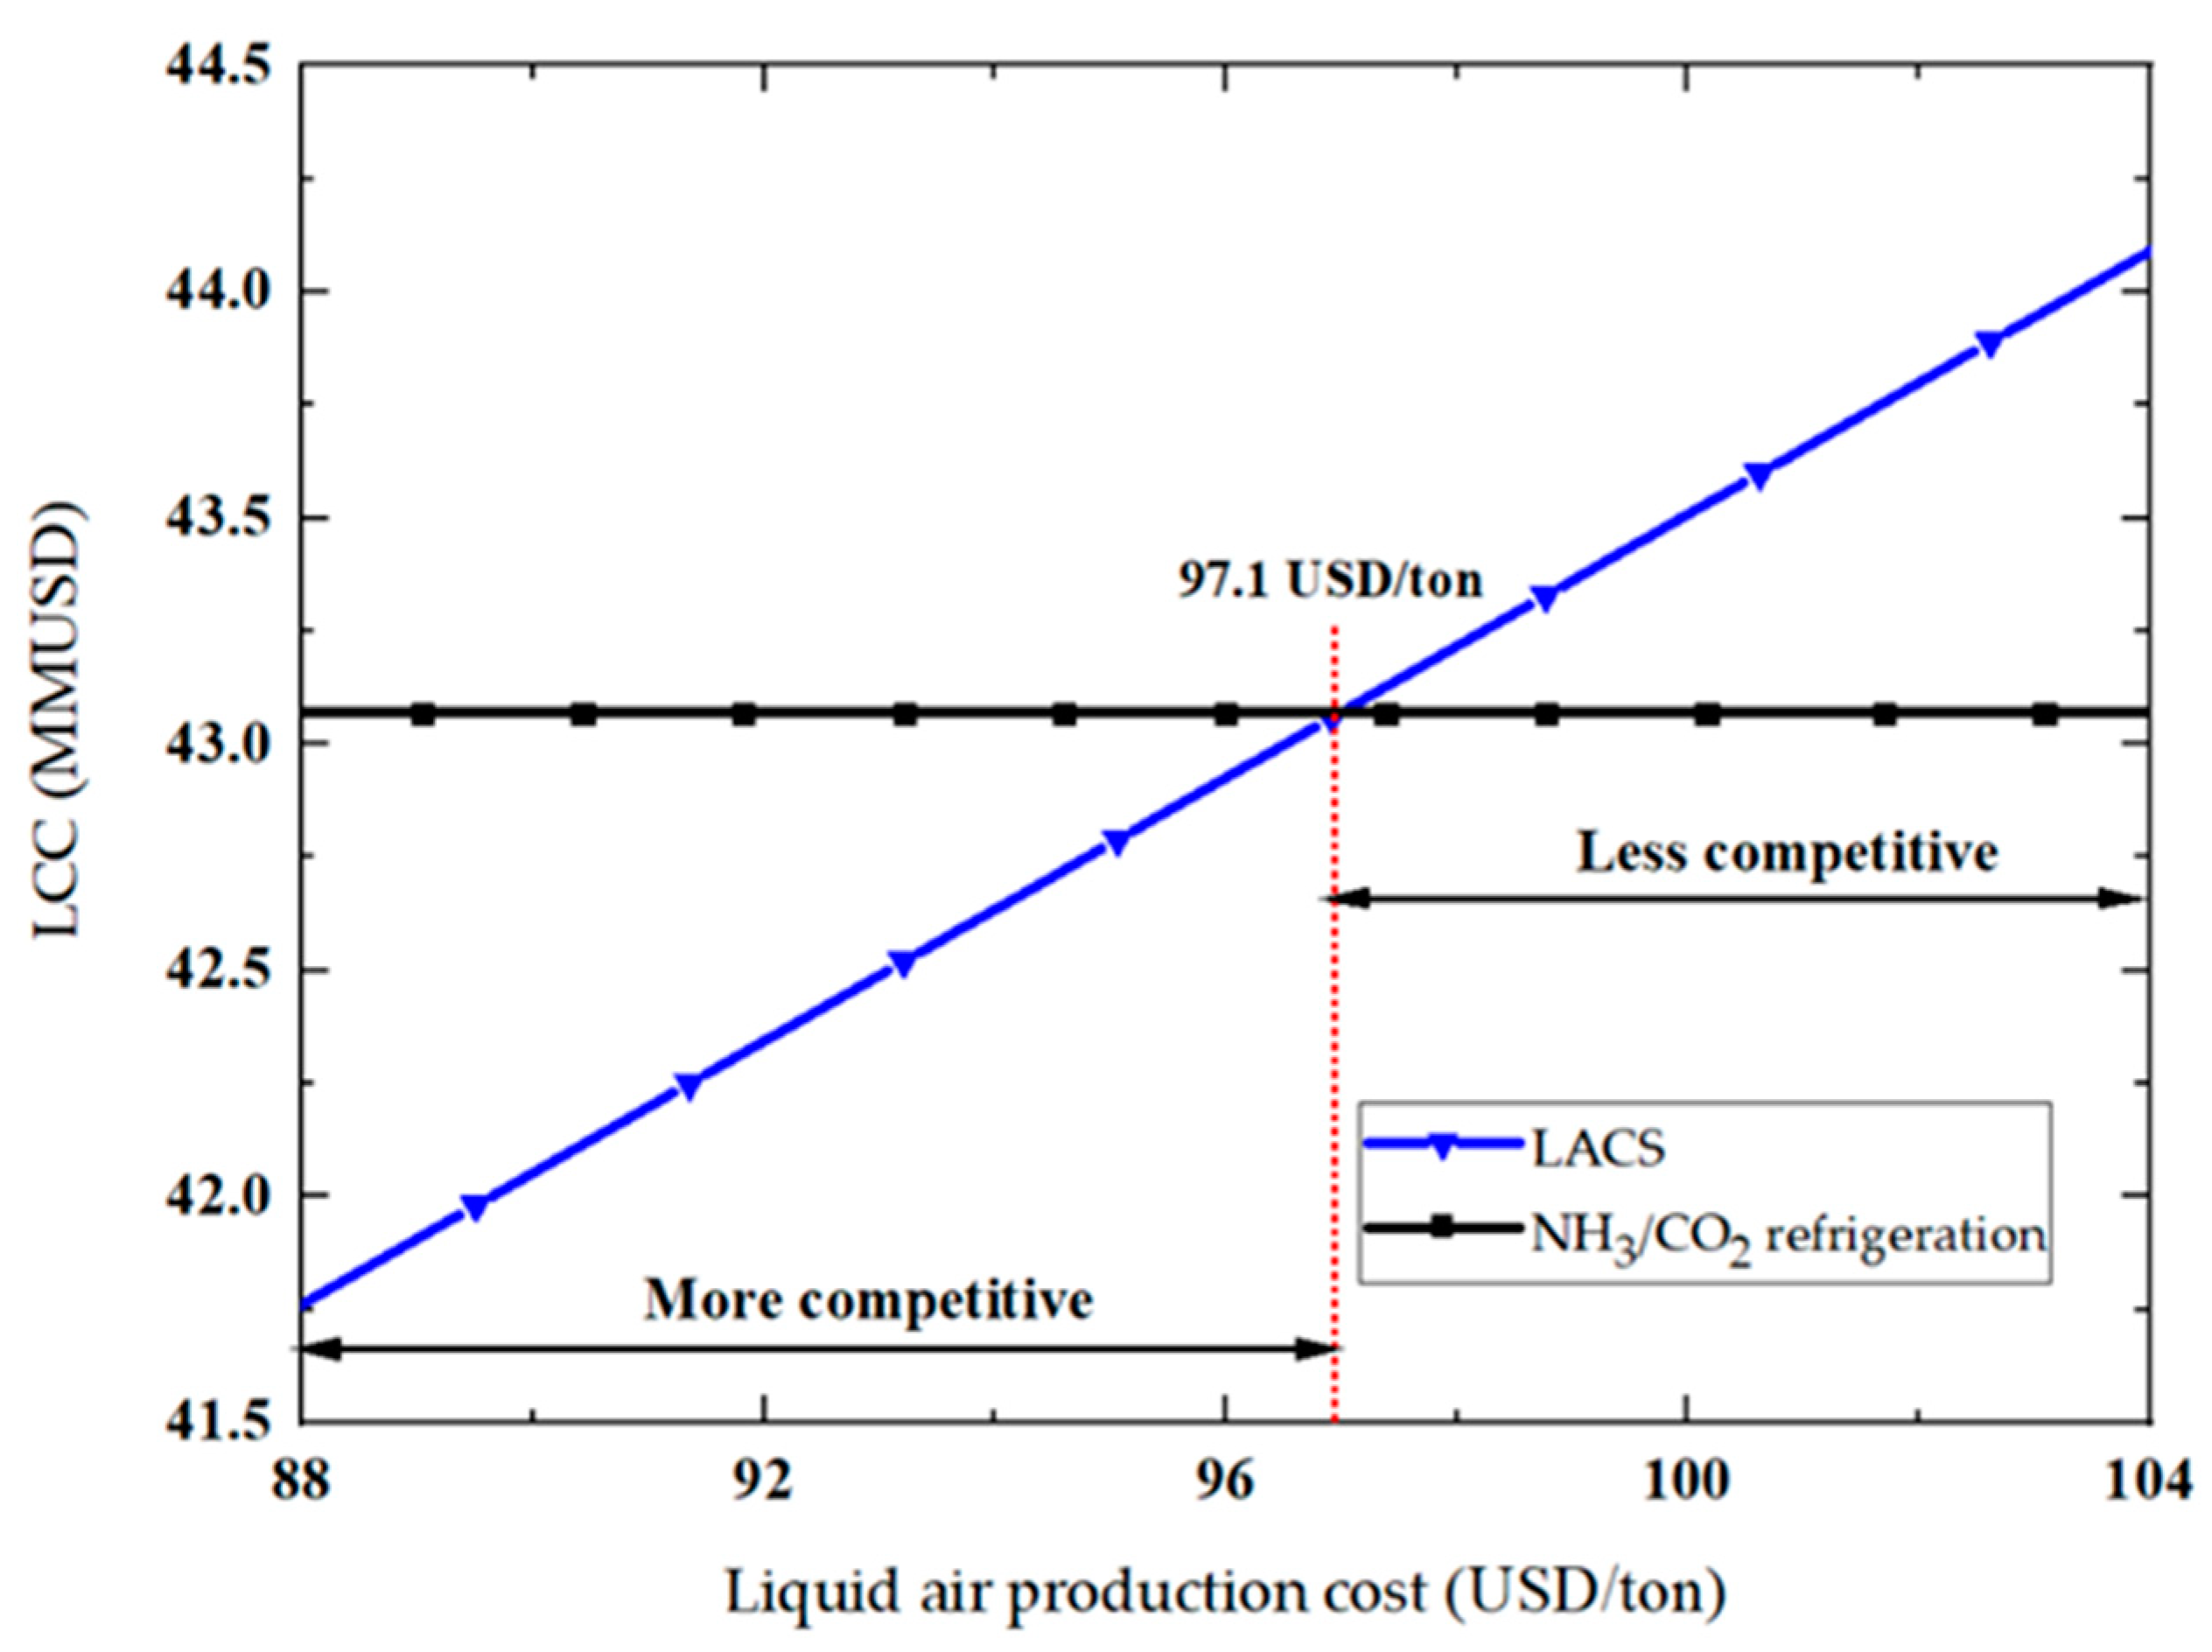
Figure 12 shows the breakeven liquid air production cost. When the liquid air production cost is lower than 95.8 USD/ton, the LACS becomes more competitive than the NH3/CO2 refrigeration system economically. This result indicates that the distance between the proposed system and the air liquefaction system should be less than 1280 km, which implies that surplus energy can be distributed with liquid air in the range of 1280 km.
4.3. Sensitivity Analysis
Design assumptions applied in this study can be changed depending on the operating environment of the system. A sensitivity analysis was performed for evaluating the in the air liquefaction system and the operating time in the LACS. The liquid air production costs for various show the required cost for various sizes of surplus energy storing systems. The LCCs for various operating times of the cold storage system show the economic feasibility compared to the NH3/CO2 refrigeration system. Moreover, an effective distance that liquid air can work as the energy carrier can be determined from the breakeven distance analysis.
Figure 13 shows the liquid air production cost for various , depending on the delivery distance. The production costs are estimated at of 20, 80, 140, and 200 ton/h. The nonlinearity of the liquid air production cost is highlighted when the is decreased; this is because the liquid air production rate decreases so that the discrete number of required trucks can be emphasized. Moreover, the difference in the liquid air production cost is within 1% when the exceeds 80 ton/h. This result implies that liquid air can be supplied without production cost fluctuations, although the LNG mass flow rate can be changed depending on the demand.
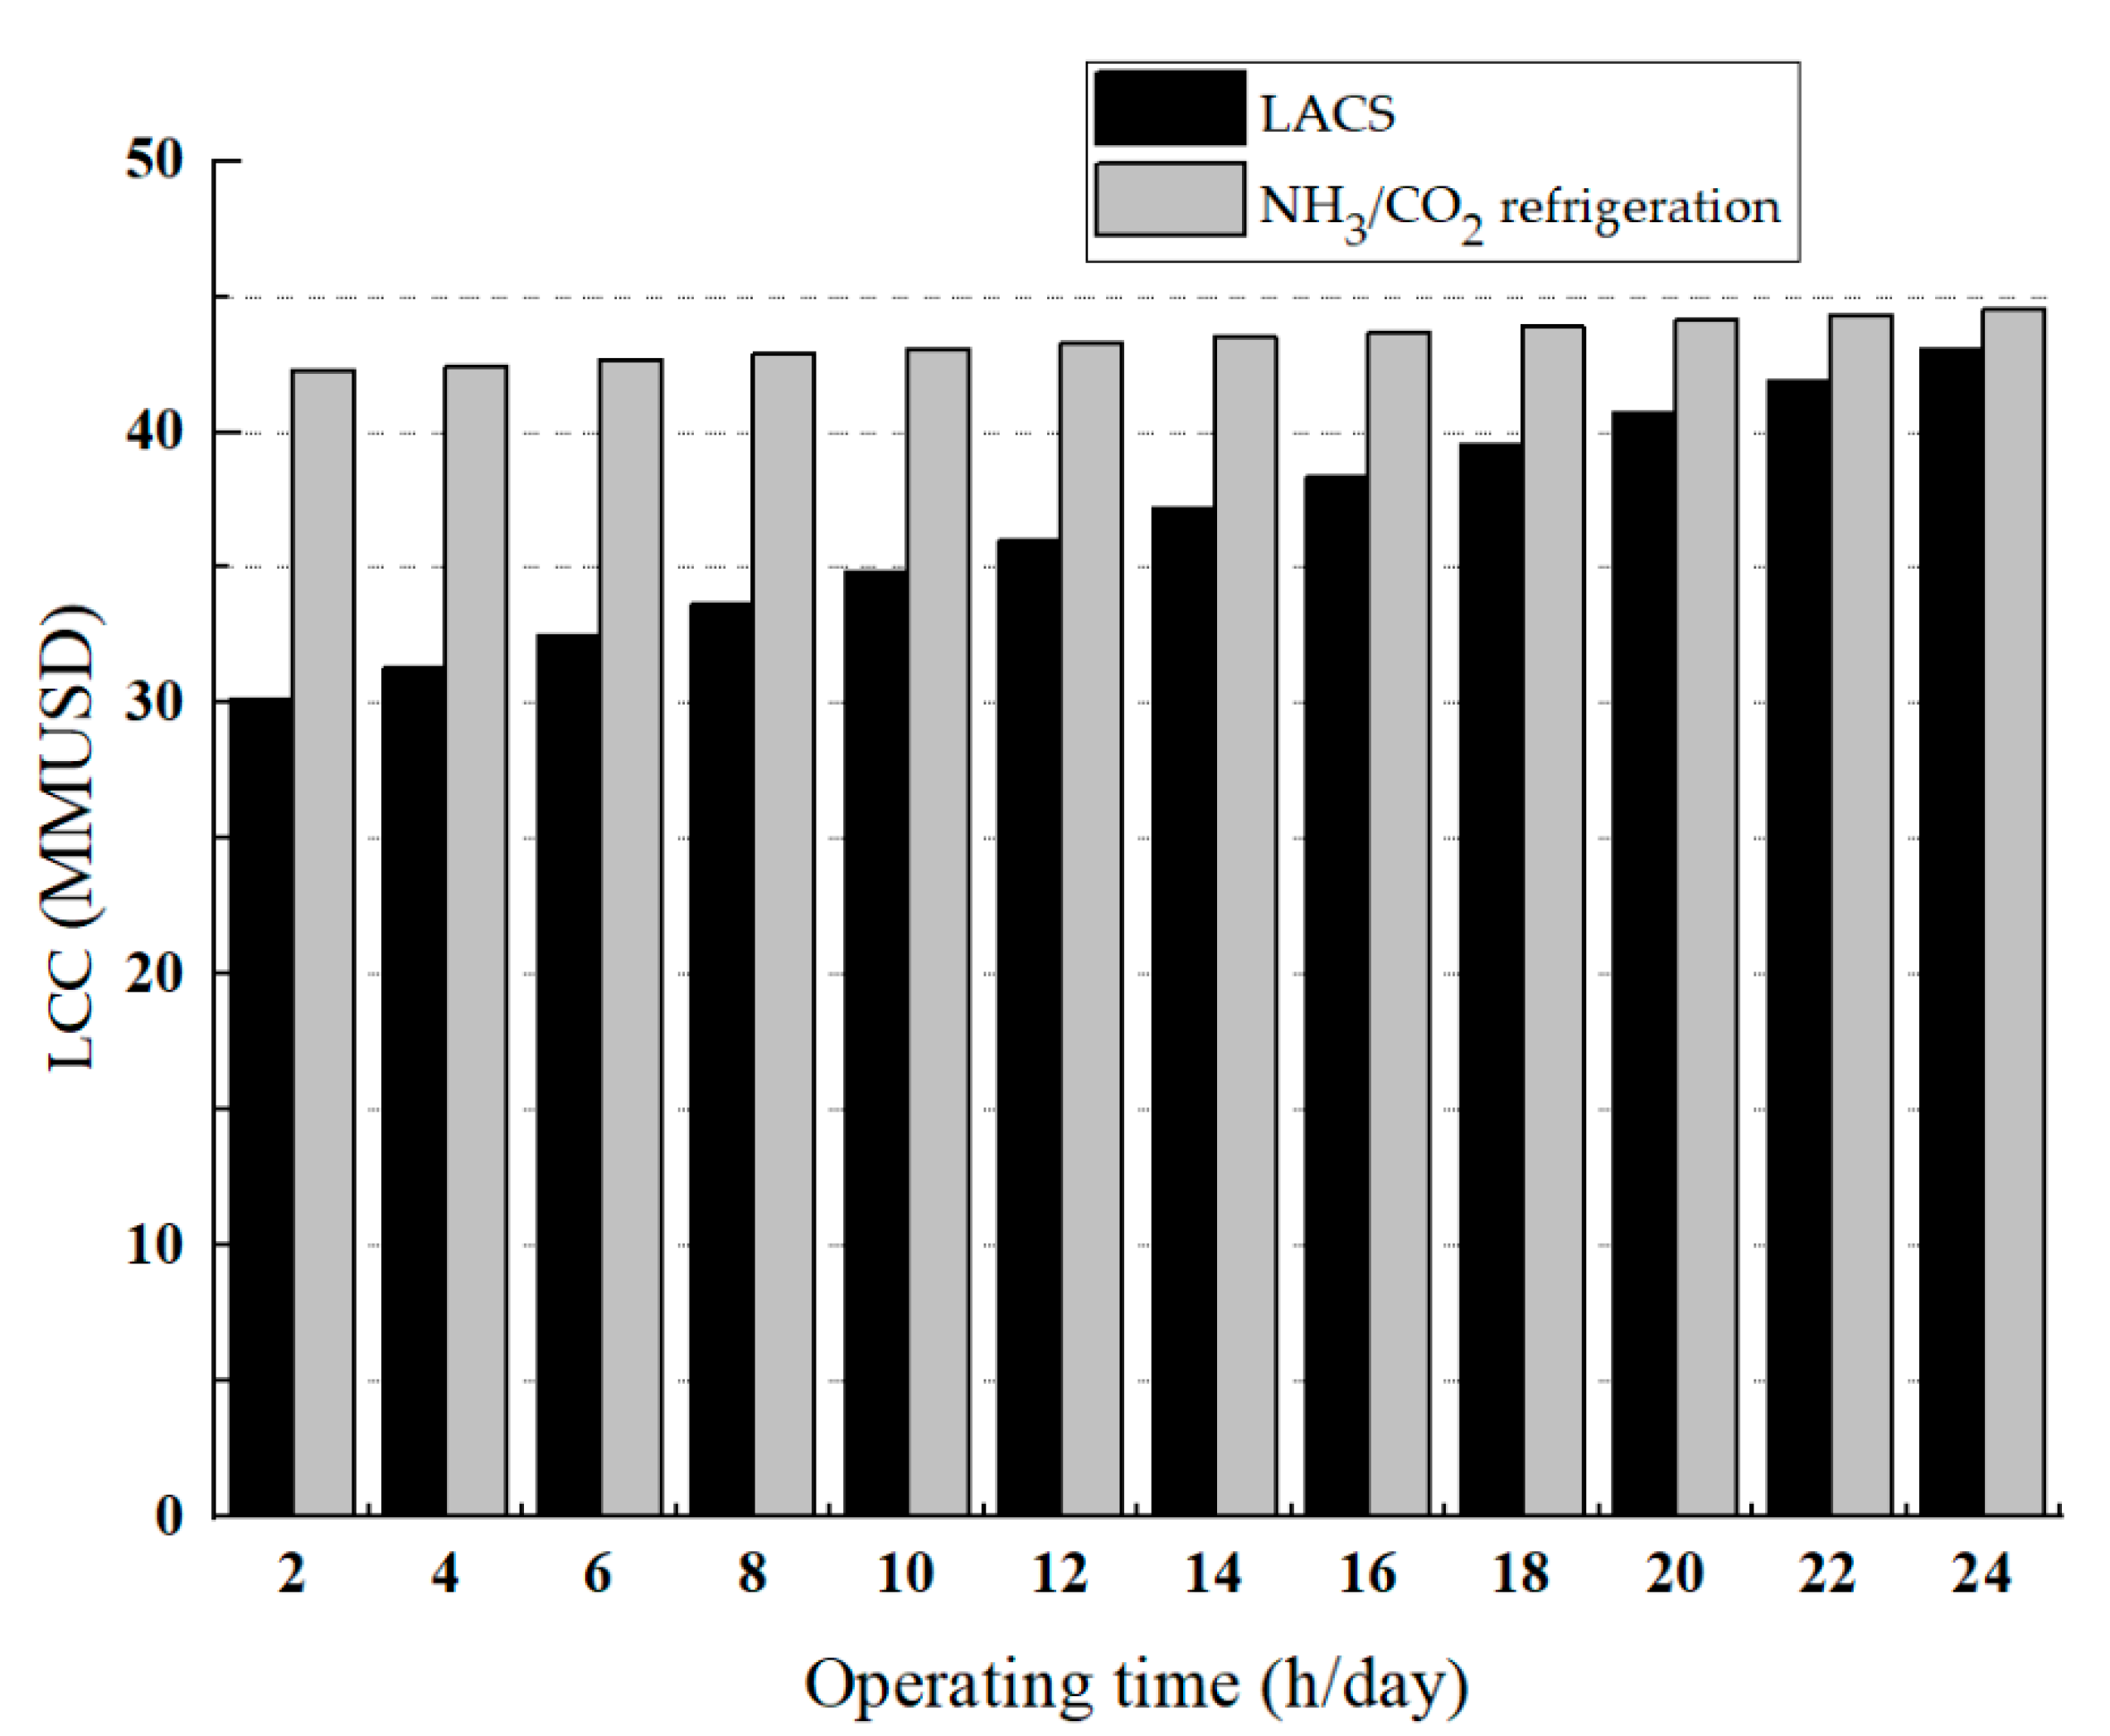
Figure 14 shows the LCC comparison of the NH3/CO2 refrigeration and the LACS with various operating times, when the delivery distance is 100 km. Based on operating time, 3–28% of the LCC can be reduced in the LACS. The LCC reduction rate becomes more significant when the cold storage has a lower daily operating time. When the operating time decreases, the liquid air consumption rate also decreases accordingly. The LCC of the air liquefaction system that the LACS should cover also decreases. Therefore, the LCC of the LACS decreases as the operating time is decreased.
The LACS should be scaled accordingly to satisfy the LCC required for the air liquefaction system. Figure 15 shows the breakeven distances of the LACS with various operating time. The breakeven distances for operating times of 8, 10, and 12 h/day are 990, 1310, and 1780 km, respectively. The breakeven distance is inversely proportional to the daily operating time of the LACS. 16–21% of the LCC is reduced on selected operating time, as shown in Figure 14. The reduction in LCC means that the LACS can afford higher liquid air production cost, thereby the breakeven distance increases. To make liquid air as the energy carrier economically competitive, the delivery distance should be determined carefully by considering the operating time of the LACS.
5. Conclusions
This study proposed a supply chain of cold storage system and demonstrated the potential of using liquid air as an energy carrier. The air liquefaction system for the energy storage and the cold storage system for the energy distribution were conceptually designed. The thermodynamic and economic performances of the designed supply chain was used for its evaluation. The comparative study with the NH3/CO2 refrigeration system was performed as the case study.
In the thermodynamic analysis, the COP, recovery efficiency, and exergy efficiency of the supply chain were 0.56, 32%, and 22%, respectively. The maximum pressure of the multistream heat exchanger in the air liquefaction system restricted the performance of the supply chain. Moreover, the in the LACS did not significantly change the performance of the supply chain after 100 bar, which indicates that there are no reasons to increase the pressure further. The exergy flow diagram of the supply chain showed that only a small amount of the stored exergy was utilized usefully.
As a case study, the proposed supply chain and a conventional NH3/CO2 cold storage system were compared thermodynamically in terms of exergy efficiency and COP. The exergy efficiency and the COP of the supply chain was 37.5%, and 22.9% lower than that of the conventional system, respectively. Both energy storing and distributing processes destroyed a significant amount of stored exergy in liquid air. The results showed that using liquid air as the energy carrier is a challenging process, which causes exergy destruction during the processes.
The proposed supply chain and the conventional system were also compared in terms of their economic performance. The LCC of the air liquefaction system was converted to liquid air production cost, and it was evaluated as the OPEX of the LACS. The liquid air production cost and the LCC of the LACS were 40.4 USD/ton and 34.2 MMUSD, respectively. The LCC of the LACS was 19% lower than that of the NH3/CO2 system. The LACS required less CAPEX than the conventional system, and thus, the proposed system was economically competitive compared to that of the conventional system. The sensitivity analysis showed that the cold storage operating time and the were the two important parameters that makes the proposed supply chain economically competitive.
This study showed that liquid air can be used as an energy carrier for LNG cold energy and electricity. The supply chain was more economically competitive than the conventional refrigeration system. Moreover, the proposed supply chain provides not only cooling but also distributed generation. However, the proposed supply chain becomes competitive only when many LACSs are installed to use the produced liquid air. Further, there are downsides to the fact that the thermodynamic performances of the chain are lower than the conventional refrigeration system. These limitations will be investigated in future works. Various cold energy industry will be focused to improve the thermodynamic efficiencies of the supply chain and installation limitation.
Author Contributions
Conceptualization, J.K.; methodology, S.C. and J.K.; software, S.C.; validation, S.C.; formal analysis, S.C. and J.K.; investigation, S.C.; resources, S.C.; data curation, S.C.; writing—original draft preparation, S.C.; writing—review and editing, J.K.; visualization, S.C.; supervision, J.K. and D.C.; project administration, D.C.; funding acquisition, D.C. All authors have read and agreed to the published version of the manuscript.
Funding
This research was funded by BK21 Plus Program.
Institutional Review Board Statement
Not applicable.
Informed Consent Statement
Not applicable.
Conflicts of Interest
The authors declare no conflict of interest.
References
- De Sisternes, F.J.; Jenkins, J.D.; Botterud, A. The value of energy storage in decarbonizing the electricity sector. Appl. Energy 2016, 175, 368–379. [Google Scholar] [CrossRef] [Green Version]
- American Petroleum Institute (API). Available online: https://www.api.org/oil-and-natural-gas/wells-to-consumer/exploration-and-production/natural-gas/methodology-for-estimating-ghgs-from-lng (accessed on 2 January 2021).
- Chino, K.; Araki, H. Evaluation of energy storage method using liquid air. Heat Transf. Asian Res. 2000, 29, 347–357. [Google Scholar] [CrossRef]
- Morgan, R.E. Liquid air energy storage–From theory to demonstration. Int. J. Environ. Stud. 2016, 73, 469–480. [Google Scholar] [CrossRef]
- Centre for Low Carbon Futures. Available online: https://www.slideshare.net/tswittrig/liquid-airtechnologies-cold-economy-2013 (accessed on 6 January 2021).
- Kroposki, B.; Basso, T.; DeBlasio, R. Microgrid standards and technologies. In Proceedings of the IEEE Power and Energy Society General Meeting, Pittsburgh, CA, USA, 20–24 July 2008; pp. 1–4. [Google Scholar] [CrossRef]
- Faisal, M.; Hannan, M.A.; Ker, P.J.; Hussain, A.; Mansor, M.B.; Blaabjerg, F. Review of energy storage system technologies in microgrid applications: Issues and challenges. IEEE Acc. 2018, 6, 35143–35164. [Google Scholar] [CrossRef]
- Kanellos, F.D.; Tsouchnikas, A.I.; Hatziargyriou, N.D. Micro-grid simulation during grid-connected and islanded modes of operation. In Proceedings of the International Conference on Power Systems Transients, Montreal, QC, Canada, 19–23 June 2005. Paper No. IPST05–113. [Google Scholar]
- Patrao, I.; Figueres, E.; Garcerá, G.; González-Medina, R. Microgrid architectures for low-voltage distributed generation. Renew. Sustain. Energy Rev. 2015, 43, 415–424. [Google Scholar] [CrossRef]
- Aghamohammadi, M.R.; Abdolahinia, H. A new approach for optimal sizing of battery energy storage system for primary frequency control of islanded microgrid. Int. J. Electr. Power Energy Syst. 2014, 54, 325–333. [Google Scholar] [CrossRef]
- Kishimoto, K.; Hasegawa, K.; Asano, T. Development of generator of liquid air storage energy system. Mitsubishi Juko Giho 1998, 35, 60–63. [Google Scholar]
- Guizzi, G.L.; Manno, M.; Tolomei, L.M.; Vitali, R.M. Thermodynamic analysis of a liquid air energy storage system. Energy 2015, 93, 1639–1647. [Google Scholar] [CrossRef] [Green Version]
- Morgan, R.; Nelmes, S.; Gibson, E.; Brett, G. Liquid air energy storage–Analysis and first results from a pilot scale demonstration plant. Appl. Energy 2015, 137, 845–853. [Google Scholar] [CrossRef]
- Sciacovelli, A.; Vecchi, A.; Ding, Y. Liquid air energy storage (LAES) with packed bed cold thermal storage–From component to system level performance through dynamic modelling. Appl. Energy 2017, 190, 84–98. [Google Scholar] [CrossRef] [Green Version]
- She, X.; Peng, X.; Nie, B.; Leng, G.; Zhang, X.; Weng, L.; Tong, L.; Zheng, L.; Wang, L.; Ding, Y. Enhancement of round trip efficiency of liquid air energy storage through effective utilization of heat of compression. Appl. Energy 2017, 206, 1632–1642. [Google Scholar] [CrossRef]
- Borri, E.; Tafone, A.; Romagnoli, A.; Comodi, G. A preliminary study on the optimal configuration and operating range of a “microgrid scale” air liquefaction plant for Liquid Air Energy Storage. Energy Convers. Manag. 2017, 143, 275–285. [Google Scholar] [CrossRef]
- Antonelli, M.; Barsali, S.; Desideri, U.; Giglioli, R.; Paganucci, F.; Pasini, G. Liquid air energy storage: Potential and challenges of hybrid power plants. Appl. Energy 2017, 194, 522–529. [Google Scholar] [CrossRef]
- Kim, J.; Noh, Y.; Chang, D. Storage system for distributed-energy generation using liquid air combined with liquefied natural gas. Appl. Energy 2018, 212, 1417–1432. [Google Scholar] [CrossRef]
- Ahmad, A.; Al-Dadah, R.; Mahmoud, S. Air conditioning and power generation for residential applications using liquid nitrogen. Appl. Energy 2016, 184, 630–640. [Google Scholar] [CrossRef]
- Ahmad, A.; Al-Dadah, R.; Mahmoud, S. Liquid air utilization in air conditioning and power generating in a commercial building. J. Clean. Prod. 2017, 149, 773–783. [Google Scholar] [CrossRef] [Green Version]
- Sung, T.; Kim, K.C. LNG cold energy utilization technology. In Energy Solutions to Combat Global Warming; Springer: Cham, Germany, 2017; pp. 47–66. [Google Scholar] [CrossRef]
- Li, S.; Wang, B.; Dong, J.; Jiang, Y. Thermodynamic analysis on the process of regasification of LNG and its application in the cold warehouse. Therm. Sci. Eng. Prog. 2017, 4, 1–10. [Google Scholar] [CrossRef]
- Yang, K.H.; Wu, S.C. Design analysis of a refrigerated warehouse using LNG cold energy. Int. J. Arch. Sci. 2003, 4, 14–23. [Google Scholar]
- Lian, J.; Xia, B.; Yin, Y.; Yang, G.; Yang, Y.; Gou, X.; Wang, E.; Liu, L.; Wu, J. Research on high efficient utilization of LNG cold energy. In Proceedings of the 4th International Conference on Computer, Mechatronics, Control and Electric Engineering, Hangzhou, China, 28–29 September 2015; pp. 283–287. [Google Scholar] [CrossRef] [Green Version]
- Dispenza, C.; Dispenza, G.; La Rocca, V.; Panno, G. Exergy recovery in regasification facilities—A cold utilization: A modular unit. Appl. Therm. Eng. 2009, 29, 3595–3608. [Google Scholar] [CrossRef] [Green Version]
- Zhang, T.; Chen, L.; Zhang, X.; Mei, S.; Xue, X.; Zhou, Y. Thermodynamic analysis of a novel hybrid liquid air energy storage system based on the utilization of LNG cold energy. Energy 2018, 155, 641–650. [Google Scholar] [CrossRef]
- Peng, X.; She, X.; Li, C.; Luo, Y.; Zhang, T.; Li, Y.; Ding, Y. Liquid air energy storage flexibly coupled with LNG regasification for improving air liquefaction. Appl. Energy 2019, 250, 1190–1201. [Google Scholar] [CrossRef]
- Lee, I.; You, F. Systems design and analysis of liquid air energy storage from liquefied natural gas cold energy. Appl. Energy 2019, 242, 168–180. [Google Scholar] [CrossRef]
- Sohn, Y.; Yang, Y.; Yoon, I.; Choi, G. Basic design of Pyeongtaek LNG receiving terminal-II of Korea gas corporation. In Proceedings of the Gastech, Bilbao, Spain, 14–17 March 2005; pp. 1–7. [Google Scholar]
- Jang, N.; Shin, M.W.; Choi, S.H.; Yoon, E.S. Dynamic simulation and optimization of the operation of boil-off gas compressors in a liquefied natural gas gasification plant. Korean J. Chem. Eng. 2011, 28, 1166–1171. [Google Scholar] [CrossRef]
- Kim, J.; Seo, Y.; Chang, D. Economic evaluation of a new small-scale LNG supply chain using liquid nitrogen for natural-gas liquefaction. Appl. Energy 2016, 182, 154–163. [Google Scholar] [CrossRef]
- Yin, Q.S.; Li, H.Y.; Fan, Q.H.; Jia, L.X. Economic analysis of mixed-refrigerant cycle and nitrogen expander cycle in small scale natural gas liquefier. AIP Conf. Proc. 2008, 985, 1159–1165. [Google Scholar] [CrossRef]
- Cui, L.; Kim, Y.J.; Kim, C. Estimation model of electric energy consumption on logistics center based on thermodynamics theory. J. Korea Acad. Ind. Coop. Soc. 2015, 16, 6799–6806. [Google Scholar] [CrossRef] [Green Version]
- Bjork, A.; Kongstad, C.S. Conditions for Design and Control of Refrigeration Systems in Fish Processing Plants. Master’s Thesis, Chalmers University of Technology, Göteborg, Sweden, 2006. [Google Scholar]
- Mosaffa, A.H.; Farshi, L.G.; Ferreira, C.A.I.; Rosen, M.A. Exergoeconomic and environmental analyses of CO2/NH3 cascade refrigeration systems equipped with different types of flash tank intercoolers. Energy Convers. Manag. 2016, 117, 442–453. [Google Scholar] [CrossRef] [Green Version]
- Messineo, A. R744-R717 Cascade refrigeration system: Performance evaluation compared with a HFC two-stage system. Energy Procedia 2012, 14, 56–65. [Google Scholar] [CrossRef] [Green Version]
- Querol, E.; Gonzalez-Regueral, B.; Perez-Benedito, J.L. Practical Approach to Exergy and Thermoeconomic Analyses of Industrial Processes; Springer Science & Business Media: Berlin, Germany, 2012; ISBN 978-1-4471-4622-3. [Google Scholar] [CrossRef]
- Peters, M.S.; Timmerhaus, K.D.; West, R.E. Plant Design and Economics for Chemical Engineers; McGraw-Hill: New York, NY, USA, 1968; ISBN 978-0-0723-9266-1. [Google Scholar]
- Lee, B.; Chae, H.; Choi, N.; Moon, C.; Moon, S.; Lim, H. Economic evaluation with sensitivity and profitability analysis for hydrogen production from water electrolysis in Korea. Int. J. Hydrogen Energy 2017, 42, 6462–6471. [Google Scholar] [CrossRef]
- Linde Group. Available online: https://www.linde-engineering.com/en/images/30160_LE_Manufacturing_PFHE_brochure_update_RZ_VIEW_tcm19-406598.pdf (accessed on 2 January 2021).
Figure 1.
Schematic of the overall supply chain and the proposed supply chain.

Figure 2.
Process flow diagram of the air liquefaction system.

Figure 3.
Process flow diagram for the LACS.

Figure 4.
Specific power consumption, liquid yield, and exergy efficiency of the air liquefaction system.
Figure 4.
Specific power consumption, liquid yield, and exergy efficiency of the air liquefaction system.

Figure 5.
Liquid air consumption rate and power generation of the LACS.

Figure 6.
Thermodynamic efficiencies of the LACS.

Figure 7.
Exergy flow diagram for the supply chain.

Figure 8.
COP and exergy efficiency comparison between NH3/CO2 refrigeration system and proposed supply chain.
Figure 8.
COP and exergy efficiency comparison between NH3/CO2 refrigeration system and proposed supply chain.

Figure 9.
Liquid air production cost against liquid air delivery distance.

Figure 10.
CAPEX, OPEX, and LCC of LACS against distance.

Figure 11.
LCC comparison between NH3/CO2 refrigeration system and LACS.

Figure 12.
Breakeven liquid air production cost.

Figure 13.
Liquid air production cost against in the air liquefaction system.

Figure 14.
LCC comparison between NH3/CO2 system and LACS with various operating times.

Figure 15.
Breakeven distance of LACS for various operating time.


| Items | Value | Unit |
|---|---|---|
| ηcomp | 0.88 | - |
| ηpump,liq | 0.80 | - |
| 200 | ton/h | |
| PLair,storage | 1.01 | bar |
| PLNG,pump | 77.00 | bar |
| TNG | 0.00 | °C |
| Tpinch,hx | 4.00 | °C |
Table 2.
Composition of the LNG and inlet air [30].
Table 2.
Composition of the LNG and inlet air [30].
| Items | LNG (Mole %) | Inlet Air (Mole %) |
|---|---|---|
| Methane | 89.26 | - |
| Ethane | 8.64 | - |
| Propane | 1.44 | - |
| i-Butane | 0.35 | - |
| n-Butane | 0.27 | - |
| Nitrogen | 0.04 | 79.0 |
| Oxygen | - | 21.0 |
Table 3.
Stream conditions for the air liquefaction system.
| No. | Flow Rate (ton/h) | Pressure (bar) | Temperature (°C) |
|---|---|---|---|
| 1 | 302.7 | 1.013 | 25.00 |
| 2 | 578.9 | 1.013 | −28.23 |
| 3 | 578.9 | 5.110 | 134.4 |
| 4 | 578.9 | 5.110 | 25.00 |
| 5 | 578.9 | 25.77 | 220.1 |
| 6 | 578.9 | 25.77 | 25.00 |
| 7 | 578.9 | 130.0 | 221.7 |
| 8 | 578.9 | 130.0 | 25.00 |
| 9 | 578.9 | 130.0 | −148.1 |
| 10 | 578.9 | 1.013 | −194.3 |
| 11 | 302.7 | 1.013 | −194.3 |
| 12 | 276.2 | 1.013 | −194.3 |
| 13 | 276.2 | 1.013 | −85.91 |
| 14 | 302.7 | 1.013 | −194.3 |
| 15 | 200.0 | 1.013 | −164.5 |
| 16 | 200.0 | 77.00 | −161.0 |
| 17 | 200.0 | 77.00 | 0.000 |
Table 4.
Design assumptions for the LACS.
| Items | Value | Unit |
|---|---|---|
| ηexp,LACS | 0.8 | - |
| ηpump,LACS | 0.8 | - |
| Tpinch,hx | 4 | °C |
| Tstorage | −29 | °C |
| Qcooling | 300 | kW |
Table 5.
Stream conditions for the LACS.
| No. | Flow Rate (ton/h) | Pressure (bar) | Temperature (°C) |
|---|---|---|---|
| 1 | 1.993 | 1.013 | −194.3 |
| 2 | 1.993 | 100.0 | −189.6 |
| 3 | 1.993 | 100.0 | −31.62 |
| 4 | 1.993 | 21.64 | −110.3 |
| 5 | 1.993 | 21.64 | −31.62 |
| 6 | 1.993 | 4.682 | −103.9 |
| 7 | 1.993 | 4.682 | −31.62 |
| 8 | 1.993 | 1.013 | −101.8 |
| 9 | 1.993 | 1.013 | −31.62 |
Table 6.
Items in CAPEX and multiplying factors.
| Items | Contents | f |
|---|---|---|
| Direct costs | Purchased equipment | 1 |
| Installation | 0.47 | |
| Instrumentation and control | 0.18 | |
| Piping | 0.66 | |
| Electrical | 0.11 | |
| Buildings | 0.18 | |
| Yard | 0.10 | |
| Services | 0.70 | |
| Land | 0.06 | |
| Indirect costs | Engineering supervision | 0.33 |
| Construction expenses | 0.41 | |
| Contractor’s fees | 0.21 | |
| Contingency | 0.42 | |
| Working capital | 0.85 |
Table 7.
Estimated cost of equipment for CAPEX.
| Item | Description | Reference |
|---|---|---|
| Compressors | Air compressor Gas compressor | 476 USD/kW [18] APEA |
| Turbine | Air expander | 1343 USD/kW [32] a |
| Storage tank | Liquid air storage tank | APEA |
| Separator | Cryogenic vessel | APEA |
| Cryogenic pumps | LNG pump Liquid air pump | APEA |
| Heat exchangers | Plate fin HX Shell and tube HX Evaporator Condenser | APEA |
| Trucks | Heavy truck | 0.5 million USD/truck [31] |
a The capital cost is based on the nitrogen expander. The capacity of the expander is 148 kW.
Table 8.
Detailed items included in OPEX consideration.
| Target System | Item | Value |
|---|---|---|
| Air liquefaction system LACS NH3/CO2 refrigeration system | Operating labor cost | 35,000 USD/labor |
| Electricity cost | 0.07 USD/kWh | |
| Carbon tax | 30 USD/ton CO2 | |
| Maintenance and repairs | 7% of CAPEX | |
| Operating supplies | 15% of maintenance and repairs | |
| Local taxes | 3% of CAPEX | |
| Insurance | 1% of CAPEX | |
| Plant overhead costs | 60% of plant overhead costs | |
| Transportation | Operational costs | 0.86 USD/km |
| LACS | Liquid air production cost | 40.4 USD/ton a |
a This is the production cost when is 130 bar and the delivery distance is 100 km.
Table 9.
Operating parameters of proposed supply chain for case study.
| Item | Value | Unit |
|---|---|---|
| Pair,comp | 130 | bar |
| PLair,LACS | 100 | bar |
| Delivery distance | 100 | km |
| Cold storage operating time | 10 | h/day |
Table 10.
Exergy flow information for the supply chain.
| Item | ||||
|---|---|---|---|---|
| 1st compressor | 27.67 | 25.26 | 2.41 | 1.56 |
| 2nd compressor | 55.14 | 52.72 | 2.42 | 1.57 |
| 3rd compressor | 78.00 | 75.56 | 2.44 | 1.58 |
| 1st intercooler | 25.89 | 22.70 | 3.19 | 2.07 |
| 2nd intercooler | 53.87 | 45.27 | 8.60 | 5.57 |
| 3rd intercooler | 76.81 | 67.49 | 9.32 | 6.04 |
| Multistream HX | 137.65 | 130.45 | 7.20 | 4.66 |
| J-T valve | 95.03 | 75.23 | 19.8 | 12.8 |
| Separator | 75.23 | 74.91 | 0.32 | 0.21 |
| LNG pump | 57.58 | 56.67 | 0.91 | 0.59 |
| Lair pump | 62.31 | 61.02 | 1.29 | 0.84 |
| 1st evaporator | 66.80 | 33.56 | 33.24 | 14.1 |
| 2nd evaporator | 27.86 | 22.59 | 5.27 | 1.32 |
| 3rd evaporator | 15.80 | 11.57 | 4.23 | 0.98 |
| 4th evaporator | 4.50 | 0.52 | 3.98 | 0.90 |
| 1st expander | 33.56 | 31.20 | 2.36 | 1.53 |
| 2nd expander | 22.59 | 20.01 | 2.58 | 1.67 |
| 3rd expander | 11.57 | 8.94 | 2.63 | 1.71 |
Publisher’s Note: MDPI stays neutral with regard to jurisdictional claims in published maps and institutional affiliations. |
© 2021 by the authors. Licensee MDPI, Basel, Switzerland. This article is an open access article distributed under the terms and conditions of the Creative Commons Attribution (CC BY) license (http://creativecommons.org/licenses/by/4.0/).
Share and Cite
MDPI and ACS Style
Che, S.; Kim, J.; Chang, D. Liquid Air as an Energy Carrier for Liquefied Natural Gas Cold Energy Distribution in Cold Storage Systems. Energies 2021, 14, 272. https://0-doi-org.brum.beds.ac.uk/10.3390/en14020272
AMA Style
Che S, Kim J, Chang D. Liquid Air as an Energy Carrier for Liquefied Natural Gas Cold Energy Distribution in Cold Storage Systems. Energies. 2021; 14(2):272. https://0-doi-org.brum.beds.ac.uk/10.3390/en14020272
Chicago/Turabian StyleChe, Sanghyun, Juwon Kim, and Daejun Chang. 2021. "Liquid Air as an Energy Carrier for Liquefied Natural Gas Cold Energy Distribution in Cold Storage Systems" Energies 14, no. 2: 272. https://0-doi-org.brum.beds.ac.uk/10.3390/en14020272
Note that from the first issue of 2016, this journal uses article numbers instead of page numbers. See further details here.