Monofacial and Bifacial Micro PV Installation as Element of Energy Transition—The Case of Poland


1
Mineral and Energy Economy Research Institute, Polish Academy of Sciences, 7A Wybickiego St., 31-261 Cracow, Poland
2
Faculty of Environmental and Energy Engineering, Cracow University of Technology, 24 Warszawska, 31-155 Cracow, Poland
3
Faculty of Energy and Fuels, AGH University of Science and Technology, 30 Mickiewicza Ave., 30-059 Cracow, Poland
4
Department of Machines and Technical Systems, Faculty of Mechanical Engineering, UTP University of Science and Technology in Bydgoszcz, Al. prof. S. Kaliskiego 7, 85-796 Bydgoszcz, Poland
*
Author to whom correspondence should be addressed.
Energies 2021, 14(2), 499; https://0-doi-org.brum.beds.ac.uk/10.3390/en14020499
Submission received: 23 November 2020
/
Revised: 6 January 2021
/
Accepted: 14 January 2021
/
Published: 18 January 2021
(This article belongs to the Special Issue Technologies Conducive to Low Green House Gas Emission)
Abstract
:The several government subsidies available in Poland contributed to an increased interest in PV installations. Installed PV capacity increased from 100 MW in 2016 up to 2682.7 MW in July 2020. In 2019 alone, 104,000 microinstallations (up to 50 kWp) were installed in Poland. The paper determines the energy gain and the associated reduction of CO2 emissions for two types of solar installation located in Poland. The monofacial solar modules with a power of 5.04 kWp (located in Leki) and bifacial solar modules with a power of 6.1 kWp (located in Bydgoszcz). Both installations use mono-crystalline Si-based 1st generation PV cells. With comparable insolation, a bifacial installation produces approx. 10% (for high insolation) to 28% (for low insolation) more energy than a monofacial PV installation. Avoided annual CO2 emission in relation to the installation capacity ranges from 0.58 to 0.64 Mg/kWp for monofacial and from 0.68 to 0.74 Mg/kWp for bifacial and is on average approx. 16% higher for bifacial installations. Cost-benefit analyses were made. For different electricity prices, the NPV for monofacial and bifacial was determined.
Keywords:
photovoltaic; monofacial PV; bifacial PV; renewable energy source; CO2 emission; my electricity; PV; Poland; Mój Prąd1. Introduction
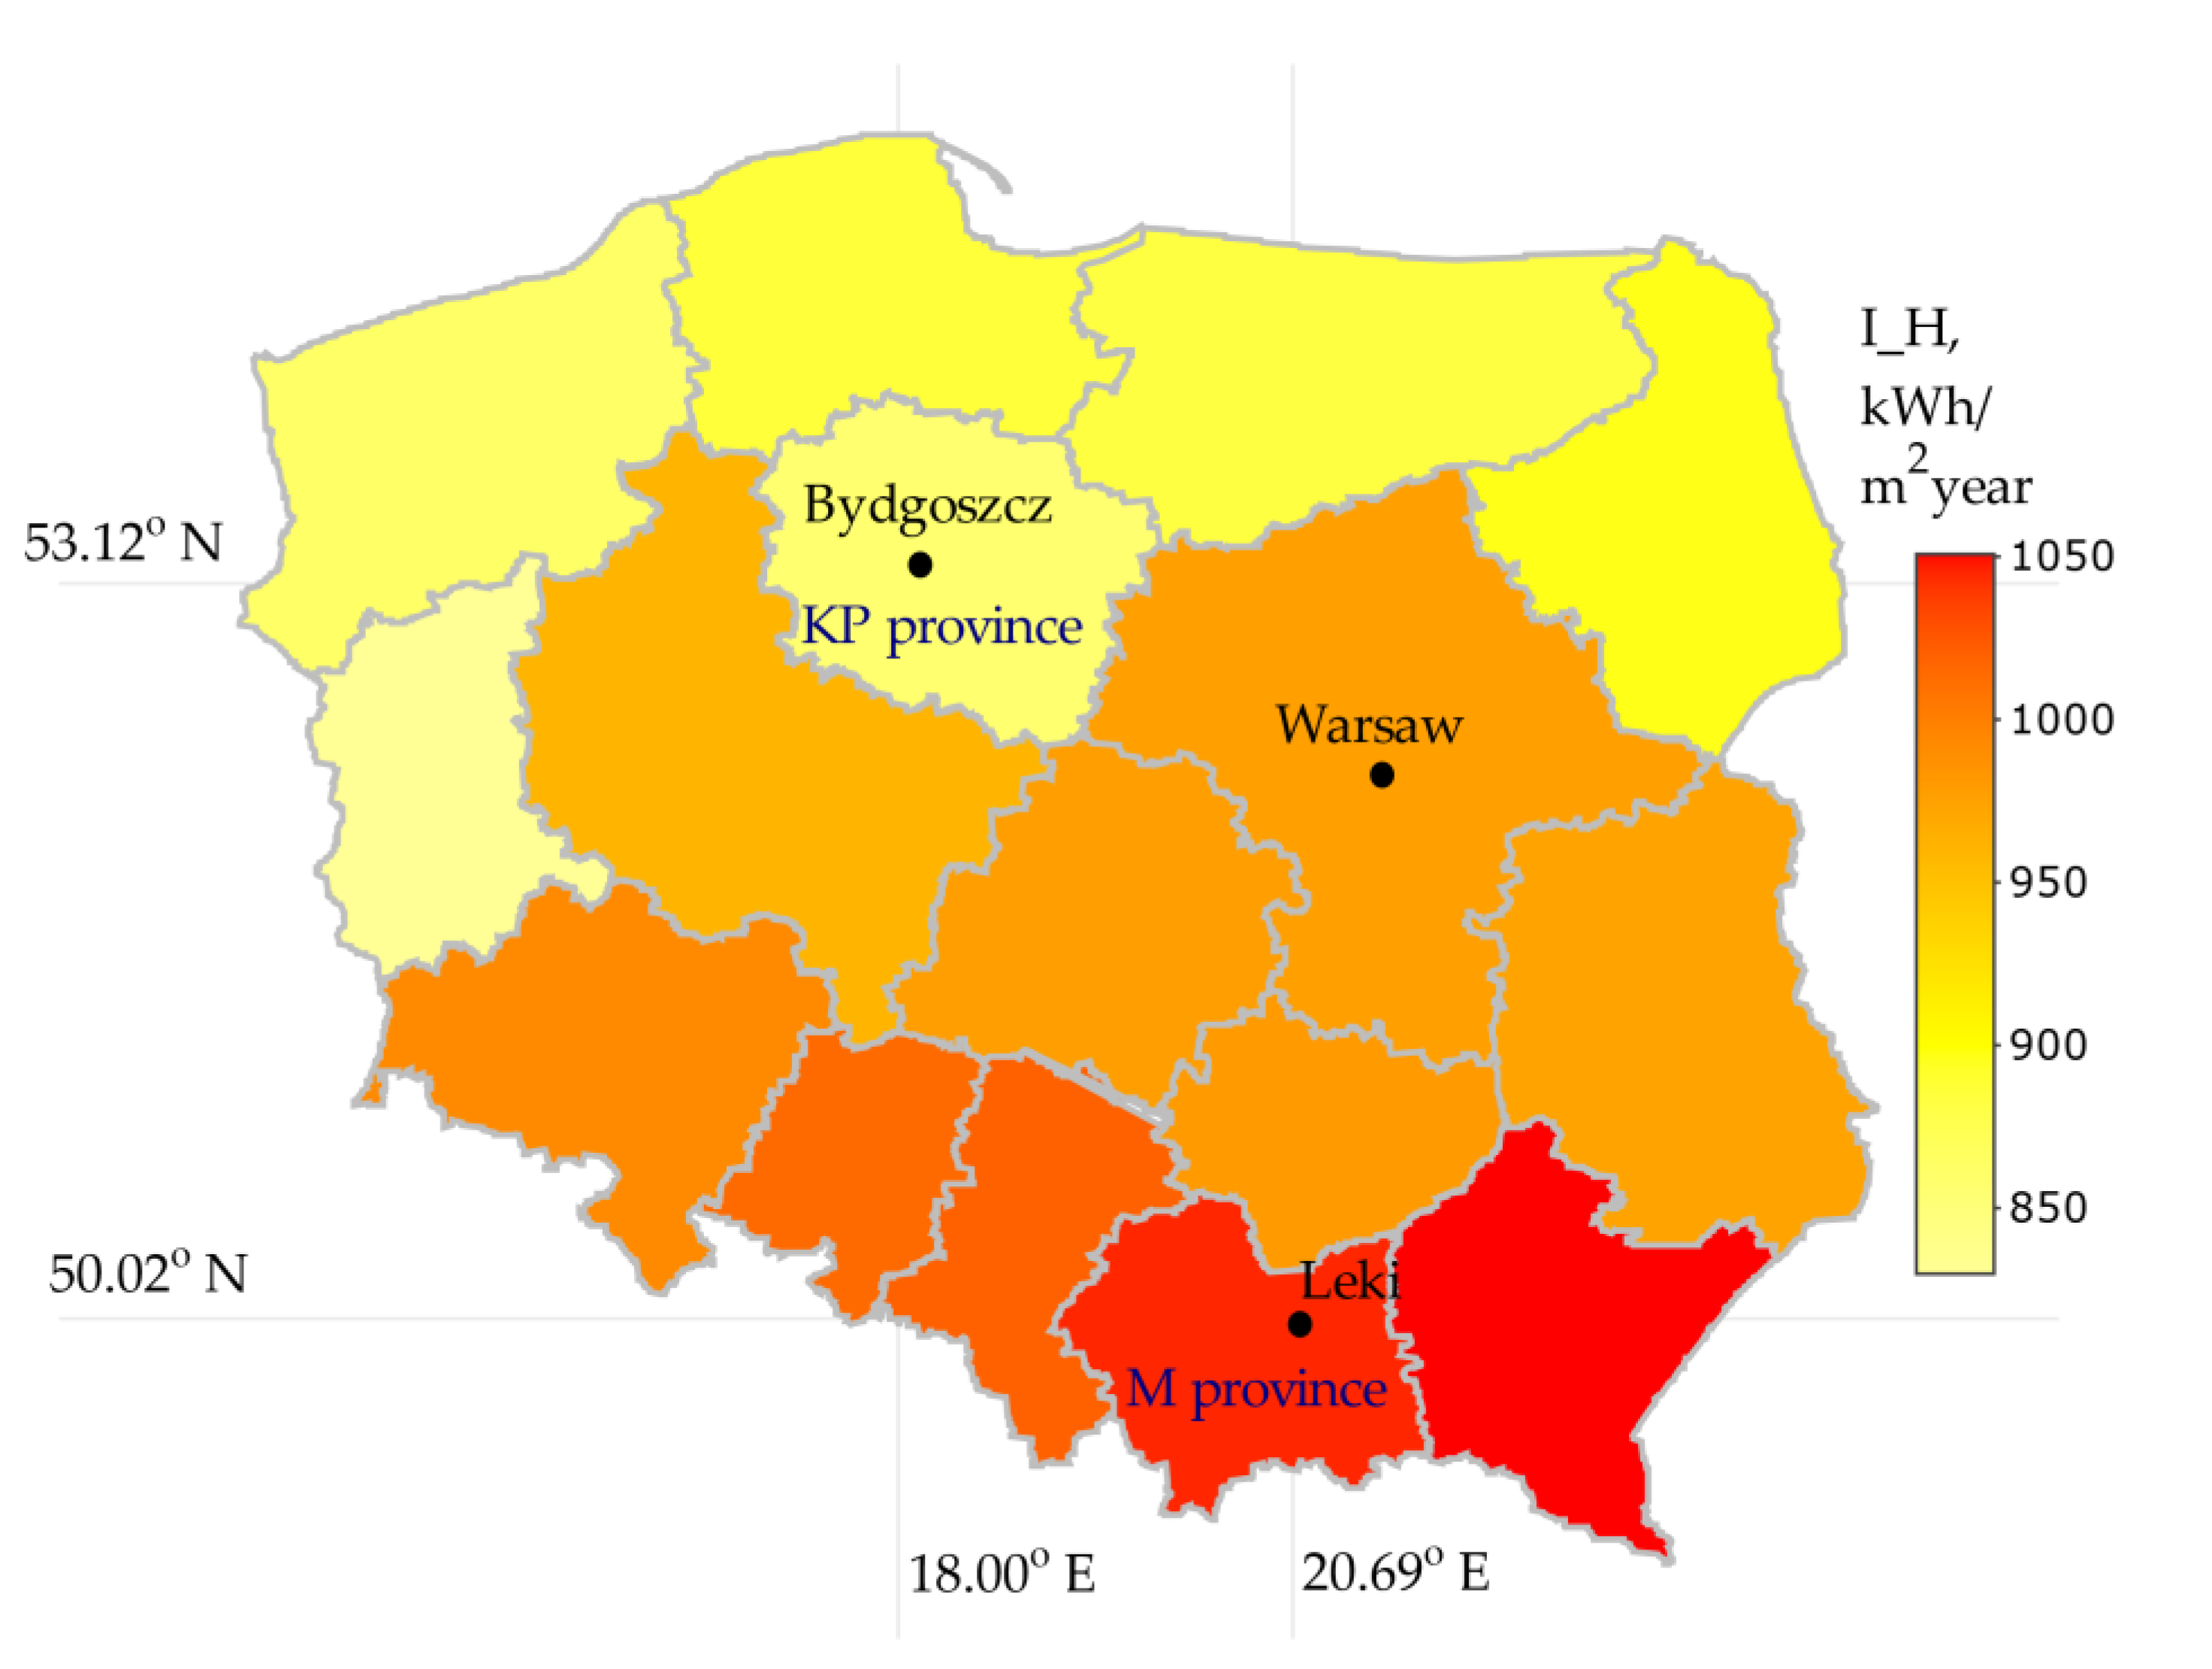
Currently, the development of the industry and technology has resulted in increased energy demand. At the same time, society is much more aware of the decreasing fossil fuel resources and other problems caused by burning fossil fuels such as climate change, eutrophication, acid rain, greenhouse gas (GHG), mercury and other pollutant emissions, etc. [1,2]. Poland is one of countries where fossil fuels, mainly coal, is widely used to supply energy [3] and is facing the urgent need for developing a proper solution to deal with problems caused by the energy sector from environmental, technology, and economic points of view [4]. Data from KOBiZE shows that GHG emissions were 413.8 million tons of CO2eq in Poland in 2017. Comparing to 1990 and 1988, emissions have been reduced by 12.8% and 28.3%, respectively. One of the pillars of decarbonisation of Europe could be solar photovoltaic (PV) power generation [5]. In the European Union (EU), solar PV electricity generation capacity increased from 1.9 GW in 2010 to over 133 GW in 2019. The year 2019 alone brought an increase in new installed capacity by 16.5 GW in EU [6]. At the end of 2019, from the installed PV power capacity both in EU and UK, around 150 TWh of electricity could be generated (which gives around 5.2% of the final electricity demand) [7]. Efficiency of solar PV system depends on the insolation, PV technology, system components and suitable design. The performance of PV depends on many different environmental parameters such as irradiance level, temperature, angular losses, partial shading, and soiling losses [8,9]. Currently, the biggest photovoltaic market in European countries with temperate climates is observed in Germany, Netherland or Poland [10]. For Poland, the estimated value of insolation during a year is about 1000 kWh/m2 [11,12,13] (Figure 1). In Poland PV sector is the fastest developed renewable energy source (RES) sector with the highest power growth over the past three years [14]–from 100 MW/a in 2016 up to almost 700 MW/a in 2019 and 2682.7 MW data as of October 1, 2020 [15,16]. It is estimated that by 2030, the installed capacity in PV will increase by approximately 5–7 GW, while in 2040-by approx. 10–16 GW [15,17]. Poland (after Germany, Spain, Netherlands, and France) has been in fifth place in EU in terms of establishing new PV systems capacities.
Jager-Waldau et al. [7] analyse the role of PV to obtain the long-term strategy of the European Commission for energy and climate change and set the target of GHG reduction from 40% to 55% by 2030. Achieving this can make Europe the first climate-neutral continent by 2050. Depending on the strategic policy scenario, reaching 55% GHG emissions reduction would be possible if the cumulative PV capacity both in the EU and the UK surge to 455–605 GW up to 2030.
Taking under consideration ambitious plans of 55% GHG reduction in the EU up to 2030, it has been important to analyse the potential of micro-PV installations for reduction CO2 emission in Poland. Among the renewable energy technologies available in Poland, the greatest increase is observed in PV installations, usually microinstallations (especially up to 10 kWp) [16,19]. The reason for the increase in the number of micro-PV are subsidies in the form of government programs: “My Electricity” [14], Czyste Powietrze, Energia Plus, Prosument or Agroenergia (intended for farmers). These programs make it possible to subsidise the purchase and installation of new PV panels. In addition, the advantage of microinstallations is that annually from 25 to 30% of energy is consumed on site, and the rest of the energy can be consumed by neighbouring buildings within one microgrid (low voltage ≈ 230 V). The off-grid independent PV systems are suitable and attractive for many applications for technical, economical, safety, legal reasons [20,21]. In rural areas the microscale installations are preferred due to their simplicity and stand-alone applications, wherein the investment in solar energy is strongly connected with the household income and wealth [22].
In contrast, the introduction of the auction support system has contributed to the development of large solar PV farms (over 1 MW) [23,24]. In addition, the energy price increases and PV’ investment cost drops (learning curve [25]), caused the popularization of the energy prosumer business model in which company invest in PV installations for its own needs [26].
In addition, in accordance with the Polish Energy Policy, a user without a PV installation uses electricity from the energy mix [27]. This means that every hour we have a different share of sources generating electricity, including residual amounts from RES. When we install renewable energy sources and have, for example, 1 MWh of our own energy, the use of energy from the mix decreases, and because renewable energy sources have priority, we reduce energy consumption from conventional sources. So 1 MWh of renewable energy replaces 1 MWh of nonrenewable energy, and not a mix with the current share of renewable energy [17,28], which is related to the reduction of CO2 emissions [29].
Taking under consideration the Polish conditions related to subsidies (grants per kWp [16]) and Prosumer rules, it is not profitable to oversize the installation [30].
In the Prosument program, under which it is possible to settle energy from RES for microinstallations, a household can receive 80% (prosumer factor PF) for 10 kWp installation and 70% for 10 kWp to 50 kWp). For example, for 1 kWh supplied to the grid, a household can receive 0.8 kWh (up to 10 kWp), or 0.7 kWh (up to 50 kWp). For installations up to 10 kWp, a surplus of over 125% causes overproduction economically unprofitable for the household (the energy does not disappear in the grid, but the user gets nothing for surplus) [30,31].
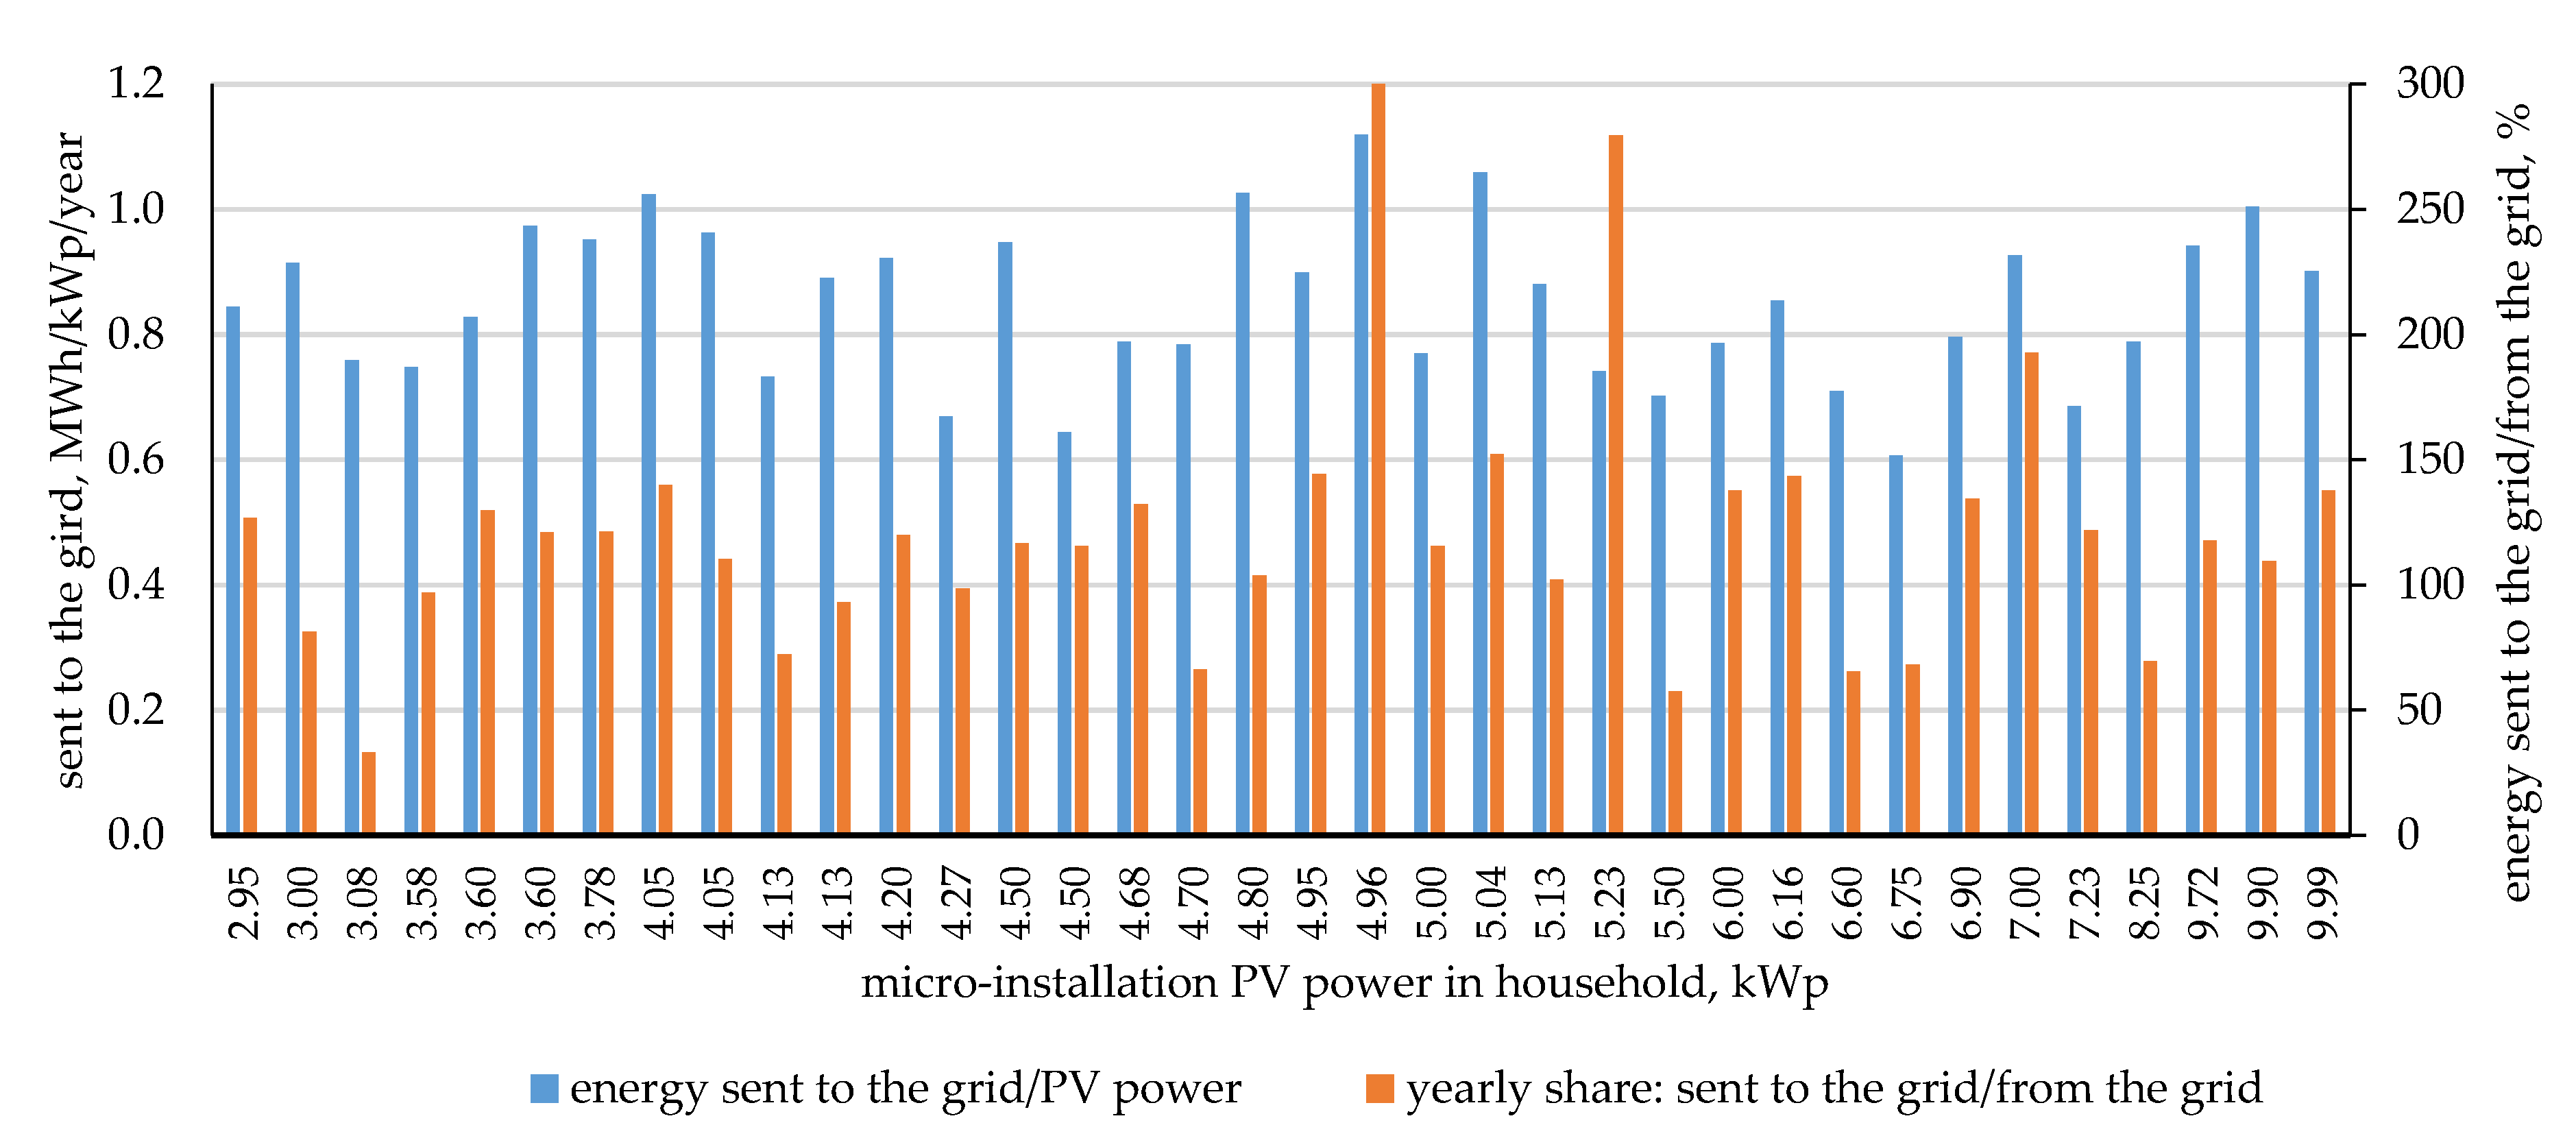
Microinstallation up to 50 kWp do not need a building permit (when the installation height does not exceed 3 m), therefore the construction process is much more simplified. Microinstallations are typically installed on the roof or on ground/soil, but there is a condition that the ground should be for building purpose not for agriculture one. The paper focuses on microphotovoltaic installations located in the Kuyavian-Pomeranian and Lesser Poland province (localization-Figure 1). Characteristics of the energy production is represented by the annual values of energy sent to the grid. The amount of energy consumed from the grid is also presented [32]. Figure 2 and Figure 3 show the performance characteristics for a selected group of installations in the Lesser Poland province.
Among installations with a capacity of 2.95 kWp to 10 kWp, 23 out of 36 installations sent more energy to the grid than they consumed during the year, of which in 13 this share was greater than 125%. On the other hand, one should bear in mind the ecological effects and avoided CO2 emissions. The surplus energy is sent to the grid, thus reducing the use of fossil fuels.
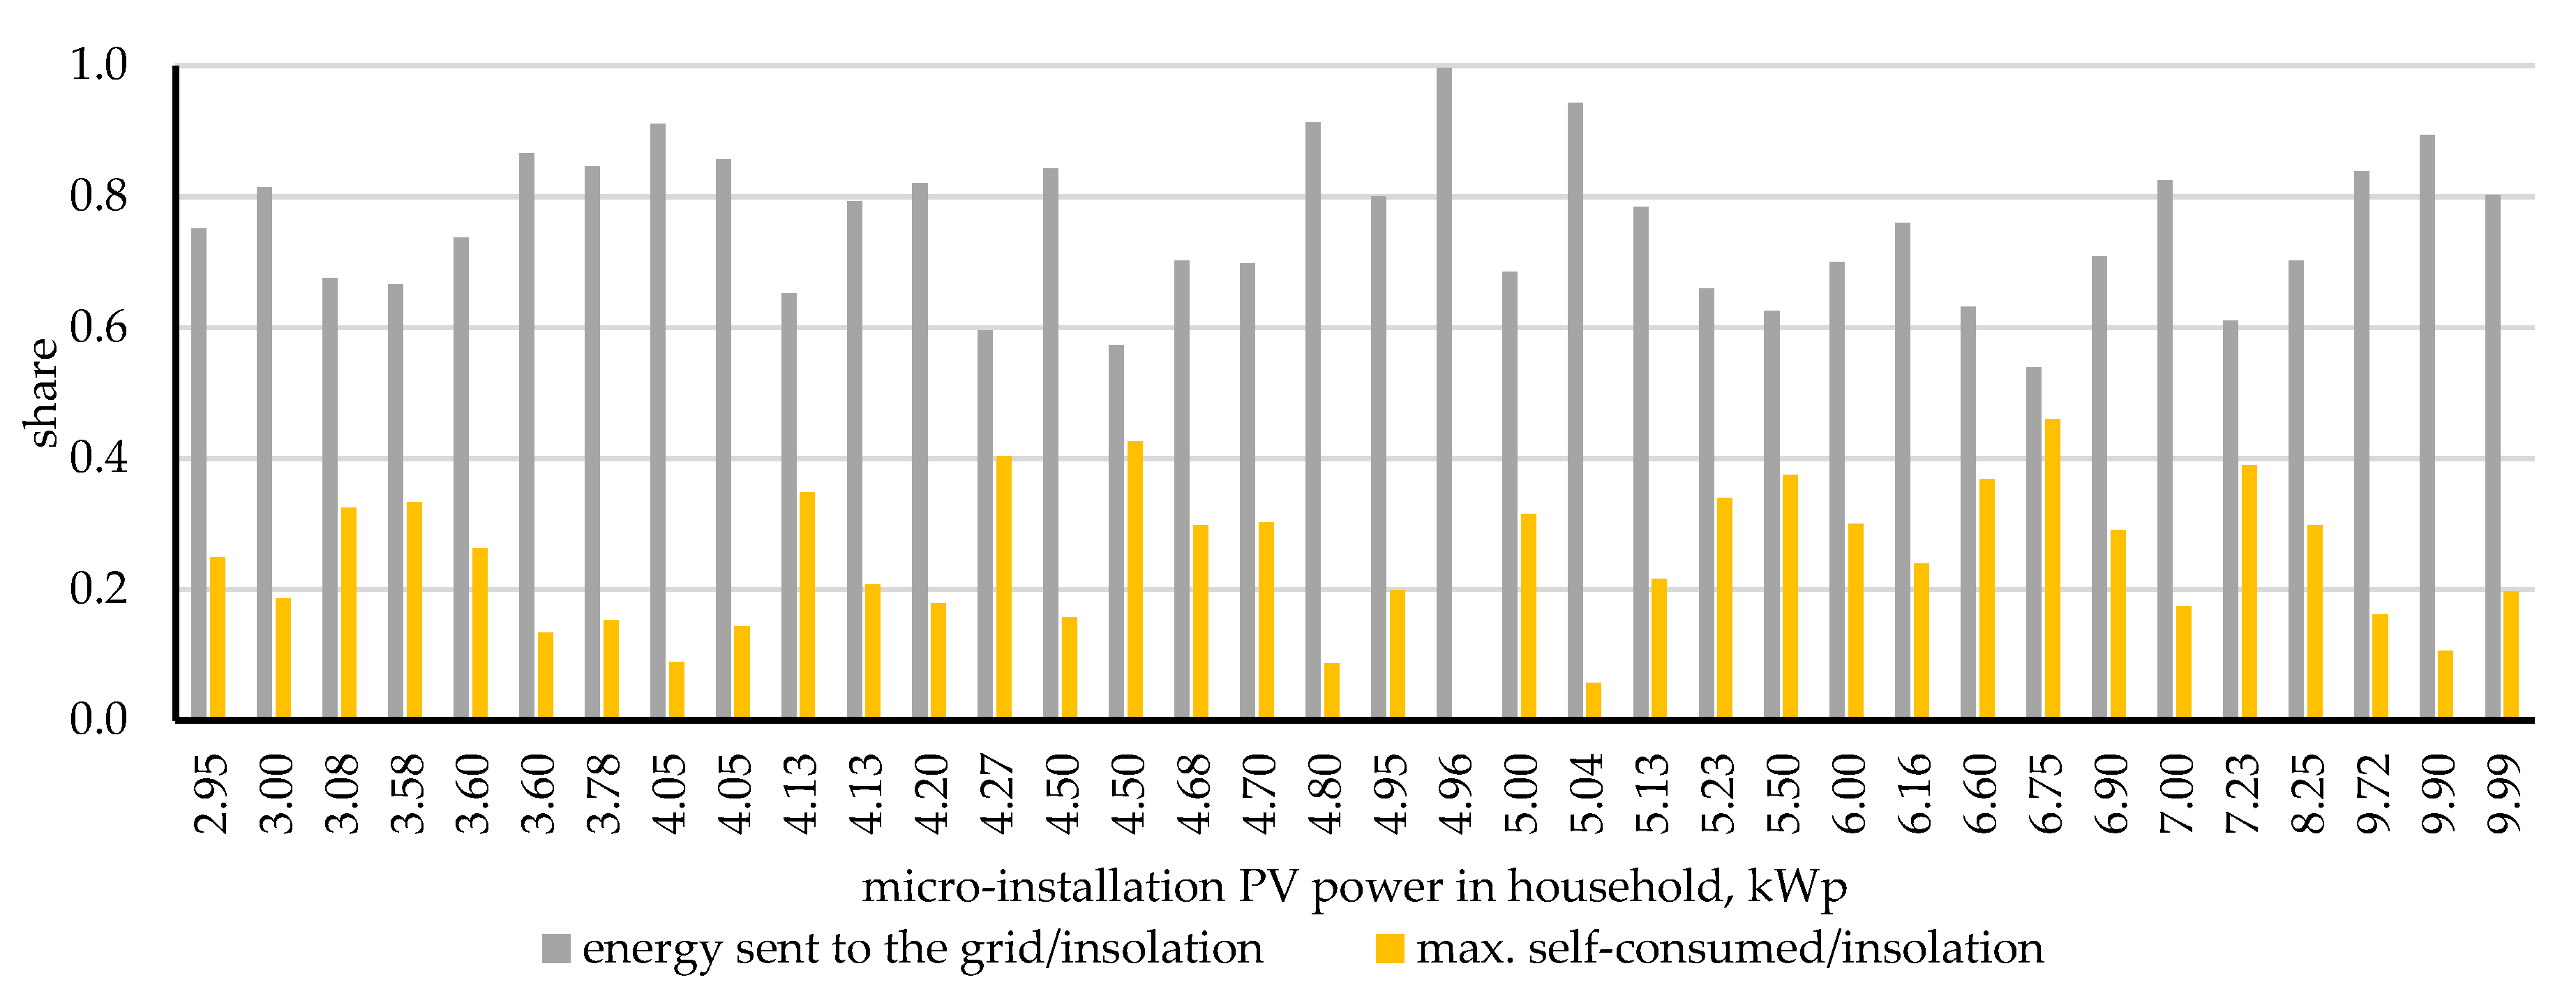
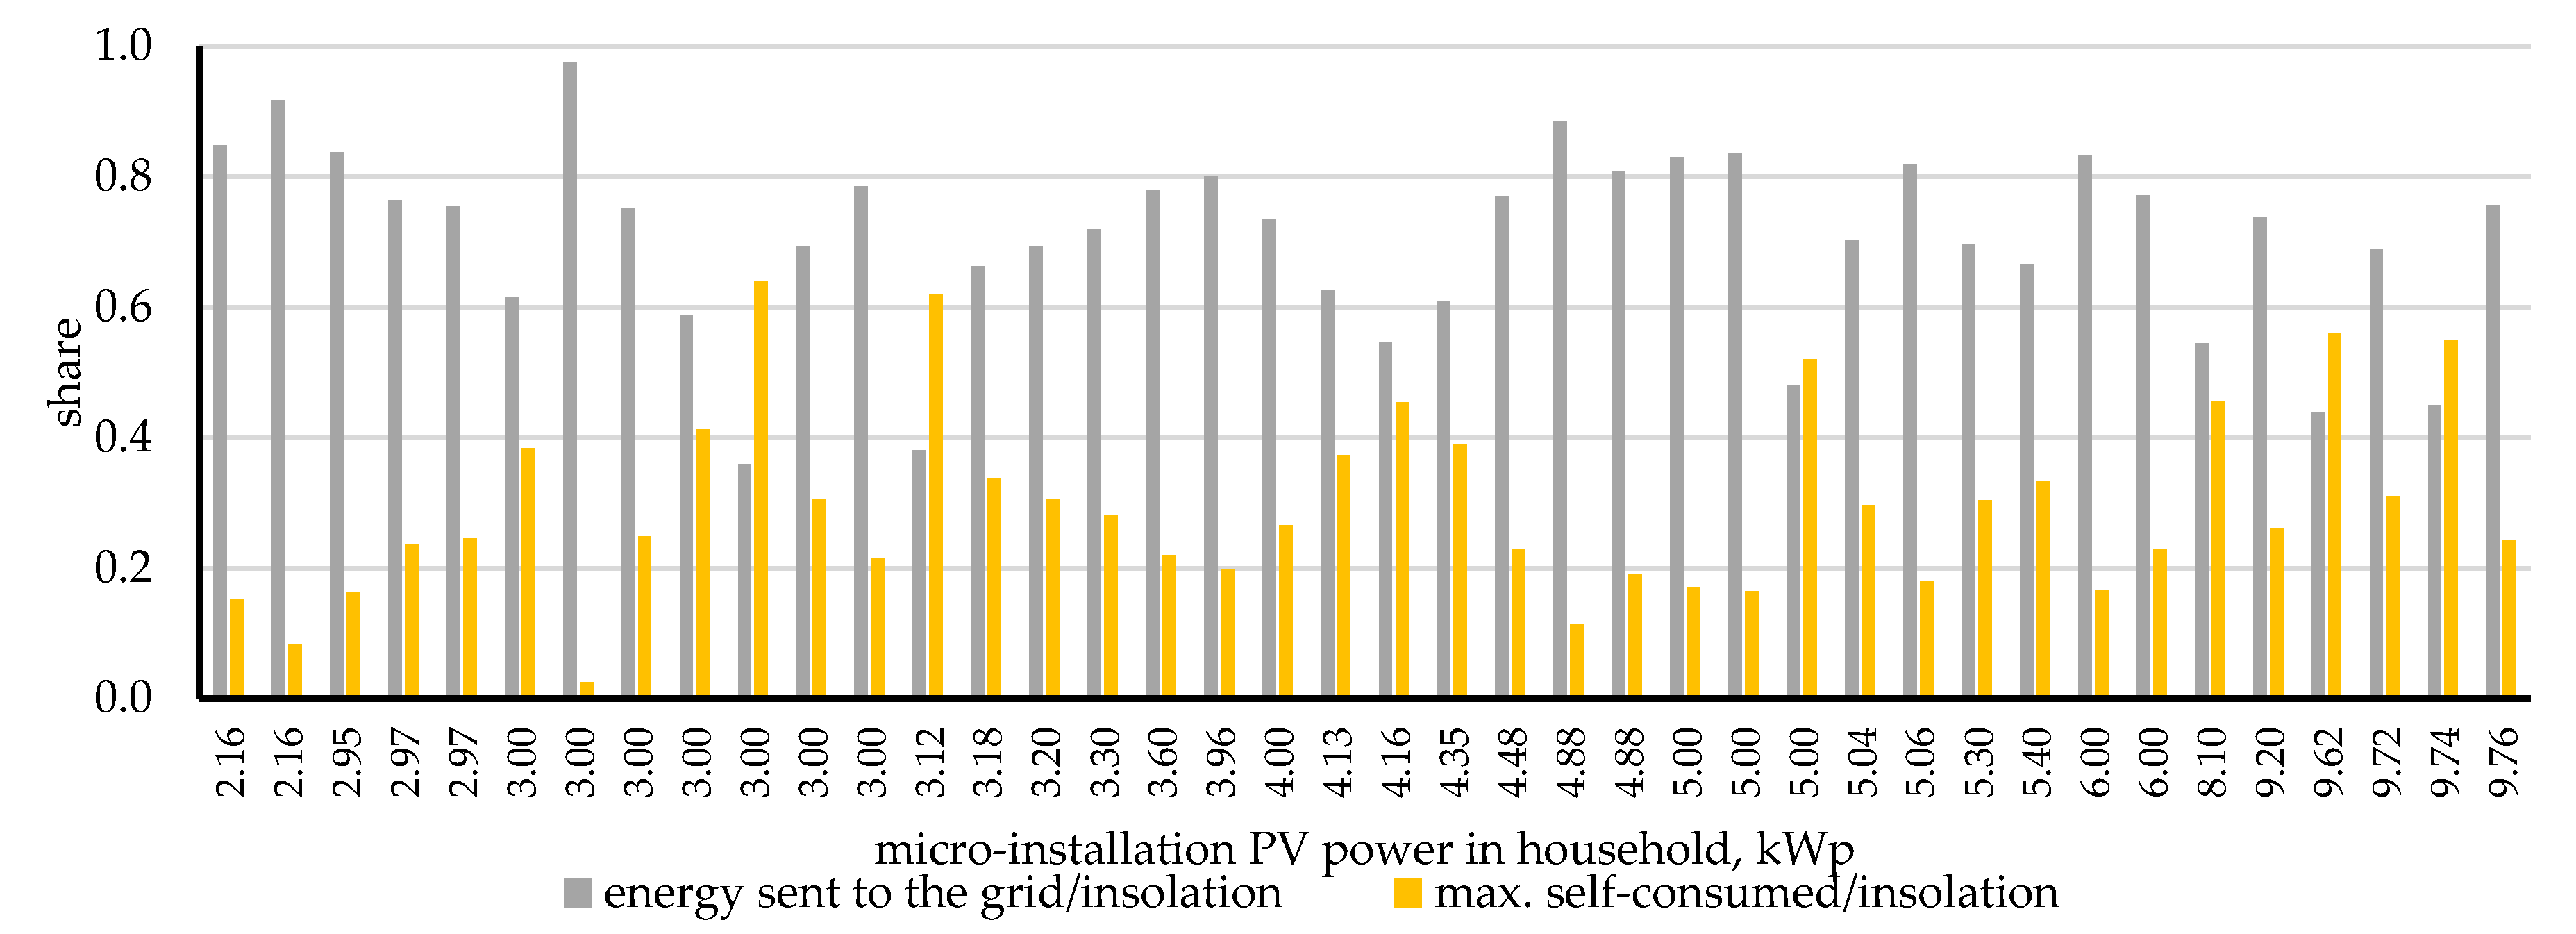
Based on insolation measured in Lesser Poland province (1124 kWh/m2/year [29]) and energy sent to the grid measured (Figure 2) in each installation theoretical maximum value of self-consumed energy was calculated (Figure 3) The average (for this province) maximum value of the self-consumed energy share was obtained as 24%. Mean value of selected PV installation power is 5.18 kWp but for above-mentioned the biggest grants program “My electricity” mean PV installation power value in 2019 was 5.39 kWp (obtained for 3060 microinstallation [15]). Theoretically, the more production is sent to the network, the lower the self-consumption rate can be.
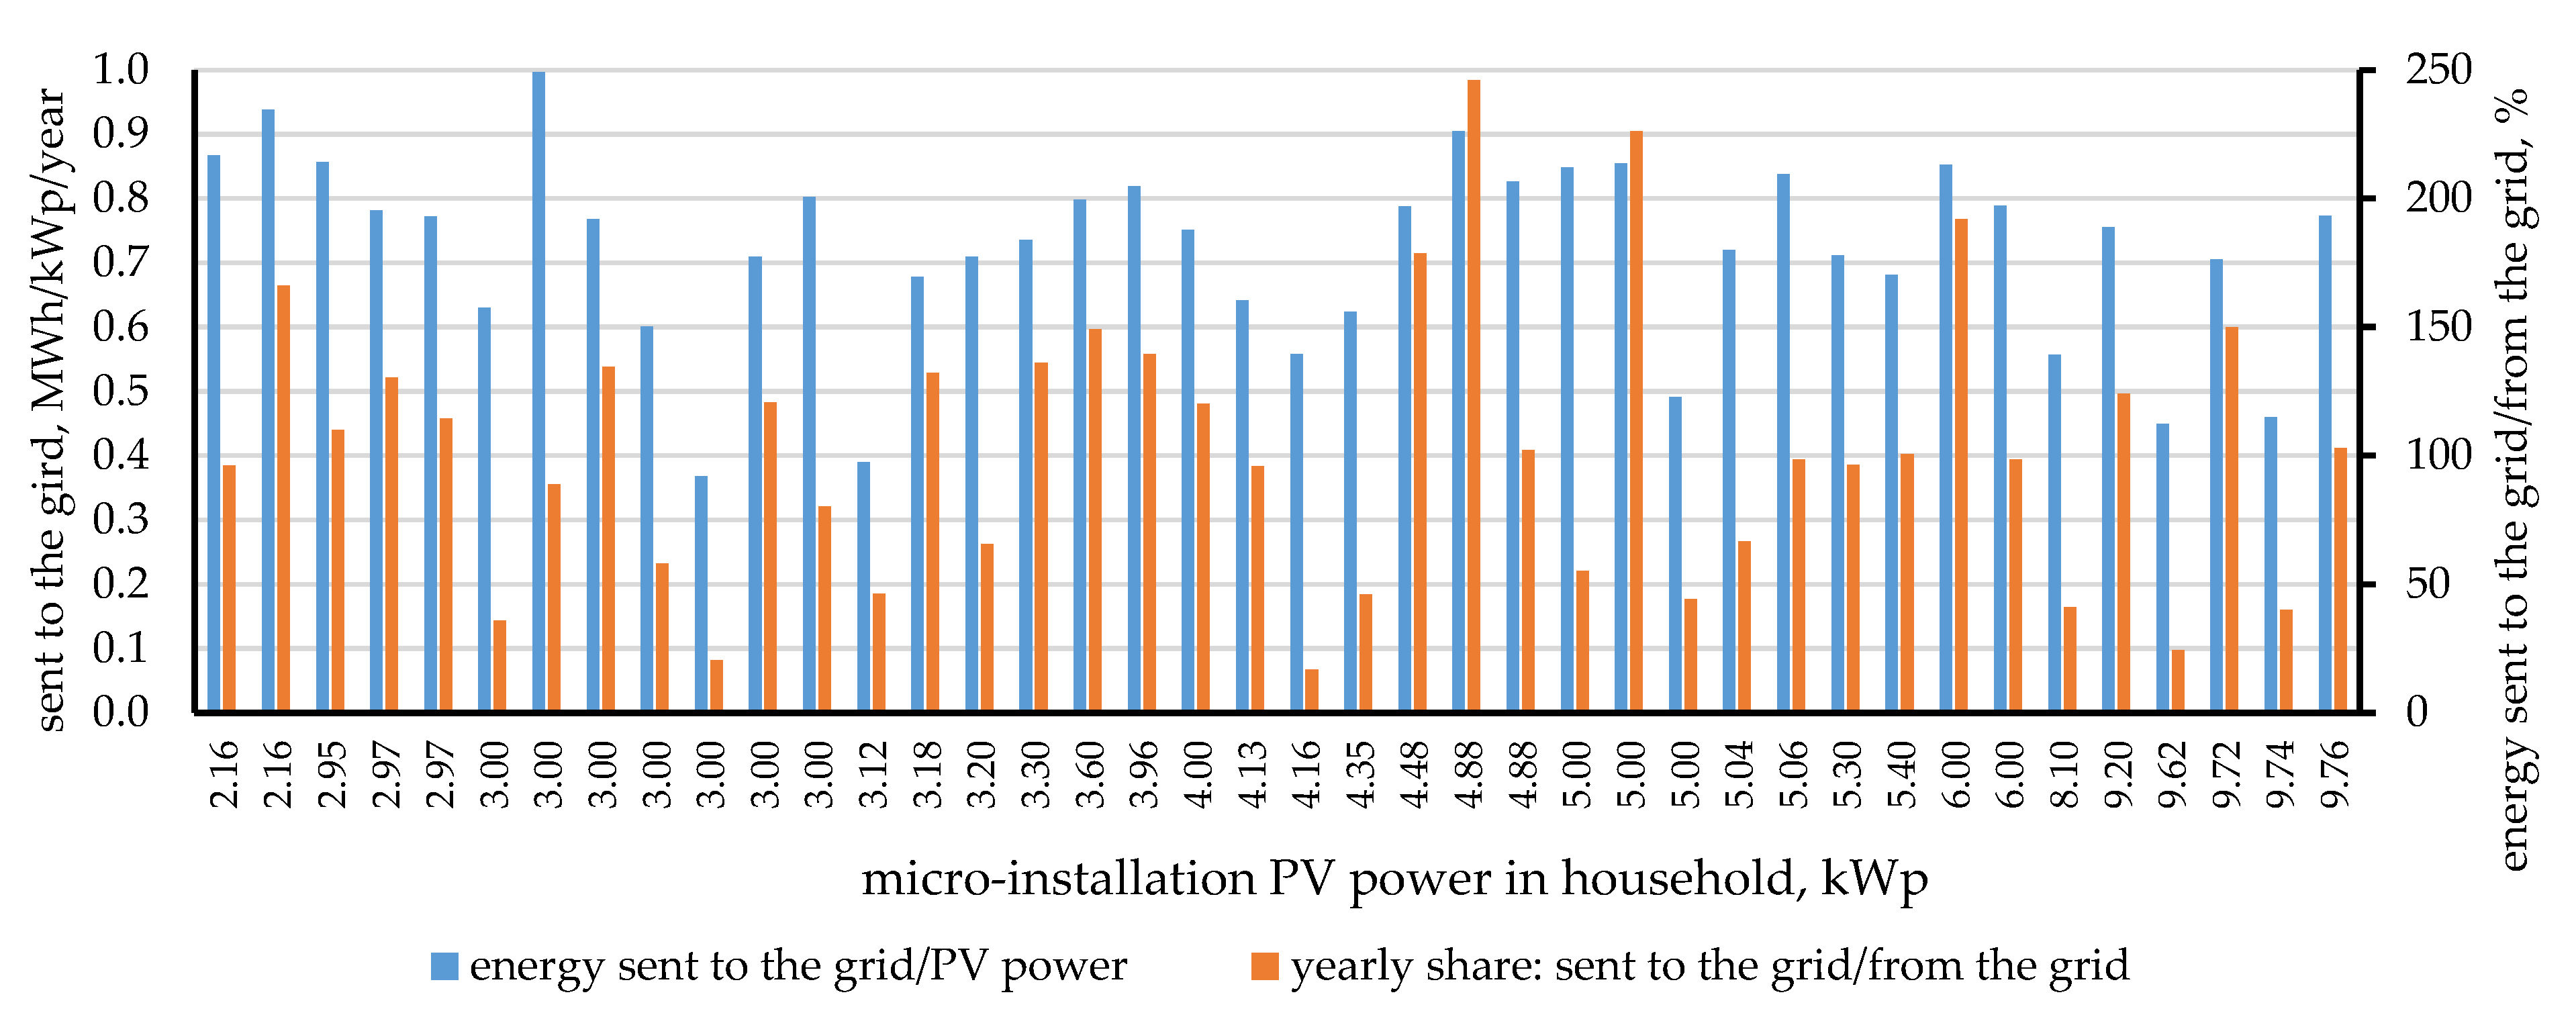
A similar analysis was performed for a selected group of installations in the Kuyavian-Pomeranian province and shown in Figure 4 and Figure 5.
In the Kuyavian-Pomeranian province 18 out of 40 installations sent more energy to the grid than they consumed during the year, of which in 12 this share was greater than 125%.
Based on insolation measured in Kuyavian-Pomeranian province (1022 kWh/m2/year [33]) and energy sent to the grid measured (Figure 4) in each installation theoretical maximum value of self-consumed energy was calculated (Figure 5) The average (for this province) maximum value of the self-consumed energy share was obtained as 30%. Mean value of selected PV installation power is 4.74 kWp but for above-mentioned the biggest grants program “My electricity” mean PV installation power value in 2019 was 5.94 kWp (obtained for 1094 microinstallation [16]).
There are some studies considering the use of PV system to reduce CO2 emissions for example Ren at al. [34] analysed the impact of installed capacity on CO2 emissions in China, while Louwen et al. [35] analysed how 40 years of PV development influence energy sector and how contribute to GHG emissions avoidance. In Mohammadi et al. [36] research, a large-scale photovoltaic plant in southern coast of Iran has been considered. The analysis of 5 MW installation showed that using of such system can obtain 5259 ton/year of CO2 reduction compared to the natural gas power plant. Antonanzas et al. [37] compered in their research life cycle assessment (LCA) of fixed and single axis tracking systems (SATS) for PV. A better CO2 mitigation potential has been obtained for SATS which changed between 3.4 to 14.5 MgCO2/kW compared to the fixed system for base case scenario [38,39]. Even though Prăvălie and Bandoc’s research shows that PV technology is more polluting considering CO2 g per kWh in comparison to other energy sources technologies including wind, Concentrate Solar Power, hydro energy or nuclear energy [40]. PV technology is still preferable technology in light of carbon emission reduction in comparison to fossil fuels such as coal, oil and gas [40].
Typical installations used in Poland are systems with monofacial modules, while bifacial installations in Poland are practically nonexistent. Contrary to traditional monofacial modules, bifacial modules are assembled from cells that can effectively absorb and convert into electricity the radiation falling on both their front and back sides, which allows the use of diffused and reflected radiation (the size of which depends mainly on the albedo). According to research by Park et al. [41], depending on the albedo of the ground on which the panel is installed, the effective energy yield may be higher than 10% to 33% in relation to monofacial panels. The use of bifacial panels may cause self-consumption increase (direct) as production in the morning and evening hours is higher [42,43]. Gallegos et al. have shown that for latitudes above 40°, bifacial modules are more cost-effective than monofacial [44]. Based on a review of the LCA of PVs, CO2 emissions for mono-Si cells are 21 to 250 gCO2/kWh, mean value by Kommalapati et al. estimated at 85 gCO2/kWh. The large discrepancy in values depend on the energy mix at every step of the supply chain [39]. The cleaner the mix, the cleaner the solar array production. Reich et al. stated that the intensity of GHG emissions may be zero g CO2-eq/kWh for energy based on renewable sources and nuclear energy up to 200 gCO2/kWh for energy only from coal [45]. The current GHG footprint is around 25 gCO2/kWh for mono-Si PV systems, down from 409 gCO2/kWh in 1986 [35]. There are few LCAs for bifacial modules; analysis by Gazbour et al. shows a value of 31 gCO2/kWh [46].
As shown in the paragraph above, the listed programs are not the main driving force behind the selection of bifacial PV panels. As shown on the Polish market, there is no research on the use of bifacial panels, for which a higher yield in the form of energy (from a limited area) can be achieved, and one of the goals of this work is to show how higher this yield is. Currently, due to the fact that bifacial PV panels are a newer solution than mono-facial panels (as well as less frequently used), they are more expensive, however, their popularization should affect their prices and attractiveness of use on global and Polish markets. The novelty of this paper is a comparison of a new solution for Polish climate conditions with bifacial panels to a traditional monofacial installation. Checking the economic (a profitability analysis) and ecological benefits (an assessment of the potential to avoid CO2 emissions) of using solar installations in the implemented co-financing programs for this type of projects. On the basis of the conducted research, the energy gains of both installations and the amount of CO2 emission reduction were determined. Depending on the structure of energy generation and the related CO2 emission index, the unit cost of CO2 reduction was estimated in the perspective of 20 years.
2. Configurations of Analyzed Monofacial and Bifacial Micro PV
Productivity analyses were carried out for two photovoltaic installations. Classic monofacial PV located in Lesser Poland with a capacity of 5.04 kWp and bifacial PV located in Bydgoszcz with a capacity of 6.1 kWp. Both installations use mono-crystalline Si-based 1st generation PV cells. A detailed analysis was carried out for June 2020.
2.1. PV Microinstallation in Leki (Lesser Poland Voivodship)
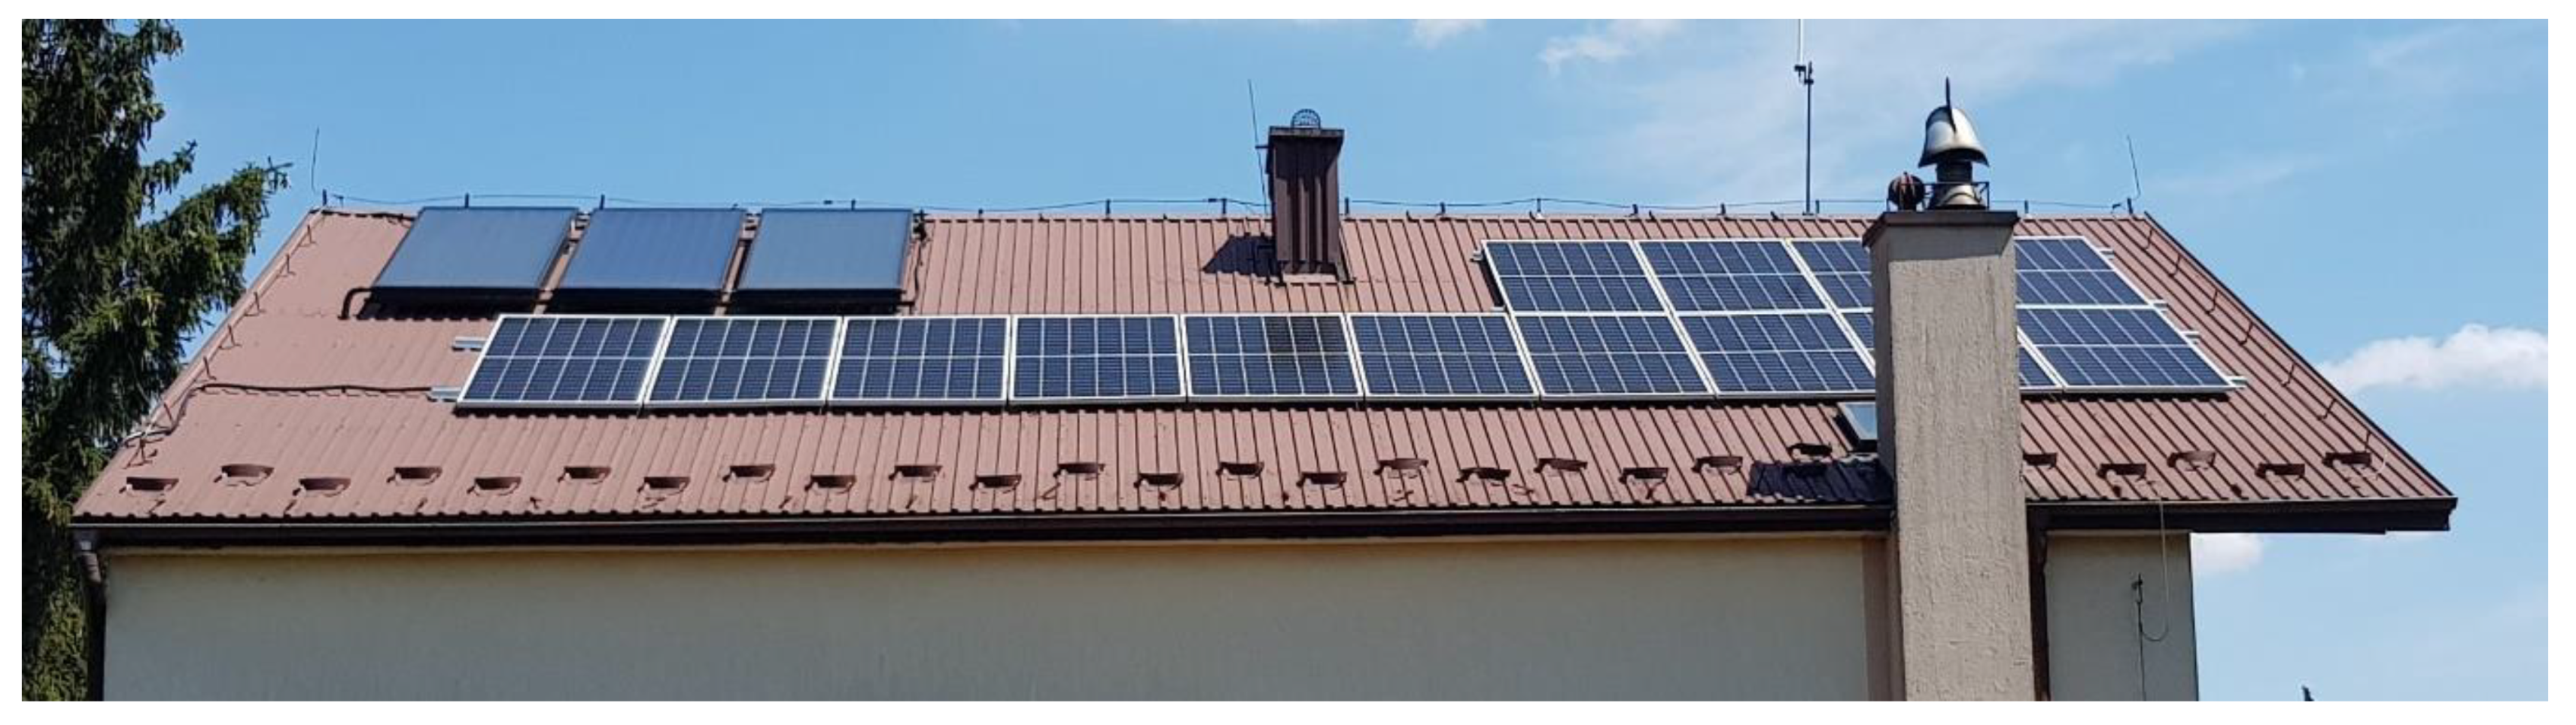
The photovoltaic installation located in the Lesser Poland province (the exact geographical coordinates are shown in Figure 1) consists of 14 monocrystalline panels by Longi-Figure 6 with a power of 0.36 kWp. The technical data of the panels are included in Table 1, and the installation configuration data in Table 2. The energy output from the inverter (Fronius 5.0 3M) was measured every 5 min and the energy sent to the grid and energy from the grid was monitored via a bidirectional electricity meter.
The installation was built in 2020 at a cost of EUR 4250, of which EUR 1150 in subsidies [14,16], was obtained under the “My Electricity” program, and another EUR 250 was settled as a tax credit. The unit price without subsidies is EUR 843/kWp, and including subsidies, it is EUR 565/kWp.
In 2018–2019, an analysis of the demand for electricity was carried out for the building (the annual total is about 5600 kWh), detailed results are included in the work by Kryzia et al. [43]. The energy produced in the installation replaces energy from the electricity grid at a price of EUR 0.14/kWh, the surplus energy produced is “virtually stored in the grid” (energy sent to the grid) and can be downloaded by the user again (up to one year) with a reduction of 20% (for installation power up to 10 kWp) [47].
2.2. PV microinstallation (Bifacial) in Bydgoszcz (Kujawsko-Pomorskie Province)
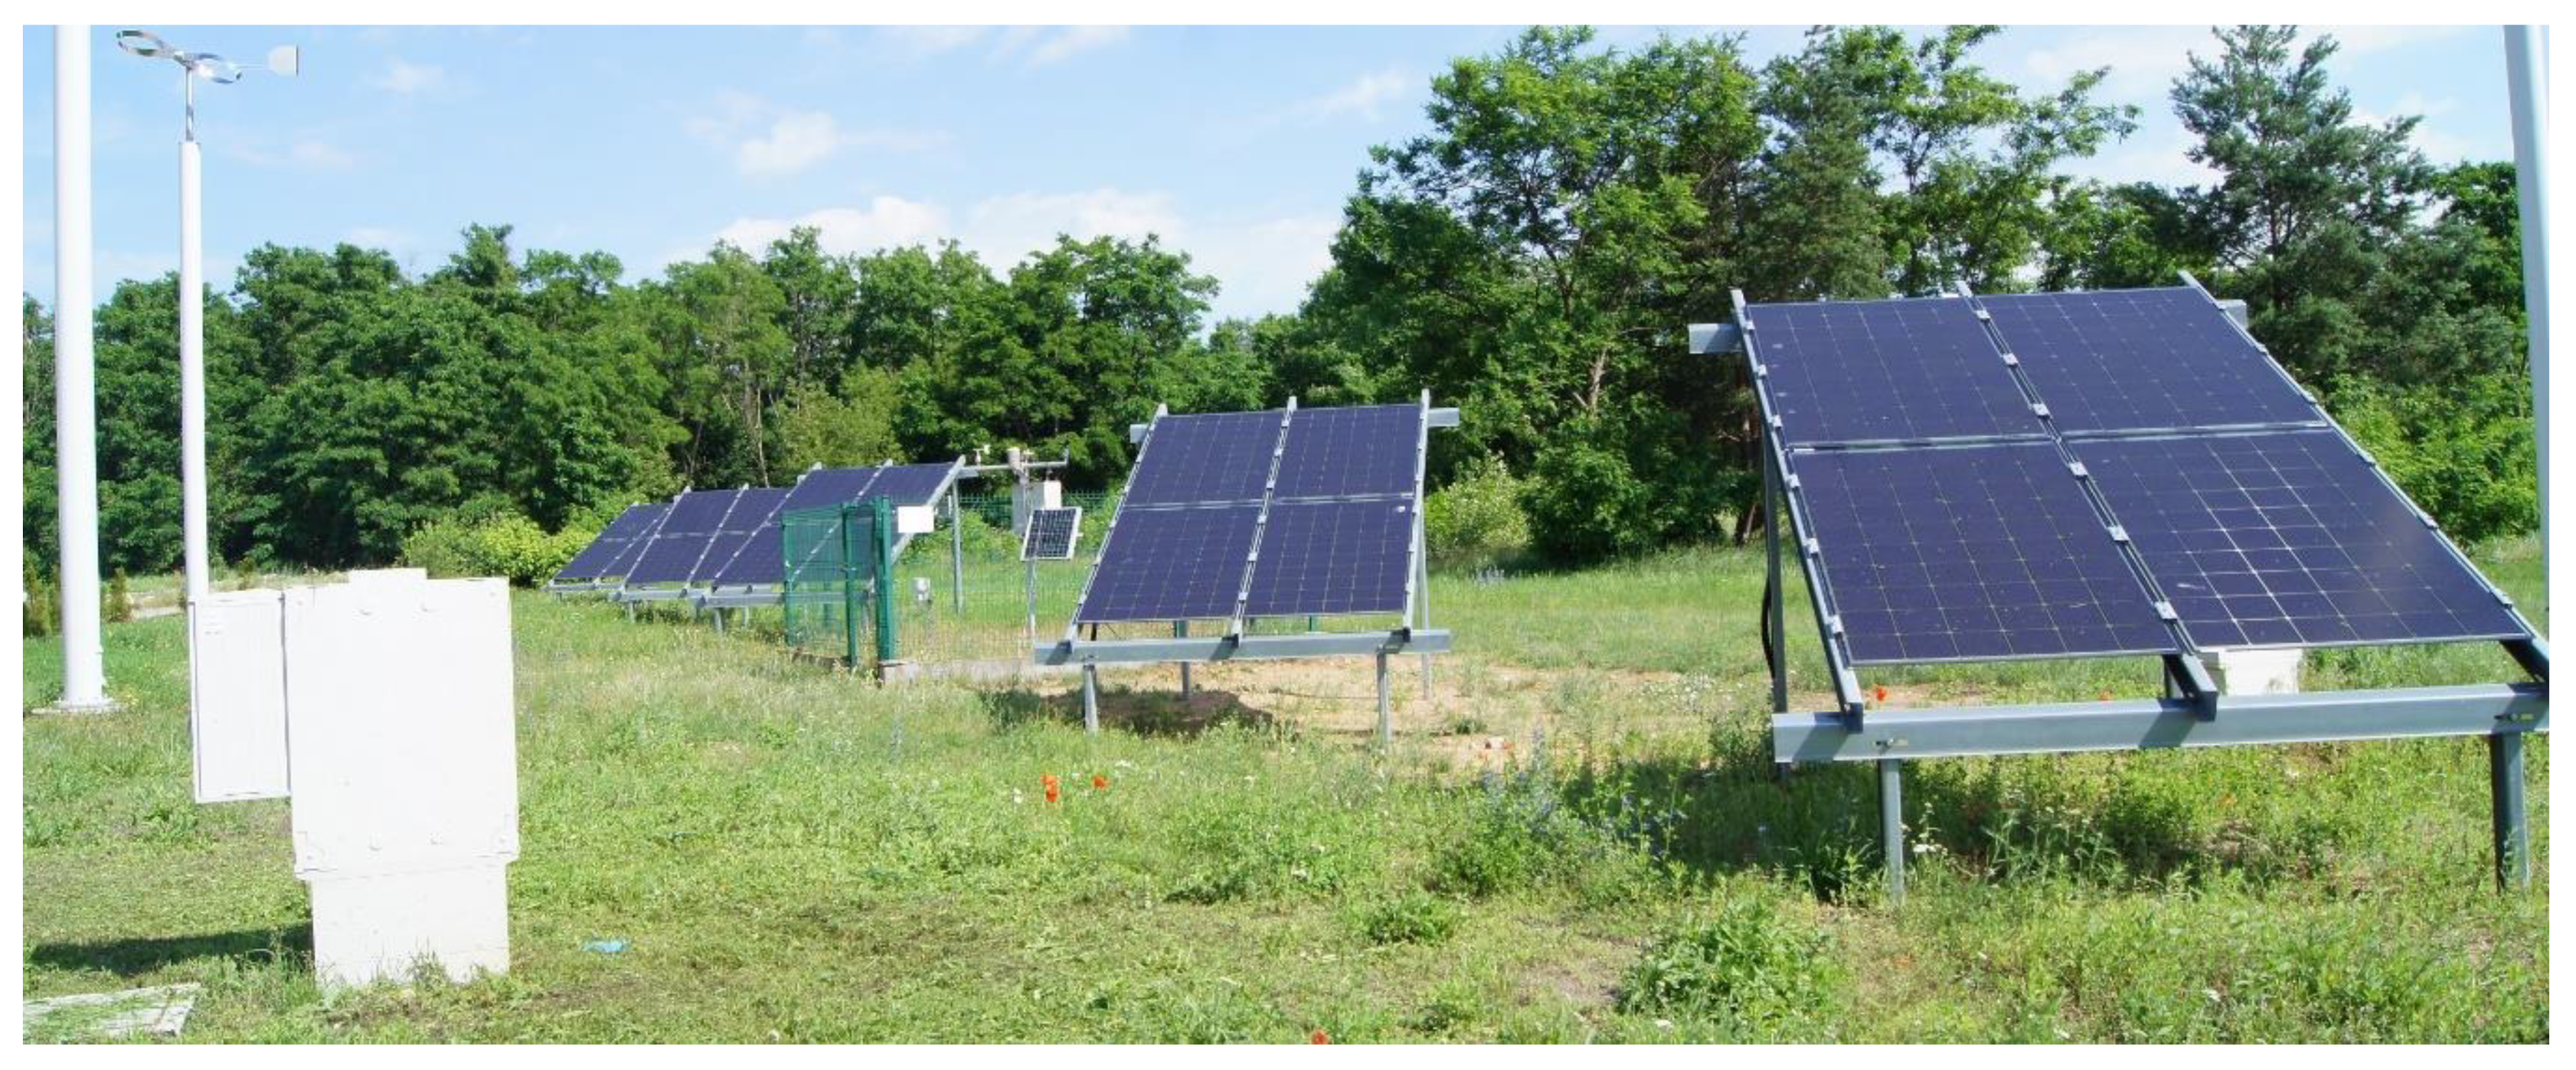
At the UTP University of Science and Technology in Bydgoszcz, at the Faculty of Mechanical Engineering at the Institute of Manufacturing Technique, a photovoltaic installation was built (Figure 7). This installation consists of 20 Hanplast bifacial photovoltaic panels, where each panel consist of cells made in smart-wire technology with a power of 0.305 kWp. The technical data of the panels are included in Table 1. The panels are facing south and inclined at an angle of 45°. They are located on the ground (meadow area), which has a positive effect on their gravity cooling compared to PV installed on the roof surface.
The modules are equipped with a P 370 type power optimiser. The entire system is protected with two SK 3K inverters with 10 PV modules connected to each of the inverters. The installation supplies teaching buildings, including server rooms, whose minimum power demand is greater than the energy production in the PV installation. All the energy produced is used on site. The installation was built at the beginning of 2020, its total cost was EUR 9800.
The lower the values of the temperature coefficient of the open-circuit voltage and temperature coefficient of the power, the less the current efficiency of the panel depends on the panel temperature [50]. Bifacial panels are characterised by lower values.
3. Methodology of Analyses
3.1. Electricity Demand vs. Production
Based on the data on the structure of production and energy consumption in the analysed buildings, the degree of coverage of the demand by PV systems was determined. Two factors have been identified: self-consumption (SC) and self-sufficiency (SS) indicators. The first could show the amount of energy produced and consumed in the same building (electric installation) with respect to total energy production in installations, at the same period of time. The self-sufficiency coefficient (SS) is the amount of energy produced and consumed in the same building (electric installation) with respect to total energy consumption in installations, at the same period of time.
where:
- Esc—energy self-consumed from energy produced in PV installation directly in the building: energy consumption in the building minus energy from the grid
- Ep—energy produced
- τ—time
- Ec—energy consumption in the building
- τ—time
3.2. Annual Energy Gains
Based on the measured monthly data on energy production from both installations and statistical data on insolation on a horizontal surface and for angles characteristic for the installations under consideration (Figure 8 and Figure 9), the correction factors for multi-year analysis were determined. The method used in calculation had been based on [31,51,52,53]. In terms of that the following correction factors were determined: insolation coefficient (IJC), changes in insolation for a given direction and angle of panel installation (IDA), solar radiation conversion for the whole year (JSHIA). The following formula for annual energy gains (EAG) has been proposed:
where:
- EAG—Annual energy gains, kWh/year
- EMG—Measured monthly energy gains, kWh/month
- IJC—Insolation coefficient, kWh/kWh, Equation (4)
- IDA—Correction for Insolation on the direction and angle, kWh/kWh
- JSHIA—Converting the insolation from June to the whole year, month/year,
- I_H_June—Horizontal Insolation in June in year, kWh/(m2·month)
- I_TRY_H_June—Insolation for Typical Reference Year–Horizontal Surface, kWh/(m2·month)
- I_TRY_S45_June—Insolation for Typical Reference Year–south directed surface titled 45°, kWh/(m2·month)
- TRY_SW30_June—Insolation for Typical Reference Year–south-west directed surface titled 30° [18], kWh/(m2·month)
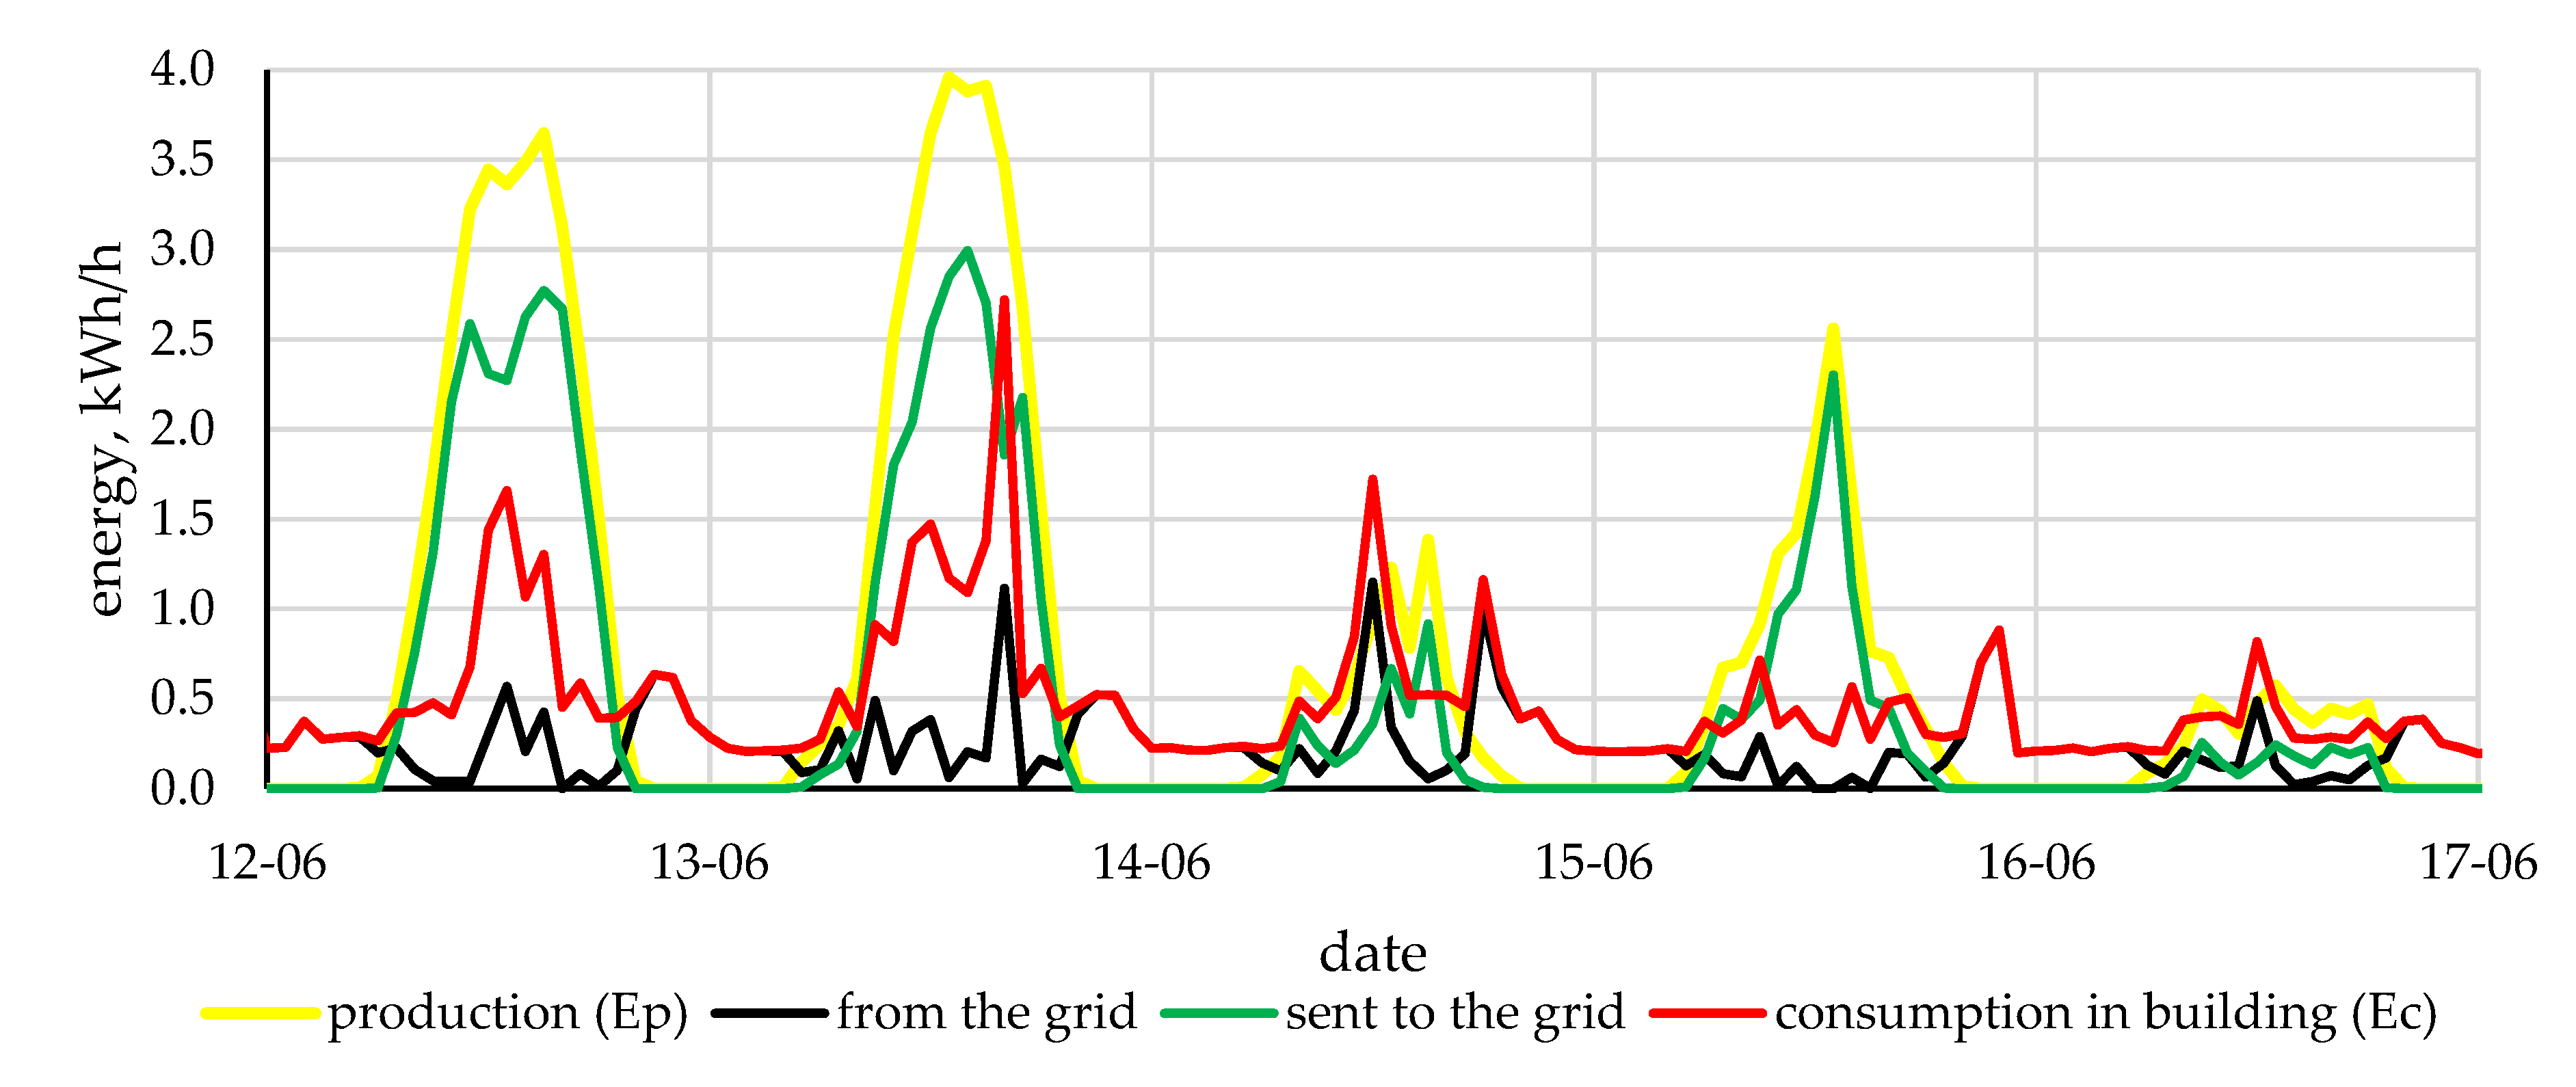
Figure 8.
Energy production in the PV installation Leki and energy: added to the grid, consumed and Energy consumption in the building, June 2020.
Figure 8.
Energy production in the PV installation Leki and energy: added to the grid, consumed and Energy consumption in the building, June 2020.

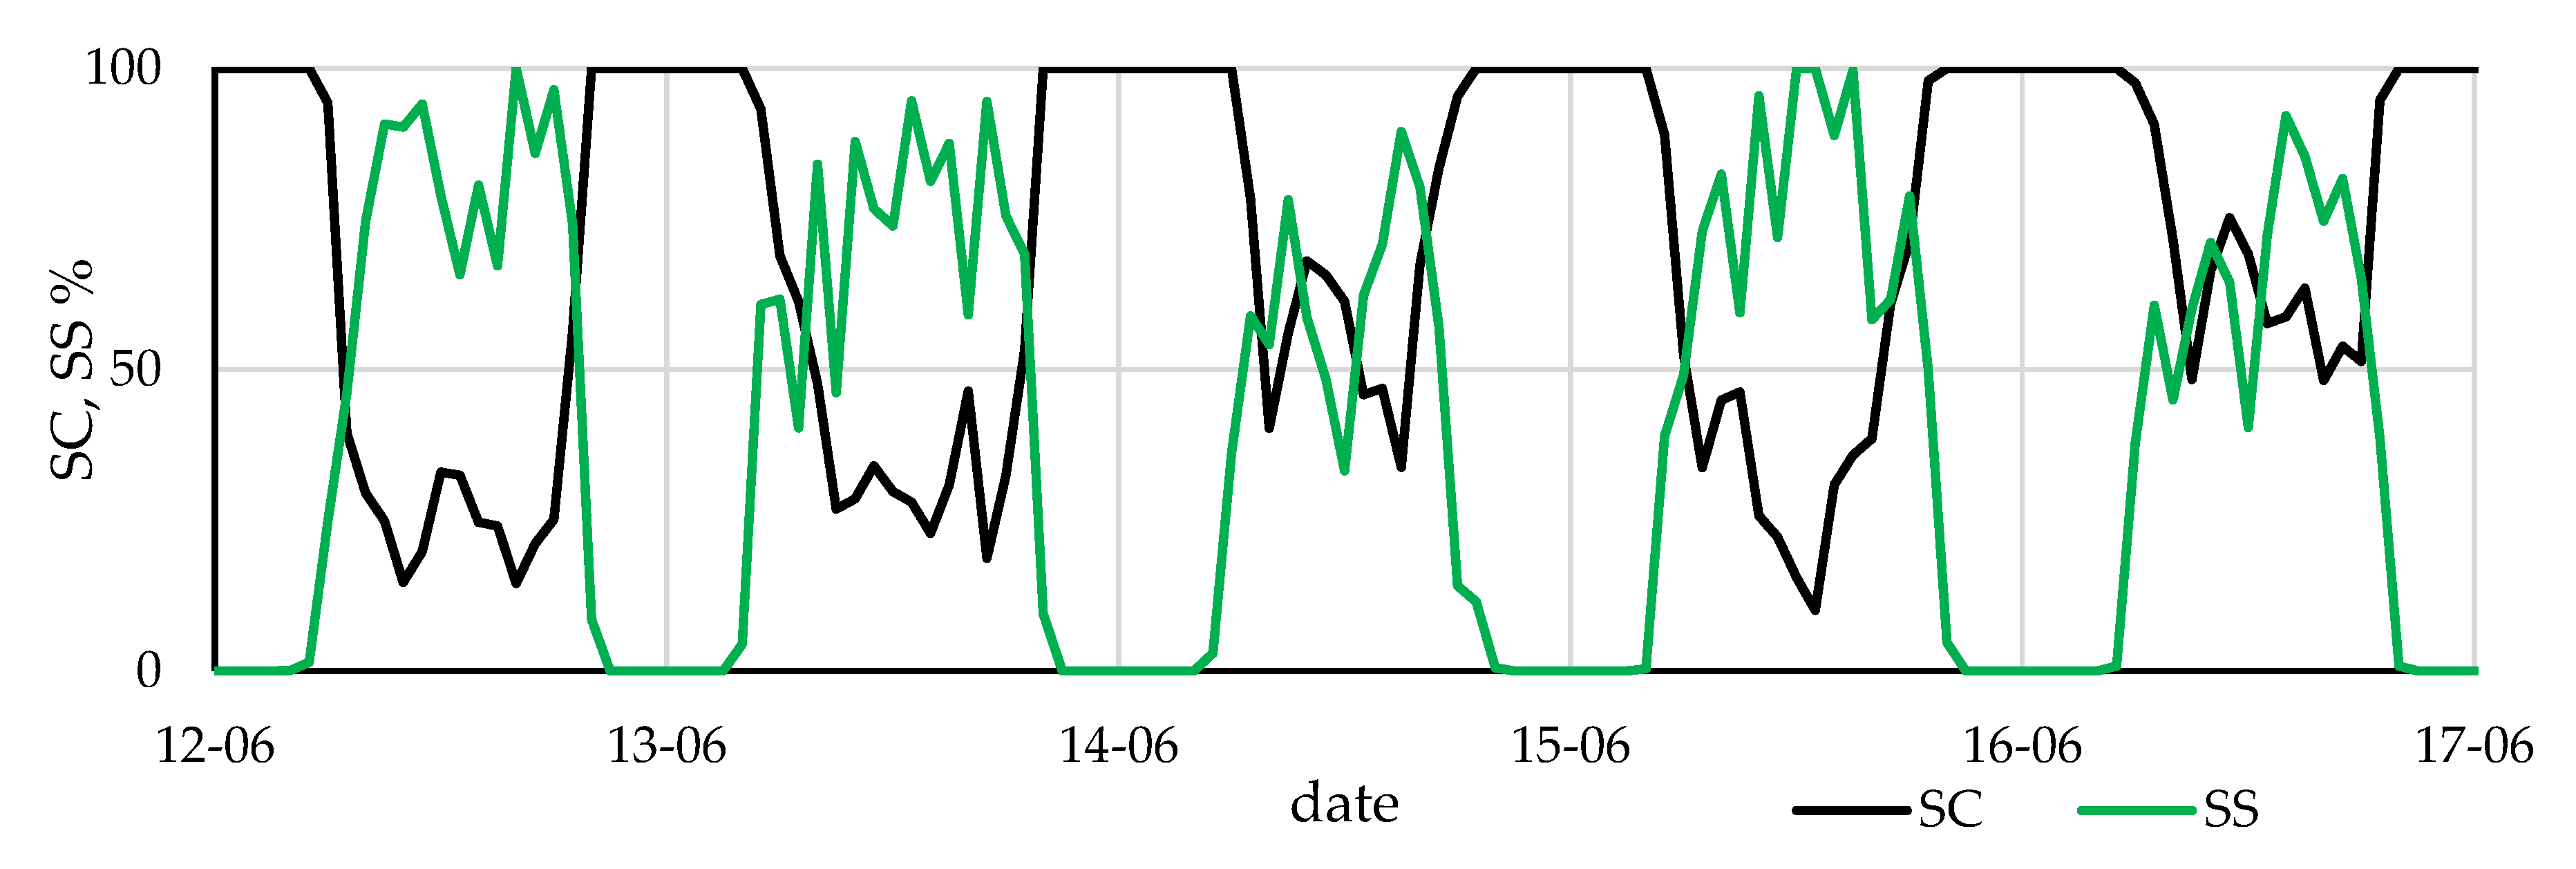
Figure 9.
Self-consumption coefficient (SC) and self-sufficiency coefficient (SS) for several days of June 2020.
Figure 9.
Self-consumption coefficient (SC) and self-sufficiency coefficient (SS) for several days of June 2020.

Based on the insolation data from 2010–2020 [33], the representativeness of insolation data for the analysed June 2020 (JSHI) was determined:
where:
- I_H_June—Horizontal Insolation in June, kWh/(m2·month)
- I_H_Year—Horizontal Insolation in whole year, kWh/(m2·year)
- JSHIA-is average (from 2010 to 2019 year) for value for JSHI, month/year
3.3. Reduce of CO2 Emission
The main reason for the construction of PV installations is the ability to reduce greenhouse gas emissions. The analysis considered two factors, the benefit of reducing CO2 emissions from the combustion of fossil fuels (EECO2) and CO2 emissions that arise during the production cycle of PV panels (EPVCO2) [54].
In Poland, the CO2 emission factor per kWh for end users of electricity (according to KOBiZE) is 0.765 kgCO2/kWh [3,28]. Since the emission factor depends on the type of fuel (brown coal, hard coal) the analysis of EECO2 has been carried out for a range of 0.4–1 kgCO2/kWh. It has been assumed that during PV production the EPVCO2 changes in the range of 20–85 gCO2/kWh.
- ACO2—the amount of CO2 emission avoided, Mg/year
- EAG—Annual energy gains, kWh/year
- EECO2—energy electricity emission factor in Poland, kgCO2/kWh
- EPVCO2—CO2 emission factor for PV, kgCO2/kWh
Additionally, the indicator unit (investment) cost of CO2 emission reduction factor (UCPVCO2) was calculated. The analysis was related to the 20 years of use of the investment and included the total installation costs (I0): Leki-EUR 4250, Bydgoszcz-EUR 9800.
where:
- UCPVCO2—Unit (investment) cost of CO2 emission reduction factor, EUR/kgCO2
- I0—initial investment value, EUR,
- n—lifetime of PV, year
3.4. Profitability Analyses
The purpose of the economic analysis was to compare the economic results using Net Present Value (NPV) (Equation (9)).
Moreover, it was assumed:
- Discount rate (r), varies in range from 0 to 0.06 [55],
- Decrease in the PV panels productivity by 0.5% per year
- CFt is the cash flow in the year t, EUR (Equation (10)),
- t—year of the analysis,
- r—discount rate, %
- CFt is the cash flow in the year t, EUR,
- OC—operating cost, EUR/year,
- PF—prosumer factor,
- ElP—electricity price, EUR/kWh,
- SC—self-consumption, Equation (1)
For the Leki installation, which was covered by the subsidy program, the cost of reducing CO2 emissions was calculated for the options with and without subsidies. For Bydgoszcz, the analysis was compared to the cost invested in the installation.
Additionally, NPV differences were calculated for different ElP values and for different r values:
4. Results and Discussion
4.1. Electricity Demand vs. Production
Figure 8 presents the details of the energy production, flow and consumption in the building Leki for selected days with high and low energy production.
For the data presented in Figure 8, self-consumption (SC) and self-sufficiency (SS) indicators were determined.
High production was achieved on the 13 June and it was 32.22 kWh of which 21.98 kWh were sent to the grid. Consumption on the analysed day was 16.95 kWh, of which 6.71 kWh were obtained from the grid. For comparison, on June 14th, it was 8.04 kWh of which 3.65 kWh were sent to the grid. The consumption on that day was 11.91 kWh, of which 7.52 kWh were obtained from the grid.
The SC and SS coefficients were determined for 12–17 June, the obtained results are presented in Figure 9. Then the SC and SS were determined for all hours of June-Figure 10.
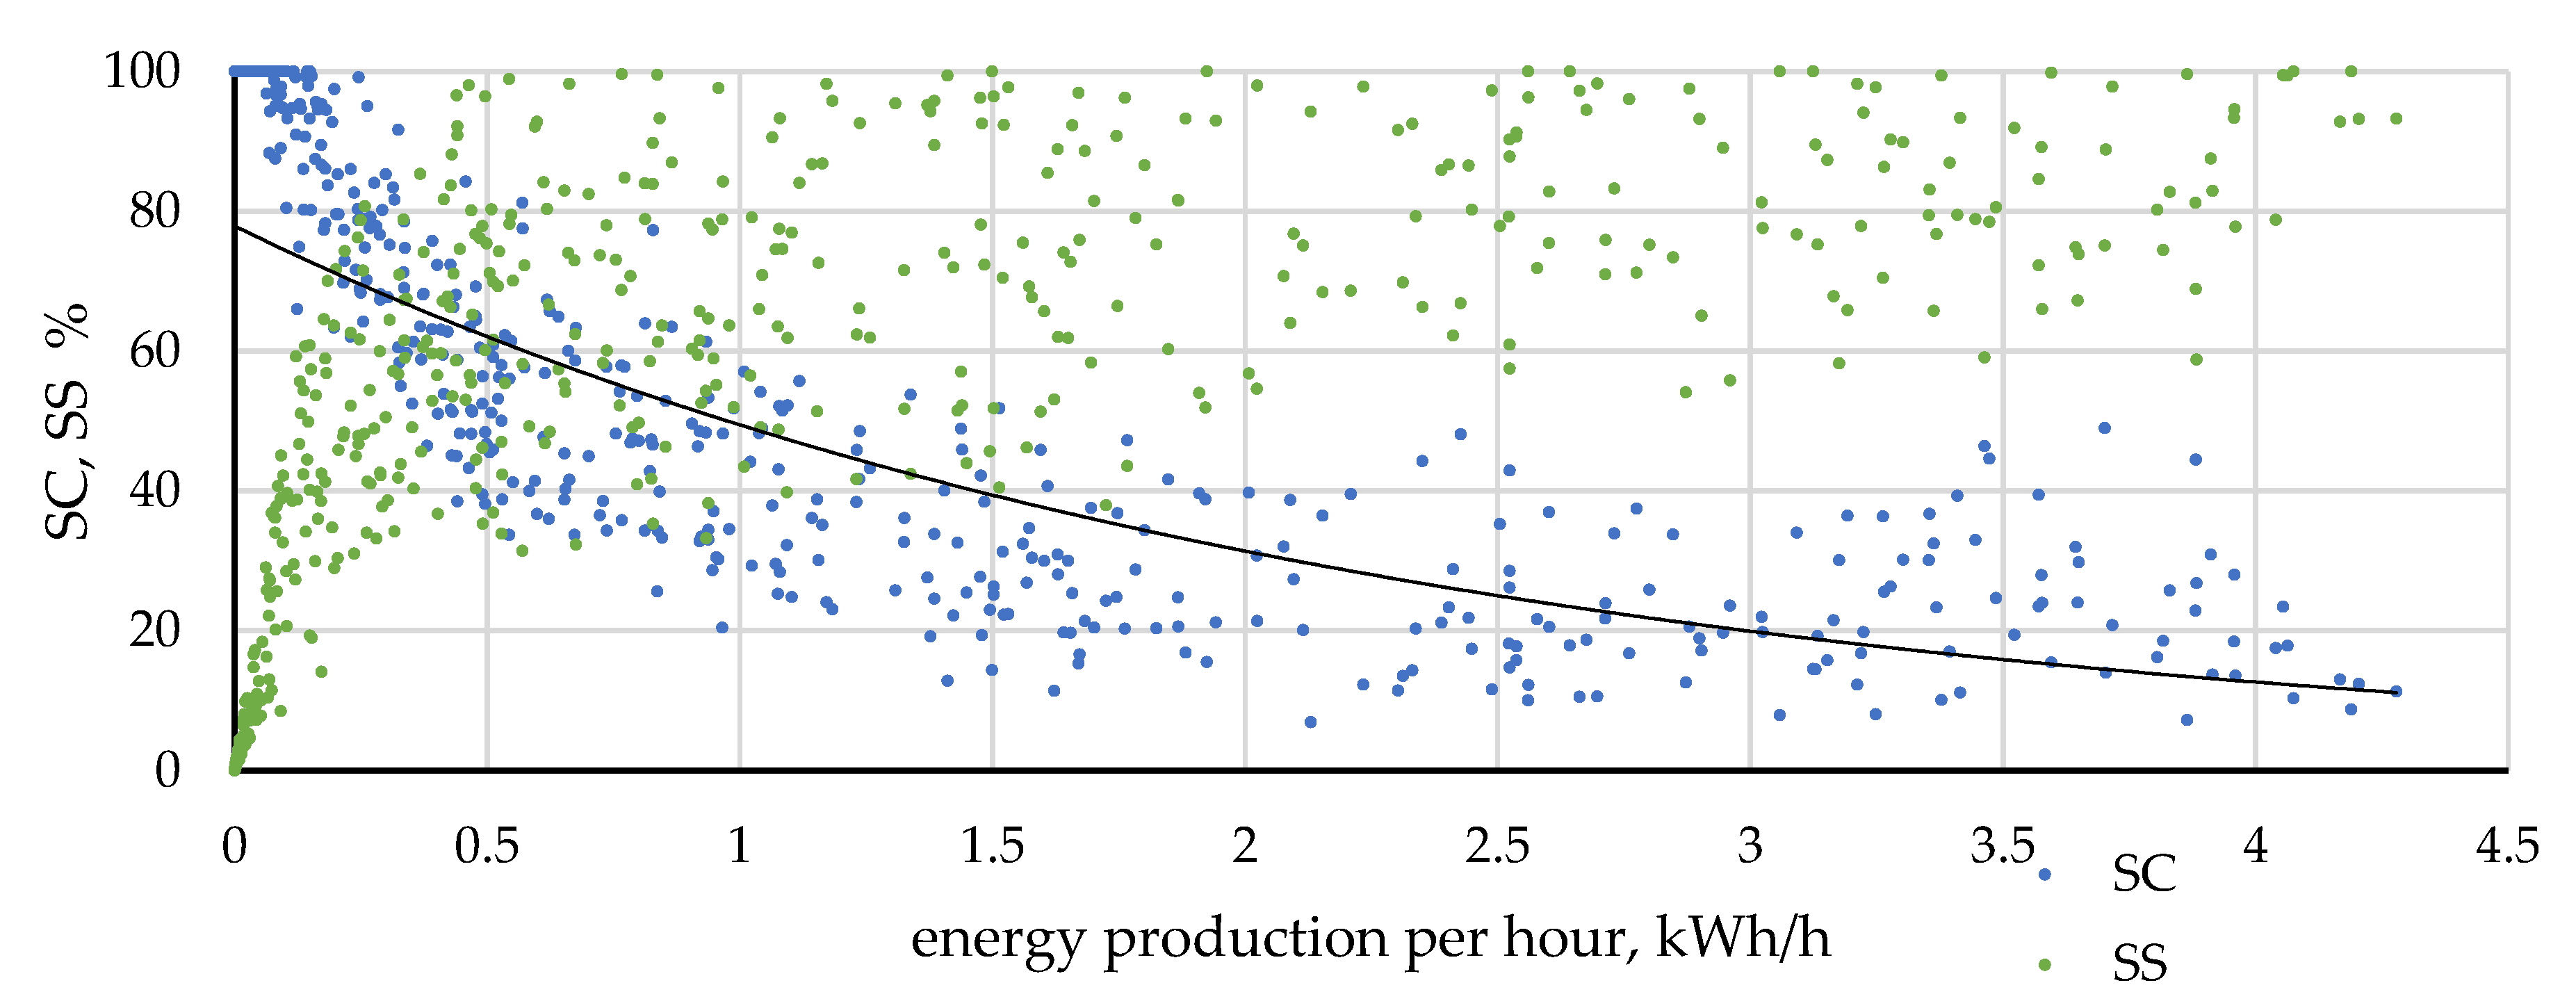
For various conditions that were observed from 12 June to 17 June, it was found that only for 4 h the SS value was 100%, it means that the PV installation fully covered the energy consumption only through 4 h. In whole June, it was, only for 31 h. The SC coefficient decreases with increasing productivity and is close to 100% only for low PV powers below 10% of nominal power, observed at low intensity of solar radiation (see Figure 8 and Figure 9). The SS behaves the opposite (Figure 10). In the analysed period (June 2020), the average SC value was 30.4% and the SS was 48.9%.
For bifacial installation, the energy produced by the system is used in the University buildings. The SC ratio is 100%.
4.2. Anually Gain
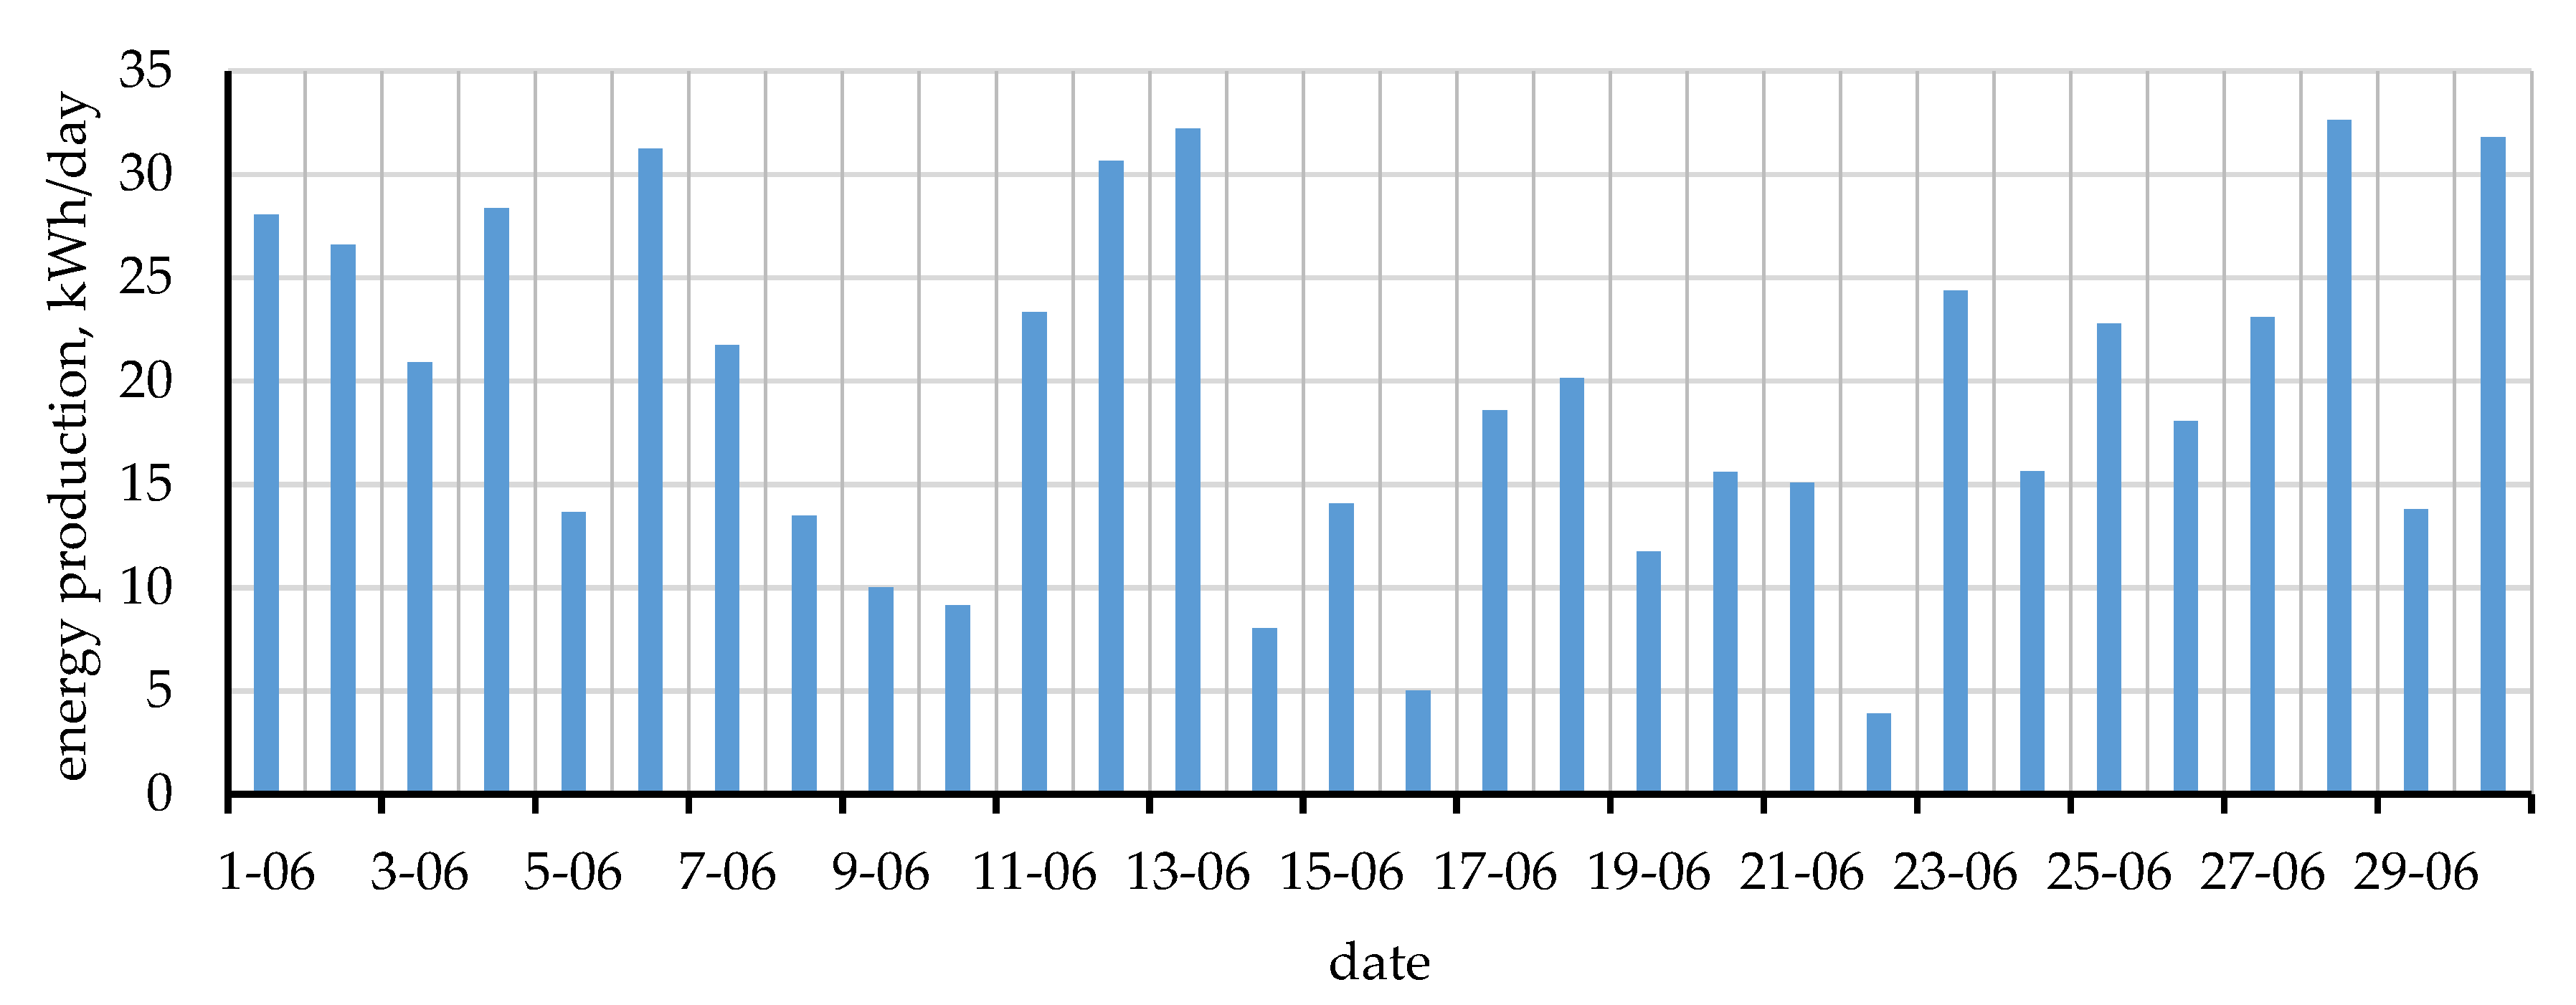
The amount of energy produced by the Leki installation in the form of daily sums is presented in Figure 11. The daily production of monofacial PV installation varied from 4 kWh to 32.5 kWh. In total, 583.87 kWh (EMG) was achieved in the period under examination.
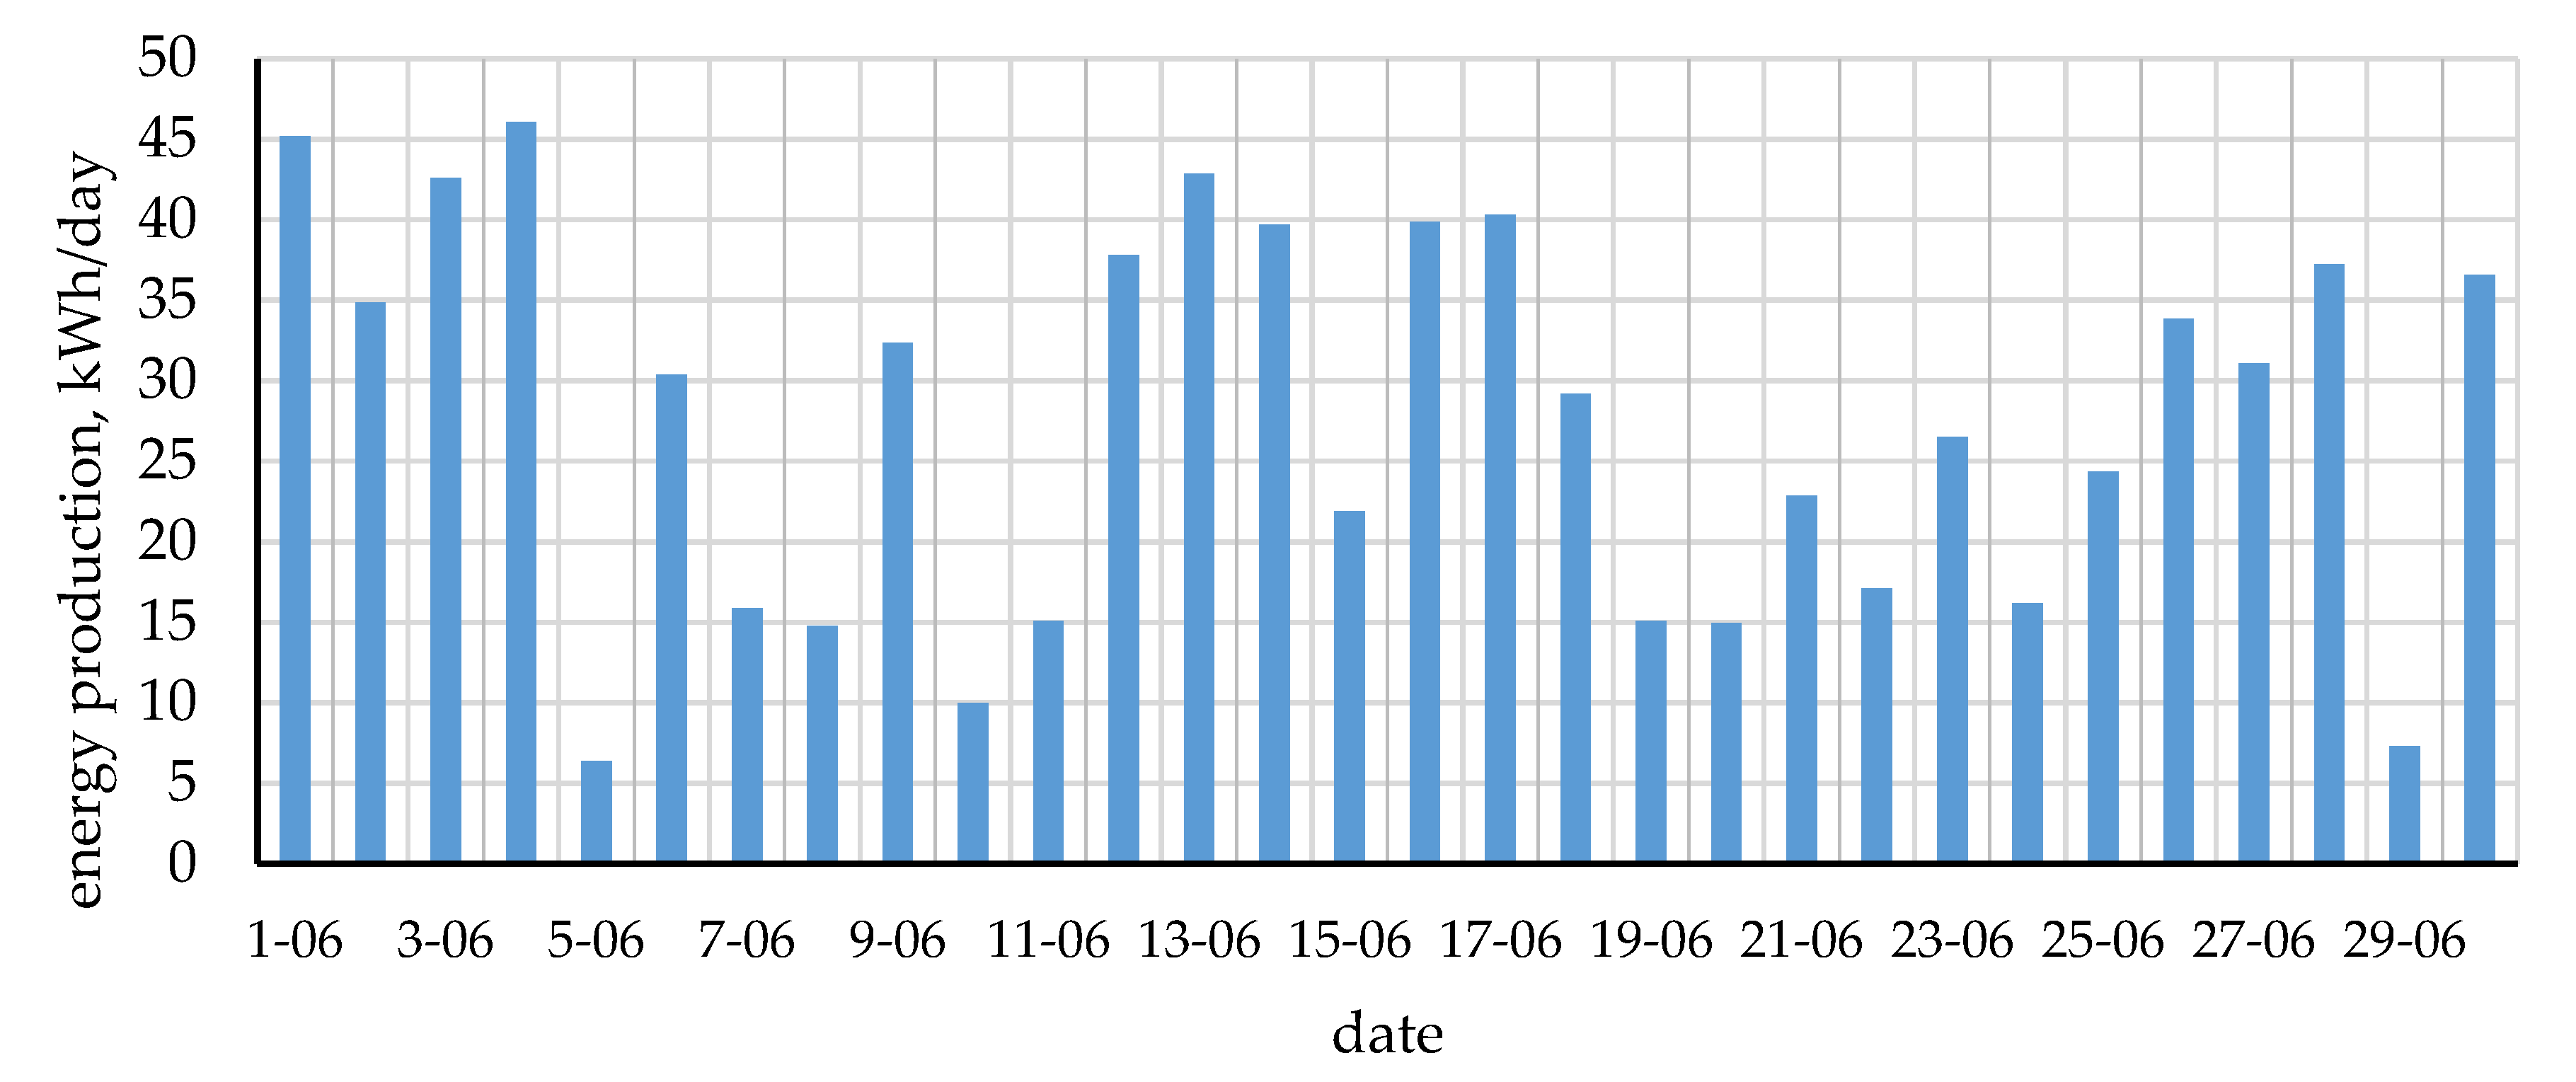
The daily production of bifacial PV installation in Bydgoszcz in June 2020 ranged from 6.4 kWh to 46 kWh (Figure 12). Total production for June was measured as 828.13 kWh (EMG).
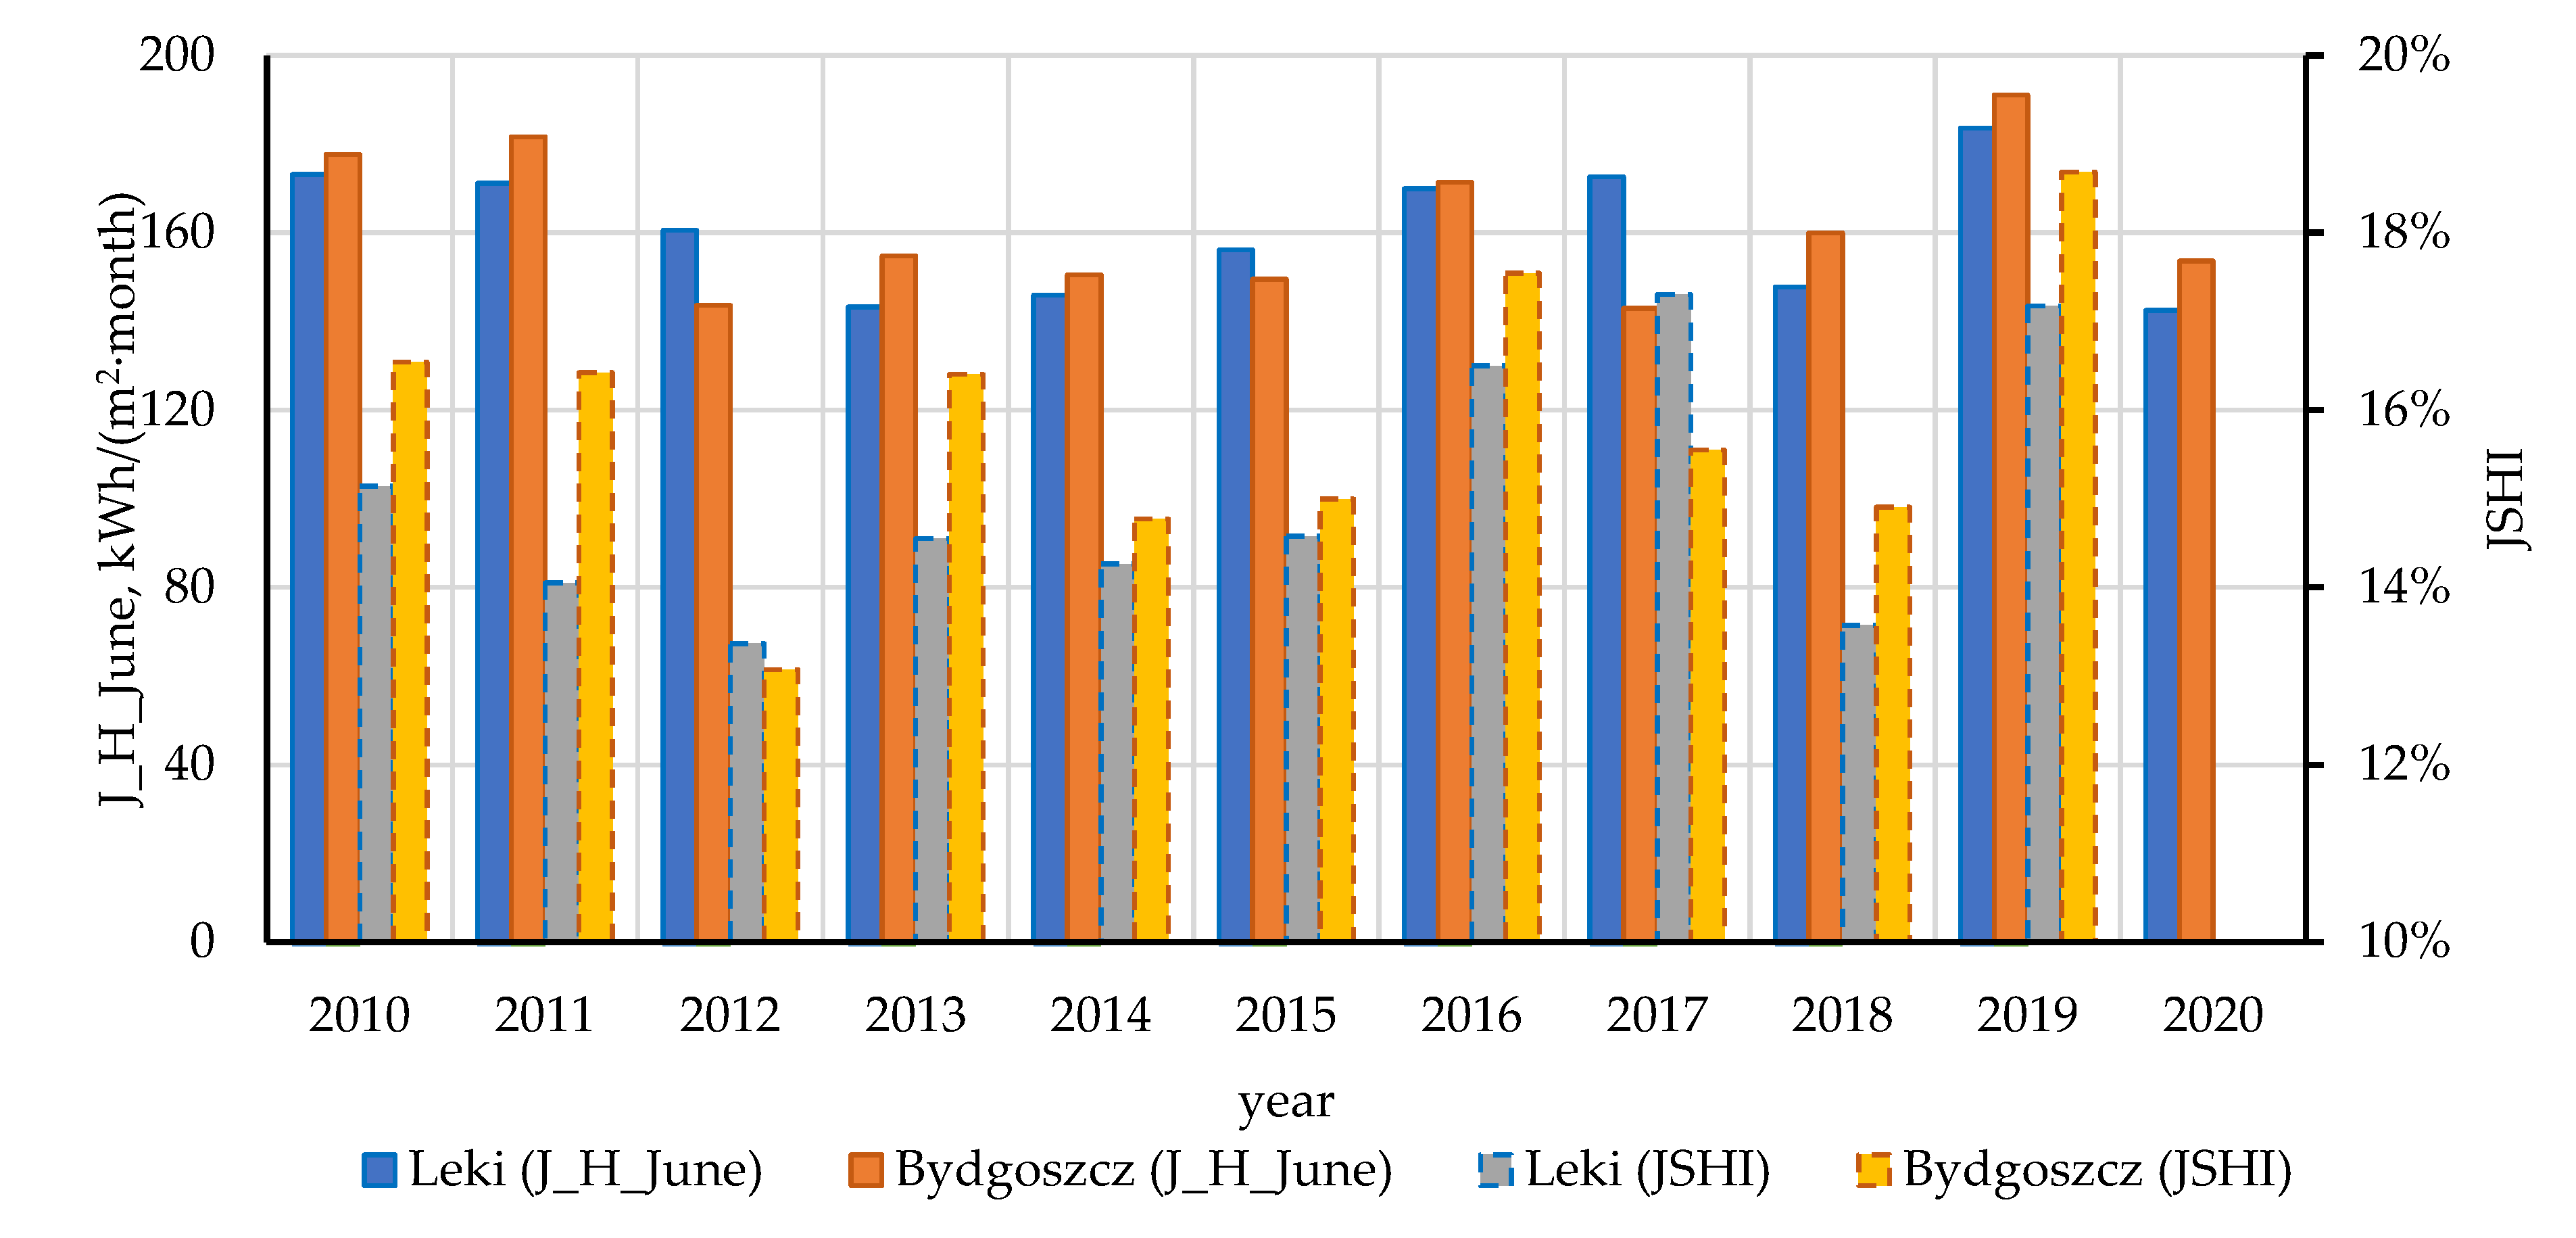
The recorded insolation values for each June in 2010–2020 for both locations are presented in Figure 13.
In 2010–2020, the value of insolation in June for Leki varied from 145 kWh/(m2·month) to 184 kWh/(m2·month), and for Bydgoszcz from 144 kWh/(m2·month) to 191 kWh/(m2·month). The value of insolation for Leki and Bydgoszcz in June 2020 was 142.45 kWh and 153.63 kWh (see also Figure 15) and was lower than the 11-year average by 11% and 5%. For further calculations it was assumed that the insolation coefficient IJC for the installation Leki and Bydgoszcz was 0.89 and 0.95, respectively.
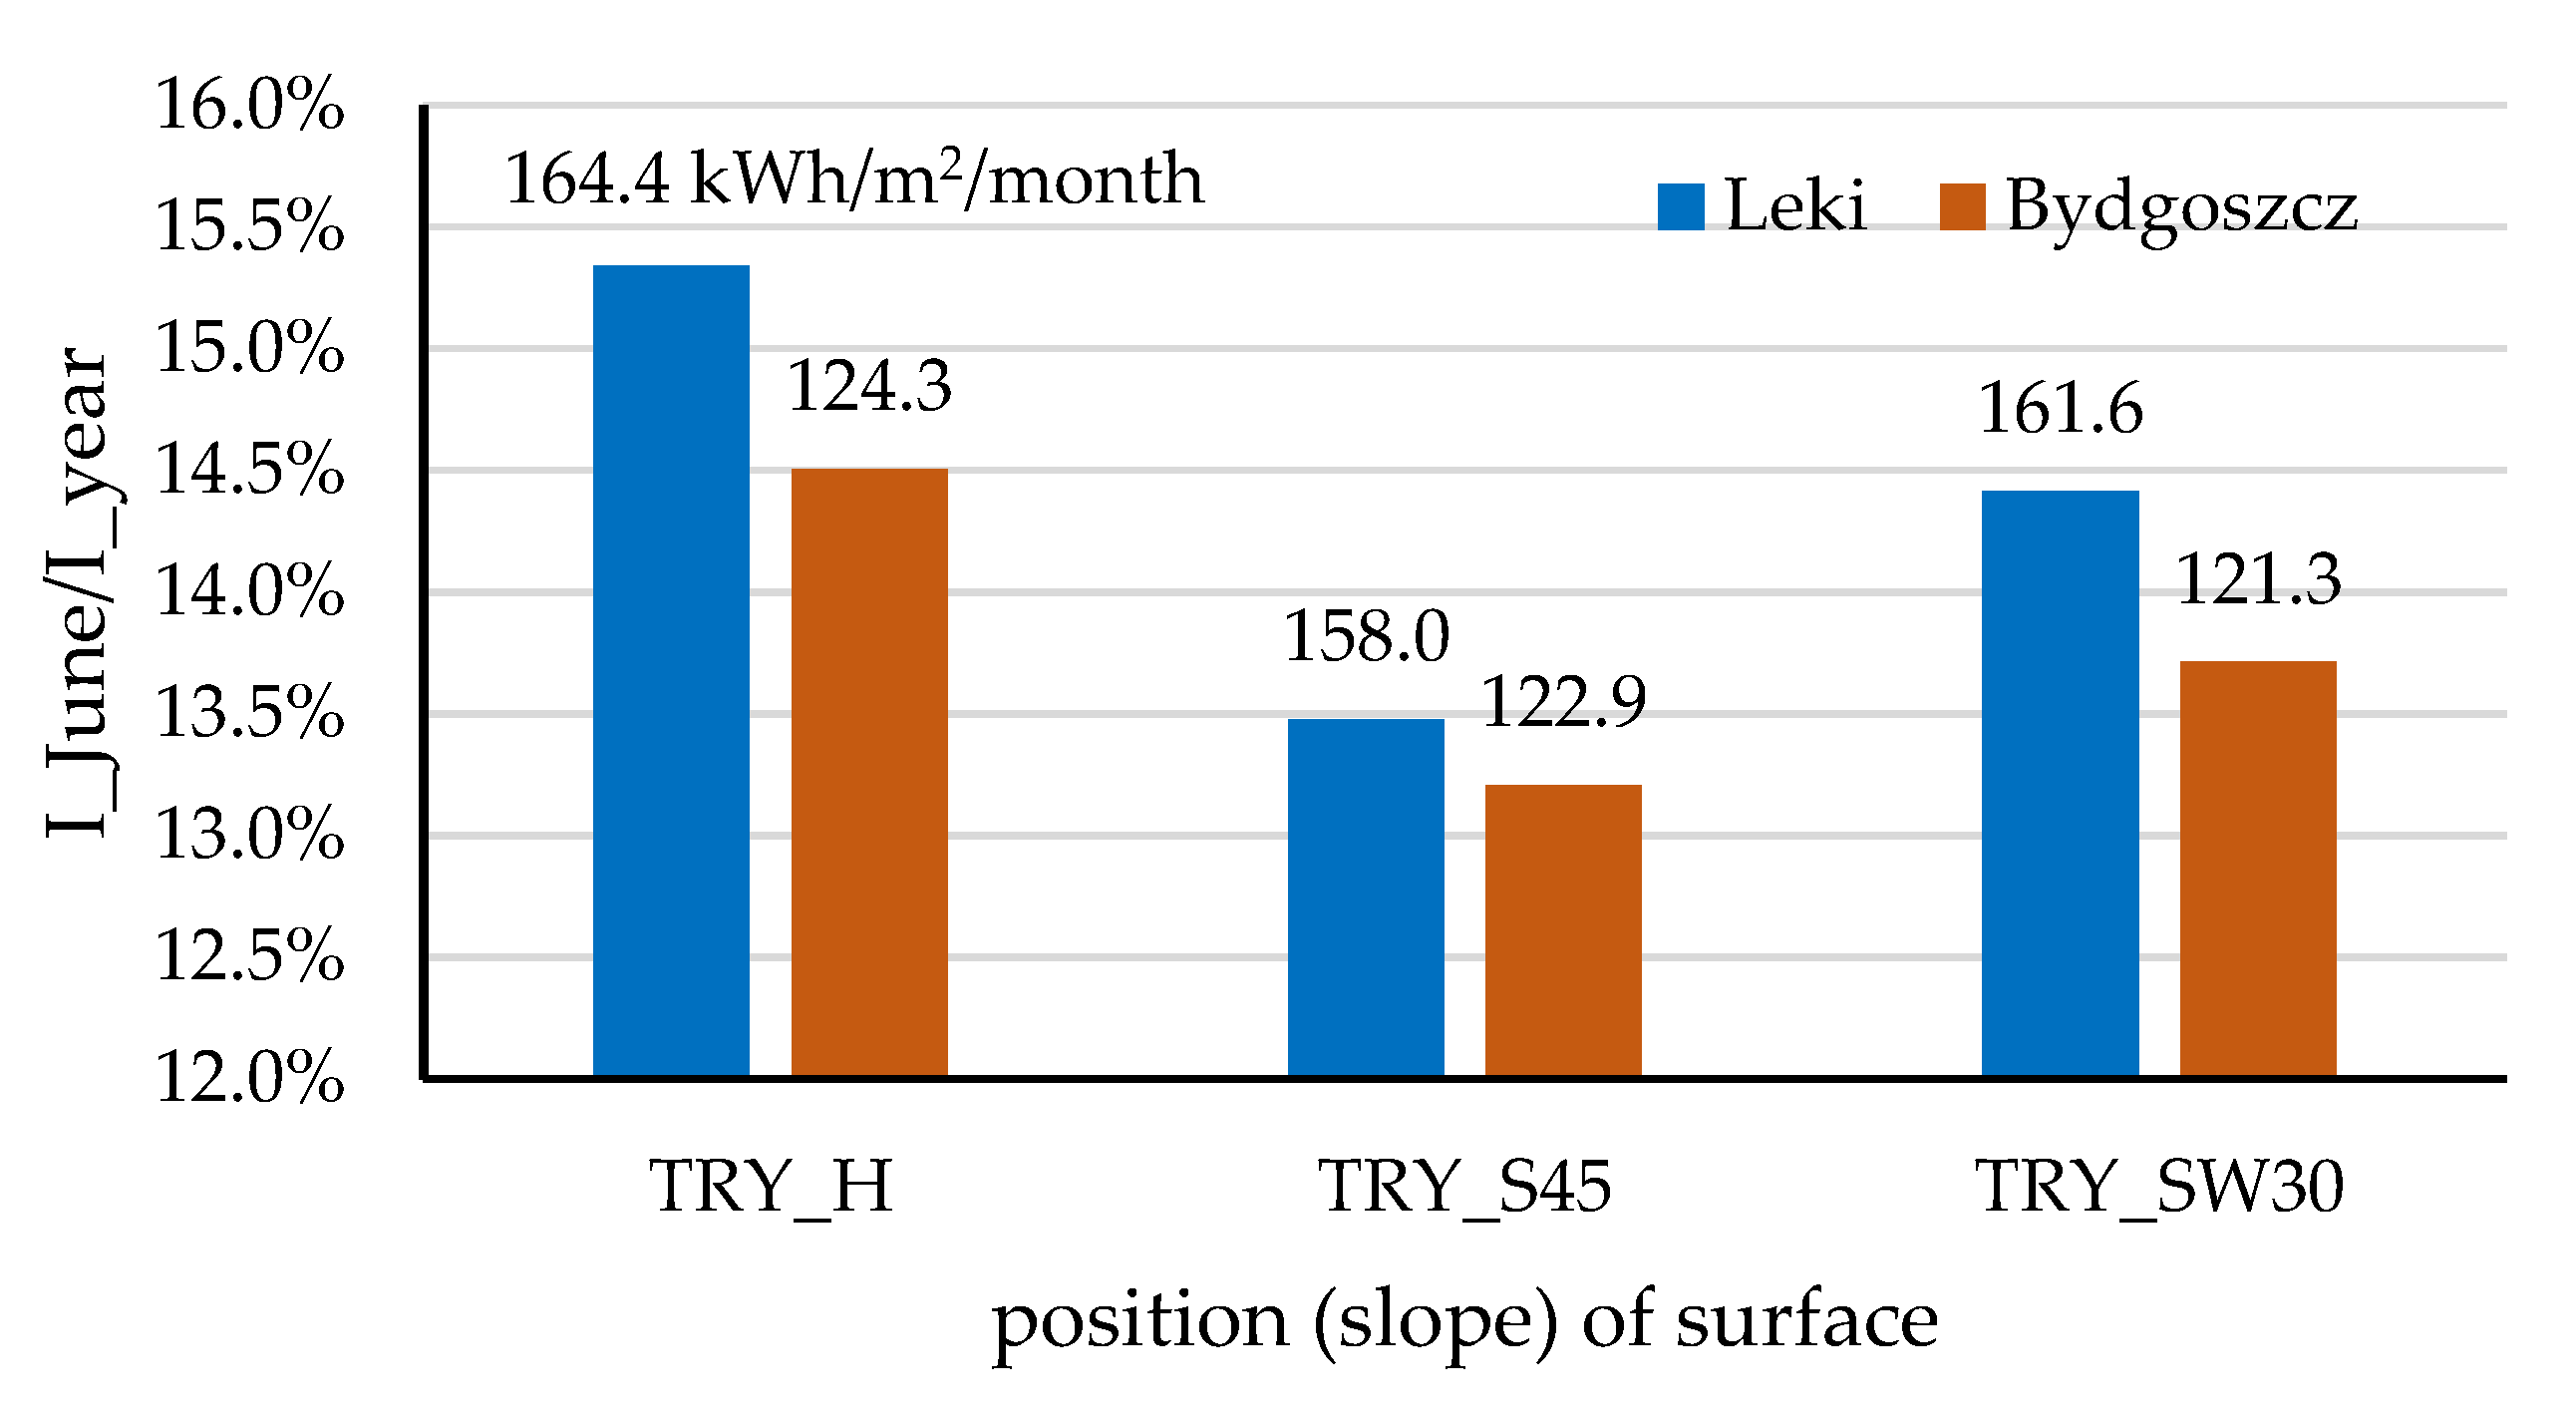
On the basis of NASA Larc data [33], the average share of registered sunlight falling on the horizontal surface for June was determined for both locations in relation to the annual amount (TRY_H). The solar representativity for the south (TRY_S45) and south-west (TRY_SW30) direction was also determined, referring to the percentage of insolation for June in the year (Typical Reference Year)–Figure 14.
The average share of the registered insolation in June in relation to the annual value was 15% and 15.9% (Figure 13) and was lower by 0.3 percent point (Leki) and higher by 1.4 percent point (Bydgoszcz) compared to the Typical Reference Year (Figure 11). Taking into account the direction of the panels’ installation, the insolation value for Leki differs by 0.9% compared to the Typical Reference Year-horizontal, while for Bydgoszcz by 1.2% compared to the Typical Reference Year-horizontal. For further calculations it was assumed that the insolation on the direction and angle coefficient (IDA) for the Leki and Bydgoszcz installations is 0.991 and 0.988, respectively.
Taking into account the coefficients IJC, IDA, JSHIA (Table 3) for both locations, the annual energy gain (EAG) for Leki and Bydgoszcz was calculated as 4300 kWh, 6091 kWh.
4.3. Comparison of Solar Energy Production
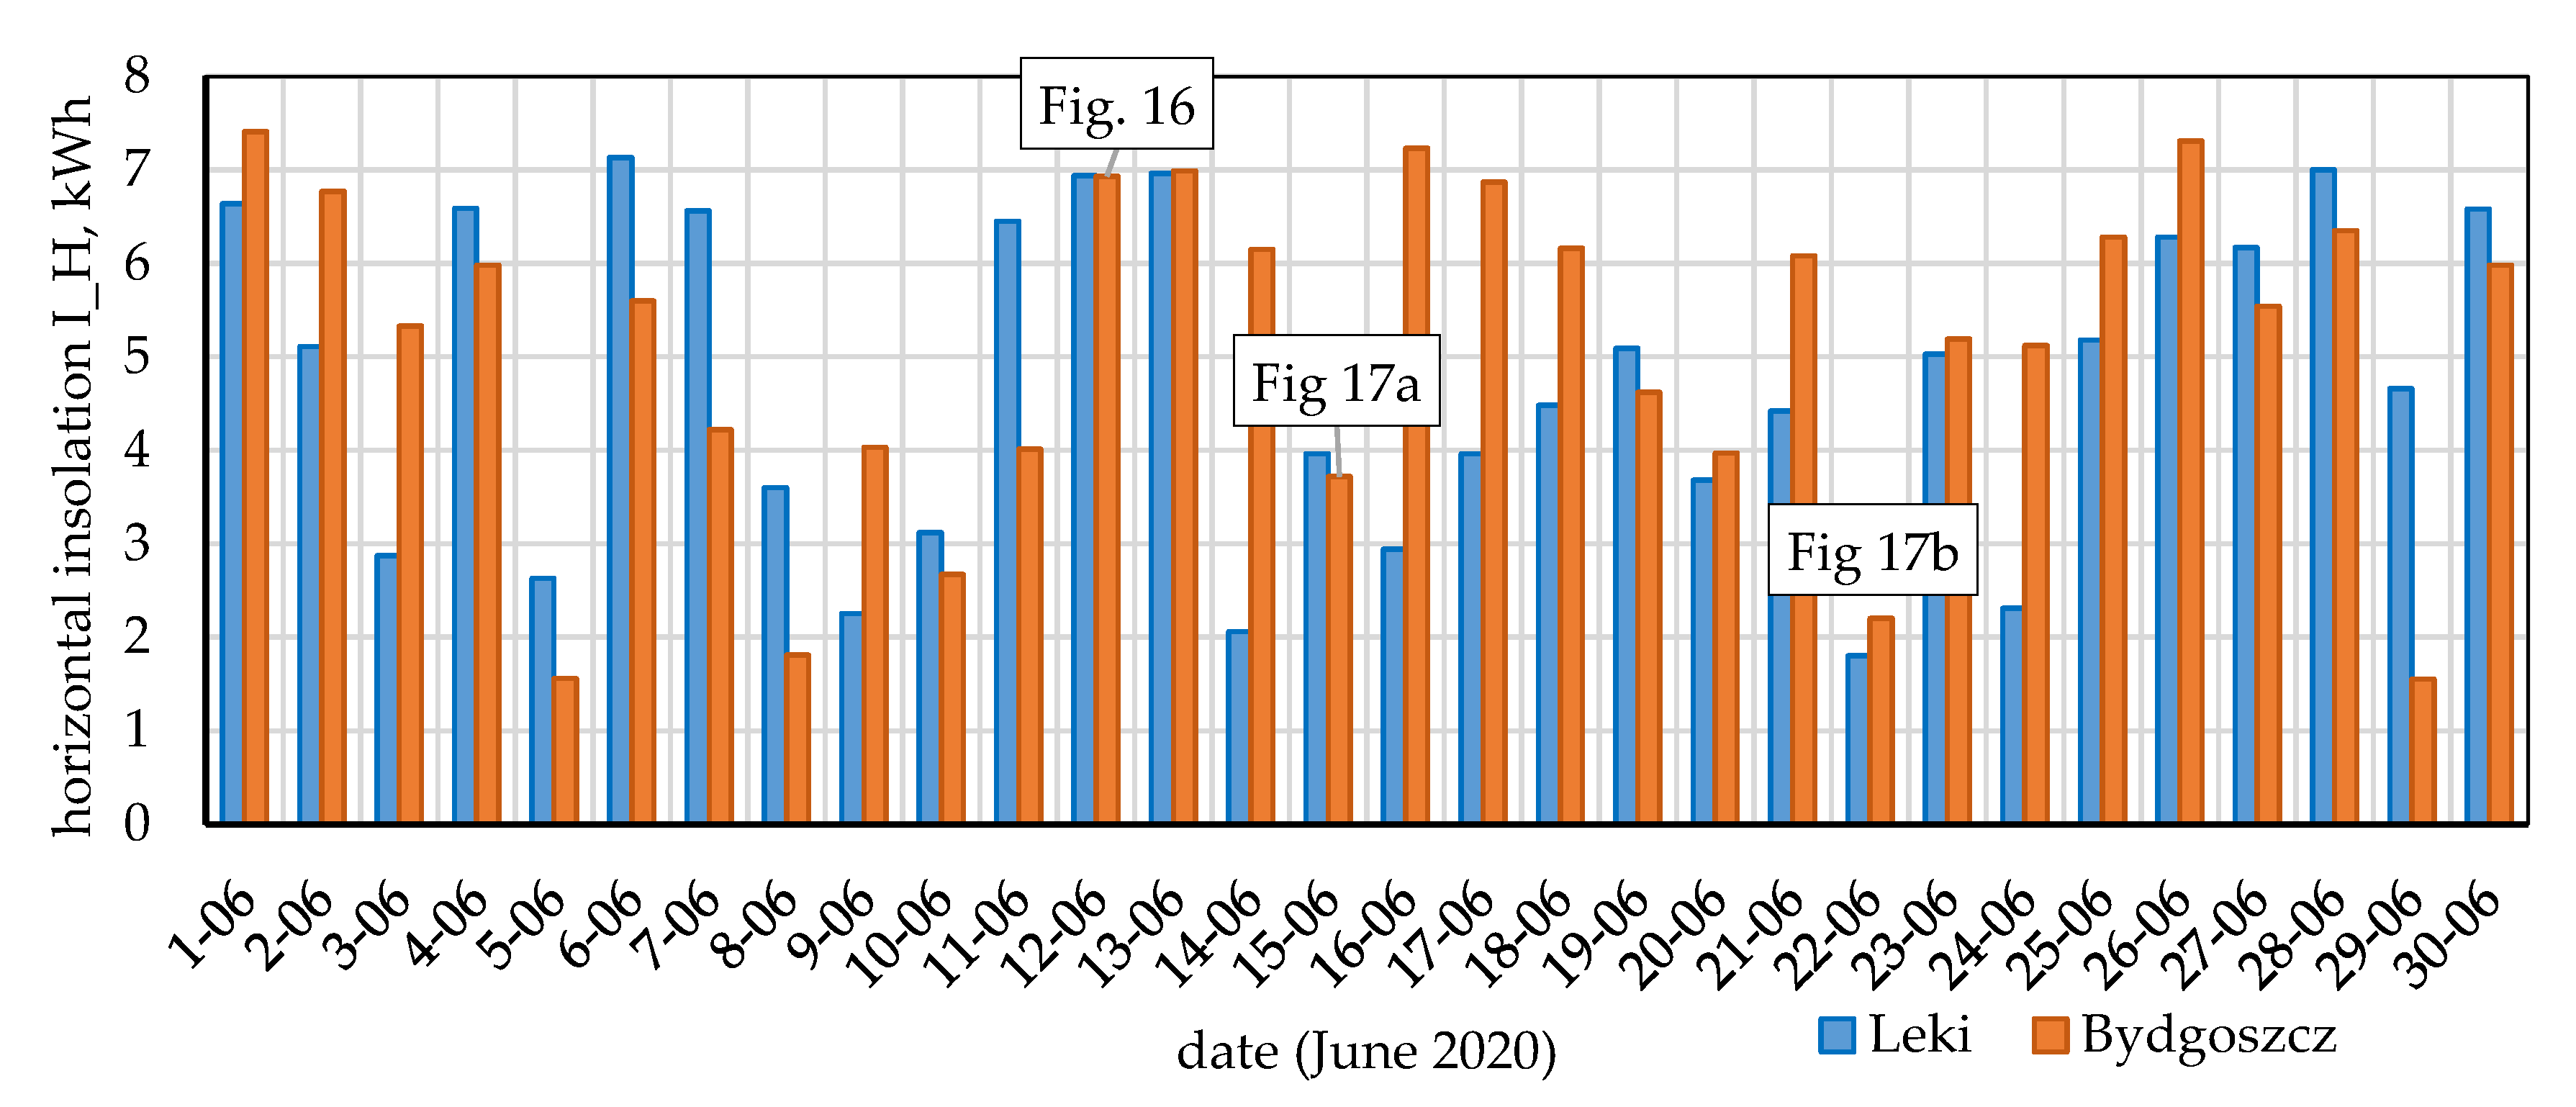
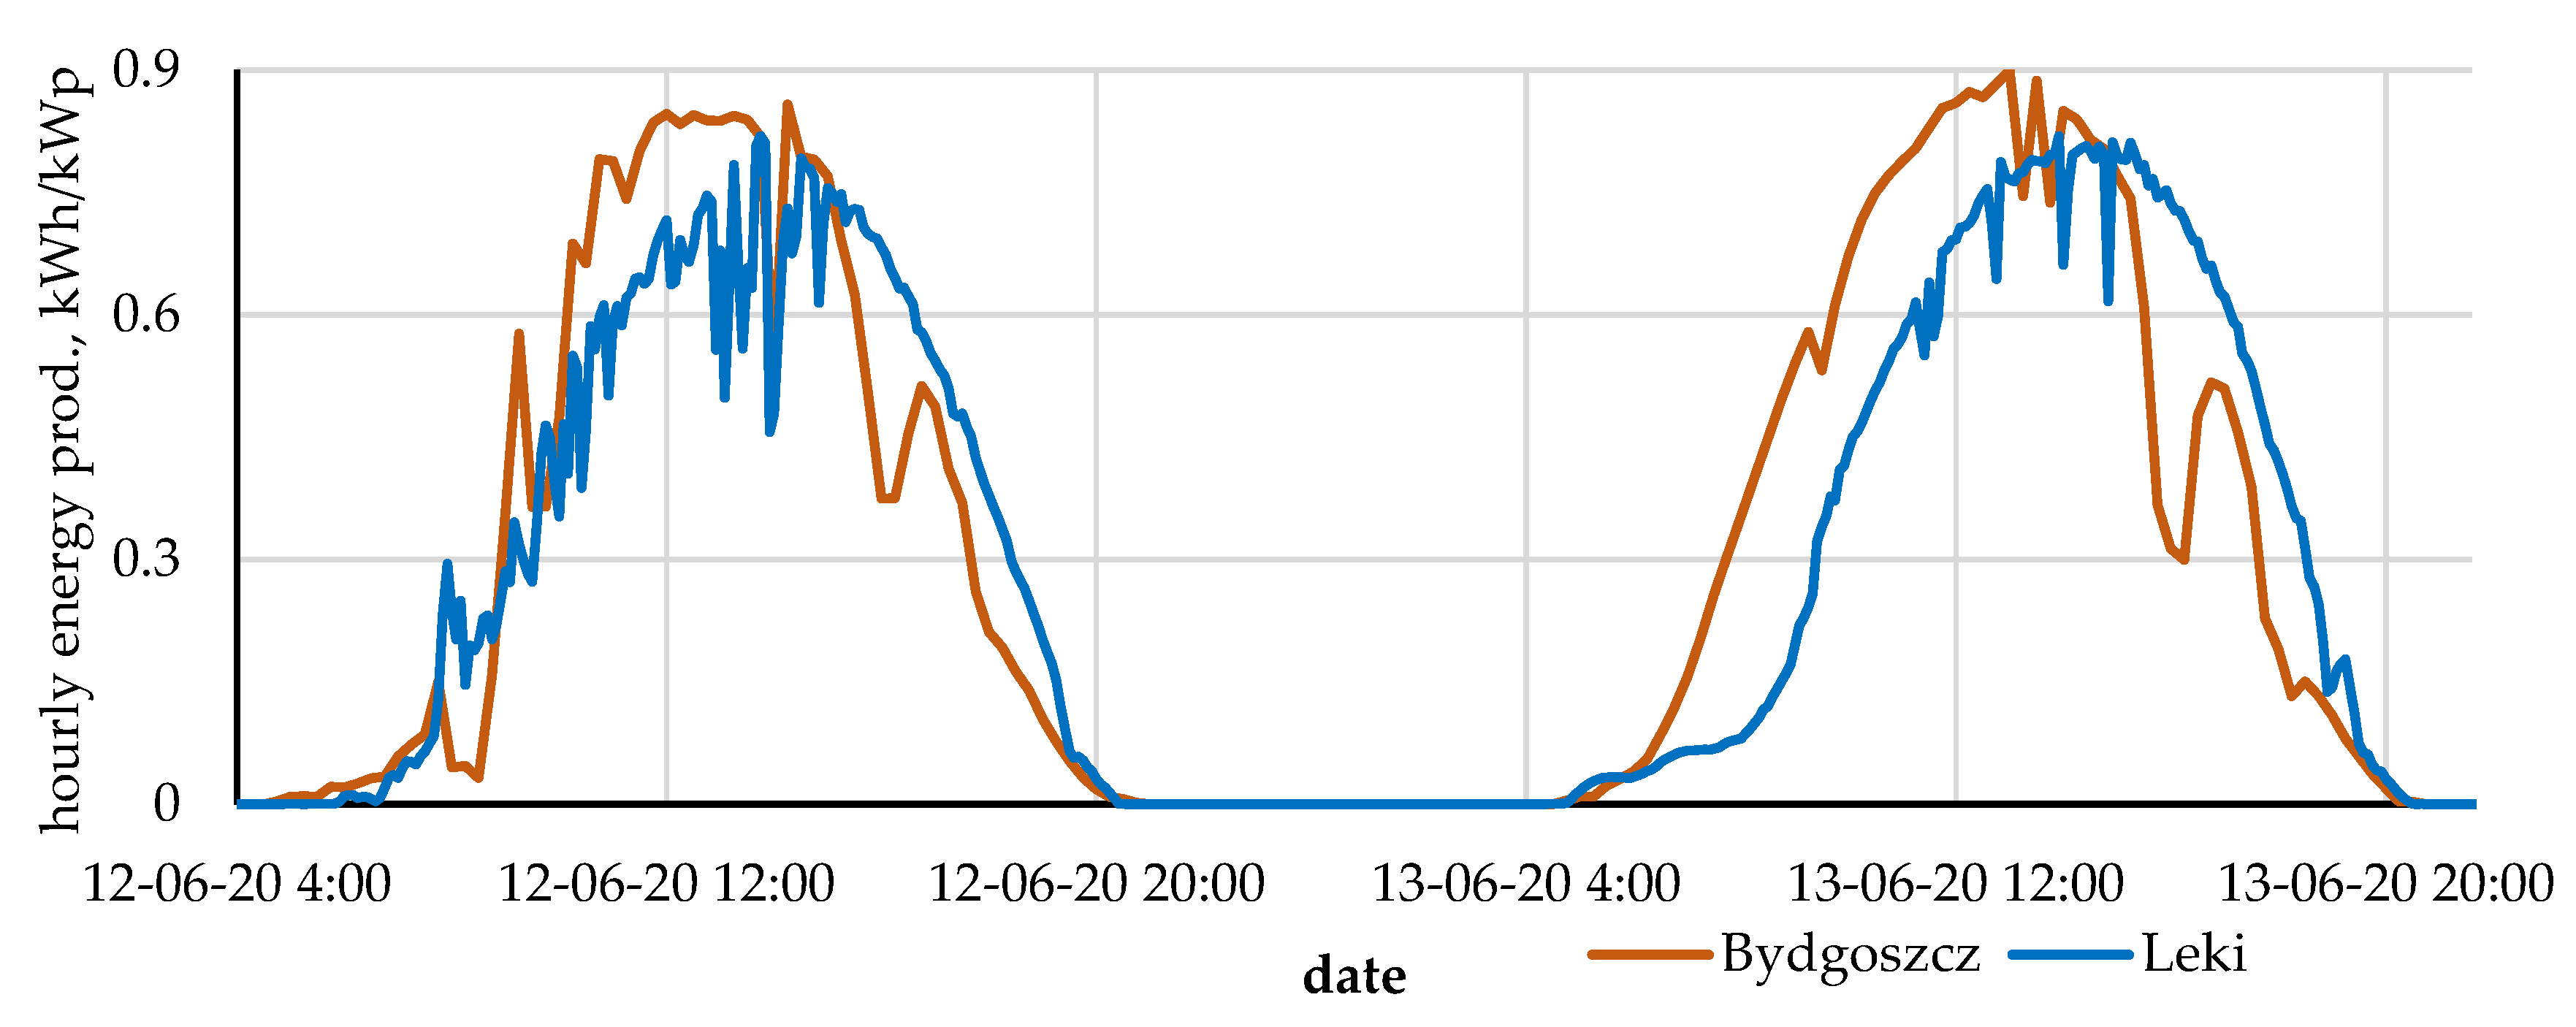
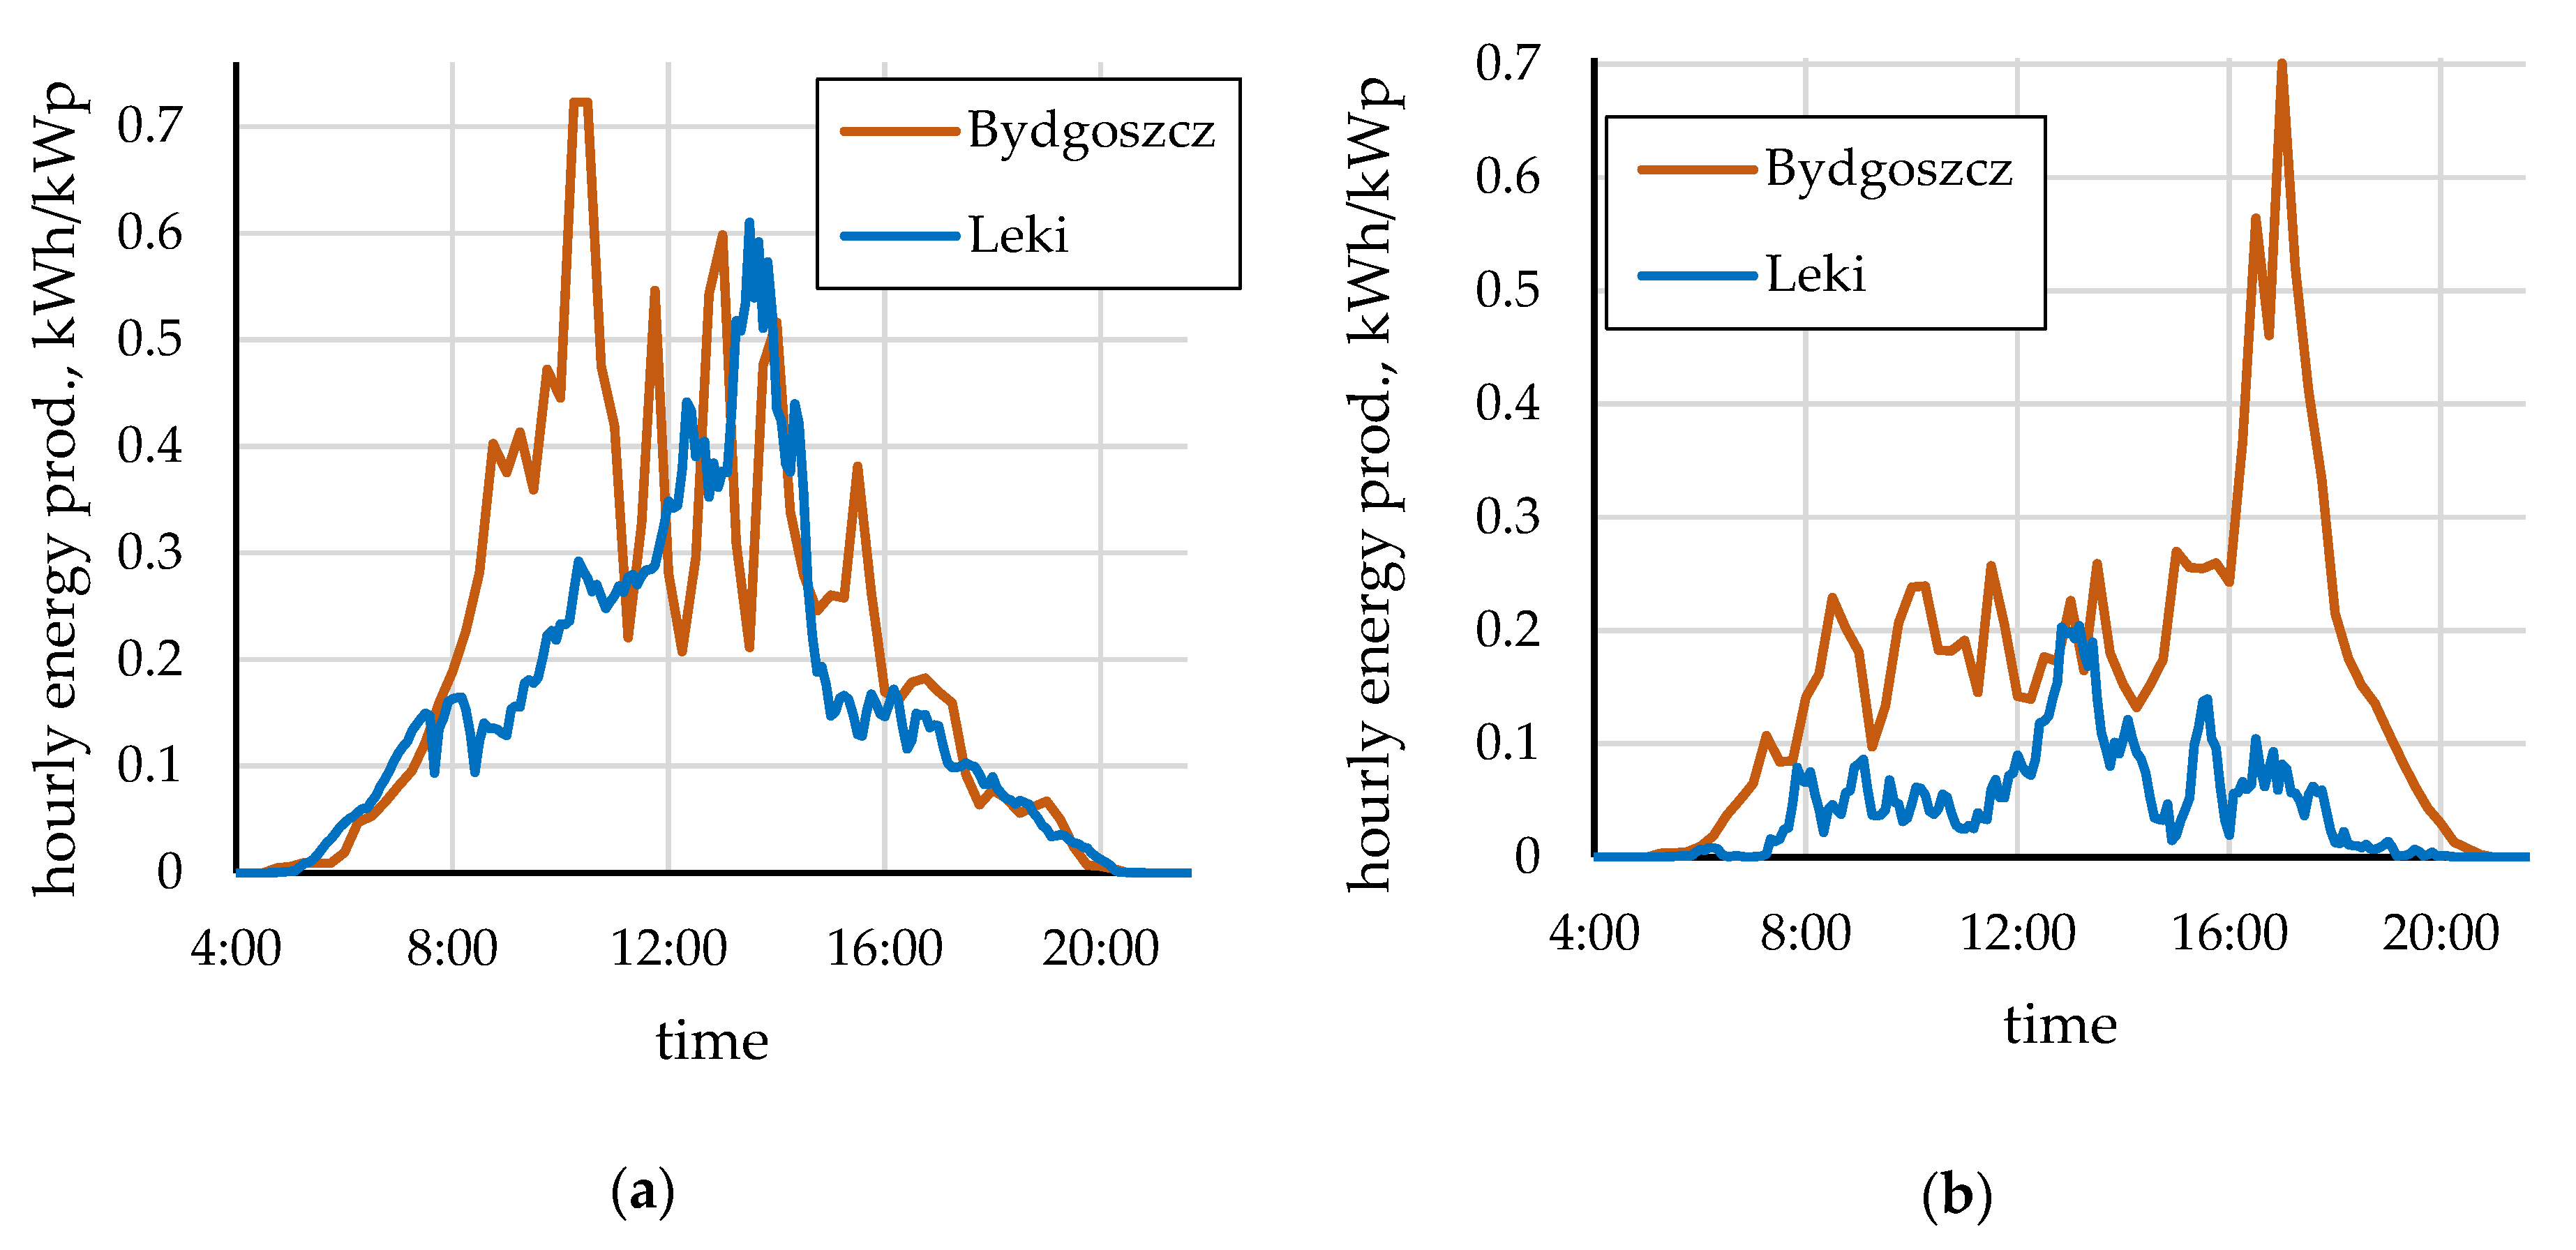
In order to compare the volume of energy production in both installations, two days were selected (Figure 16) for which high insolation was recorded in both installations, followed by days with low insolation.
On 12 and 13 June, both locations recorded comparable high levels of insolation of 7 kWh/m2/day (Figure 15). On selected days, the installation in Leki produced 6.08 and 6.39 kWh/kWp, respectively, and in Bydgoszcz 6.20 and 7.03 kWh/kWp. In both cases, the two-sided installation generated more energy. In addition, on 13.06, the influence of a different direction of PV panel foundation was observed (SW30 for Leki, S45 for Bydgoszcz), the installation in Bydgoszcz reached the maximum hourly production of 0.87 kWh/kWp at around 1:00 p.m., while Leki 0.8 kWh/kWp in the period of 2:30 p.m. (Figure 17).
On 15 and 22 June in the analysed locations, comparable low insolation was recorded (Figure 15), not greater than 4 kWh/m2/day on 15 June and approx. 2 kWh/m2/day on 22 June. Unit energy production on 15 June was 2.8 (Bydgoszcz) and 0.8 (Leki) kWh/(kWp·day), and 22 June, respectively, 3.6 and 2.8 kWh/(kWp·day).
Analysing both cases (Figure 16 and Figure 17), it can be seen that at lower values of insolation, two-sided panels produce more energy, which results in lower variability of the available/produced energy from bifacial PV installations compared to that of one-sided panels. That is also good for increasing direct consumption as peaks around midday are avoided and the broadening leads to longer time during the day in which electricity can be used, even more as, during midday, many people are not at home.
With comparable insolation, a bifacial installation produces approximately 10% (for high insolation) to 28% (for low insolation) more energy than a monofacial installation.
4.4. Carbon Dioxide Emission Reduction Analyses
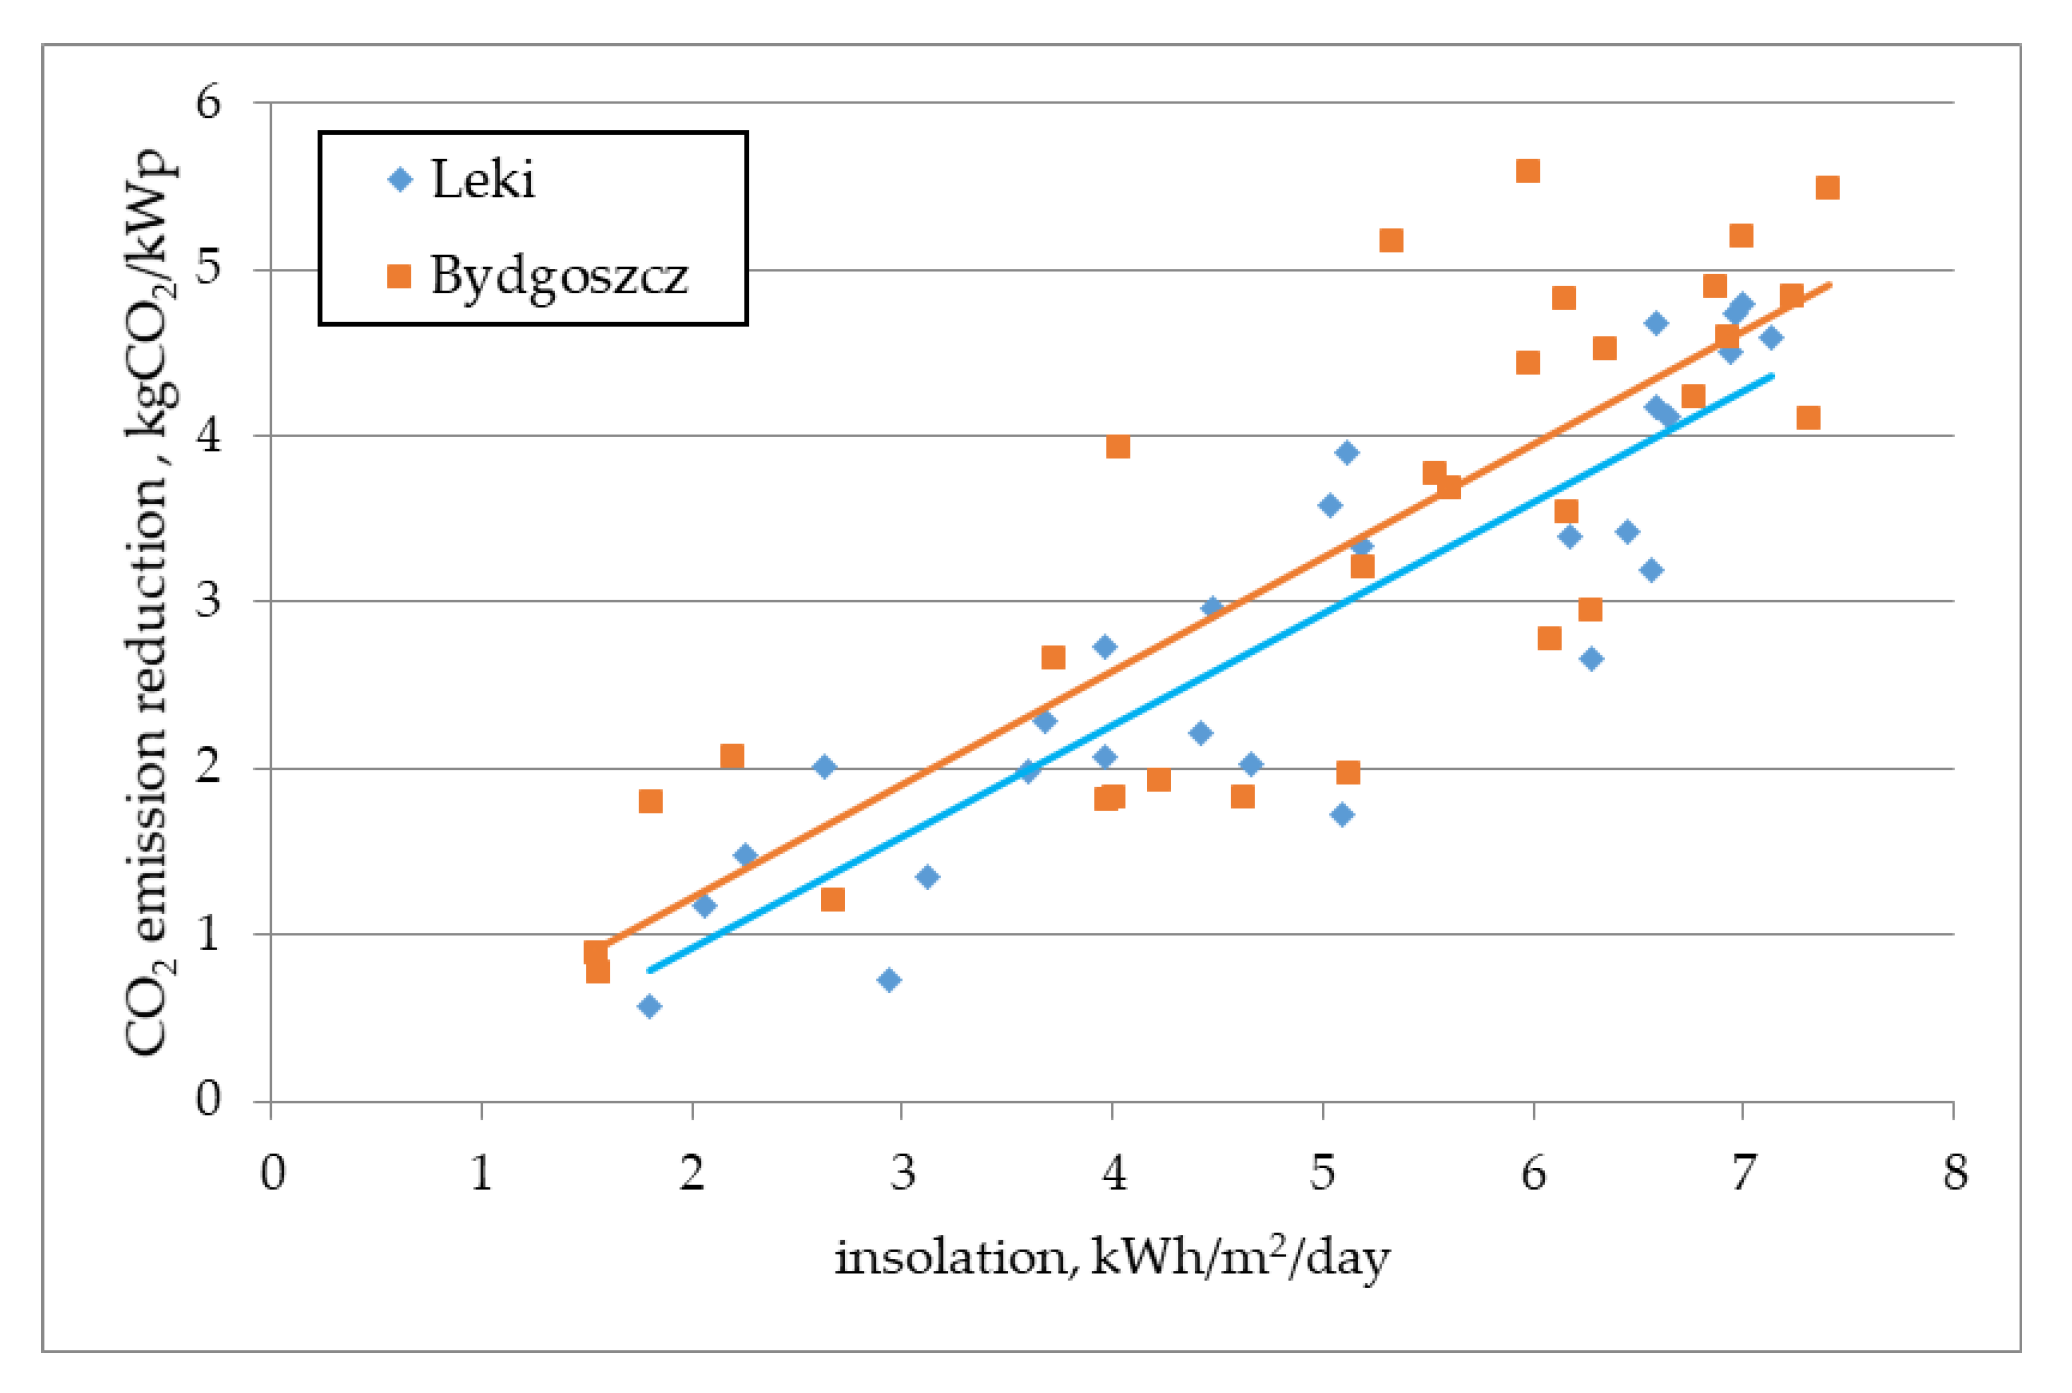
The installation in Leki produced 583.87 kWh of electricity in June and 4300 kWh per year (Table 3); the installation in Bydgoszcz produced 828.13 kWh, and 6091 kWh per year (Table 3). This makes it possible to avoid CO2 emissions at the level of 397 to 435 kg and 563 to 617 kg, which will amount from 2.9 to 3.2 Mg and 4.1 to 4.5 Mg per year.
Additionally, considering the power of the panels (Table 2), it was found that the annual energy production for Leki (monofacial panel) and Bydgoszcz (bifacial) is 853 kWh/kWp and 999 kWh/kWp, respectively. Avoided annual CO2 emission in relation to the installation capacity is from 0.58 to 0.64 Mg/kWp and from 0.68 to 0.74 Mg/kWp and is on average approx. 16% higher for bifacial installations. Daily unit reduction of CO2 emissions is depicted in Figure 18.
Analysing the daily energy production (Figure 11 and Figure 12), which is closely related to insolation (Figure 15) and assuming the CO2 emission factors for fossil fuels and the average emission factor resulting from PV production equal to 25 gCO2/kWh [58], the impact of the amount of insolation on reduction of CO2 emissions.
The results presented in Figure 18 confirm the greater efficiency of the system with the bifacial installation and the resulting higher reduction of CO2 emissions.
The cost of reducing CO2 emissions depends on the share of energy sources in the structure of its production. An exemplary emission factor for electricity generated in a gas power plant is 400 kgCO2/MWh, while for a coal power plant, it is 850 kgCO2/MWh [59]. Forecasts for the development of the power industry in the perspective of 2060 are varied [54,60]. Depending on the variant depending on the costs of emission allowances, gas prices or the share of renewable energy, the share of coal energy in 2020–2040 changes from 62% to 55.7% for the variant with high costs for emission allowances from 51.6% to 13.4% for the option of reducing the emission level to 85 million Mg CO2.
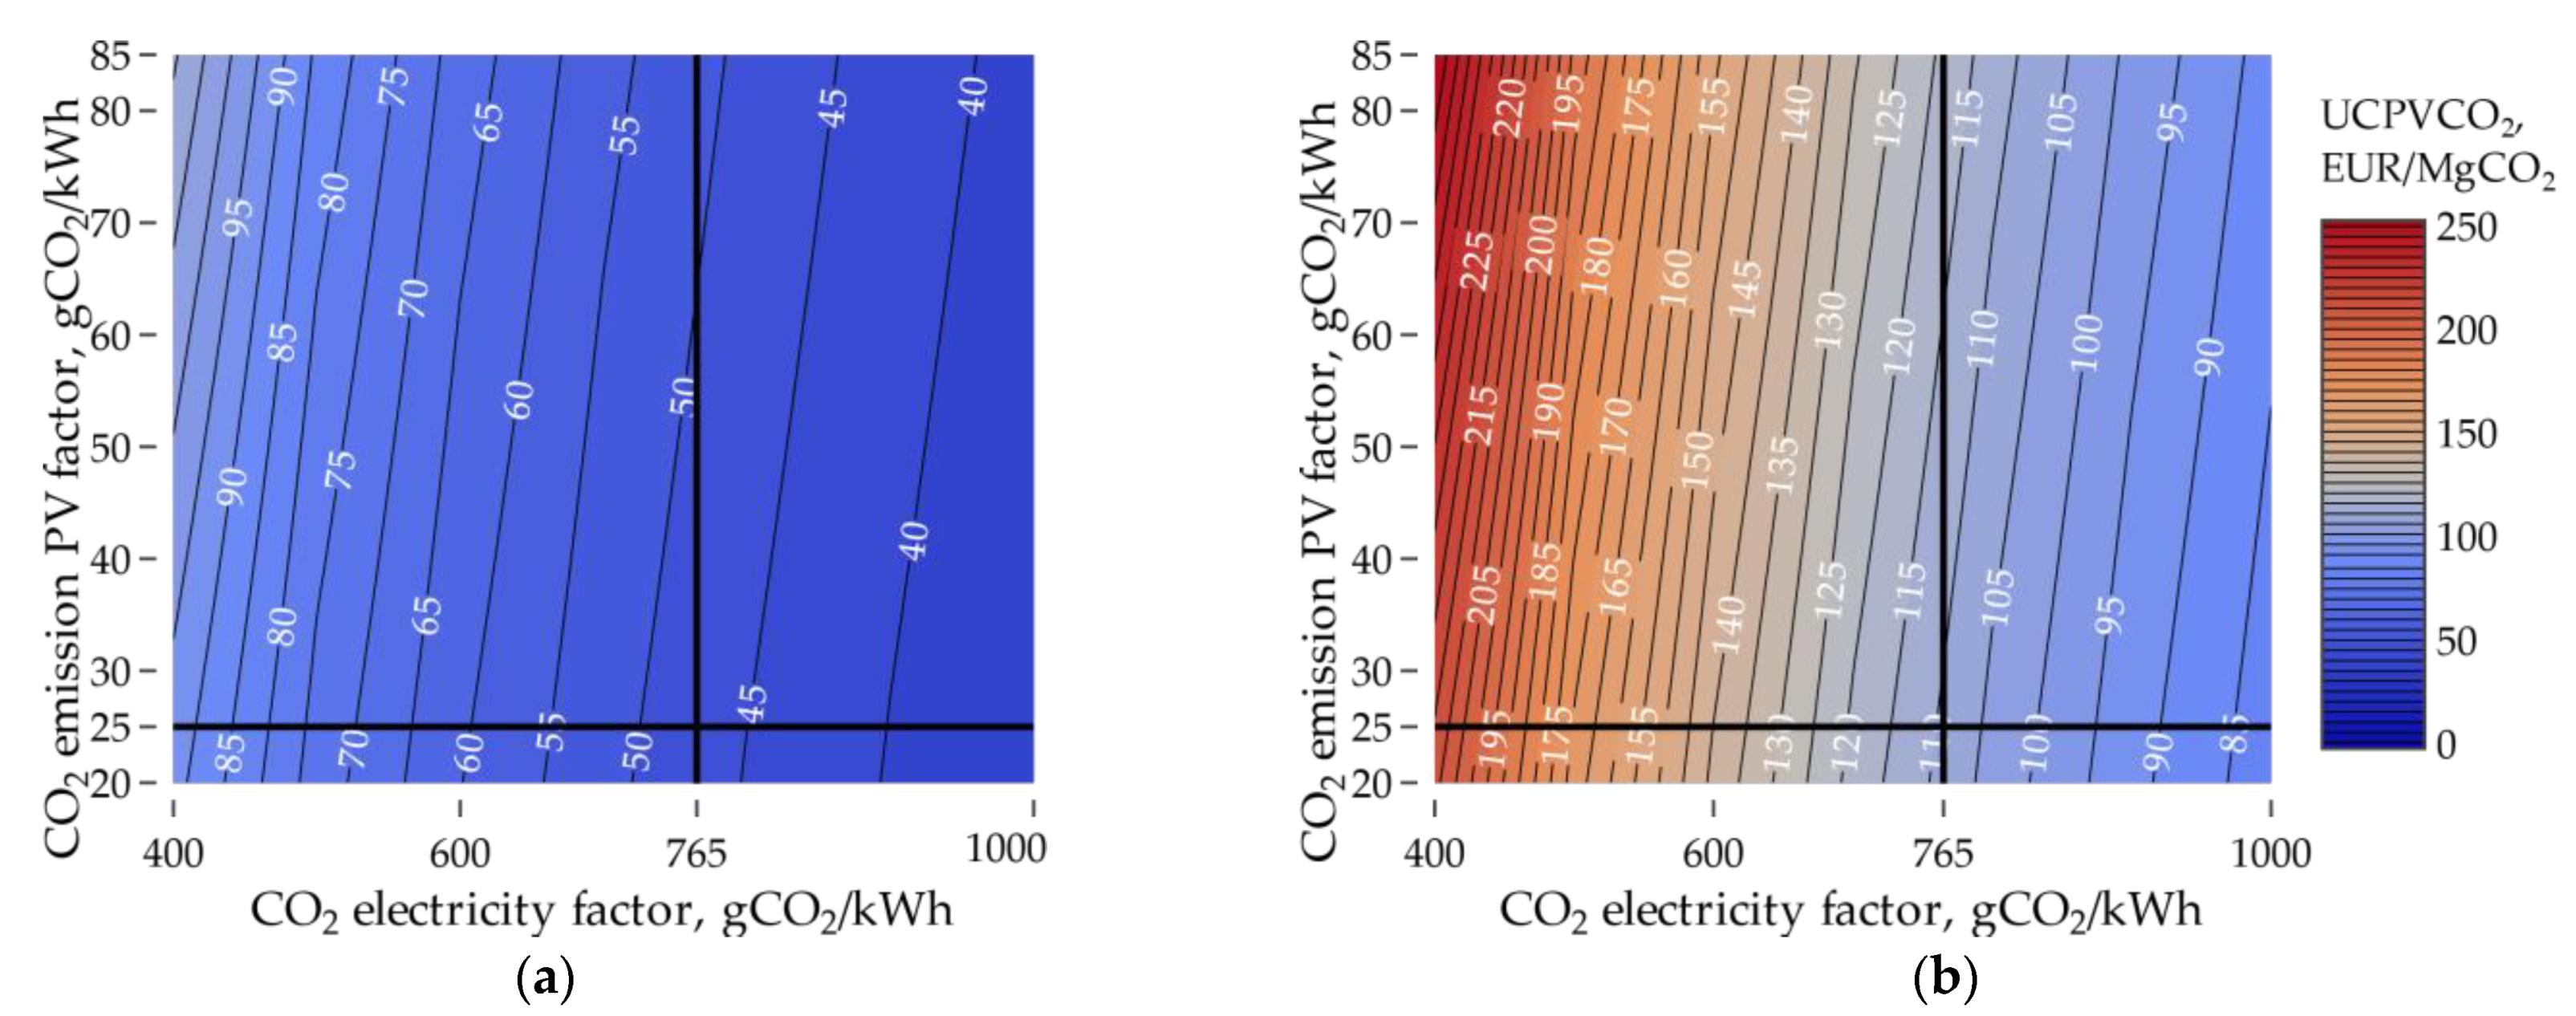
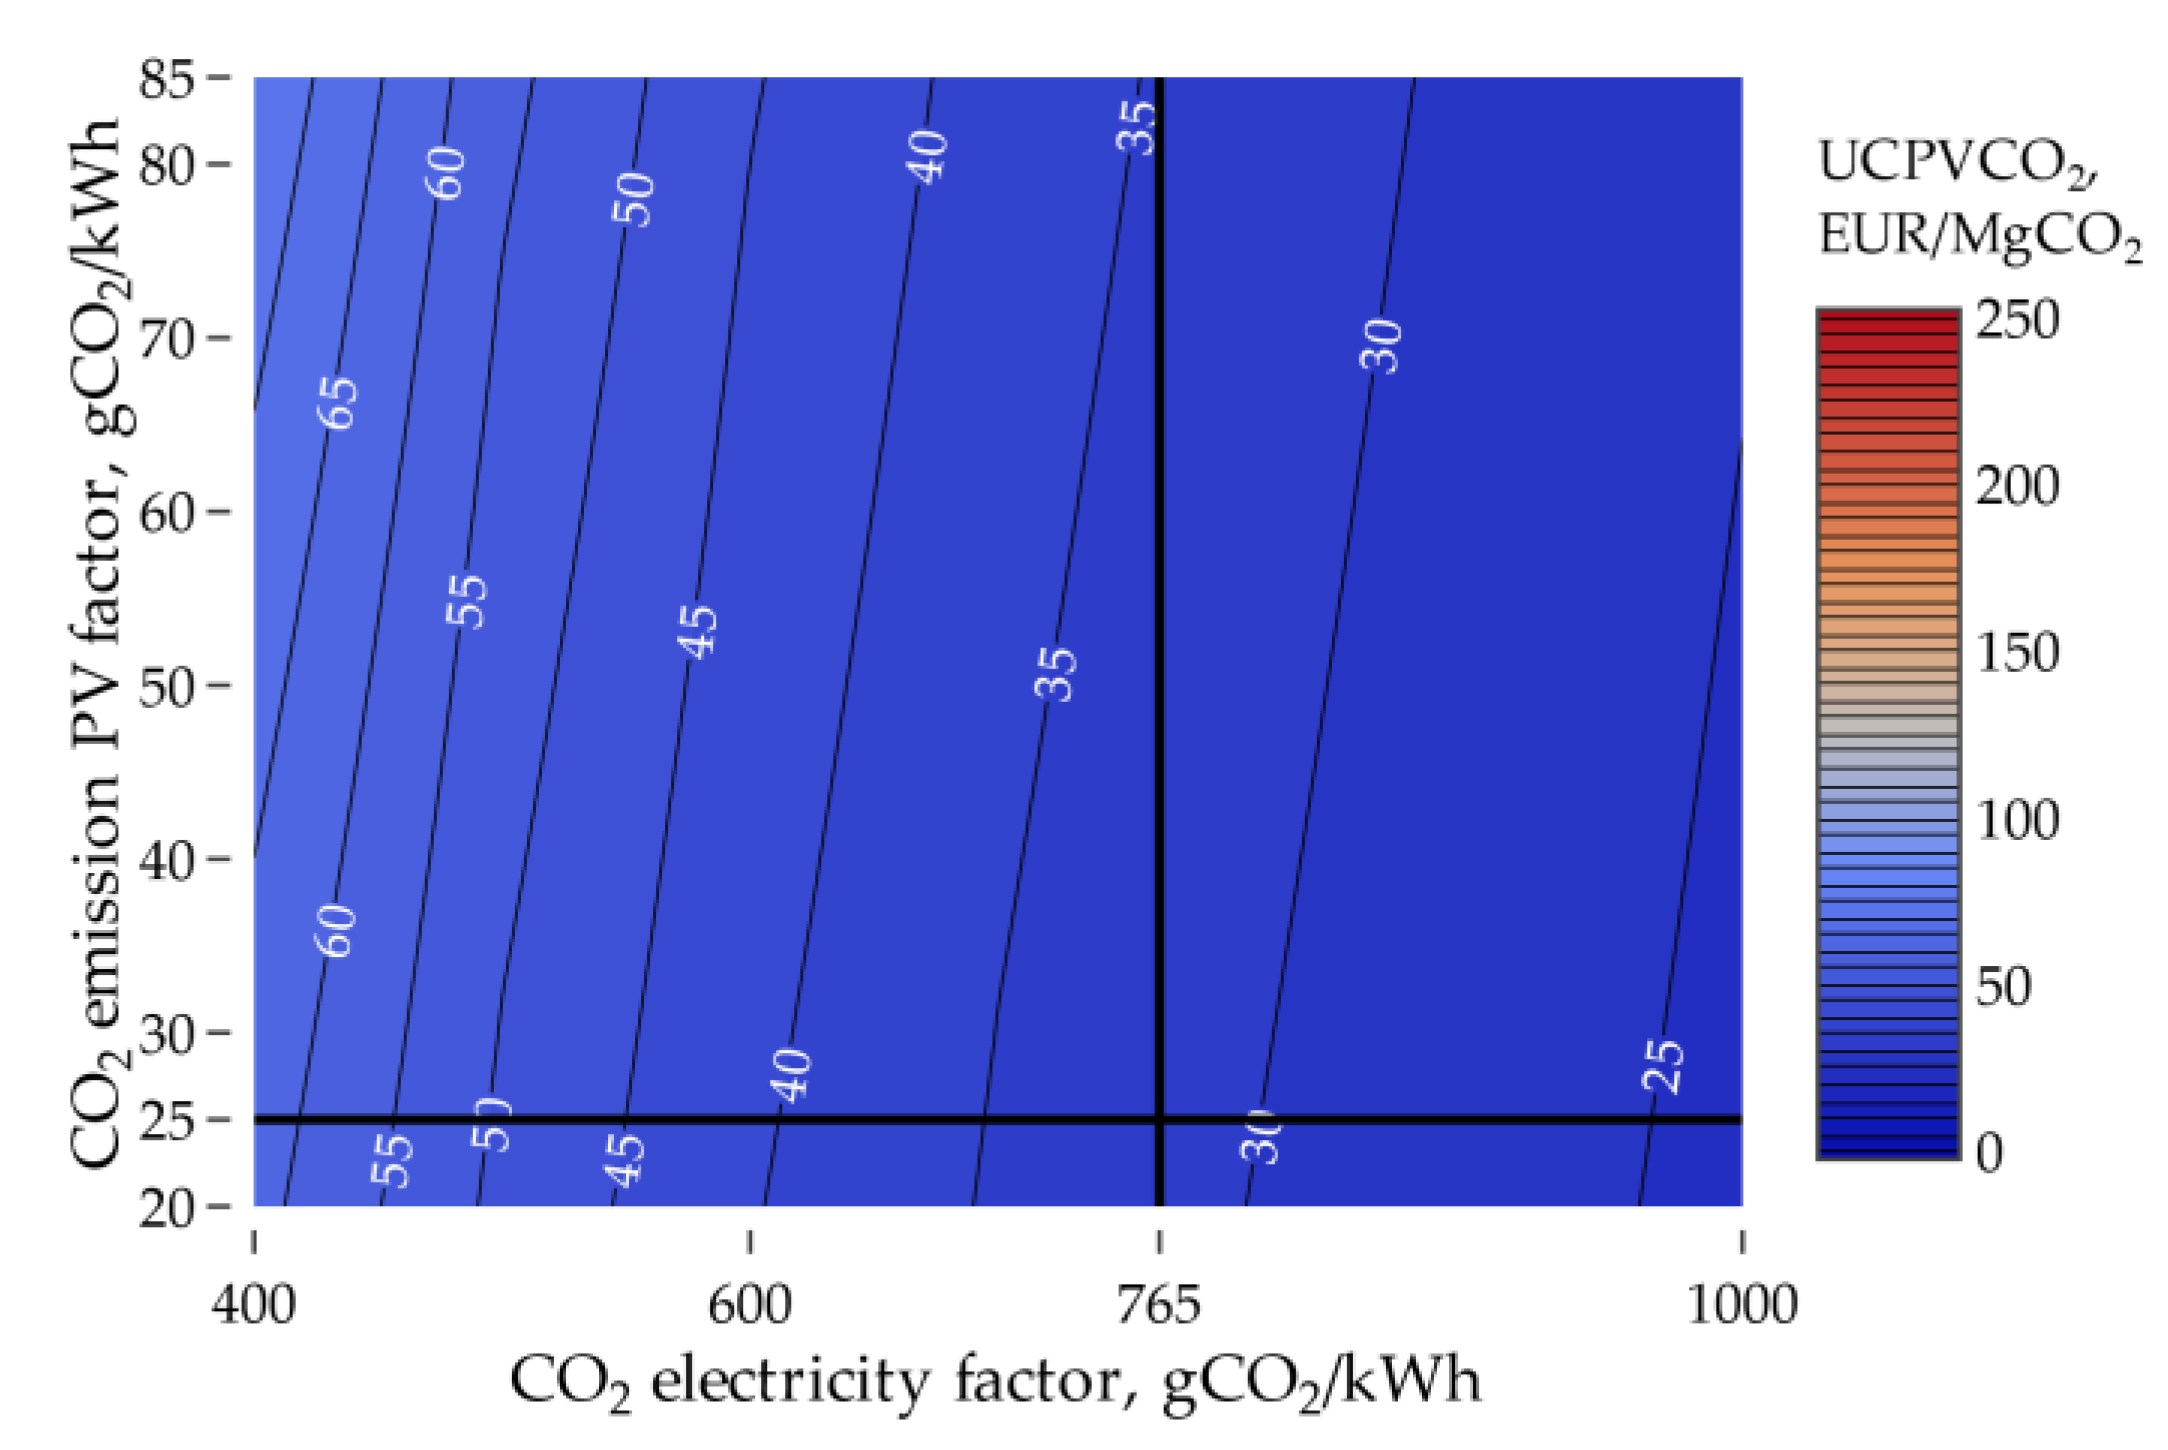
With the current emission indicators related to the production of panels–25 gCO2/kWh and the indicator concerning CO2 emissions related to electricity production in Poland 765 gCO2/kWh, the unit cost of reducing CO2 emissions is about EUR 48 for monofacial and 110 for bifacial (without subsidies) per Mg CO2, taking into account 20 years of operation of the installation (Figure 19). In the case of a decrease in the emissivity of electricity production in Poland to the level of 400 gCO2/kWh, the unit cost increases to approx. 93 and 210 EUR per MgCO2. If the emission related to the production of PV panels was much higher, i.e., 85 gCO2/kWh, these values would be for monofacial 52 EUR/MgCO2 and for bifacial 118 EUR/MgCO2, respectively. Considering the subsidy, these values are correspondingly lower (Figure 20).
4.5. Profitability Analyses
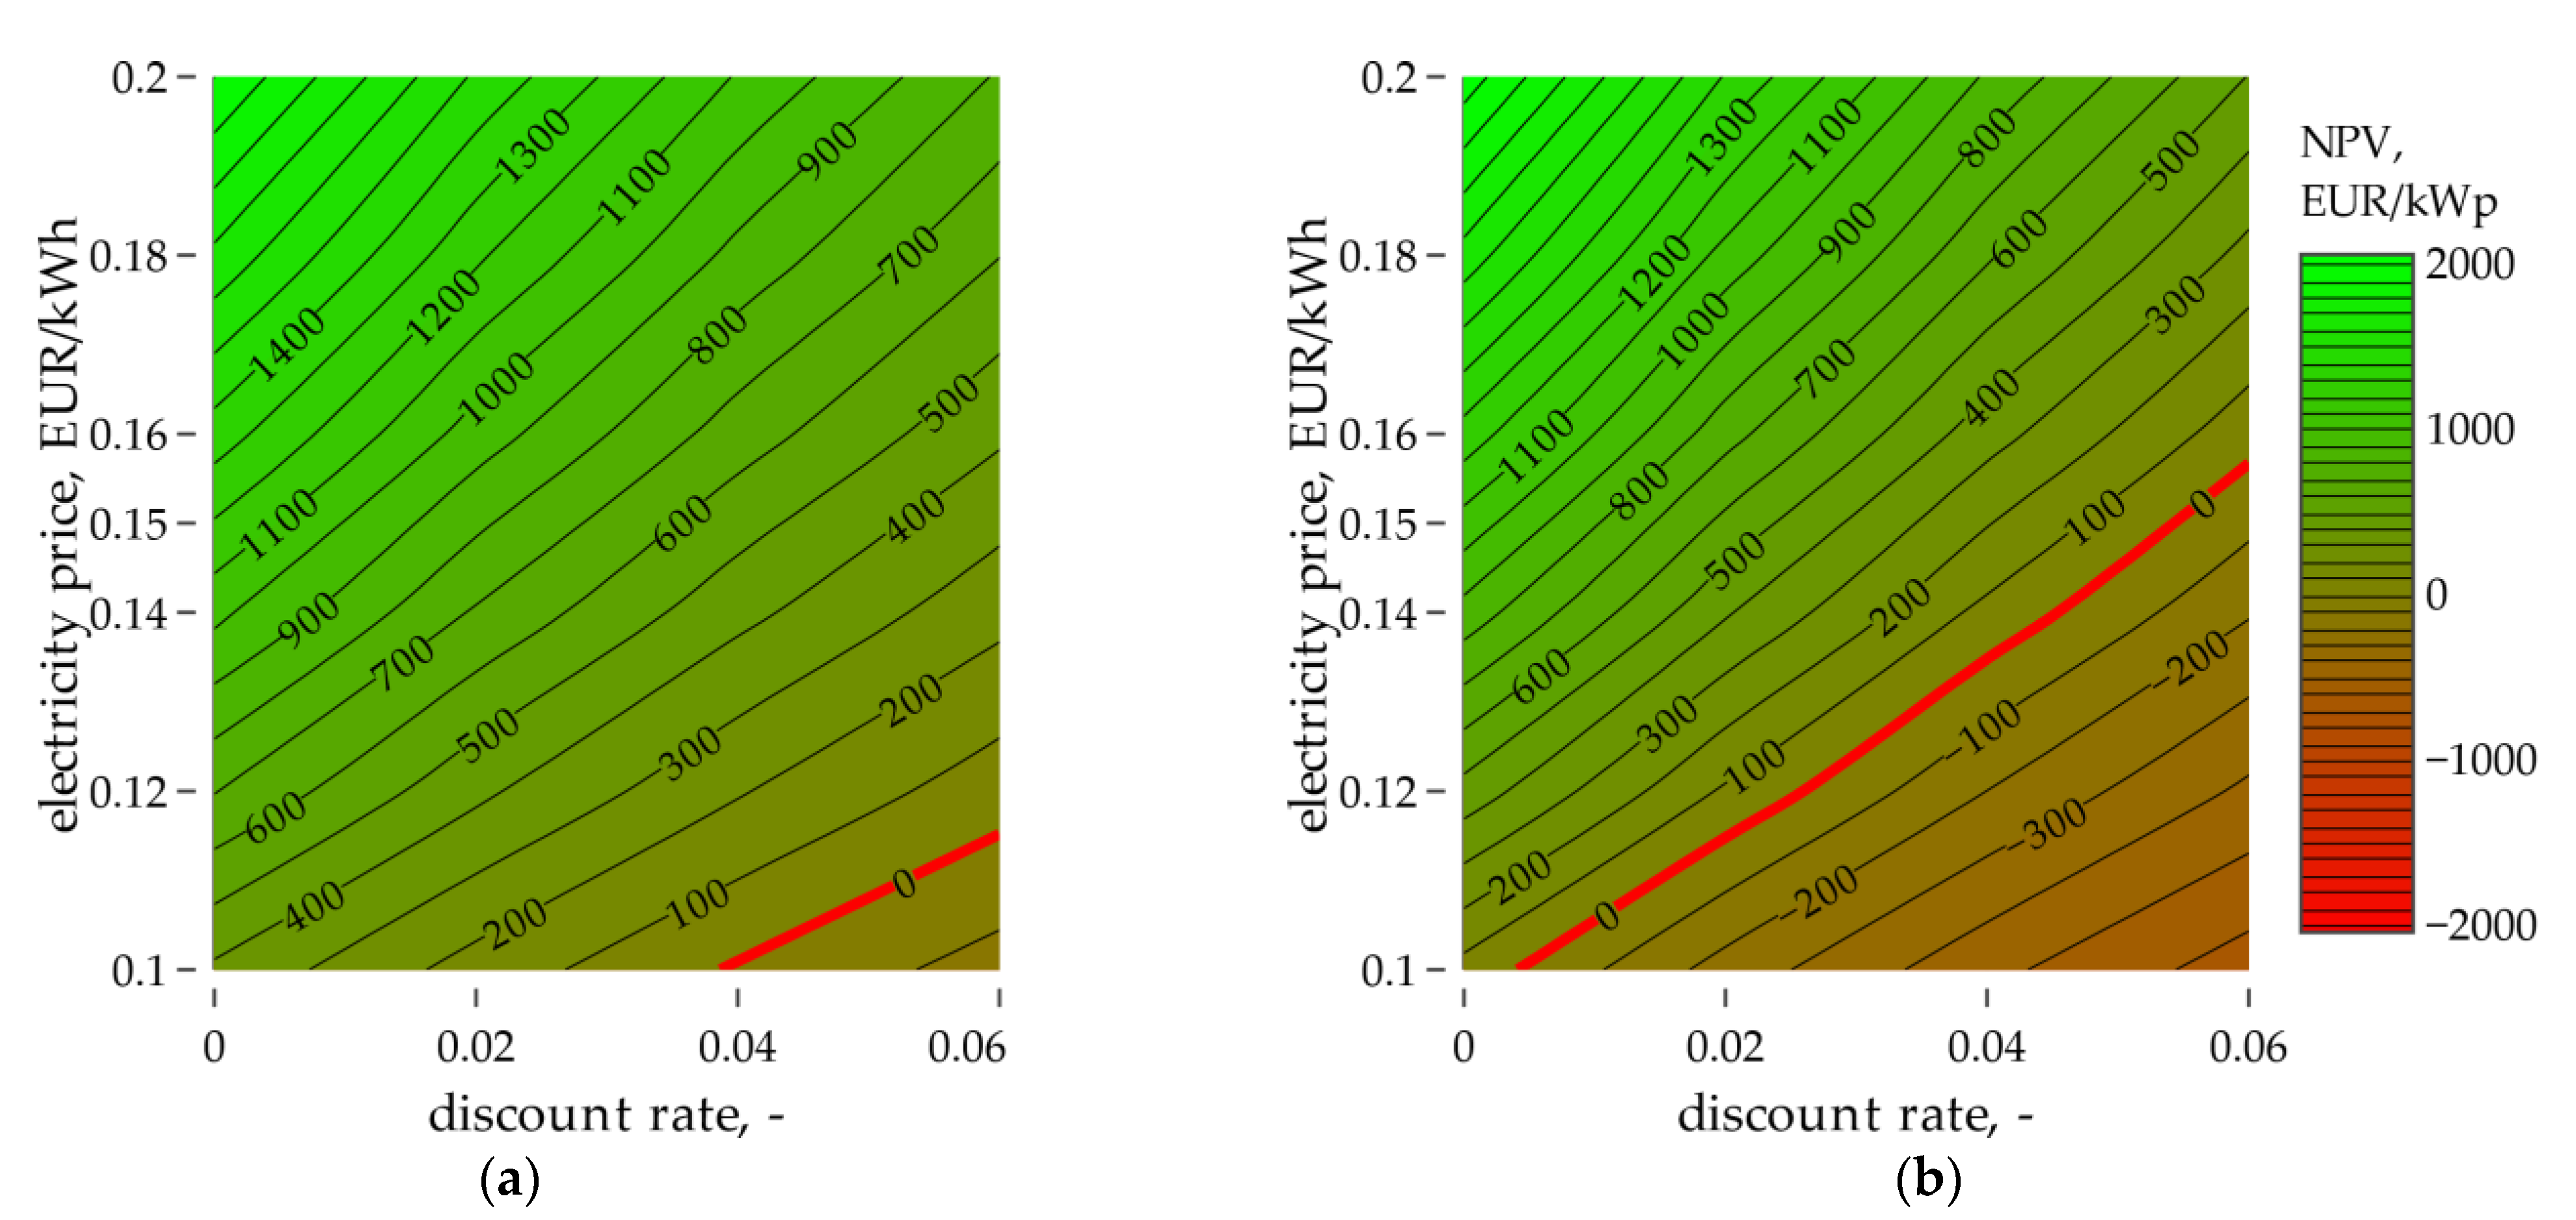
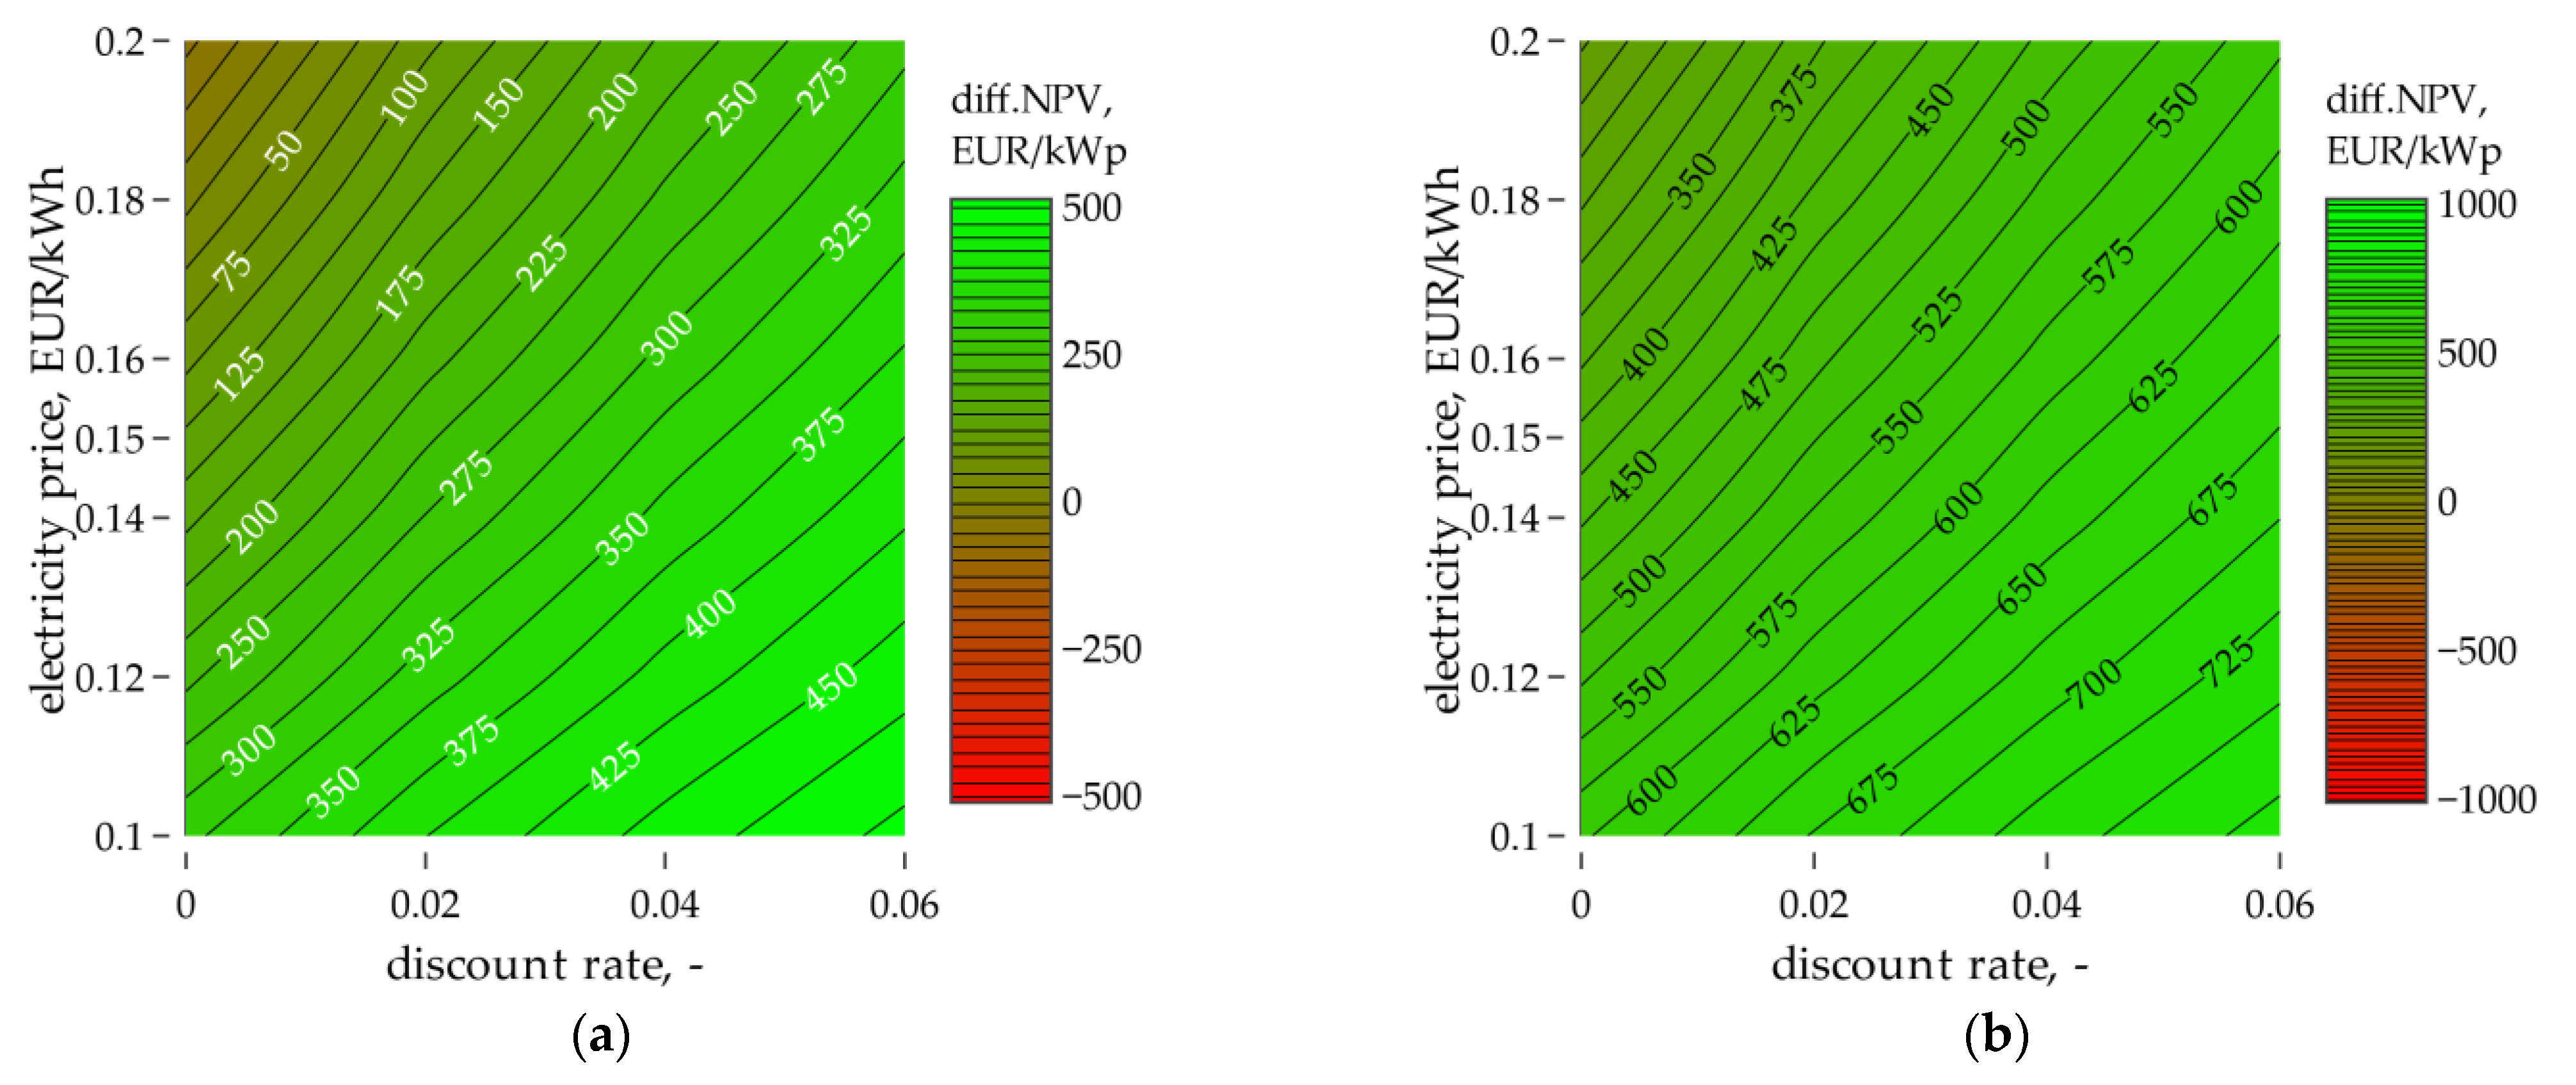
The results of the NPV analysis are presented in Figure 21. In addition, the NPV for Leki and NPV for Bydgoszcz (diff.NPV—Equation (11)) were determined differently (Figure 22a) and similarly, taking into account the subsidies for the Leki installation (Figure 22b).
Figure 22 shows under which economic conditions the bifacial panel’s price reaches (Bydgoszcz case) a higher NPV than the monofacial PV panels (Leki case). As can be seen in Figure 22a, the installation in Bydgoszcz does not give a greater result in the form of NPV. Considering the subsidy in the scope of electricity price 0.1–0.2 EUR/kWh, the installation in Bydgoszcz is also in no case more profitable.
For ElP = 0.15 EUR/kWh and r = 0%, unit NPV for monofacial is equal 1200 EUR/kWp, and for bifacial 1060 EUR/kWp. The difference of EUR 140/kWp is increased to EUR 410/kWp if the subsidy “My electricity” is taken into account.
5. Conclusions
There are more and more PV installations in Poland, especially microinstallations (up to 50 kWp, but due to the regulations of the Prosument and “My Electricity”, the majority of microinstallations in Poland is up to 10 kWp.). In 2017, 12,900 microinstallations were installed, in 2018–27,300, and in 2019–104,000 (mostly up to 10 kWp) [61].
Typical installations used in Poland are systems with monofacial modules; bifacial installations in Poland are practically nonexistent. The work analyses the economics and ecology of operation of such microinstallations in two localization Bydgoszcz and Leki (near Tarnow). The analysis was performed for similar insolation conditions. Bifacial installations produce approx. from 10% for high insolation to 28% for low insolation more energy than a monofacial installation. Therefore, they enable greater reductions in CO2 emissions.
In Poland, the share of fossil fuels (hard coal and lignite) in electricity generation is of importance, which gives the CO2 footprint of 765 gCO2/kWh. The production of one kWh of energy from PV theoretically limits this value, but it practically replaces the most emitting carbon sources. In the analysed cases the annual reduction of CO2 emissions, taking the emissions resulting from the production of panels into account, could be from 0.58 to 0.64 Mg/kWp for monofacial PV and 0.68 to 0.74 Mg/kWp for bifacial PV. Avoided CO2 emission is on average approximately 16% higher for bifacial installations.
Spending 1 Euro for PV installations contributes to emission savings of 20.8 kgCO2 (for 25 gCO2/kWh as environmental cost of PV installation) in the case of monofacial panels and in the case of bifacial panels to 9 kgCO2.
The installation subsidised under the “My Electricity” program can reach an NPV of EUR 6000 over 20 years with a discount rate r = 0 and assuming an electricity price of 0.15 EUR/kWh. If this price is increased to 0.2 EUR/kWh, NPV will be 10,000 EUR.
Author Contributions
Conceptualization, P.O., D.M. and M.O.; methodology, P.O. and M.O.; software, P.O., and D.M.; validation, M.O.; formal analysis, P.O., D.M. and M.O.; investigation, M.O.; resources, P.O. and T.M.; data curation, P.O., T.M. and M.O.; writing—original draft preparation, P.O., D.M., and M.O.; writing—review and editing, M.O., D.M. and A.D.; visualization, P.O. and M.O.; supervision, P.O.; project administration, P.O. and M.O.; funding acquisition, P.O. and A.D. All authors have read and agreed to the published version of the manuscript.
Funding
There is no external funding.
Institutional Review Board Statement
Not applicable.
Informed Consent Statement
Not applicable.
Data Availability Statement
Not applicable.
Conflicts of Interest
The authors declare no conflict of interest.
Abbreviation
| ACO2 | amount of CO2 emission avoided, Mg/year |
| CF | Cash flow, EUR |
| Diff.NPV | Difference of NPV in Leki and Bydgoszcz |
| E | East |
| EAG | Annual energy gains, kWh/year |
| Ec | energy consumption in the building |
| EECO2 | energy electricity emission factor in Poland, kgCO2/kWh |
| ElP | Electricity price, EUR/kWh |
| EMG | Measured monthly energy gains, kWh/month |
| Ep | energy produced |
| EPVCO2 | CO2 emission factor for PV, kgCO2/kWh |
| Esc | energy self-consumed from locally produced: energy consumption in the building minus energy from the grid |
| GHG | greenhouse gas |
| I0 | initial investment value, EUR |
| IDA | Correction for Insolation on the direction and angle, kWh/kWh |
| IJC | Insolation coefficient, kWh/kWh |
| I_H_June | Horizontal Insolation in June, kWh/(m2·month) |
| I_H_Year | Horizontal Insolation in whole year, kWh/(m2·year) |
| I_June | Insolation in June for TRY |
| I_Year | Insolation in whole for TRY |
| JSHI | June Share of Yearly Horizontal Insolation |
| JSHIA | Converting the insolation from June to the whole year, month/year |
| LCA | Life Cycle Analyses |
| N | north |
| n | lifetime of PV, year |
| NPV | Net Present Value, EUR |
| PI | Total PV panel power, kWp |
| PV | photovoltaic |
| r | discount rate |
| t | year |
| S | South |
| SATS | single axis tracking systems |
| SC | self-consumption |
| SS | self-sufficiency |
| TRY_H | Typical Reference Year–Horizontal Surface |
| TRY_S45 | Typical Reference Year–south directed surface titled 45° |
| TRY_SW30 | Typical Reference Year–south-west directed surface titled 30° |
| UCPVCO2 | Unit (investment) cost of CO2 emission reduction, EUR/kgCO2 |
| W | West |
| τ | time |
References
- Pestana, D.G.; Rodrigues, S.; Morgado-Dias, F. Environmental and economic analysis of solar systems in Madeira, Portugal. Util. Policy 2018, 55, 31–40. [Google Scholar] [CrossRef]
- Peng, J.; Lu, L.; Yang, H. Review on life cycle assessment of energy payback and greenhouse gas emission of solar photovoltaic systems. Renew. Sustain. Energy Rev. 2013, 19, 255–274. [Google Scholar] [CrossRef]
- National Centre for Emissions Management. CO2, SO2, NOx, CO and Total Dust EMISSION RATIOS FOR ELECTRICITY Based on the Information Contained in the National Database of Greenhouse Gas Emissions and other Substances for 2018. Available online: https://www.kobize.pl/uploads/materialy/materialy_do_pobrania/wskazniki_emisyjnosci/Wskazniki_emisyjnosci_grudzien_2019.pdf (accessed on 7 April 2020).
- Sampaio, P.G.V.; González, M.O.A. Photovoltaic solar energy: Conceptual framework. Renew. Sustain. Energy Rev. 2017, 74, 590–601. [Google Scholar] [CrossRef]
- European Commission. A Clean Planet for All. A European Long-Term Strategic Vision for a Prosperous, Modern, Competitive and Climate Neutral Economy; EUR-Lex: Brussels, Belgium, 2018. [Google Scholar]
- Jaeger-Waldau, A. PV Status Report 2019; Publications Office of the European Union: Brussels, Belgium, 2019. [Google Scholar]
- Jäger-Waldau, A.; Kougias, I.; Taylor, N.; Thiel, C. How photovoltaics can contribute to GHG emission reductions of 55% in the EU by 2030. Renew. Sustain. Energy Rev. 2020, 126, 109836. [Google Scholar] [CrossRef]
- Micheli, D.; Alessandrini, S.; Radu, R.; Casula, I. Analysis of the outdoor performance and efficiency of two grid connected photovoltaic systems in northern Italy. Energy Convers. Manag. 2014, 80, 436–445. [Google Scholar] [CrossRef]
- Phinikarides, A.; Makrides, G.; Zinsser, B.; Schubert, M.; Georghiou, G.E. Analysis of photovoltaic system performance time series: Seasonality and performance loss. Renew. Energy 2015, 77, 51–63. [Google Scholar] [CrossRef]
- Zdyb, A.; Gulkowski, S. Performance assessment of four different photovoltaic technologies in Poland. Energies 2020, 13, 196. [Google Scholar] [CrossRef] [Green Version]
- Global solar Atlas GHI—Global Horizontal Irradiation. Available online: http://solargis.info/doc/_pics/freemaps/1000px/ghi/SolarGIS-Solar-map-Europe-en.png (accessed on 12 November 2020).
- Olczak, P.; Matuszewska, D.; Zabagło, J. The Comparison of Solar Energy Gaining Effectiveness between Flat Plate Collectors and Evacuated Tube Collectors with Heat Pipe: Case Study. Energies 2020, 13, 1829. [Google Scholar] [CrossRef] [Green Version]
- Chwieduk, D.; Chwieduk, M. Determination of the Energy Performance of a Solar Low Energy House with Regard to Aspects of Energy Efficiency and Smartness of the House. Energies 2020, 13, 3232. [Google Scholar] [CrossRef]
- Olczak, P.; Kryzia, D.; Matuszewska, D.; Kuta, M. “My Electricity” Program Effectiveness Supporting the Development of PV Installation in Poland. Energies 2021, 14, 231. [Google Scholar] [CrossRef]
- Rynek-Elektryczny W Czerwcu moc Zainstalowana Fotowoltaiki Przekroczyła 2 GW. Available online: https://www.rynekelektryczny.pl/moc-zainstalowana-fotowoltaiki-w-polsce/ (accessed on 15 July 2020).
- Olczak, P.; Matuszewska, D.; Kryzia, D. ”Mój Prąd” as an example of the photovoltaic one off grant program in Poland. Energy Policy J. 2020, 23, 123–138. [Google Scholar] [CrossRef]
- Szczerbowski, R.; Kornobis, D. The proposal of an energy mix in the context of changes in Poland’s energy policy. Polityka Energetyczna 2019, 22, 5–18. [Google Scholar] [CrossRef]
- Ministry of Development Typical Reference Year. Available online: https://www.gov.pl/web/fundusze-regiony/dane-do-obliczen-energetycznych-budynkow (accessed on 18 December 2019).
- NFOŚiGW Mój Prąd. Available online: https://mojprad.gov.pl/wyniki-1-naboru-2019/ (accessed on 7 April 2020).
- Almeshaiei, E.; Al-Habaibeh, A.; Shakmak, B. Rapid evaluation of micro-scale photovoltaic solar energy systems using empirical methods combined with deep learning neural networks to support systems’ manufacturers. J. Clean. Prod. 2020, 244, 118788. [Google Scholar] [CrossRef]
- Bukowski, M.; Majewski, J.; Sobolewska, A. Macroeconomic Electric Energy Production Efficiency of Photovoltaic Panels in Single-Family Homes in Poland. Energies 2021, 14, 126. [Google Scholar] [CrossRef]
- Guta, D.D. Determinants of household adoption of solar energy technology in rural Ethiopia. J. Clean. Prod. 2018, 204, 193–204. [Google Scholar] [CrossRef]
- Komorowska, A.; Kamiński, J. A review of the 2018 Polish capacity market auctions. Energy Policy J. 2019, 22, 75–88. [Google Scholar] [CrossRef]
- Paska, J.; Surma, T.; Terlikowski, P.; Zagrajek, K. Electricity generation from renewable energy sources in Poland as a part of commitment to the polish and EU energy policy. Energies 2020, 13, 4261. [Google Scholar] [CrossRef]
- Elshurafa, A.M.; Albardi, S.R.; Bigerna, S.; Bollino, C.A. Estimating the learning curve of solar PV balance–of–system for over 20 countries: Implications and policy recommendations. J. Clean. Prod. 2018, 196, 122–134. [Google Scholar] [CrossRef]
- IEO. PV MARKET IN POLAND 2020; IEO: Warsaw, Poland, 2020. [Google Scholar]
- Szczerbowski, R. Energy security of Poland—Energy mix and energy efficiency. Polityka Energetyczna 2013, 16, 35–47. [Google Scholar]
- Matuszewska, D.; Kuta, M.; Olczak, P. Techno-Economic Assessment of Mobilized Thermal Energy Storage System Using Geothermal Source in Polish Conditions. Energies 2020, 13, 3404. [Google Scholar] [CrossRef]
- Zelazna, A.; Gołębiowska, J.; Zdyb, A.; Pawłowski, A. A hybrid vs. on-grid photovoltaic system: Multicriteria analysis of environmental, economic, and technical aspects in life cycle perspective. Energies 2020, 13, 3978. [Google Scholar] [CrossRef]
- Mirowski, T.; Sornek, K. Potential of prosumer power engineering in Poland by example of micro PV installation in private construction. Energy Policy J. 2015, 18, 73–84. [Google Scholar]
- Pepłowska, M.; Olczak, P. The tilt angle selecting problem of PV panels taking the energy demand profile into account. Bull. Miner. Energy Econ. Res. Inst. Pol. Acad. Sci. 2018, 102, 91–100. [Google Scholar]
- Poland, O. Data of Electricity Distribution System Operators; Data direct from DSO; Unpublished work; 2020. [Google Scholar]
- NASA Solar Radiation. Available online: https://power.larc.nasa.gov/data-access-viewer/ (accessed on 20 July 2020).
- Ren, F.R.; Tian, Z.; Liu, J.; Shen, Y.T. Analysis of CO2 emission reduction contribution and efficiency of China’s solar photovoltaic industry: Based on Input-output perspective. Energy 2020, 199, 117493. [Google Scholar] [CrossRef]
- Louwen, A.; Van Sark, W.G.; Faaij, A.P.C.; Schropp, R.E.I. Re-assessment of net energy production and greenhouse gas emissions avoidance after 40 years of photovoltaics development. Nat. Commun. 2016, 7, 13728. [Google Scholar] [CrossRef] [PubMed]
- Mohammadi, K.; Naderi, M.; Saghafifar, M. Economic feasibility of developing grid-connected photovoltaic plants in the southern coast of Iran. Energy 2018, 156, 17–31. [Google Scholar] [CrossRef]
- Antonanzas, J.; Arbeloa-Ibero, M.; Quinn, J.C. Comparative life cycle assessment of fixed and single axis tracking systems for photovoltaics. J. Clean. Prod. 2019, 240, 118016. [Google Scholar] [CrossRef]
- Frischknecht, R.; Itten, R.; Sinha, P.; de Wild-Scholten, M.; Zhang, J.; Fthenakis, V.; Kim, H.C.; Raugei, M.; Stucki, M. Life Cycle Inventories and Life Cycle Assessments of Photovoltaic Systems. PVPS Task 12, Report T12-04:2015; IEA: Paris, France, 2015. [Google Scholar]
- Nugent, D.; Sovacool, B.K. Assessing the lifecycle greenhouse gas emissions from solar PV and wind energy: A critical meta-survey. Energy Policy 2014, 65, 229–244. [Google Scholar] [CrossRef]
- Prăvălie, R.; Bandoc, G. Nuclear energy: Between global electricity demand, worldwide decarbonisation imperativeness, and planetary environmental implications. J. Environ. Manag. 2018, 209, 81–92. [Google Scholar] [CrossRef]
- Park, H.; Chang, S.; Park, S.; Kim, W.K. Outdoor performance test of bifacial n-type silicon photovoltaic modules. Sustainability 2019, 11, 6234. [Google Scholar] [CrossRef] [Green Version]
- Mirowski, T.; Pepłowska, M. Simulation Analysis of Electricity Consumption for the Final Consumer with the Use of Smart Metering. Energy Policy J. 2016, 2, 81–91. [Google Scholar]
- Kryzia, D.; Kuta, M.; Matuszewska, D.; Olczak, P. Analysis of the potential for gas micro-cogeneration development in Poland using the Monte Carlo method. Energies 2020, 13, 3140. [Google Scholar] [CrossRef]
- Rodríguez-Gallegos, C.D.; Bieri, M.; Gandhi, O.; Singh, J.P.; Reindl, T.; Panda, S.K. Monofacial vs bifacial Si-based PV modules: Which one is more cost-effective? Sol. Energy 2018, 176, 412–438. [Google Scholar] [CrossRef]
- Reich, N.H.; Alsema, E.A.; Van Sark, W.G.; Turkenburg, W.C.; Sinke, W.C. Greenhouse gas emissions associated with photovoltaic electricity from crystalline silicon modules under various energy supply options. Prog. Photovolt. Res. Appl. 2011, 19, 603–613. [Google Scholar] [CrossRef]
- Gazbour, N.; Razongles, G.; Schaeffer, C.; Charbuillet, C. Photovoltaic power goes green. In Proceedings of the 2016 Electronics Goes Green 2016+, EGG 2016, Berlin, Germany, 6–9 September 2016. [Google Scholar]
- Olczak, P.; Pepłowska, M. Problematyka doboru wielkości przydomowych instalacji fotowoltaicznych. In Energetyka Solarna; Foundation for Clean Energy: Poznan, Poland, 2018; pp. 80–90. [Google Scholar]
- Hanplast-Energy SW PREMIUM BIFACIAL (HJT). Available online: http://hanplast.energy/uploads/files/GWARANCJEHP/KARTATECHNICZNA-HanplastSWPremiumBifacialHJTEN3053103155-6mmv01.10.2019.pdf (accessed on 18 July 2020).
- Longi LR4-60HPH 360M. Available online: https://en.longi-solar.com/uploads/attach/20200423/5ea0f91d33235.pdf (accessed on 2 June 2020).
- Canales, F.A.; Jadwiszczak, P.; Jurasz, J.; Wdowikowski, M.; Ciapała, B.; Kaźmierczak, B. The impact of long-term changes in air temperature on renewable energy in Poland. Sci. Total Environ. 2020, 729, 138965. [Google Scholar] [CrossRef]
- Olek, M.; Olczak, P.; Kryzia, D. The sizes of Flat Plate and Evacuated Tube Collectors with Heat Pipe area as a function of the share of solar system in the heat demand. E3S Web Conf. 2016, 10, 00139. [Google Scholar] [CrossRef]
- Olczak, P.; Kryzia, D.; Pepłowska, M.; Olek, M. Influence of Inclination Angle and its Adjustment Time on Insolation of Collector or Photovoltaic Panel. Dist. Heat. Vent. 2018, 49, 506–509. [Google Scholar]
- Olczak, P.; Kryzia, D.; Augustyn, A.; Olek, M. The economic profitability of the changing size of solar collectors surface in the case study of the household domestic hot water installation. Bull. Miner. Energy Econ. Res. Inst. Pol. Acad. Sci. 2018, 102, 77–90. [Google Scholar]
- Olczak, P.; Olek, M.; Kryzia, D. The ecological impact of using photothermal and photovoltaic installations for DHW preparation. Polityka Energetyczna 2020, 23, 65–74. [Google Scholar] [CrossRef]
- Kryzia, D.; Kopacz, M.; Kryzia, K. The Valuation of the Operational Flexibility of the Energy Investment Project Based on a Gas-Fired Power Plant. Energies 2020, 13, 1567. [Google Scholar] [CrossRef] [Green Version]
- CSO. Energy Consumption in Households in 2018; Central Statistical Office: Warsaw, Poland, 2019. [Google Scholar]
- Copernicus Climate Change Service (C3S). ERA5: Fifth Generation of ECMWF Atmospheric Reanalyses of the Global Climate. Copernicus Climate Change Service Climate Data Store (CDS). 2017. Available online: https://cds.climate.copernicus.eu/cdsapp#!/home (accessed on 4 November 2020).
- Kommalapati, R.; Kadiyala, A.; Shahriar, M.T.; Huque, Z. Review of the life cycle greenhouse gas emissions from different photovoltaic and concentrating solar power electricity generation systems. Energies 2017, 10, 350. [Google Scholar] [CrossRef] [Green Version]
- PARP. Conversion Guidelines—Greenhouse Gas Emissions. Available online: https://www.parp.gov.pl/storage/grants/documents/105/Wytyczne-dotyczce-konwersji---emisje-gazw-cieplarnianych_20200225.pdf (accessed on 28 July 2020).
- Kprm Model of the Optimum Energy Mix for Poland until 2060. Available online: https://www.premier.gov.pl/files/files/energymix_das_dost.pdf (accessed on 28 July 2020).
- Globenergia over 104,000 PV Micro-Installations in 2019! Available online: https://globenergia.pl/ponad-104-tysiace-mikroinstalacji-pv-w-2019-roku-gigantyczny-wzrost-w-fotowoltaice/ (accessed on 24 July 2020).
Figure 1.
Yearly horizontal insolation in Poland calculated per province’s capital city. KP province—Kuyavian-Pomeranian; M province–Lesser Poland. Source own study based on [18].
Figure 1.
Yearly horizontal insolation in Poland calculated per province’s capital city. KP province—Kuyavian-Pomeranian; M province–Lesser Poland. Source own study based on [18].

Figure 2.
Annual values of energy sent to the grid in relation to the installed capacity and the annual share of energy sent to the grid in relation to the consumed, in the Lesser Poland province 1 June 2019–31 May 2020. Source own study based on [32].
Figure 2.
Annual values of energy sent to the grid in relation to the installed capacity and the annual share of energy sent to the grid in relation to the consumed, in the Lesser Poland province 1 June 2019–31 May 2020. Source own study based on [32].

Figure 3.
Annual values of energy sent to the grid in relation per kWp to insolation and the maximum annual self-consumed (max. self-consumed/insolation) share, in the Lesser Poland province, 1 June 2019–31 May 2020. Source own study based on [32].
Figure 3.
Annual values of energy sent to the grid in relation per kWp to insolation and the maximum annual self-consumed (max. self-consumed/insolation) share, in the Lesser Poland province, 1 June 2019–31 May 2020. Source own study based on [32].

Figure 4.
Annual values of energy sent to the grid in relation to the installed capacity and the annual share of energy sent to the grid in relation to the consumed, in the Kuyavian-Pomeranian province, 2019. Source: own study based on [32].
Figure 4.
Annual values of energy sent to the grid in relation to the installed capacity and the annual share of energy sent to the grid in relation to the consumed, in the Kuyavian-Pomeranian province, 2019. Source: own study based on [32].

Figure 5.
Annual values of energy sent to the grid in relation to insolation and the maximum annual self-consumed (max. self-consumed/insolation) share in the Kuyavian-Pomeranian province, 2019. Source own study based on [32].
Figure 5.
Annual values of energy sent to the grid in relation to insolation and the maximum annual self-consumed (max. self-consumed/insolation) share in the Kuyavian-Pomeranian province, 2019. Source own study based on [32].

Figure 6.
Panels on the roof of a single-family building in Leki.

Figure 7.
Setting up 5 × 4 panels on the ground in Bydgoszcz.

Figure 10.
Self-consumption coefficient (SC) and self-sufficiency coefficient (SS) as a function of energy production per hour. June 2020.
Figure 10.
Self-consumption coefficient (SC) and self-sufficiency coefficient (SS) as a function of energy production per hour. June 2020.

Figure 11.
Daily energy production in PV installation (Leki), June 2020.

Figure 12.
Daily energy production in PV installation (Bydgoszcz), June 2020.

Figure 13.
Comparison of insolation values varied from locations for June in the last 11 years. Source own study based on [18,33,57].

Figure 14.
Comparison of the insolation values for both locations for June against the Typical Reference Year data and different location of the surface. (TRY_H–Typical Reference Year–Horizontal Surface, TRY_S45-Typical Reference Year–south directed surface titled 45°, TRY_SW30-Typical Reference Year–south-west directed surface titled 30° [18].

Figure 15.
Comparison of insolation values for both locations for individual days in June. (References to detail figures are marked-energy production results for both installations.)
Figure 15.
Comparison of insolation values for both locations for individual days in June. (References to detail figures are marked-energy production results for both installations.)

Figure 16.
Comparison of the unit results of energy production from installations for 12 and 13 June.
Figure 16.
Comparison of the unit results of energy production from installations for 12 and 13 June.

Figure 17.
Comparison of the unit results of energy production in an installation, for: (a) 15 June; (b) 22 June.
Figure 17.
Comparison of the unit results of energy production in an installation, for: (a) 15 June; (b) 22 June.

Figure 18.
Daily reduction of CO2 emissions as a function of insolation.

Figure 19.
Unit (investment) cost of CO2 emission reduction as a function of CO2 emission factor in the national grid and emissions related to the production of panels: (a) Leki; (b) Bydgoszcz.
Figure 19.
Unit (investment) cost of CO2 emission reduction as a function of CO2 emission factor in the national grid and emissions related to the production of panels: (a) Leki; (b) Bydgoszcz.

Figure 20.
Unit (investment) cost of CO2 emission reduction as a function of CO2 emission factor in the national grid and emissions related to the production of Leki panels with subsidy.
Figure 20.
Unit (investment) cost of CO2 emission reduction as a function of CO2 emission factor in the national grid and emissions related to the production of Leki panels with subsidy.

Figure 21.
Net Present Value (NPV) as a function of electricity price and discount rate value: (a) for Leki; (b) for Bydgoszcz. ElP = 0.15 EUR/kWh is actual electricity price in Poland.
Figure 21.
Net Present Value (NPV) as a function of electricity price and discount rate value: (a) for Leki; (b) for Bydgoszcz. ElP = 0.15 EUR/kWh is actual electricity price in Poland.

Figure 22.
Difference of Net Present Value (diff.NPV) Leki-Bydgoszcz as a function of electricity price and discount rate value: (a) excluding subsidies; (b) including subsidies. ElP = 0.15 EUR/kWh is actual electricity price in Poland.
Figure 22.
Difference of Net Present Value (diff.NPV) Leki-Bydgoszcz as a function of electricity price and discount rate value: (a) excluding subsidies; (b) including subsidies. ElP = 0.15 EUR/kWh is actual electricity price in Poland.


| Parameter | Unit | Leki | Bydgoszcz |
|---|---|---|---|
| Name | Longi HPH 360 | BIFACIAL | |
| Nominal power | kWp | 0.36 | 0.305 |
| Total length | m | 1.776 | 1.664 |
| Total width | m | 1.052 | 0.996 |
| Temperature coefficient of the short-circuit current | %/°C | 0.057 | 0.029 |
| Temperature coefficient of the open-circuit voltage | %/°C | −0.286 | −0.224 |
| Temperature coefficient of the power | %/°C | −0.370 | −0.279 |
| Technology | Mono-PERC | Bifacial, mono N |
Table 2.
Installation configuration.
| Parameter | Unit | Leki | Bydgoszcz |
|---|---|---|---|
| Number of panels | 14 | 20 | |
| Tilt angle | ° | 30 | 45 |
| Direction | SW | S | |
| Inverter | Fronius 5.0–3M | 2xSolar Edge SE10k | |
| Power of inverters | kW | 5 | 6.1 |
| Total PV panel power (PI) | kWp | 5.04 | 6.1 |
Table 3.
Energy production correction factors and annual energy gains.
| Parameter | Unit | Leki | Bydgoszcz |
|---|---|---|---|
| Monthly energy gains, EMG | kWh | 583.87 | 828.13 |
| Insolation coefficient, IJC | - | 0.89 | 0.95 |
| Insolation on the direction and angle, IDA | - | 0.991 | 0.988 |
| Converting the insolation from June to the whole year, JSHIA | - | 0.154 | 0.145 |
| Annual energy gains, EAG | kWh | 4300 | 6091 |
| Annual energy gains per PI, EAG/PI | kWh/kWp | 853 | 999 |
Publisher’s Note: MDPI stays neutral with regard to jurisdictional claims in published maps and institutional affiliations. |
© 2021 by the authors. Licensee MDPI, Basel, Switzerland. This article is an open access article distributed under the terms and conditions of the Creative Commons Attribution (CC BY) license (http://creativecommons.org/licenses/by/4.0/).
Share and Cite
MDPI and ACS Style
Olczak, P.; Olek, M.; Matuszewska, D.; Dyczko, A.; Mania, T. Monofacial and Bifacial Micro PV Installation as Element of Energy Transition—The Case of Poland. Energies 2021, 14, 499. https://0-doi-org.brum.beds.ac.uk/10.3390/en14020499
AMA Style
Olczak P, Olek M, Matuszewska D, Dyczko A, Mania T. Monofacial and Bifacial Micro PV Installation as Element of Energy Transition—The Case of Poland. Energies. 2021; 14(2):499. https://0-doi-org.brum.beds.ac.uk/10.3390/en14020499
Chicago/Turabian StyleOlczak, Piotr, Małgorzata Olek, Dominika Matuszewska, Artur Dyczko, and Tomasz Mania. 2021. "Monofacial and Bifacial Micro PV Installation as Element of Energy Transition—The Case of Poland" Energies 14, no. 2: 499. https://0-doi-org.brum.beds.ac.uk/10.3390/en14020499
Note that from the first issue of 2016, this journal uses article numbers instead of page numbers. See further details here.