1. Introduction
With the recent development of the versatile test reactor (VTR), there has been a substantial increase in the interest in modeling metallic fuel performances for startup fuel and to predict pin failure rates [
1]. These pin failure rates are predicted by the cumulative damage fraction (CDF) in cladding and cladding strain accumulation. For example, in the VTR design criteria, the acceptable failure criteria is one in 13,000 pins [
1]. This failure criteria will be assessed either using a CDF or maximum cladding strain within a fuel performance code, such as BISON. In recent developments, BISON has been linked with the Integral Fast Reactor (IFR) Materials Information System (IMIS) and Fuels Irradiation & Physics Database (FIPD) to supply post-irradiation examination (PIE) and fuel pin operational data from the Experimental Breeder Reactor (EBR)-II for fuel performance analysis [
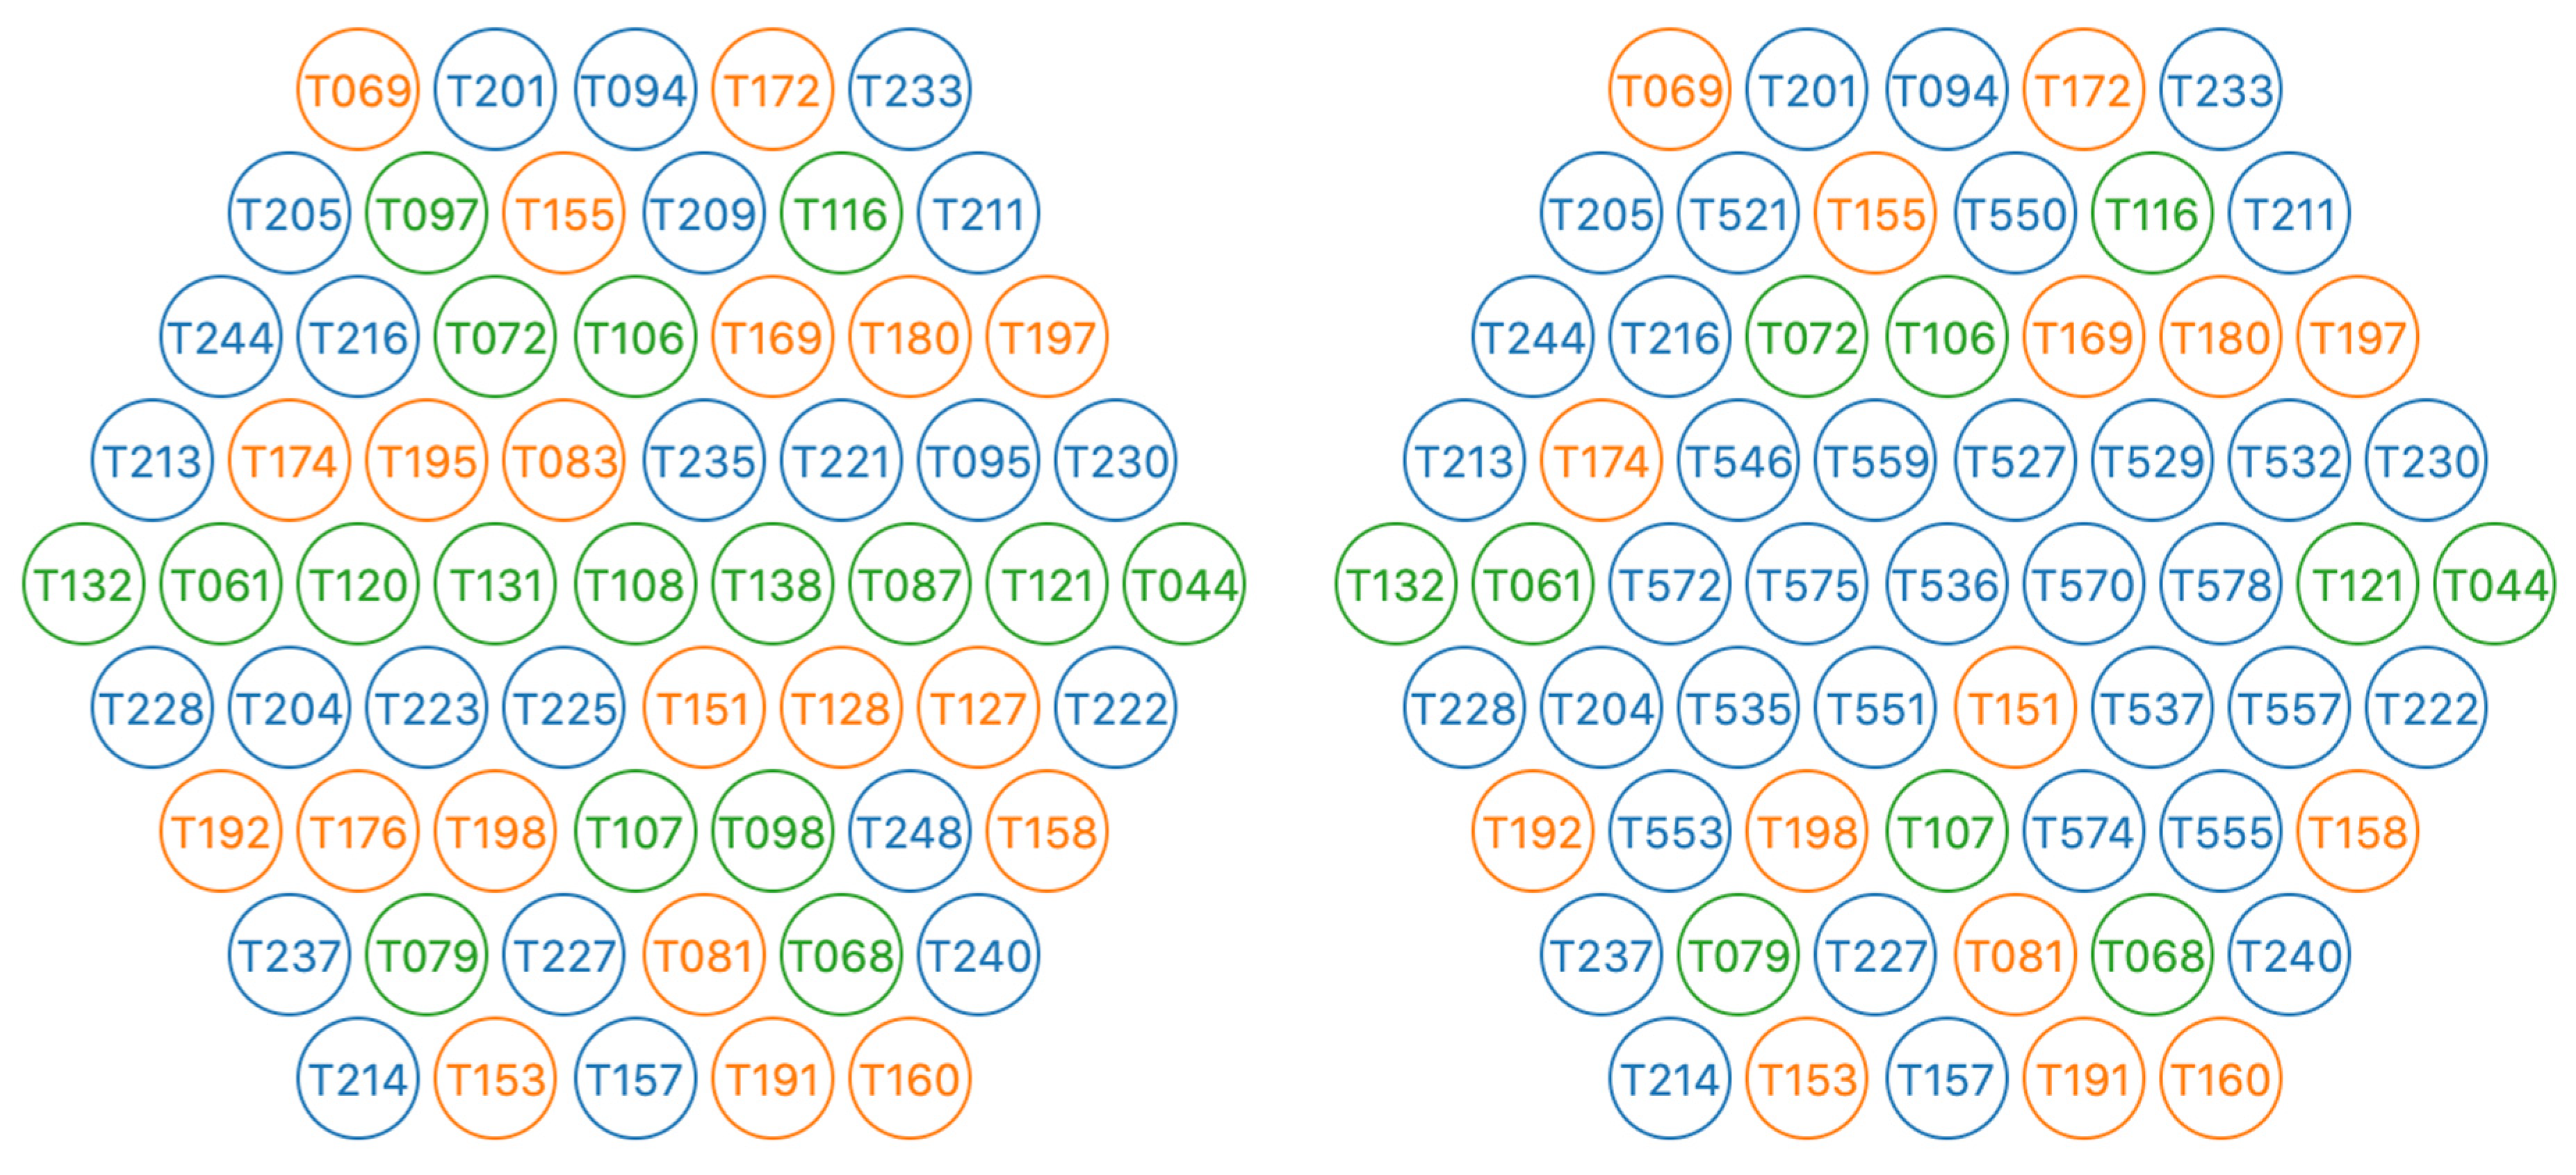
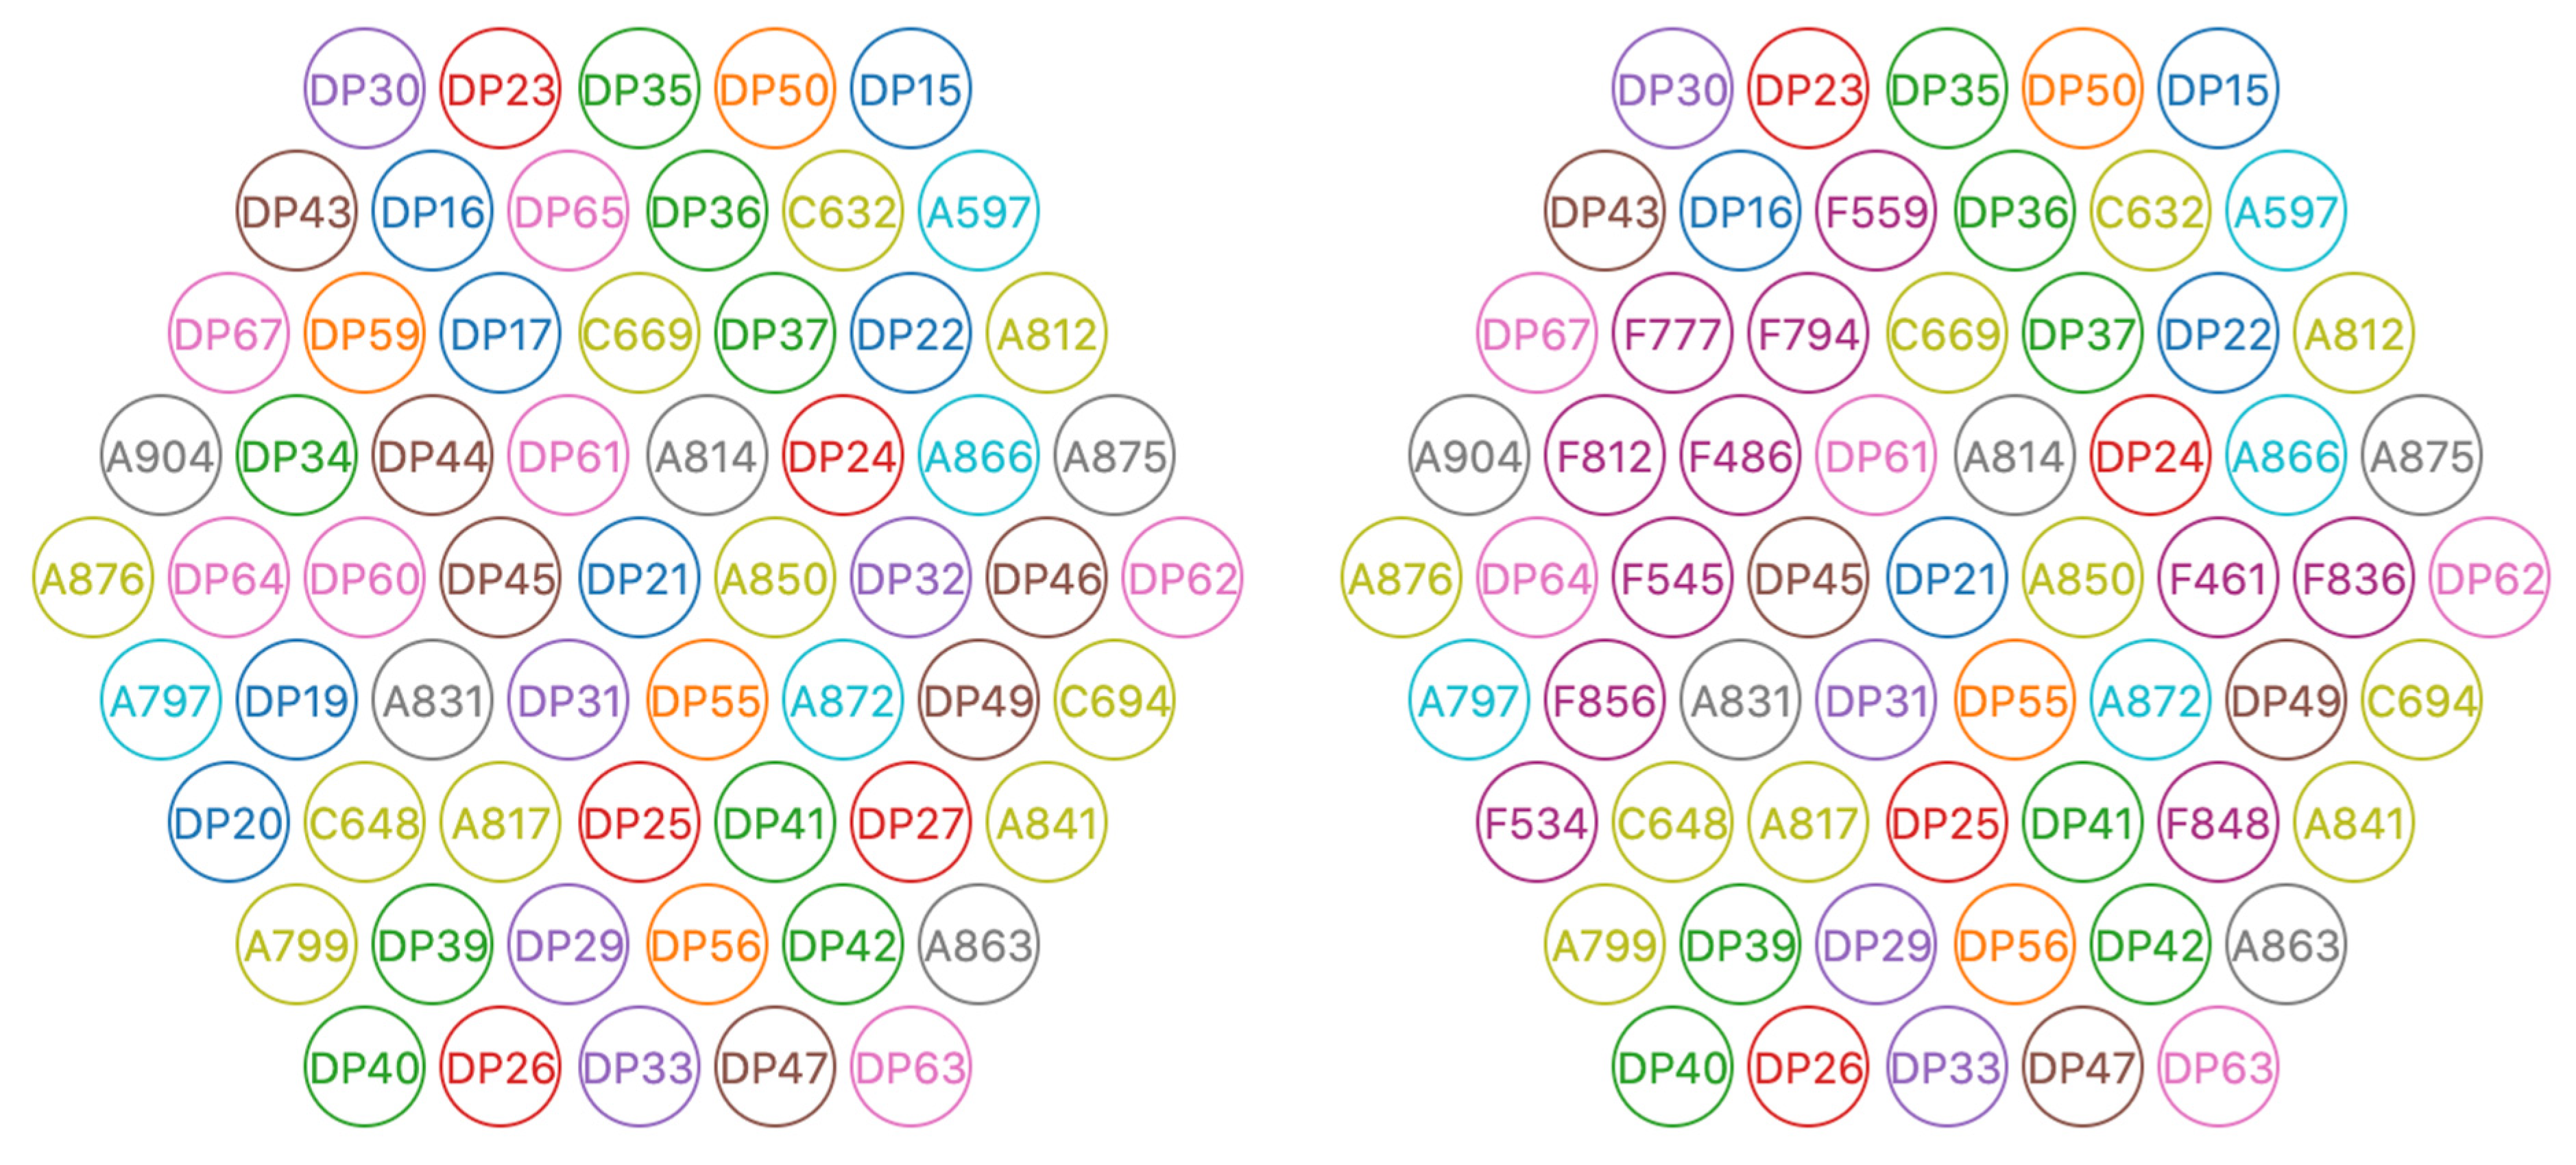
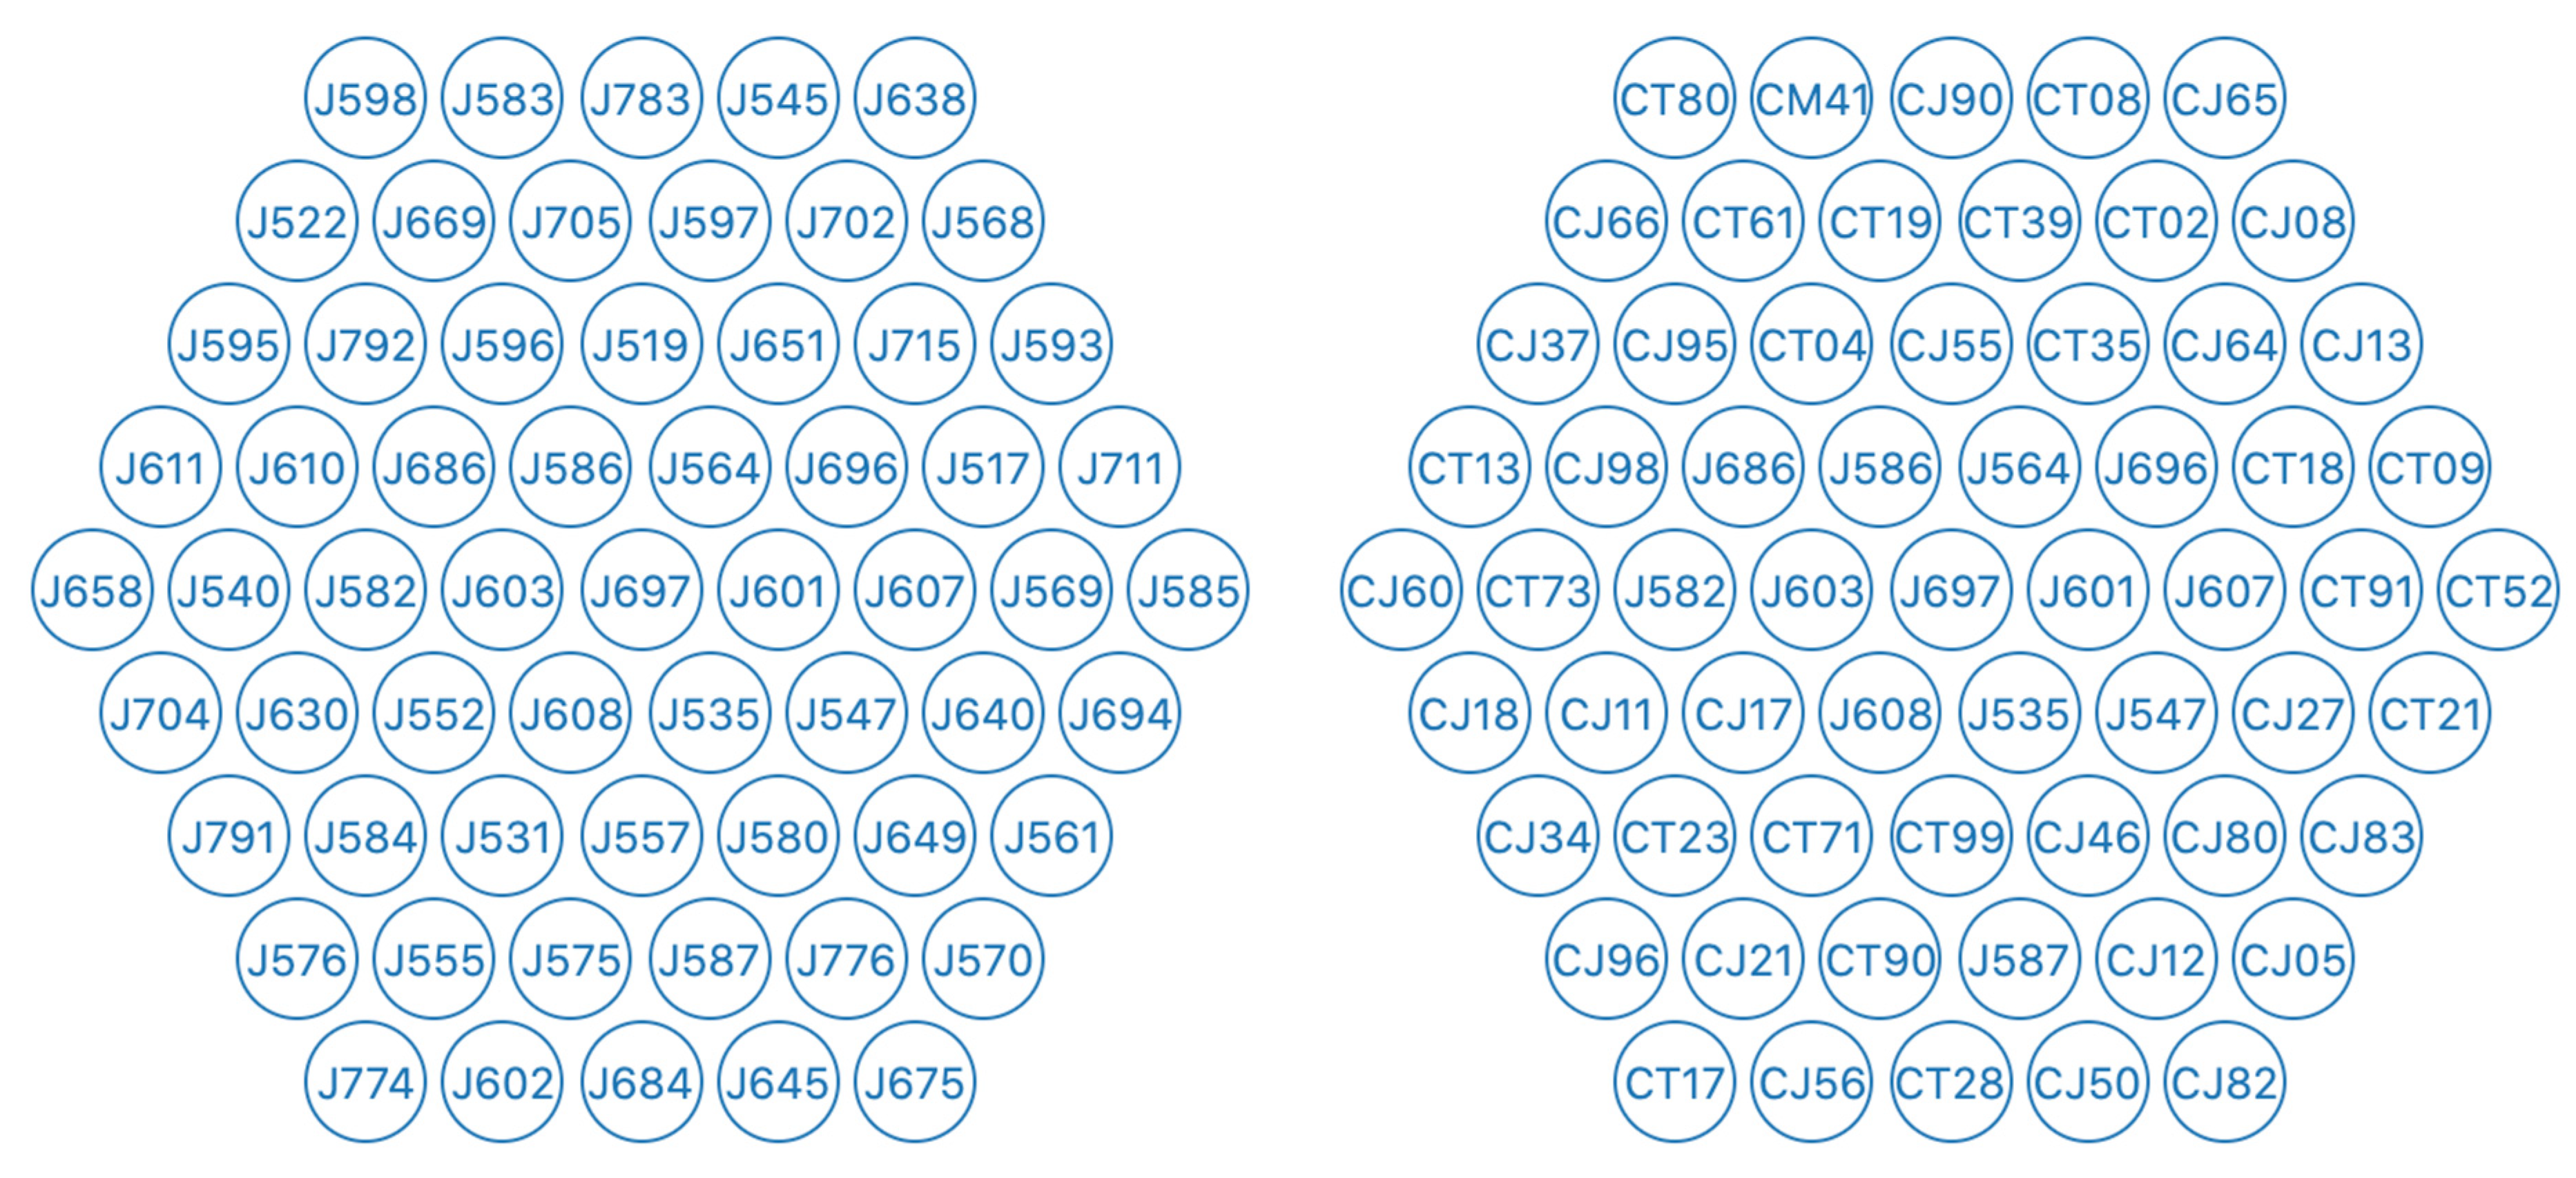
2]. The linking of the databases allows for assessment cases to be benchmarked and new models to be developed to more accurately evaluate fuel performance, such as the irradiation-induced volumetric swelling of cladding materials. The addition of volumetric swelling models for HT9, D9, and SS316 cladding within BISON allows for a proper assessment of cladding strain with the addition of other material models used in the evaluation. In this manuscript, the implementation of volumetric swelling models for HT9, D9, and SS316 cladding in the BISON code will be examined and assessed using EBR-II fuel pins from the 61-pin experiments X421, X441, and X486. The sub-assemblies for X421, X441, and X486 are shown
Figure 1,
Figure 2 and
Figure 3. Pins within X421 and X441 are colorized to represent different pin groups within the sub-assemblies, with pin information available within FIPD [
3,
4]. All pins within X486/X486A had identical specifications and were not separated into groups, such as X421 and X441.
BISON is a finite element method code based off the Multiphysics Object Orientated Simulation Environment (MOOSE), which allows for users to create C++ objects for tightly coupled simulations [
5]. BISON allows for fuel performance to be evaluated for a variety of fuel forms, including light water reactor fuel rods, tri-structural isotopic particle fuel, and metallic fuel [
6,
7]. BISON solves the fully-coupled thermomechanical equations and species diffusion for various geometry configurations. Fuel models within BISON include temperature, porosity, and burnup-dependent thermal properties, fission product swelling, densification, fracture, and fission gas production and release [
8]. Mechanical and thermal contact are allowed to be modeled as well to allow for thermomechanical coupling. The primary benefit of using BISON compared to other fuel performance codes is the ability for BISON users to contribute their own C++ objects to the code and develop models currently not within BISON, such as empirical HT9, D9, and SS316 clad void swelling correlations. Other codes such as PANTHER, and LIFE-METAL do not provide advanced, detailed thermomechanical coupling that BISON allows, allowing for stresses, temperatures, and other variables to be coupled over time for individual pins [
9]. Alloyed Fuel Unified Simulator (ALFUS), another fuel performance code, does thermomechanical coupling, but does not allow the user to easily write other properties into the code.
Previous work in the initial BISON automation demonstration showed that the implementation of SS316 volumetric swelling matched well with the profilometry, only deviating by a few micrometers from PIE data [
2]. The BISON input file generation within this previous work will be the basis for the cladding strain evaluation presented in this manuscript to keep the physics and other input conditions the same, with the addition of four major improvements. The first improvement is the inclusion of individual pin flux/fluence values. In the initial demonstration of the BISON automation with IMIS and FIPD, assembly average flux values were used for each run for the EBR-II fuel pins, which caused irradiation-induced volumetric swelling of pin J555, with cold-worked Type SS316 cladding, to be overpredicted due to the assembly average flux values being greater than the flux values for the individual pin, J555. Using the assembly average flux values for individual pins may over or underpredict cladding strain and CDF depending on how much the pin flux values deviate from the assembly average. In the case of irradiation-induced volumetric swelling for D9 and SS316 cladding, a 10% difference of total fluence can double the amount of volumetric swelling a metallic fuel pin may experience. The second major improvement is implementing individual power and flux axial profiles, rather than the two generic EBR-II functions available within BISON. This allows for better representation of the power and flux axially, which directly affects the amount of volumetric swelling in each node. With these implementations, it is expected that the profilometry within the previous work will change. The third improvement is changing the contact model in BISON from frictionless to frictional contact, with a friction coefficient specified. This allowed for more accurate stress from a fuel/cladding mechanical interaction (FCMI) to be placed on the inner cladding wall and corrected for excess axial fuel swelling. The fourth improvement is the addition of volumetric swelling for EBR-II pins.
Other work outside of BISON to predict cladding profilometry and cladding strain includes codes such as the ALFUS, which is an irradiation behavior analysis code developed specifically for metallic fuel [
10]. Within the simulations performed in ALFUS, fission gas release (FGR), FCMI, porosity, temperature distribution, and mechanical models were needed for strain [
10]. Similarly to BISON, the material models within ALFUS are coupled together. Results for U-Pu-Zr fuel modeled within ALFUS were in agreement with experimental FGR percentage and axial fuel elongation for burnups between 5–10 at %. The cladding strain predicted by ALFUS were less than desirable for the measured data at the time. Since 1999, more PIE profilometry measurements have become available for EBR-II fuel pins within IMIS and FIPD [
3,
4]. This allows for this analysis to be repeated within BISON for a better comparison of data.
The irradiation-induced volumetric swelling models that were added into the BISON code and used within the BISON simulations were based off EBR-II and Fast Flux Test Facility (FFTF) Mechanistic Fuel Failure (MFF) fuel pins from the irradiation experiments. There have been multiple iterations and updates to these equations over the years, which were originally developed to predict the cladding strain and volumetric swelling of cladding while in a reactor system [
11,
12,
13,
14]. Each of the volumetric swelling correlations use volumetric strain, which depends on the volume change due to void formations and thermal precipitation-based densification. In the case of the void swelling equation for SS316 used here, there is no thermal densification term [
13,
14]. Each correlation is a function of current temperature and fluence to predict the volumetric swelling, which is useful for predicting volumetric swelling under reactor conditions. However, the pin operating temperatures change during the life of the irradiation, so rate versions of the equations were used to integrate over the time period of operation.
For the work presented here, a statistical analysis is performed over the cladding profilometry for D9, HT9, and SS316 pins within X421, X441, and X486, respectively. The profilometry used in this study was supplied by FIPD and IMIS for direct comparison to BISON simulation results. The creation of the BISON input files used the combination of the two databases in addition to the generic BISON EBR-II input file. Out of the possible 174 digitized cladding profilometries, only two pins from each experiment will be presented, with a statistical evaluation accompanying each experiment. However, linking BISON with the databases allows all pins to be modeled if desired. The EBR-II fuel pins presented in this study include T068 and T227 from X421, DP21 and DP25 from X441, and J555 and J630 from X486. The BISON simulation profilometry results and other PIE parameters were compared to the PIE data with the volumetric swelling models enabled to see the impact on assessment cases, cladding strain, and CDF for fuel performance. Note that swelling strain does not contribute to CDF.
2. Materials and Methods
All BISON input files used in this work include modifications based off a generic EBR-II input file developed in previous work [
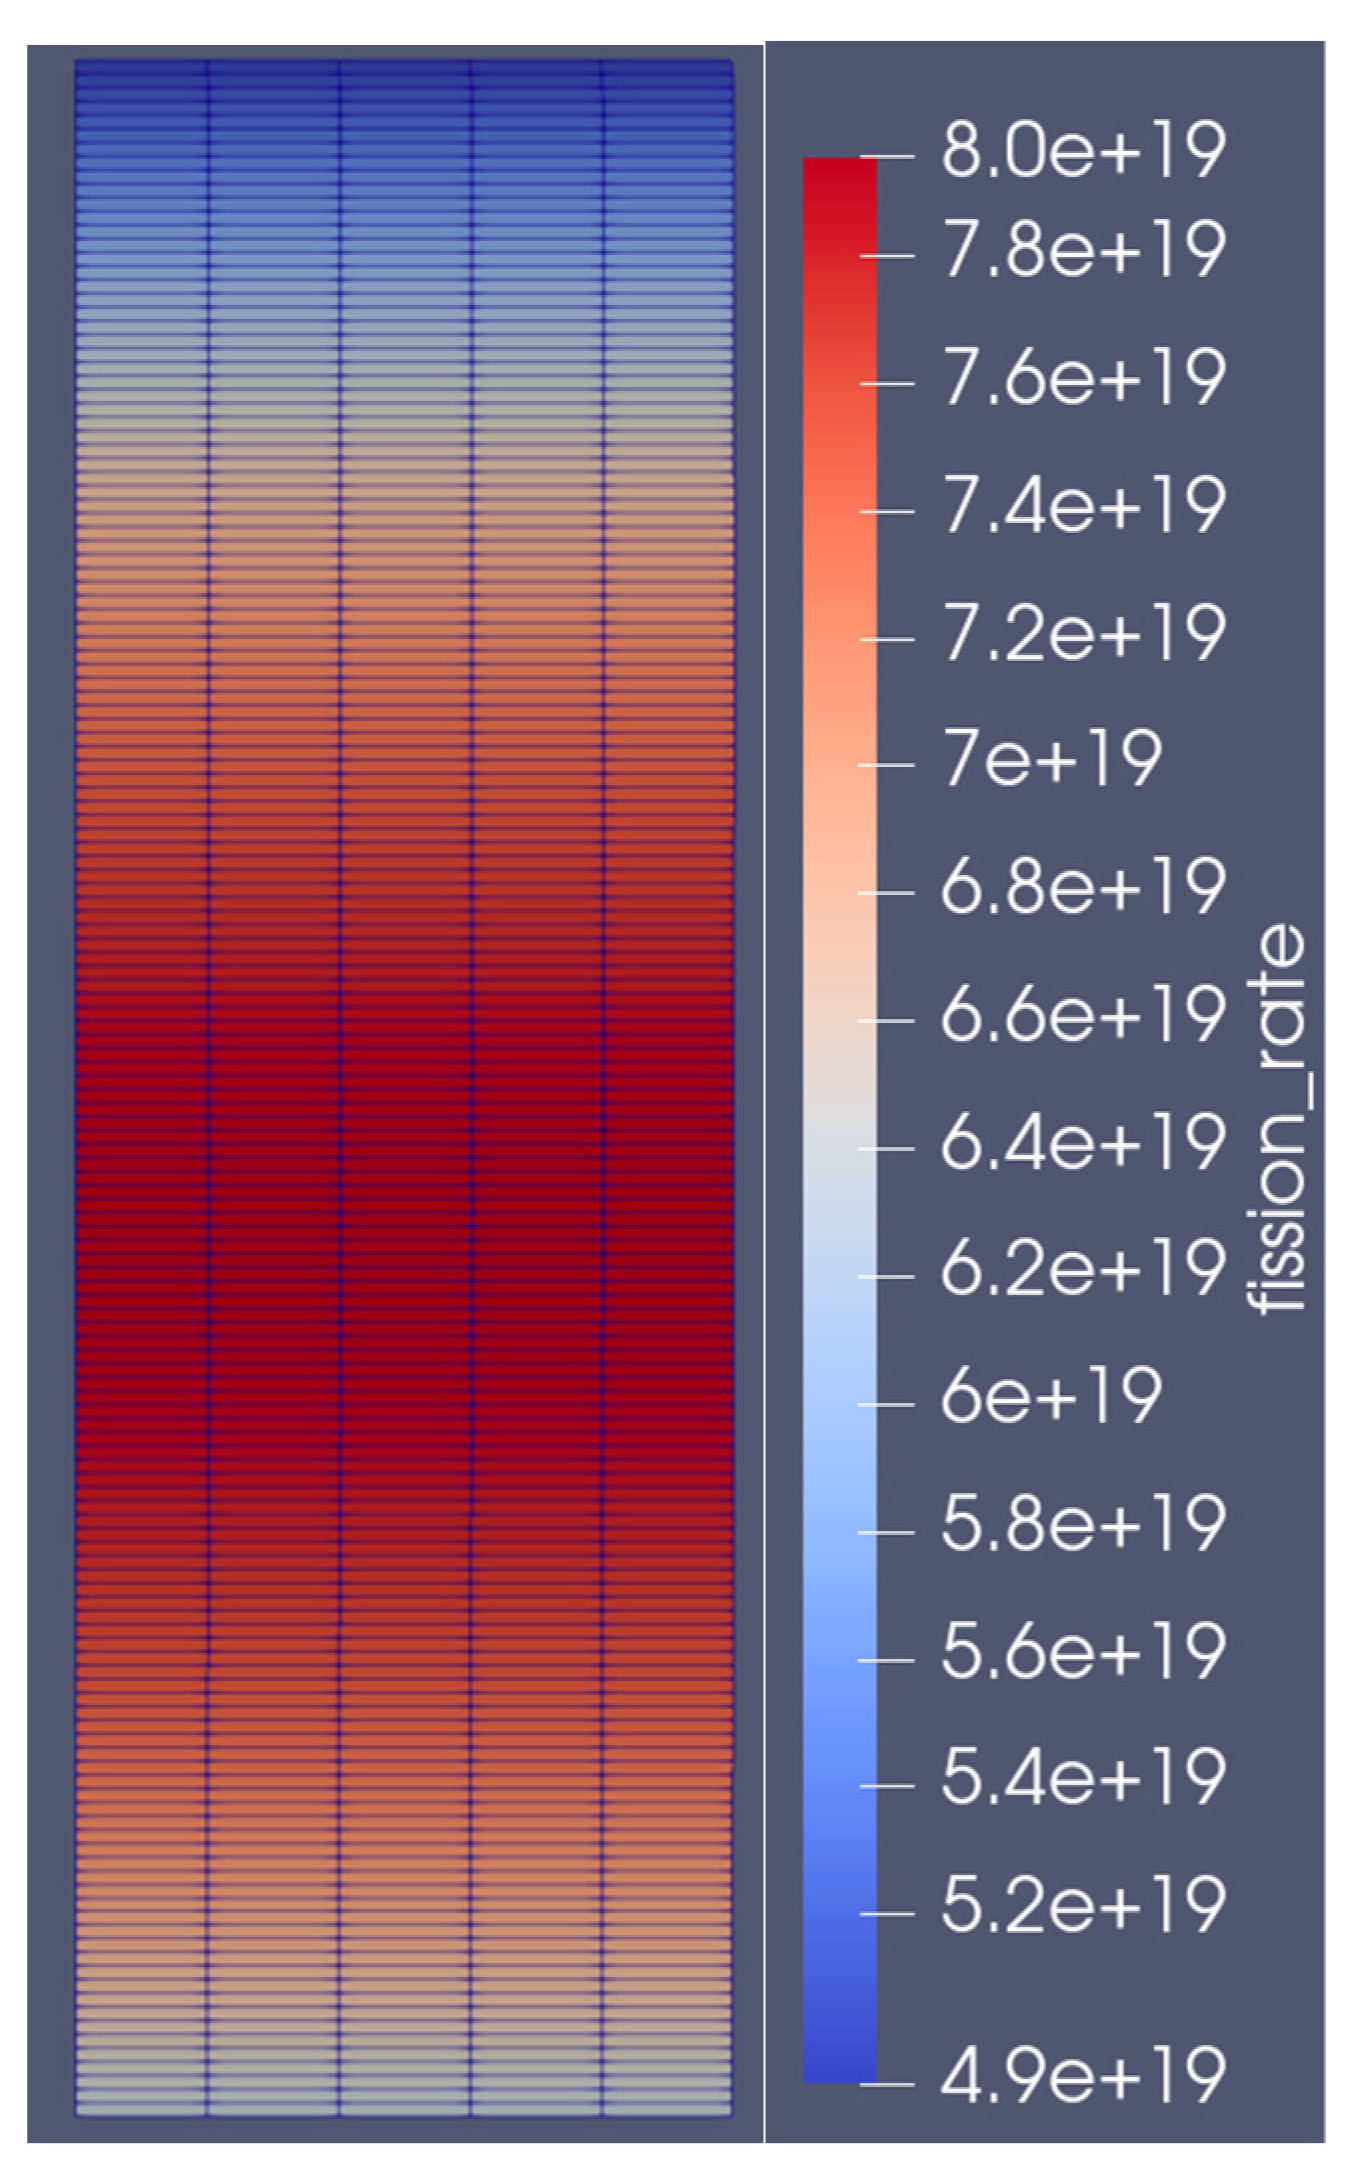
2]. In total, 174 unique PIE profilometry measurements were used in this study for statistical analysis, with 127 unique pins within the PIE profilometry for the three experiments. For experiment X486, there were only six digitized cladding profilometry profiles available for the statistical study, whereas there were 68 for X421/X421A and 110 for X441/X441A. Additions to the generic EBR-II file include individual pin fluence values supplied by FIPD rather than the assembly averaged flux values supplied by IMIS, individual pin axial power and axial flux profiles, irradiation-induced volumetric swelling models, and frictional contact. Pin information for the six pins presented in this study, including experiment, fuel type, cladding type, smeared density, and cumulative burnup are found in
Table 1. An example axial power profile being applied to the fission rate within the BISON simulations is seen in
Figure 4.
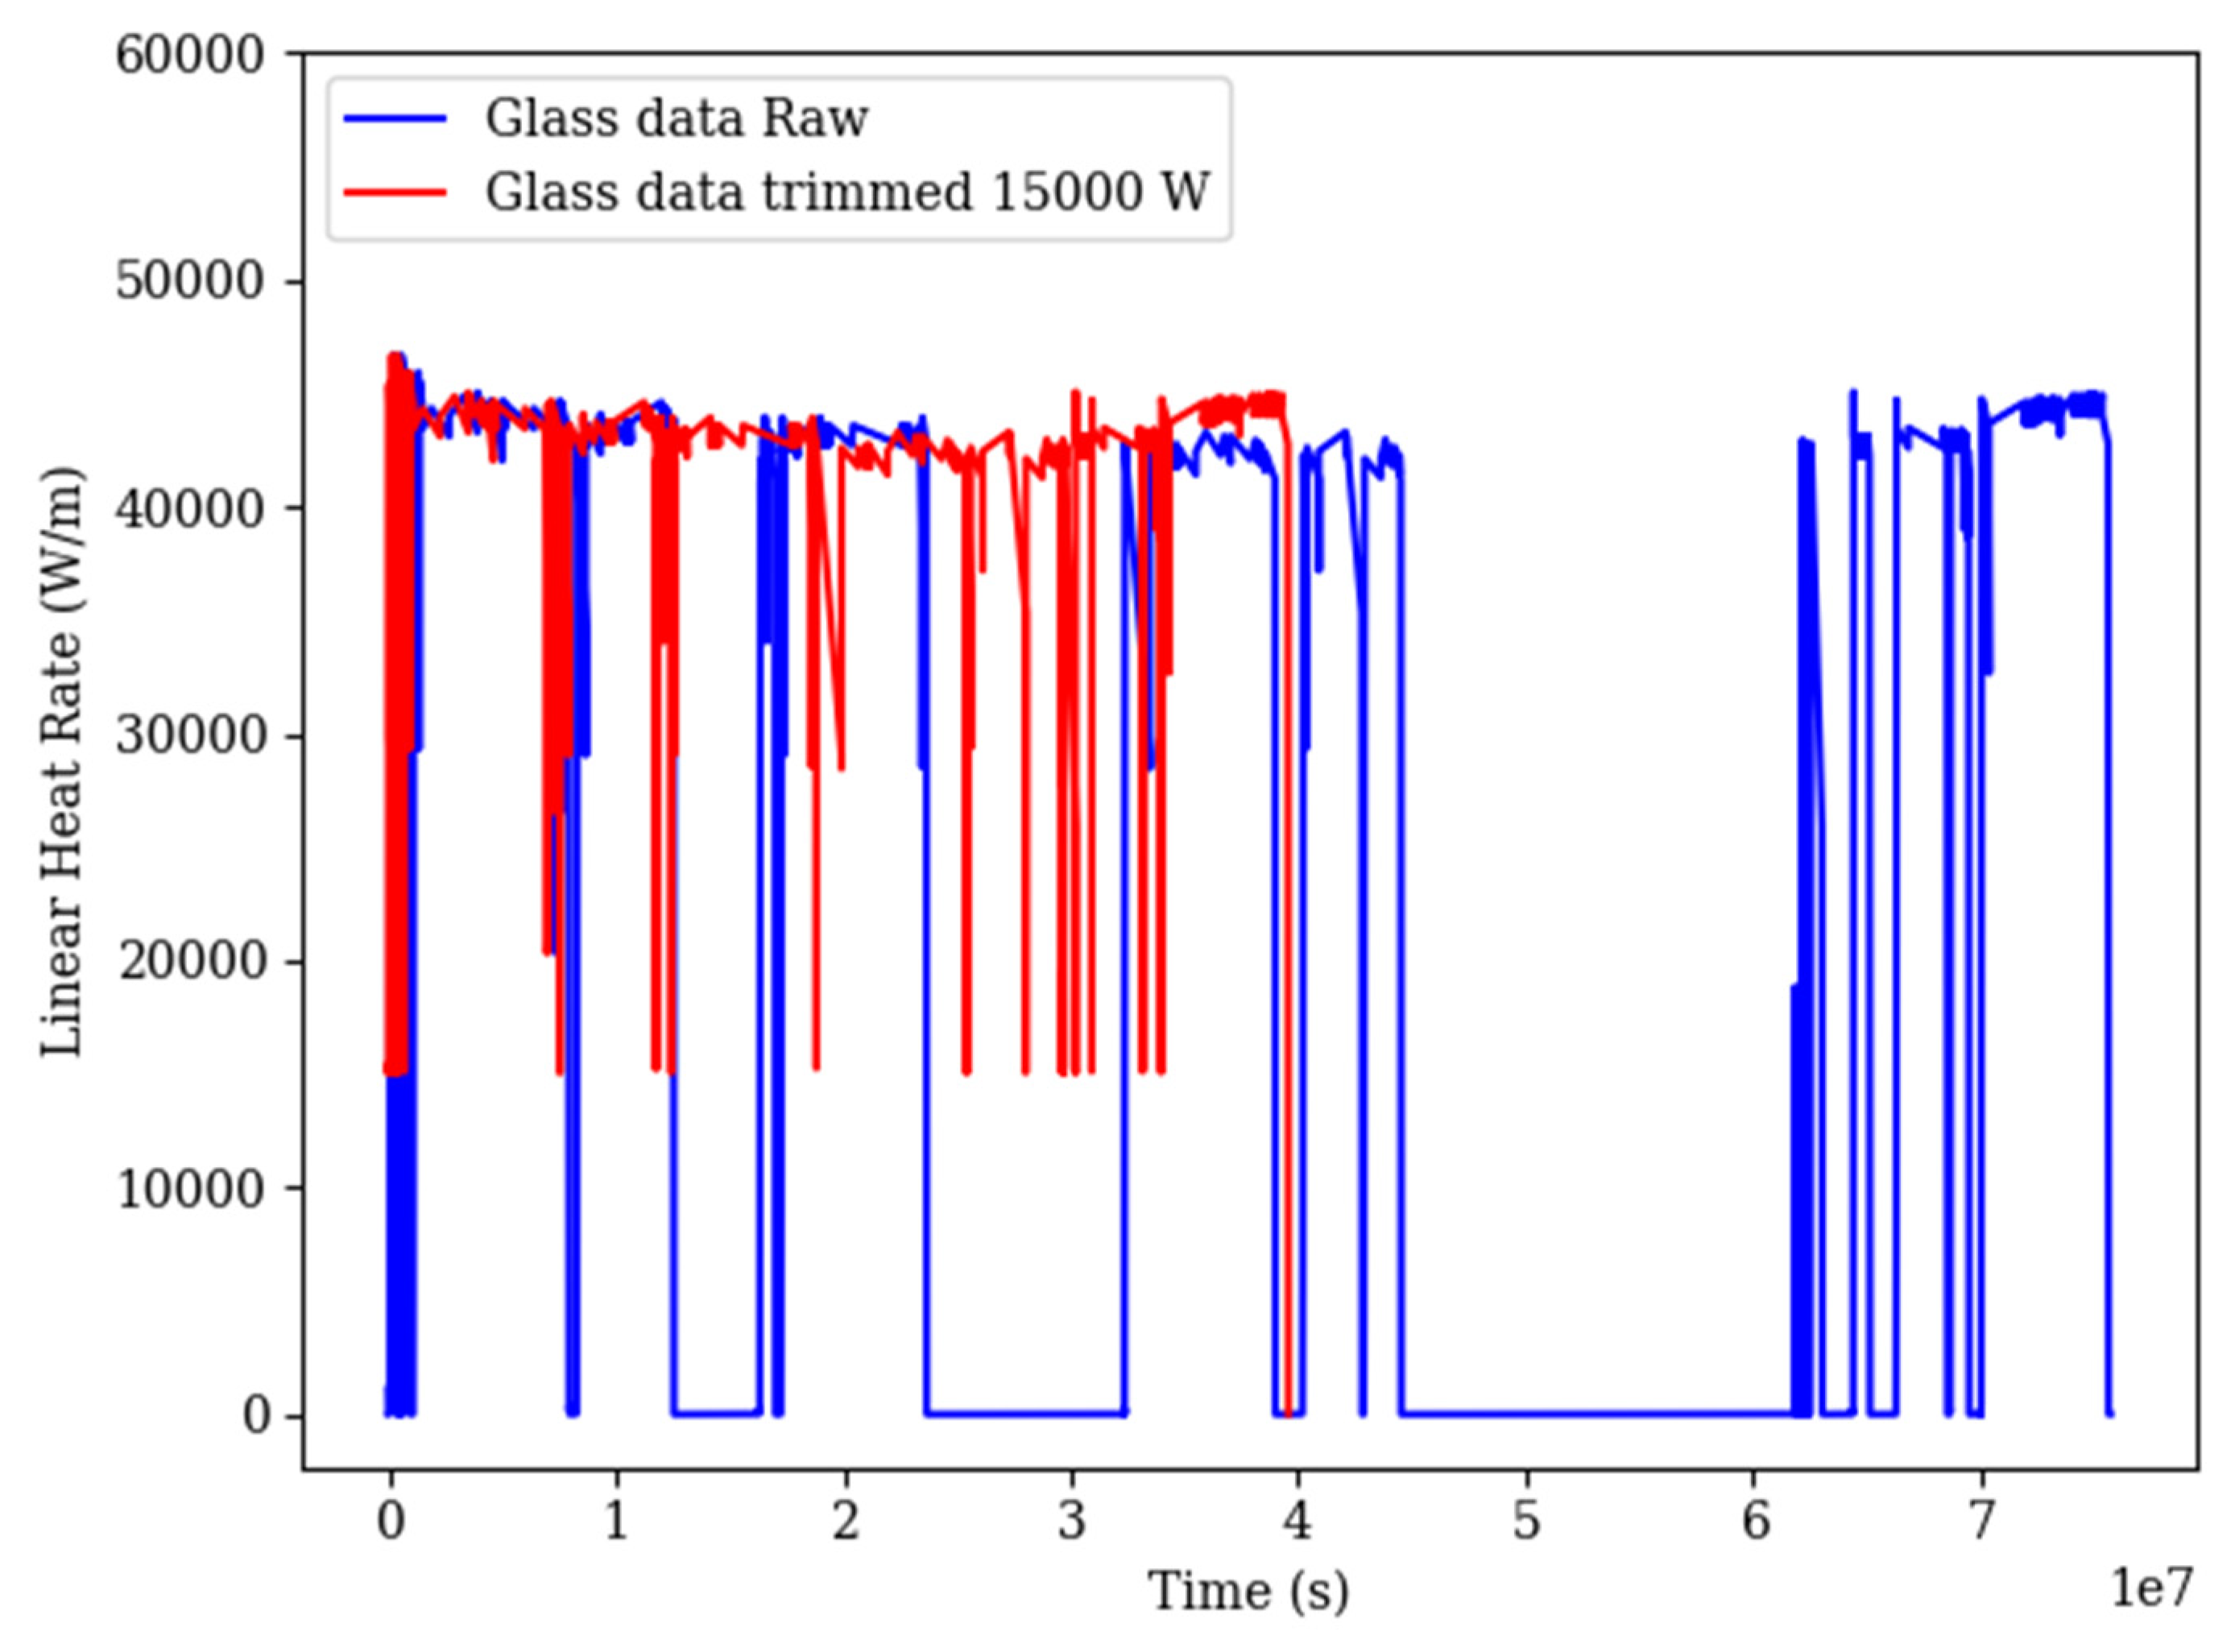
The pin fluence values from FIPD were taken for each run and coupled with Germanium-Lithium Argon Scanning System (GLASS) data to produce flux values for each pin. This was done by taking the difference in fluence between runs in FIPD and dividing by the time difference of each run obtained from the GLASS data. This results in the run-average flux, which is multiplied by the max-to-average power of the run to obtain the run maximum flux. The maximum flux of each run is then multiplied by the normalized GLASS data to produce a unique flux history for each pin. If GLASS data was unavailable for a run, such as at the beginning of X421 and the end of X486, the average LHGR and fluence values within FIPD were used. Average flux values without GLASS data were obtained similarly by taking fluence values from each run and dividing by the known run time. An example power history is provided in
Figure 5. The implementation of individual pin fluence values from FIPD resulted in a better PIE profilometry agreement when coupled with volumetric swelling models for D9 and SS316 clad pins. The swelling in HT9 clad pins was minimal.
Axial power and axial flux profiles for each pin were generated by fitting a third order polynomial to the axial fluence values supplied from FIPD. The fitting of the third order polynomial to the axial fluence values resulted in a R
2 of one, which is expected as FIPD used a third order polynomial to display the data [
4]. This was done, as this process mirrors the PowerPeakingFunction documentation found within BISON [
15]. The coefficients from the third order polynomial were passed in through the BISON input file to create an axial power and axial flux profile for each pin, which changes based on the location within the experiment assembly. The shape of the axial profiles directly affects the cladding profilometry by varying the fluence values and fission rate density, which affect other material properties and variables, one of them being the irradiation-induced volumetric swelling influenced by temperature.
Frictional contact between the fuel and the inner cladding was changed from frictionless contact to a frictional model, AugmentedLagrange, with a friction coefficient of 0.2. This friction coefficient was chosen because other lubricated steels have a friction coefficient between 0.11 and 0.23 depending on what substance was used to lubricate the two surfaces. It is assumed that U-Pu-Zr fuel acts as a steel, such that friction coefficients from steel-to-steel contact may be used, with the sodium bond acting as a lubricant for FCMI.
Volumetric swelling was merged into BISON for HT9, D9, and SS316 cladding types. HT9 and D9 use a variation of the following equations presented in Equations (1) and (2) respectively, where
. is the volumetric strain from swelling and densification,
. is the negative fractional density change from void formation, and
. is the fractional density change from solid-state reactions [
11,
12,
13,
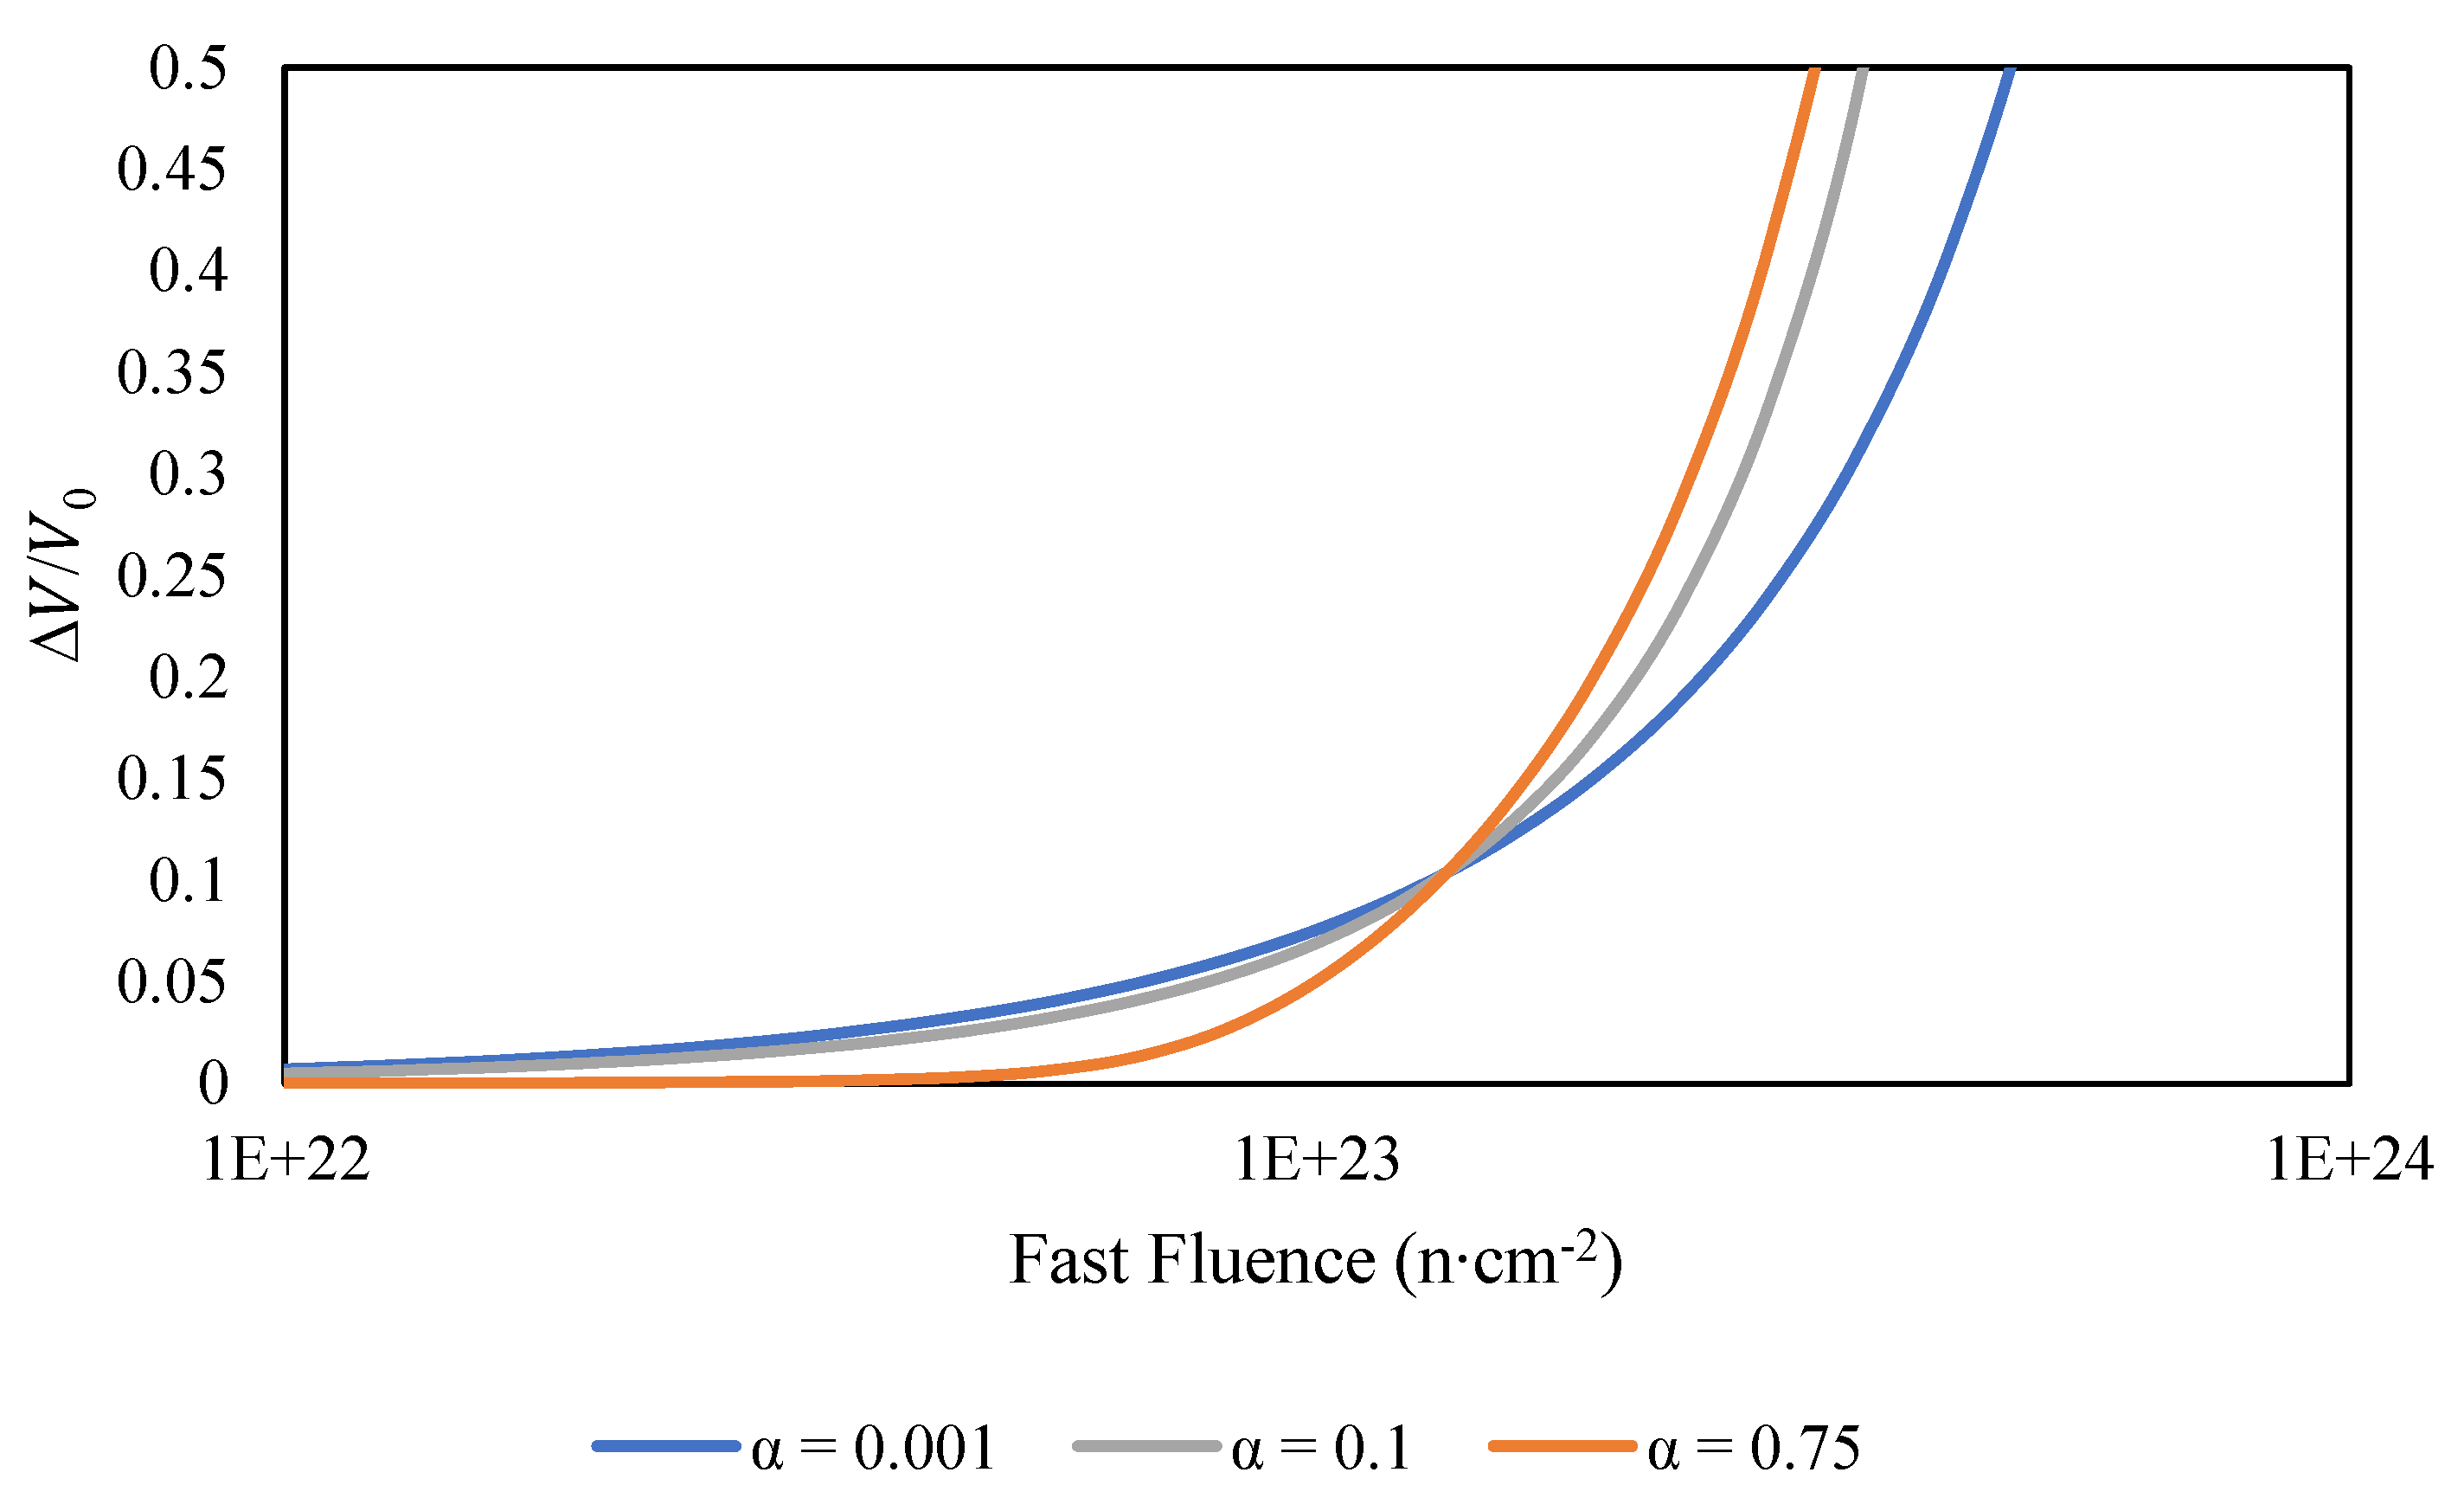
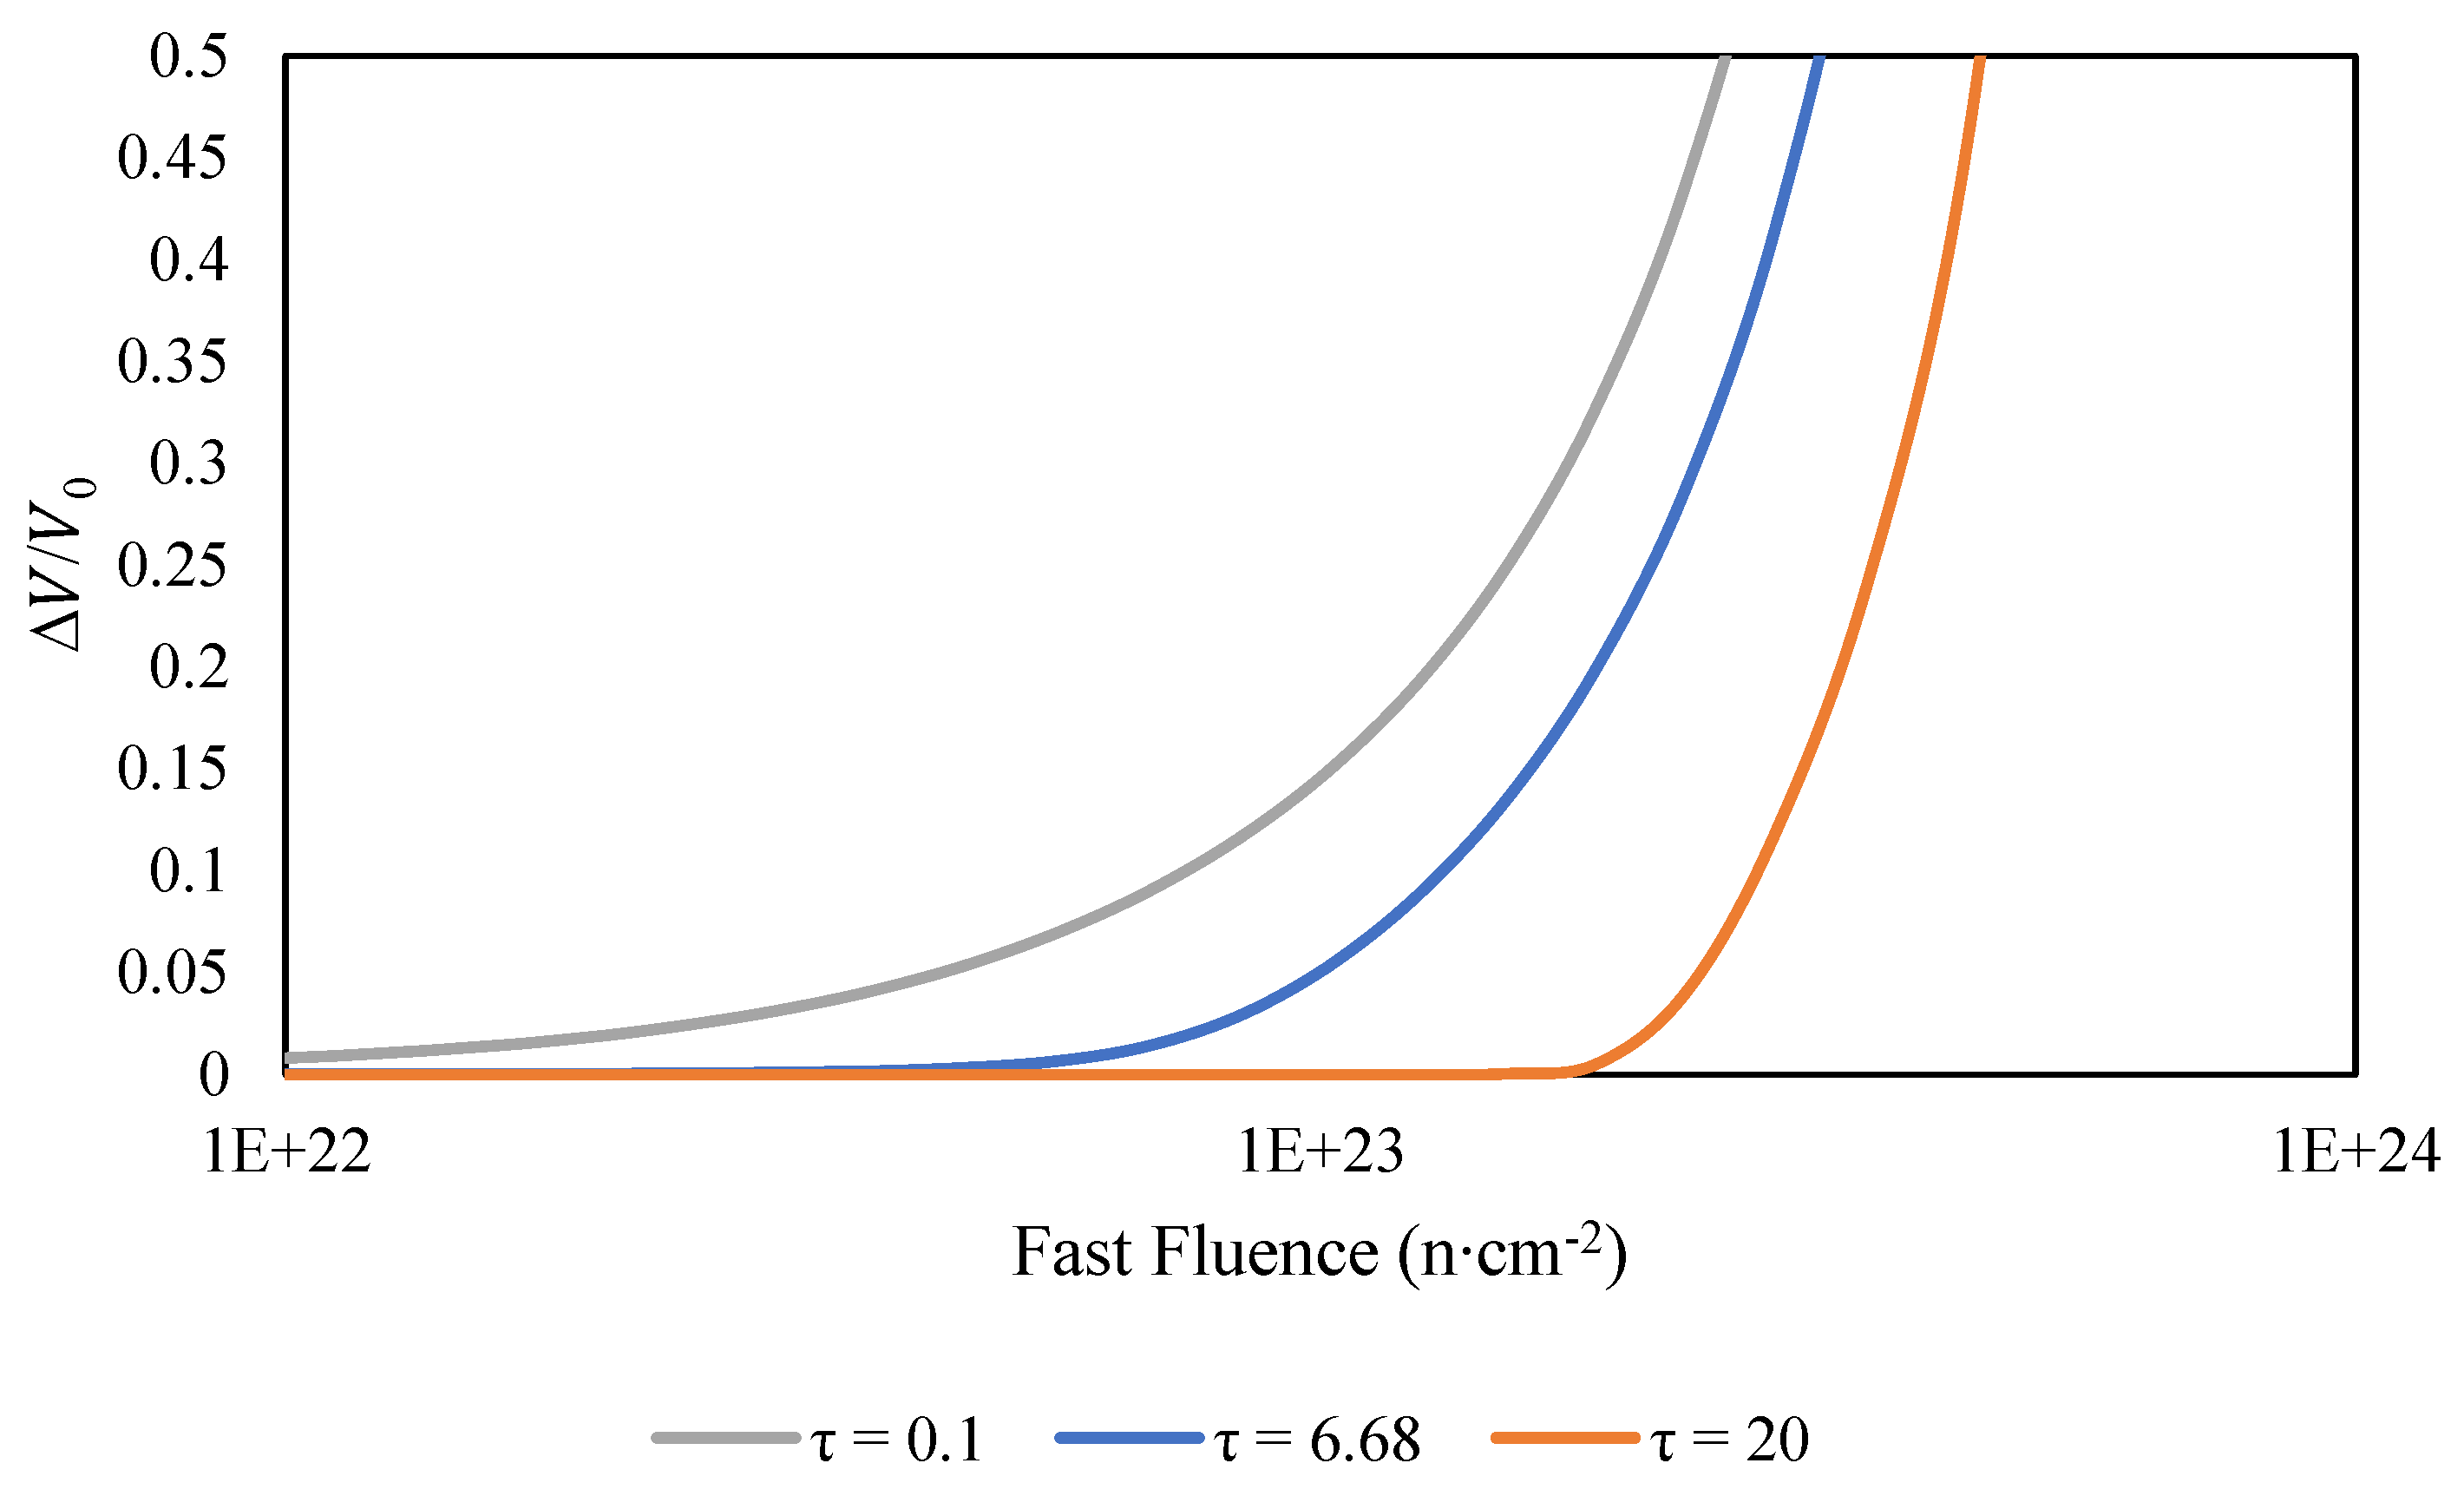
14]. Over the years, the empirical correlations for HT9, D9, and SS316 have been modified as more cladding strain data became available. This has resulted in new renditions of the equations with updated values, such as
R, τ, and α. These three parameters determine the curvature of the volumetric cladding strain growth rate (α), and when the rapid steady-state swelling begins (τ). The sensitivity of these parameters is shown in
Figure 6,
Figure 7 and
Figure 8 using the volumetric swelling strain for SS316 presented in Equation (3).
Volumetric swelling strain for each cladding type uses Equation (4) for the volume change from void formations. HT9 and D9 cladding use Equations (5) and (6) for the volume change from solid-state reactions. SS316 volumetric swelling does not include solid-state reactions.
R used in Equation (4) is the steady-state swelling rate percentage with units of 10
−22 cm
2. For HT9 and D9 claddings the steady-state swelling rate is calculated by using different coefficients and temperatures where the maximum swelling occurs in Equation (7) and (8), respectively. The steady-state swelling rate for SS316 is calculated by using a polynomial fit from experimental data and
β in Equations (9) and (10).
The curvature parameter,
α, has a unit of 10
−22 cm
2 and determines the curvature of the swelling growth rate of each volumetric swelling correlation. The incubation parameter,
τ, has a unit of 10
22 cm
−2 and determines the fluence where the rapid, steady-state swelling begins.
Equations (1)–(3) are formulated to give an instantaneous estimate of the volumetric swelling based on current temperature and fast neutron fluence. This was done to estimate volumetric swelling within a reactor environment to determine the volumetric swelling during irradiation. Equations (1)–(3), when implemented in the BISON code, are not directly applicable due to the temperature change caused by power oscillations in the simulations. To account for the swelling that occurs at different temperatures and fluence levels while a fuel pin is under irradiation, derivatives of Equations (1)–(3) were taken to produce the swelling rates in Equations (14)–(16). To get the volumetric swelling of each cladding, the change in volumetric swelling was multiplied by the change in time and summed, as seen in Equation (17). Equations (18)–(20) show the derivatives of the volume change from the void swelling and solid-state reactions for each cladding type.
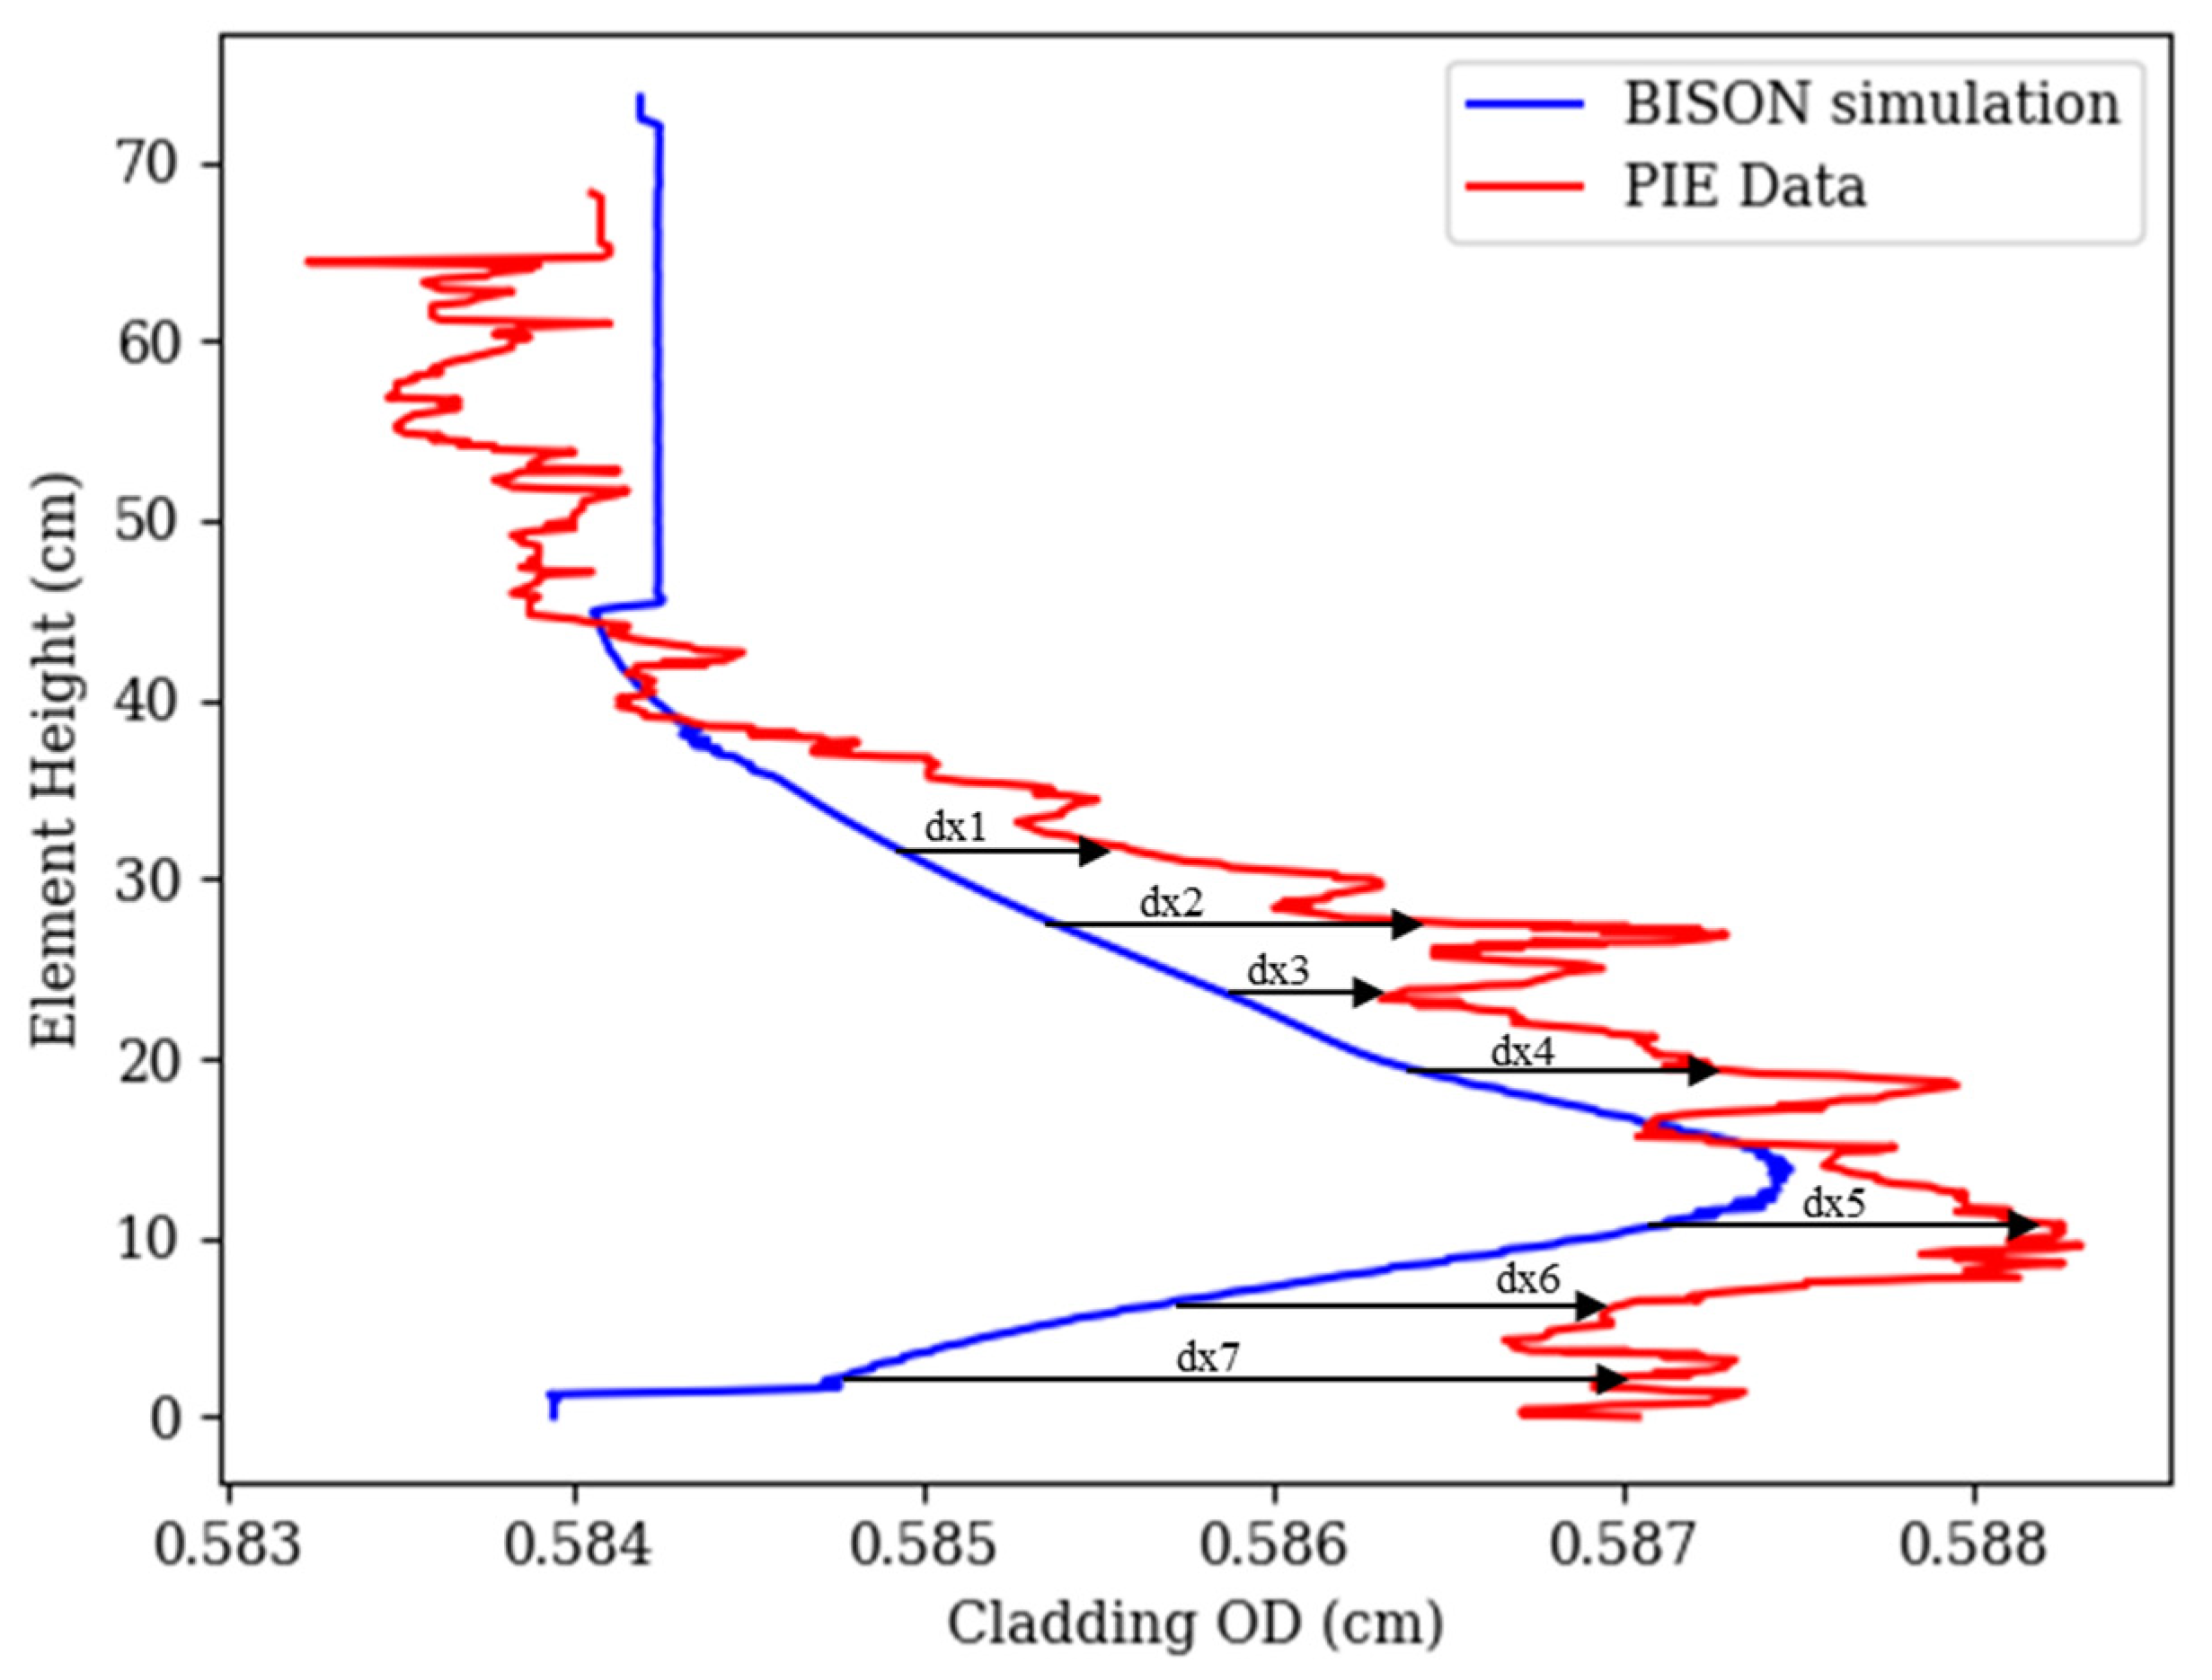
Implementation of the volumetric swelling equations within BISON allowed for clad profilometry profiles to better match the PIE measurements with the addition of individual pin axial profiles and flux values. The implementation of the changes to the BISON input file described previously allows for a more accurate assessment of the volumetric swelling models and a statistical assessment over the BISON profilometry predictions. The statistical study for each experiment utilized each digitized cladding profilometry profile within FIPD. Due to the number of datapoints within the digitized PIE profilometry being different from the BISON results due to mesh size, the BISON profilometry results were linearly interpolated to compare clad strain measurements for each axial PIE datapoint. This was done to assess the accuracy of the profilometry profile shape produced from BISON. The difference between each cladding strain from the BISON and PIE measurements were stored in a list and shown for each pin, as shown in
Figure 9, along with the average and max cladding strains. A standard error of the estimate (SEE) was used to evaluate the accuracy of the profilometry profile BISON simulations produce, as the SEE accounts for the difference between the BISON and PIE datapoints. The PIE cladding profilometry was measured by using mechanical rollers, which may have had contamination on them when measuring the outer diameters of fuel pins. This can lead to variation and noise within the PIE data. Noise within the PIE data was not smoothed for SEE calculations, as this would result in a smaller variance. This is seen in Equation (21), where
y is the BISON cladding strain,
is the PIE cladding strain, and
n is the number of profilometry datapoints in a pin. The SEE was also applied to each experiment to assess the profilometry profile for each volumetric swelling model.
The difference in average and maximum cladding strain, along with standard deviation of the difference, was computed for each pin. BISON overpredicting the cladding profilometry results in the difference in average and maximum cladding strain being negative. This was done to assess how each volumetric swelling model predicts the average and max cladding strain within each pin, not necessarily where the average and max cladding strain occur. BISON cladding profilometries were lowered to 293 K such that a direct comparison with PIE data may be made. If the SEE and difference in average strain and max strain for each pin are all relatively low, it can be concluded that the volumetric swelling model implemented accurately depicts the profilometry profile, average strain, and max strain of the cladding. SEE strain was calculated by taking the SEE value for each pin and dividing by the manufactured cladding outer diameter. Note that creep is included in the cladding diameter change for both modeling and PIE data, which could affect the differences between the two in addition to differences in swelling. For HT9-clad pins, this can be significant because the swelling of the cladding is very small.
3. Results
To illustrate implementation of the volumetric swelling models in the BISON code and the implementation of individual axial profiles and flux values from FIPD, 127 unique pins were simulated. Out of the 127 pins, only six are displayed, including T068 and T227 from X421, DP21 and DP25 from X441, and J555 and J630 from X486. These pins were chosen as they represent different cladding materials, fuel compositions, and have multiple sets of profilometry data available, except for X486. The BISON cladding profilometry results for X486 (CW316 cladding) matched the PIE profilometry profile, average strain, and max strain well. The BISON profilometry results for X421 (D9 cladding) matched the profilometry profile well for lower burnup pins but deviated from the PIE data in X421A being shifted up. Average and max cladding strain from BISON simulations for X421 were in agreement with PIE measurements. BISON profilometry results for X441 predicted the average cladding strain, max cladding strain, and profilometry profile well when compared to PIE measurements. Statistics over the profilometry results presented for the six pins are shown, with the other 121 pin profilometry results and statistical analysis over each experiment covered separately. Frictional contact with a friction coefficient of 0.2 and a terminating porosity of 0.18 were used in the simulations. An anisotropic swelling of 0.5 used was found to impact axial fuel swelling and cladding profilometry results but not as significant as frictional contact and terminating porosity. This is due to D9 and SS316 cladding swelling from void formation faster than fuel solid swelling.
3.1. Cladding Profilometry for X421, X441, AND X486
The cladding profilometry BISON predictions are indirectly dependent on the friction coefficient, anisotropic factor, terminating porosity, and volumetric swelling models used in the simulations. As mentioned previously in the methods section, frictional contact was used with a friction coefficient of 0.2 and an anisotropic factor of 0.5. These particular factors were chosen due to all 1977 EBR-II models in a previous work converging under these parameters with the models and operation conditions described in the methods section [
2]. Terminating porosity was lowered from the BISON default values as the volumetric strain of the fuel was overpredicted for fuel pins with a smeared density above 70%. Due to the terminating porosity directly affecting the volumetric strain of the fuel, only 75% smeared density pins were included in the experiment-level statistics. 70% and 85% smeared density pins will be examined in future work after a hot-pressing U-Pu-Zr model is committed to BISON.
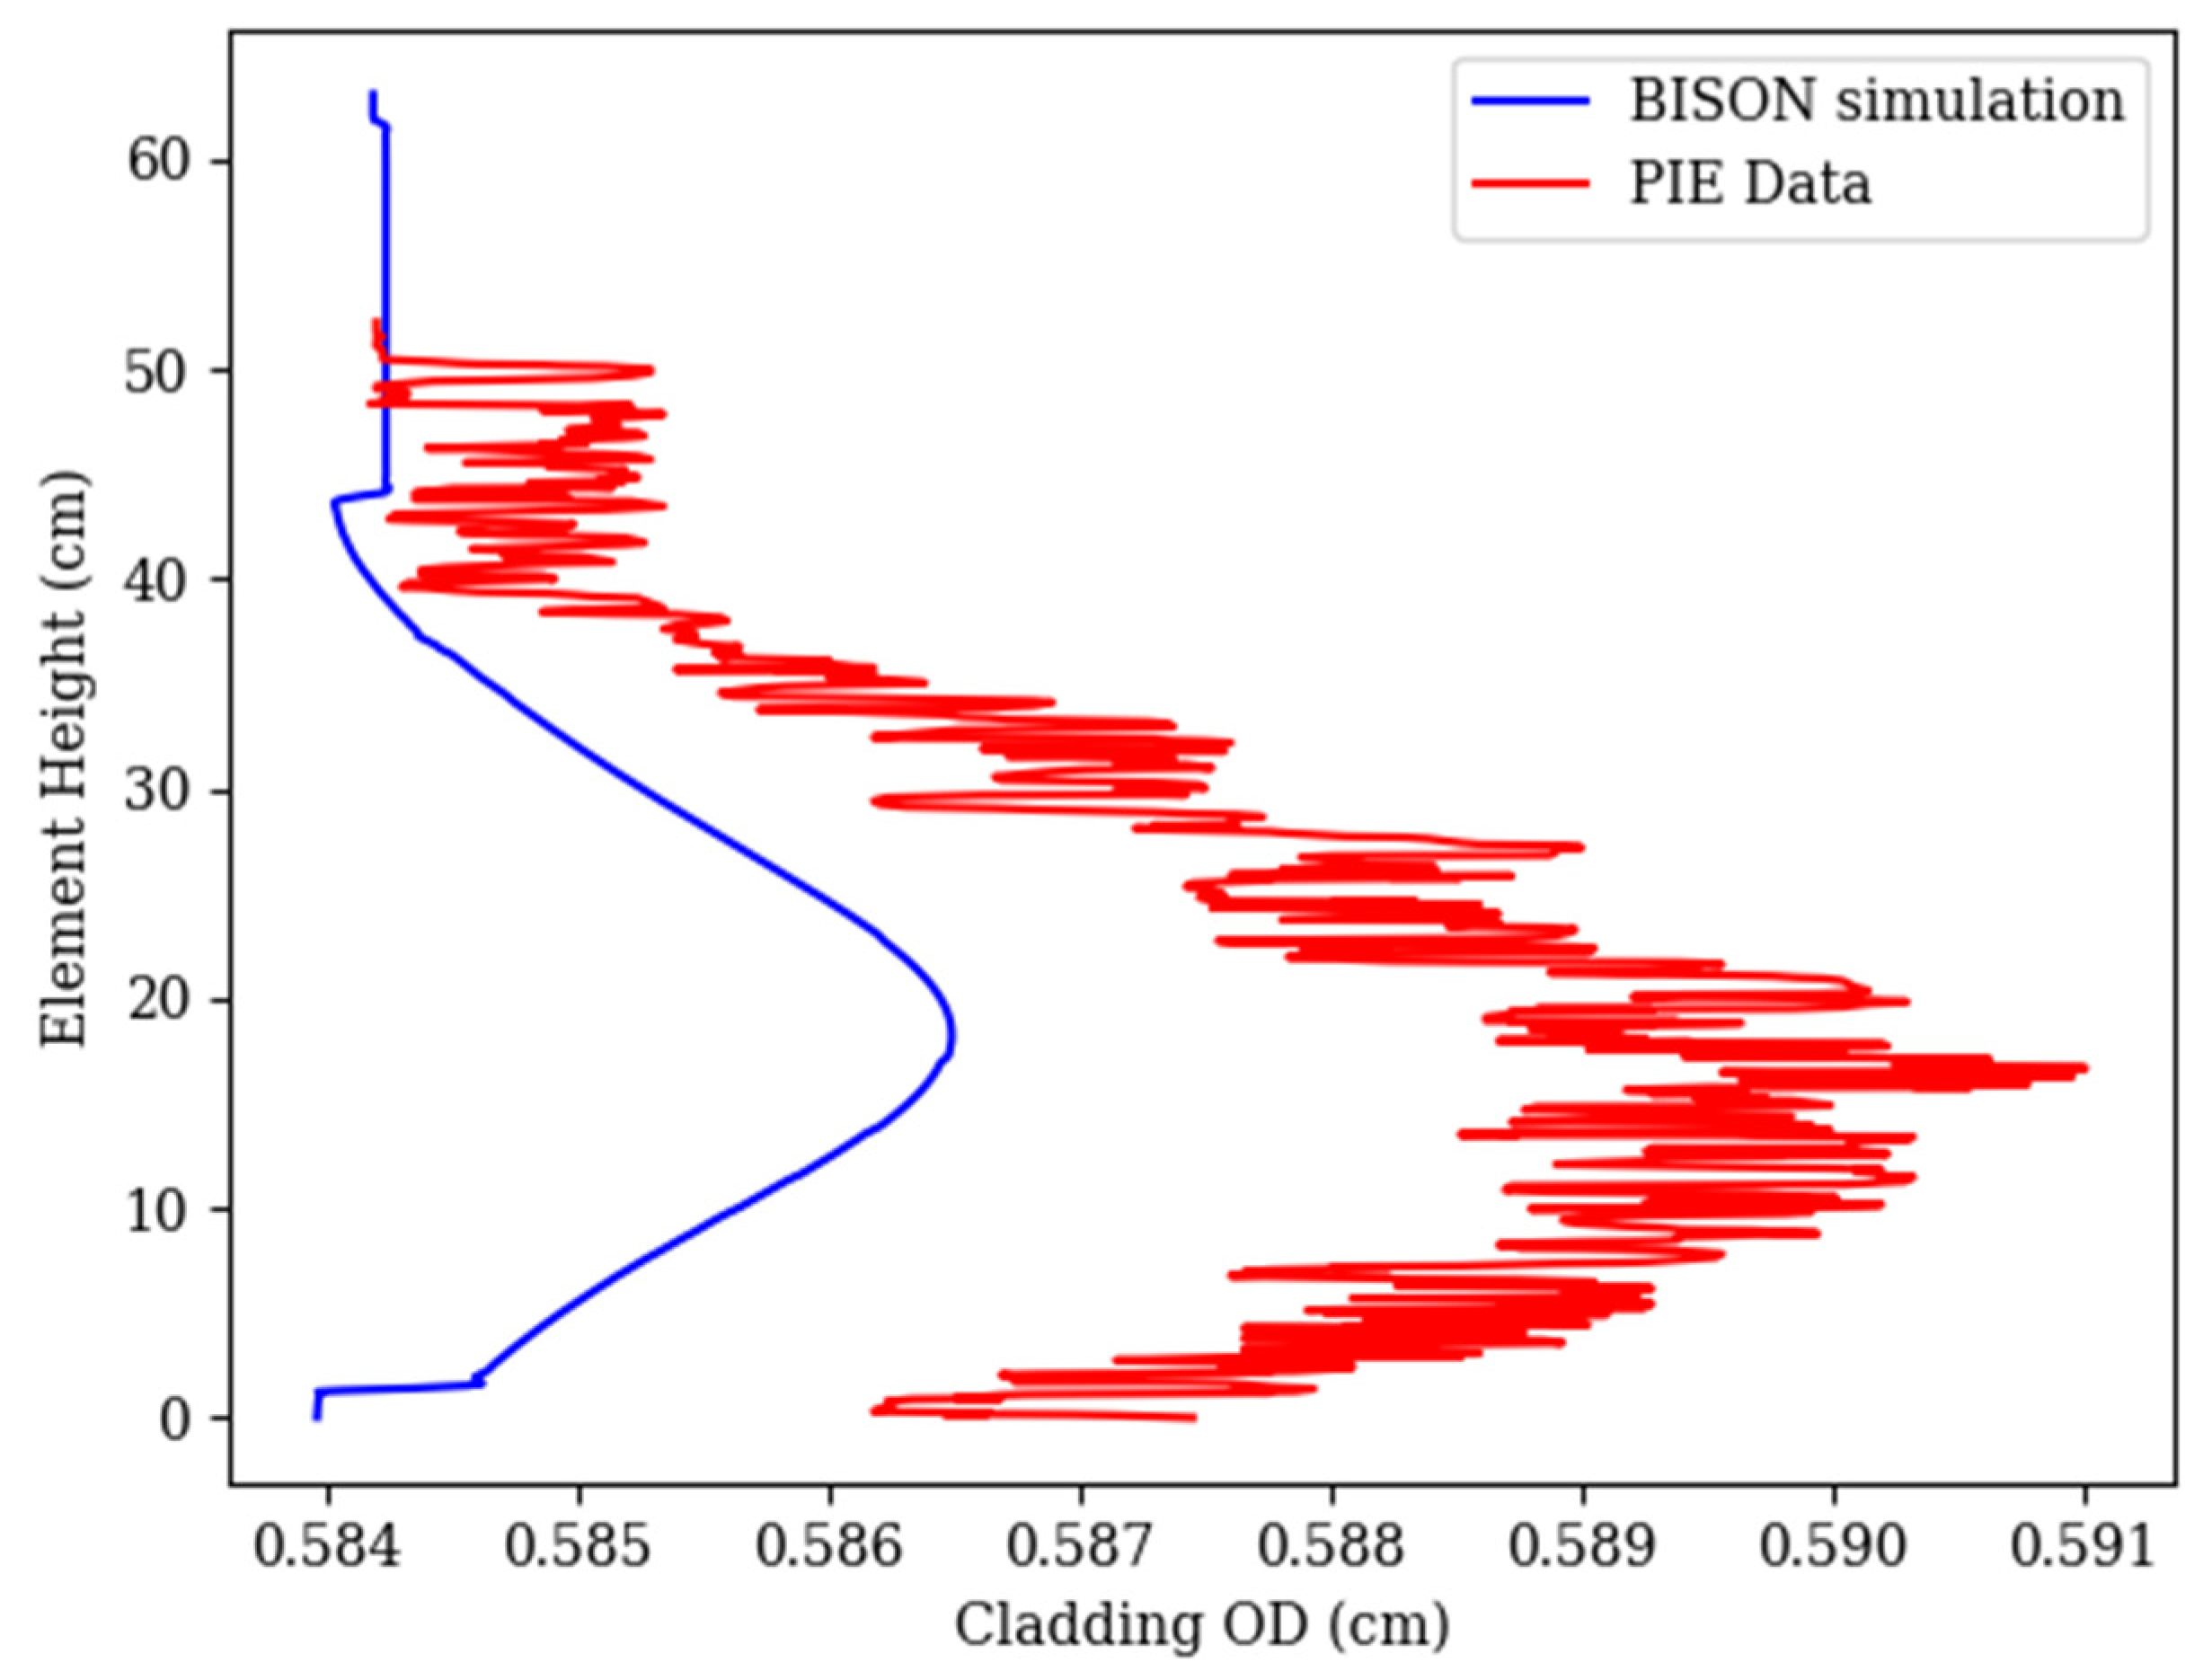
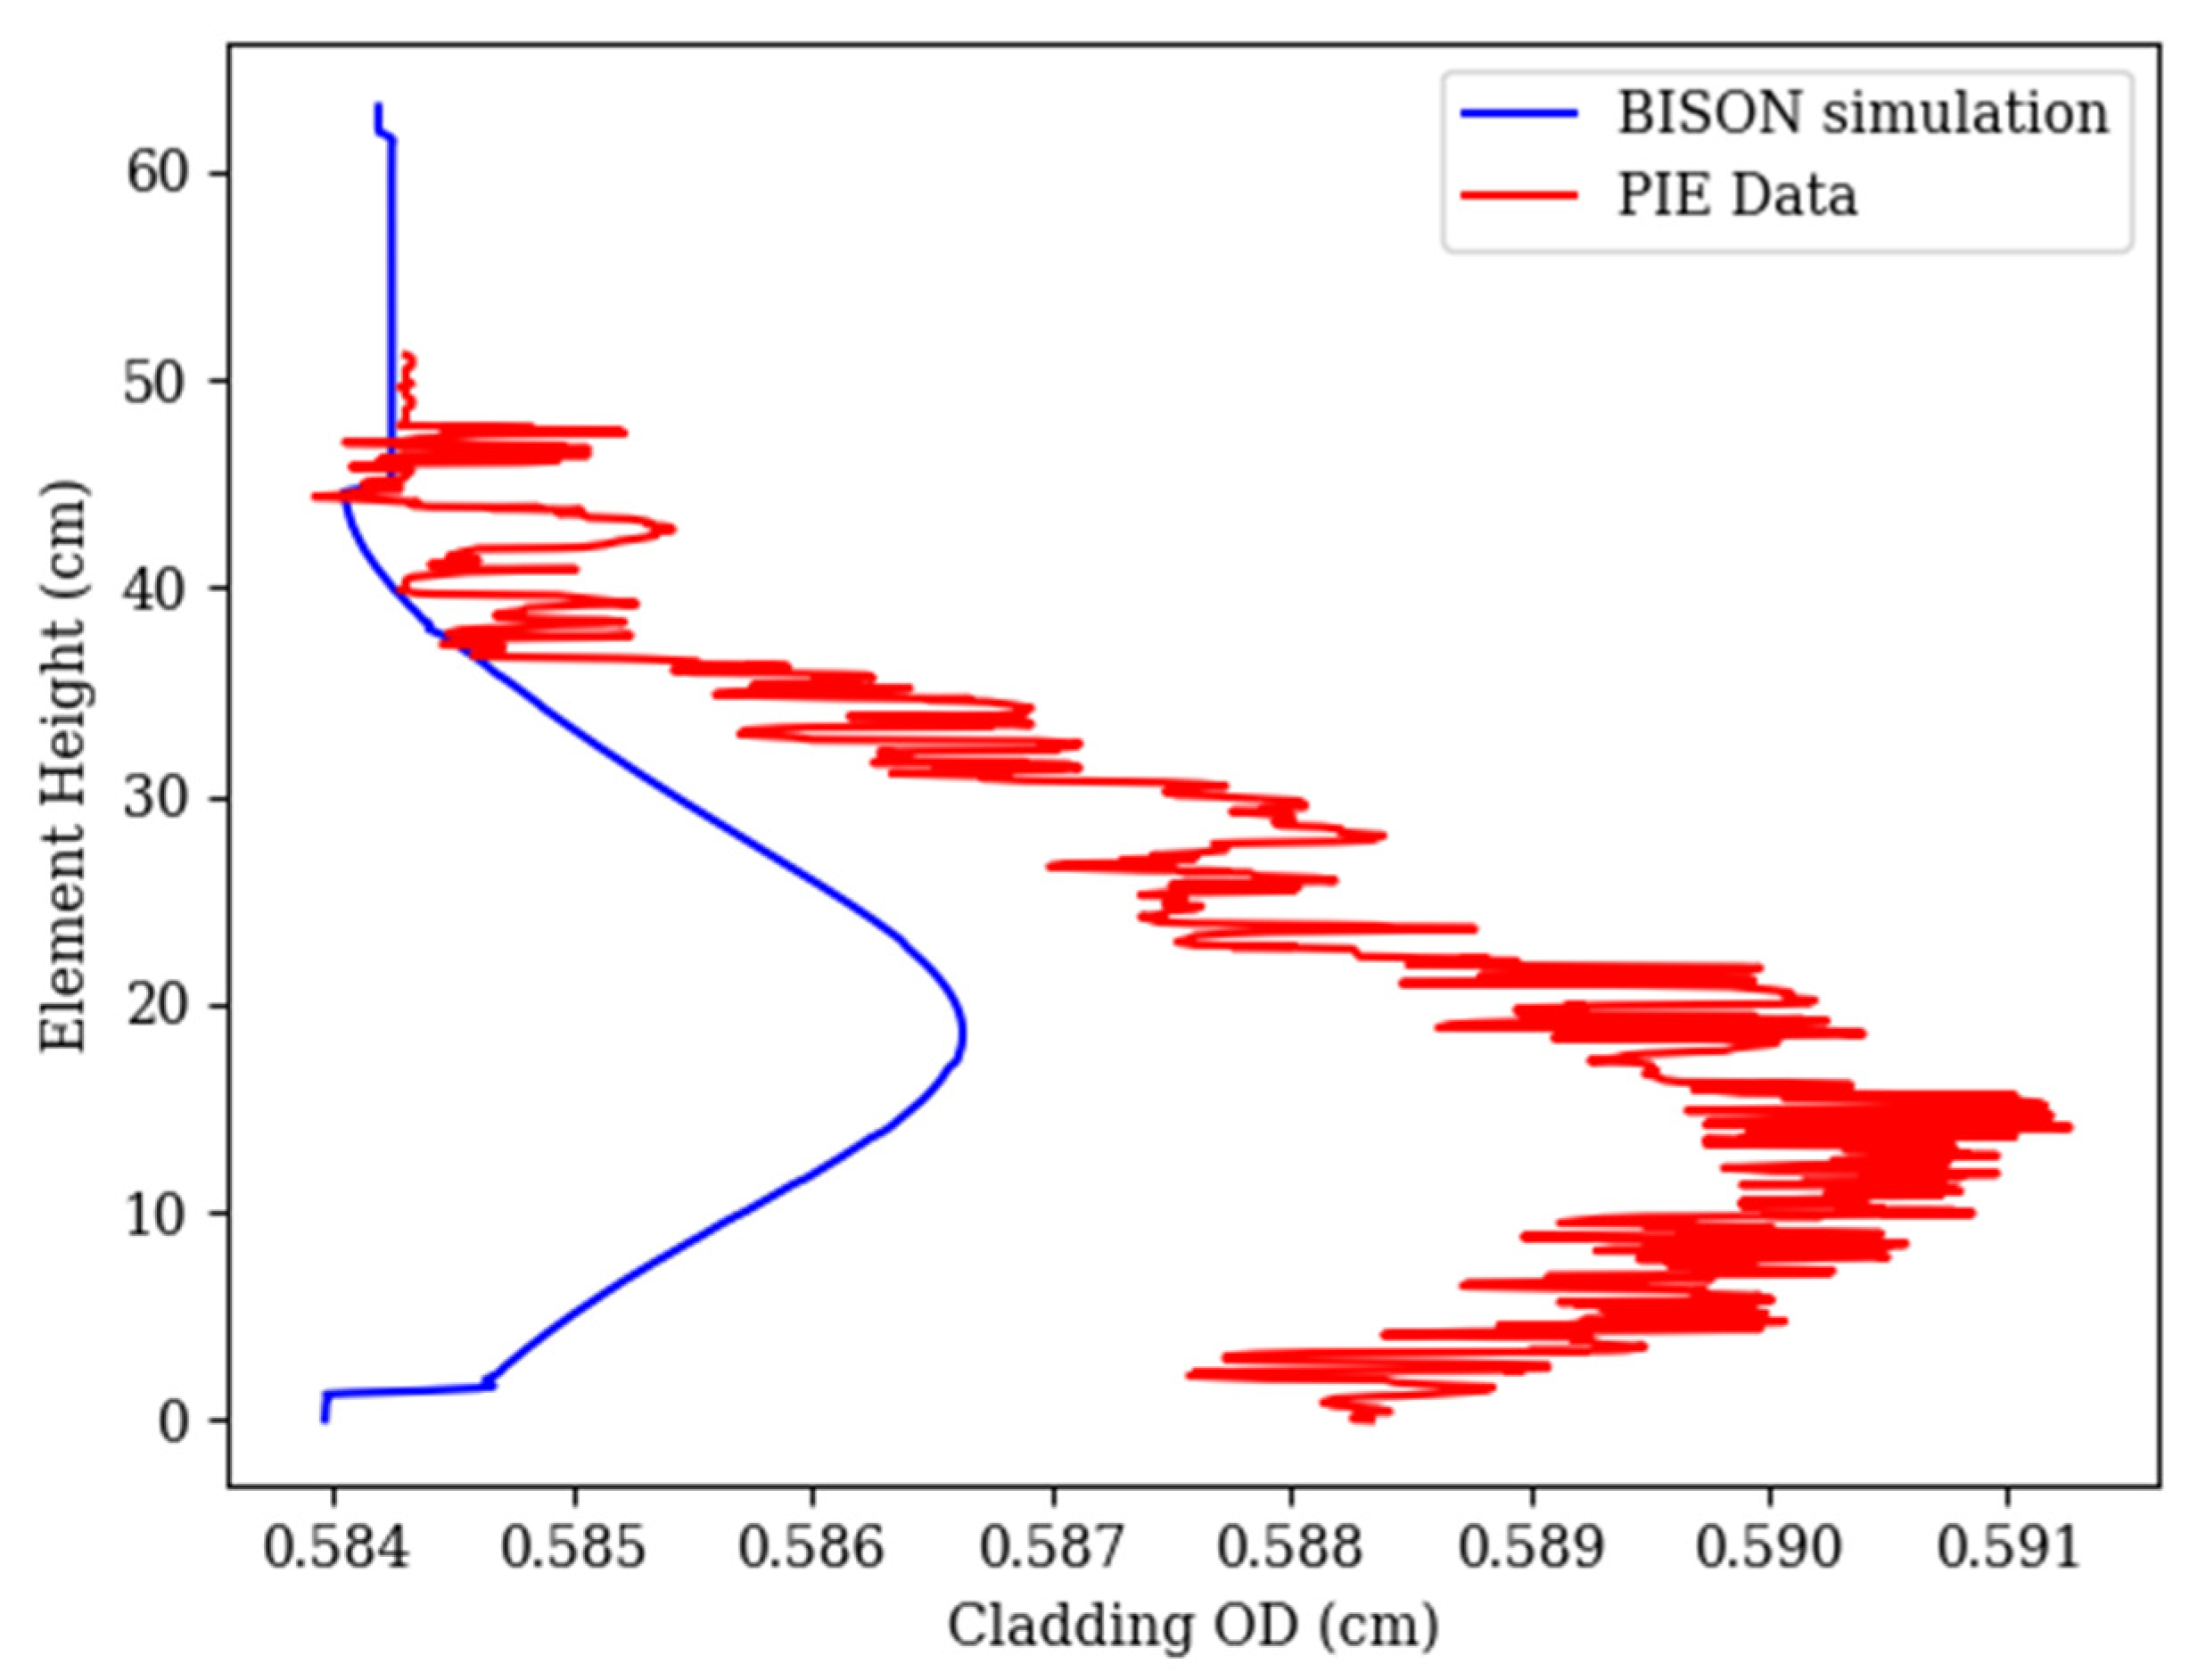
3.2. X421 Individual Pins and Experiment
For the X421/X421A experiment, there were 61 pins and 68 cladding profilometries used in the experiment-level statistics. For the individual analysis, EBR-II pins T068 and T227 (D9 cladding) were selected, as each of these pins contain two PIE cladding profilometries. The BISON simulations results are compared to PIE measurements for pins T068 and T227 in
Figure 10,
Figure 11 and
Figure 12. It was found that implementing a volumetric swelling model had a significant effect on the profilometry results, resulting in roughly 18% volumetric swelling in the D9 cladding after the X421A irradiation. Due to the D9 volumetric swelling model being highly sensitive on the neutron flux and fluence, the profilometry results depend on the axial flux profile and fluence supplied to each pin. In
Figure 10 and
Figure 12, the cladding strain shows a slight increase. This is caused by the axial neutron flux going to zero above 43 cm. Within
Figure 11 (peak fast fluence 1.95 × 10
23 n∙cm
−2) and
Figure 13 (peak fast fluence of 2.27 × 10
23 n∙cm
2), both BISON simulated profilometry results have less magnitude when compared to their PIE measurement counterpart. Potential reasons for the discrepancy could be heat-to-heat variations, known to affect swelling in D9 and stress-enhanced swelling [
11,
12]. In that phenomenon, stress effectively decreases
τ, the incubation parameter, or fluence required for rapid swelling to initiate. There is also a creep component to the strain. It is important to note that wastage thinning to the cladding due to the fuel cladding chemical interaction (FCCI) and cladding coolant chemical interaction (CCCI) were not accounted for in the BISON simulations. Accounting for FCCI and CCCI would allow for the cladding wall to have thinned, increasing the creep strain on the cladding. This effect is expected to add to the model in the next stage of development.
The SEE values for pins T068 and T227 as well as the experiment-level SEE value are shown in
Table 2. The average strain value for each pin with a corresponding standard deviation is calculated as well to have a comparison to the SEE. SEE was used over the standard deviation as it takes into account the axial shift of the BISON profilometry from the PIE profilometry measurements. The SEE values of the pins from X421 were smaller than the SEE values from X421A for this reason. The experiment-level SEE value was found to be 44 µm, which is deemed acceptable when considering the magnitude difference in the BISON profilometries over various burnups and the starting outer diameter of the claddings, with the main value being 0.584 cm.
3.3. X441 Individual Pins and Experiment
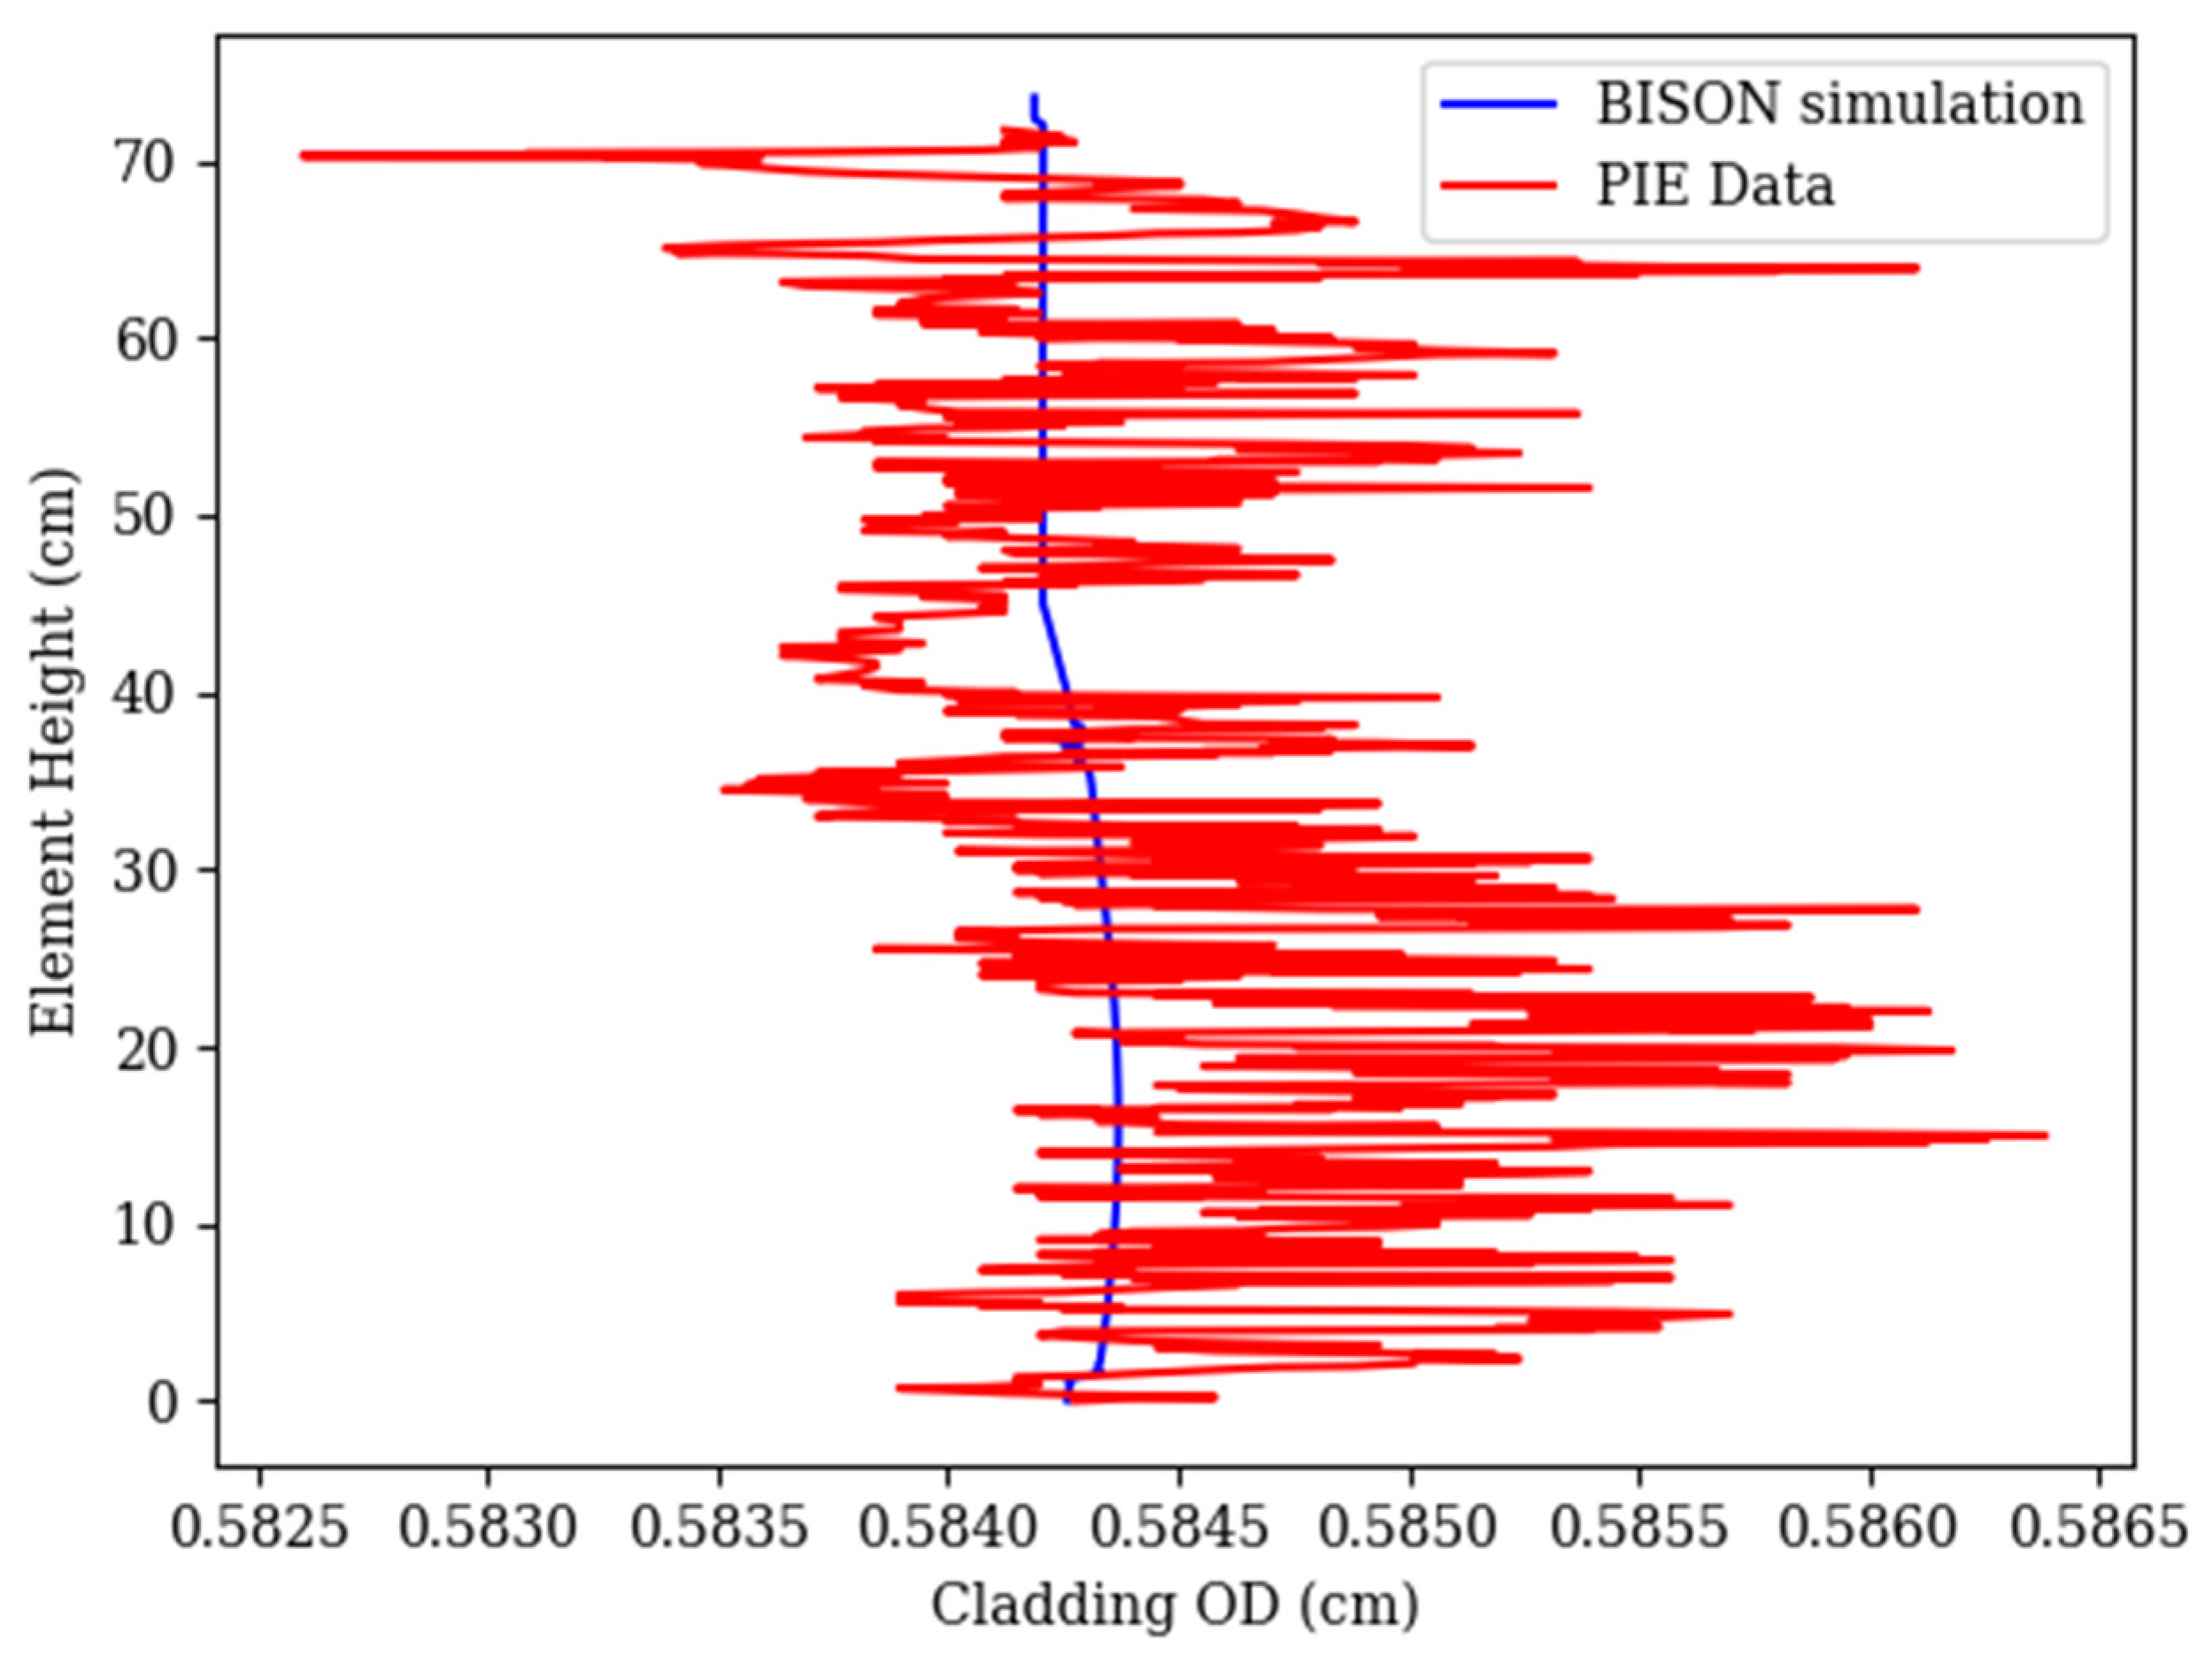
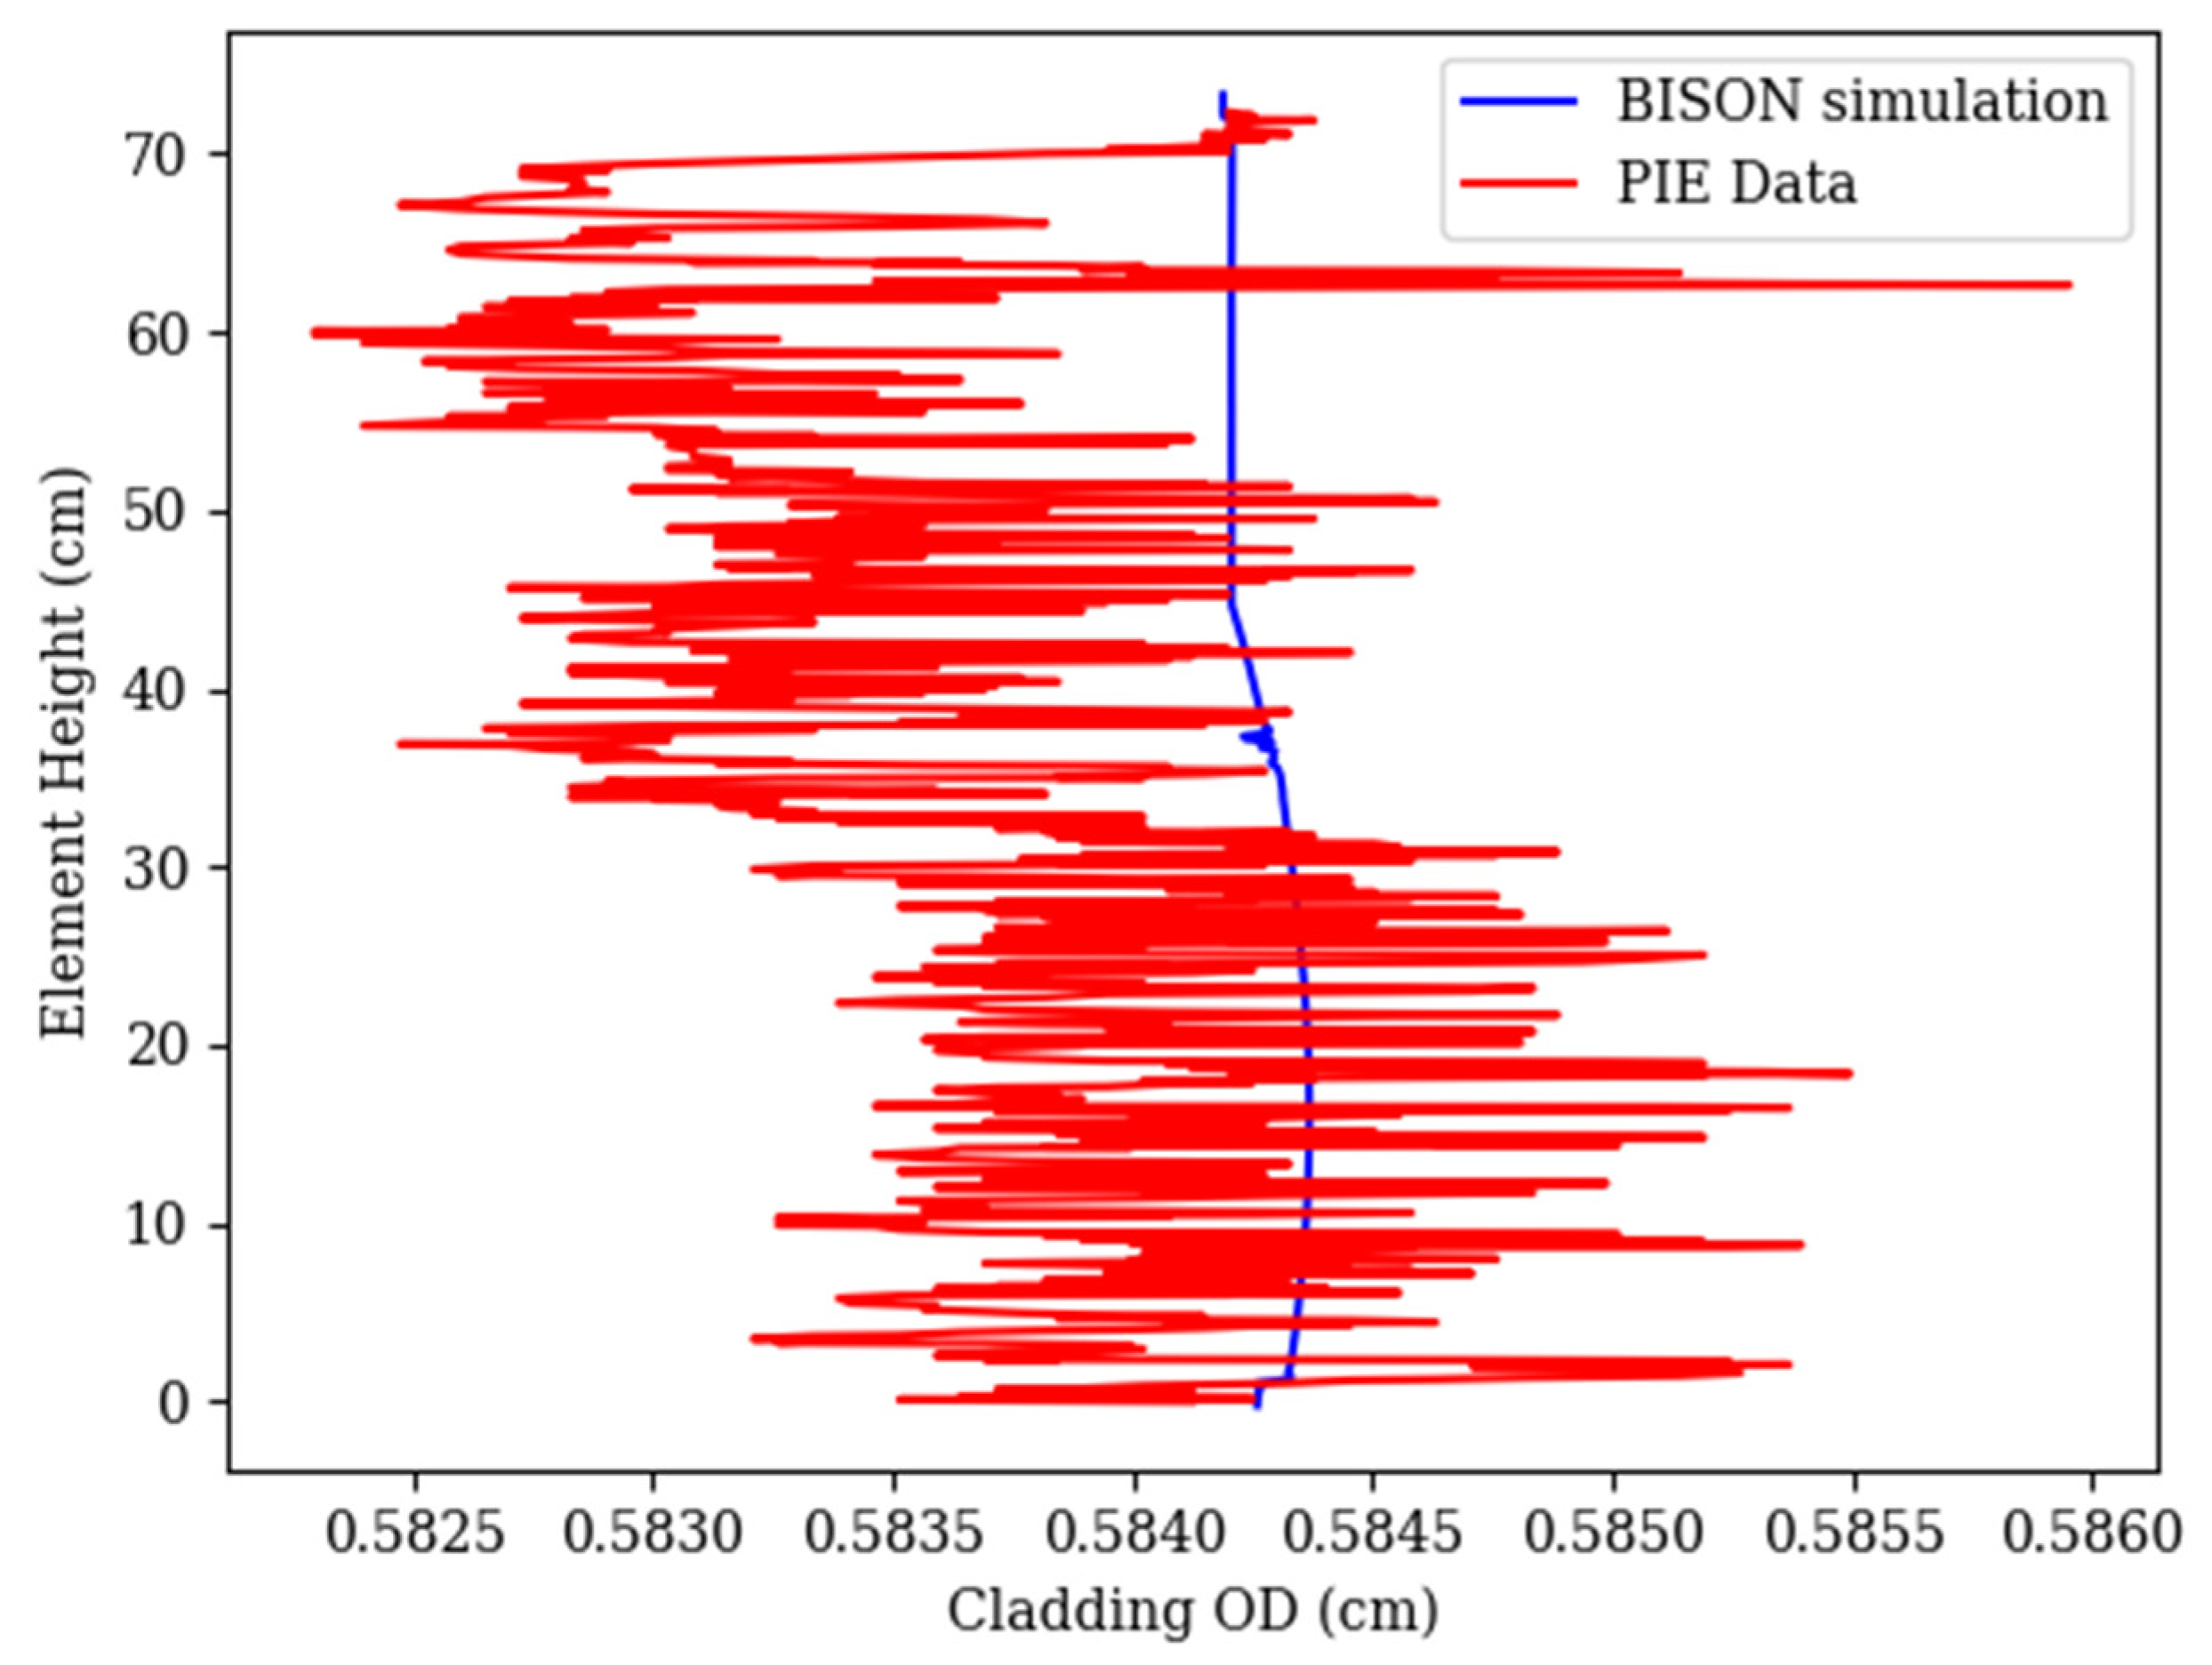
Experiment X441/X441A contained 61 pins and 110 PIE cladding profilometries used in the experiment-level statistics. For the individual analysis, EBR-II pins DP21 and DP25 were selected, as each of these pins contain two PIE cladding profilometries and are both HT9 clad. Experiments X441/X441A also contained D9 pins, which are included in the experiment-level SEE value. The BISON simulations results are compared to PIE measurements for pins DP21 and DP25 in
Figure 14,
Figure 15,
Figure 16 and
Figure 17. It was found that implementing a volumetric swelling model had an insignificant effect on the profilometry results, as the fluence values within X441/X441A do not exceed 1.01 × 10
23 n∙cm
−2. The swelling at these fluence levels produce volumetric swelling that is insignificant when compared to the impact frictional contact and terminating porosity, which impact FCMI, have on the cladding profilometry [
2]. Within
Figure 14 and
Figure 16, the BISON profilometry results are within the PIE profilometry measurements and are in good agreement. In both pins for the X441 irradiation, the BISON simulations predict that the fuel has yet to make contact with the cladding, producing minimal cladding strain due to plenum pressure and irradiation-induced volumetric swelling. By the end of experiment X441A, FCMI is shown to have occurred within the BISON and PIE profilometries in
Figure 15 and
Figure 17, both of which are in good agreement with PIE measurements.
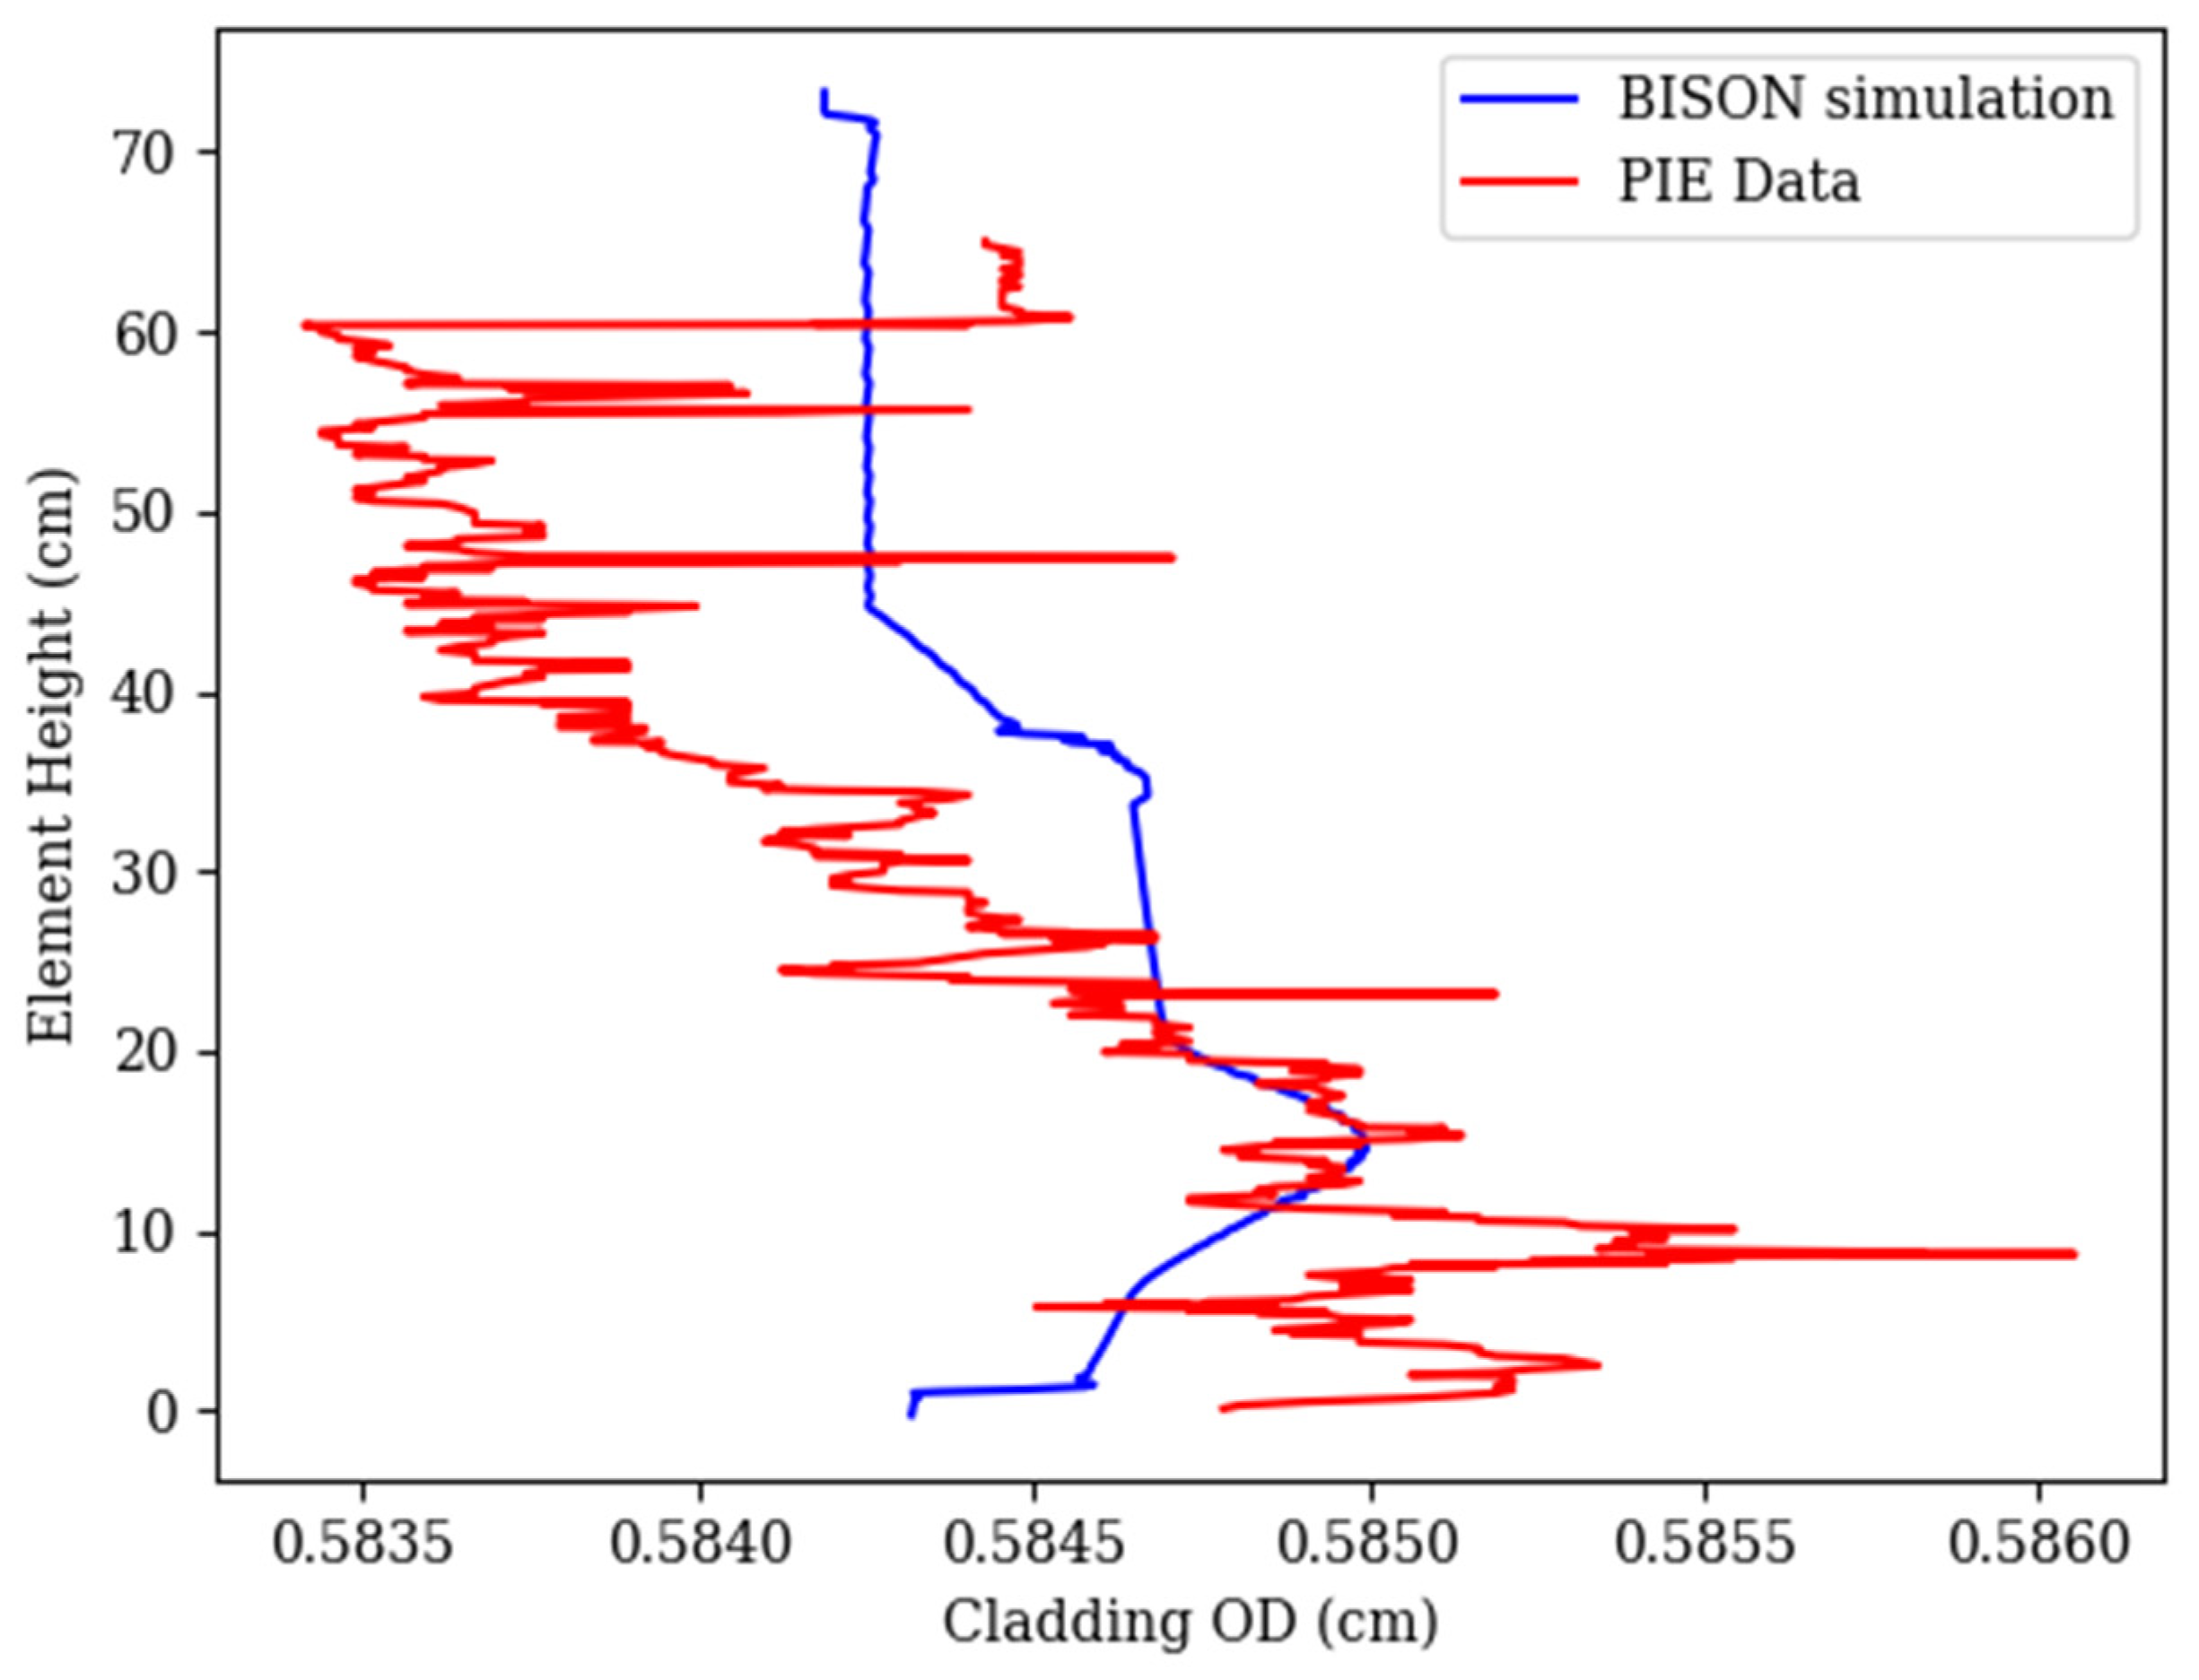
Within the X441A profilometry results in
Figure 15 and
Figure 17, there are two noticeable peaks that are seen within the BISON results. The main peak that is seen and shared with the PIE profilometry measurements occurs at ~13 cm and is caused by irradiation creep induced by the fission gas pressure and FCMI. This is not present within the X421 and X486 pins, as the irradiation-induced volumetric swelling in the D9 and SS316 cladding produces a greater volumetric strain than the creep-related strains caused by FCMI. The second peak in the BISON profilometry, which is not noticeable in the PIE measurements, occurs at ~36 cm and is caused by thermal creep. The reason it occurs at this location is due to the cladding having elevated temperatures near the top of the fuel, where thermal creep is prevalent. Other peaks seen in the PIE profilometry that are not present in the BISON profilometry may have come from foreign material that was on the outside of the cladding when the contact profilometry was measured, such as at the axial heights of ~20 cm and ~33 cm in
Figure 15 and ~30 cm and ~58 cm in
Figure 17. Even with these discrepancies, the SEE of the individual pins and the value of the experiment-level SEE were acceptable. These values are shown in
Table 3 below. The only pin with a greater SEE than the experiment-level SEE value was DP30, where the manufactured cladding outer diameter reported in FIPD was not the manufactured cladding outer diameter within the PIE measurements, with an average difference of 82 µm in diameter. This is reflected in the SEE for DP30 as well, being 102 µm.
FCCI and CCCI were not accounted for within the BISON models, but are not expected to have a significant impact on the HT9 pins within X441/X441A due to the lower cladding temperatures during operation, unlike the cladding temperatures observed during experiment X447/X447A. The oscillation within the temperature after an axial height of ~36 cm is due to the size of the finite element and is an artifact of BISON being a finite element method code.
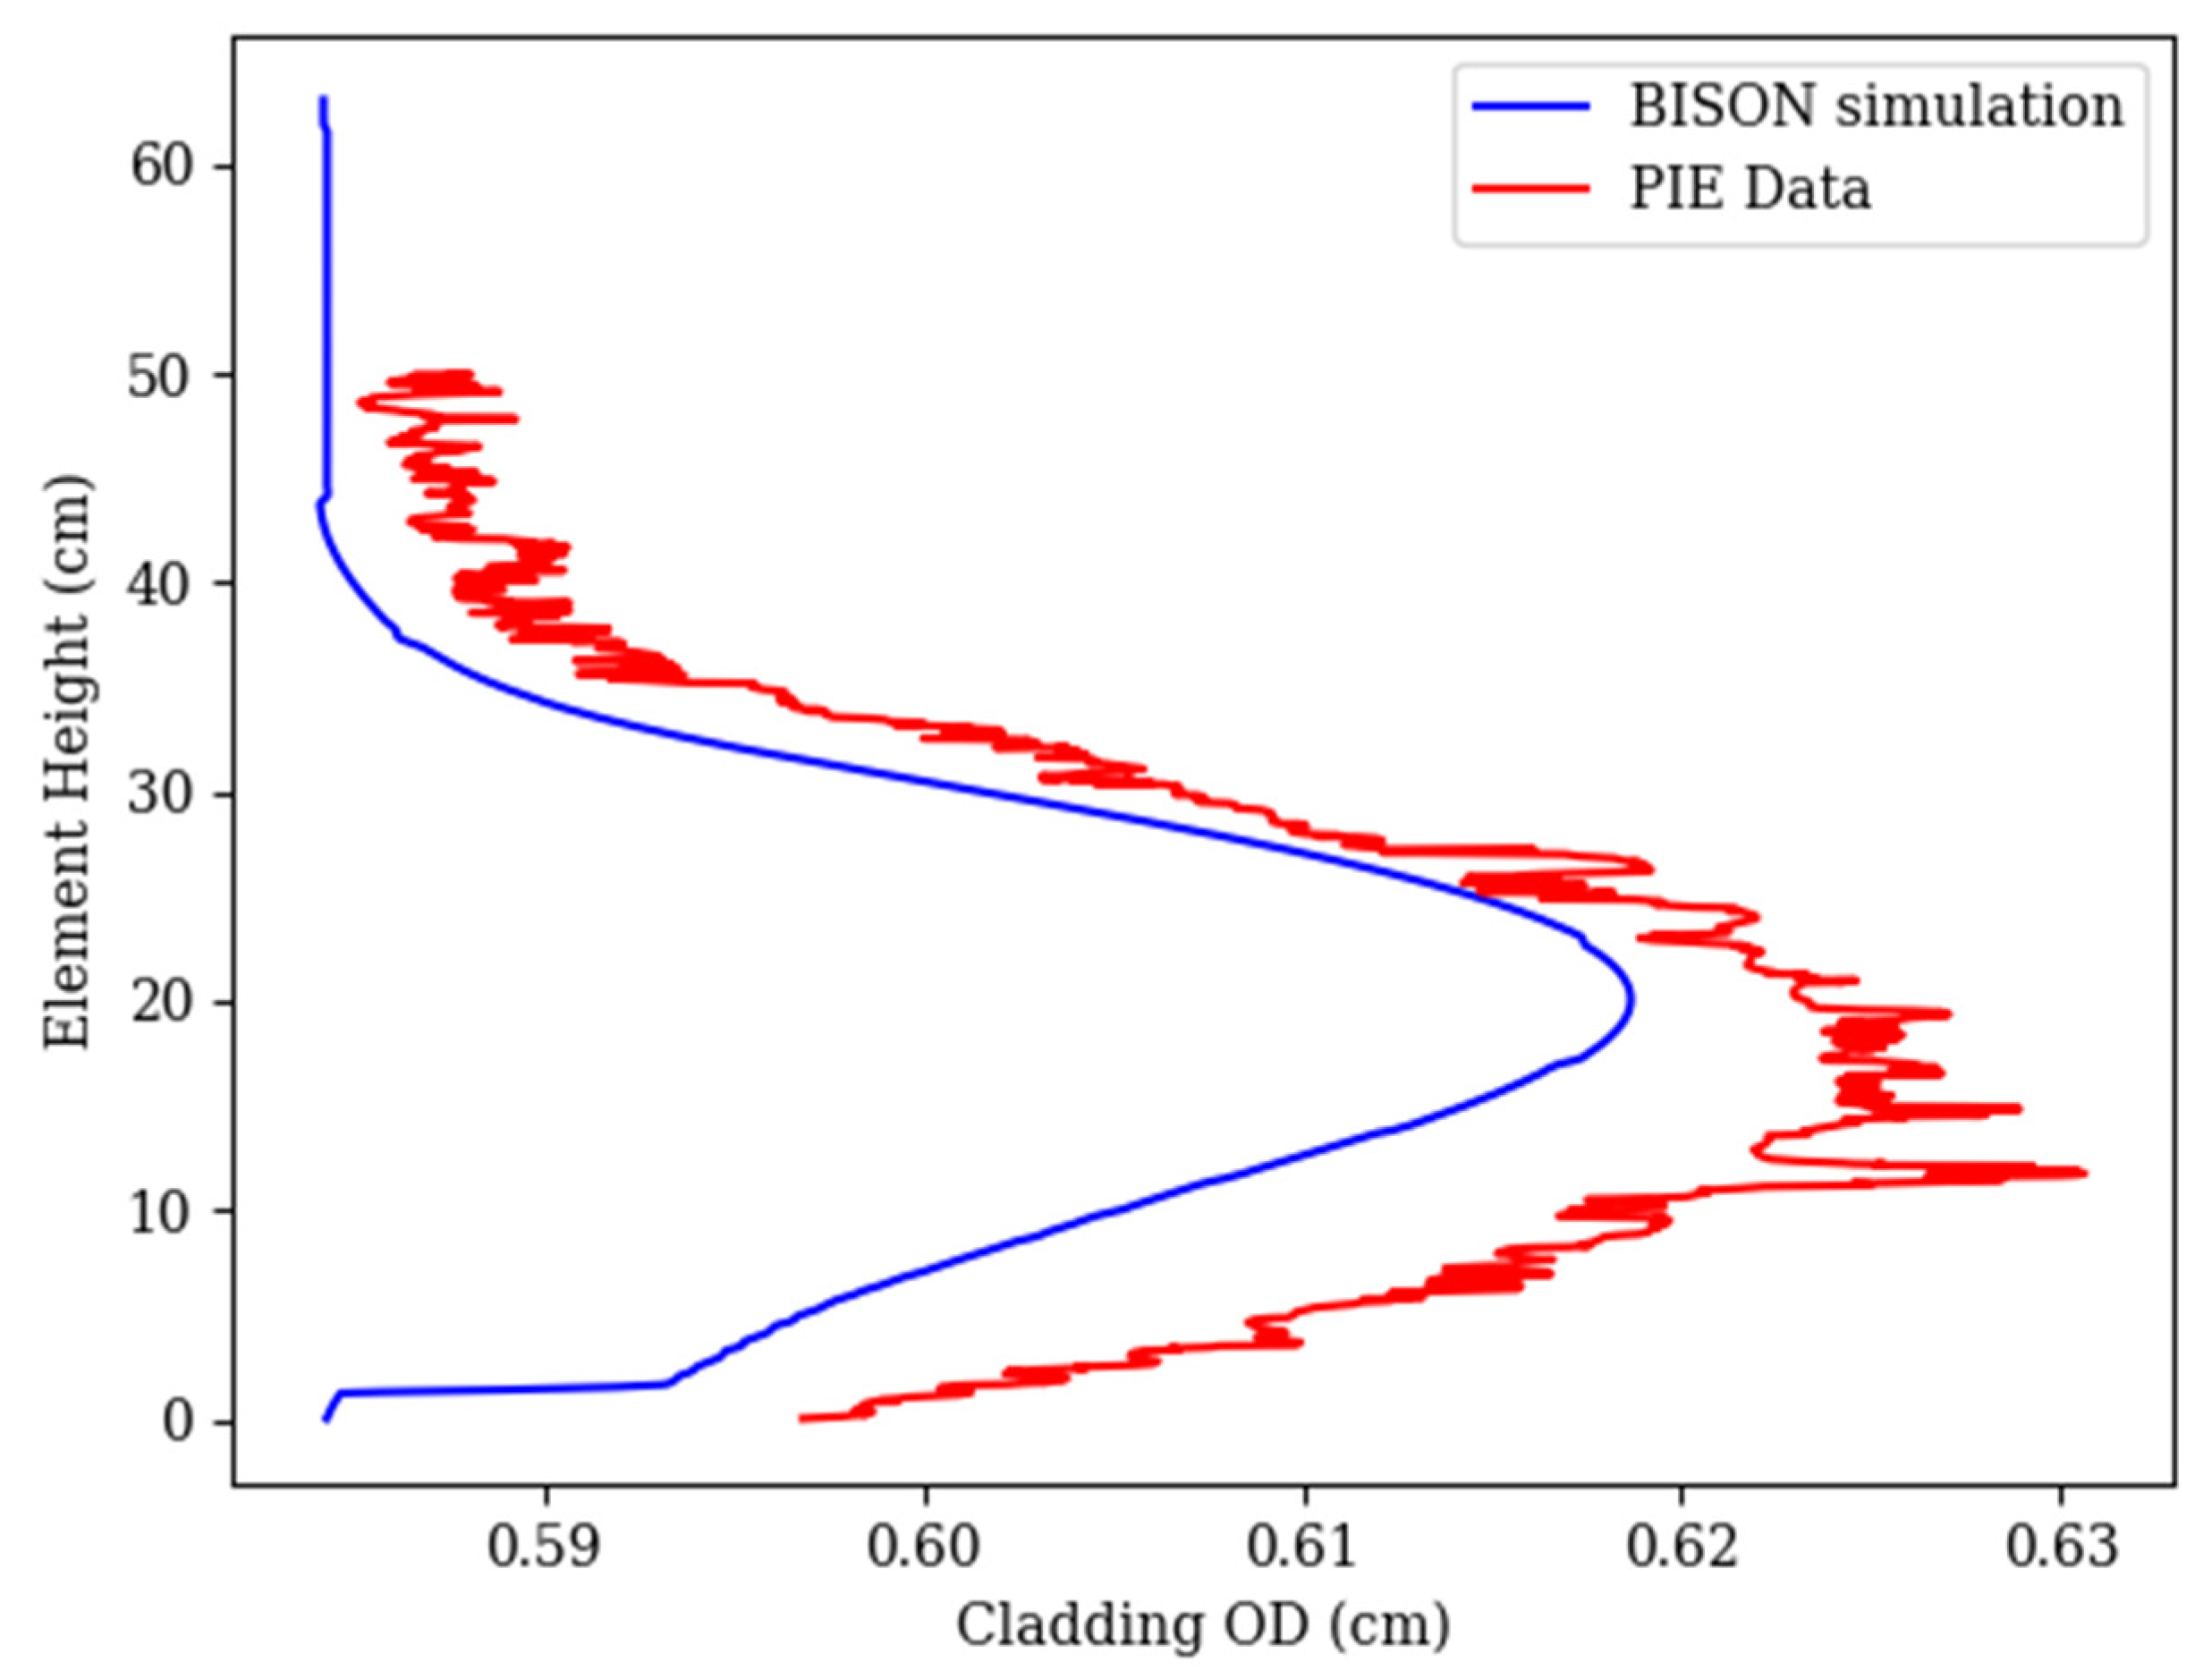
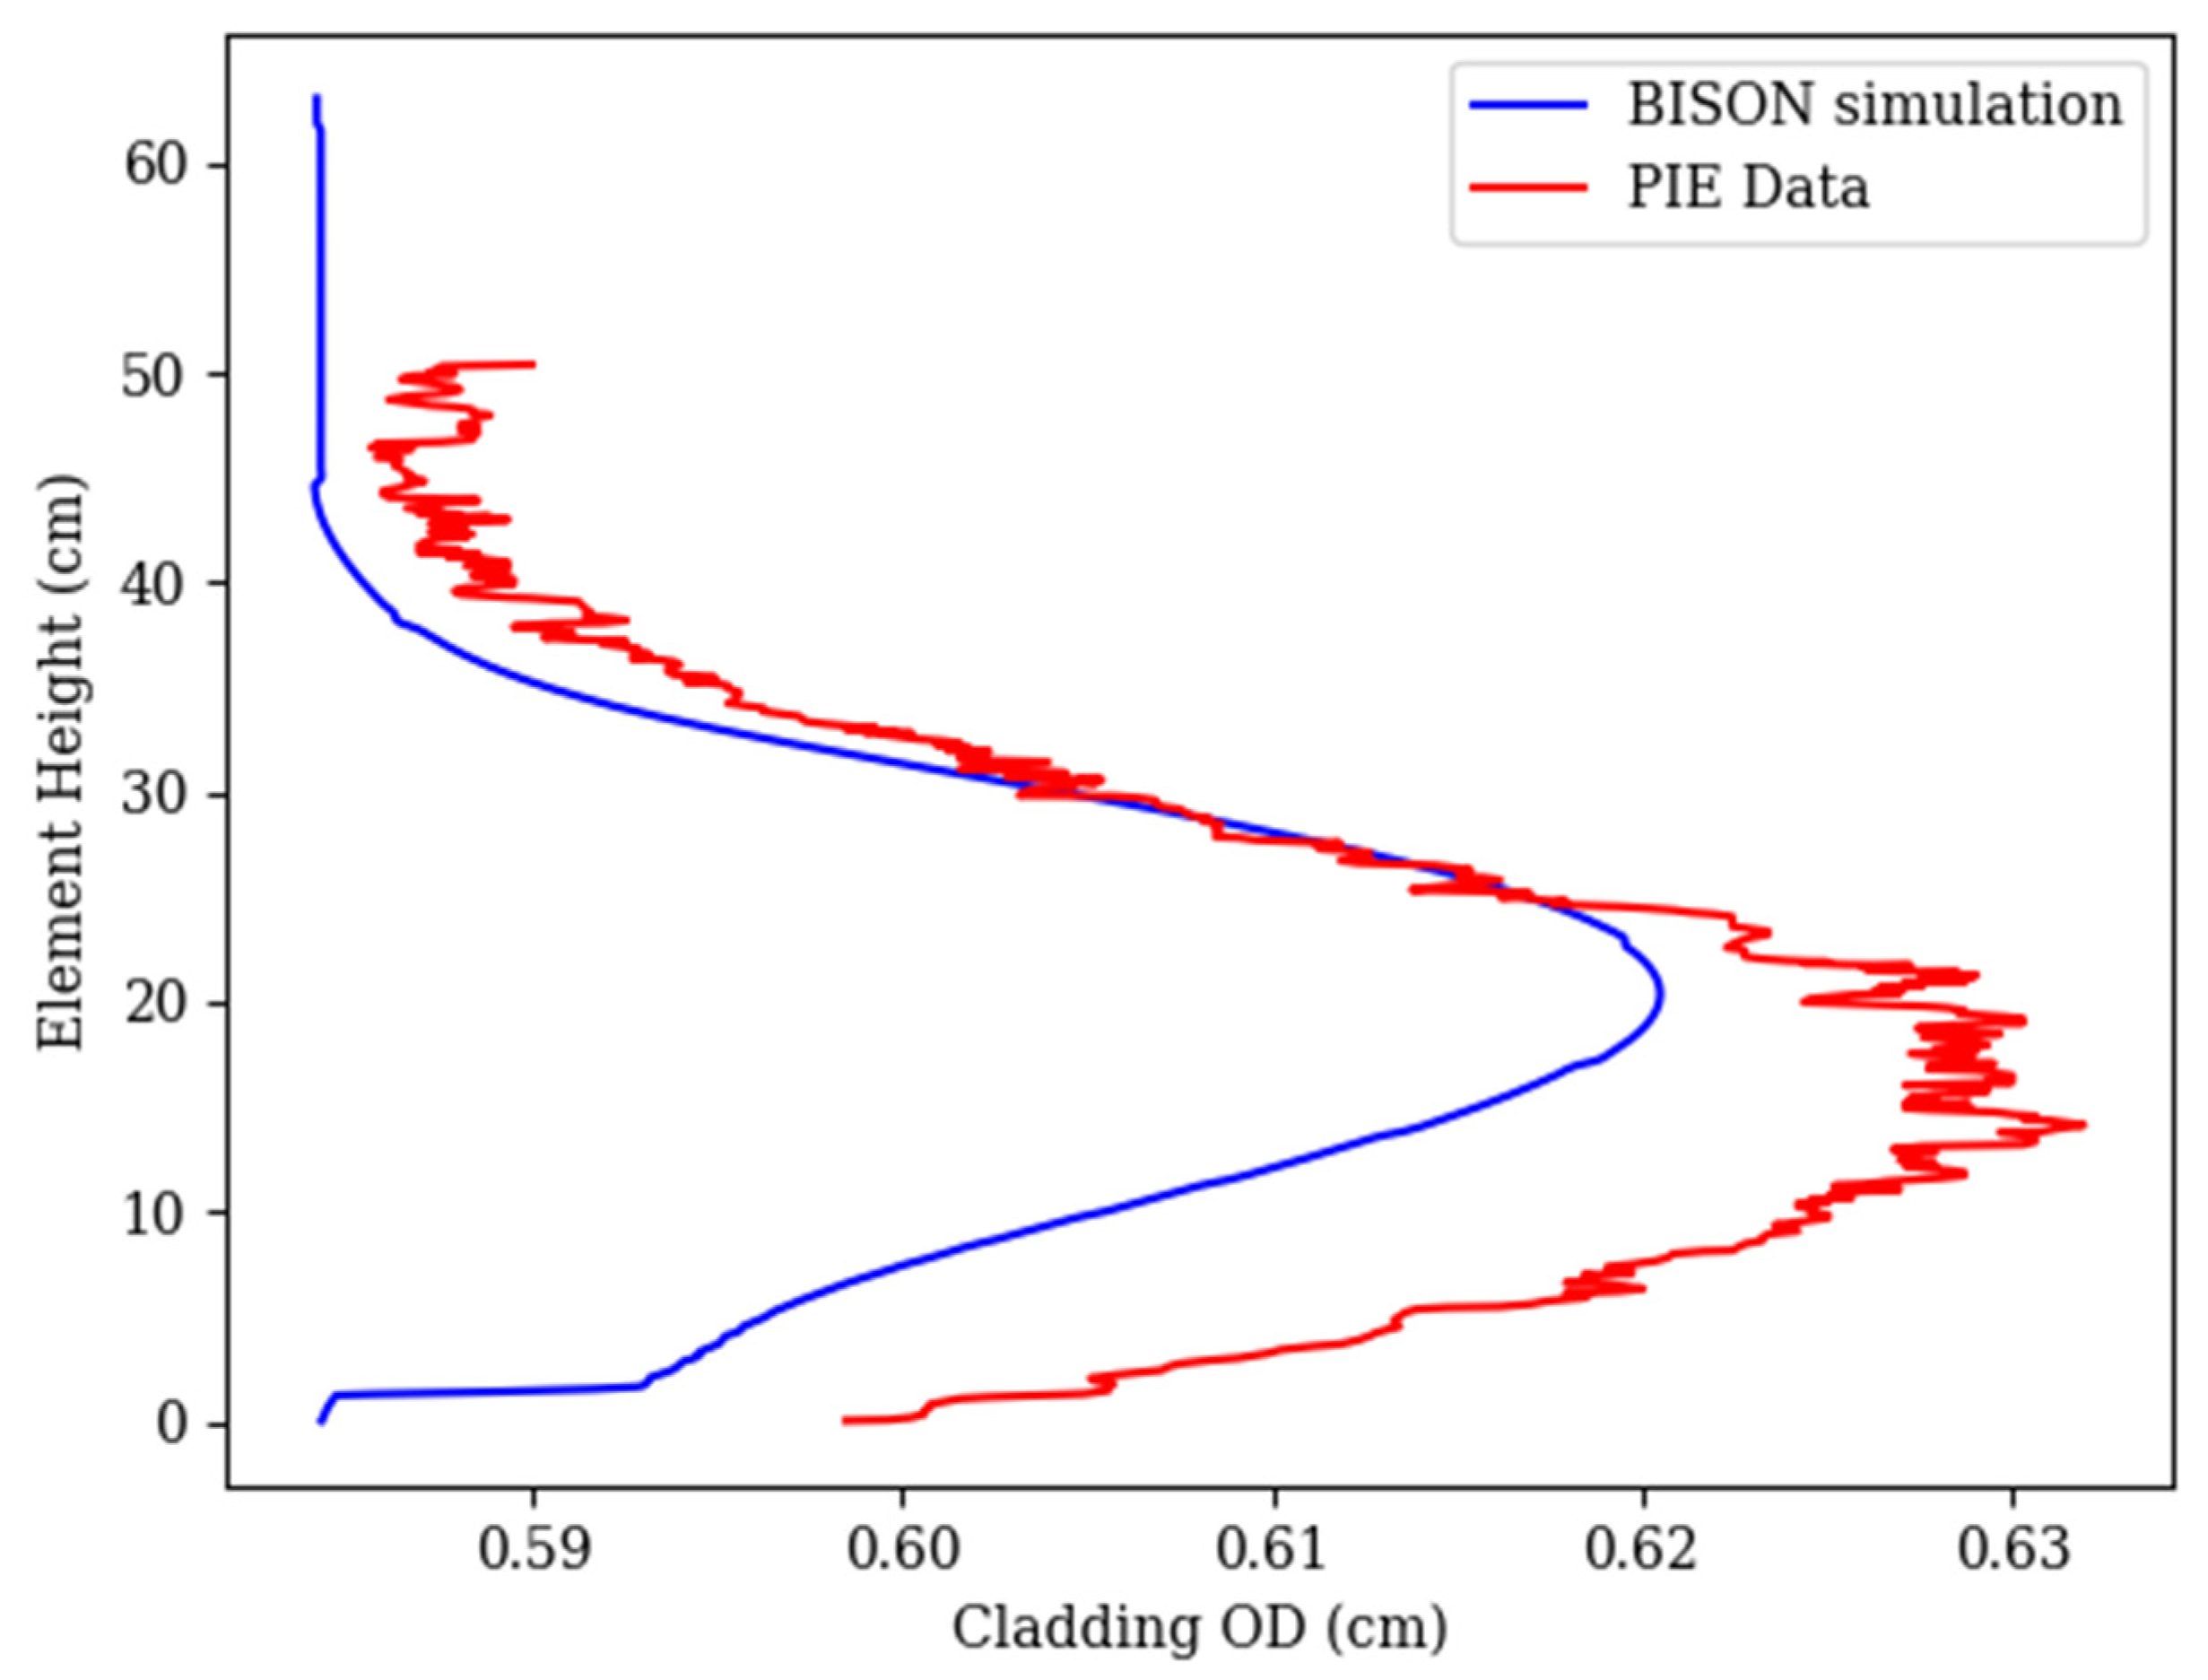
3.4. X486 Individual Pins and Experiment
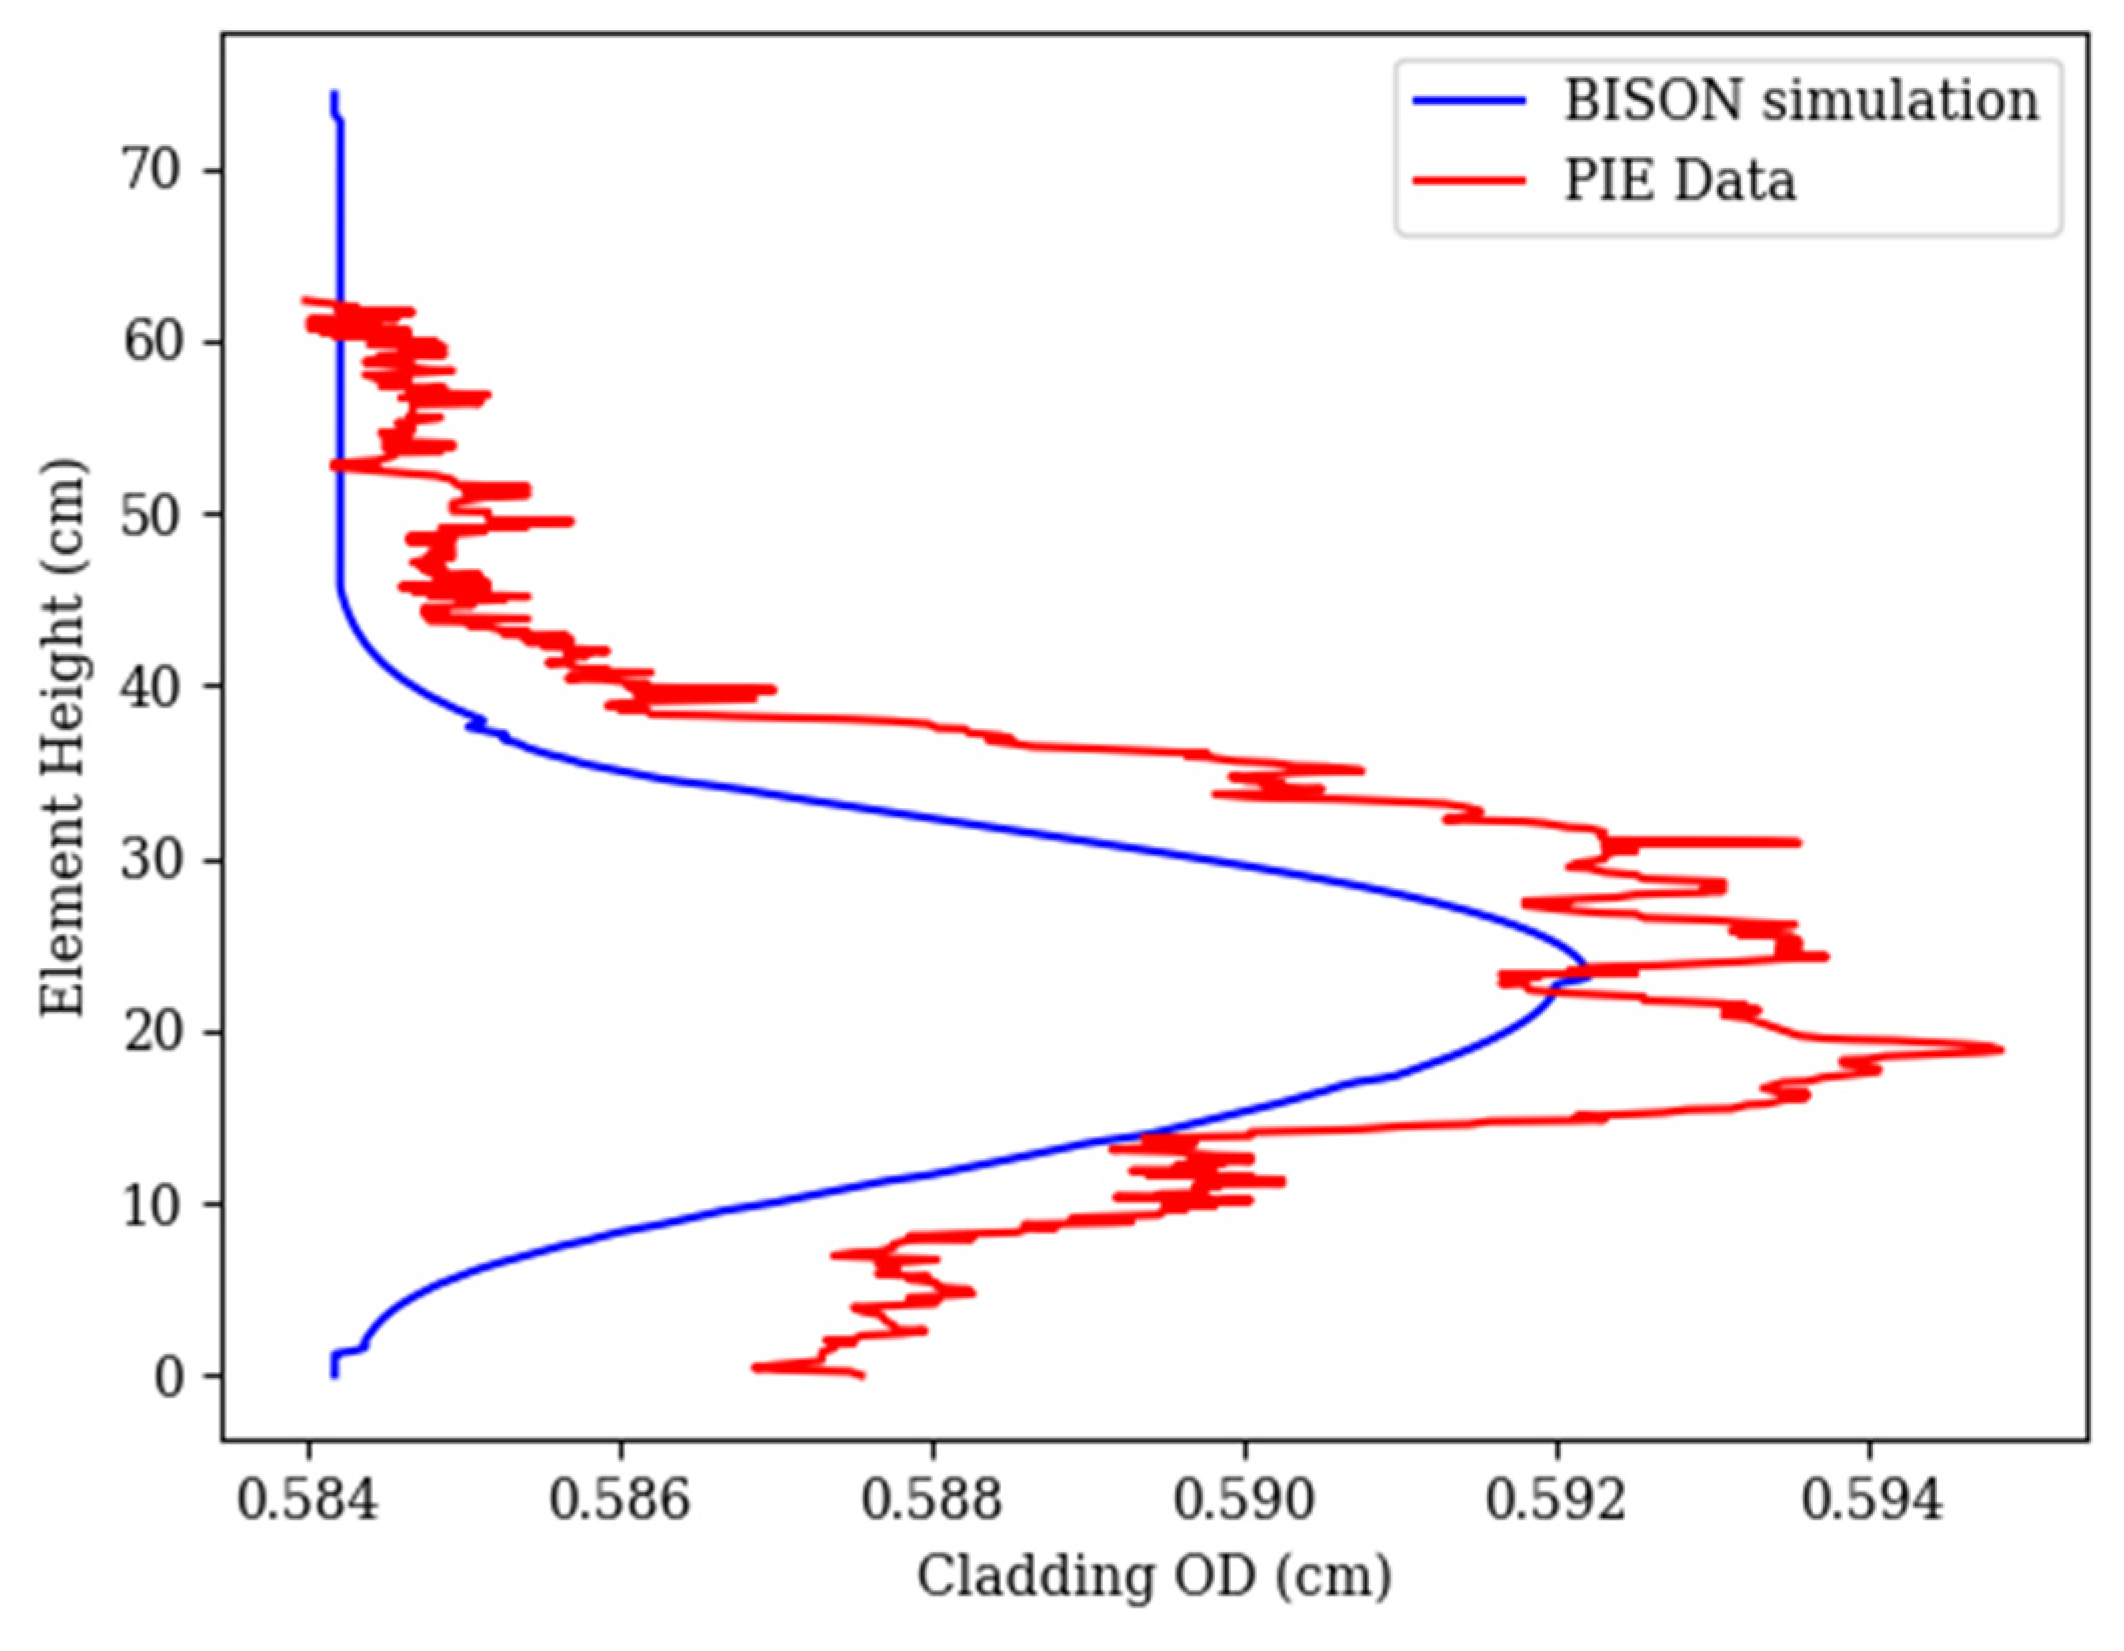
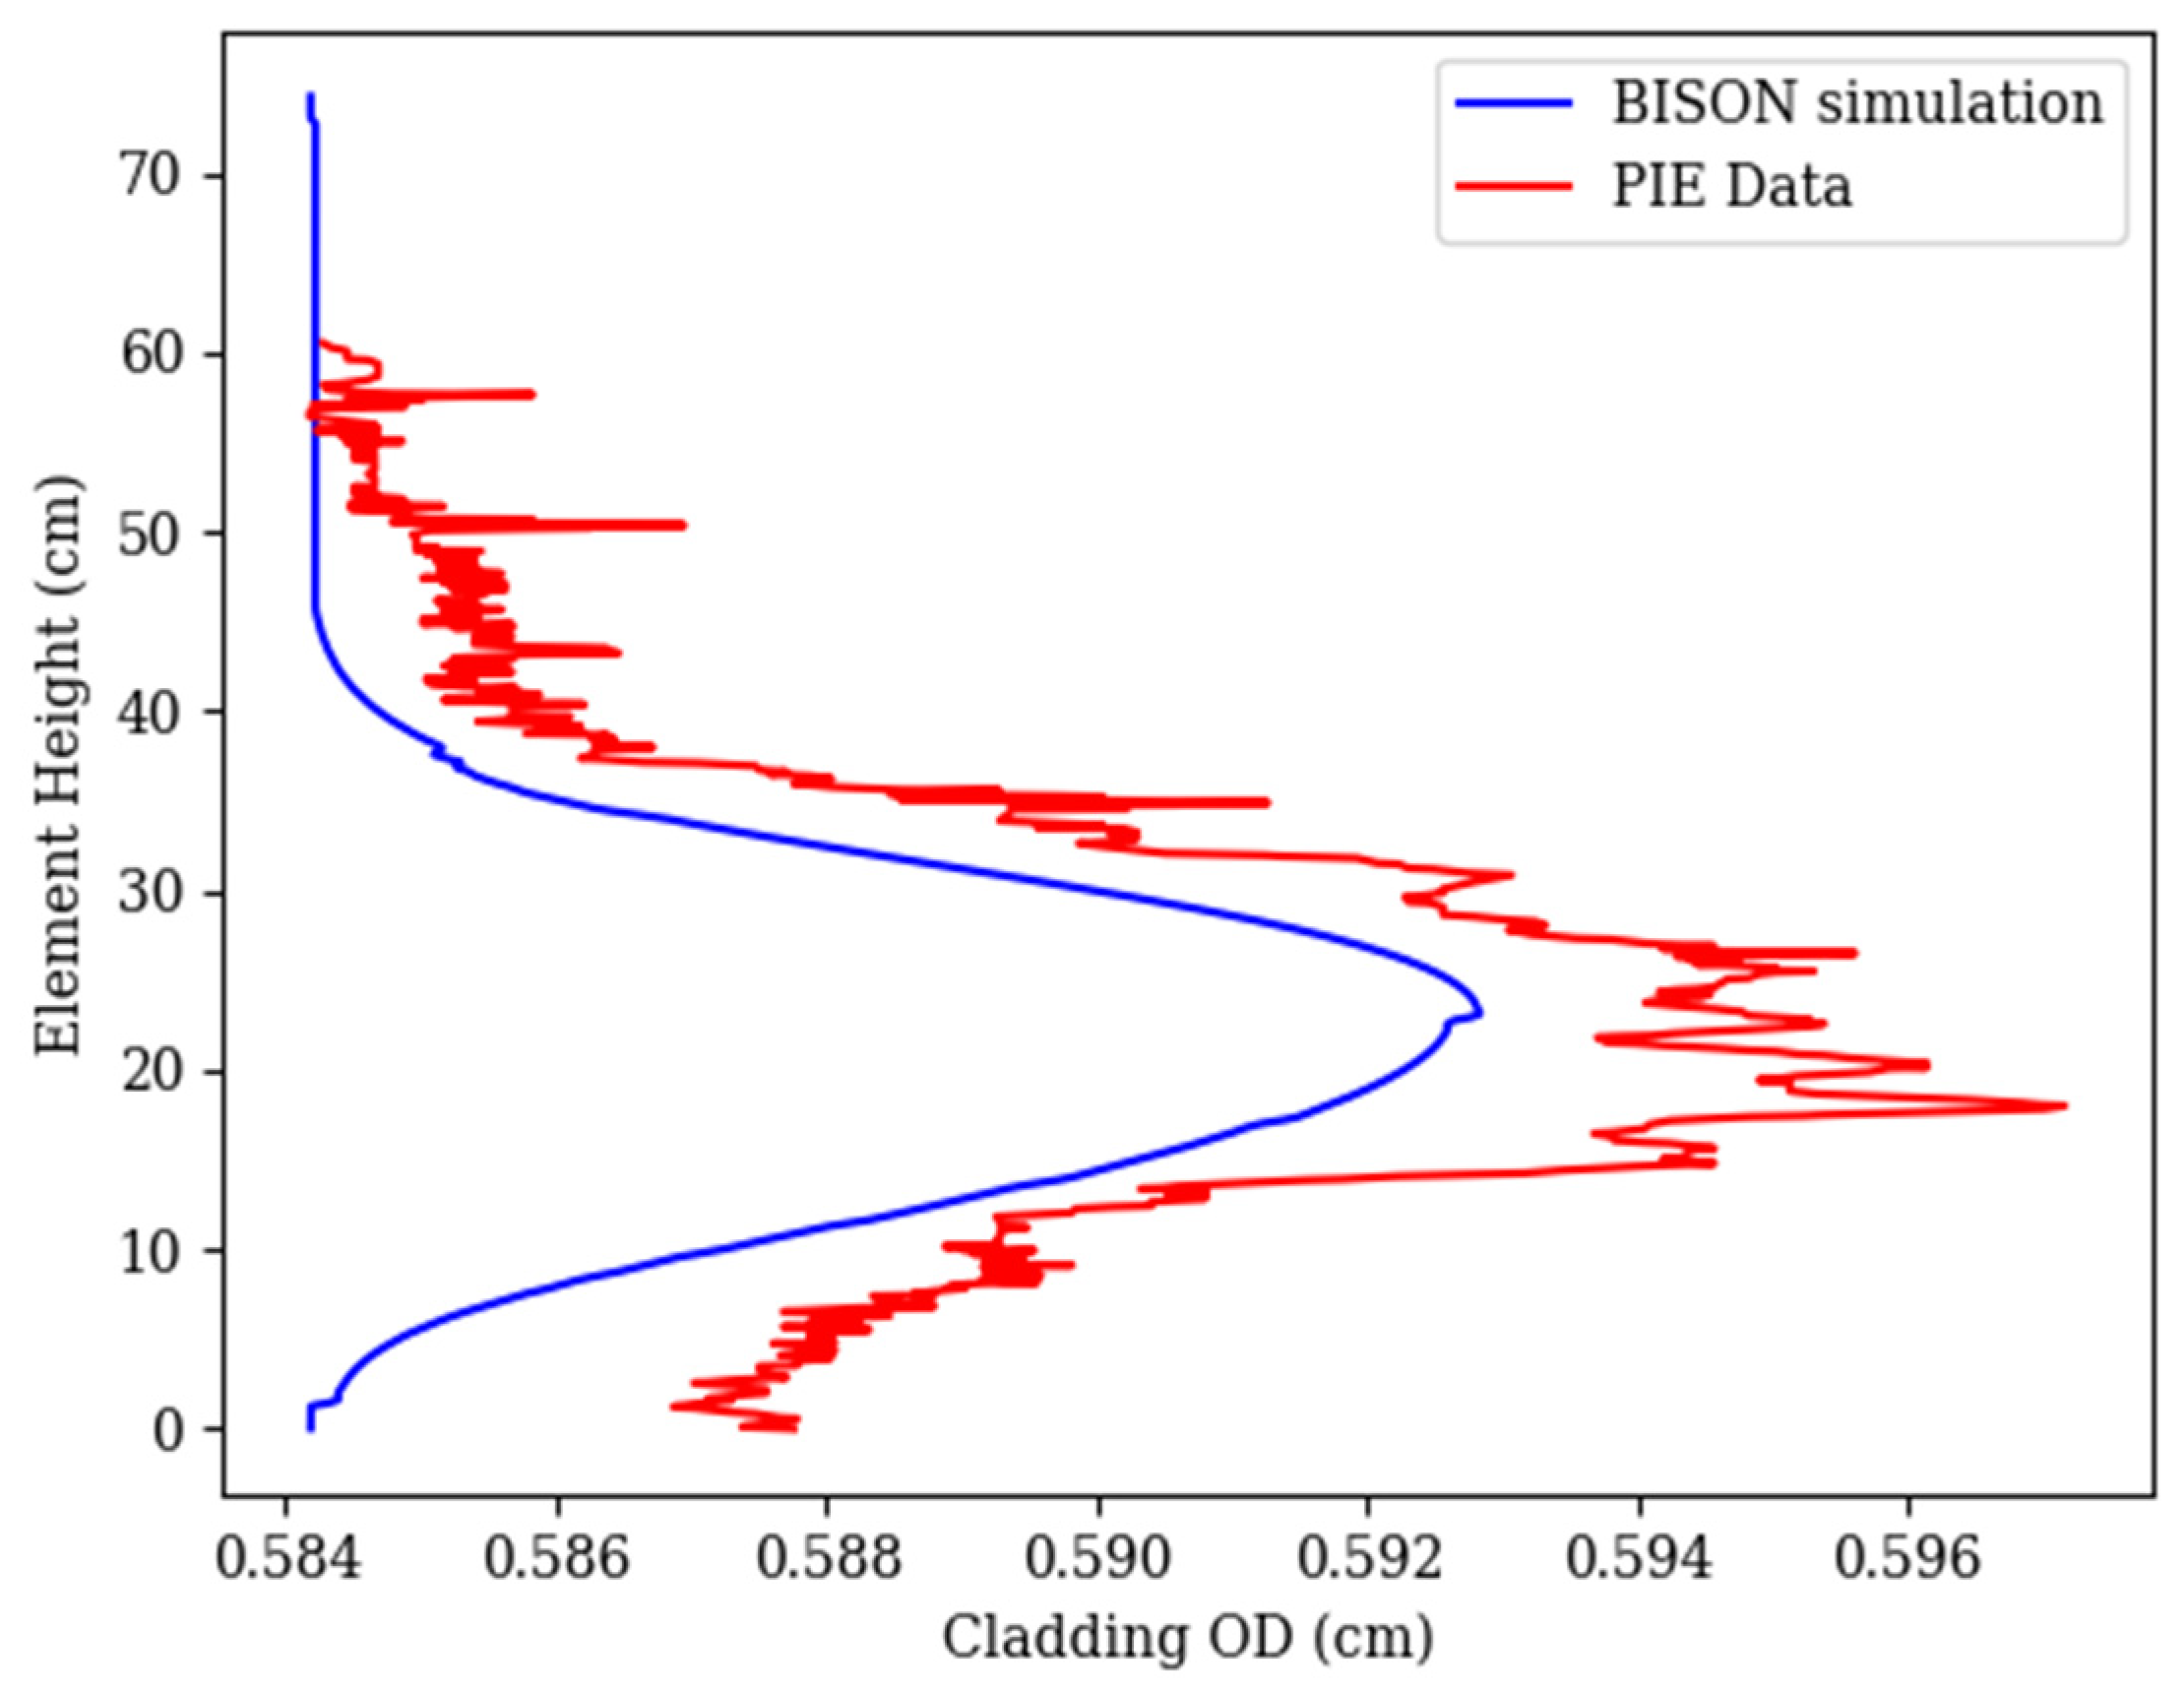
Experiment X486 contained a limited set of six pins available with PIE cladding profilometries that could be used in the experiment-level statistics. For individual analysis, EBR-II pins J555 and J630 were selected and only have one profilometry profile each. The BISON simulations results are compared to PIE measurements for pins J555 and J630 in
Figure 18 and
Figure 19. It was found that the implementation of the SS316 volumetric swelling model had a significant effect on the profilometry results, resulting in 4% volumetric swelling in the SS316 cladding after the X486 irradiation. As mentioned previously in the D9 profilometry results, the volumetric swelling models are very dependent on flux, fluence, and the axial flux profile. As seen in
Figure 18 and
Figure 19, both of the BISON simulated profilometry results match the axial location of the peak within the PIE cladding profilometry, but the BISON simulations underpredict the magnitude of the cladding volumetric strain. FCCI and CCCI were not coupled into the models, but are known to aid in volumetric strain by the wastage formed thinning of the cladding wall. The wastage of the cladding would allow for more thermal creep to occur in the SS316 cladding, aiding volumetric strain. However, the cladding strain observed within
Figure 18 and
Figure 19 is in rough agreement with the PIE results.
Due to the limited dataset of PIE profilometry measurements available for X486, all the SEE values for the pins and the experiment-level SEE are displayed in
Table 4. The maximum SEE value comes from pin J651, which has the most volumetric strain out of the six pins done for X486. Although the pins within X486 had relatively the same fluence values (J651 being higher), the maximum cladding temperatures observed varied by 30 K. The increase in cladding temperature contributes to the volumetric swelling of the cladding, justifying J651 swelling more than the rest of the X486 pins examined. Axial cladding temperatures of J630 and J651 are shown in
Figure 20 to show that J651 was at slightly elevated temperatures. The elevated temperatures also correspond to a greater fluence value imparted on pin J651. The noise seen in
Figure 20 past ~35cm is an artifact of the cladding mesh size and the coolant channel model used in BISON. The J651 PIE profilometry profile has two distinct peaks, as opposed to a singular peak seen in
Figure 18 and
Figure 19. It is believed that the two peaks seen within the J651 PIE profilometry are supposed to be singular, but variance of the contact profilometry and possible debris on the outer cladding wall contributed to the separation into two peaks. With the experiment-level SEE being 28 µm, the BISON simulated profilometry agrees with the PIE cladding profilometry measurements.
4. Discussion
BISON profilometry results for experiments X421/X421A, X441/X441A, and X486 were compared to PIE profilometry measurements from IMIS and FIPD. This was primarily done to validate metallic fuel and benchmark material model development for irradiation-induced volumetric swelling models for HT9, D9, and SS316 cladding materials. The correlations for the irradiation-induced volumetric swelling models stem from the metallic fuels handbook and other studies [
11,
12,
13,
14]. The biggest challenge with this work was choosing modeling parameters that would be constant throughout all the BISON simulations to best describe the fuel operating phenomena, such as the terminating porosity, anisotropic swelling, and the friction coefficient used in frictional contact with the cladding. Note that, for now, this also simulates the anisotropy of fuel swelling, where the creep of the fuel in the outer/colder radial regions in the fuel helps restrain axial growth.
When using the BISON default initiating and terminating porosity values, the simulations were found to overpredict the volumetric swelling of the fuel, with the fuel volumetric strain reach 33% from gaseous swelling alone. Adding in fuel volumetric swelling from solid fission products, in addition to the gaseous swelling, allowed some fuel pins to reach fuel strains over 55%. This is not accurate, as most 75% smeared density pins reach a fuel strain of 35% total, which is shown within previous work, IMIS, and FIPD [
3,
4,
10]. In other fuel performance codes such as ALFUS, hot pressing of U-Pu-Zr is taken into consideration to prevent overswelling of the fuel by modeling pore collapse [
10]. BISON does not yet account for U-Pu-Zr hot pressing and pore collapse, but there are plans to implement these models in the near future.
When using the BISON default values for initiating and terminating porosity, the type of frictional contact within the BISON simulation played a significant role on cladding profilometry. Using frictionless contact underpredicted the cladding profilometry and severely overpredicted the axial fuel length. This occurs as there is no force binding the fuel to the cladding, and it is allowed to swell vertically due to no resistance. Also, no anisotropic swelling was assumed to restrain overall axial growth by colder radial regions creep less and restrain the hotter central region creating a ‘pressurized tube’ effect. The opposite is true if frictional contact is used with the BISON default parameters, as frictional forces bind the vertical swelling and push the cladding wall out radially, as seen in previous work [
2]. There is an effort to develop a model for metallic fuel that allows the fuel matrix to compress when in contact with the cladding to allow for different smeared density U-Pu-Zr pins to fit the profilometry with frictional contact.
Coupling the individual pin axial flux and power profiles as well as pin specific fluence values allowed for a better representation of the reactor conditions imparted on the EBR-II fuel pins. The implementation of this data from FIPD as well as instituting frictional contact allowed for a better assessment of the HT9, D9, and SS316 irradiation-induced volumetric swelling models added to the BISON code. The SEE technique was used to evaluate the volumetric swelling models implemented into BISON to show the difference between the BISON simulations and the PIE profilometry measurements. Implementation of the volumetric swelling models showed a significant improvement in evaluating D9 and SS316 clad pins in EBR-II. Due to HT9 pins being more resistant to irradiation-induced volumetric swelling for the fluences simulated, the difference between the simulations is not as pronounced. The HT9 volumetric swelling model used in this modeling is being implemented in HT9 clad pins within MFF FFTF, as fluences within those pins have reached 2.2 × 10²³ n∙cm−2. It can be seen that swelling is not an important part of radial deformation of the HT9 cladding; creep is the dominant mechanism.
Although implementing volumetric swelling models for HT9, D9, and SS316 cladding materials is shown to be important in evaluating cladding profilometry for metallic fuel performance, other models need to be developed and implemented into BISON to further capture fuel and cladding physical phenomena occurring within the fuel pins, such as FCCI, CCCI, and hot pressing of the U-Pu-Zr matrix. Currently, there are FCCI and CCCI models within BISON that compute the effective thinning of the cladding using either a burnup or flux dependent method, but these computations are not coupled back into the BISON simulation to adjust the cladding thickness. Coupling the thinning of the cladding is important in evaluating the cladding strain data, as it allows for the cladding to deform more due to more thermal creep. This is particularly important in the X447/X447A experiment modeling efforts, as FCCI is more prevalent at elevated temperatures, where DP70 and DP75 were known to have failed due to these chemical interactions. A hot-pressing model of U-Pu-Zr fuel into BISON would alleviate the need for the terminating porosity to be adjusted for different smeared density metallic fuel pins and aid in the overswelling issue observed within metallic fuel modeling.
When comparing BISON cladding profilometry results to similar pins within X441 from previous work, BISON simulations were able to predict the profile shape of the cladding strain, in addition to maximum cladding strain [
10,
16]. Previous work done with ALFUS for X441 included modeling a generic pin with a constant power history for different smear densities and was able to produce results that relatively match average measured data from INL [
10]. In the case for BISON profilometry results, more datapoints, pin initial conditions and histories were simulated and compared directly to the corresponding pin PIE measurements, and not an average of profilometry data. BISON profilometry results were successfully able to predict cladding strain from PIE measurements for multiple cladding materials and yield more accurate results when compared to previous work [
10]. This is due to FIPD and IMIS containing individual pin initial conditions and histories that can be imported into BISON easily, and the digitization of PIE measurements for simulation comparison, all of which were not available at the time when ALFUS was being developed for metallic fuel [
10].
Cladding profilometry was simulated using COMSOL in previous work using similar material models found within BISON for pin T470 out of X425. Although this pin was in a different experiment, the fuel composition and geometric dimensions were the same as most pins within X441/X441A. In the COMSOL simulations conducted, the cladding profilometry overpredicted experimental results at various burnups [
16]. The primary difference between the COMSOL simulations and the BISON simulations from previous work is the swelling model used for the fuel. The COMSOL simulations uses the hydrostatic stress within the gaseous swelling model, where BISON limits the amount of swelling by setting a terminating porosity and isotropic factor [
15,
16]. This overprediction of cladding profilometry in COMSOL simulations could be rectified by fitting constants to more experimental data. As mention previously, a U-Pu-Zr hot-pressing model needs to be developed in BISON to have similar physics coded in ALFUS and COMSOL to accurately describe fuel swelling instead of fixing the terminating porosity.
The BISON results presented in this statistical study showed the impact the volumetric swelling models for HT9, D9, and SS316 can provide and the accuracy of the swelling models when coupled with detailed physics and initial conditions. As more cladding profilometry data from IMIS and FIPD become available for other experiments such as X430, a statistical analysis with BISON modeling will be conducted as well.


