
In Situ Deformation Analysis of a Fracture in Coal under Cyclic Loading and Unloading


1
State Key Laboratory of Heavy Oil Processing, China University of Petroleum-Beijing at Karamay, Karamay 834000, China
2
Research Centre of Multiphase Flow in Porous Media, School of Petroleum Engineering, China University of Petroleum (East China), Qingdao 266580, China
*
Authors to whom correspondence should be addressed.
Energies 2021, 14(20), 6474; https://0-doi-org.brum.beds.ac.uk/10.3390/en14206474
Submission received: 9 September 2021
/
Revised: 4 October 2021
/
Accepted: 5 October 2021
/
Published: 10 October 2021
(This article belongs to the Special Issue Multiscale Petrophysics Characterization and Multiphase Flow in Unconventional Reservoirs)
Abstract
:The deformation analysis of fractures is vital for advantageous development of oil and gas fields, especially the coalbed methane (CBM) reservoir, since the change of fracture parameters can be directly evaluated through fracture deformation analysis. Then the flow capacity of CBM and the effect of various stimulation methods can be analyzed. In this study, X-ray CT image analysis is used to quantitatively characterize the deformation of a coal fracture in situ, and the evolution of fracture aperture under cyclic loading is presented. Furthermore, dimensionless permeability at different confining pressures by the Lattice Boltzmann method is simulated. The current results indicate that the fracture deformation changes significantly under cyclic loading. A dramatic change is observed in the initial loading stage, in which the coal is strongly compacted, and the fracture aperture and permeability are reduced to 13.9% and 0.1%, respectively, when the confining pressure is loaded to 10 MPa. When unloading to 0 MPa, the fracture aperture and dimensionless permeability are far less than that of the initial 0 MPa. It is worth noting that the deformation of the second cycle fracture is weaker, and the change range of permeability and aperture of coal fracture becomes smaller, but when unloading to 0 MPa in the second cycle, the fracture permeability can be restored to 50.8% compared with 0 MPa of the loading stage. Additionally, a special phenomenon has been observed that under cyclic loading, even when the confining pressure reaches 10 MPa, some areas of the fracture are still not closed. We infer that there are some large pore structures in fracture space, and high confining pressure leads to fracture closure, but the deformation of the pore structure is not prominent compared with the fracture space. These characteristics of fracture deformation are of great significance for the production of CBM and are worthy of further study.
1. Introduction
With the continuous consumption of energy, coal and coalbed methane (CBM) are still an important part of the world’s energy. China is rich in coal and coalbed methane resources, but the low permeability of most coal seams restricts the exploitation and utilization of CBM. It is widely known that fractures are the main flow channel in coal seams and are a major contributor to coal permeability [1,2,3,4] (Flores 1998, Heriawan and Koike 2015, Mazumder et al. 2006, Moore 2012). Therefore, fully understanding and quantitatively characterizing the change of fracture structure is of great significance for quantitative analysis of gas flow in coal and further CBM production.
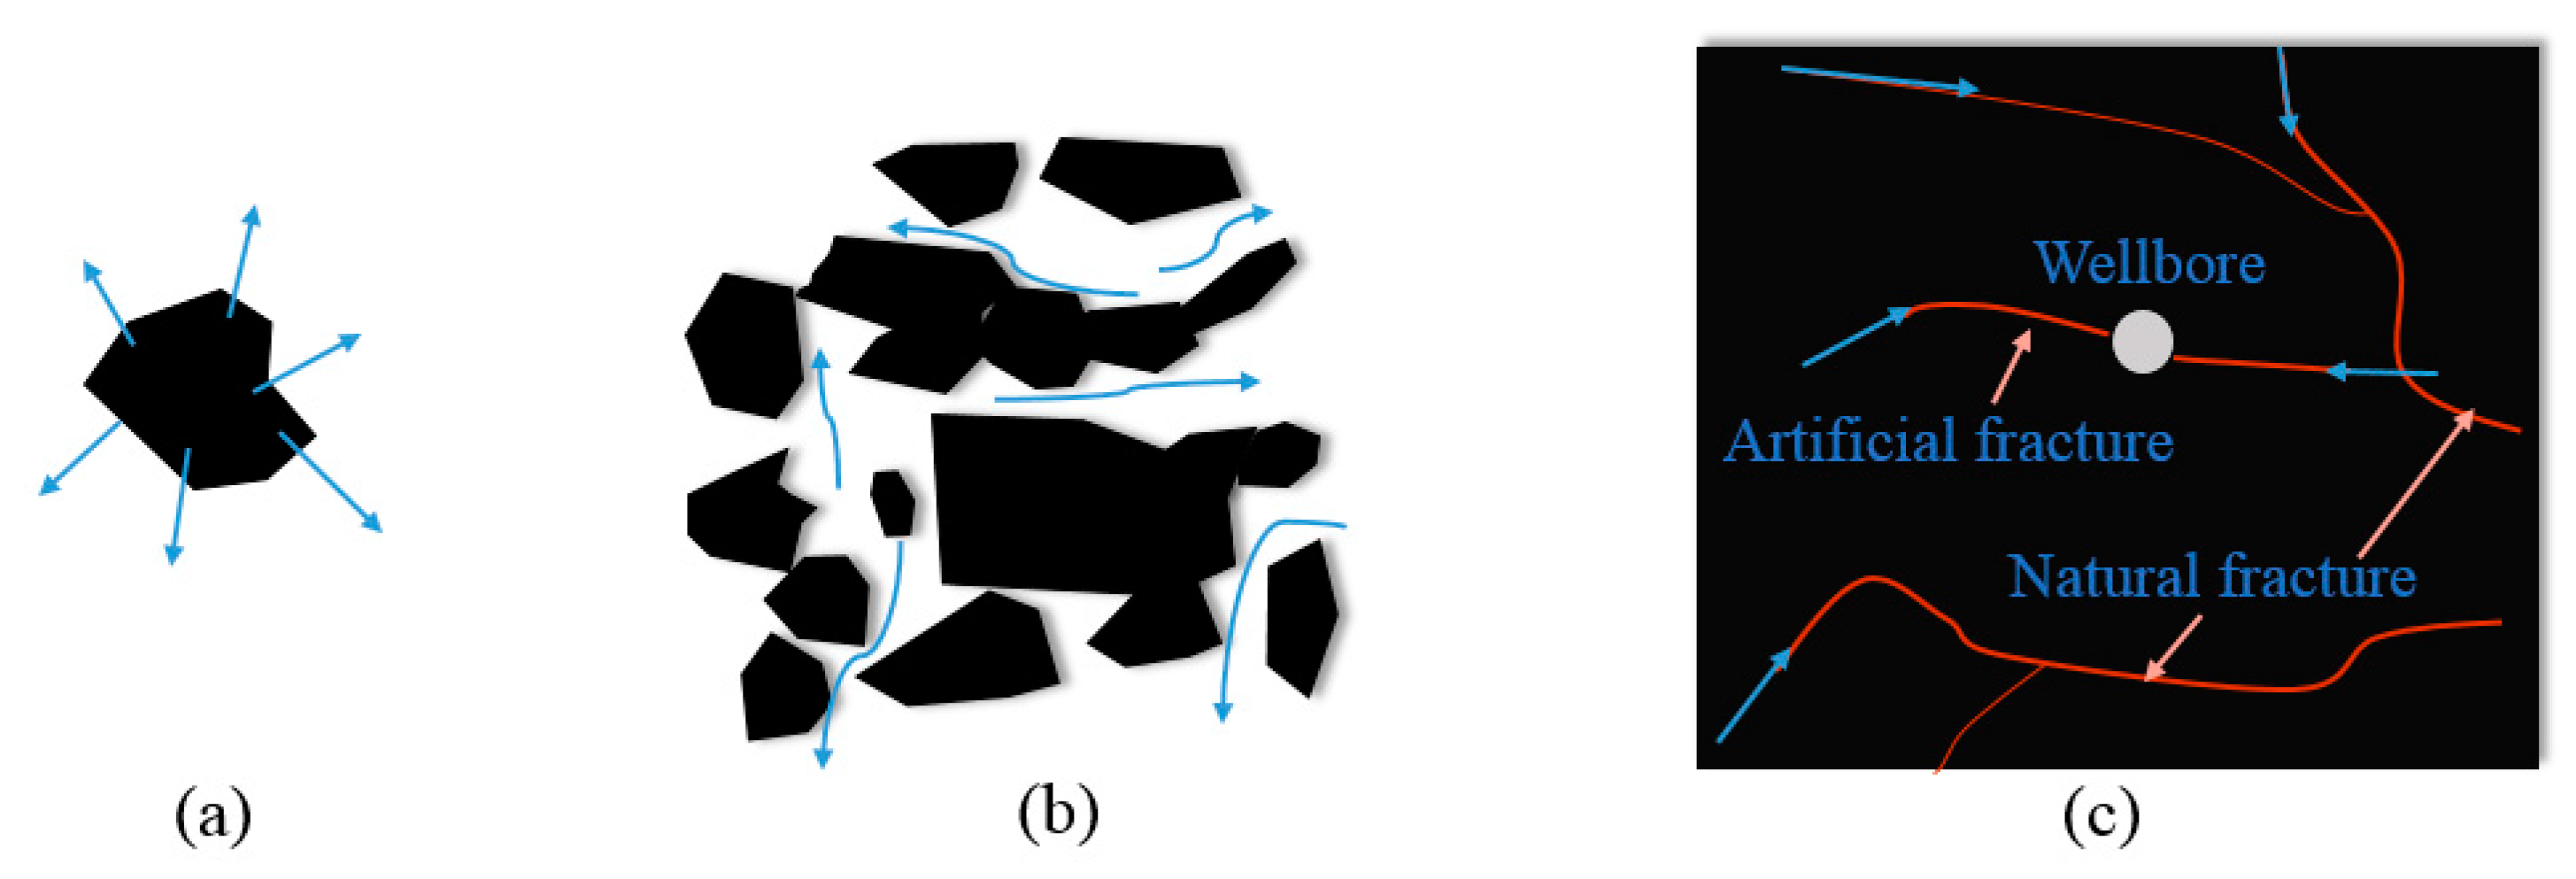
It is generally recognized that the production of CBM is a complex process, including desorption, diffusion and fluid flow, and the coal seam is a mixture of coal matrix particles, pores, fractures, clay, carbonate, et cetera [5,6,7,8]. In the development of CBM, as shown in Figure 1, after desorption, methane flows into the pores and fractures of the coal and then flows into the wellbore by large fractures [8]. In this process, microfractures, i.e., micro cleats or fractures in coal, play a vital role because they are a bridge between pores and macro fractures, and their existence directly affects the permeability of the reservoir [3,9]. Therefore, microfractures, whether natural or artificially induced, have been widely studied [10,11,12,13,14,15,16,17,18].
However, with the development of the reservoir and the production operations of gas wells, the pressure in the reservoir changes dramatically, and additional attention has been paid to the effect of cyclic loading and unloading on a fractured core. The authors from [19] find that the sample will be adequately seasoned after several cycles, and the unloading cycle stabilizes more rapidly. The impact of effective stress and gas slippage on coal permeability under cyclic loading conditions is investigated by [20], their results indicate that permeability declines exponentially with increasing gas pressure. The FE-SEM experimental results of [21] show that during stress increase, some of these nano- and microfractures collapse, but some of the collapsed nano- and microcracks might not be reopened. X-ray computed tomography (CT), acoustic emission profiling and the concurrent measurement of P-wave velocities are used to examine the evolution of the 3D fracture network during stressing through failure. Their results show that under tri-axial stress, permeability changes in a “V” shape with the increase in axial stress [22].
However, so far, there is no consistent understanding of in situ characterization of fracture parameters under cyclic stress, and traditional laboratory tests do not provide any information about the deformation of fracture structure. In addition, compared with natural microfractures, artificial microfractures are more prone to deformation under different formation pressures, but few researchers focus on cyclic loading and unloading of artificial fracture in coal directly on the microscale.
Many detection techniques have been used to characterize microfractures in coal at different scales, such as nuclear magnetic resonance (NMR), X-ray computed tomography (CT), scanning electron microscope (SEM), focused ion beam scanning electron microscope (FIB-SEM), acoustic emission and ultrasonic technology. X-ray CT technology is an effective and non-destructive technique and has been widely used in petroleum geology research [23,24,25,26,27,28,29,30,31,32,33]. Characterization of microscale fractures based on X-ray CT is a typical and convenient application. X-ray CT is used to obtain the internal cleat structure of a heterogeneous fractured coal sample, based on which statistics of coal lithotype distributions and cleat geometrical properties are extracted [33]. The authors of [34] used CT scanning to determine the distribution of bedding dip angle of the coal seam. In addition, X-ray CT is combined with FESEM-EDS to quantitatively evaluate the three-dimensional (3D) structure of fractures and minerals in two cores [35]. These works provide an important basis for the fracture deformation analysis based on CT technology. To study the influence of in situ fracture deformation under cyclic loading and unloading on fracture aperture and permeability, we used X-ray micro-CT combined with cyclic stress sensitivity equipment for the pore-scale in situ quantitative characterization of a coal sample with an artificial fracture. Fracture apertures of the same position are measured based on CT images, and dimensionless permeability at different confining pressures is calculated by the Lattice Boltzmann method (LBM). Finally, the variation law of fracture aperture and permeability of a coal sample under cyclic stress is fully discussed, and it is hoped to provide a more theoretical basis for CBM exploitation.
2. Cyclic Stress Sensitivity Experiment of a Coal Sample
2.1. Experimental Method and Equipment
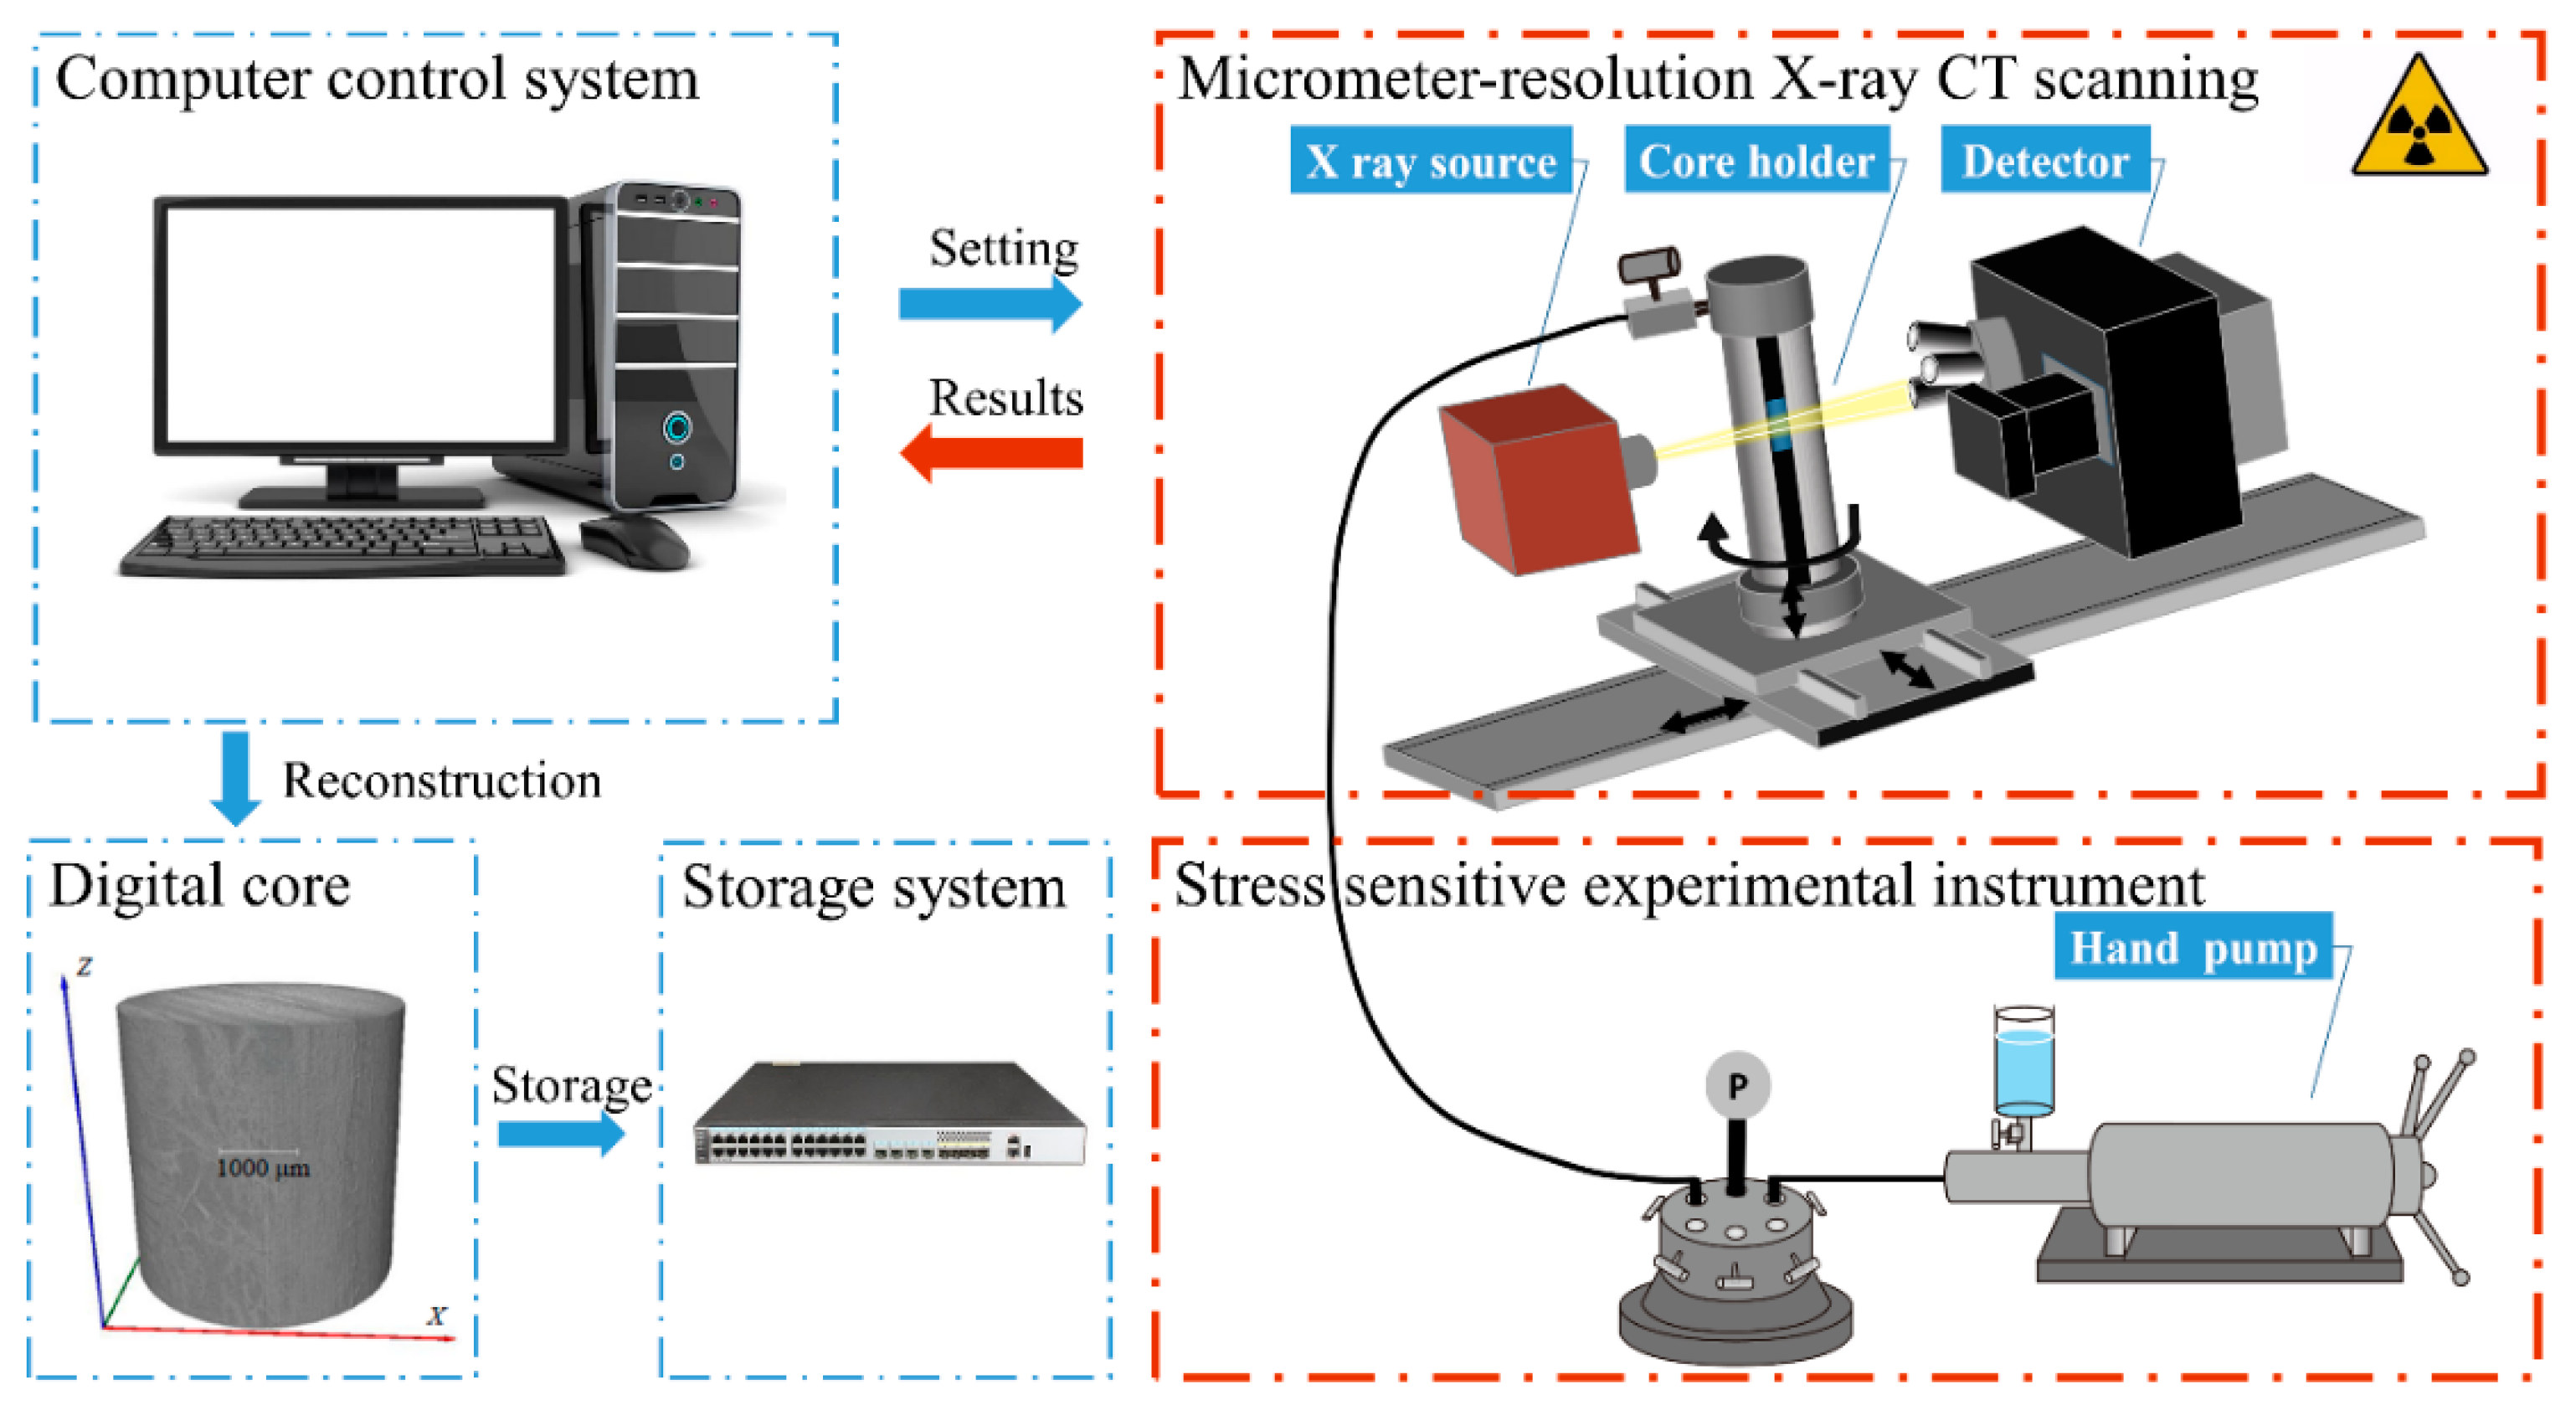
X-ray CT refers to a method in which a core sample rotates between an X-ray emitter and a highly sensitive detector for continuous cross-sectional scanning, by which the properties of rock can be analyzed [36,37,38,39,40]. The X-ray CT apparatus is mainly divided into three parts: a computer control system, a scanning part and an image storage system, as displayed in Figure 2. The computer control system is mainly used to precisely control the operation of the CT equipment, and the resolution of scanning is closely related to the transformation of the lens, the distance between the source and sample, and the distance between the detector and sample. Appropriate resolution is crucial to the visualization of the pore and fracture in the core.
In the scanning part, the X-ray attenuates when it passes through the objects, and the attenuation coefficients of different materials are different. Therefore, the attenuated X-ray received by the detector will be different. In this experiment, the X-ray passes through the skeleton and the fracture space of the coal sample, and the attenuation coefficients are quite different between them, so they can be clearly identified.
In this study, X-ray CT is utilized to scan the coal sample wrapped in a special core holder. The core holder can withstand high pressure and can be mounted on the sample base of the CT scanner, so combining X-ray CT with a stress-sensitive experimental instrument enables us to realize in situ characterization of the cyclic stress sensitivity experiment, and then evaluate the effect of cyclic stress on the fracture. The in situ X-ray CT characterization system of cyclic stress sensitivity is shown in Figure 2.
As shown in Figure 2, a hand pump is used for applying different confining pressures. The coal sample is placed in a rubber sleeve. A specially made core holder is used to keep the rock under different confining, which has good X-ray transmission and can withstand high confining pressure, and is placed in the Micro-XCT400 (Carl Zeiss AG) for in situ scanning. The outlet of the core holder is connected with the atmosphere, so confining pressure acting on the core is the effective stress.
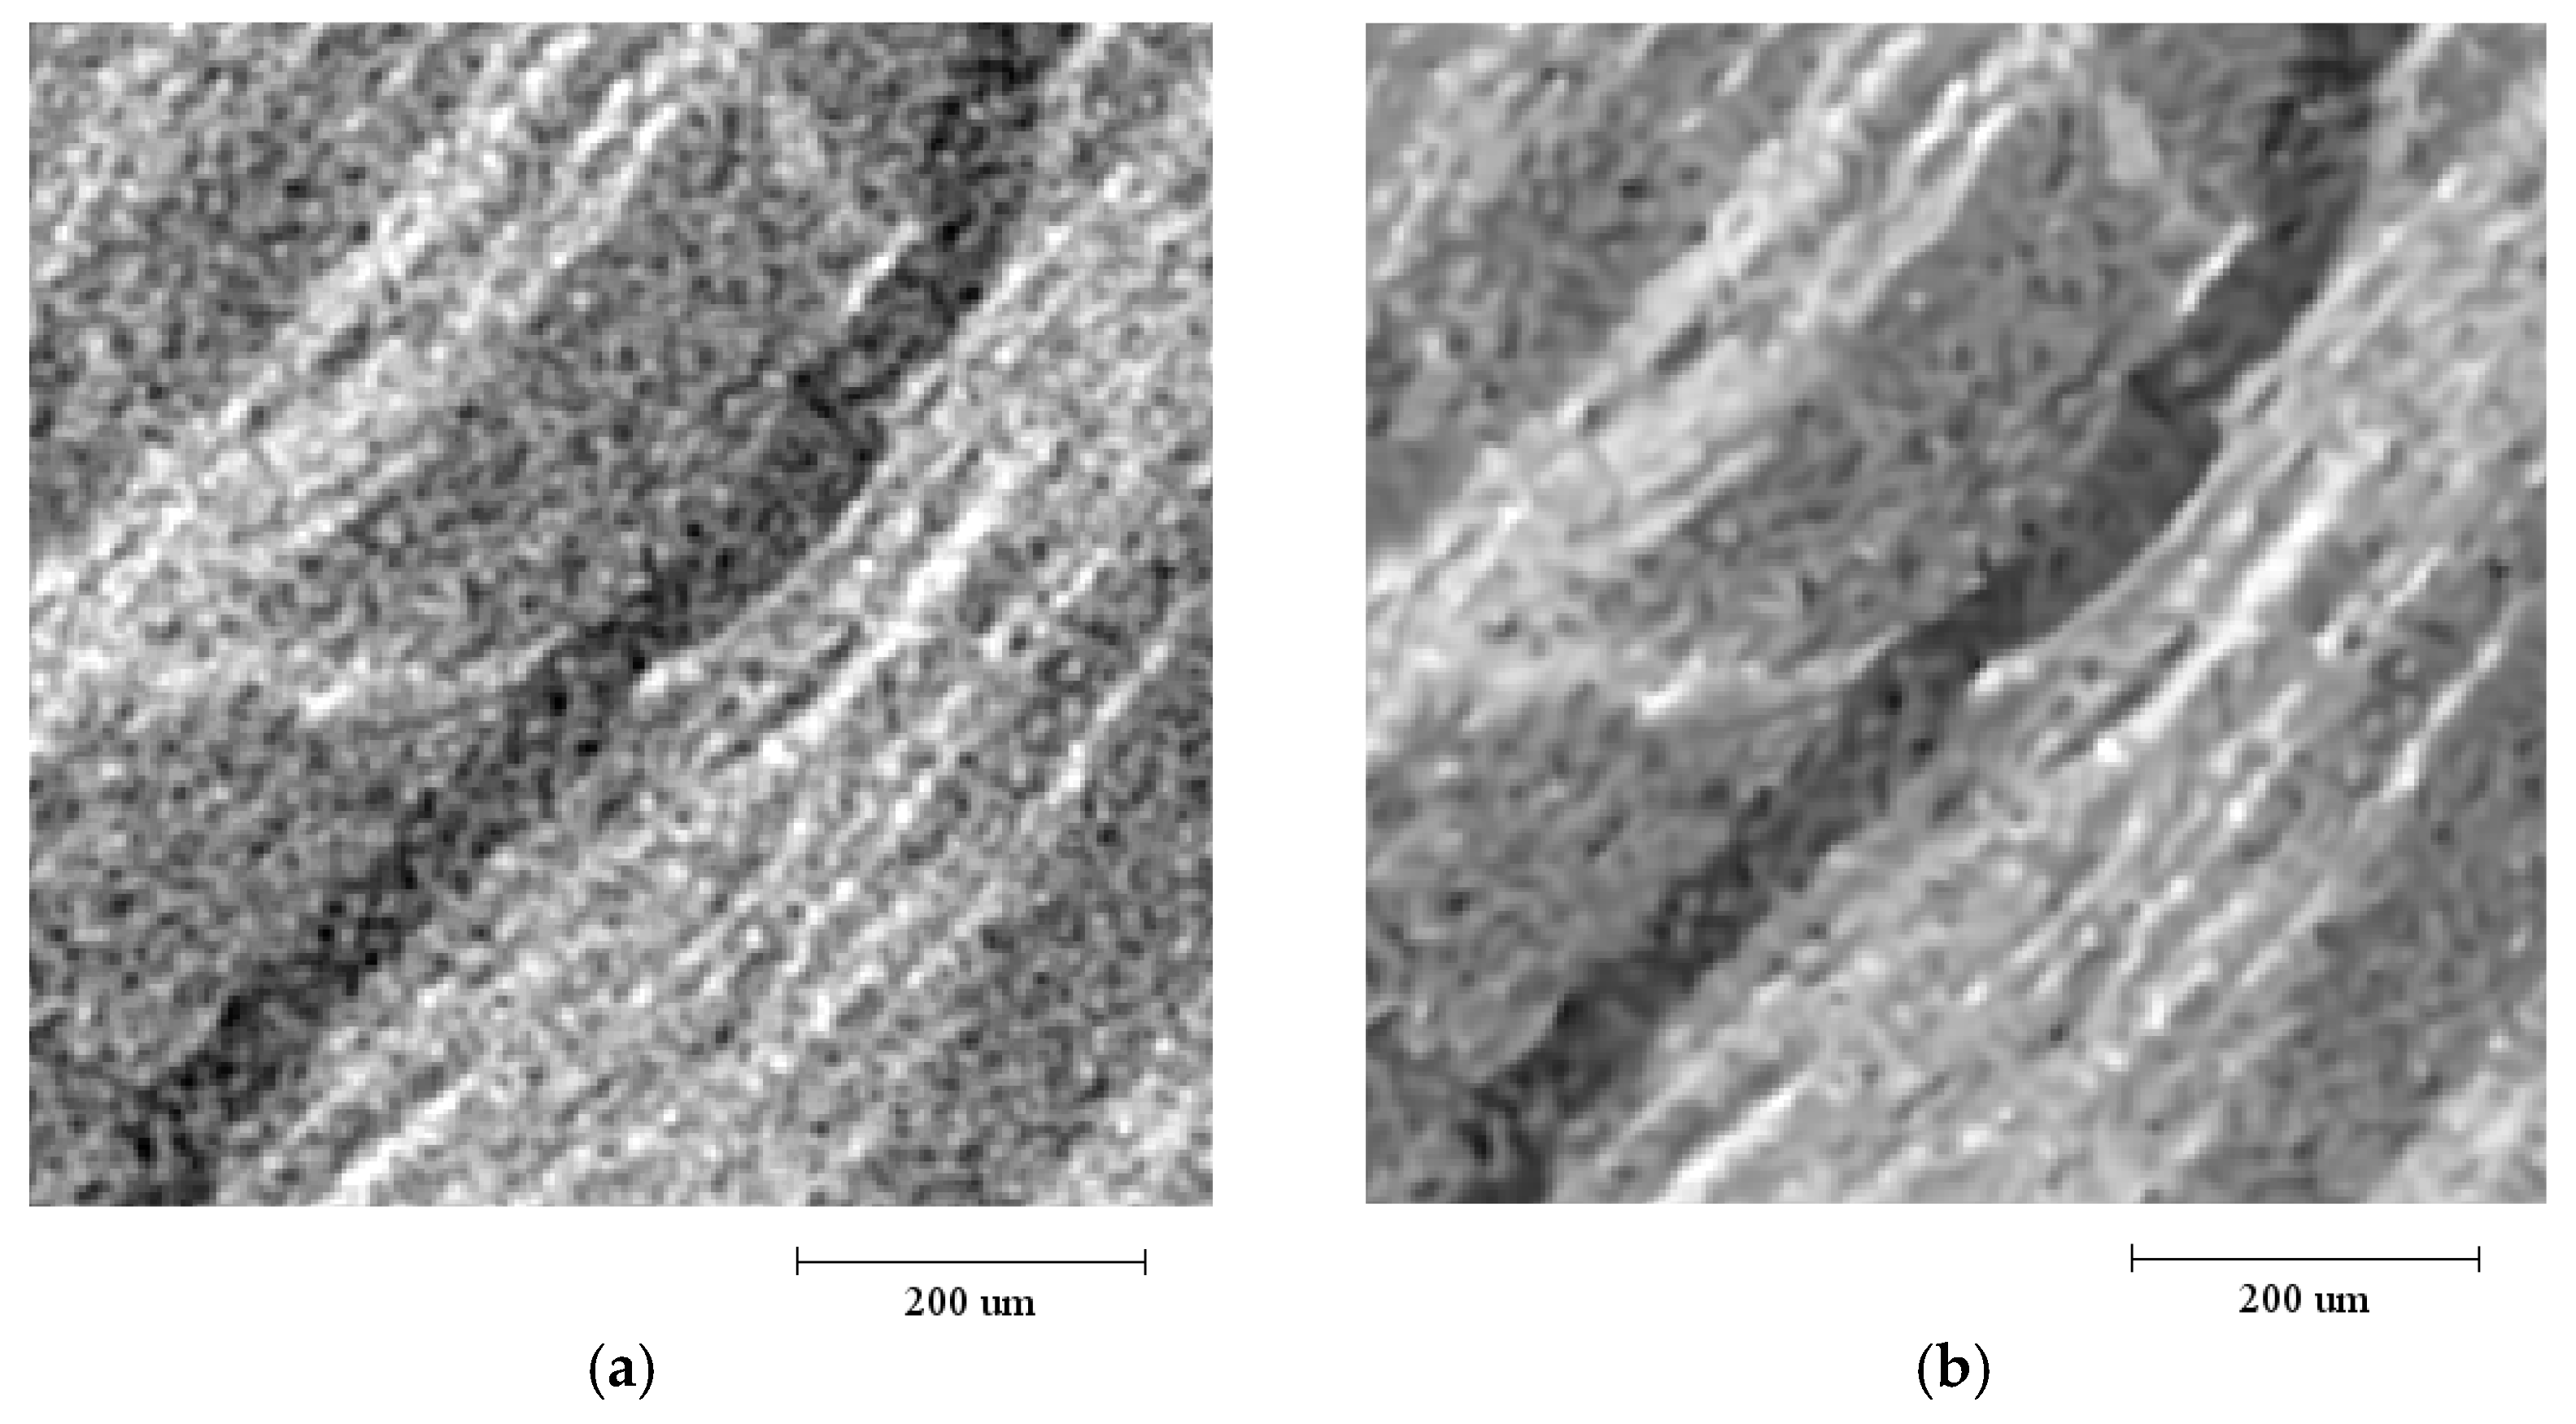
After scanning, the reconstruction, storage and post-processing works need to be completed. The first is reconstruction, which needs to be carried out by matching software; the second is storage, which requires us to store images in the storage system; and finally, image post-processing is needed. The results stored in the image storage system are imported into matching software for further image processing, including image smoothing, denoising and segmentation (a critical step in flow simulation). Figure 3 shows a slice of a coal sample, in which original grayscale image and the result of after-image smoothing and denoising are displayed respectively.
Based on this, the fracture in the coal sample can be quantitatively characterized. The dimensionless permeability of the fracture can be calculated by LBM after image segmentation; the detailed calculation method of permeability is shown in previous work [11].
In this work, similarly, the D3Q19 lattice model is used, the Lattice Bhatnagar-Gross-Krook (LBGK) approximation is applied for distribution function, fi(x), at time t:
In Equation (1), represents the equilibrium distribution function, and is the relaxation parameter, which is related to kinematic viscosity, , and the lattice pseudo-sound-speed, , as shown in Equation (2).
The equilibrium distribution function of incompressible Lattice Boltzmann model is
where is the mean density and is the weight factor in i-th direction. for D3Q19 is specified as
The fluid macroscopic density () and velocity () at a node x can be calculated by Equations (5) and (6).
Besides, the pressure in the calculating of LBM is defined as
Based on Equations (1)–(7), the dimensionless permeability of the fracture can be calculated after setting the inlet and outlet pressure and boundary conditions.
2.2. Core Sample Preparation
In this study, coal samples are taken from SX coal mine. To observe the inner structure of coal by X-ray CT and match the size of the core holder, we need to drill a cylindrical core about 10 mm. However, it is a challenge due to the brittleness of coal. Therefore, it is necessary to keep the core fixed and the bit penetration speed constant during drilling.
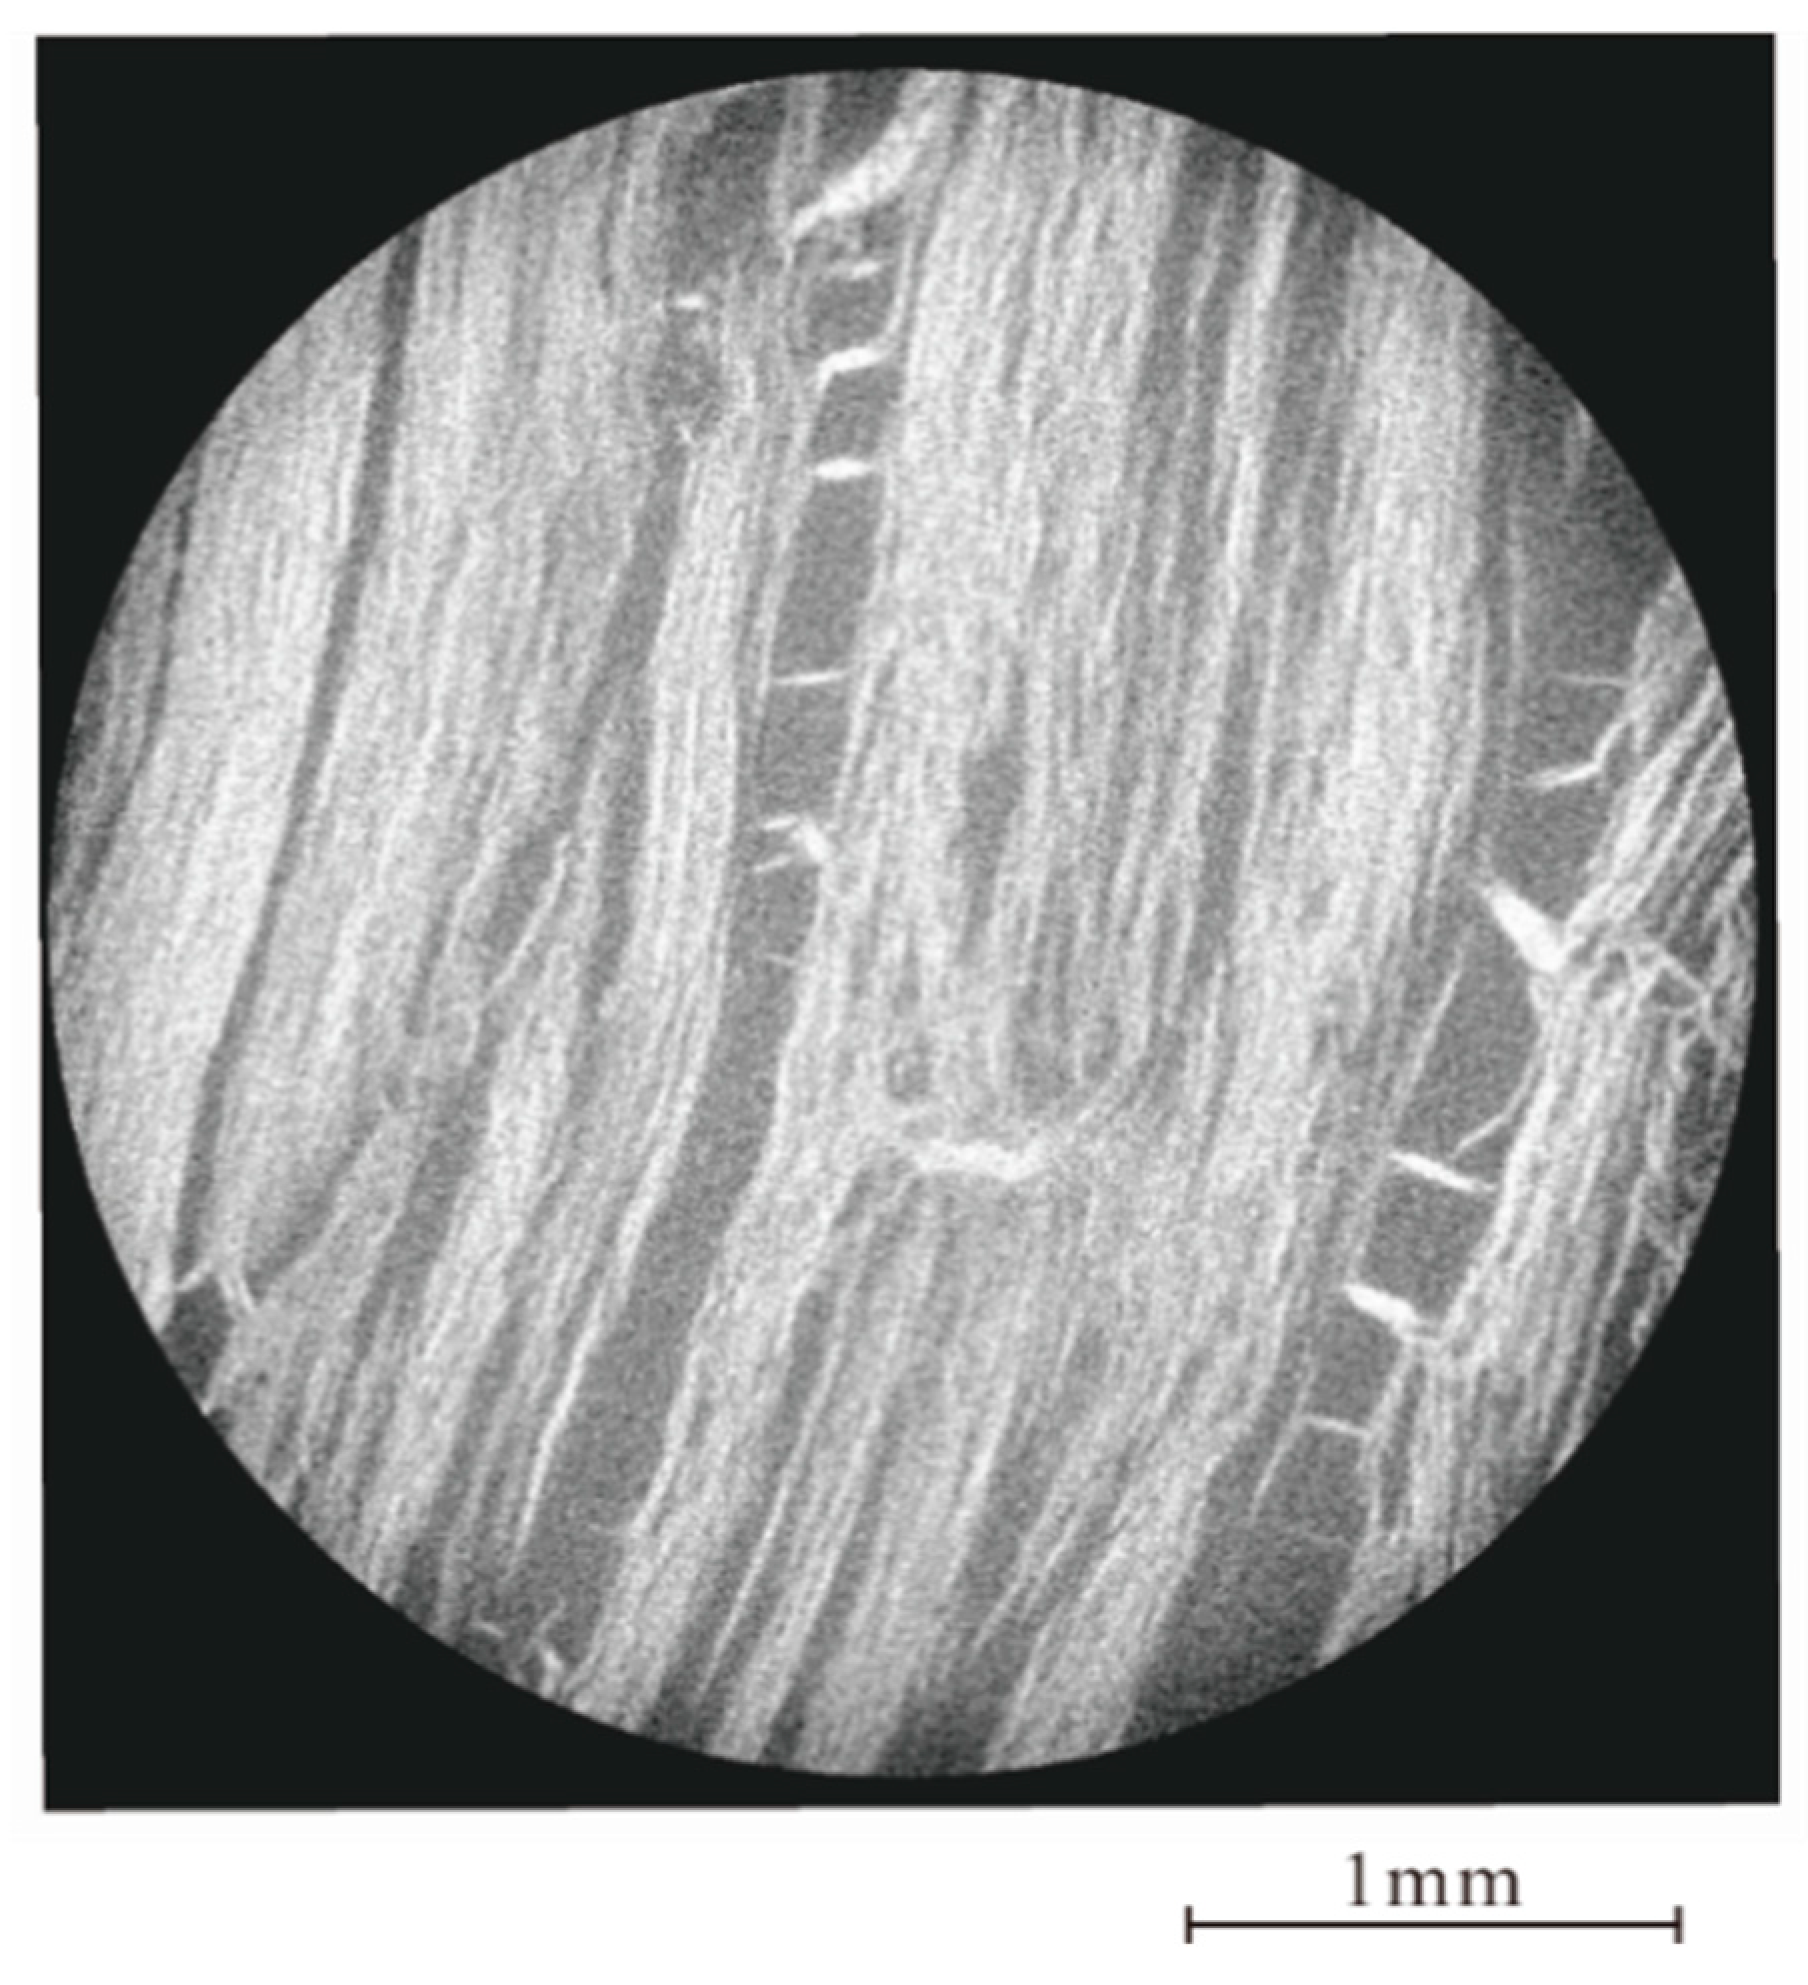
After 10 mm cylindrical cores are obtained, the samples are scanned preliminarily. Finally, the coal sample 2–1 is selected, the diameter and length of which are 9.8 mm and 19.4 mm, respectively. As shown in Figure 4, sample 2–1 is relatively dense (no pores and fractures are found under this resolution). Then, the fracture is induced artificially by applying a concentrated load on one end face of the core.
The coal sample is put into the special core holder, and the holder is fixed on the base of the CT scanner, as shown in Figure 2. The scanning position is determined and stored to ensure in situ characterization. Then, the CT scanning experiment with a resolution of 3.41μm/pixel is carried out to observe the fracture in the core, so as to prepare for the subsequent cyclic stress sensitivity.
2.3. Experimental Procedures
The cyclic stress sensitivity experiments are combined with CT scanning experiments in this work, and the specific experimental steps were as follows:
- Prior to the experiments, the experimental device for loading and unloading is first connected, and as mentioned previously, the core is placed in the core holder, and then the core holder is fixed.
- According to the connection diagram shown in Figure 2, the pipelines are connected to the core holder to start the first cycle step-up experiments. Open the valve and gradually increase the confining pressure according to the sequence of 0 MPa, 0.5 MPa, 1 MPa, 1.5 MPa, 2 MPa, 3 MPa, 5 MPa, 7 MPa and 10 MPa. After the pressure is stabilized for 30 min, the valve is closed, and the pipelines are disassembled for CT scanning to obtain the digital core images.
- Then, the first cycle depressurization experiment is carried out. The valve is opened, and the pressure is gradually reduced in the order of 7 MPa, 5 MPa, 3 MPa, 1.5 MPa and 0 MPa. After the confining pressure is stabilized for 1h, the valve is closed, the pipeline is disassembled and CT scanning is performed to obtain the digital core images.
- Similar to the above steps, the second cycle loading and unloading experiments are carried out: the confining pressure is increased in the order of 0 MPa, 0.5 MPa, 1.5 MPa, 3 MPa, 5 MPa and 10 MPa, and the confining pressure is reduced in the order of 5 MPa, 3 MPa, 1.5 MPa and 0 MPa.
- To reduce the time of image processing, we extract the subvolume from the scanning results as the research object, and then we carry out image processing. Based on this, we can get the change of fracture aperture with confining pressure at the same position in different cycles. Then, the 3D digital core of the fracture can be obtained by image segmentation, and the dimensionless permeability of the fracture can be obtained by LBM simulation.
3. Results and Discussions
3.1. In Situ Quantitative Characterization of Fracture Aperture
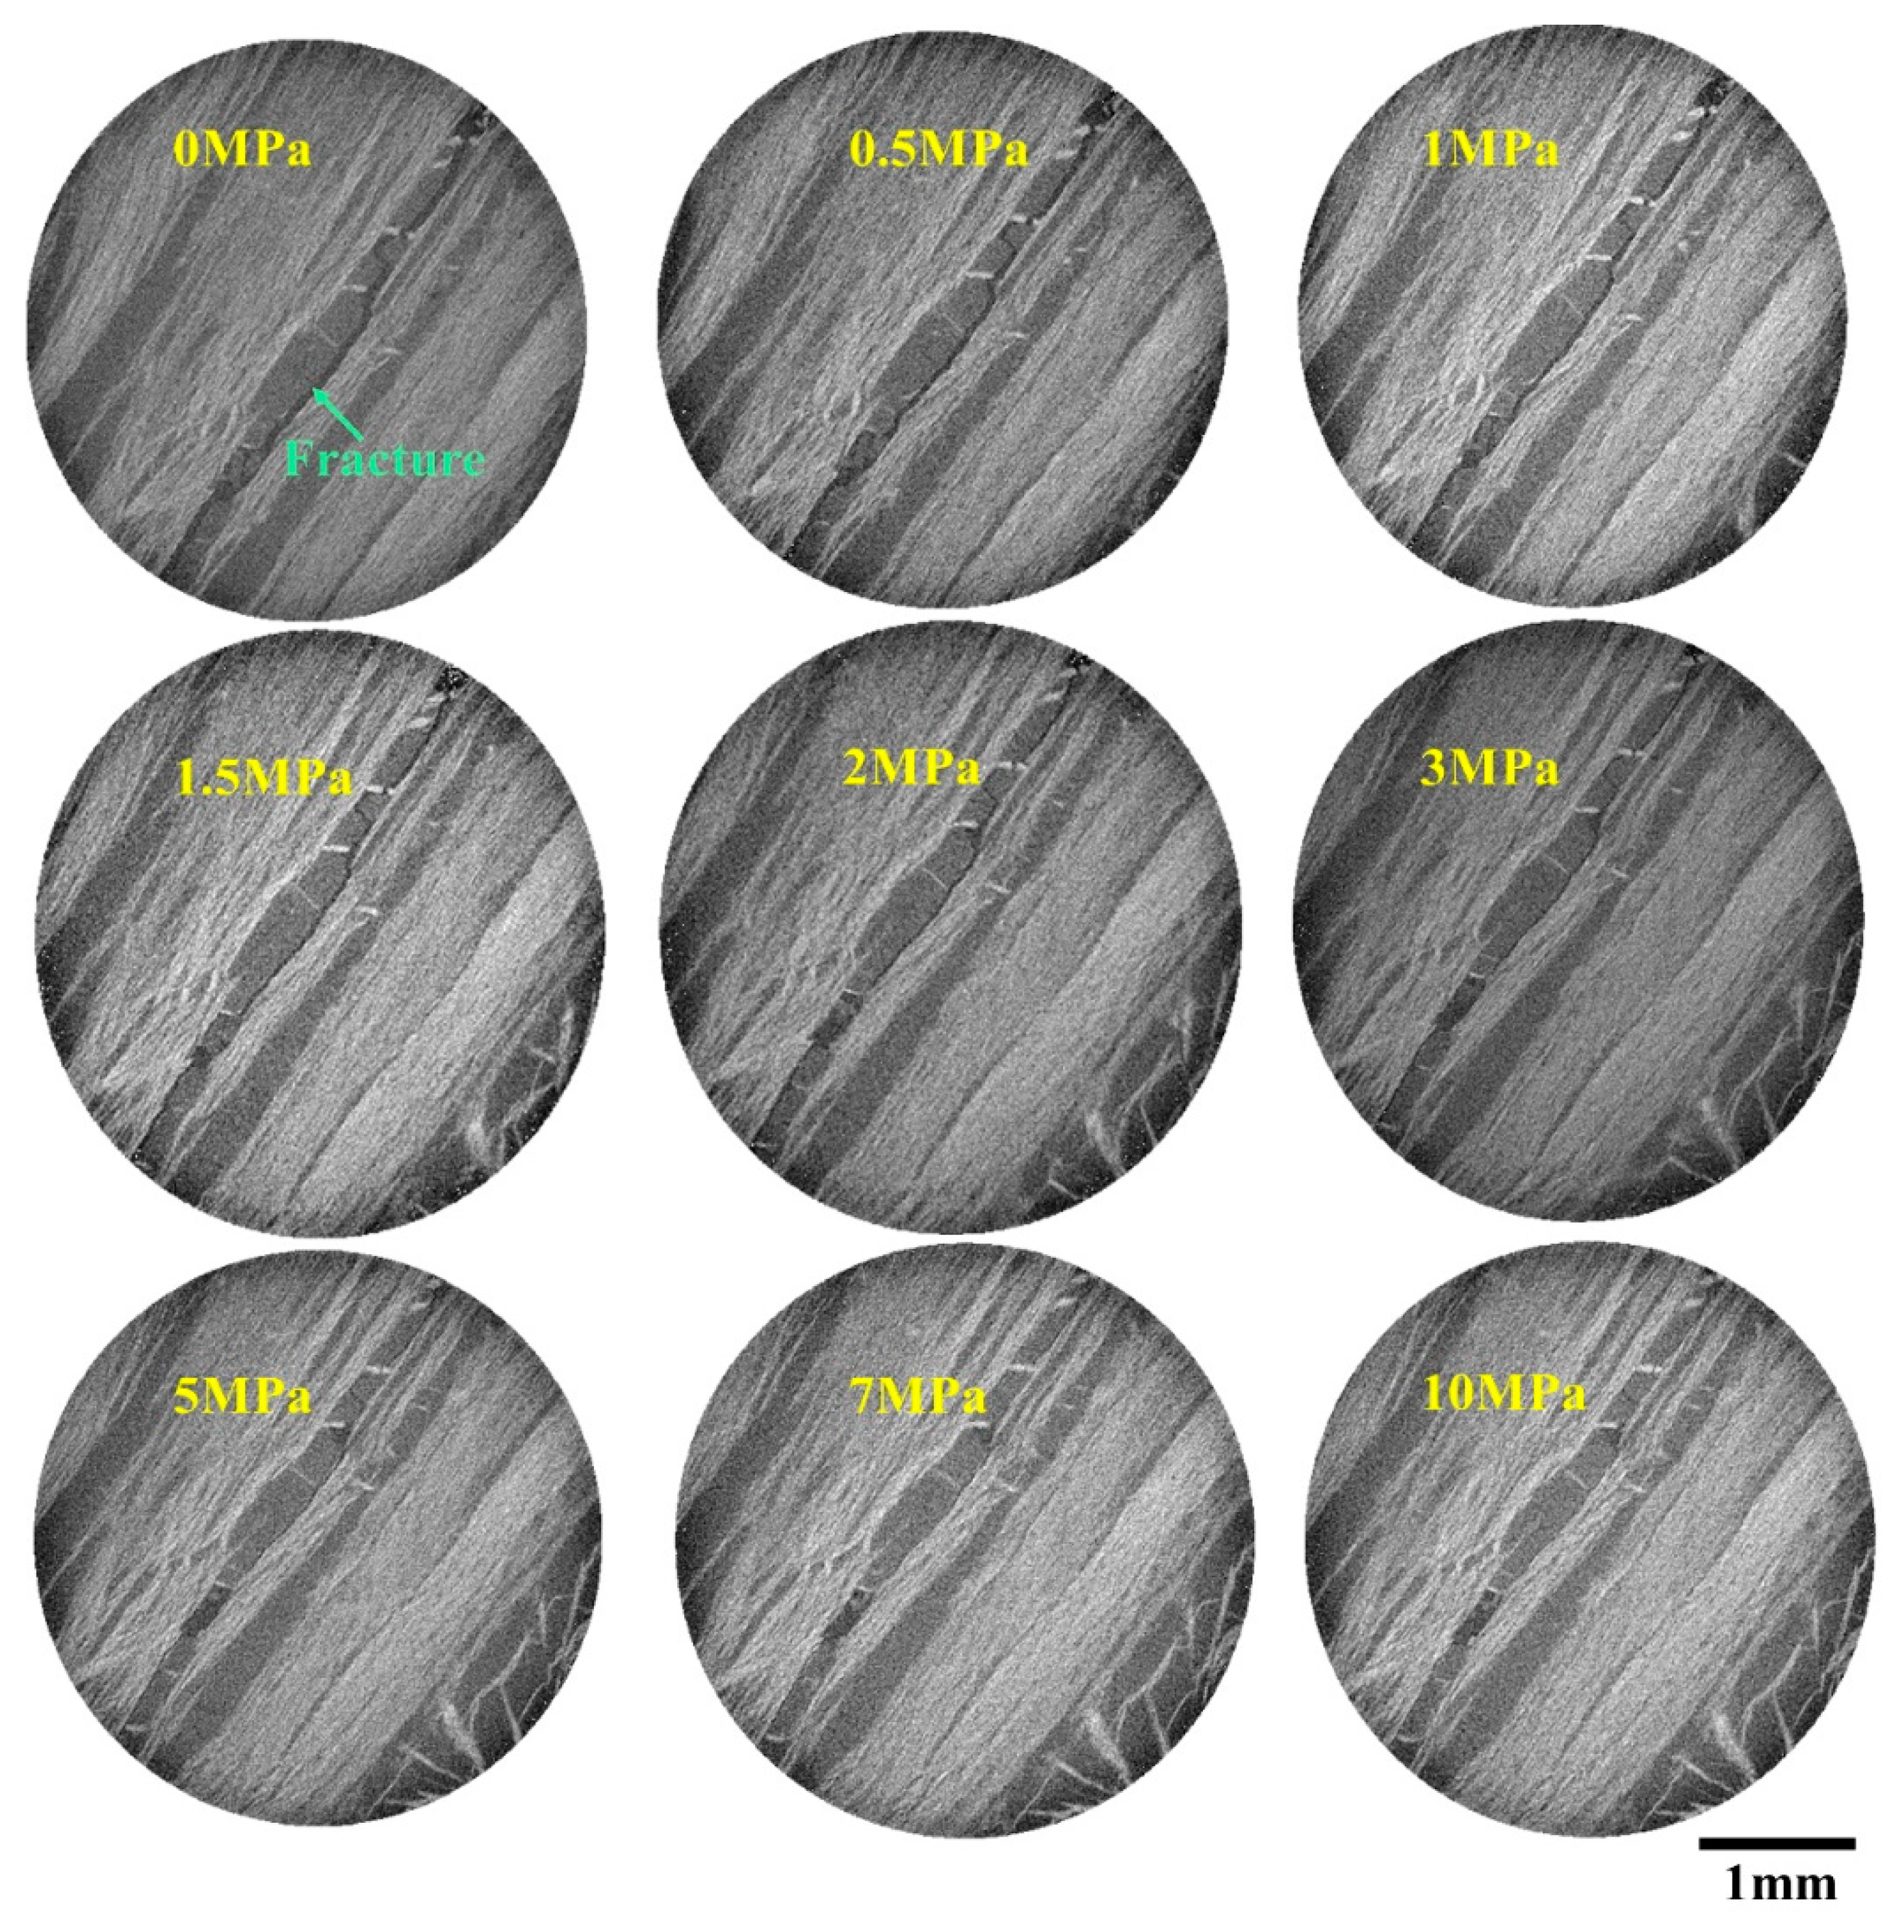
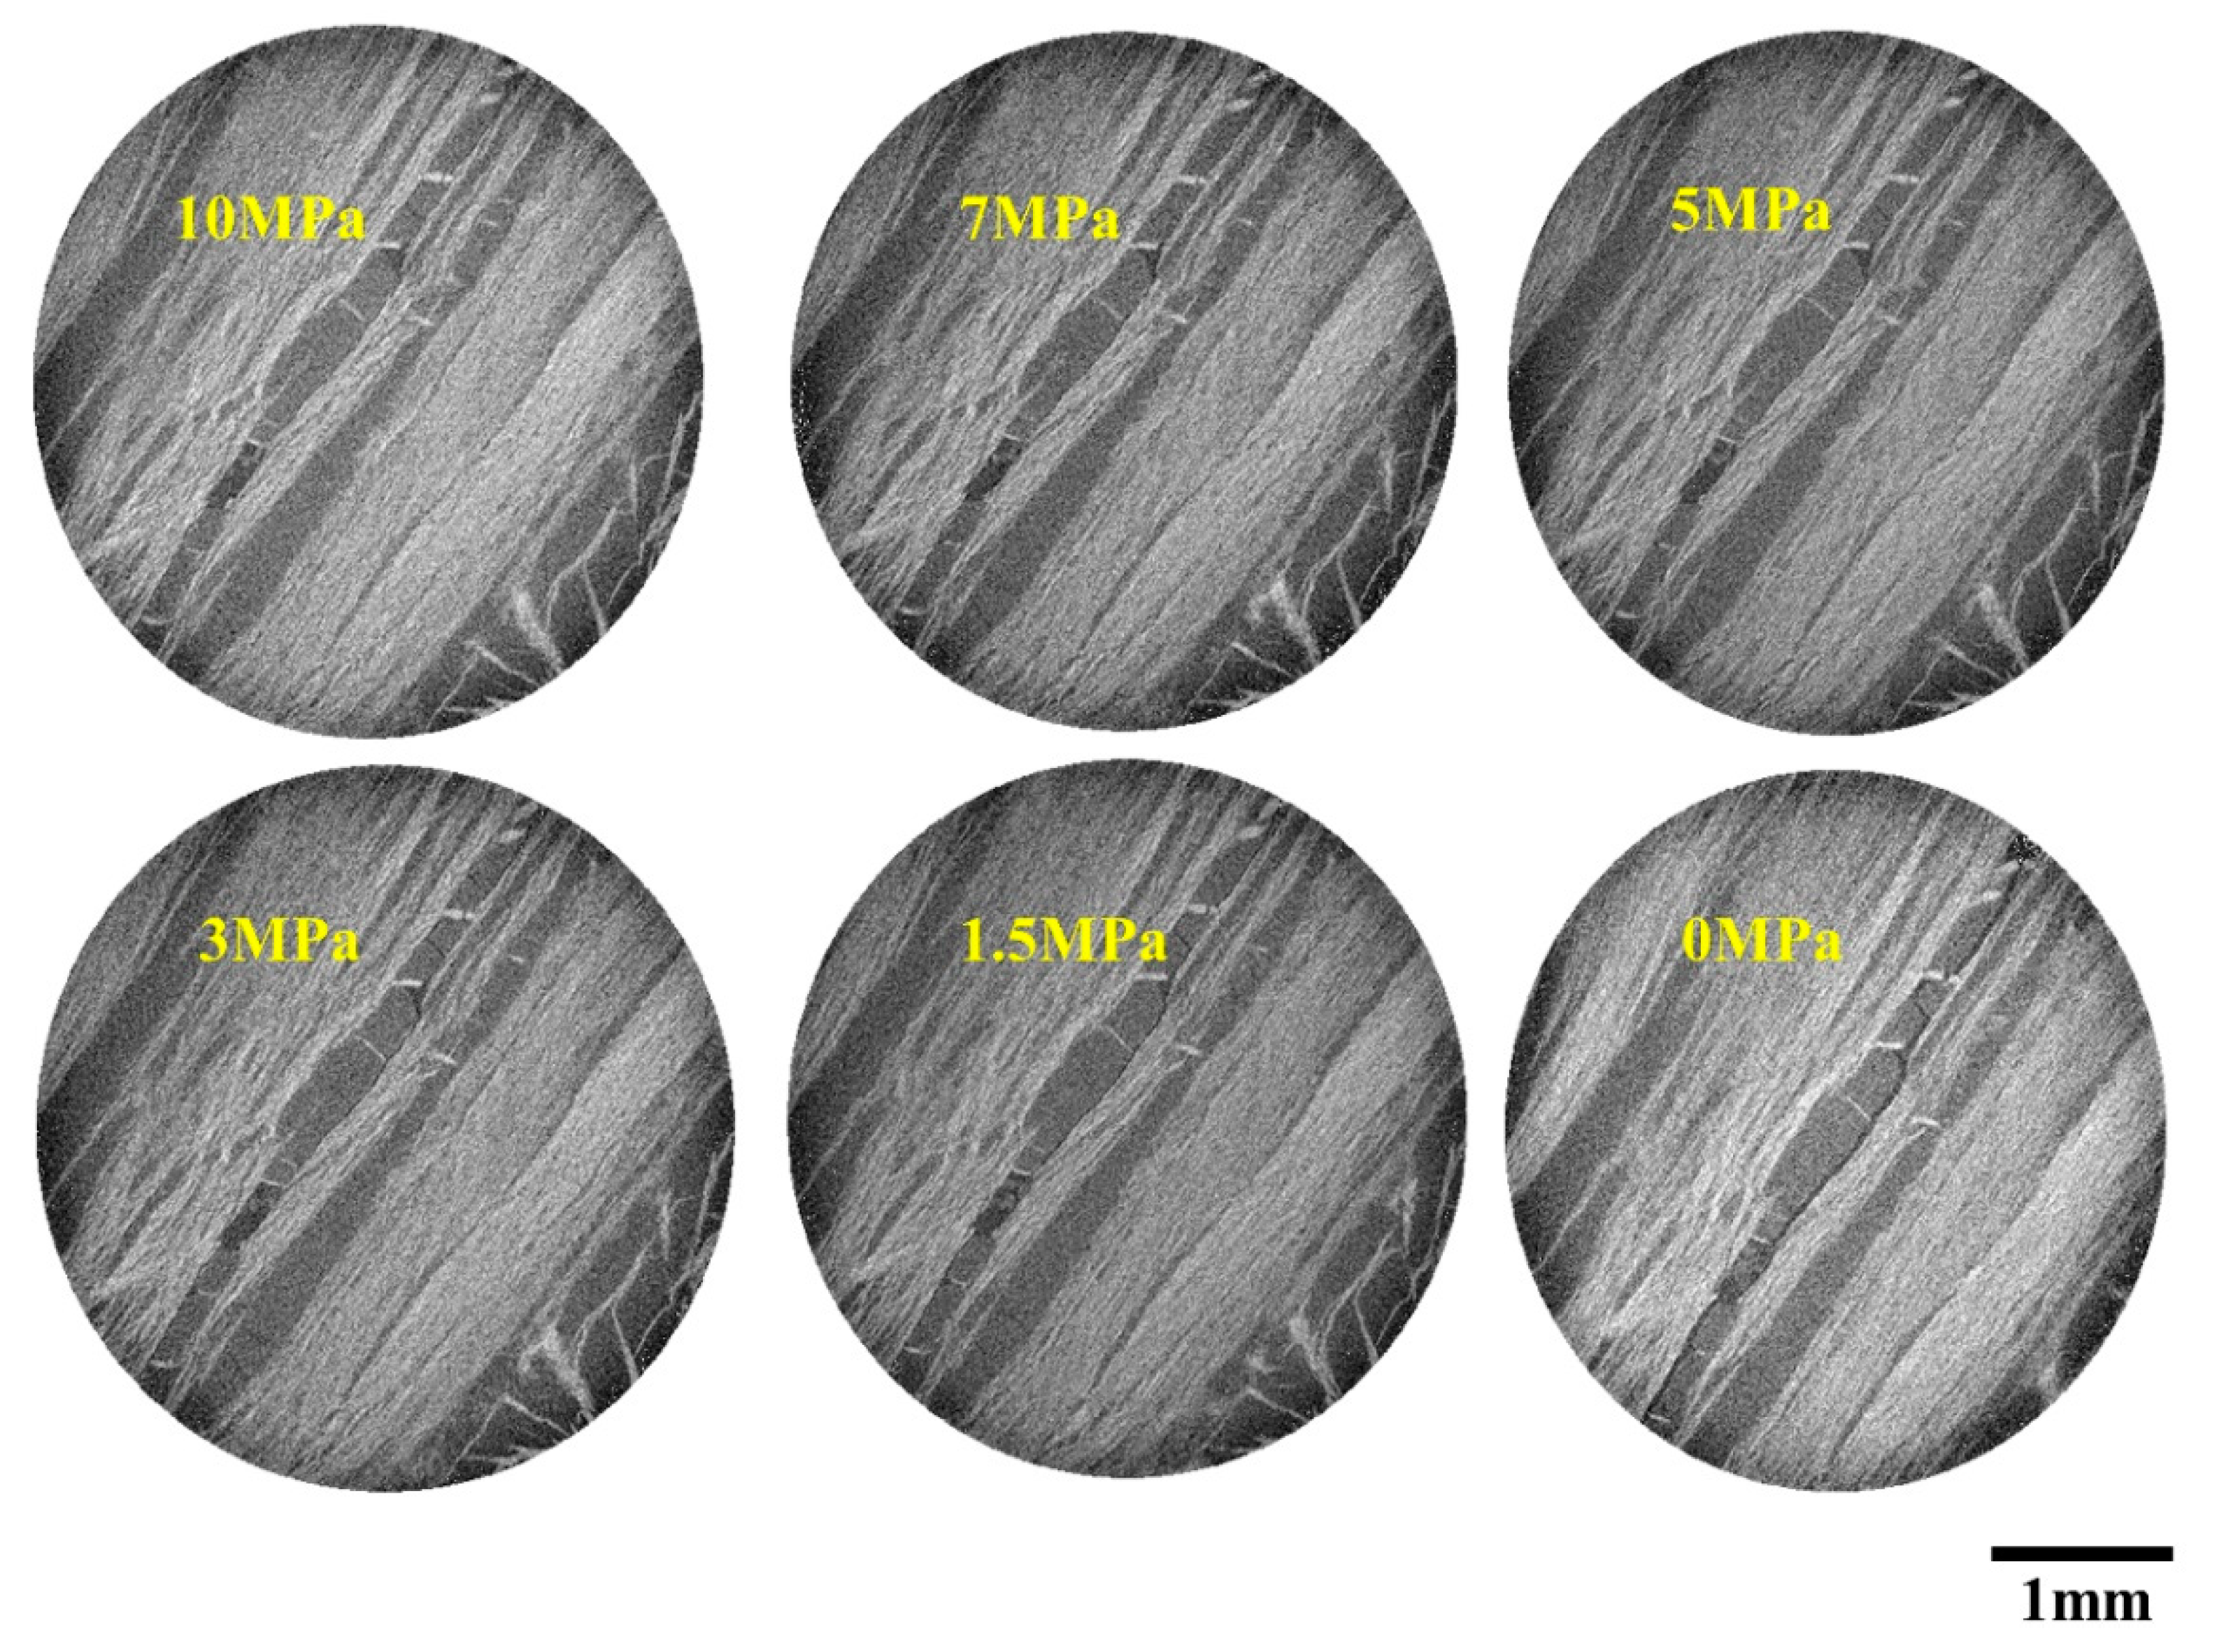
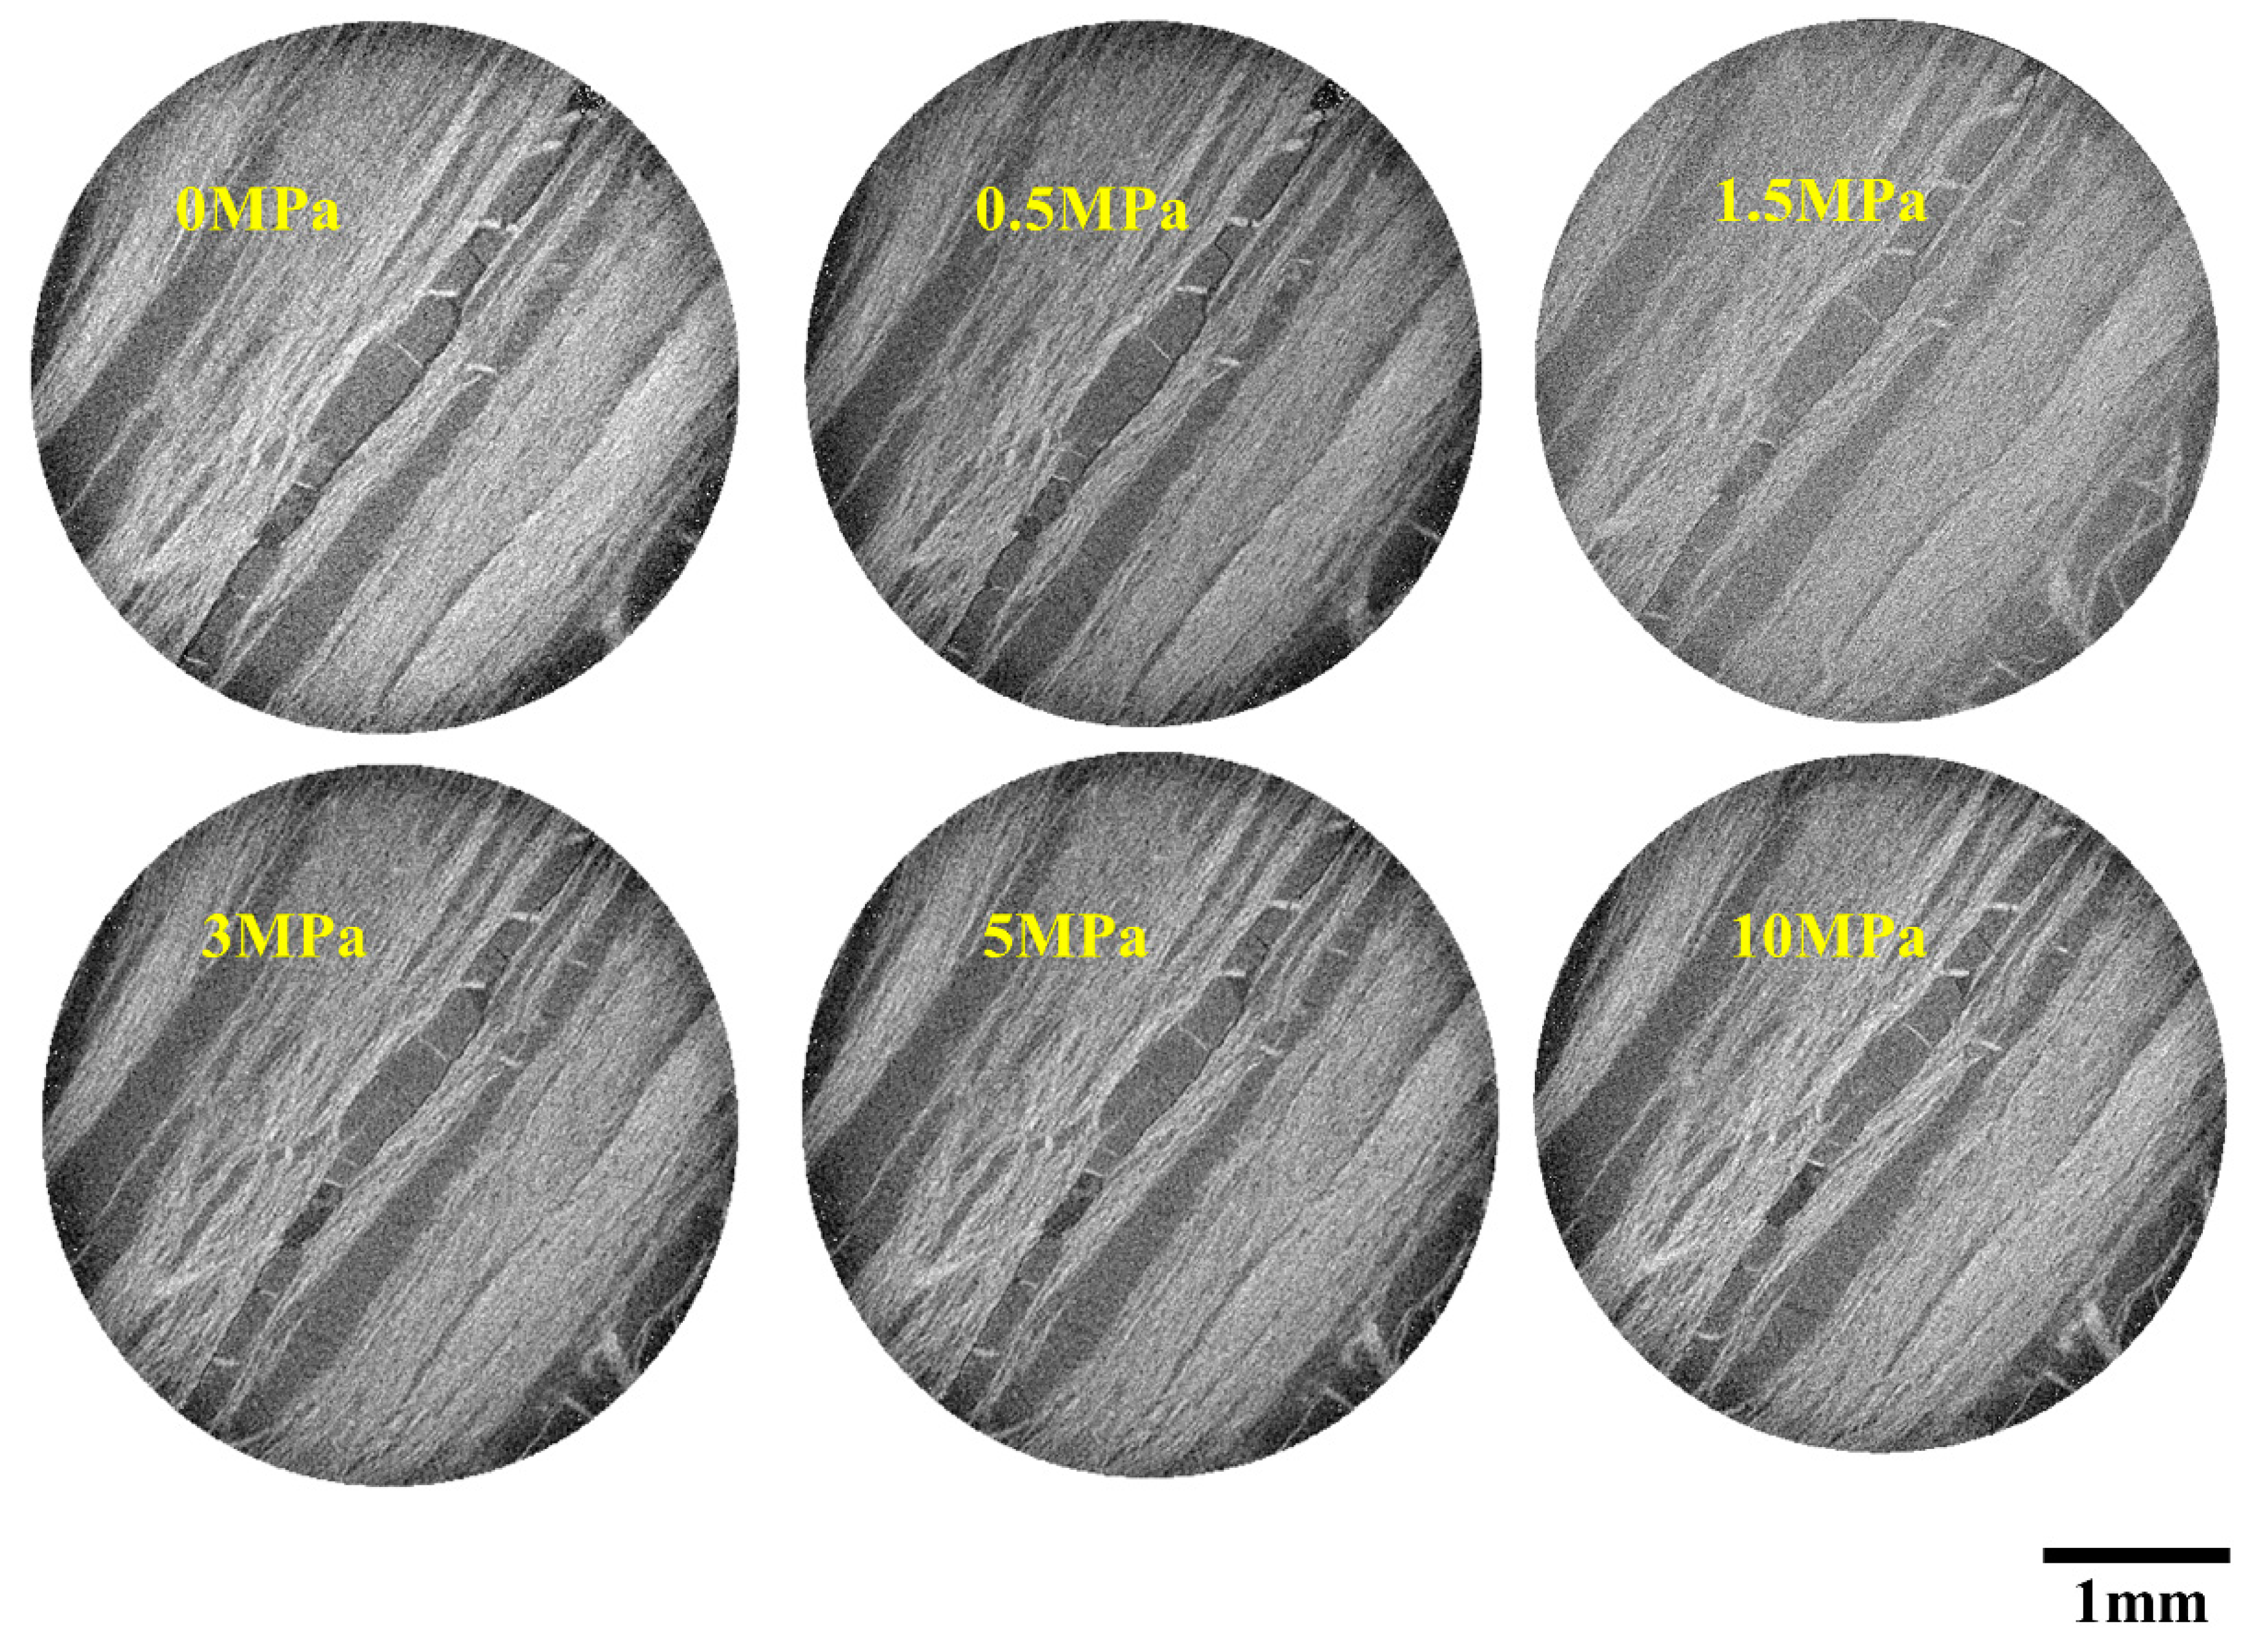
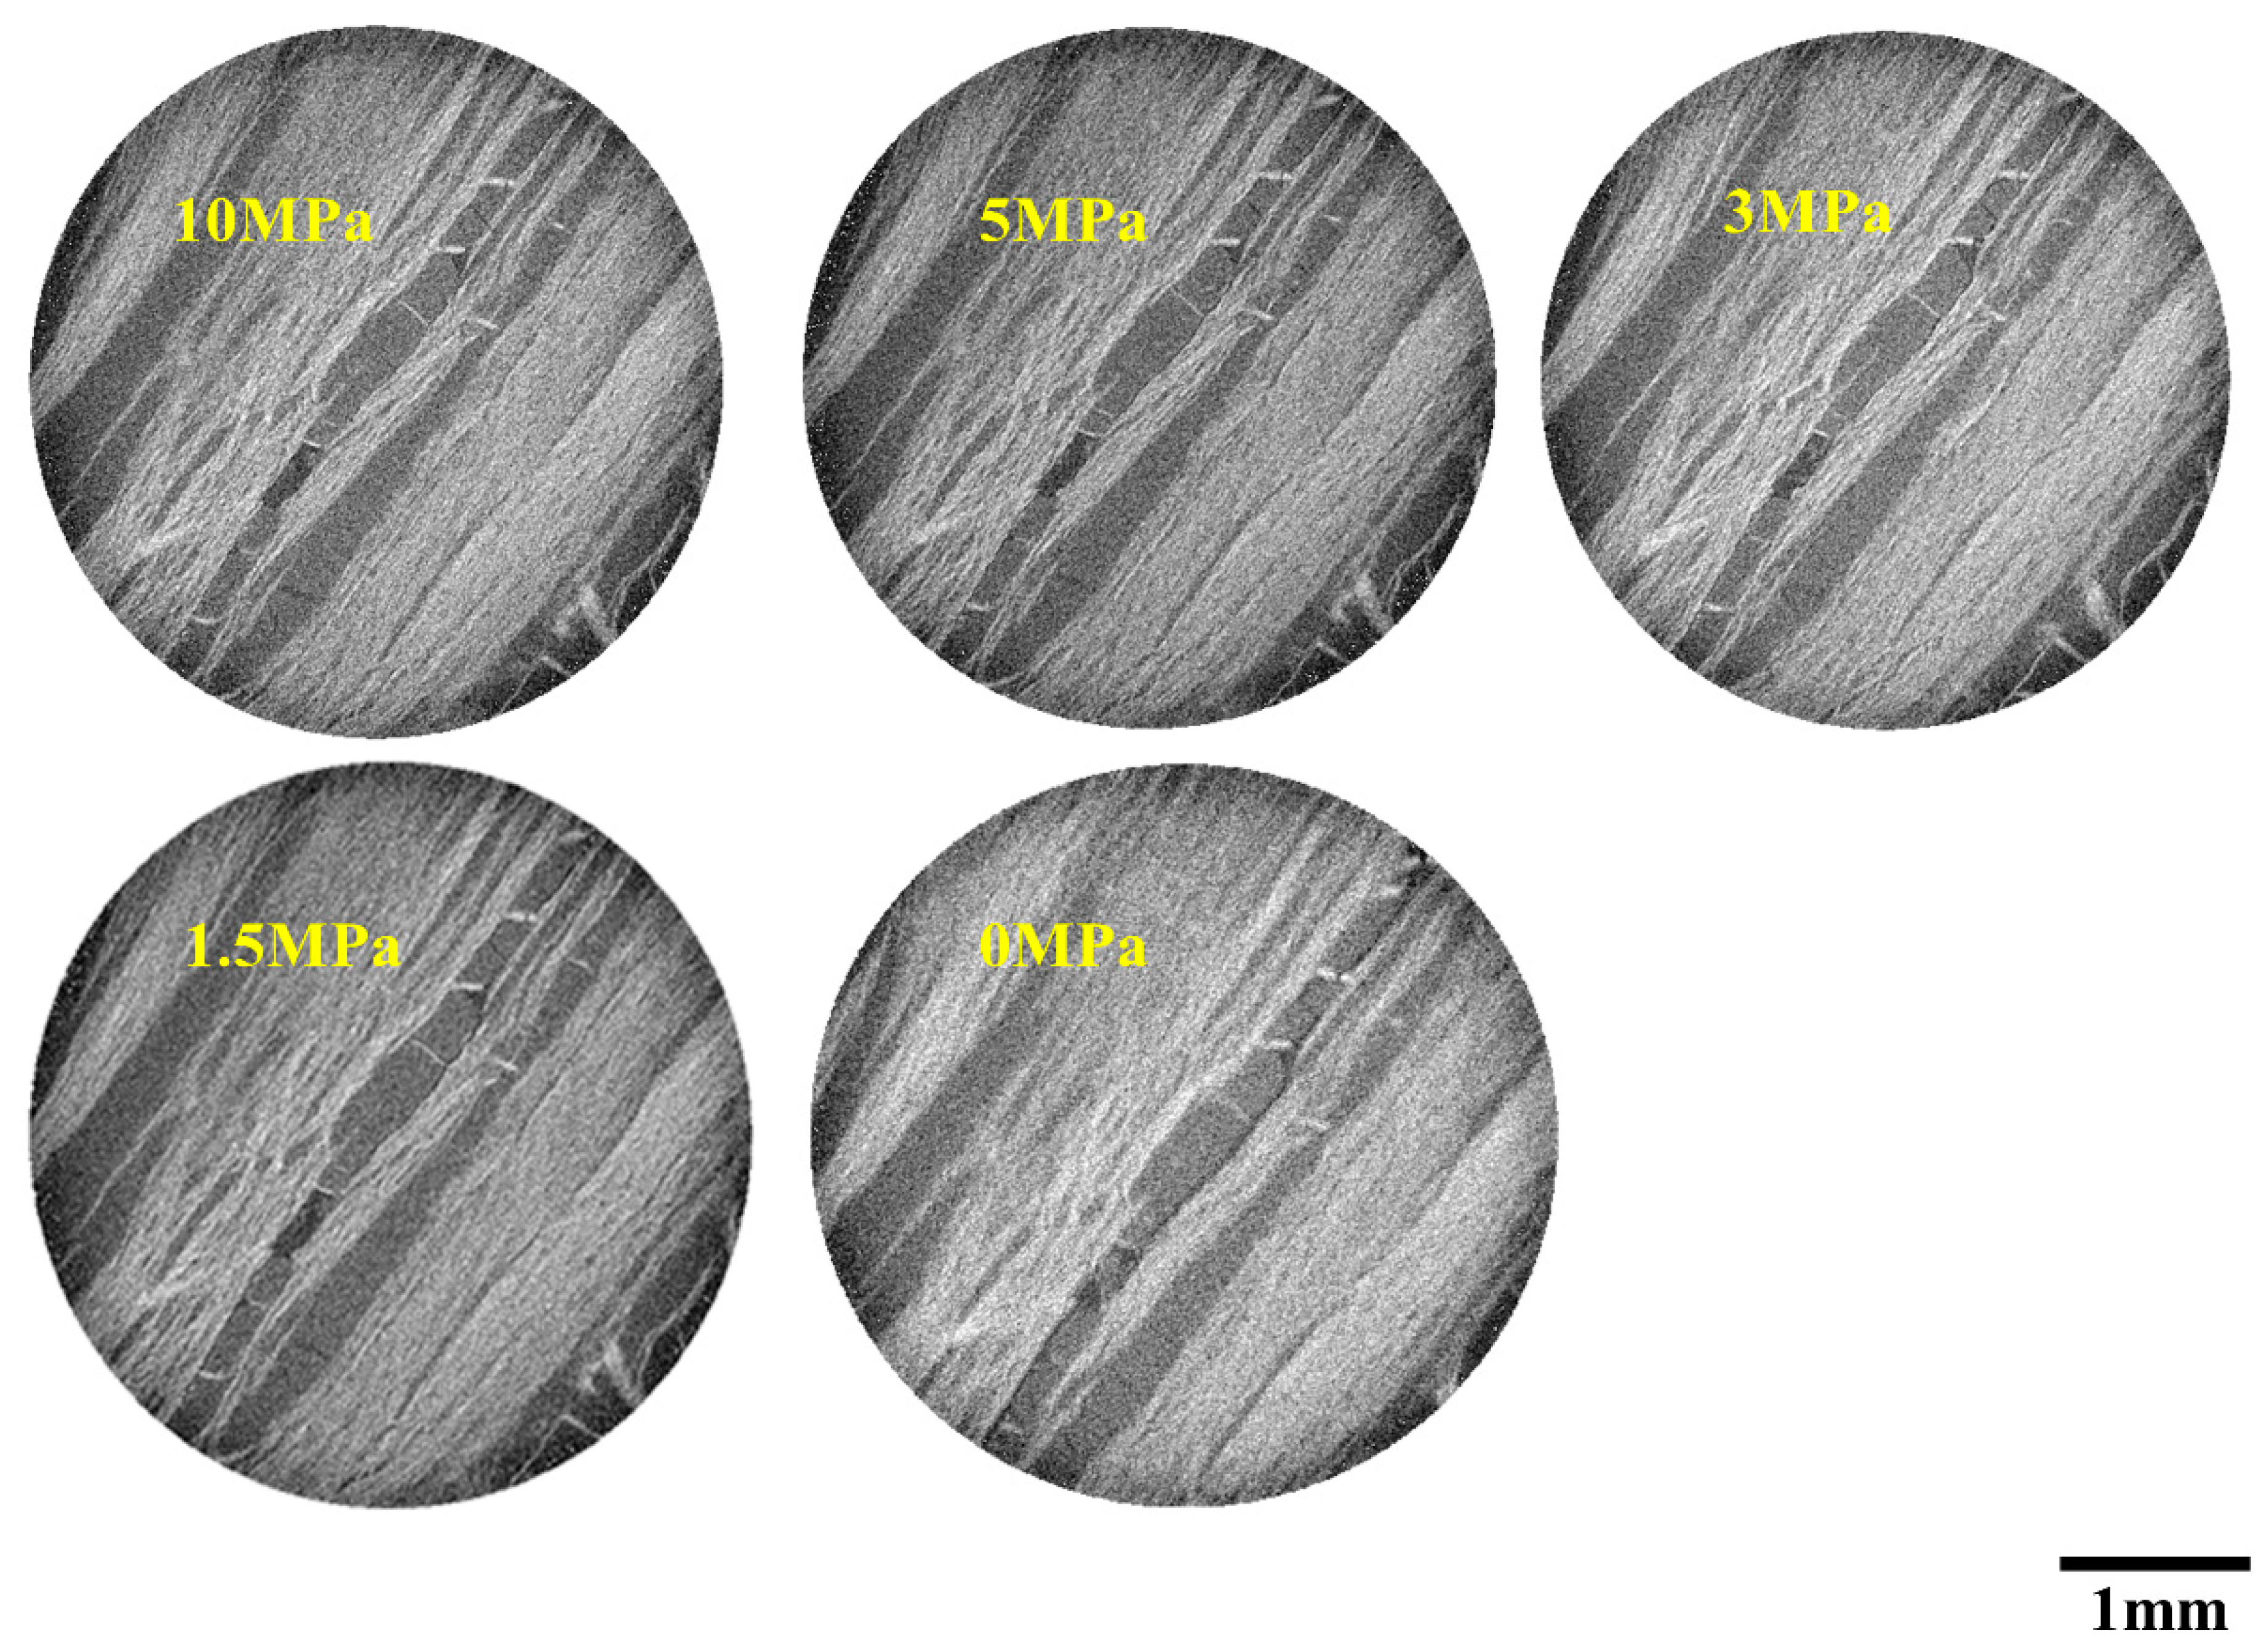
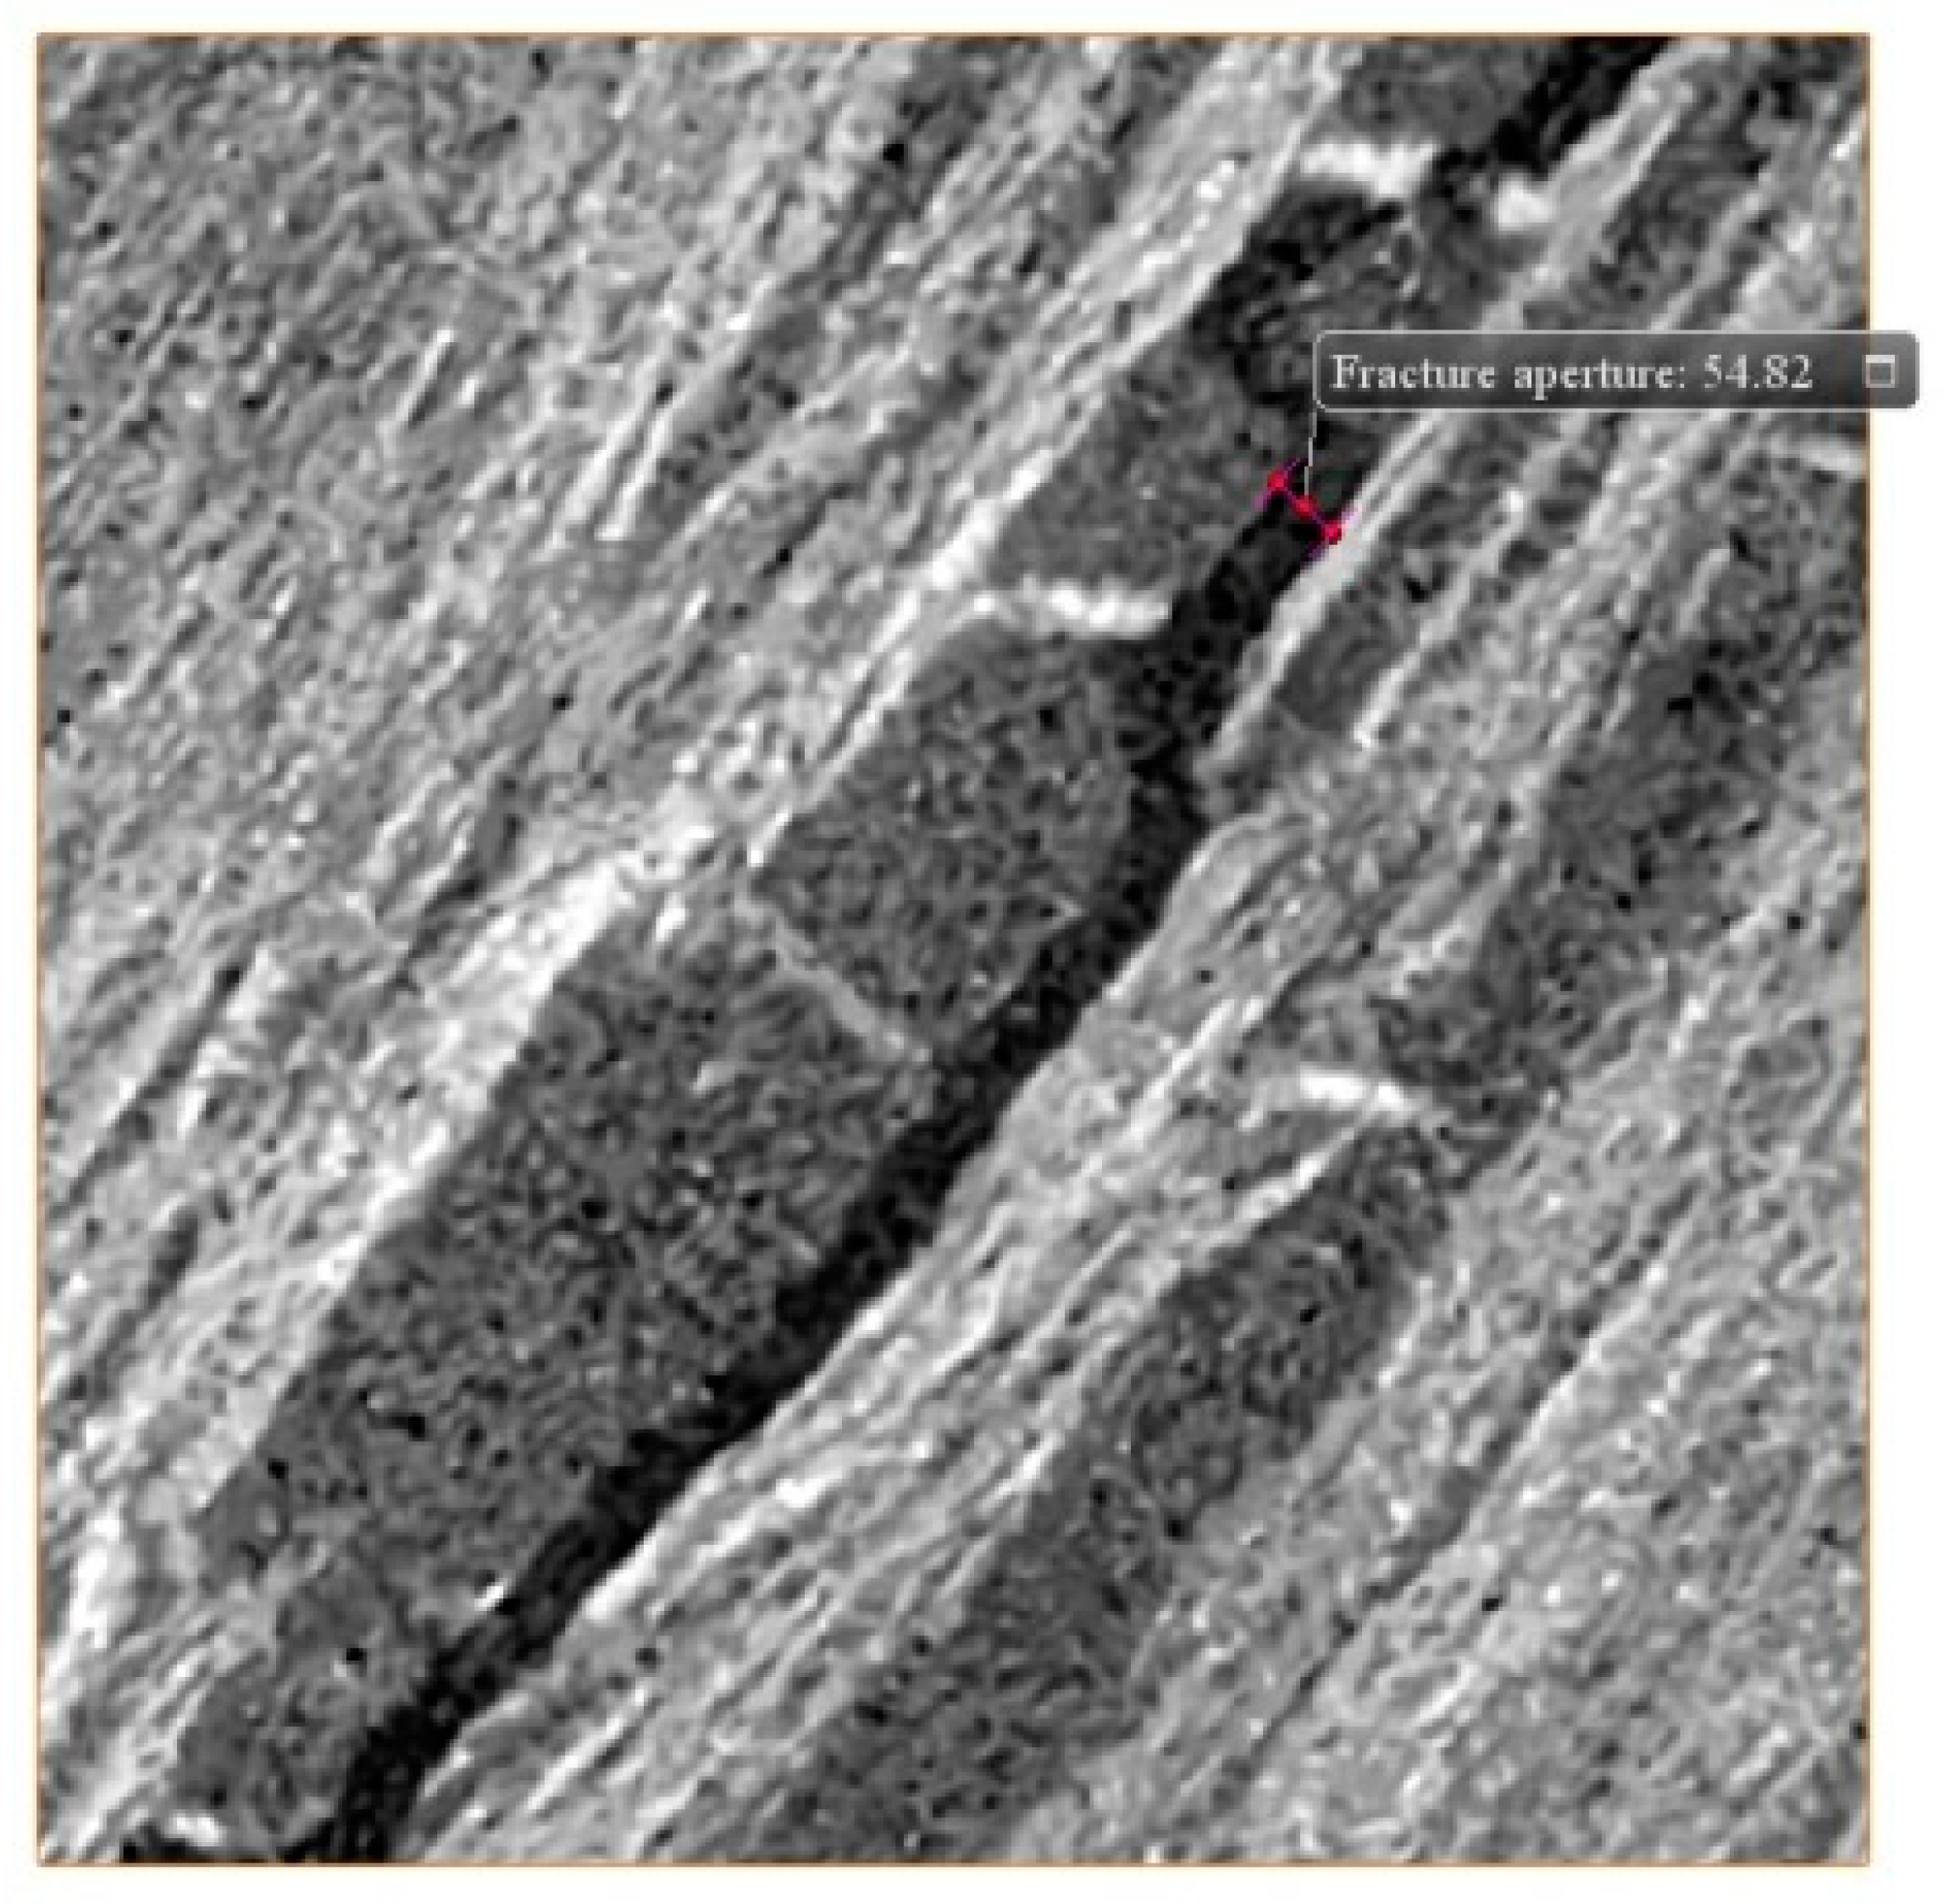
Firstly, the fractures in the same position of two cycles after image processing are compared, as displayed in Figure 5, Figure 6, Figure 7 and Figure 8. Notably, the fracture structure changes significantly under cyclic confining pressure. Then, the quantitative characterization of fracture aperture is carried out, namely, the fracture apertures at a fixed position under different confining pressures in two cycles are measured. Figure 9 displays the measurement position and the result of 0 MPa of loading stage at the first cycle.
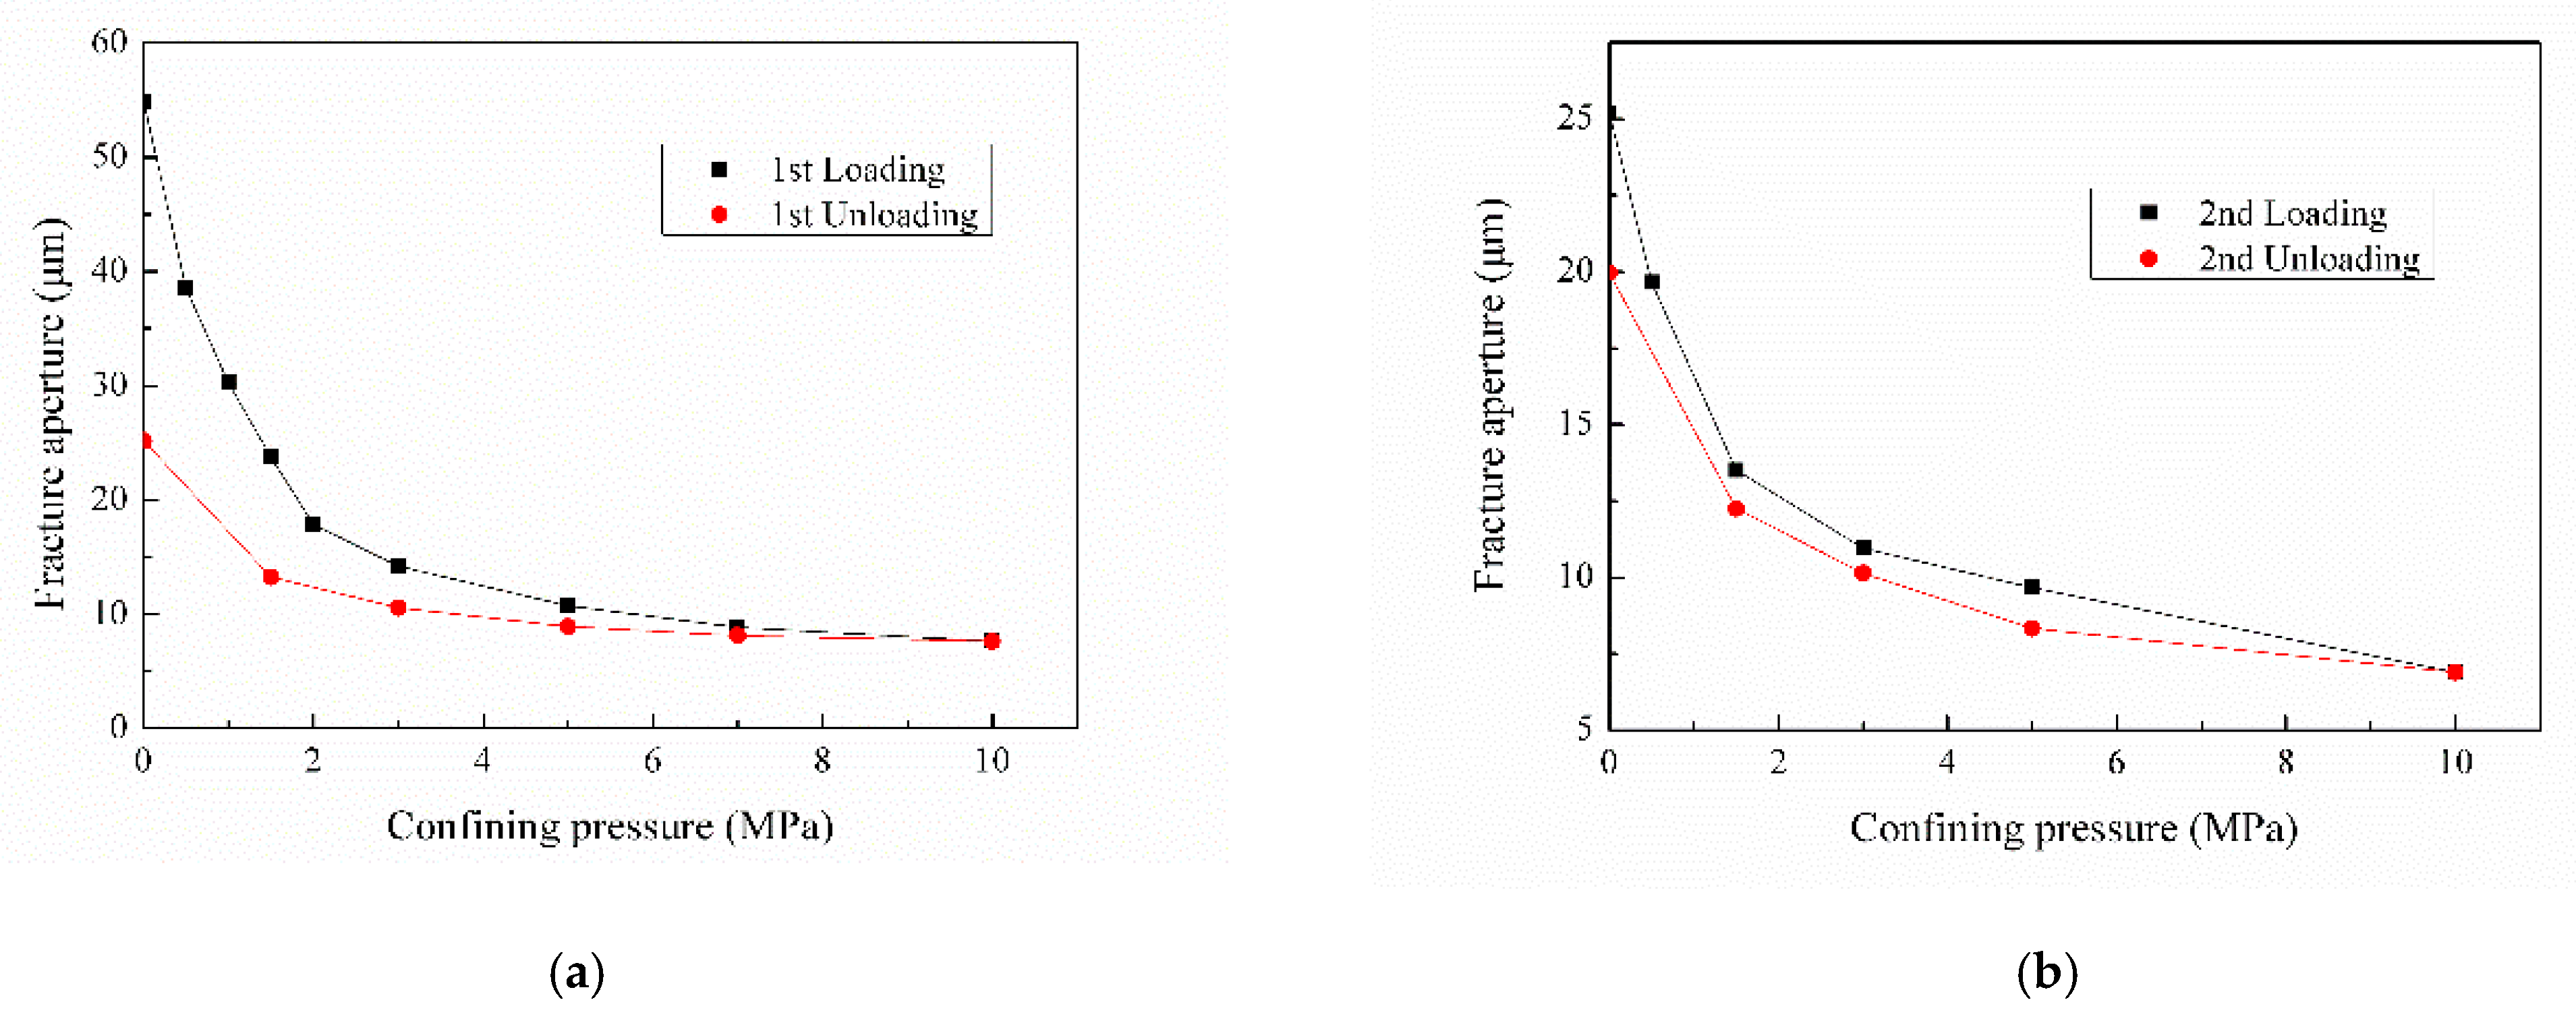
Figure 10 is drawn according to the measurement results of fracture aperture at a fixed position under different confining pressures of two cycles.
It can be clearly seen from Figure 10 that during the loading steps of the first cycle, the fracture aperture decreases significantly with the increase in confining pressure, especially from 0 MPa to 1.5 MPa. After 1.5 MPa, although the fracture aperture gradually decreases, the change range is still small, that is, the deformation of the artificial fracture is stronger in the low effective stress stage. The conclusion of this part is consistent with that of other scholars [20,41,42]. When the confining pressure is increased to 10 MPa, part of the fracture area has been obviously contacted, that is, the fracture is closed. However, it is interesting that the pore area connected with the fracture has no obvious change in the whole confining pressure change stage.
In the unloading stage, similarly, the change range of fracture aperture is larger in the low effective stress stage. However, the fracture aperture at 0 MPa is much smaller than that at loading stage of the first cycle, which indicates that the damage caused by the effective stress is irreversible.
When studying the change of fracture aperture in the second cycle, we find that it is similar to that in the first cycle, as displayed in Figure 10b. The difference is that when the confining pressure drops to 0 MPa, the fracture aperture can be restored to a value close to the initial point of the second cycle loading stage. The results show that cyclic loading and unloading have a great influence on fracture aperture, and the first cycle will seriously affect the fracture aperture.
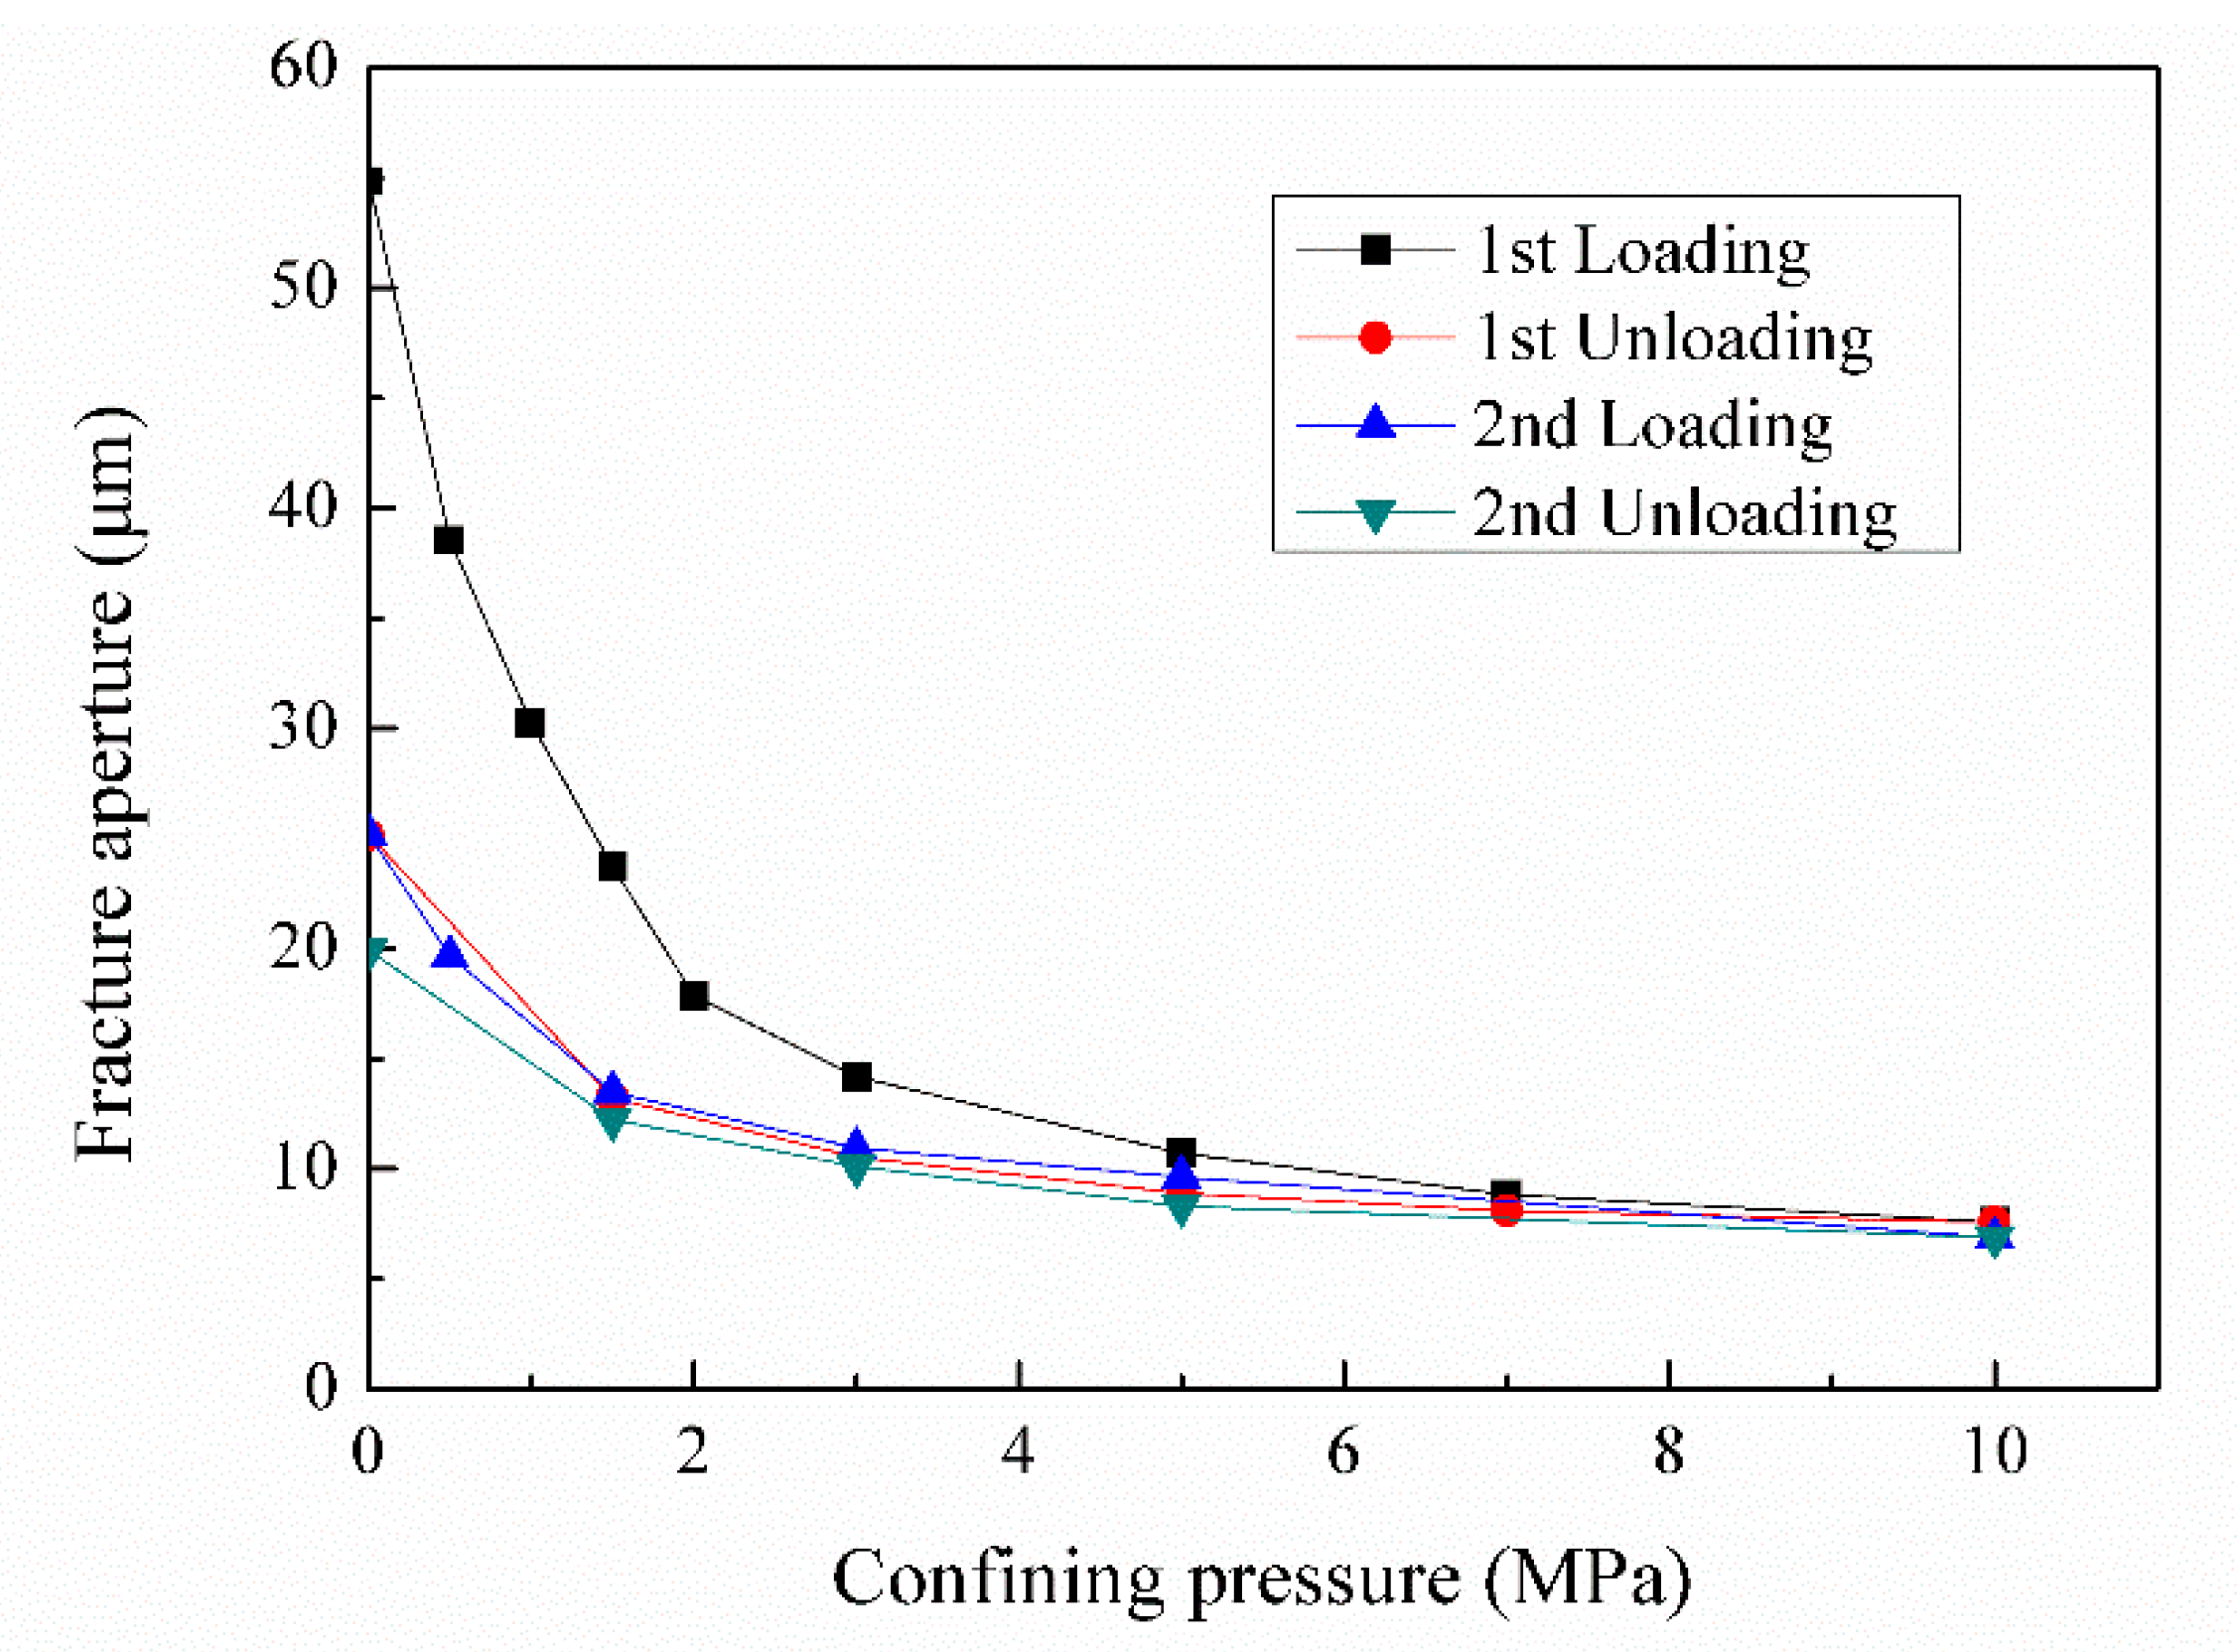
An interesting phenomenon can be seen by placing the change of the fracture aperture of two cycles in the same graph, as shown in Figure 11. It can be seen that the change of fracture aperture in the second cycle is close to the first cycle unloading curve. That is, the first cycle loading makes the fracture structure have certain elastic characteristics.
3.2. LBM Simulation Results
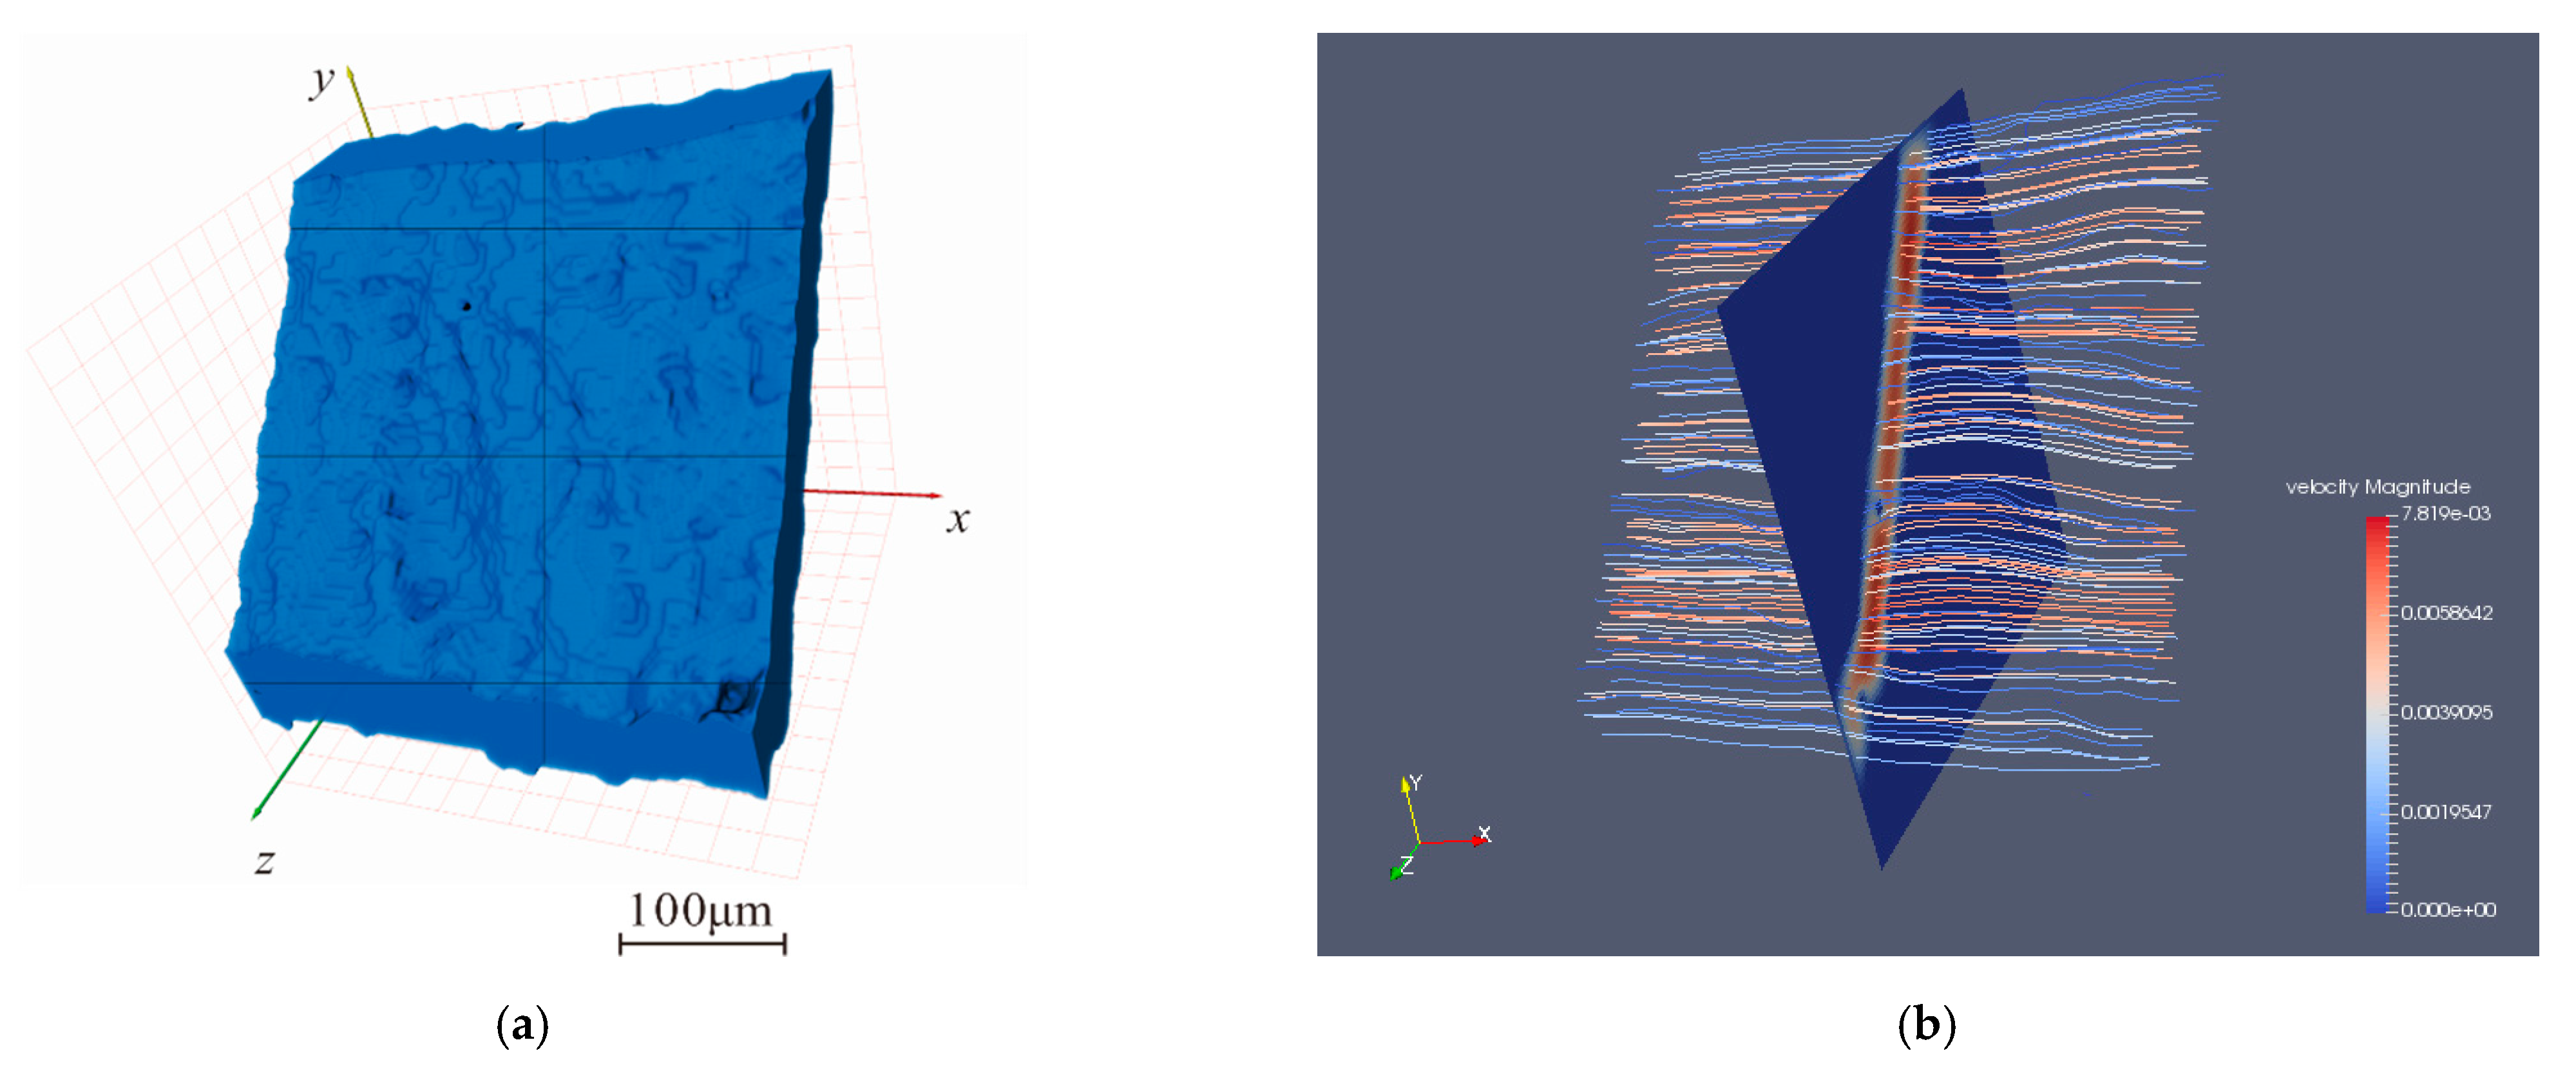
Based on the digital core obtained before, dimensionless permeability of fracture under different confining pressure can be obtained through LBM simulation. Moreover, to shorten the image processing time and flow simulation time, we extract the fracture area as shown in Figure 12a. In other words, the permeability calculated later is not the permeability of the whole digital core, but the permeability of the fractured area intercepted.
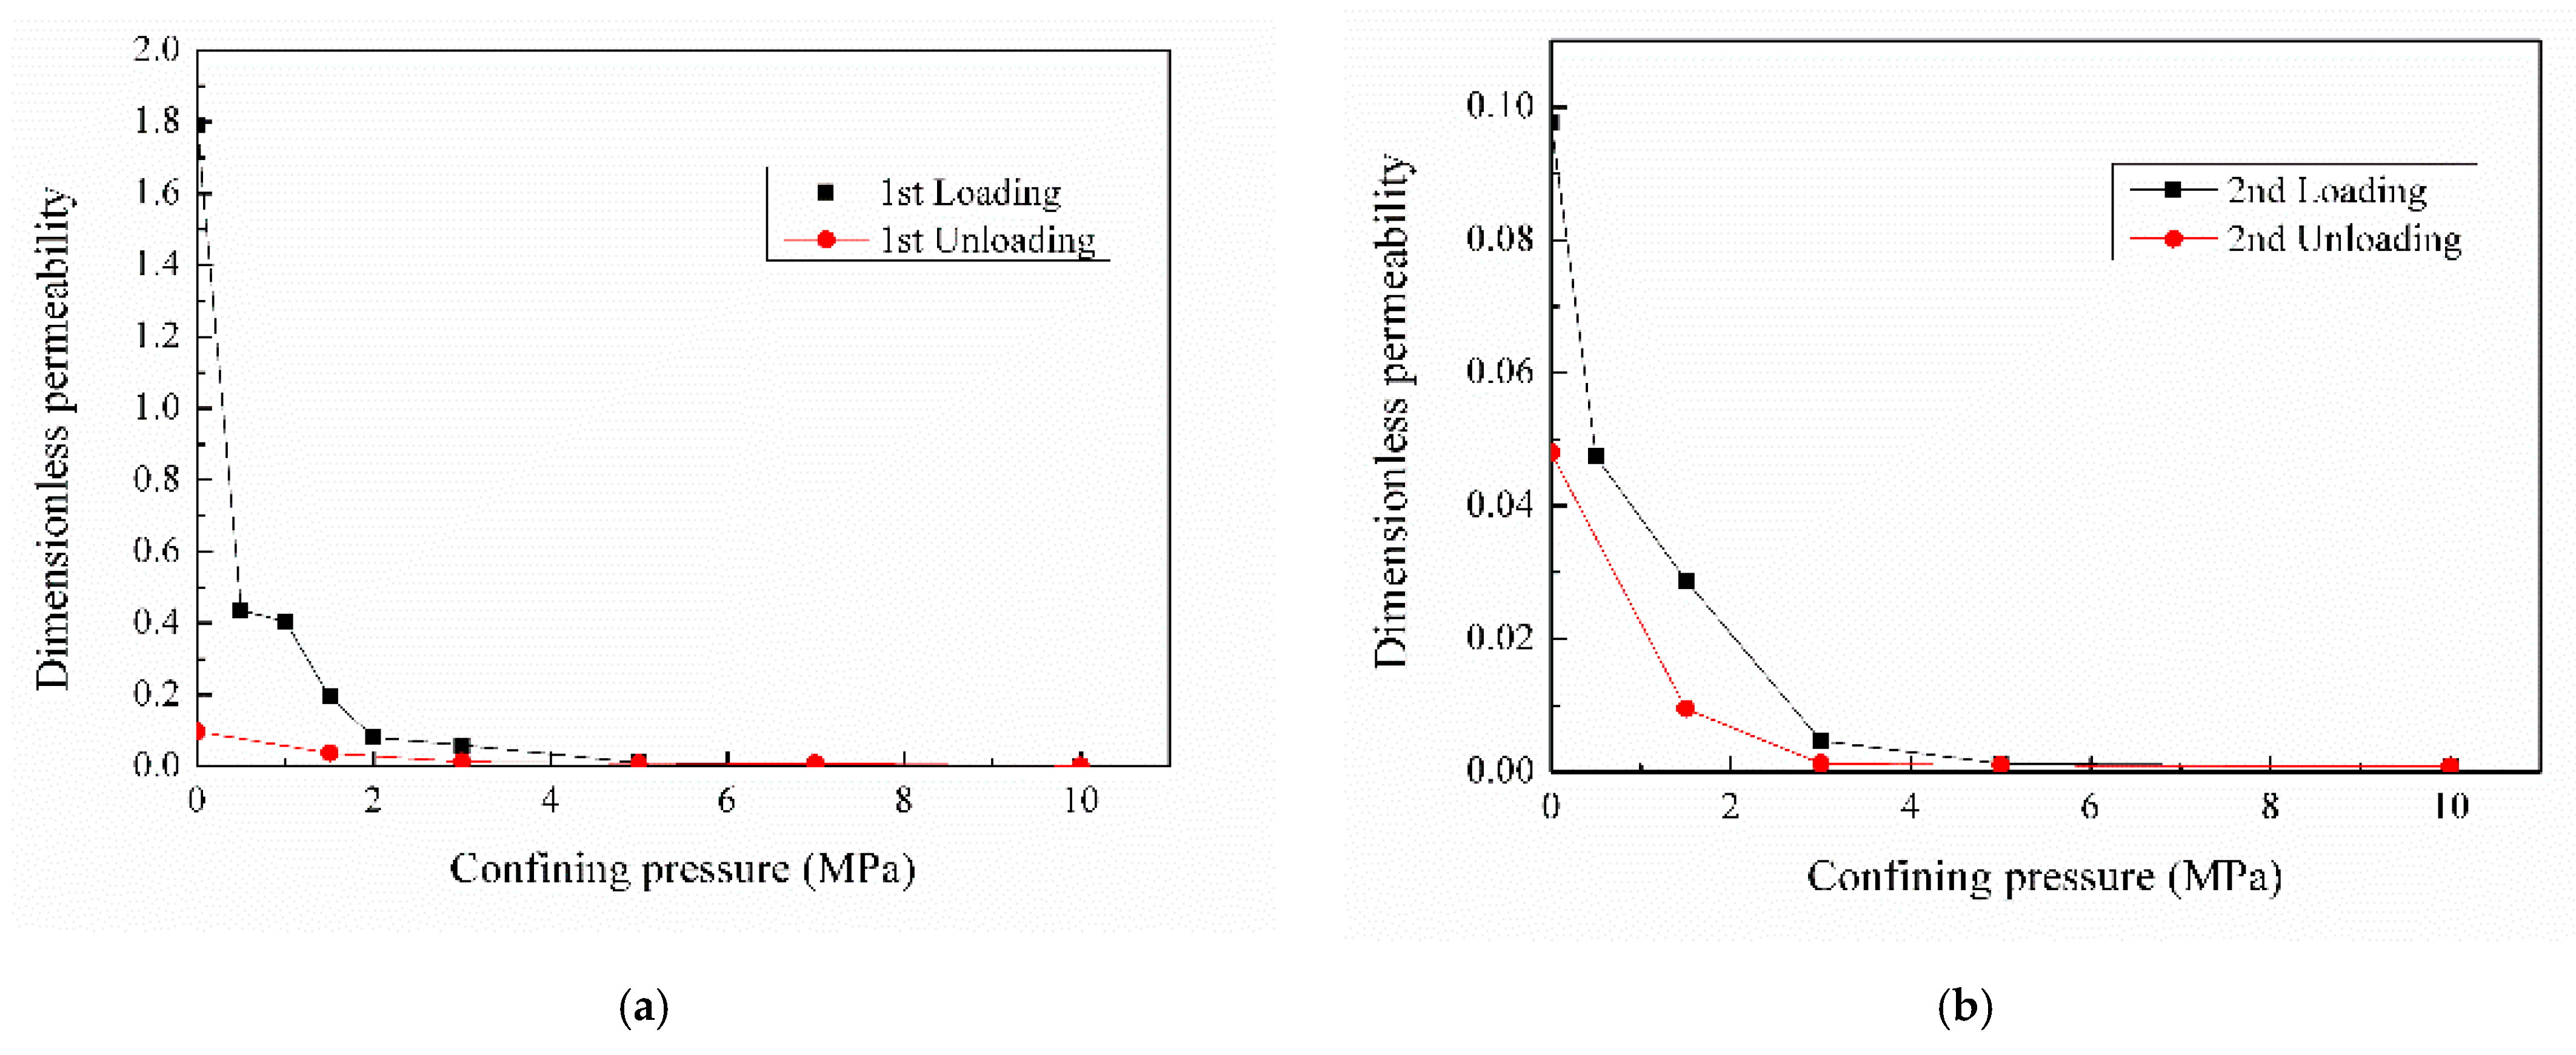
The digital core and streamlines of the first 0 MPa are shown in Figure 12. Based on the data simulated by LBM, the relationship between fracture permeability and cyclic effective stress can be obtained, as shown in Figure 13.
The following result can be obtained from Figure 13: the variation of permeability with cyclic stress is similar to that of fracture aperture with cyclic stress. In other words, under low effective stress, the fracture permeability decreases faster, and the influence of the first cycle on the core permeability is more severe. In Figure 13a, when the confining pressure is reduced to 0 MPa, the dimensionless permeability is only 0.333, which is 94.6% lower than that of 6.112 at the initial time (0 MPa) of the loading stage. This result indicates that coal sample 2–5 is strongly sensitive to stress in the first cycle. In the second cycle, it is found that the permeability decreases by 50.8% at 0 MPa, which means that the stress sensitivity is weaker than that of the first cycle.
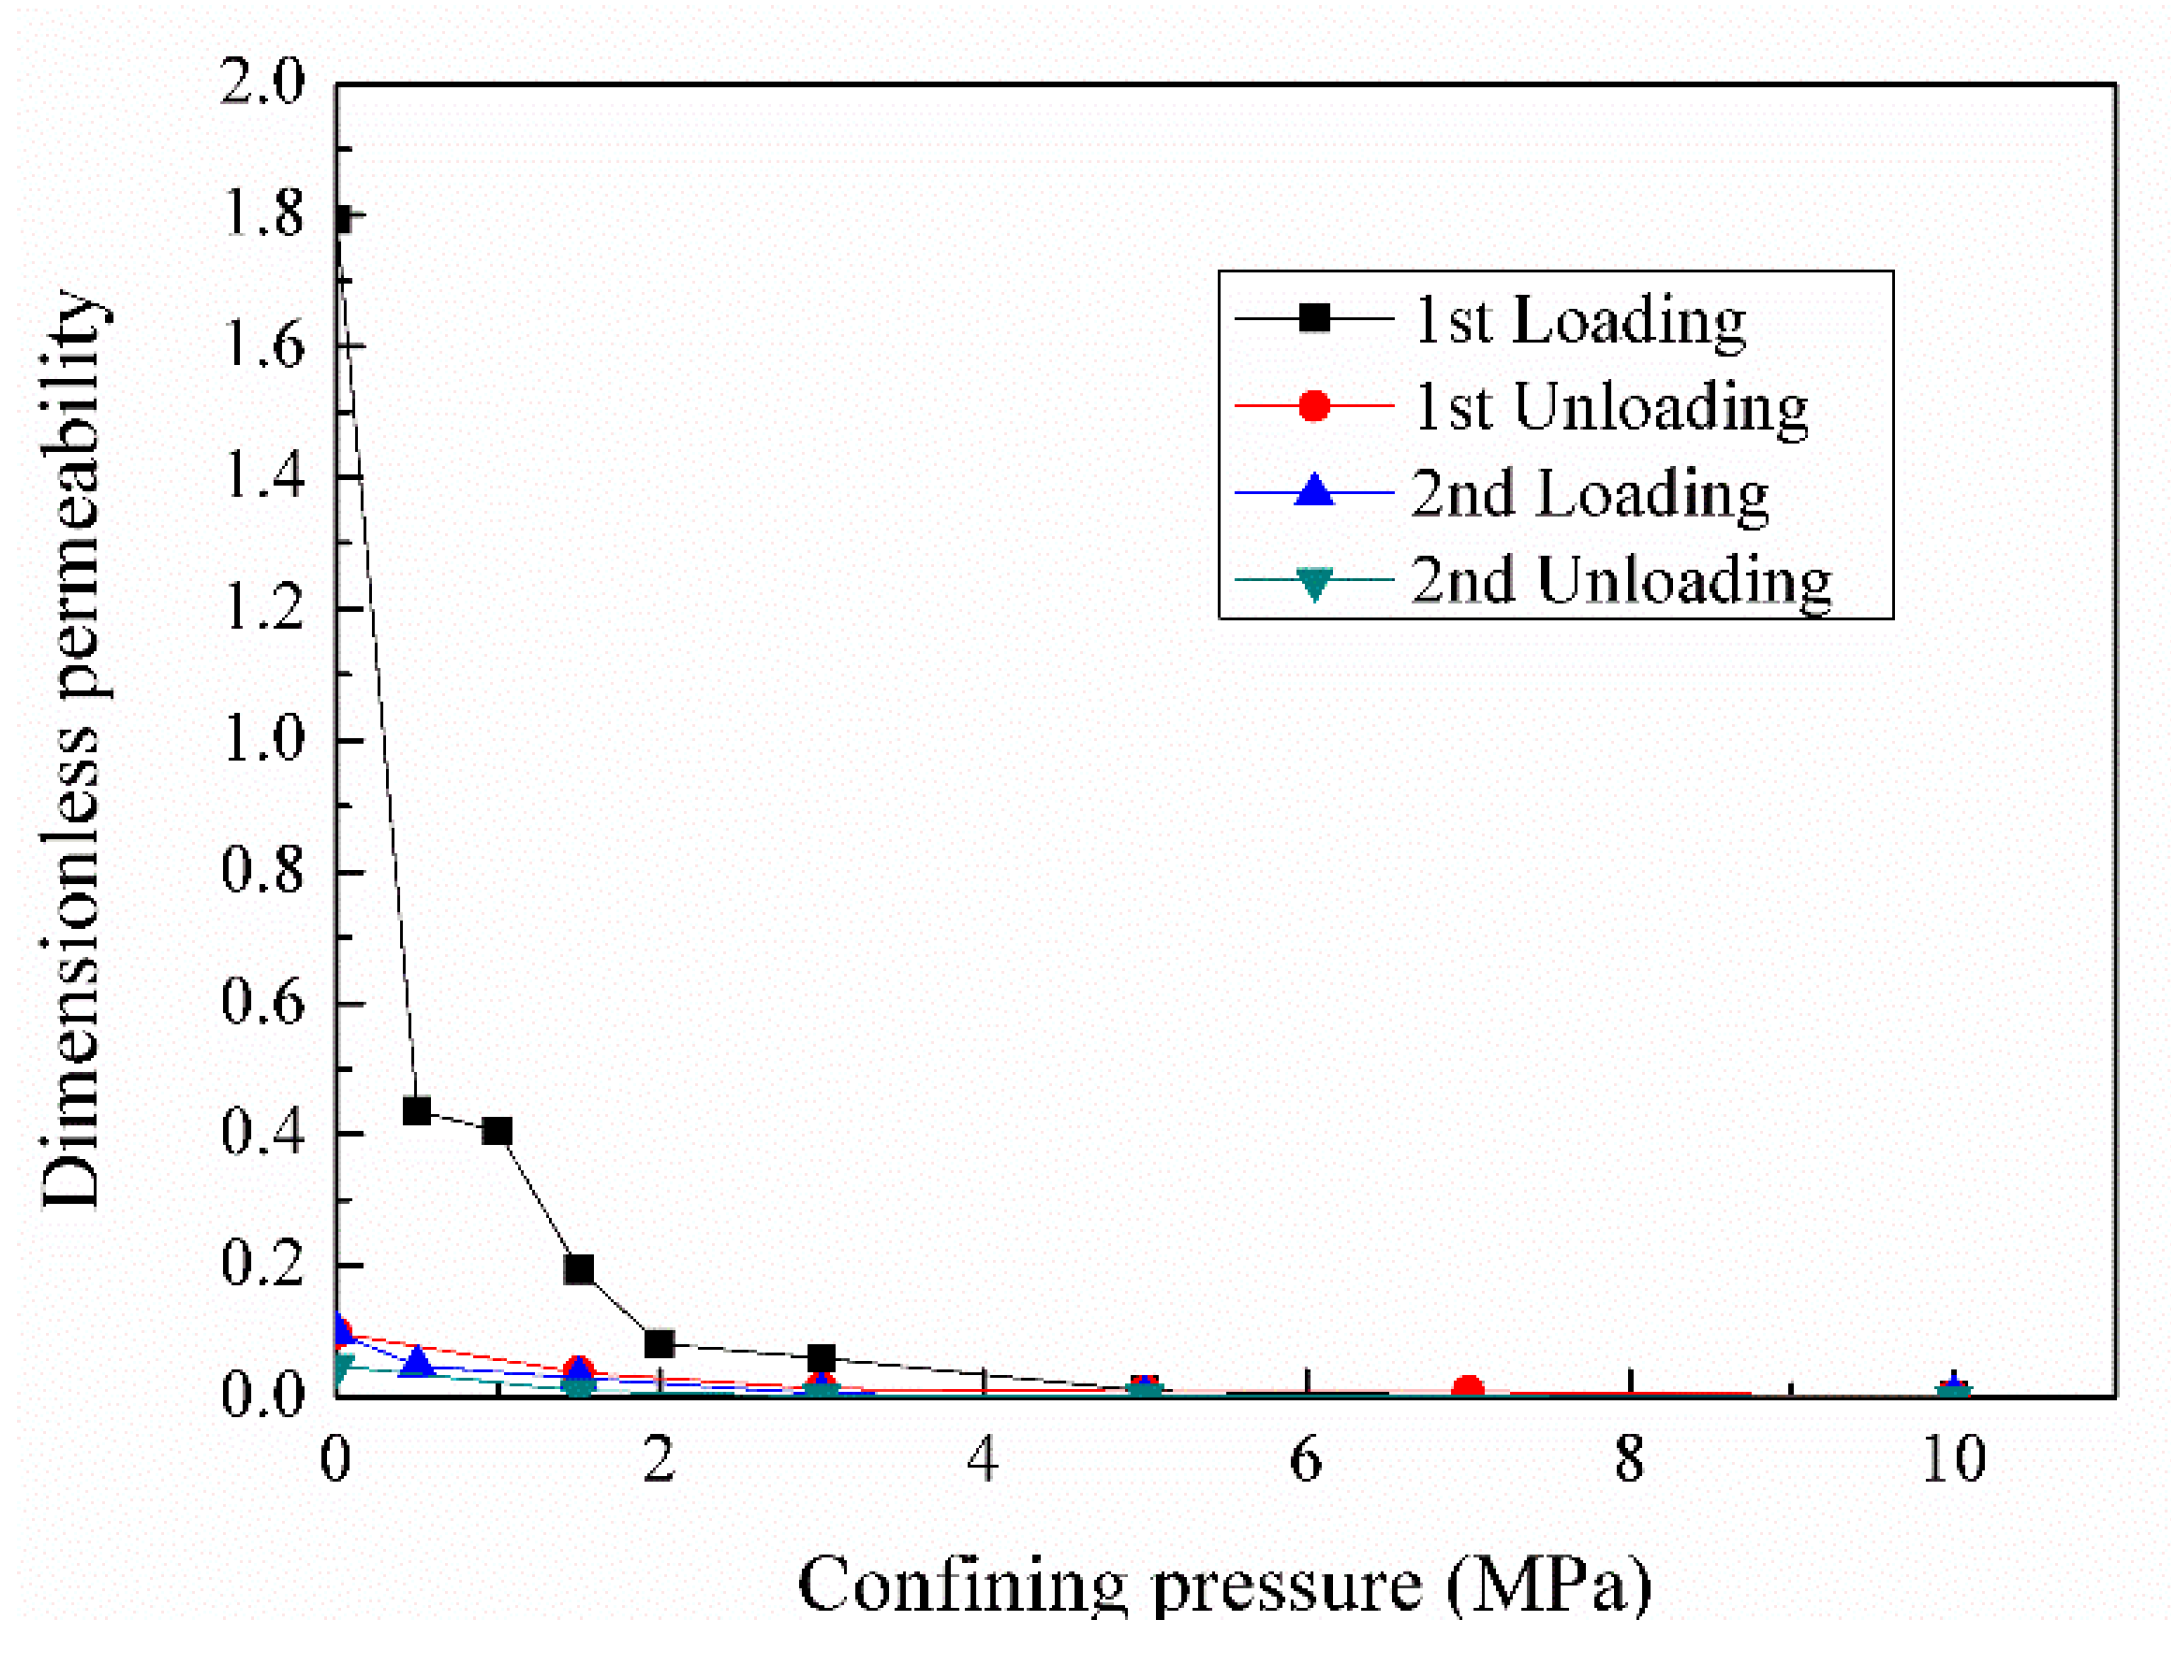
By placing the results of two cycles in the same graph, as shown in Figure 14, we can conclude that after the first cycle loading, the permeability will always be maintained at a low level, that is, the permeability of fractures is more sensitive to the effective stress of the first cycle. In addition, in the loading stage of the first cycle, the permeability is close to 0 when the pressure reaches 5 MPa, that is, the fracture closure area greatly reduces the fracture permeability. In the second cycle, when the pressure reaches 3 MPa, the fracture permeability is already close to 0.
3.3. Discussions
Through the results analysis of Section 3.1 and Section 3.2, we obtained three interesting results. Firstly, the effect of different cyclic stress on a fracture is different, and the loading stage of the first cycle greatly affects the fracture aperture and permeability. Secondly, compared with the first cycle, the stress sensitivity of the second cycle fracture is weaker, and the rock has certain “elastic” characteristics during the loading and unloading process. Thirdly, through CT images, we notice that the pores connected with fractures are almost insensitive to cyclic stress.
These results are part of our special concern. For the analysis of the first two results, the related research of rock mechanics provides us with some ideas. The behavior of rock under cyclic loading is studied in [43], and they concluded the total deformation of the specimen consists of initial deformation induced by static loading, creep deformation and damage deformation produced by cycling itself.
By observing the changes of fracture aperture and permeability with cyclic pressure, we can divide the variations of core parameters of the fracture into three stages: initial rapid deformation stage, transition stage and final stable deformation stage. It has been studied that the unloading cycle stabilizes rapidly, requiring only two cycles, while the loading cycle may take three or four cycles before the sample is adequately seasoned [19]. From our analysis, the initial loading effect, i.e., the compaction effect of confining pressure, makes the fracture close rapidly, which leads to the initial rapid closure. At this stage, the change of fracture parameters is mainly plastic; then, after repeated loading and unloading, fracture parameters change from plastic to elastic; after reaching a certain cycle, the sample is adequately seasoned, and fracture parameters present elastic characteristics.
These results have brought enlightenment to the production of CBM. In the exploration process of CBM, under the strong compaction of the first cycle, it will bring irreversible damage to the artificial fractures. Therefore, at this stage, special attention should be paid to taking appropriate measures to prevent the rapid closure of fractures. After this stage, the fracture deformation and change of permeability present some elastic characteristics, which can be used to improve the production of CBM.
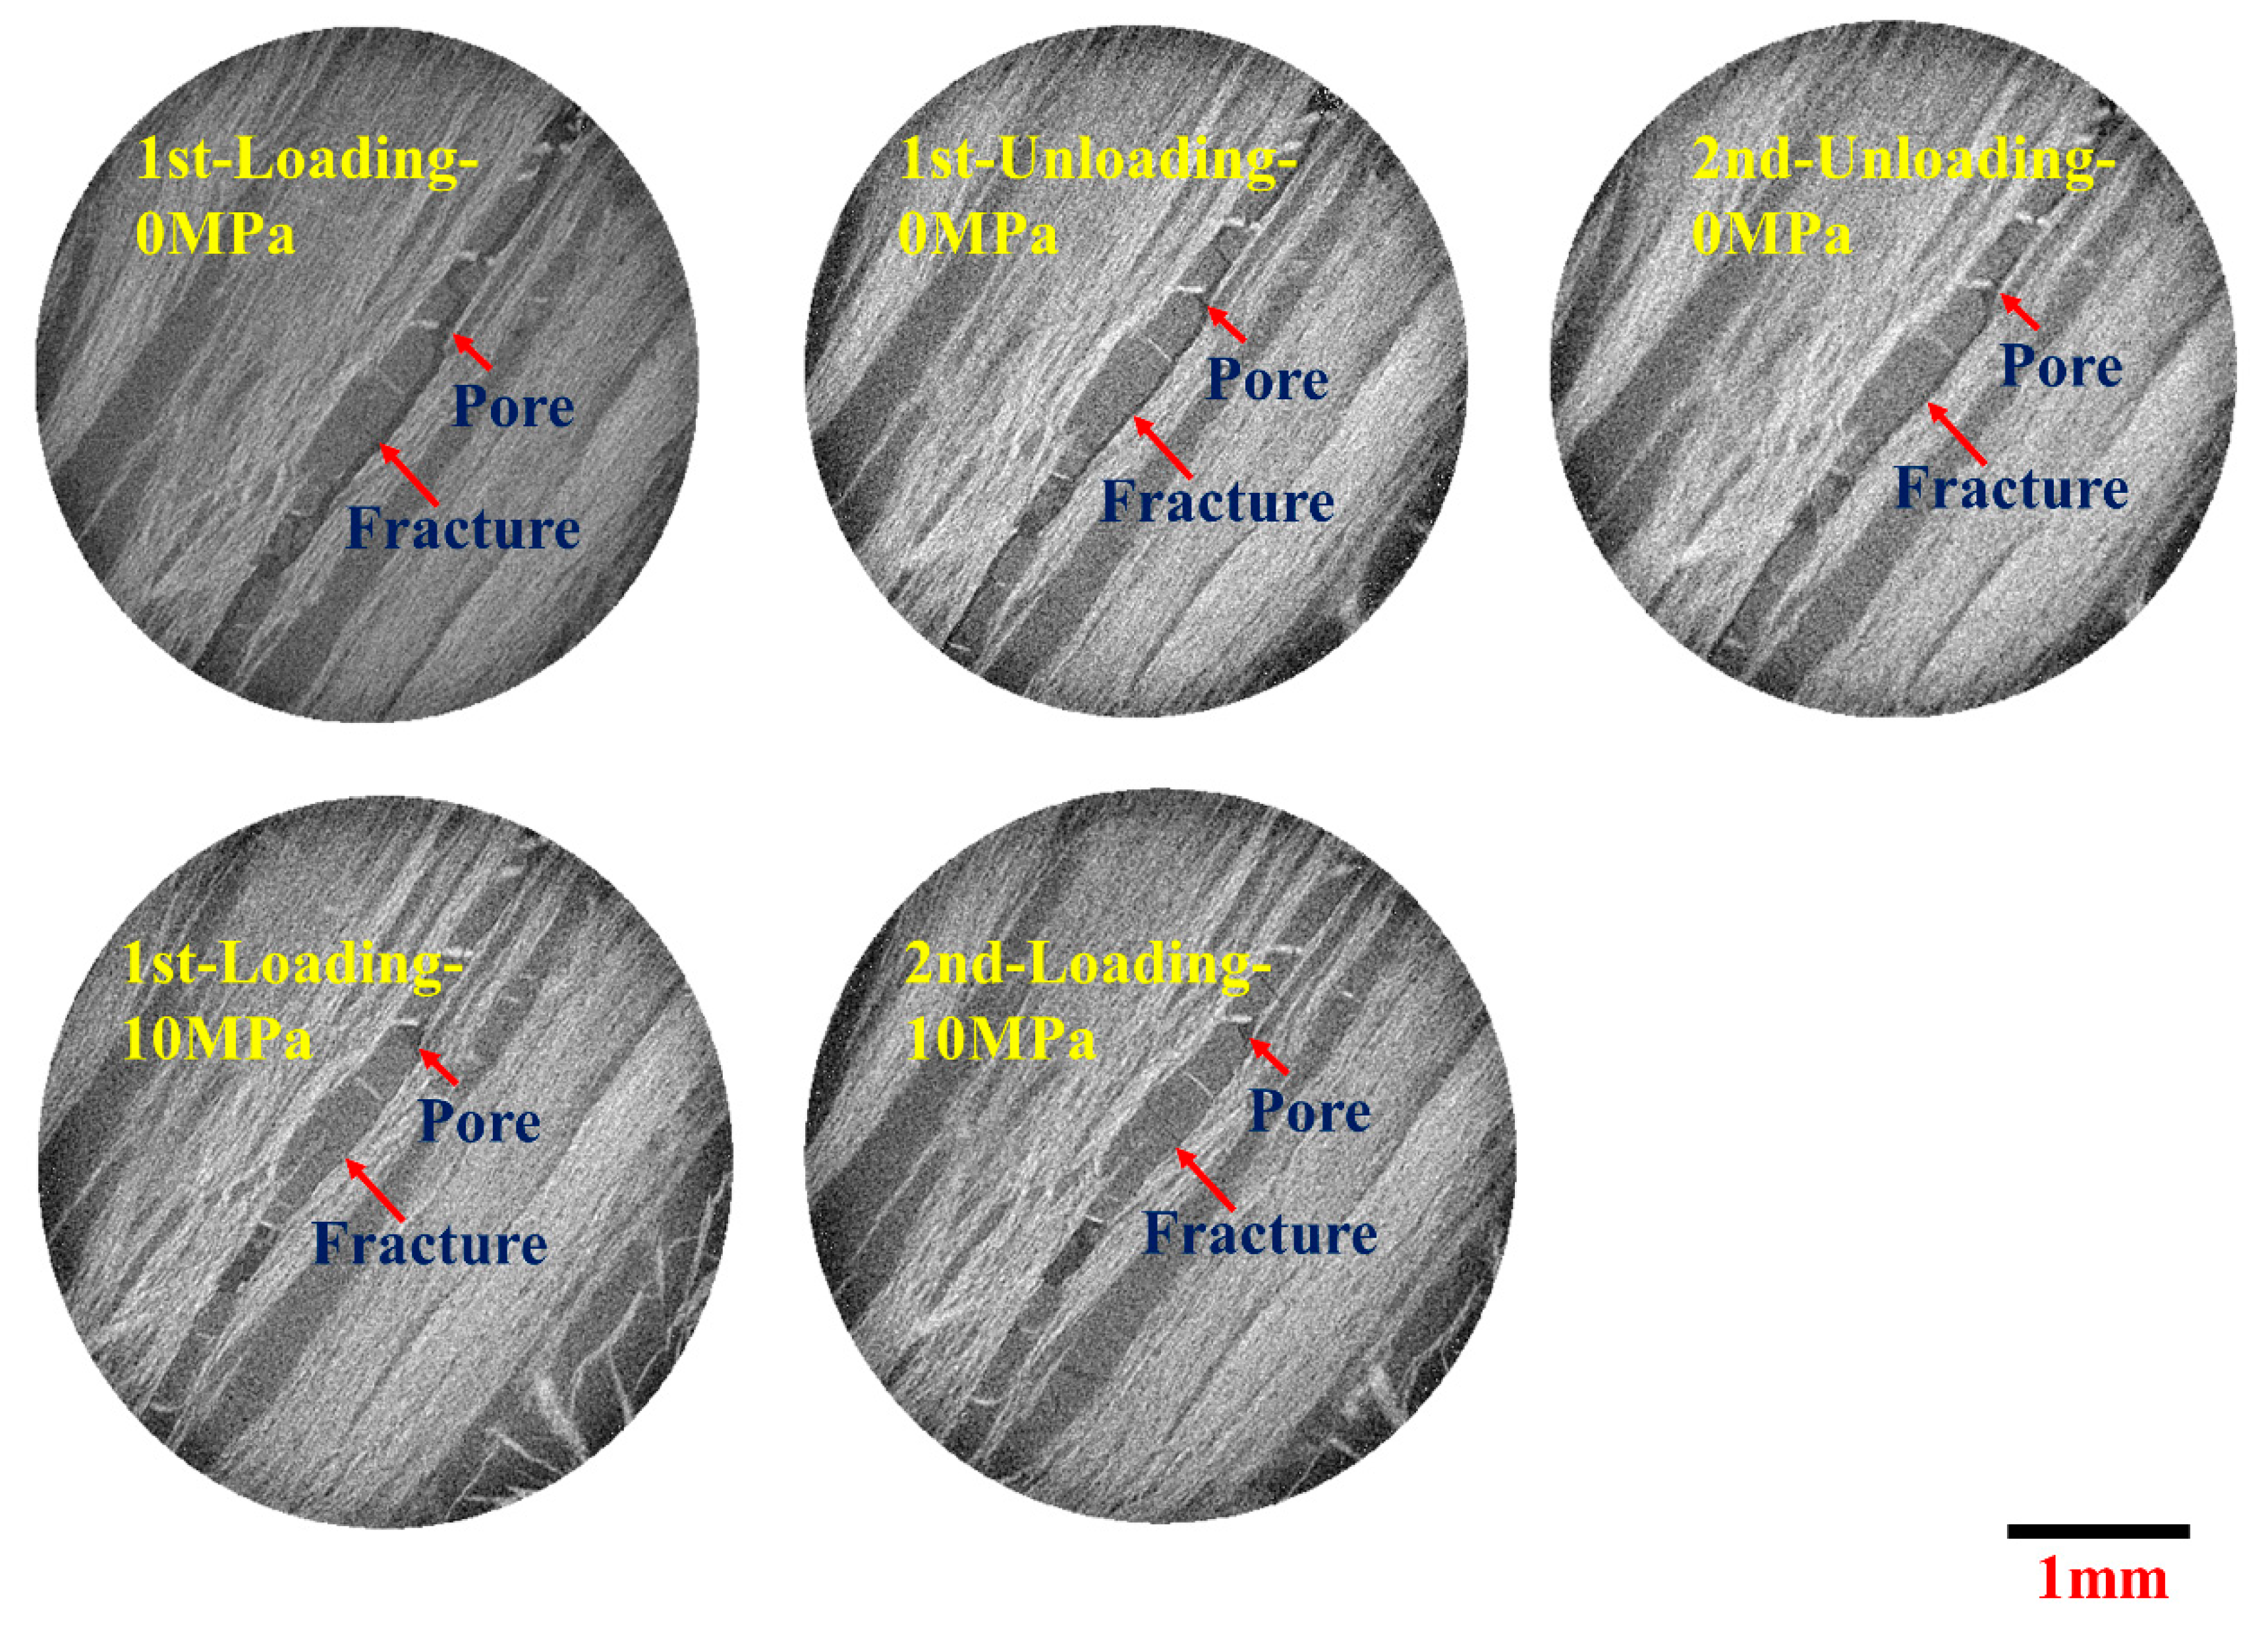
By observing the images when the confining pressure is 0 MPa and 10 MPa, as shown in Figure 15, we have observed a phenomenon well worthy of our consideration. Compared with the slices of 0 MPa, the fracture of 10 MPa is closed. However, for the pore area, the compaction under high pressure does not significantly change its shape, which provides effective technical support for CBM fracturing technology. Moreover, when the fracture is gradually closed, it is obvious that the pore structure can be a beneficial flow channel.
In the previous flow simulation, we mentioned that the flow region we chose was the fracture area, and the flow simulation of fractures connected with pores is the key content of our next research. What is worth studying is, when forming more pores in the fracture structure, whether the fracture can still have a higher flow capacity when it is compacted under strong stress and cyclic stress, so as to improve the production efficiency of coalbed methane.
4. Conclusions
A micrometer-resolution X-ray CT experiment combined with a cyclic stress sensitivity experiment for the deformation analysis are run on a coal sample with an artificial fracture. The fracture apertures of the same position based on CT images and the dimensionless permeability at different confining pressures by the Lattice Boltzmann method are evaluated. The following conclusions are made:
- The deformation of the fracture changes significantly under cyclic loading and unloading. The variation law of fracture aperture in the first and second cycle is similar, namely regardless of loading or unloading, the fracture aperture changes greatly under low effective stress. However, the effect of different cyclic stress on fracture aperture is different, the stress sensitivity of the first cycle core is stronger, and the change range of the loading stage is larger, but the recovery of aperture in the second cycle is stronger.
- The variation of permeability with cyclic stress is similar to that of fracture aperture with cyclic stress, that is, under low effective stress, the permeability decreases faster, and the influence of the first cycle on fracture aperture and permeability is more severe. In addition, the recovery of permeability in the second cycle is also stronger. At the end of the first cycle, when the confining pressure is reduced to 0 MPa, permeability decreases to 94.6% of the initial time. Permeability of the end of the second cycle decreases to 50.8% of the starting of the second cycle.
- Compared with the first cycle, the deformation of the second cycle fracture is weaker, and the coal sample has certain “elastic” characteristics during the loading and unloading process. Based on the experimental results, the variations of core parameters of coal with an artificial fracture under cyclic stress are divided into three stages: initial rapid deformation stage, transition stage and final stable deformation stage. Hence, special attention should be paid to taking appropriate measures to prevent the rapid closure of fractures in the first cycle.
- For the pore area connected with the artificial fracture, the compaction under high confining pressure (10 MPa) and cyclic confining pressure does not significantly change its shape; moreover, when the fracture is gradually closed, it is obvious that the pore structure can be a beneficial flow channel.
Author Contributions
Conceptualization, Y.Y. and Z.L.; methodology, Y.Y.; software, Y.L.; validation, J.L., Y.Y. and Z.L.; formal analysis, Z.L.; investigation, Y.L.; resources, Y.Y.; data curation, Y.L.; writing—original draft preparation, Z.L.; writing—review and editing, J.L.; visualization, Y.L.; supervision, Z.L.; project administration, Y.Y.; funding acquisition, Y.Y. All authors have read and agreed to the published version of the manuscript.
Funding
This research was funded by the National Natural Science Foundation of China (No. 52034010, 52081330095), Shandong Provincial Natural Science Foundation (ZR2019JQ21), and Program for Changjiang Scholars and Innovative Research Team in University (IRT_16R69).
Data Availability Statement
Not applicable.
Acknowledgments
We would like to express appreciation to the following financial support: the National Natural Science Foundation of China (No. 52034010, 52081330095), Shandong Provincial Natural Science Foundation (ZR2019JQ21), and Program for Changjiang Scholars and Innovative Research Team in University (IRT_16R69). The authors would also like to express their sincere gratitude to the editor and anonymous reviewers for their valuable comments, which have greatly improved this paper.
Conflicts of Interest
The authors declare that they have no known competing financial interests or personal relationships that could have appeared to influence the work reported in this paper.
References
- Flores, R.M. Coalbed methane: From hazard to resource. Int. J. Coal Geol. 1998, 35, 3–26. [Google Scholar] [CrossRef]
- Heriawan, M.N.; Koike, K. Coal quality related to microfractures identified by CT image analysis. Int. J. Coal Geol. 2015, 140, 97–110. [Google Scholar] [CrossRef]
- Mazumder, S.; Wolf, K.-H.; Elewaut, K.; Ephraim, R. Application of X-ray computed tomography for analyzing cleat spacing and cleat aperture in coal samples. Int. J. Coal Geol. 2006, 68, 205–222. [Google Scholar] [CrossRef]
- Moore, T.A. Coalbed methane: A review. Int. J. Coal Geol. 2012, 101, 36–81. [Google Scholar] [CrossRef]
- Katarzyna, G.; Dutka, B.; Chuchro, M.; Mynarczuk, M. Synergy of parameters determining the optimal properties of coal as a natural sorbent. Energies 2020, 13, 1967. [Google Scholar] [CrossRef]
- Jia, D.; Qiu, Y.; Li, C.; Cai, Y. Propagation of pressure drop in coalbed methane reservoir during drainage stage. Adv. Geo-Energy Res. 2019, 3, 387–395. [Google Scholar] [CrossRef] [Green Version]
- Katarzyna, G.; Alena, K. Microhardness of Coal from Near-Fault Zones in Coal Seams Threatened with Gas-Geodynamic Phenomena, Upper Silesian Coal Basin, Poland. Energies 2019, 12, 1756. [Google Scholar] [CrossRef] [Green Version]
- Karacan, C.O.; Okandan, E. Adsorption and gas transport in coal microstructure: Investigation and evaluation by quantitative X-ray CT imaging. Fuel 2001, 80, 509–520. [Google Scholar] [CrossRef]
- Wolf, K.H.A.A.; Bergen, F.V.; Ephraim, R.; Pagnier, H. Determination of the cleat angle distribution of the RECOPOL coal seams, using CT-scans and image analysis on drilling cuttings and coal blocks. Int. J. Coal Geol. 2008, 73, 259–272. [Google Scholar] [CrossRef]
- Wang, T.; Zhou, W.B.; Chen, J.H.; Xiao, X.; Li, Y.; Zhao, X. Simulation of hydraulic fracturing using particle flow method and application in a coal mine. Int. J. Coal Geol. 2014, 121, 1–13. [Google Scholar] [CrossRef]
- Yang, Y.; Liu, Z.; Yao, J.; Zhang, L.; Ma, J.; Hejazi, S.; Luquot, L.; Ngarta, T. Flow Simulation of Artificially Induced Microfractures Using Digital Rock and Lattice Boltzmann Methods. Energies 2018, 11, 2145. [Google Scholar] [CrossRef] [Green Version]
- Kumar, H.; Elsworth, D.; Liu, J.; Pone, D.; Mathews, J.P. Permeability evolution of propped artificial fractures in coal on injection of CO2. J. Pet. Sci. Eng. 2015, 133, 695–704. [Google Scholar] [CrossRef]
- Moghadasi, R.; Rostami, A.; Hemmati-Sarapardeh, A. Application of nanofluids for treating fines migration during hydraulic fracturing: Experimental study and mechanistic understanding. Adv. Geo-Energy Res. 2019, 3, 198–206. [Google Scholar] [CrossRef]
- Cai, J.; Wei, W.; Hu, X.; Liu, R.; Wang, J. Fractal Characterization of Dynamic Fracture Network Extension in Porous Media. Fractals 2017, 25, 1750023. [Google Scholar] [CrossRef]
- Meng, Y.; Li, Z.P.; Lai, F.P. Evaluating the filtration property of fracturing fluid and fracture conductivity of coalbed methane wells considering the stress-sensitivity effects. J. Nat. Gas Sci. Eng. 2020, 80, 103379. [Google Scholar] [CrossRef]
- Liu, R.; Jiang, Y.; Huang, N.; Sugimoto, S. Hydraulic properties of 3D crossed rock fractures by considering ani-sotropic aperture distributions. Adv. Geo-Energy Res. 2018, 2, 113–121. [Google Scholar] [CrossRef] [Green Version]
- Akhondzadeh, H.; Keshavarz, A.; Al-Yaseri, A.Z.; Ali, M.; Awan, F.U.R.; Wang, X.; Yang, Y.; Iglauer, S.; Lebedev, M. Pore-scale analysis of coal cleat network evolution through liquid nitrogen treatment: A Micro-Computed Tomography investigation. Int. J. Coal Geol. 2020, 219, 103370. [Google Scholar] [CrossRef]
- Anyim, K.; Gan, Q. Fault zone exploitation in geothermal reservoirs: Production optimization, permeability evo-lution and induced seismicity. Adv. Geo-Energy Res. 2020, 4, 1–12. [Google Scholar] [CrossRef] [Green Version]
- Warpinski, N.R.; Teufel, L.W. Determination of the Effective-Stress Law for Permeability and Deformation in Low-Permeability Rocks. SPE Form. Eval. 1992, 7, 123–131. [Google Scholar] [CrossRef]
- Zou, J.; Chen, W.; Yang, D.; Yu, H.; Yuan, J. The impact of effective stress and gas slippage on coal permeability under cyclic loading. J. Nat. Gas Sci. Eng. 2016, 31, 236–248. [Google Scholar] [CrossRef]
- Teklu, T.W.; Li, X.P.; Zhou, Z.; Abass, H. Experimental Investigation on Permeability and Porosity Hysteresis of Tight Formations. SPE J. 2018, 23, 672–690. [Google Scholar] [CrossRef]
- Cai, Y.; Liu, D.; Mathews, J.P.; Pan, Z.; Elsworth, D.; Yao, Y.; Li, J.; Guo, X. Permeability evolution in fractured coalCombining triaxial confinement with X-ray computed tomography, acoustic emission and ultrasonic techniques. Int. J. Coal Geol. 2014, 122, 91–104. [Google Scholar] [CrossRef]
- Arns, C.H.; Bauget, F.; Limaye, A.; Sakellariou, A.; Senden, T.; Sheppard, A.; Sok, R.M.; Pinczewski, V.W.; Bakke, S.; Berge, L.I.; et al. Pore Scale Characterization of Carbonates Using X-ray Microtomography. SPE J. 2005, 10, 475–484. [Google Scholar] [CrossRef]
- Arns, C.H.; Knackstedt, M.A.; Pinczewski, W.V.; Martys, N.S. Virtual permeametry on microtomographic images. J. Pet. Sci. Eng. 2004, 45, 41–46. [Google Scholar] [CrossRef]
- Chareyre, B.; Cortis, A.; Catalano, E.; Barthélemy, E. Pore-Scale Modeling of Viscous Flow and Induced Forces in Dense Sphere Packings. Transp. Porous Media 2012, 94, 595–615. [Google Scholar] [CrossRef] [Green Version]
- Blunt, M.J.; Bijeljic, B.; Dong, H.; Gharbi, O.; Iglauer, S.; Mostaghimi, P.; Paluszny, A.; Pentland, C. Pore-scale imaging and modelling. Adv. Water Resour. 2013, 51, 197–216. [Google Scholar] [CrossRef] [Green Version]
- Clarkson, C.R.; Solano, N.; Bustin, R.M.; Bustin, A.M.M.; Chalmers, G.R.L.; He, L.; Melnichenko, Y.B.; Radlinski, A.P.; Blach, T.P. Pore structure characterization of North American shale gas reservoirs using USANS/SANS, gas adsorption, and mercury intrusion. Fuel 2013, 103, 606–616. [Google Scholar] [CrossRef]
- Dong, H.; Blunt, M.J. Pore-network extraction from micro-computerized-tomography images. Phys. Rev. E 2009, 80, 036307. [Google Scholar] [CrossRef] [Green Version]
- Gu, X.; Cole, D.R.; Rother, G.; Mildner, D.F.R.; Brantley, S.L. Pores in Marcellus Shale: A Neutron Scattering and FIB-SEM Study. Energy Fuels 2015, 29, 1295–1308. [Google Scholar] [CrossRef]
- Iliev, O.; Lakdawala, Z.; Neßler, K.H.; Prill, T.; Vutov, Y.; Yang, Y.; Yao, J. On the pore-scale modeling and simulation of reactive transport in 3d geometries. Math. Model. Anal. 2017, 22, 671–694. [Google Scholar] [CrossRef] [Green Version]
- Li, W.; Wang, W.; Lu, S.; Xue, H. Quantitative characterization on shale-hosted oil reservoir: A case study of argillaceous dolomite reservoir in the Jianghan Basin. Fuel 2017, 206, 690–700. [Google Scholar] [CrossRef]
- Yang, Y.; Li, Y.; Yao, J.; Iglauer, S.; Luquot, L.; Zhang, K.; Sun, H.; Zhang, L.; Song, W.; Wang, Z. Dynamic Pore-Scale Dissolution by CO2-Saturated Brine in Carbonates: Impact of Homogeneous Versus Fractured Versus Vuggy Pore Structure. Water Resour. Res. 2020, 56. [Google Scholar] [CrossRef]
- Yang, Y.; Yang, H.; Tao, L.; Yao, J.; Wang, W.; Zhang, K.; Luquot, L. Microscopic Determination of Remaining Oil Distribution in Sandstones With Different Permeability Scales Using Computed Tomography Scanning. J. Energy Resour. Technol. 2019, 141, 092903. [Google Scholar] [CrossRef]
- Jing, Y.; Armstrong, R.T.; Mostaghimi, P. Digital coal: Generation of fractured cores with microscale features. Fuel 2017, 207, 93–101. [Google Scholar] [CrossRef]
- Cui, J.; Liu, D.; Cai, Y.; Pan, Z.; Zhou, Y. Insights into fractures and minerals in subbituminous and bituminous coals by FESEM-EDS and X-ray μ-CT. Fuel 2019, 237, 977–988. [Google Scholar] [CrossRef] [Green Version]
- Ellis, B.R.; Peters, C.A. 3D Mapping of calcite and a demonstration of its relevance to permeability evolution in reactive fractures. Adv. Water Resour. 2016, 95, 246–253. [Google Scholar] [CrossRef] [Green Version]
- Ghous, A.; Knackstedt, M.A.; Arns, C.H.; Sheppard, A.P.; Kumar, M.; Sok, R.M.; Senden, T.J.; Latham, S.; Jones, A.C.; Averdunk, H.; et al. 3D Imaging of Reservoir Core at Multiple Scales: Correlations to Petrophysical Properties and Pore Scale Fluid Distributions; Society of Petroleum Engineers: Kuala Lumpur, Malaysia, 2008. [Google Scholar] [CrossRef]
- Shah, S.M.; Gray, F.; Crawshaw, J.P.; Boek, E.S. Micro-computed tomography pore-scale study of flow in porous media: Effect of voxel resolution. Adv. Water Resour. 2016, 95, 276–287. [Google Scholar] [CrossRef] [Green Version]
- Akhondzadeh, H.; Keshavarz, A.; Awan, F.U.R.; Ali, M.; Al-Yaseri, A.; Liu, C.; Yang, Y.; Iglauer, S.; Gurevich, B.; Lebedev, M. Liquid nitrogen fracturing efficiency as a function of coal rank: A multi-scale tomographic study. J. Nat. Gas Sci. Eng. 2021, 95, 104177. [Google Scholar] [CrossRef]
- Yang, Y.; Tao, L.; Yang, H.; Iglauer, S.; Wang, X.; Askari, R.; Yao, J.; Zhang, K.; Zhang, L.; Sun, H. Stress Sensitivity of Fractured and Vuggy Carbonate: An X-ray Computed Tomography Analysis. J. Geophys. Res.-Solid Earth 2020, 125, 1–12. [Google Scholar] [CrossRef]
- Zhang, C.; Tu, S.; Zhang, L. Analysis of Broken Coal Permeability Evolution Under Cyclic Loading and Un-loading Conditions by the Model Based on the Hertz Contact Deformation Principle. Transp. Porous Media 2017, 119, 739–754. [Google Scholar] [CrossRef]
- Zhang, Y.; Xu, X.; Lebedev, M.; Sarmadivaleh, M.; Barifcani, A.; Iglauer, S. Multi-scale X-ray computed to-mography analysis of coal microstructure and permeability changes as a function of effective stress. Int. J. Coal Geol. 2016, 165, 149–156. [Google Scholar] [CrossRef] [Green Version]
- Tao, Z.; Mo, H. An experimental study and analysis of the behaviour of rock under cyclic loading. Int. J. Rock Mech. Min. Sci. Geomech. Abstr. 1990, 27, 51–56. [Google Scholar] [CrossRef]
Figure 1.
Desorption and migration of CBM: (a) desorption from surface; (b) migration in pores and fractures; (c) flowing into the well bore through fractures.
Figure 1.
Desorption and migration of CBM: (a) desorption from surface; (b) migration in pores and fractures; (c) flowing into the well bore through fractures.

Figure 2.
Schematic diagram of in situ X-ray CT characterization system of cyclic stress sensitivity.
Figure 2.
Schematic diagram of in situ X-ray CT characterization system of cyclic stress sensitivity.

Figure 3.
A slice of a coal sample: (a) original grayscale image, (b) after image smoothing and denoising.
Figure 3.
A slice of a coal sample: (a) original grayscale image, (b) after image smoothing and denoising.

Figure 4.
The 2D slice of coal 2–5 without fracture.

Figure 5.
The 2D images of the same position in the first cycle (with the increase in confining pressure).
Figure 5.
The 2D images of the same position in the first cycle (with the increase in confining pressure).

Figure 6.
The 2D images of the same position in the unloading stage of the first cycle.

Figure 7.
The 2D images of the same position in the second cycle (with the increase in confining pressure).
Figure 7.
The 2D images of the same position in the second cycle (with the increase in confining pressure).

Figure 8.
The 2D images of the same position in the second cycle (with the decrease in confining pressure).
Figure 8.
The 2D images of the same position in the second cycle (with the decrease in confining pressure).

Figure 9.
The measurement of fracture aperture at the first 0 MPa.

Figure 10.
The measurement results of fracture aperture: (a) the first cycle, (b) the second cycle.

Figure 11.
Fracture aperture at a fixed position under different confining pressures of two cycles.

Figure 12.
The digital core and streamlines of the first 0 MPa: (a) the digital core, (b) the streamlines.
Figure 12.
The digital core and streamlines of the first 0 MPa: (a) the digital core, (b) the streamlines.

Figure 13.
The relationship between permeability and confining pressure: (a) the first cycle, (b) the second cycle.
Figure 13.
The relationship between permeability and confining pressure: (a) the first cycle, (b) the second cycle.

Figure 14.
The relationship between permeability and confining pressure of the second cycle.

Figure 15.
The images of the same position when the confining pressure is 0 MPa and 10 MPa.

Publisher’s Note: MDPI stays neutral with regard to jurisdictional claims in published maps and institutional affiliations. |
© 2021 by the authors. Licensee MDPI, Basel, Switzerland. This article is an open access article distributed under the terms and conditions of the Creative Commons Attribution (CC BY) license (https://creativecommons.org/licenses/by/4.0/).
Share and Cite
MDPI and ACS Style
Liu, Z.; Yang, Y.; Li, Y.; Li, J. In Situ Deformation Analysis of a Fracture in Coal under Cyclic Loading and Unloading. Energies 2021, 14, 6474. https://0-doi-org.brum.beds.ac.uk/10.3390/en14206474
AMA Style
Liu Z, Yang Y, Li Y, Li J. In Situ Deformation Analysis of a Fracture in Coal under Cyclic Loading and Unloading. Energies. 2021; 14(20):6474. https://0-doi-org.brum.beds.ac.uk/10.3390/en14206474
Chicago/Turabian StyleLiu, Zhihui, Yongfei Yang, Yingwen Li, and Jiaxue Li. 2021. "In Situ Deformation Analysis of a Fracture in Coal under Cyclic Loading and Unloading" Energies 14, no. 20: 6474. https://0-doi-org.brum.beds.ac.uk/10.3390/en14206474
Note that from the first issue of 2016, this journal uses article numbers instead of page numbers. See further details here.