
Design and Performance Investigation of a Pilot Micro-Grid in the Mediterranean: MCAST Case Study


1
MCAST Energy Research Group (MCAST Energy), Institute of Engineering and Transport, Malta College of Arts, Science and Technology (MCAST), Triq Kordin, PLA9032 Paola, Malta
2
Department of Electrical & Electronics Engineering, School of Engineering, University of Petroleum and Energy Studies, Dehradun 248007, India
3
School of Technology, Woxsen University, Hyderabad 502345, India
*
Authors to whom correspondence should be addressed.
Energies 2021, 14(20), 6846; https://0-doi-org.brum.beds.ac.uk/10.3390/en14206846
Submission received: 15 September 2021
/
Revised: 13 October 2021
/
Accepted: 13 October 2021
/
Published: 19 October 2021
(This article belongs to the Special Issue Future Integration of Photovoltaic Systems)
Abstract
:This paper discusses the simulation framework developed for an in-campus pilot micro-grid at MCAST, Malta, to enhance its efficiency and reliability. One year of real-time metered data were used to arrive at the load curves, categorize the loads as essential and non-essential ones, and decide the micro-grid domain within MCAST. The potential scenarios were modeled to observe the behavior of the present status of the micro-grid, with an increased photovoltaic (PV) generation capacity, by using an optimum battery storage system with a diesel generator of suitable capacity and finally integrating electric vehicles (EVs) to discuss the potential of vehicle to grid (V2G) operation modes. The existing building management system (BMS) of MCAST was interfaced within the micro-grid to introduce the geographic information system (GIS) and Building Information Modeling (BIM) for developing an intelligent 3D model of the micro-grid. The results of the simulation framework for various potential case scenarios were obtained in a MATLAB/Simulink environment to assess the performance of the micro-grid. Previously formulated key performance indices (KPIs) that describe the financial aspects of micro-grid operation and ecological benefits of the investigated micro-grid were evaluated. A sensitivity analysis of these KPIs shows encouraging results with the potential of cost-competitiveness.
1. Introduction
The commercial use of electricity started only towards the end of the nineteenth century. Initially, the generation was DC, and the distance between the load and the generator was small, resulting in slow growth. Until 1925, only half of the households in the United States received electricity. Since then, its use has spread so fast and wide across the world that now it is difficult to imagine life without it. The emergence of AC grids allowed the electric power to be transmitted over long distances. The economy of scale led to the setting up of large generation stations to produce the bulk electric power and a wide network of transmission and distribution lines for feeding this power to fulfill the needs of industries, businesses, and household consumers. The balancing of demand and supply was helped by the averaging effect of the combination of large amounts of instantaneous loads. The security of the supply was increased as the failure of one generating plant was compensated by the other power plants in the interconnected system.
Nevertheless, even with the best efforts and resources, and even in a well-managed system, an interruption of electric supply at some locations in the event of a fault in some system component cannot be ruled out. With that experience, most consumers looked for ways to ensure continuous supply, at least for their essential loads. The concept of micro-grid (MG) was born out of this search for a reliable backup, primarily by having a local diesel generator. This type of backup became a norm during the second half of the twentieth century.
The European Union (EU) research project [1] describes a micro-grid as a Low-Voltage (LV) distribution system with distributed energy resources (DERs) (micro-turbines, fuel cells, photovoltaics (PV), etc.), storage devices (batteries, flywheels) energy storage system and flexible loads. Such systems can operate in two modes, either when connected or disconnected (islanded) from the main grid. Furthermore, the operation of DERs in the network can provide benefits to the overall system performance if managed and coordinated efficiently.
Micro-grids can be classified as: (i) Campus Environment/Institutional Micro-grids for aggregating existing on-site DERs and multiple loads located in tight geography; (ii) Community Micro-grids that can serve thousands of customers and support the penetration of local DERs [2] from some prosumers that can supply their demand as well as that of their neighbors within the same community; they may also have distributed energy storage with the entire system connected through bi-directional power electronic converters [3]; (iii) Remote Off-grid Micro-grids, which do not connect to the main-grid (always operate in island mode) due to economic and geographical location, are built in areas that are far distant from any transmission and distribution infrastructure [4]. Investigators have shown that operating remote islands’ off-grid micro-grids that are dominated by renewable sources will reduce the levelized cost of electricity production over the life of such projects [5,6]. Sometimes, it may be beneficial to interconnect such micro-grids provisionally to suitable neighboring micro-grids to exchange power and improve the voltage and frequency deviations [7,8,9,10]; (iv) Military Base Micro-grids, actively deployed with a focus on both physical and cybersecurity for military facilities; (v) Commercial and Industrial (C&I) Micro-grids, set up for reasons of security and reliability in industries in which an interruption of the power supply may cause high revenue losses and long start-up time. Industrial micro-grids can achieve net-zero-emission by integrating heat and power (CHP) generation on being fed by both renewable sources and waste processing [11].
The International Council on Large Electrical Systems (CIGRE) defines micro-grids as “electricity distribution systems containing loads and distributed energy resources (such as distributed generators, storage devices, or controllable loads) that can be operated in a controlled, coordinated way either while connected to the main power network or while islanded”.
The wheel has turned a full circle; instead of going for extra-large generating stations, these days, a considerable emphasis on distributed generation is seen among planners. This shift in thinking has come about on considerations of (i) the development of competitive technologies and systems of renewable sources like solar and wind; (ii) difficulties in getting right-of-way for constructing new transmission lines; (iii) customers’ demand for a highly reliable supply of electricity; (iv) deregulation of electrical generation, transmission, and distribution markets; and (v) the need to limit GHG emissions. These factors are also responsible for a growing interest in the study of micro-grids, especially in finding ways to control the micro-grids so that they can support the main grid by helping in the demand-side management of loads (shaving off or shifting away from some load during peak hours), by meeting partially active or reactive power needs of the grid during a disturbance, by feeding the essential loads in the domain of the micro-grid in islanded mode.
This paper aims to explore the behavior of an existing pilot micro-grid in MCAST, Malta in various modes, like the micro-grid in its present form, micro-grid with an increased PV generation capacity, micro-grid with added support in the form of an appropriate battery storage system, and diesel generator, and with the integration of electric vehicles EVs to discuss the potential V2G operation. Real-time data are used to derive the load profiles of the buildings and identify college areas as part of the micro-grid. These loads are then categorized as essential and non-essential loads; load curves are obtained from the metered actual metered data. The existing building management system (BMS) of MCAST is interfaced within the micro-grid to introduce the geographic information system (GIS) and Building Information Modeling (BIM) for developing an intelligent 3D model of the micro-grid. A simulation framework is developed to model various potential case scenarios. The various case studies are carried out in the MATLAB/Simulink environment to test and predict the behavior of different parameters during changing scenarios. An evaluation of previously formulated key performance indices (KPIs) showcases the effectiveness of the micro-grid with an emphasis on the levelized cost of production and reduction in greenhouse gas (GHG) emission. The levelized cost computed for this pilot micro-grid compares well with the rate being charged by Malta’s state monopoly electric utility, Enemalta. With a continuing fall in the production costs of PV systems, associated interfacing electronics, and lithium-ion batteries, the levelized cost of production from micro-grid may become a lot more competitive soon with the rate being charged by Enemalta. It may as well come out cheaper if we were to take into consideration the carbon penalties. However, looking into the recent disruption of the PV manufacturing industry, a guess about future prices is hazardous. Therefore, a sensitivity analysis for a wide price variation is also included in this study.
The rest of the paper is organized as follows. Section 2 describes the domain and features of the micro-grid at MCAST. Section 3 sheds light on the sizing of DERs, battery energy storage systems (BESS), and suggested mechanical (diesel) generators based on load curves. The modelling of various case scenarios is discussed in Section 4, along with the simulation results. Section 5 details the various key performance indices (KPIs) and their computed values. A sensitivity analysis is done in Section 6 to show the effect of price change on major KPIs. Finally, in Section 7, a brief discussion of the results is presented. The paper concludes with a summary and an assessment of the performance of the micro-grids, especially in the Mediterranean region.
2. MCAST Micro-Grid
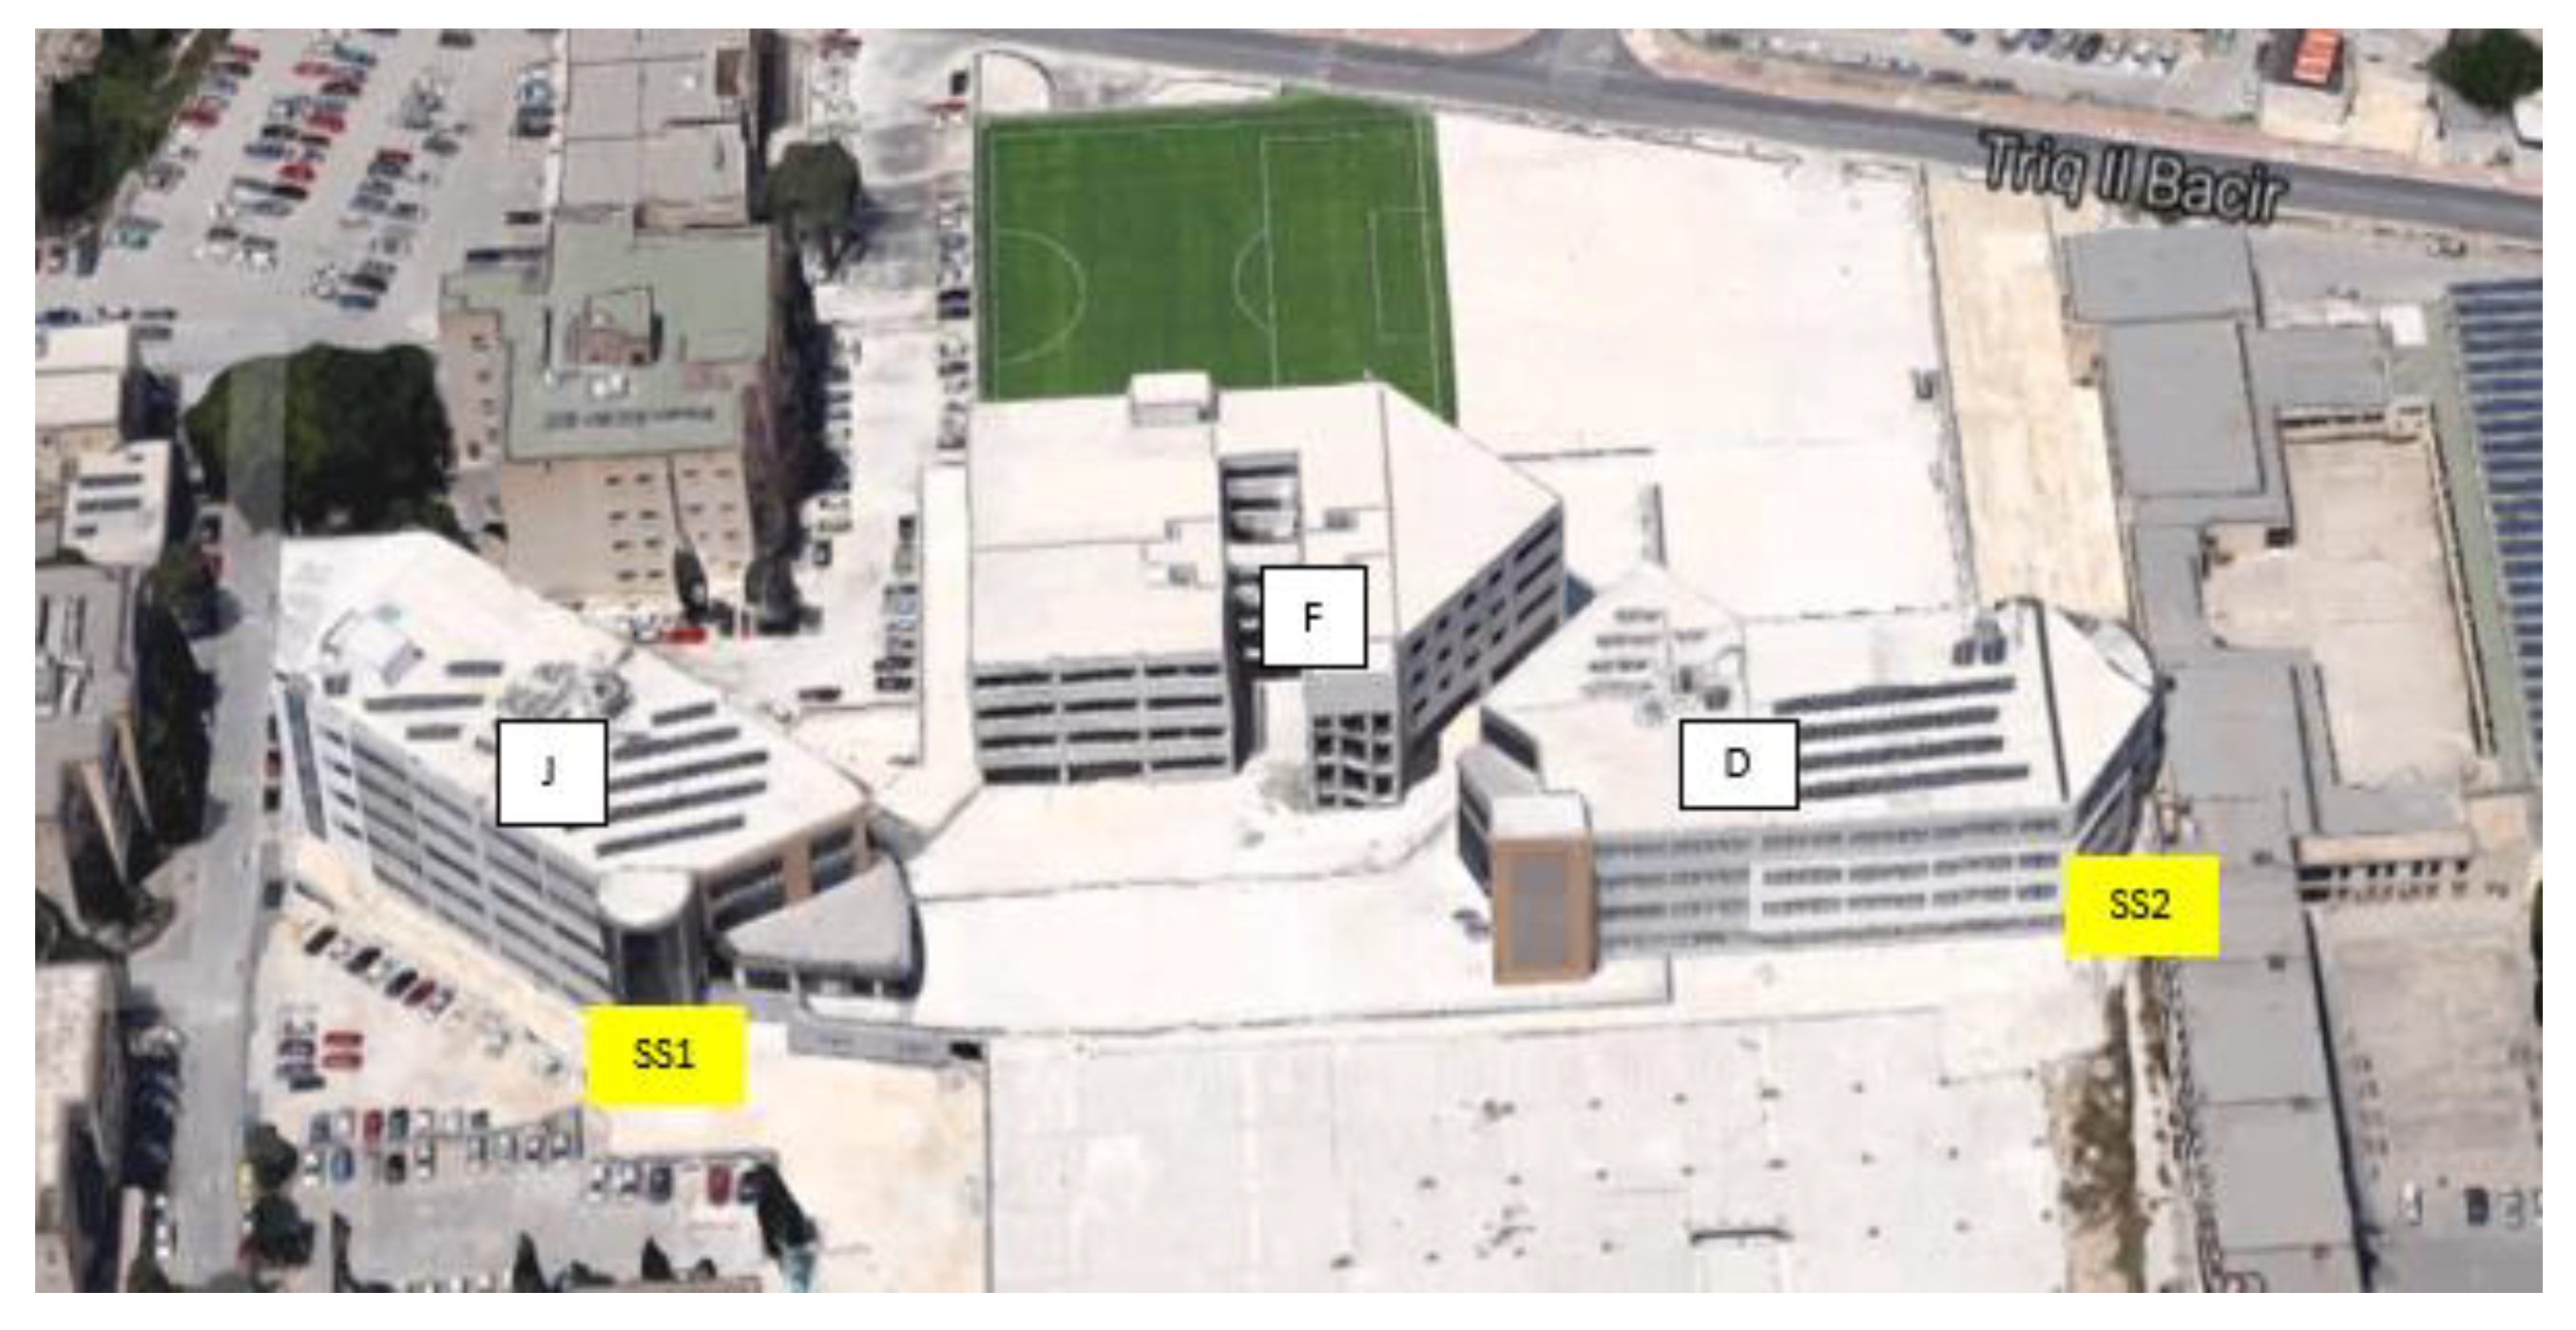
MCAST is an institution hosting nearly 3500 daily population during the school period. This paper proposes integrating distributed energy resources (DERs) with storage units utilizing a central controller. The test-bed micro-grid comprises Blocks D, F, and J of the main MCAST campus, as shown in Figure 1. Table 1 describes the layout labels of the three buildings.
2.1. Electrical Network
With Blocks D, J, and F and its underground parking, the MCAST micro-grid covers an area of around 40,000 m2 of the overall MCAST campus. The main feeder at Substation 1 (SS1) is connected to the utility grid, which Enemalta PLC maintains through a Medium Voltage (MV, 11 kV) switchgear. This voltage is then stepped down to 400 V using a step-down transformer. SS2 is connected from SS1 by an interconnection feed using a ring configuration and then stepped down to 400 V. Thus, SS1 mainly feeds Block J while SS2 feeds Blocks D, F, and the Underground Parking, as shown in Figure 2.
Currently, the DERs of the electrical system are made up of 63.24 kWP of PV systems. These are distributed on the three buildings, having 21.12 kWP each on both Blocks J and D and 21 kWP on Block F [12]. We propose enhancing the reliability of the micro-grid with a battery energy storage system (BESS) so that the micro-grid system will be able to isolate for a period of time partially. The current MCAST micro-grid is planned to work in parallel to the main grid, but a simulation framework is developed to observe the system’s behavior when diesel generators and BESS are integrated within the system.
In the MCAST micro-grid system architecture, there is only one point where the main grid meets with the system at PCC. The ultimate aim is for the micro-grid to isolate from the main grid even if it means that the controller has to shed non-critical loads to save energy for critical ones. In a MATLAB/Simulink environment, simulations are carried to test and predict the behavior of different parameters during changing scenarios.
2.2. Feeders
All feeders in the electric network are monitored by smart meters. These smart meters are positioned near the switchgear and monitor several parameters: line voltage, phase voltage, line current, active, reactive and apparent power, and energy. The data obtained through smart meters are recorded every 5 min, and approximately one year of data is used to determine different energy profiles for further analysis.
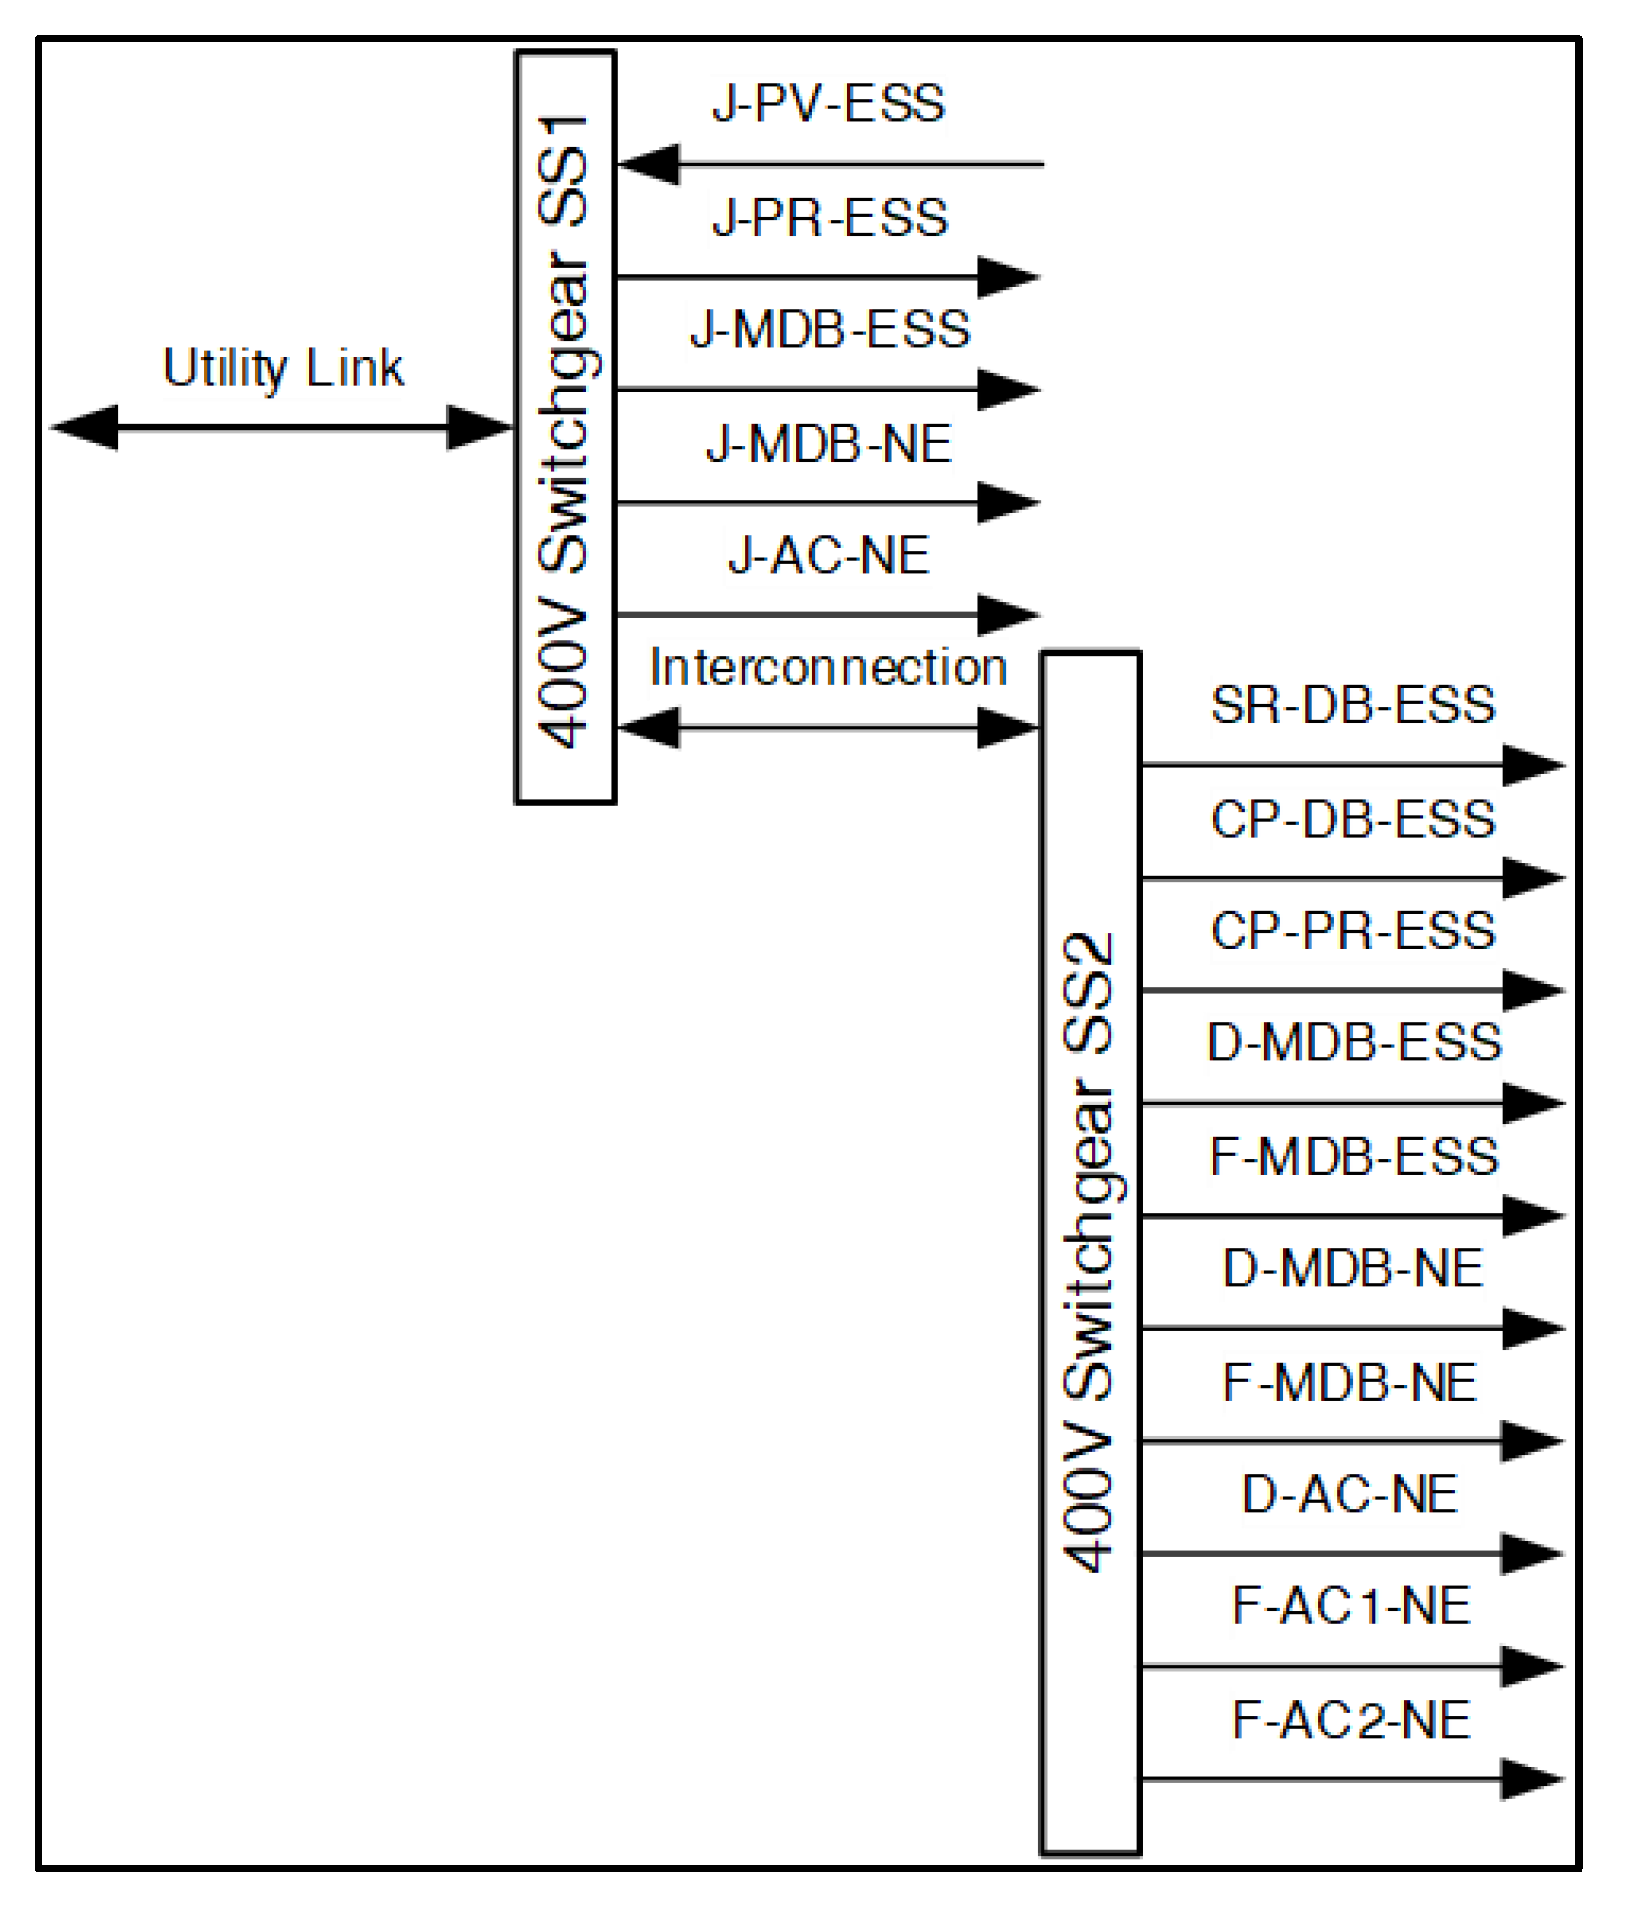
Figure 3 illustrates the metered feeders connected to the 400 V switchgear. SS1 is connected directly to the main grid, while an interconnection with SS2 is also being metered. The nomenclature of the feeders is: [Building]-[Type]-[Descriptor]. Together with Blocks J, D, and F, Car-park [CP], and Switchgear room [SR]. The PV system is currently being metered through the PV feeder while AC represents the feeder supplying electricity to the HVAC systems of each building. MDB feeders are the Main Distribution Boards, supplying feeders for essential loads [ES] and non-essential loads [NE]. The lighting system makes part of the building essential loads, while electric sockets are included as non-essential loads.
The existing building management system (BMS) of MCAST is interfaced within the micro-grid to introduce the geographic information system (GIS) and Building Information Modeling (BIM) for developing an intelligent 3D model of the micro-grid.
3. Sizing of DERs and BESS
This section describes how the capacity of DERs (PV in this case) and the Battery Energy Storage System (BESS) are determined.
3.1. Sizing of DERs
Energy profiles are prepared from the data recorded by smart meters, installed at the MCAST feeders’ ends to monitor the loads and generation of the existing network. These profiles are analyzed to obtain baseload, peak-load, and current PV generation values at the listed buildings.
Two years of data were gathered during the investigation to observe realistic trends that occur on the MCAST campus. Once the load demand was identified, an initial sizing of DERs was determined. Additionally, system conditions and operating limits were implemented in the simulation framework to enhance the reliability of the investigated micro-grid. Furthermore, conditions imposed on the maximum and minimum battery state of charge (SoC), load shedding conditions, and components efficiency were taken into account while determining the size of the required DERs under different case scenarios.
Once the simulation framework was modeled, the initial results obtained were used to observe the performance of the electrical systems. Sizing components such as the battery and generator were then updated to obtain an optimum rating according to the system needs.
3.2. Energy Profiles
Energy profiles are vital to gain valuable insight into the current behavior of the electrical network. Smart meters gave the measure of various parameters from each feeder at a 5-min resolution. A probabilistic methodology was carried out based on the metered data to simulate various scenarios envisaged on the MCAST micro-grid by observing the load-duration profile.
Data were recorded for over two years so that the profiles could be compared and analyzed. Figure 4 represents a seven-month profile of the Utility Link Feeder between August 2018 and February 2019, which supplies SS1. The solid curve represents the load duration curve and shows a peak load demand of 410 kW with a baseload power demand of 70 kW, which is 16% of the peak power. The baseload power demand is the power required by the electrical network for about 70% of the time.
The dashed curve represents the impact of the PV systems on the overall electrical power demand. The PVs reduced the peak load demand by 6% to 384 kW, while the baseload demand was reduced by 5% to approximately 66 kW.
An initial analysis revealed that the maximum metered energy consumption within the proposed buildings occurs in August, even though the campus population is not at its maximum during this month. This high consumption occurs mainly because the HVAC systems consume more energy to reach comfortable temperatures inside the building for offices, campus labs, and lecture rooms.
On the other hand, between October 2018 and May 2019, the maximum power consumption metered on the primary utility feeder was 310 kW, about 25% less than the maximum peak power registered in August 2018.
The MCAST micro-grid electrical system contains two types of loads: essential loads and non-essential loads. The essential loads incorporate essential feeders of Blocks D, F, and J and Pump Room Load1 and Pump Room Load2 and essential Car-park Loads. On the other hand, the non-essential loads consist of each block’s non-essential feeders and AC feeders.
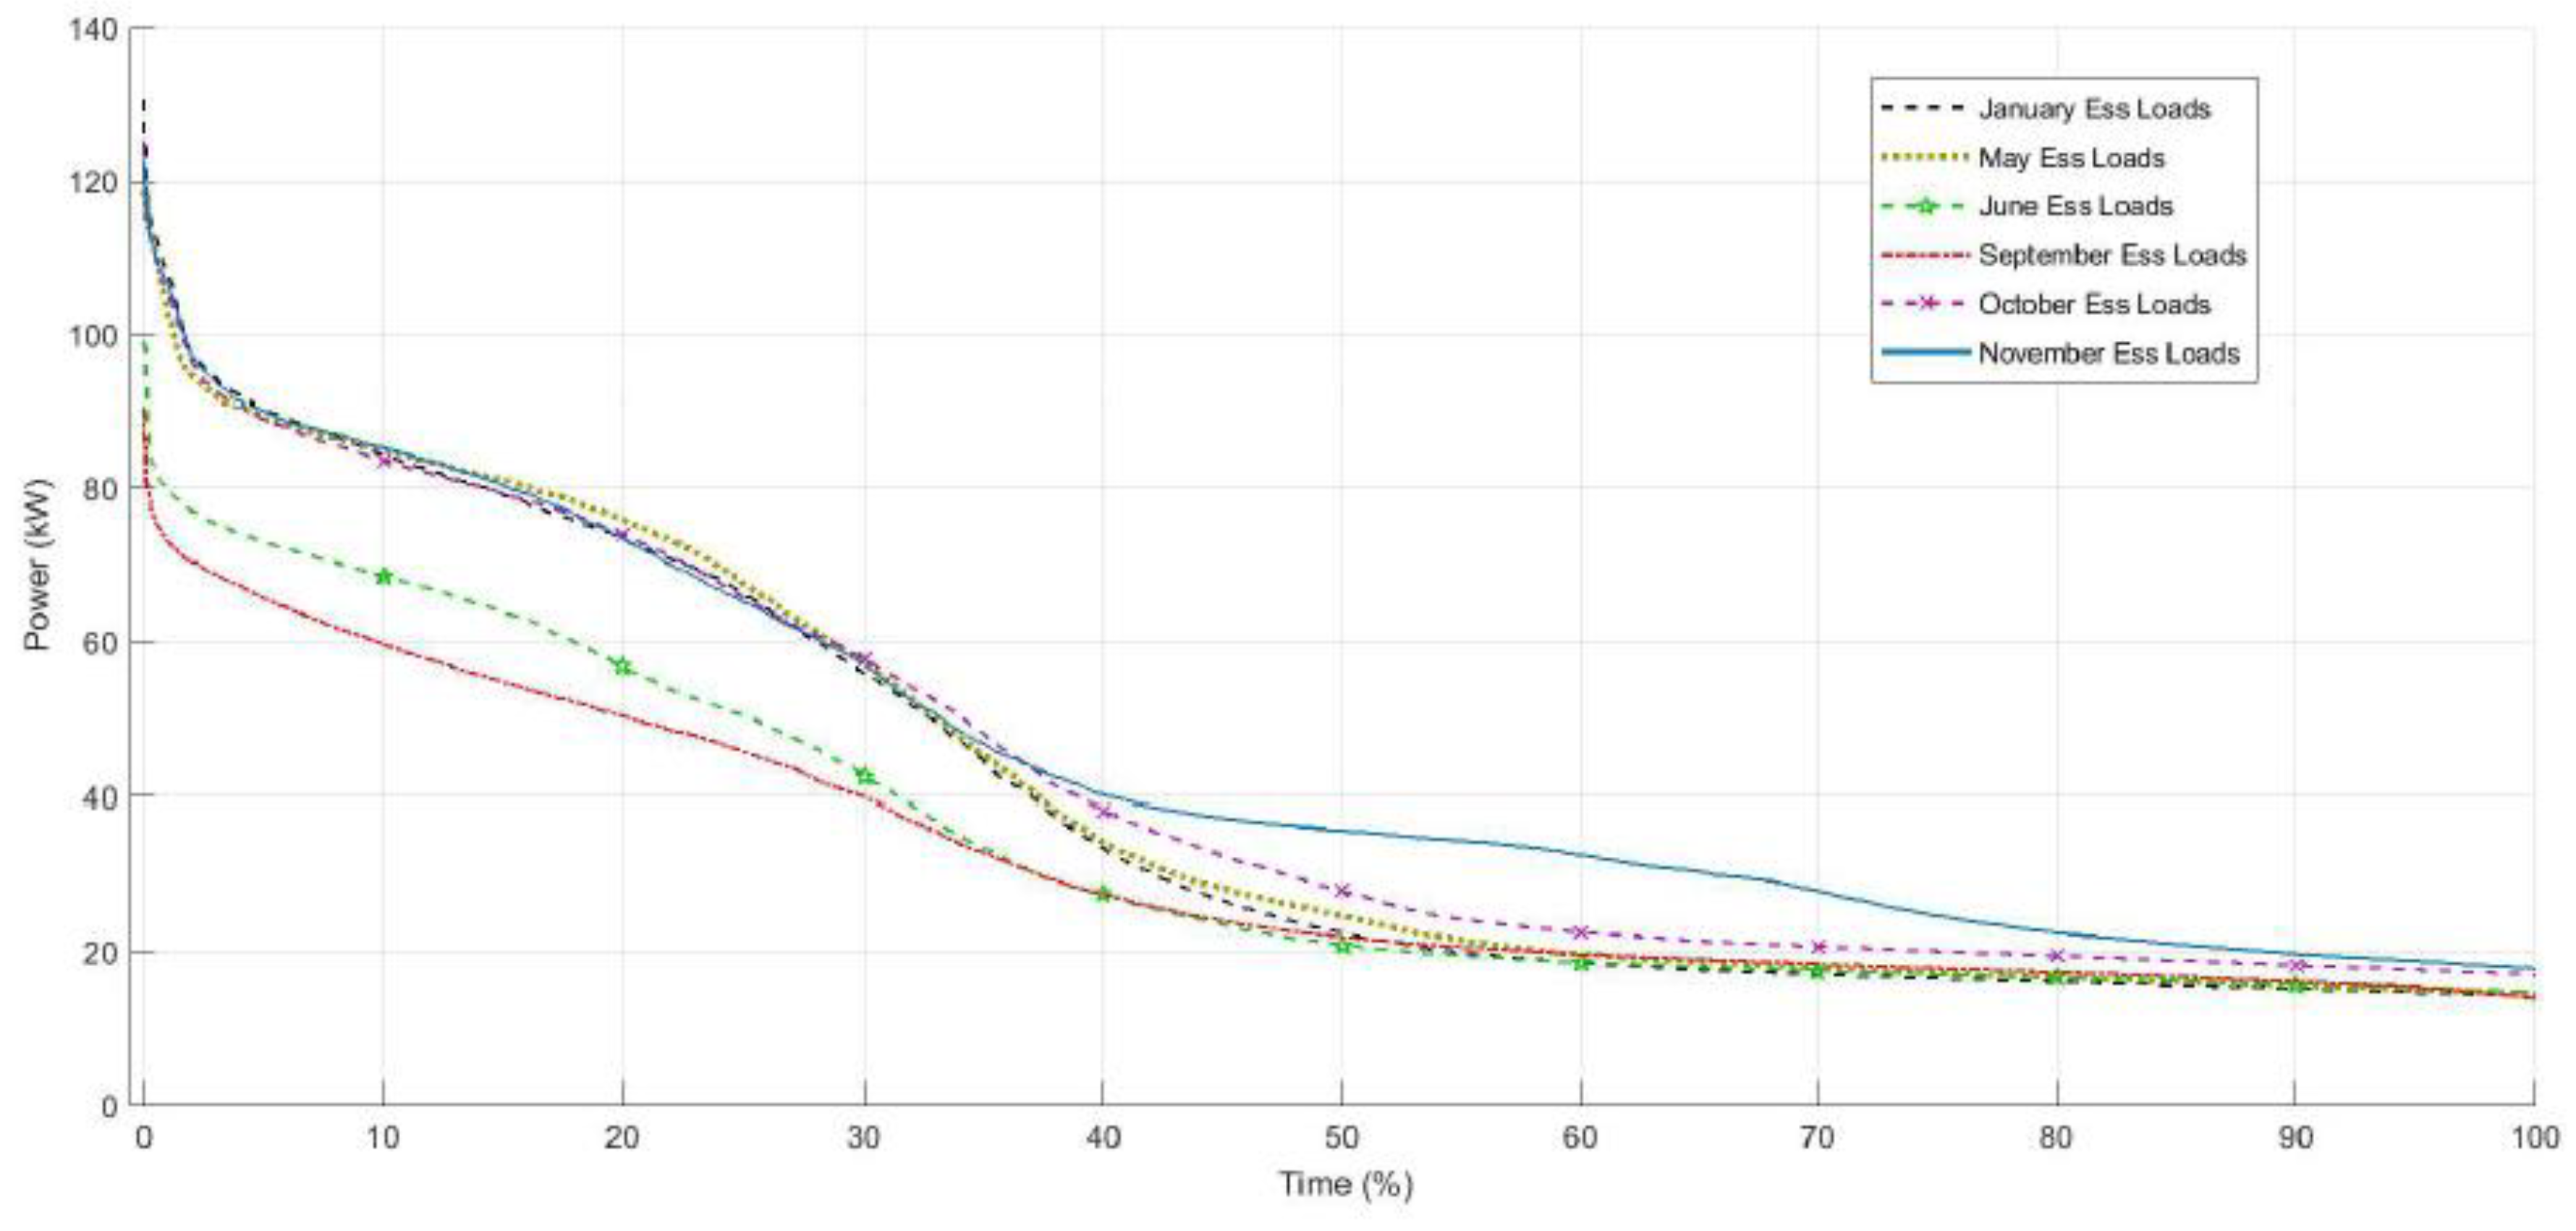
Figure 5 represents essential load demand curves during the two-year period that were considered between 2018 and 2019, depicting the maximum and minimum demands within this period. The various curves for different months appear to be very similar and have a high peak demand for a relatively short period and have a similar baseload demand between 18 and 30 kW for 60% of the time.
The highest peak demand of 130 kW for essential loads was observed in January 2019. All months between October and May have a peak load demand between 118 kW and 130 kW. Data recorded between June, July, August, and September show that the peak essential load demand is between 90 kW and 100 kW because, during these months, the campus population is reduced to a minimum due to students’ examinations and summer holidays.
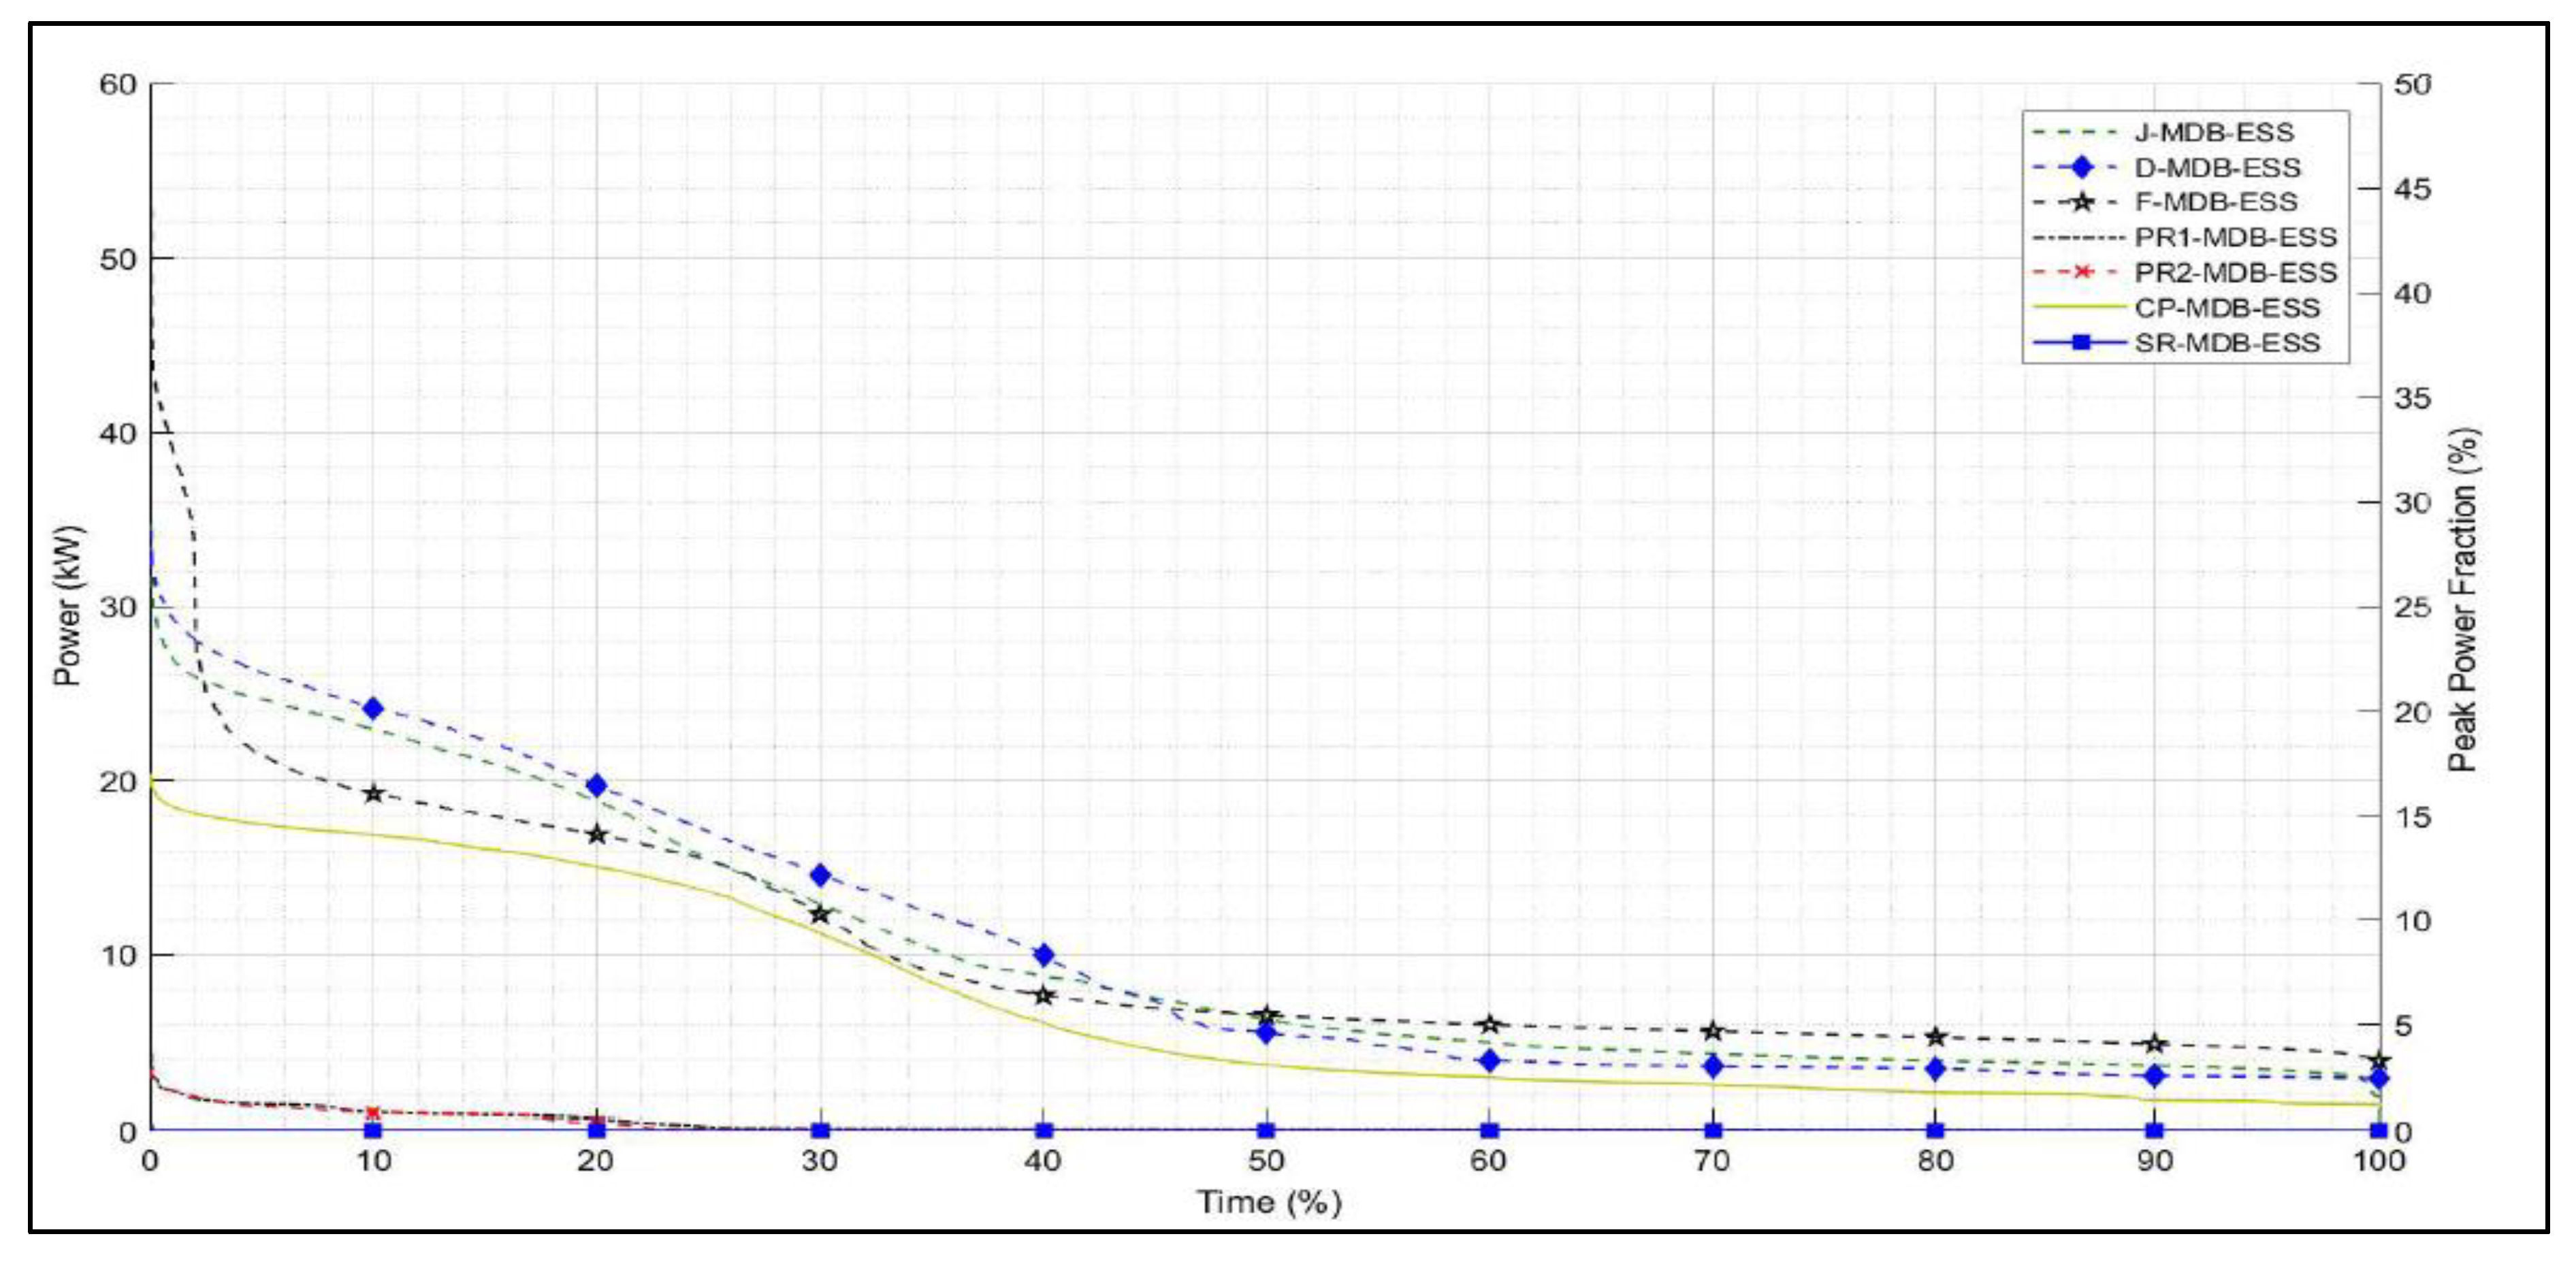
Figure 6 demonstrates the segregation of essential loads for May 2019, during which the peak power demand for essential loads was 118 kW. Again, the highest consumption feeders came out to be the essential load feeders that supply MCAST Blocks J, D, and F. J-MDB-ESS registered the highest peak power consumption of 52 kW, which is almost 50% of the total peak demand.
This initial feeders’ analysis also displays that the baseloads of all essential loads consume less than 10% of the peak load for almost 50% of the time being evaluated. Car-park feeder CP-MDB-ESS is also considered a high consumption feeder while Pump room feeders 1 and 2, PR1-MDB-ESS and PR2-MDB-ESS, and Switch Room feeder SR-MDB-ESS consume negligible power throughout all the months.
3.2.1. Daily Load-Generation Curve
Twenty-four-hour data are divided into two classes: scholastic day analysis, where the population on campus is maximum, and weekend analysis, where there is a minimum population on campus. Essential load demand curves are analyzed for both scenarios so that the backup power can be sized according to basic daily needs. This is done by comparing the PV power generation with the load-demand curves to determine the possibility of any surplus of energy generated under both scenarios.
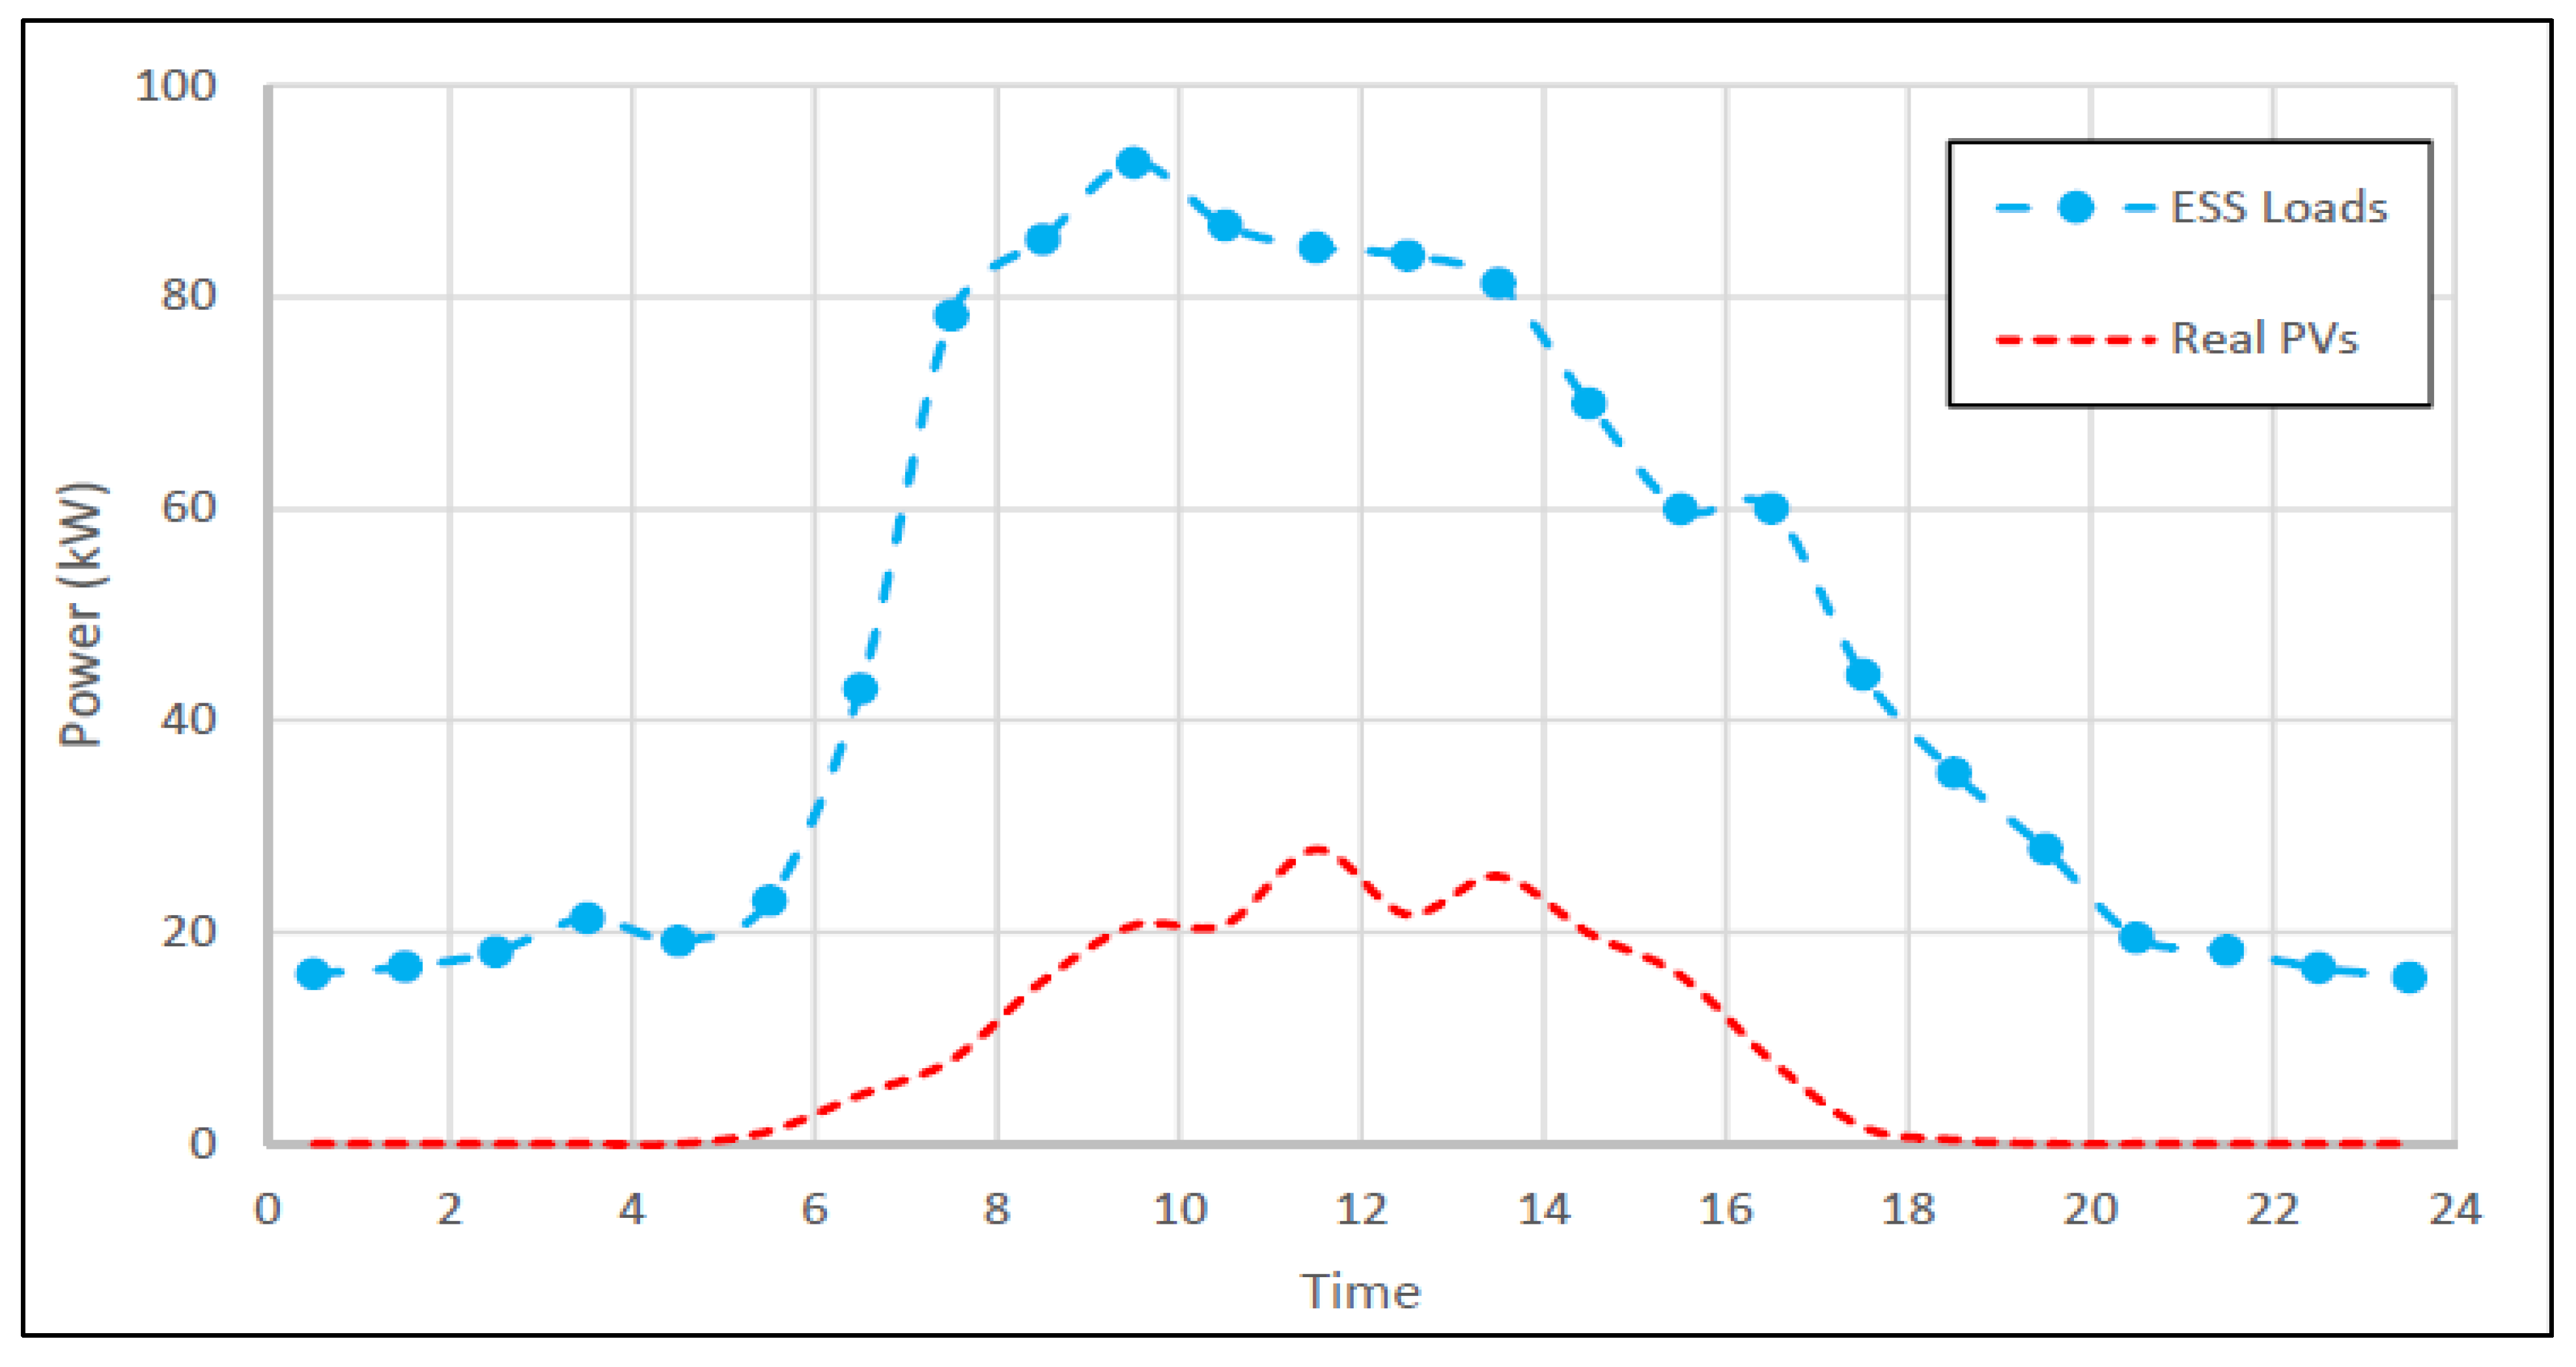
3.2.2. Scholastic Day Analysis
Figure 7 displays the recently recorded essential load profile and the PV power generation profile on a typical school day at the MCAST micro-grid. As evident from Figure 9, the load demand is significantly higher throughout the whole day, and it peaks above 90 kW around 10 a.m. On the other hand, the PV generation peaks at around noon, generating almost 30 kW. From the installed micro-grid setup, it is clear that the generation from renewable energy sources (RES) does not match the essential load demand of the three blocks. Therefore, additional energy generation is required to match the essential loads in case of power failure.
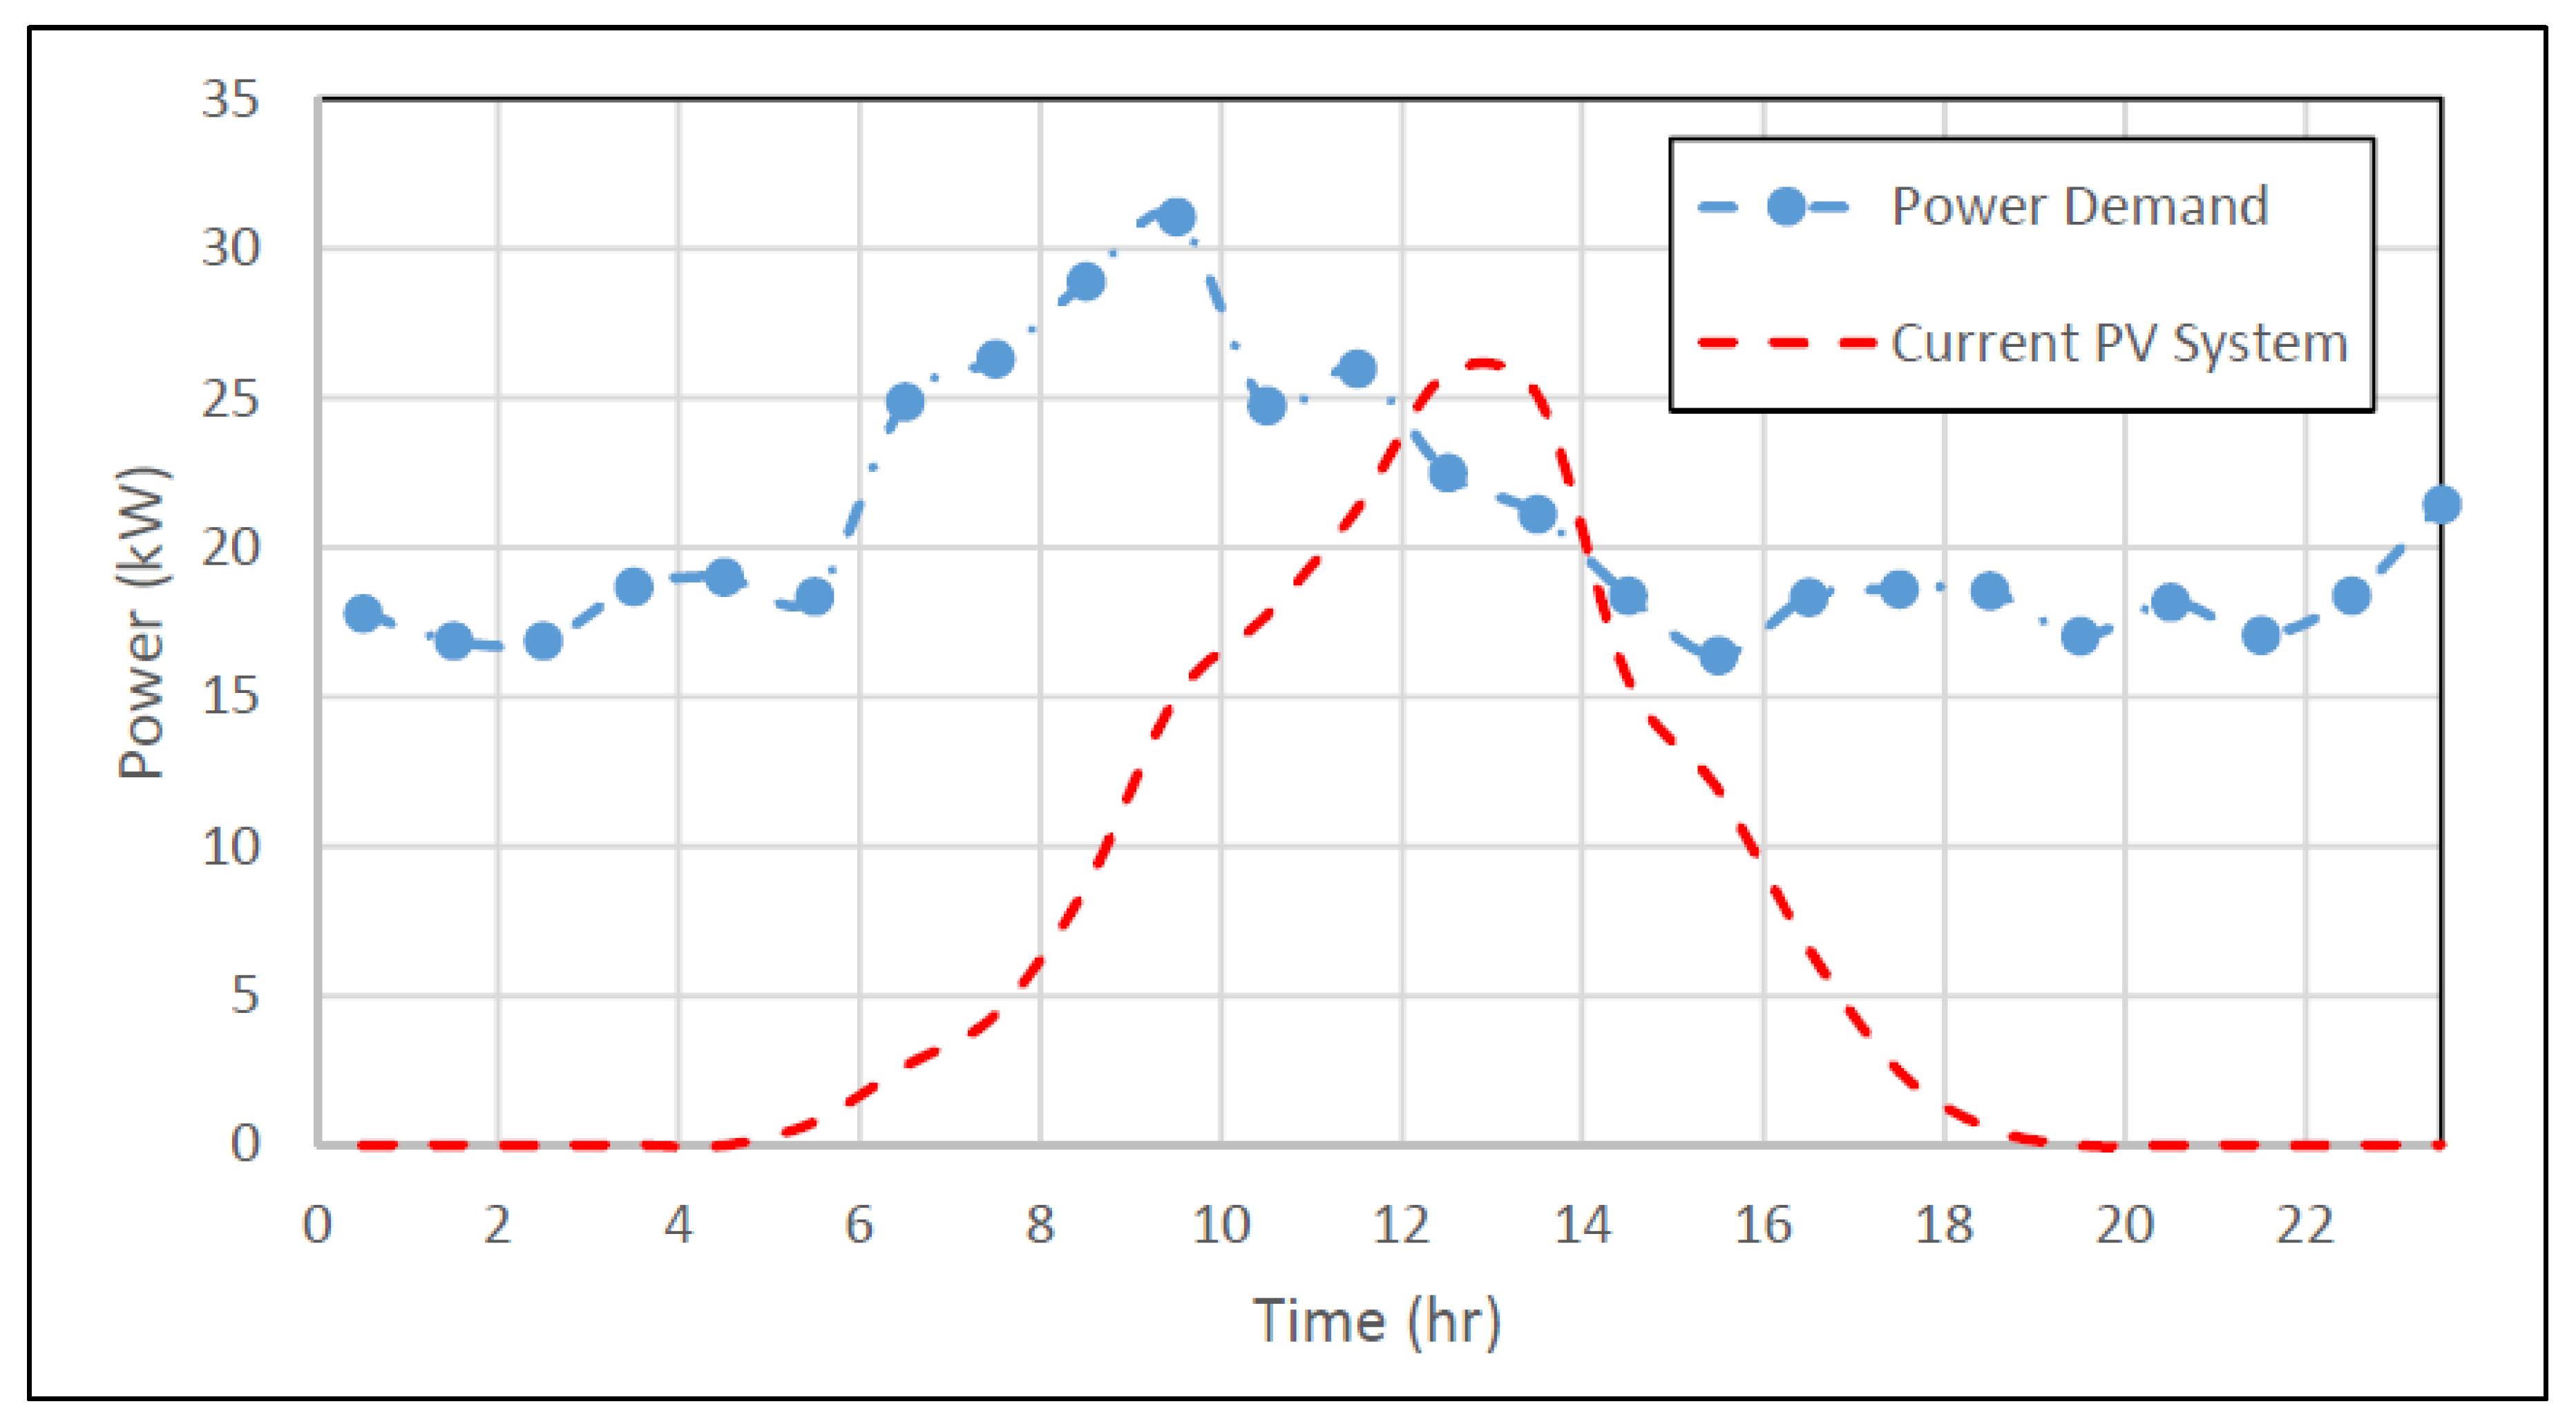
3.2.3. Weekend Analysis
On the other hand, Figure 8 represents the essential load demand on a typical Saturday when there is minimal activity on the MCAST campus. As a result, the peak essential load demand is reduced to 30 kW compared to large peak demand during the weekday, and the difference between the peak load and baseload of the essential load is reduced to 15 kW. For PV generation, a peak of 25 kW is observed between 12 p.m. to 2 p.m., ensuring the absence of surplus energy generation as the load demand curve is developed by only considering the essential loads without adding the non-essential ones.
3.3. Formalization of DERs
As previously mentioned, the PVs installed at the MCAST micro-grid are feeding energy to two types of loads, essential and non-essential loads. The total power demand can be obtained using Equation (1):
where is the total power demand, while and are the essential and non-essential loads of the micro-grid, respectively.
The power demand for essential loads can be calculated using Equation (2):
where , and are the essential loads of Buildings D, F, and J, respectively. and are the essential loads of Pump Room 1 and 2, respectively, while and are essential loads of the switchgear room and Car-park, respectively.
The essential load demand curves provide necessary data for an accurate modeling of the surplus capacity required to run the essential loads for the MCAST micro-grid. The ESS is sized to supply the essential loads for a fixed time. Once the limit of the ESS is reached, the essential loads are fed through the diesel generator.
3.3.1. Battery Energy Storage System (BESS)
The sizing of the BESS is characterized by the load demand of the system and its capacity, , is determined using Equation (3):
where is the power required by the essential loads, h is the number of hours, DOD is the depth of discharge of the battery and is the efficiency of the battery. DOD refers to the ratio between the discharged energy from the fully charged battery to the battery nominal capacity [13]. DOD can also be calculated using Equation (4):
where SOC is the state of charge of the battery at time t. The limit of BESS capacity considered in this study is 30 to 100% of the essential load capacity.
3.3.2. Diesel Generator
The capacity of the mechanical generator is evaluated using Equation (5):
where is the apparent power of the mechanical generator, and PF represents the power factor. The electrical energy produced by the generator is determined by Equation (6):
where is the rated power of the mechanical generator, while h is the number of generator operating hours. The limit of the diesel generator capacity considered in this study is 30 to 100% of the essential load capacity.
4. Modeling Potential Scenarios using a Simulation Framework
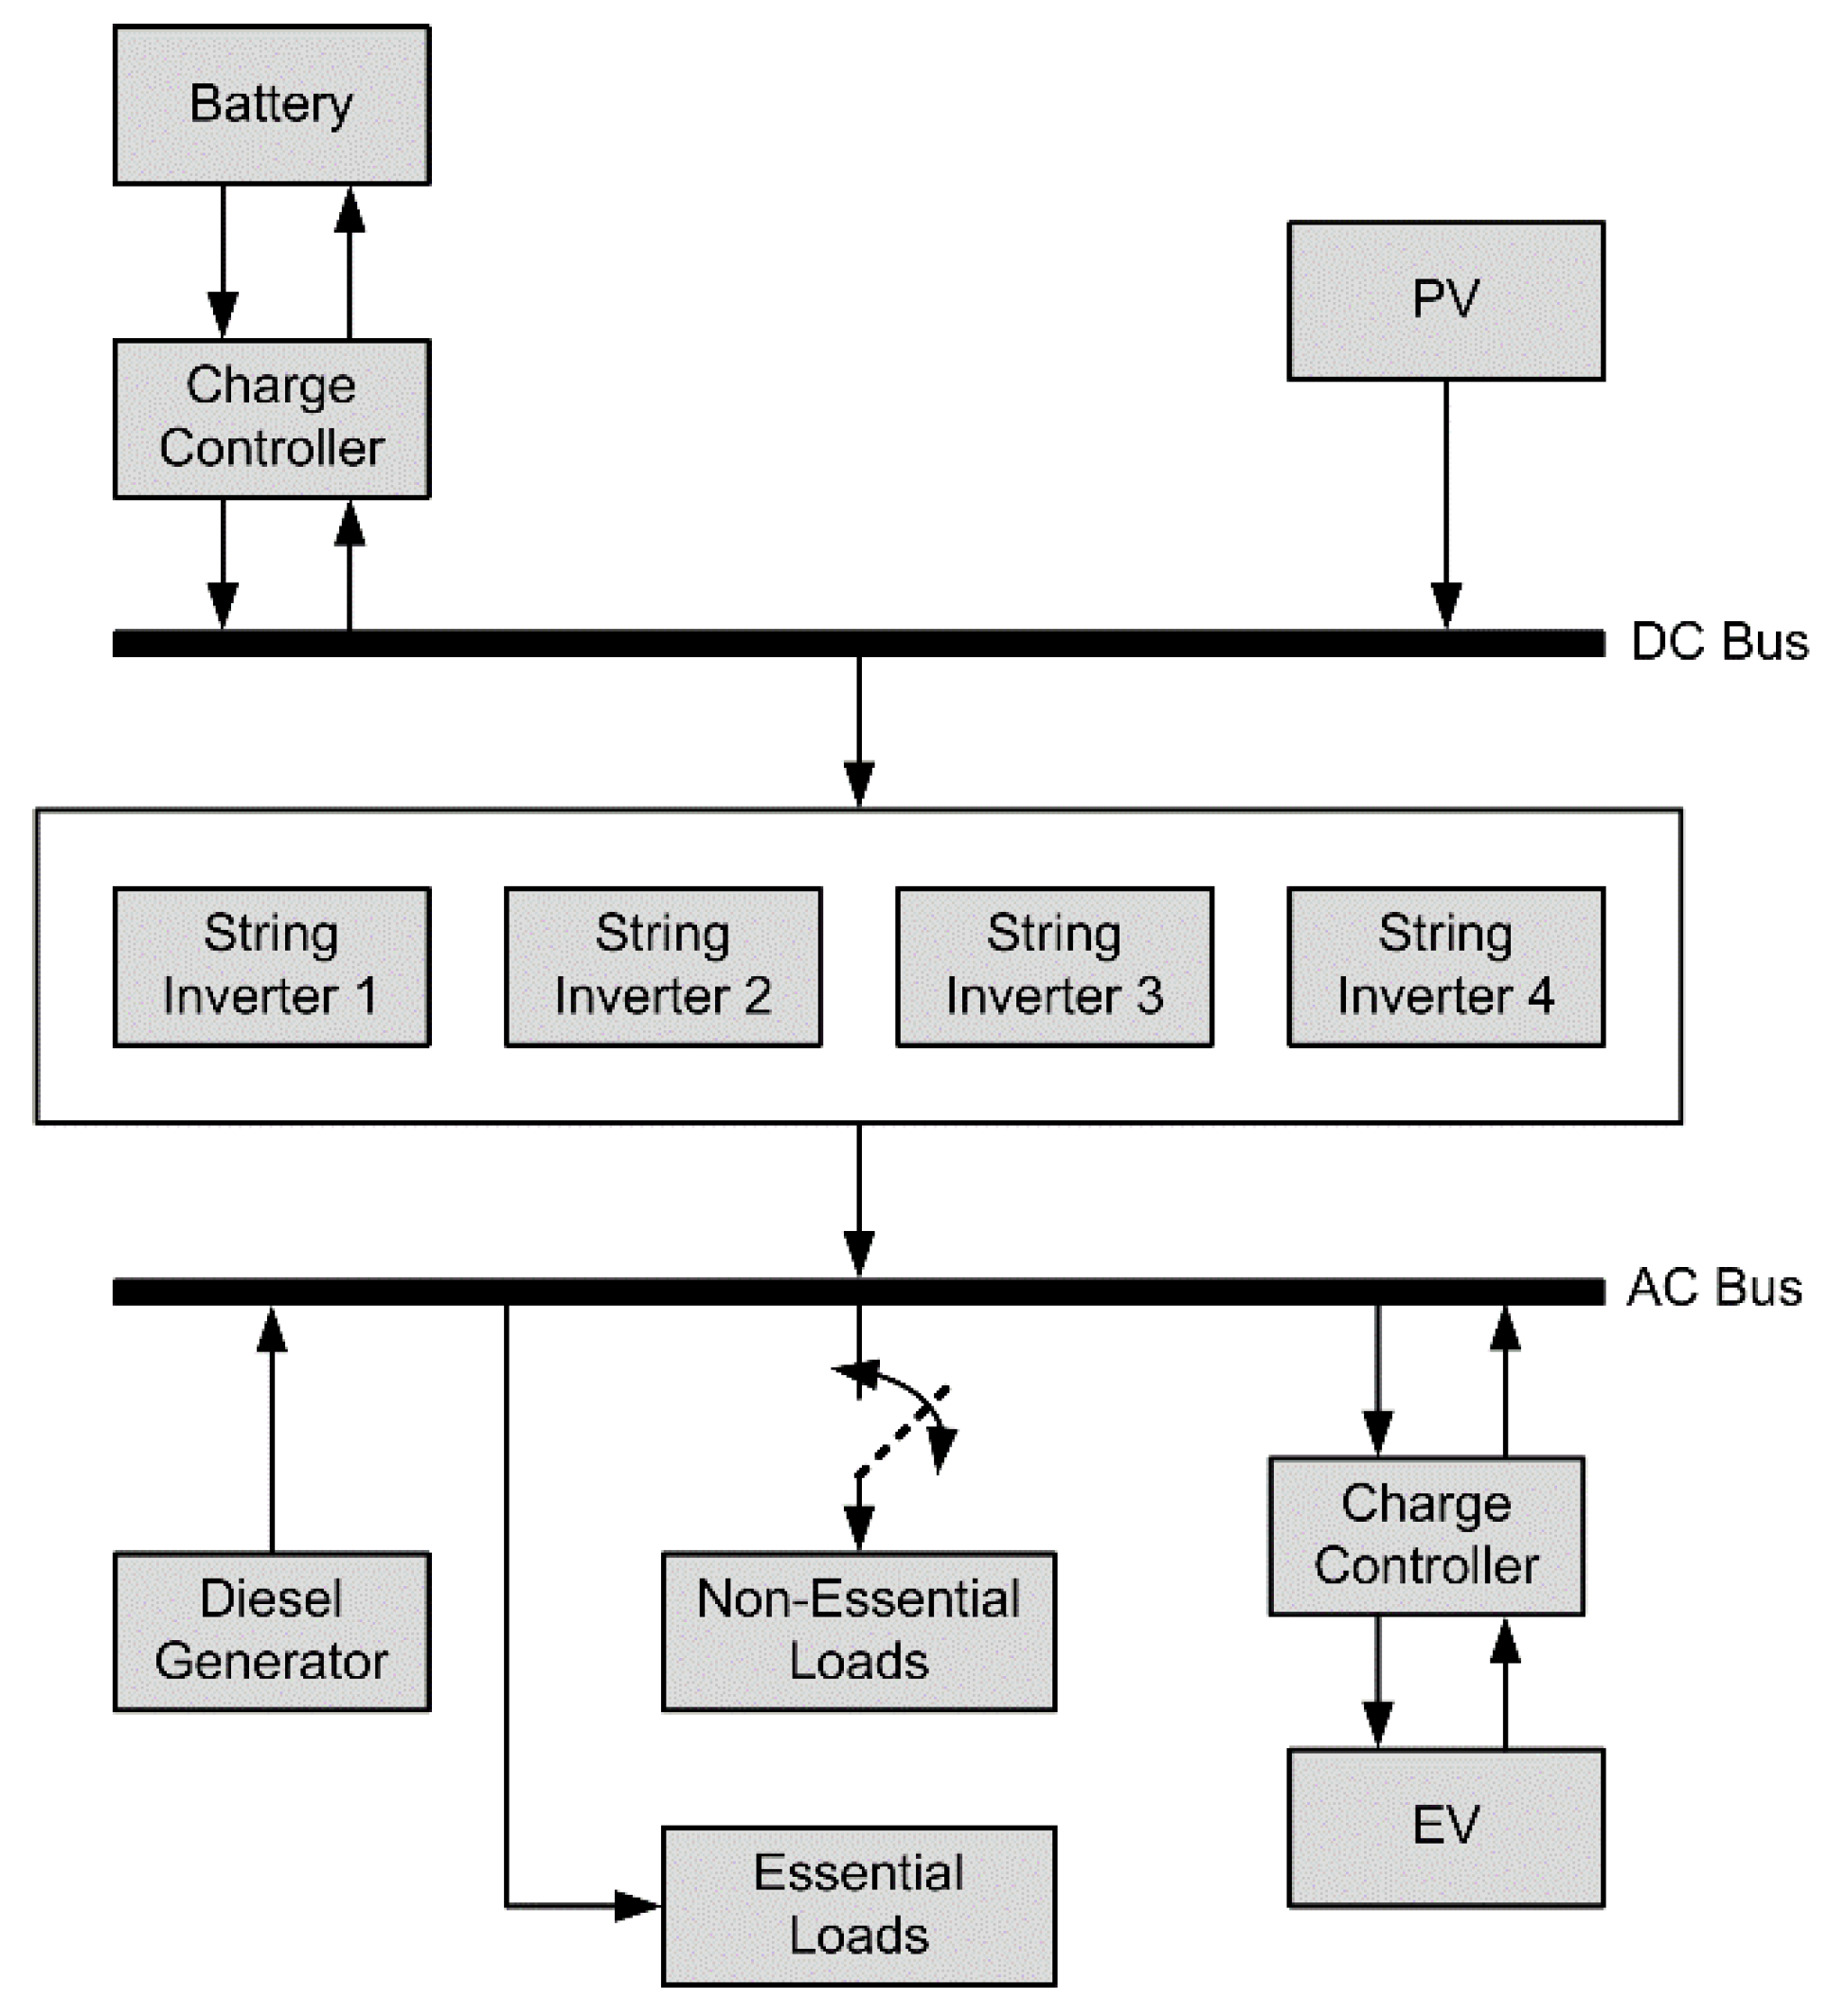
A simulation framework was built to test the behavior of the electrical network as a micro-grid, both in grid-connected mode and in island mode of operation. The block diagram showing the various DERs considered within the simulation framework is shown in Figure 9. The initial capacity of these sources within the micro-grid was determined based on the present load capacity of the system. The total load demand and PV generation within the presented framework were taken directly from the smart meters, and this real-time data helped increase the accuracy of the simulation study.
The values of all micro-grid system components and their various parameters are obtained from smart meters. Since these components are considered non-ideal to emulate the micro-grid’s real-time behavior, both active and reactive power values are utilized within the simulation study. The initial capacity of the DERs within the micro-grid is evaluated using the equations mentioned in Section 3.3 and is implemented in the simulation framework to analyze the performance of the current micro-grid. The initial capacity is then updated to obtain the optimum battery capacity while increasing the reliability of the micro-grid and minimizing the initial cost of the system. The grid is considered as an ideal source with 400 V, 50 Hz as supplied by Enemalta PLC, the sole energy supplier in Malta.
An investigation is carried out for the current MCAST micro-grid considering the following case studies:
- Case 1: Without energy storage
- Case 2: With increased PV generation
- Case 3: With integrated energy storage and diesel generation
- Case 4: With integrated EVs
The principal aim of the simulation study is to increase electric power reliability in case of power cuts. A BESS is used as a backup for the essential loads, a diesel generator as the dispatchable source is considered, and the overall system performance is evaluated.
The different case studies are simulated to forecast the behavior of the electrical network. Two general days in May 2019 are considered for the case studies, i.e., a typical weekday and a weekend. In the figures ahead, the positive axis represents the power demand, in kVA, by the system loads, while the negative axis represents the power supplied to the system by the DERs or by the main grid. The case studies were simulated for one whole day, except for one case scenario of case 3, where the system was simulated for two days to represent a power cut during the night.
4.1. Without Energy Storage
In this case study, the present behavior of the micro-grid is investigated, and the system is running without energy storage. The essential and non-essential loads are utilizing the energy generated from the PVs, and the main grid makes up for the remaining energy demand. When there is surplus energy from PVs, it is injected into the grid. Since the rated PV capacity is less than the total power demand, all loads are switched off in case of power cut from the utility.
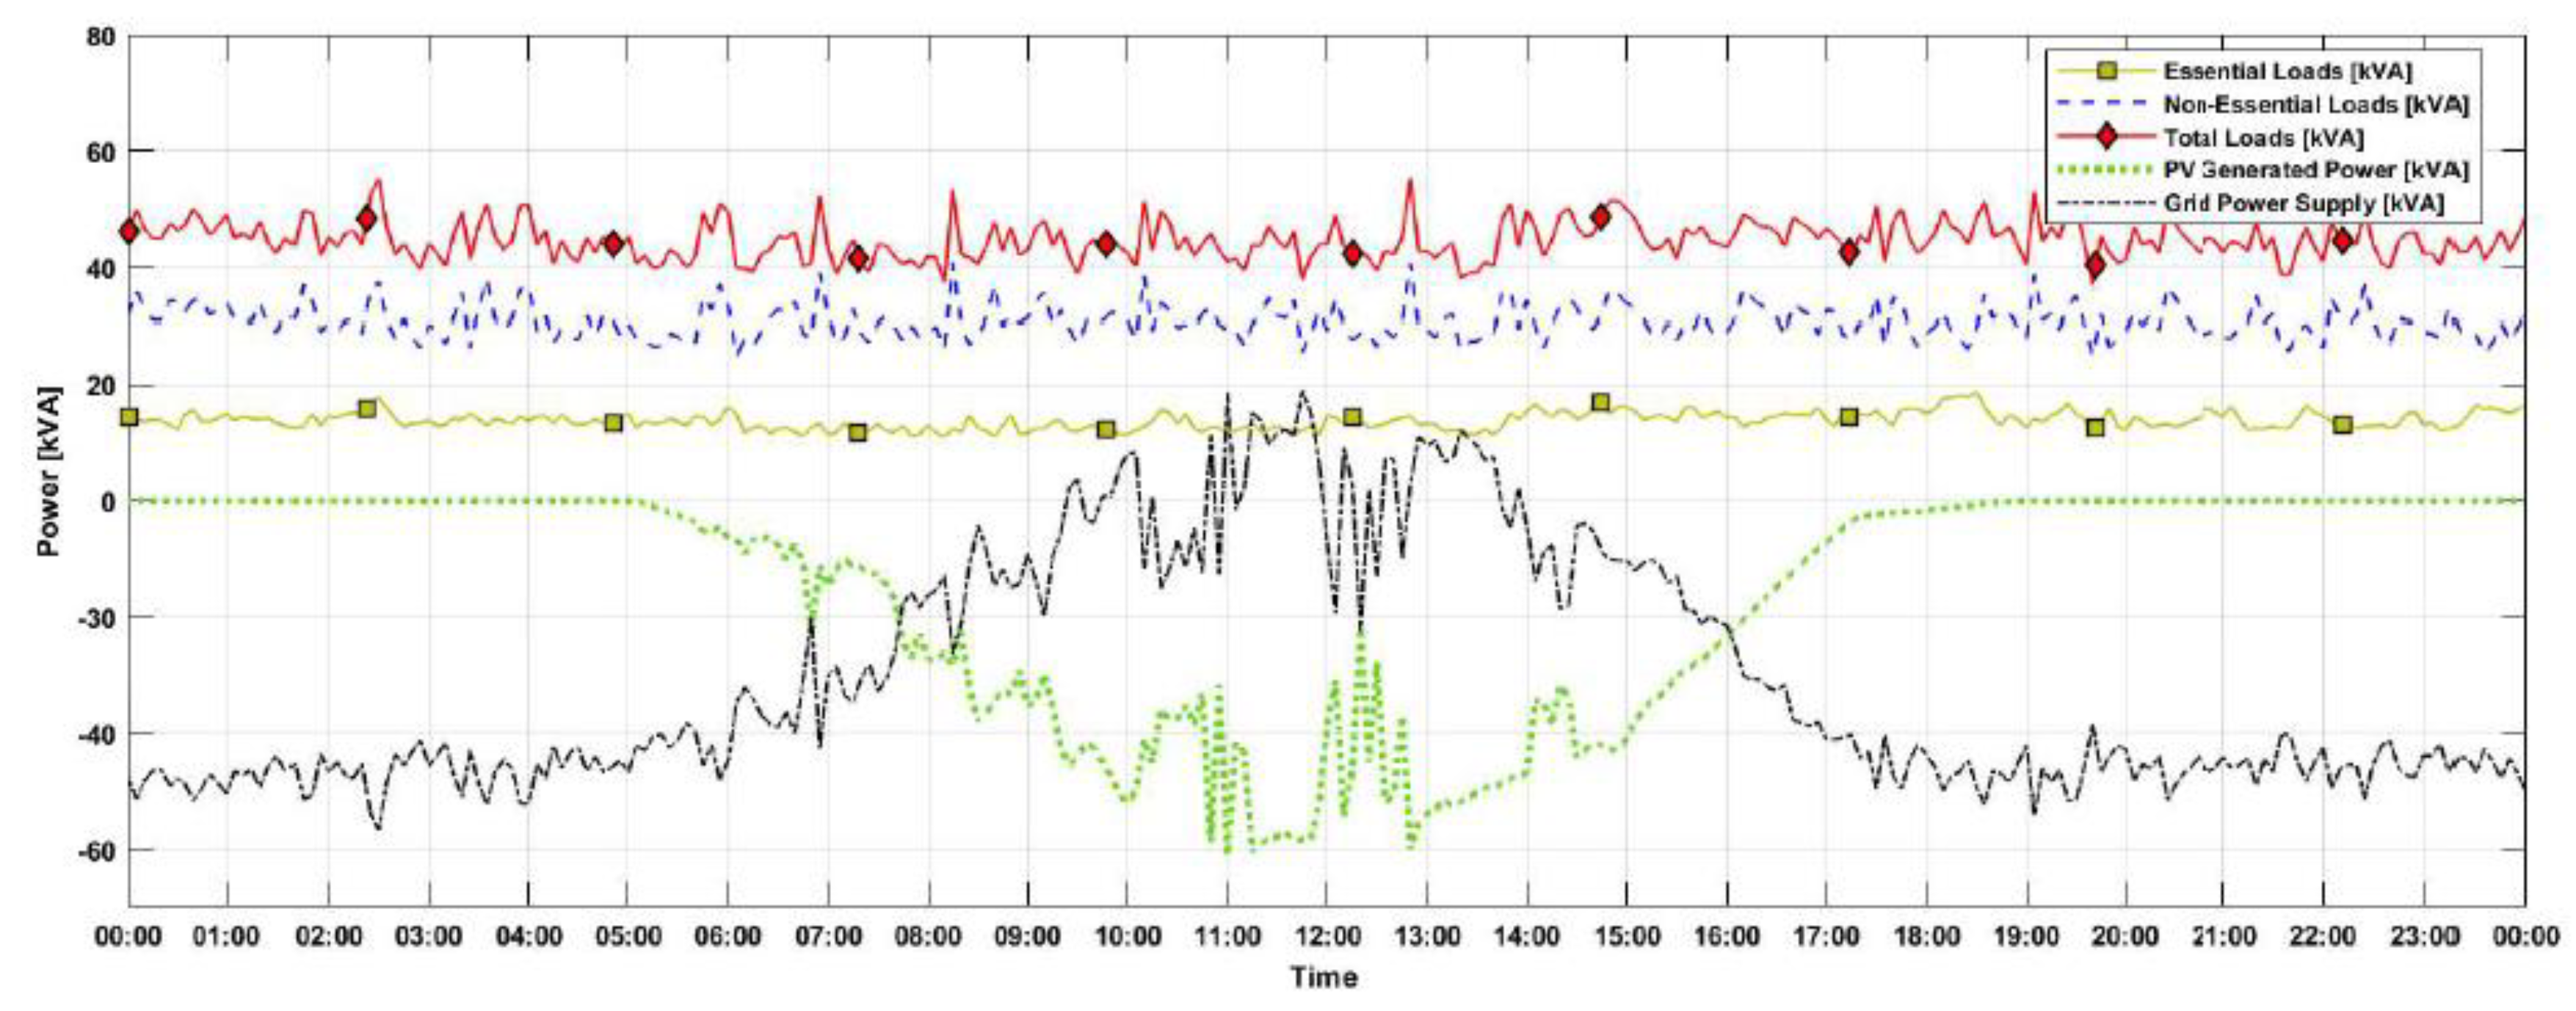
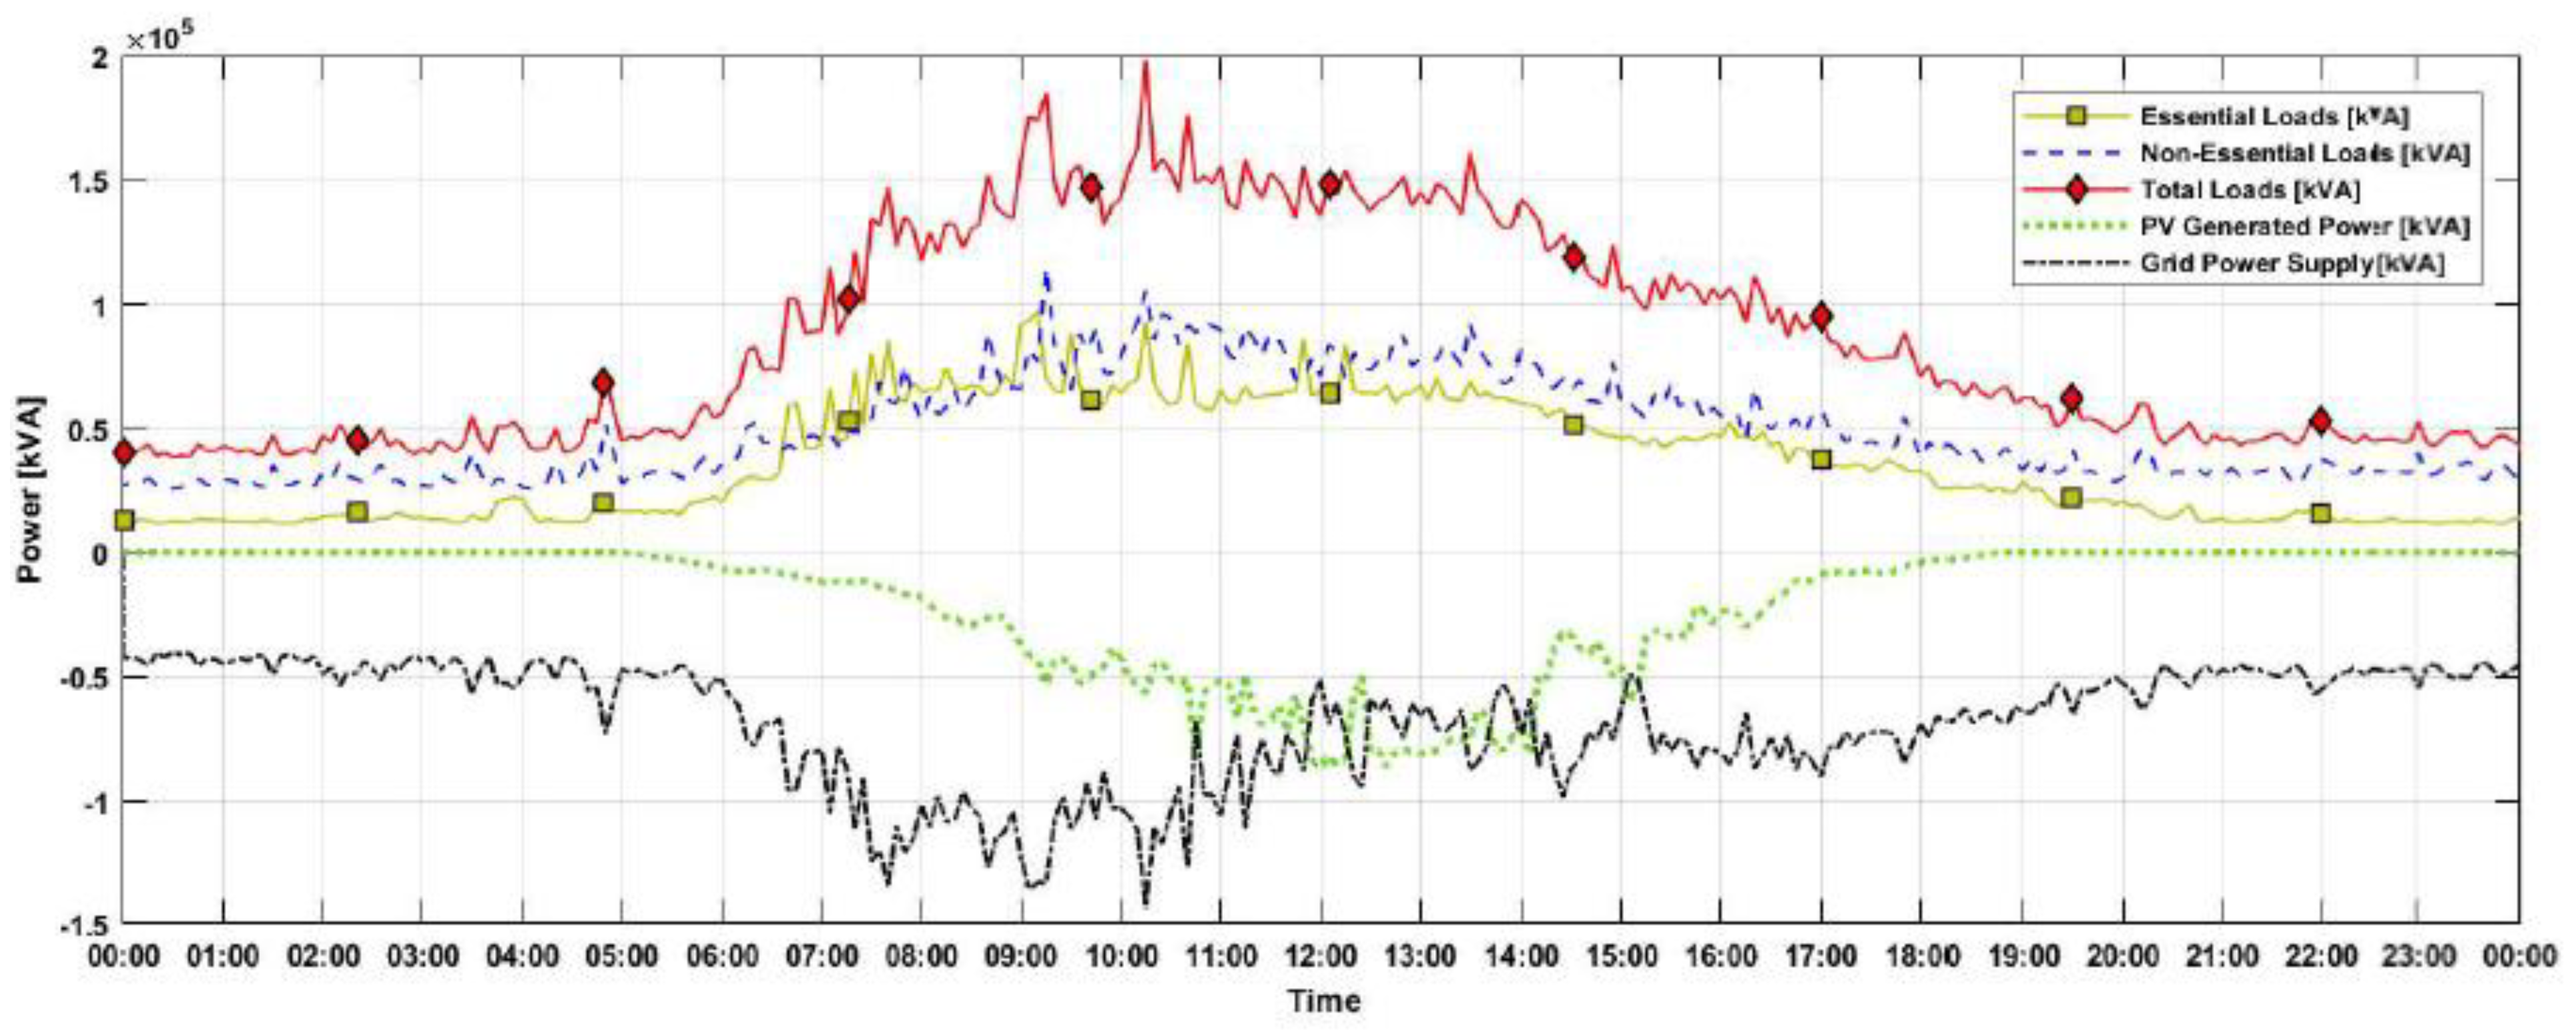
Figure 10 illustrates the first case study of the proposed three MCAST buildings showing the behavior of the total load demand (red) that is the summation of the essential loads (yellow) and non-essential loads (blue), the power generated from 63 kWp PVs (green), and the power supplied from the main grid (black) during a typical weekday. Figure 10 shows that an initial increase in total load demand occurs after 6 a.m., with the total demand increasing gradually from 50 kVA to 100 kVA until 7 a.m. The peak total demand occurs between 9 a.m. and 2 p.m., where the power demand is above 150 kVA. The total load demand decreases after 2 p.m., where the load goes from 150 kVA to 50 kVA during the night. The variation in essential load demand occurs during the day as it increases from around 20 kVA to almost 60 kVA as the campus population reaches its maximum. The non-essential loads, which incorporate the HVAC system, have a baseload demand of 40 kVA. This peaks at 100 kVA after 9 a.m. The peak load demand occurs just after 10 a.m., with a load demand of 200 kVA, which is made up of 100 kVA of essential loads and 100 kVA of non-essential loads.
The 63 kWp PV system’s output also peaks between 11 a.m. and 1 p.m., reaching about 60 kW. The PV system generates a substantial amount of power between 7 a.m. and 4.30 p.m. The grid power illustrated by the black dotted line shows that it fills the difference in power needed by the system. Therefore, at the peak power demand of 200 kVA, the PV system generates 50 kVA while the main grid supplies the 150 kVA power difference required by the buildings.
On the other hand, Figure 11 represents a typical day on campus during the weekend where the population is reduced to a minimum. The total power demand by the three buildings is relatively constant and varies between 40 kVA and 55 kVA, as shown in Figure 11. Having a similar PV generation output as measured during the weekday, the power needed from the grid is substantially reduced to 50 kVA. When the PV generation is at maximum, surplus PV power is injected into the grid. This occurs mainly between 11 a.m. and 2 p.m.
4.2. With Increased PV Generation
In the second case study, the system’s behavior is investigated by increasing the PV capacity from 63 kWp to almost 95 kWp, thereby increasing the current generation by a factor of 1.5. This scenario could be easily implemented due to available space on the rooftops of Blocks F and D. The same real-time data of Case 1 is employed in this case study, and the main grid covers the power mismatch between the load demand and the power generated from PVs.
Figure 12 displays the effect of increasing the PV system from 63 kWp to 94.5 kWp during a typical weekday. The simulation results show that the peak generation is increased from 60 kW to 90 kW between 12 p.m. and 2 p.m. Thus, although the supply from the main grid remains 150 kVA at about 10 a.m., the power required from the main grid is reduced significantly when the PV generation is at its maximum.
The impact of increasing the PV by the same ratio on a typical weekend is illustrated in Figure 13, where the peak power generation occurs between 11 a.m. and 1 p.m. Since the power consumption is relatively low (about 50 kVA only) for the entire day, energy is transferred back to the grid from 7.30 a.m. until 3 p.m., where the PV power generated is above 40 kVA. This surplus energy could also be utilized locally instead of transferring it back to the main grid by developing the concept of load shifting during some days when the population at MCAST is low.
4.3. With Integrated Energy Storage and Diesel Generation
In this case study, the micro-grid’s BESS is made up of lithium-ion battery banks, which are 95% efficient and have 3000 life cycles. This indicates that the energy system will last long enough even if it is discharged twice/thrice a week. Furthermore, as previously mentioned, the peak essential load demand during a typical school day is 120 kW, which lasts for a brief period while having a baseload demand of around 30 kW.
The size of the battery banks is estimated to accommodate the essential loads for 2 h. The rated battery capacity is calculated at 250 kWh. This capacity of the ESS is deliberated on days during which the PVs generate nothing, and therefore, the backup system should cater to the essential loads completely when power cuts occur during nights or cloudy days. The rated capacity of the diesel generator is evaluated at 150 kVA to cater to the system’s inefficiencies. This case study was simulated, and the overall system was analyzed and finally improved to reduce the initial cost of the BESS.
Different scenarios are implemented within this case study. Power cuts during different times on a typical working day are simulated and analyzed. The initial capacity of the BESS was revised to adapt to the MCAST scenario according to the needs of the electrical system, which improves the overall performance of the micro-grid.
The battery energy storage system was programmed in such a way to ensure fast charging when the microgrid is connected to the utility. To improve the performance of the micro-grid during island mode, the battery storage was programmed to supply power to all loads until its SoC is above 50%. At 50% SoC, the non-essential loads are shed, and the battery storage only supplies the essential loads until its SoC reaches 30%. Once the battery SoC reaches 30%, the generator starts supplying power to essential loads. The battery starts to charge again when power from the main grid is re-established or when there is a surplus of energy generated from the PV System. The integration of this BESS helps to increase the utilization of localized energy generated from the PV system.
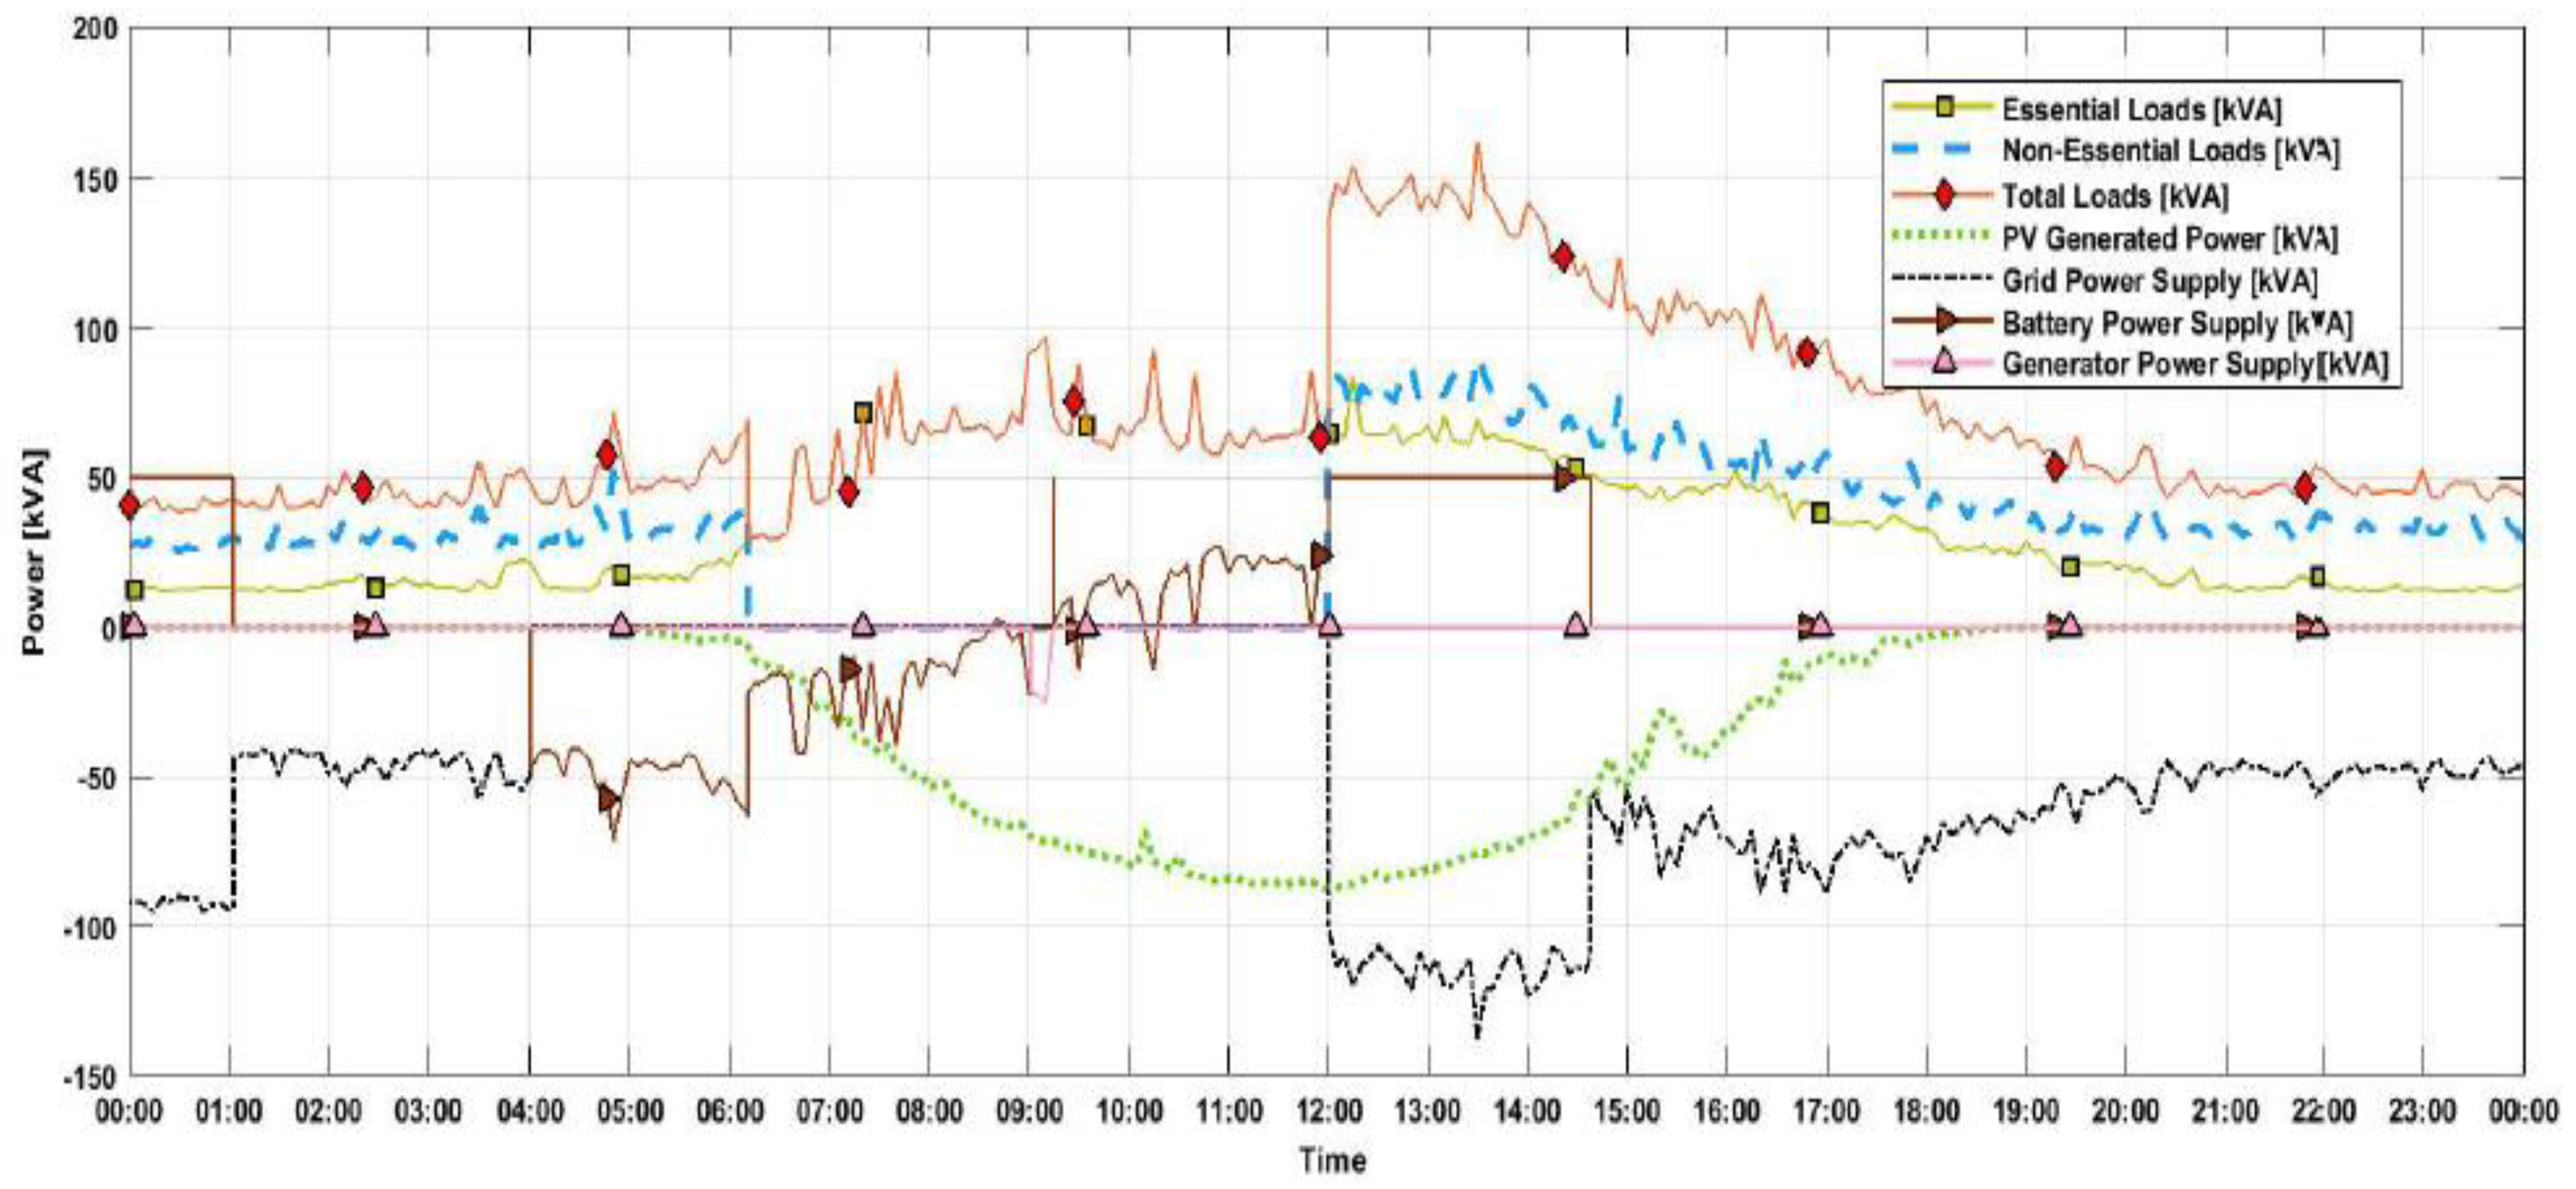
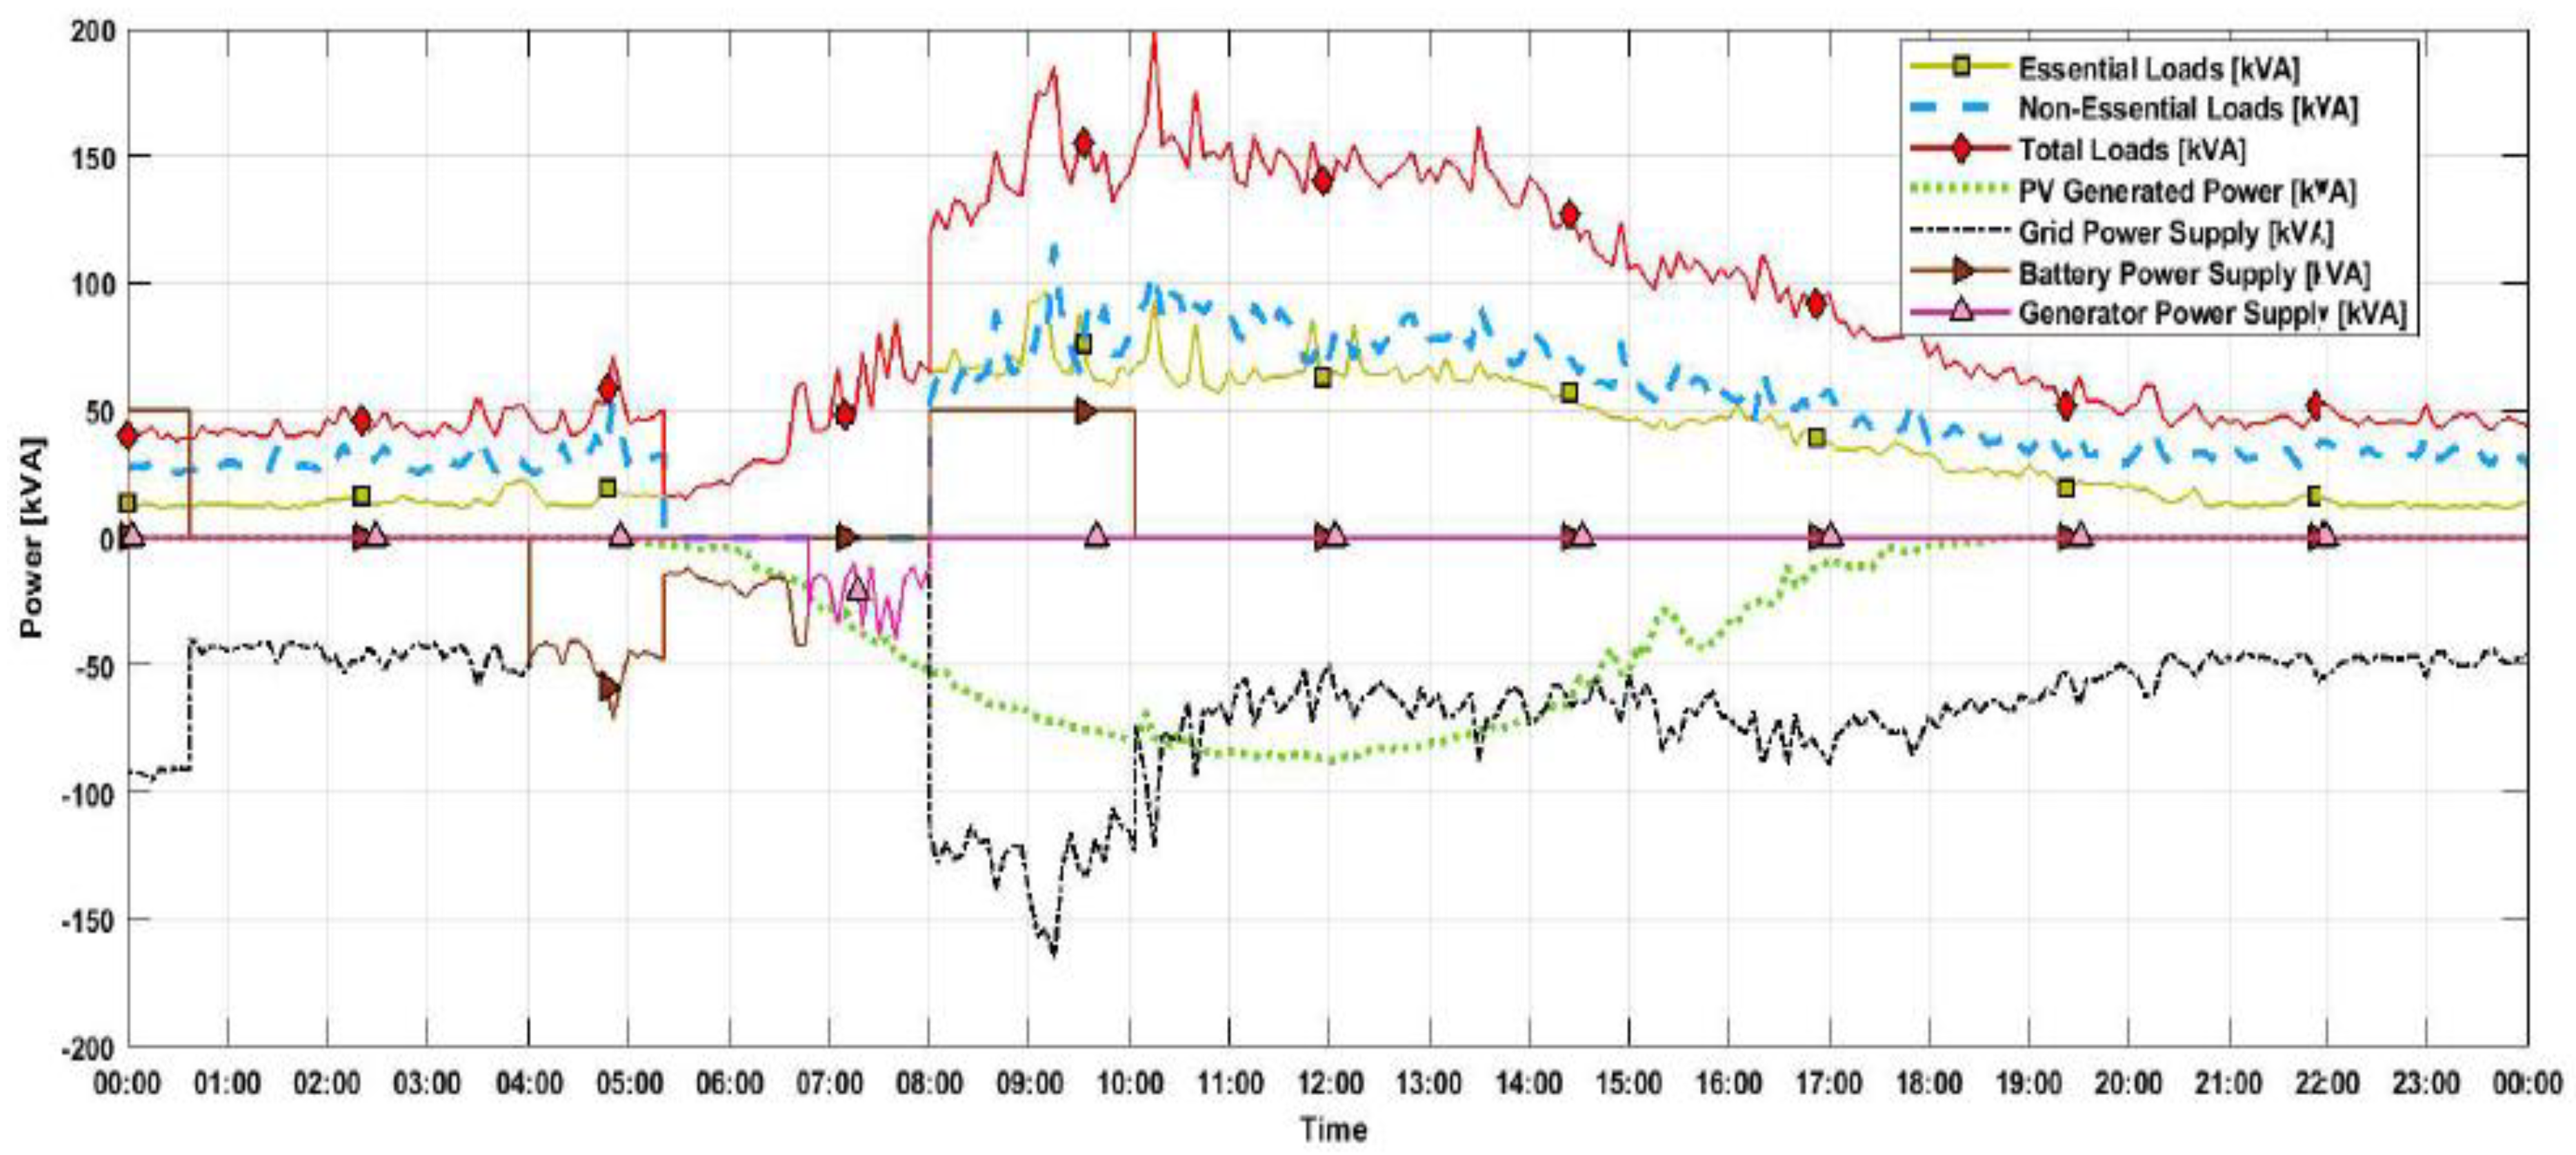
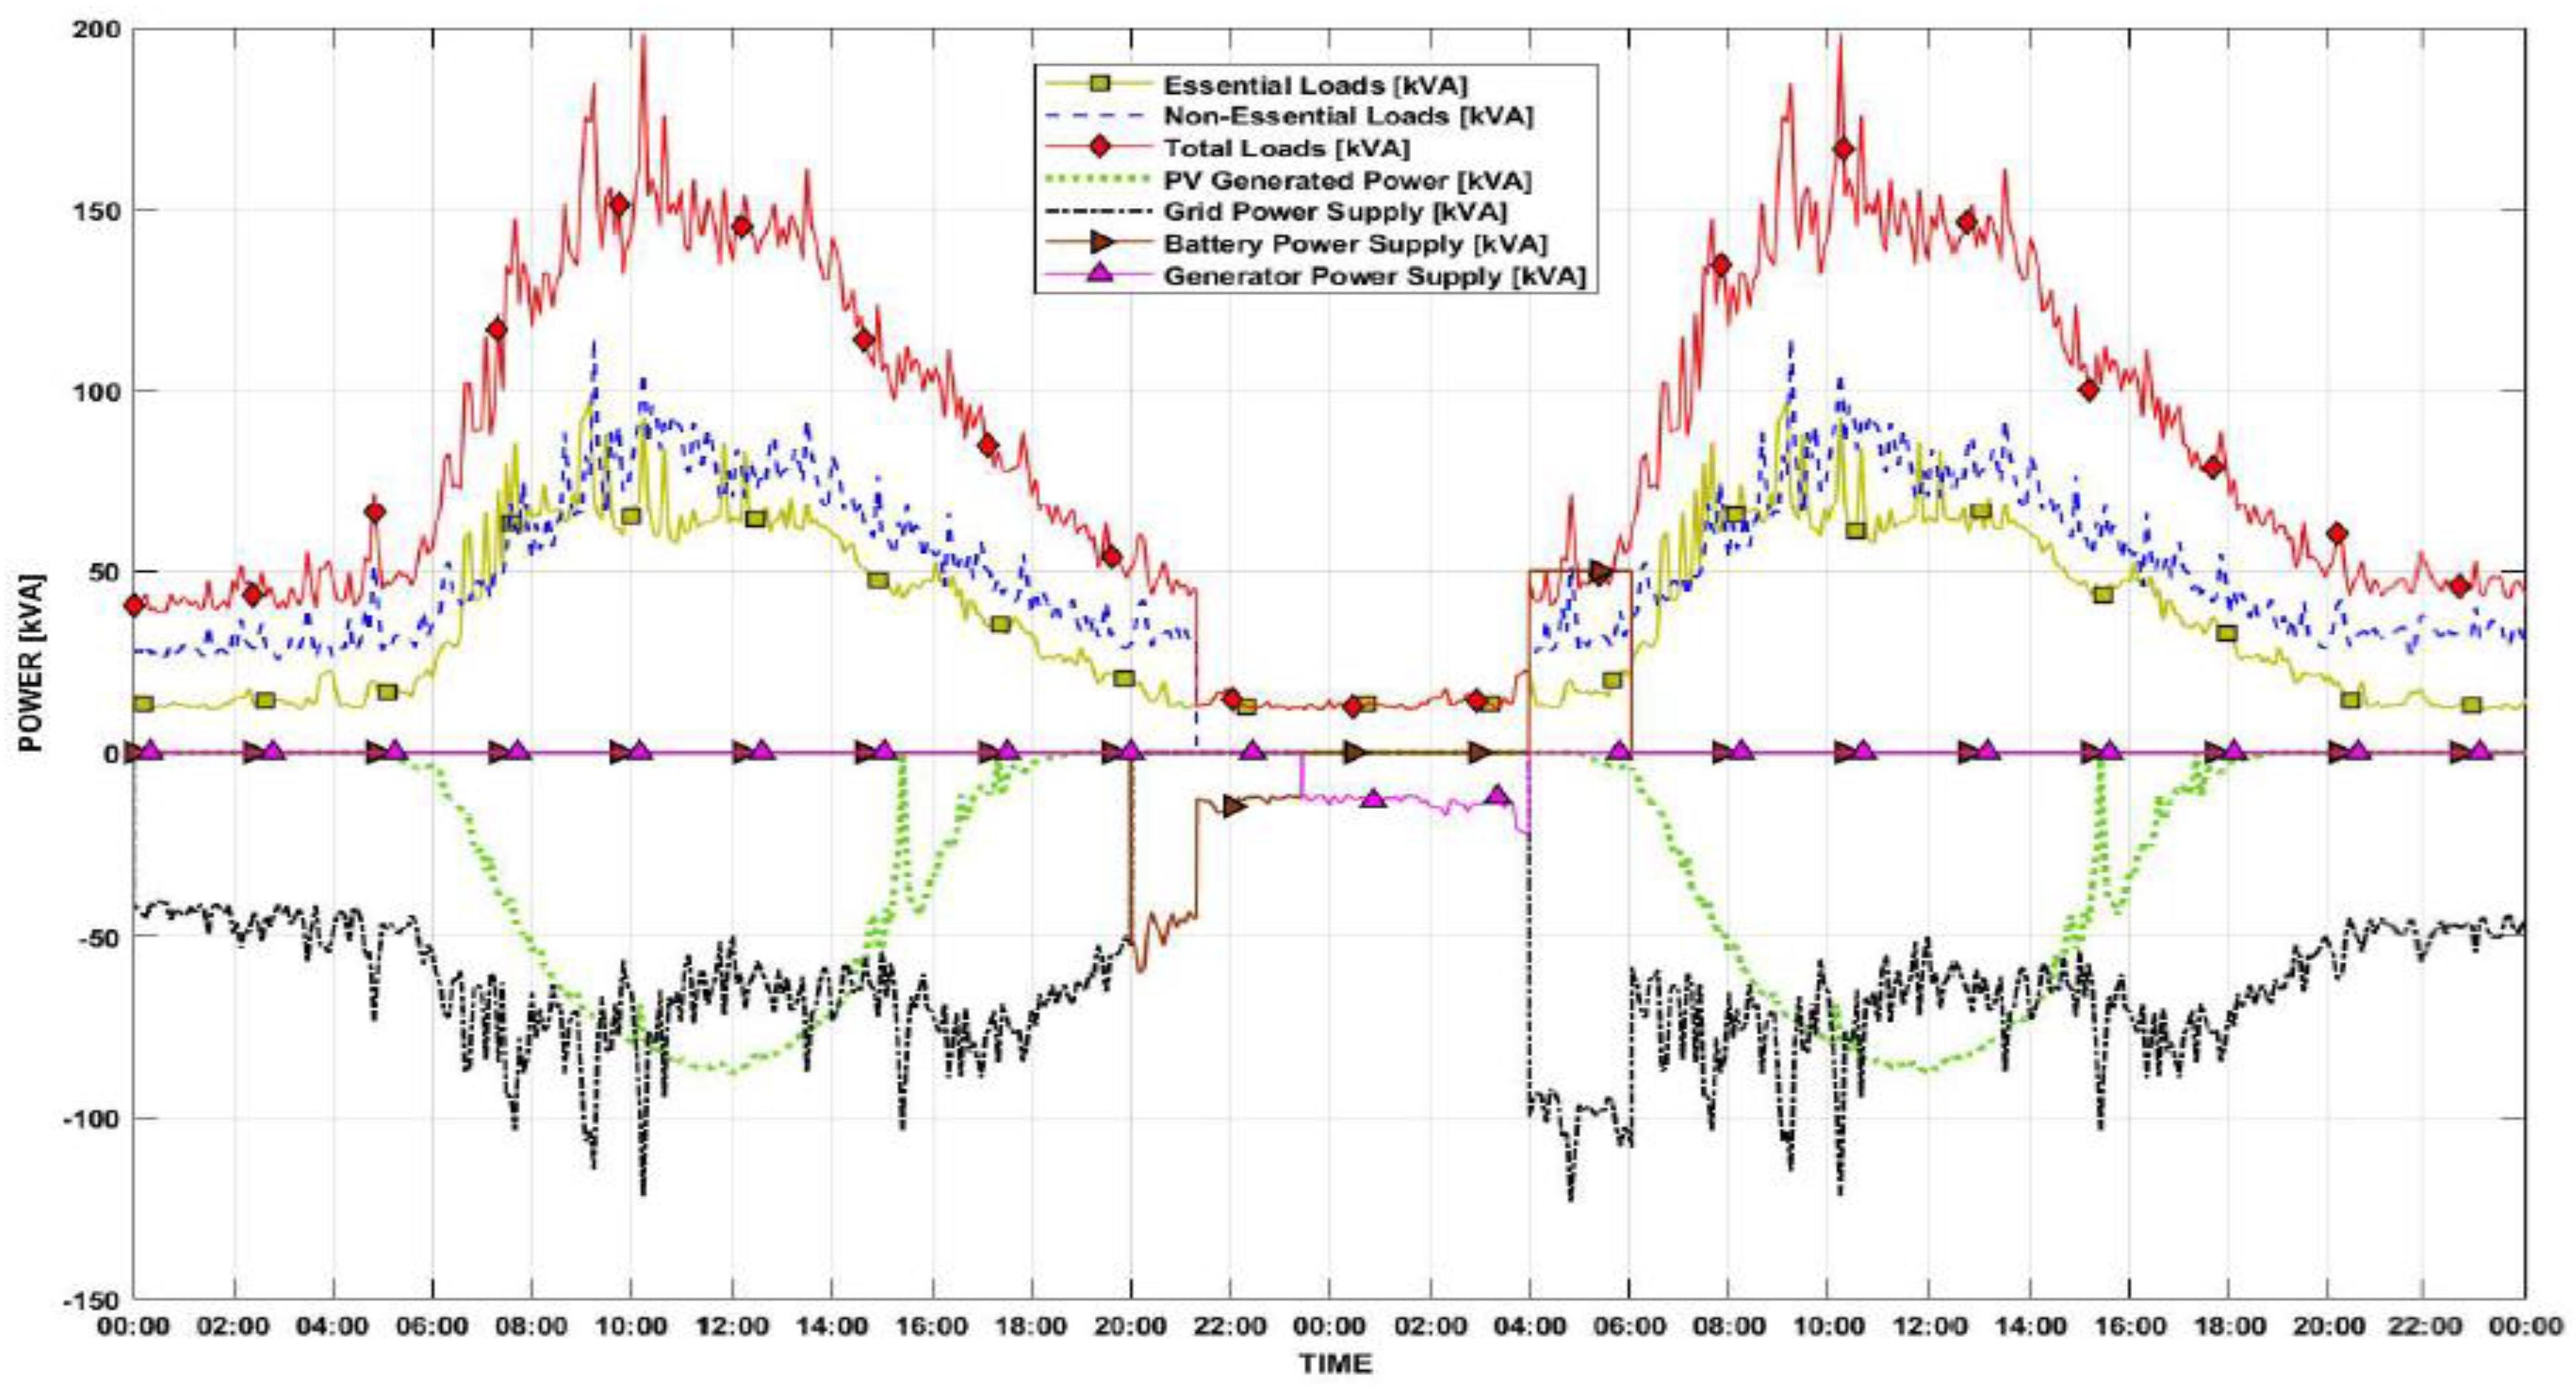
In the first scenario of case study 3, a 250-kWh battery storage was integrated into the electrical network of the MCAST micro-grid. An 8-h power cut occurs at 4 a.m., as illustrated in Figure 14. During the first hour, the battery is being charged as it is assumed that the battery SoC is not at 100%. At 4 a.m., there is a disruption in the power supply from the main grid, and the battery starts supplying power to all loads.
Just after 6 a.m., the non-essential loads are shed, and the BESS only feeds the essential loads. In this case, the required power demand to run the essential loads is delivered by battery and PV system.
Since the non-essential loads are switched off, the PV generation almost matches the demand for the essential loads after 8 a.m. Therefore, the diesel generator is only needed for about 15 min after 9 a.m. Then, between 9 a.m. and 12 a.m., the battery starts to charge again using the surplus energy generated from the PV System. When the power is restored, the battery continues to charge until it reaches 95% SoC.
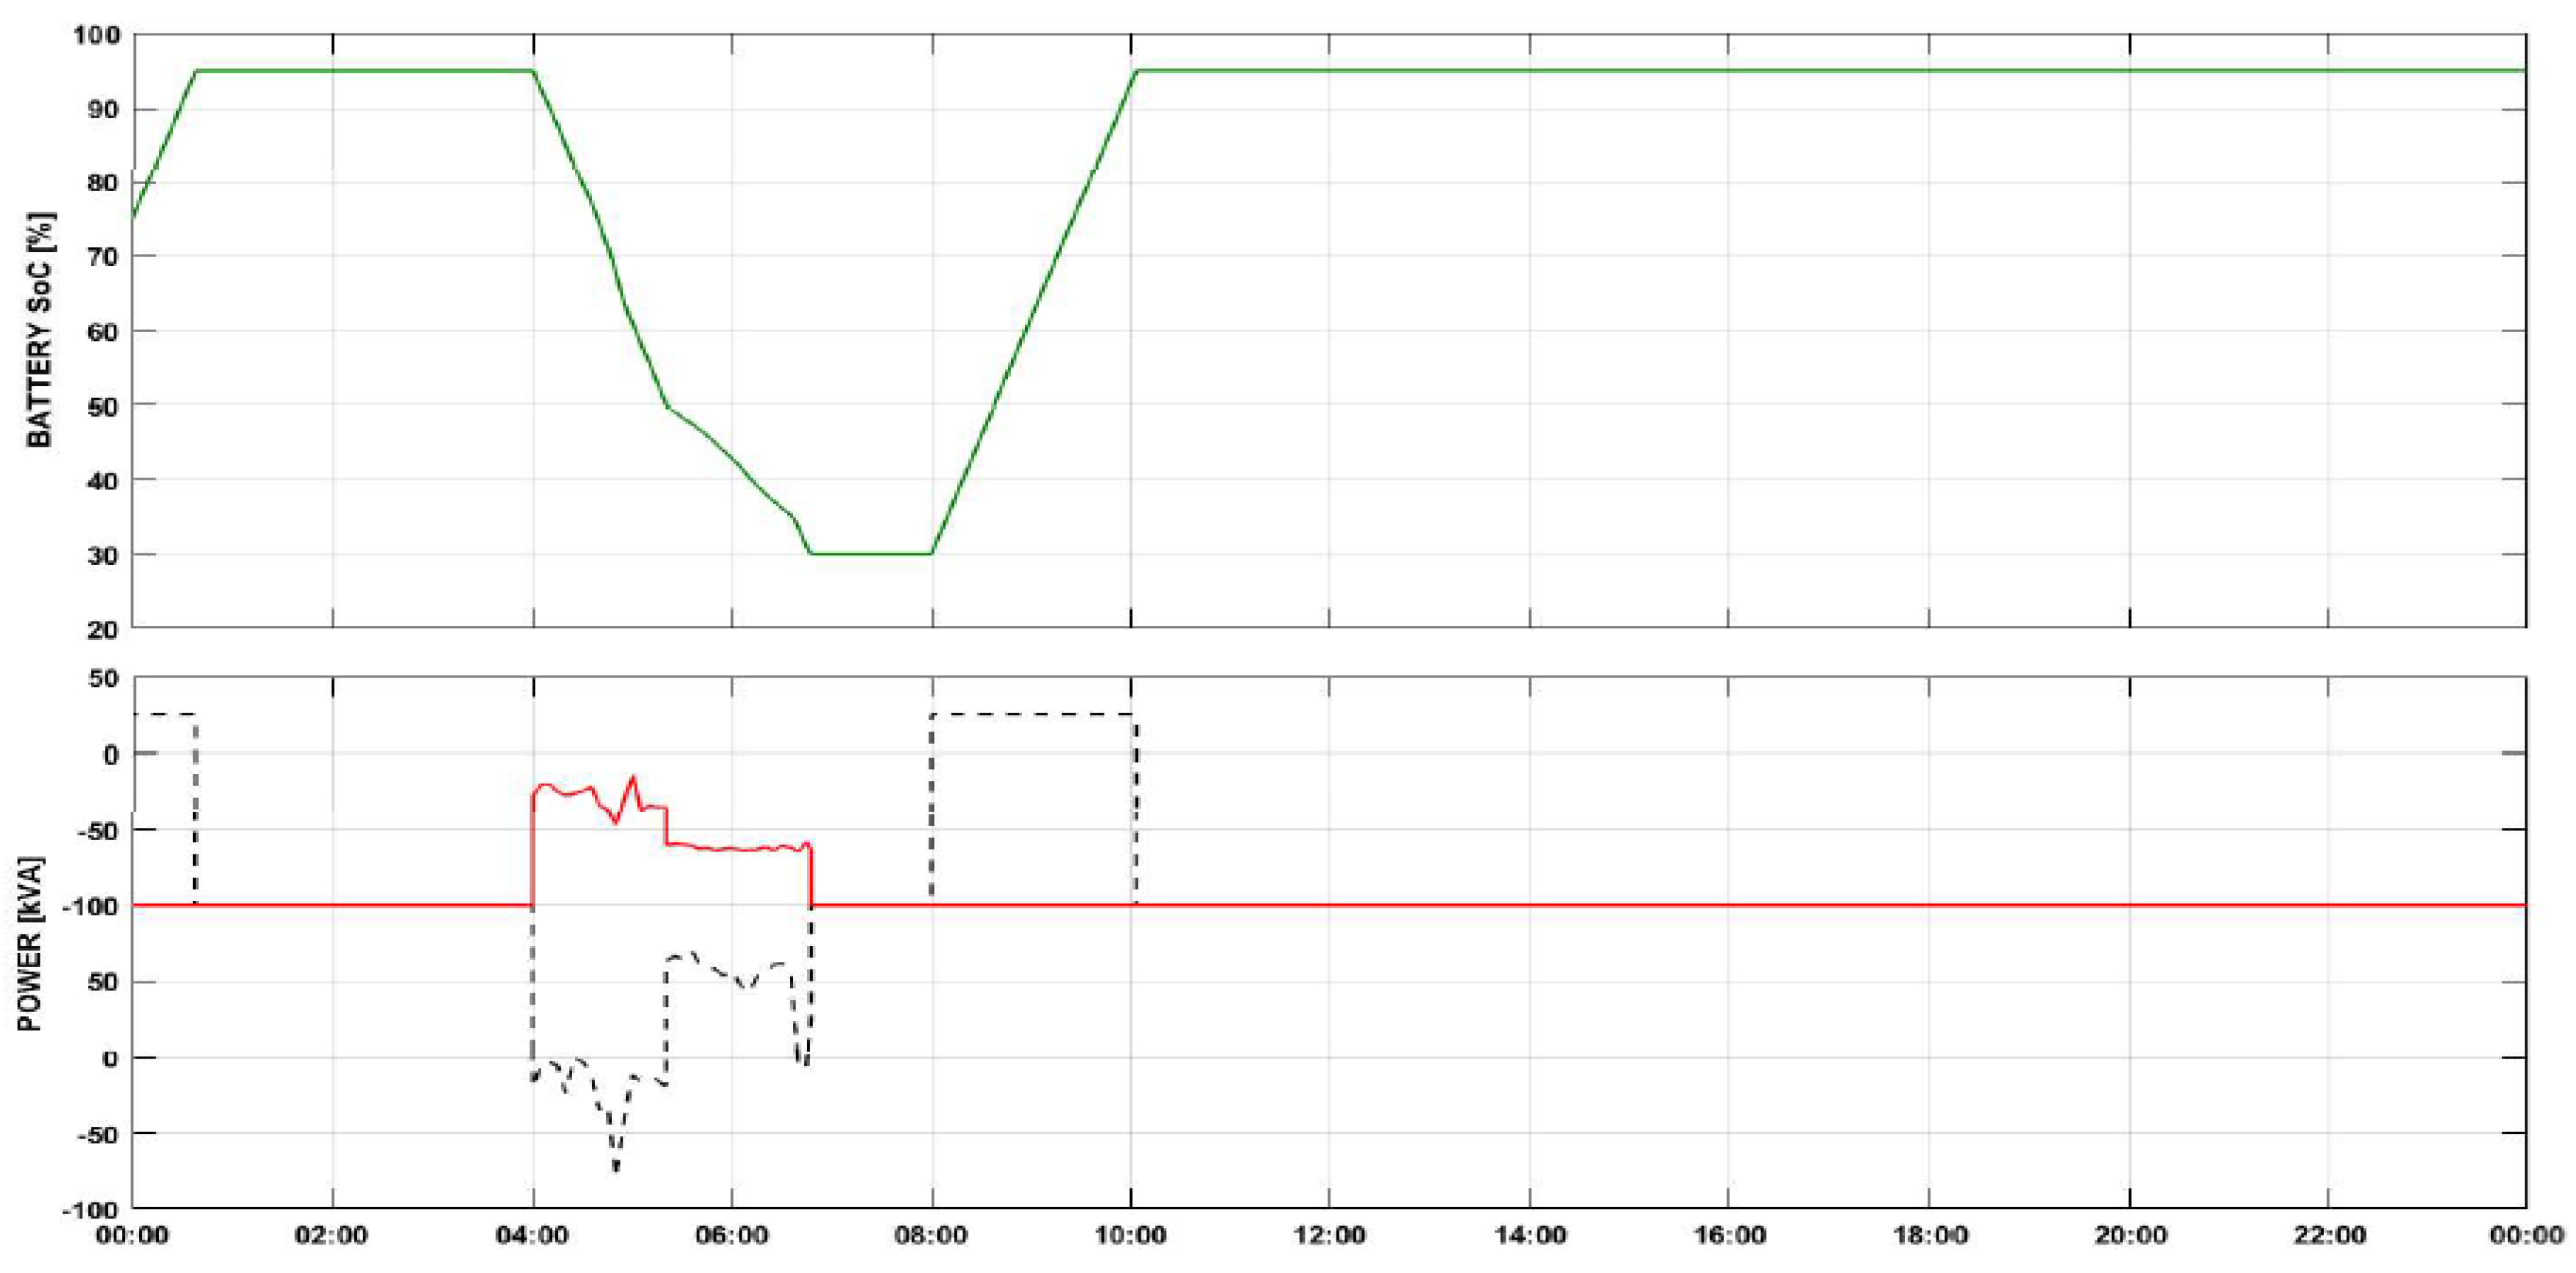
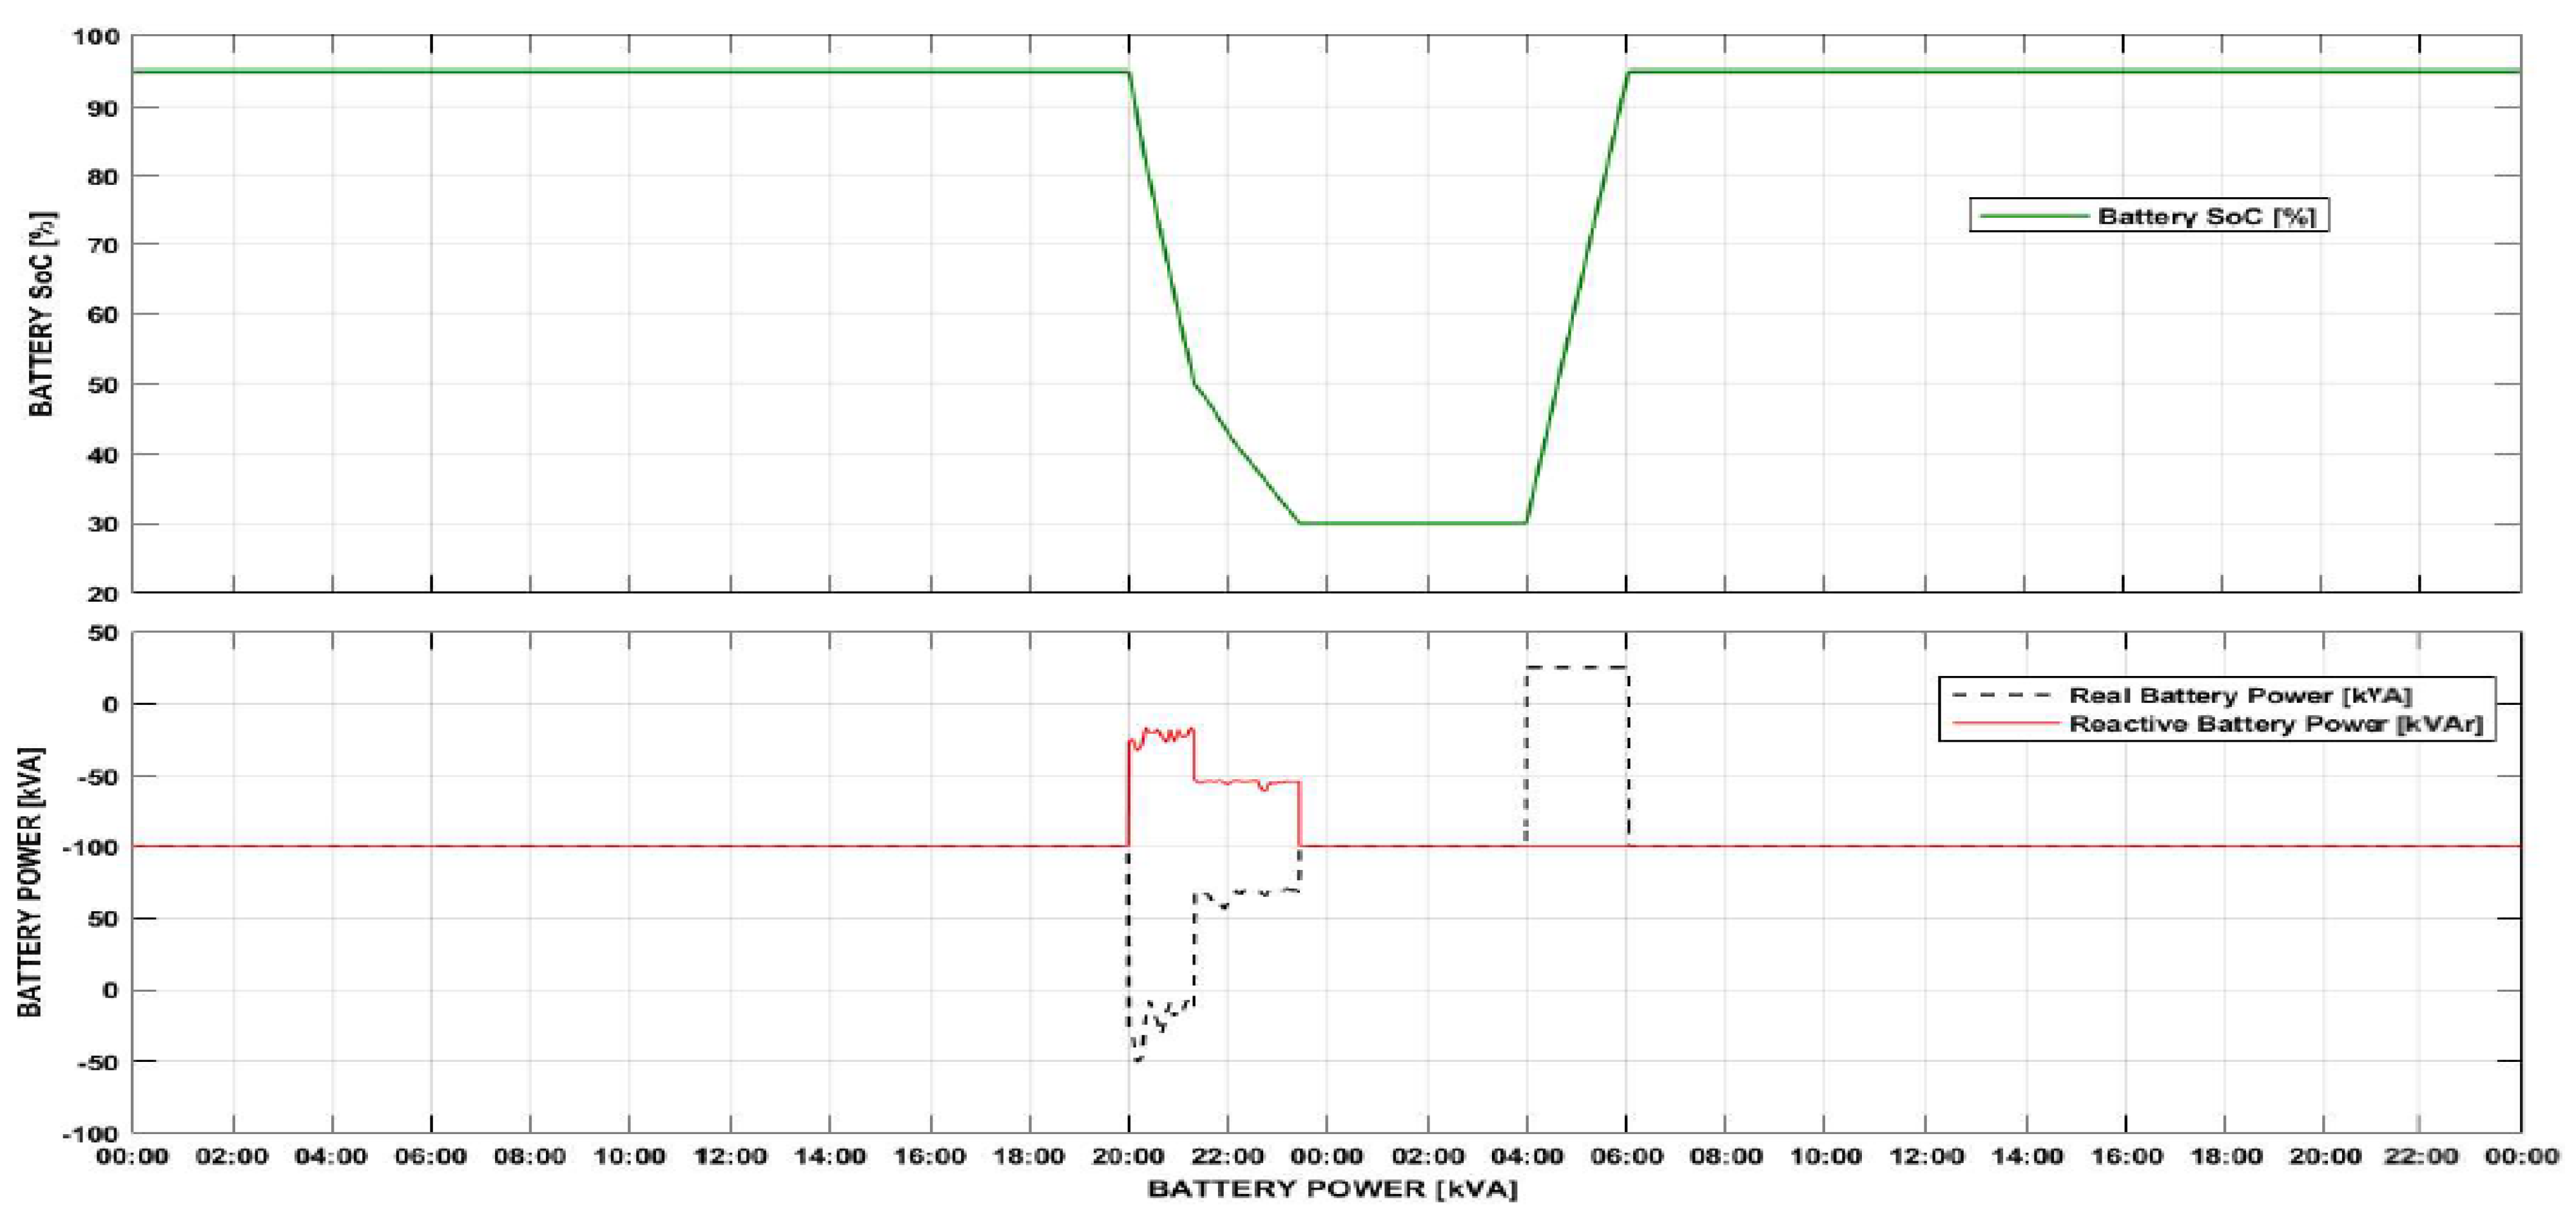
Figure 15 displays the performance of the 250-kWh battery system, where the first graph shows the Battery SoC in %. The battery is charged between midnight and 1 a.m. since the initial SoC of the battery is set at 75%. Then, the battery starts discharging at 4 a.m. when the power cut occurs. At 6 a.m., the battery reaches 50% SoC, and it continues to discharge at a slower rate since the demand is lowered due to the shedding of non-essential loads. Thus, between 4 a.m. and 6 a.m., the real power supplied by battery banks is about 50 kVA, while the power supplied is reduced to 25 kVA for the next 2 h, during which the SoC is reduced from 50% to 30%.
Since the 250-kWh battery system exceeds the 2-h energy storage required to increase the system reliability, the battery capacity was reduced to obtain a cost-effective system. Furthermore, the baseload power demand of essential loads between 6 a.m. and 6 p.m. of a typical school day is 70 kW while the peak is 120 kW, which means that the load demand results to be almost 60% of the peak power. Therefore, the initial battery energy capacity was reduced by 60%, thus obtaining an improved value of 150 kWh battery system for the MCAST micro-grid.
Another case scenario was simulated using a 150-kWh battery storage system to analyze the system’s performance. The 150-kWh battery storage system resulted in an optimal battery capacity for the MCAST micro-grid, which helps increase the system reliability by ensuring regulated supply to the essential loads for 2 h.
Figure 16 shows the behavior of the micro-grid electrical system during a 2-h power cut from the utility. As before, the battery bank is charged within the first 40 min since the initial SoC was set at 75%. When the power cut occurs at 4 a.m., the battery system supplies power to all loads initially for 70 min until its SoC reaches 50%. Then, the non-essential loads are shed, and the battery continues to supply power to the essential loads. During the 2-h power cut at 4 a.m., the diesel generator was not operated, and the battery storage met the load demand.
Figure 17 outlines the performance of the 150-kWh battery storage system during a 2-h power cut. The battery is charged for the first 40 min by drawing power from the main grid. After that, the power cut occurs for 2 h between 4 a.m. and 6 a.m., during which the battery supplies the power to the electrical loads.
The battery system supplies power for about 90 min to all loads and supplies 50 kVA for almost 30 min to the essential loads. When the power from the main grid is restored, the battery is charged until its SoC reaches 95% in less than 2 h. After 2 h, the battery SoC is reduced from 95% to almost 40%. This optimum size of battery still manages to feed the essential loads for more than 2 h without the use of a diesel generator and in the absence of PV generation. Using this size of the BESS, more case scenarios are simulated, showing grid power interruptions at irregular intervals to evaluate the performance of the overall electrical network.
A case scenario is simulated using a similar setup when a 4-h power cut occurs at 4 a.m. Figure 18 displays a power cut at 4 a.m. that occurs on a typical weekday, and the battery system supplies the essential loads for almost 3 h. When the battery system SoC reaches 30%, the loads are supplied through the diesel generator and PV system. When the power is restored at 8 a.m., the battery is charged for almost 2 h.
Figure 19 shows the performance of the battery system during a typical weekday during a 4-h power cut. When the utility power is disrupted, the battery starts discharging at a rapid rate since it is supplying all loads. However, when the non-essential loads are shed, the battery continues to discharge at a slower rate until it reaches 30%. Once the battery system reaches 30%, power is supplied to the essential loads by the diesel generator, and therefore, the power supplied by the battery is shown as 0 kVA. As soon as the power from the main grid is restored, the battery starts charging again.
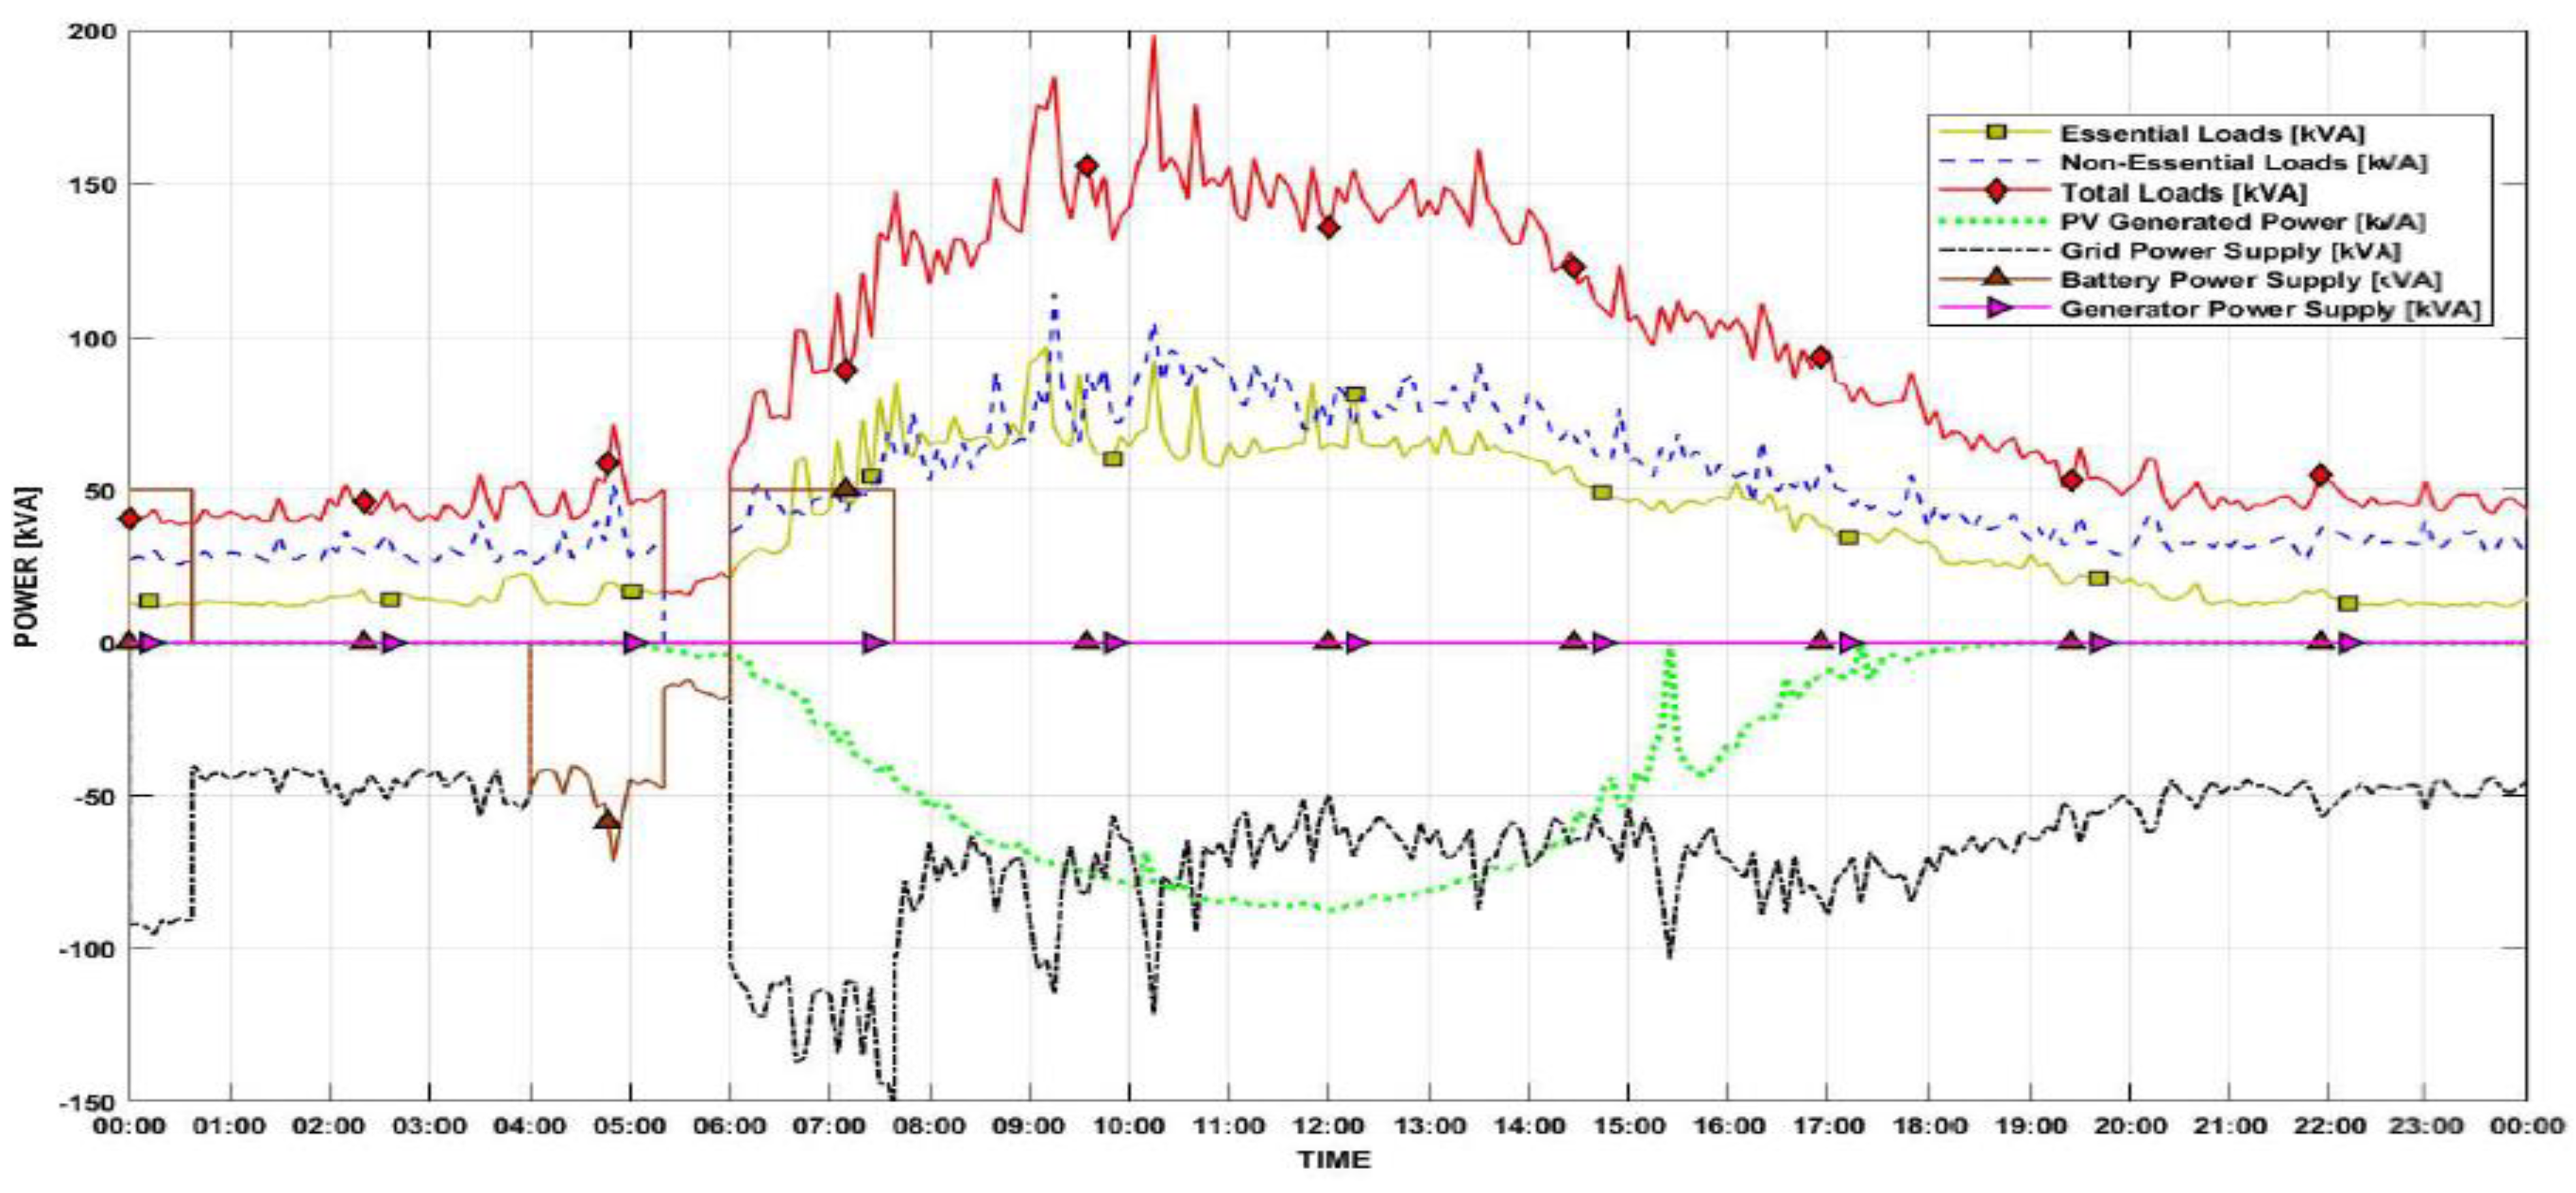
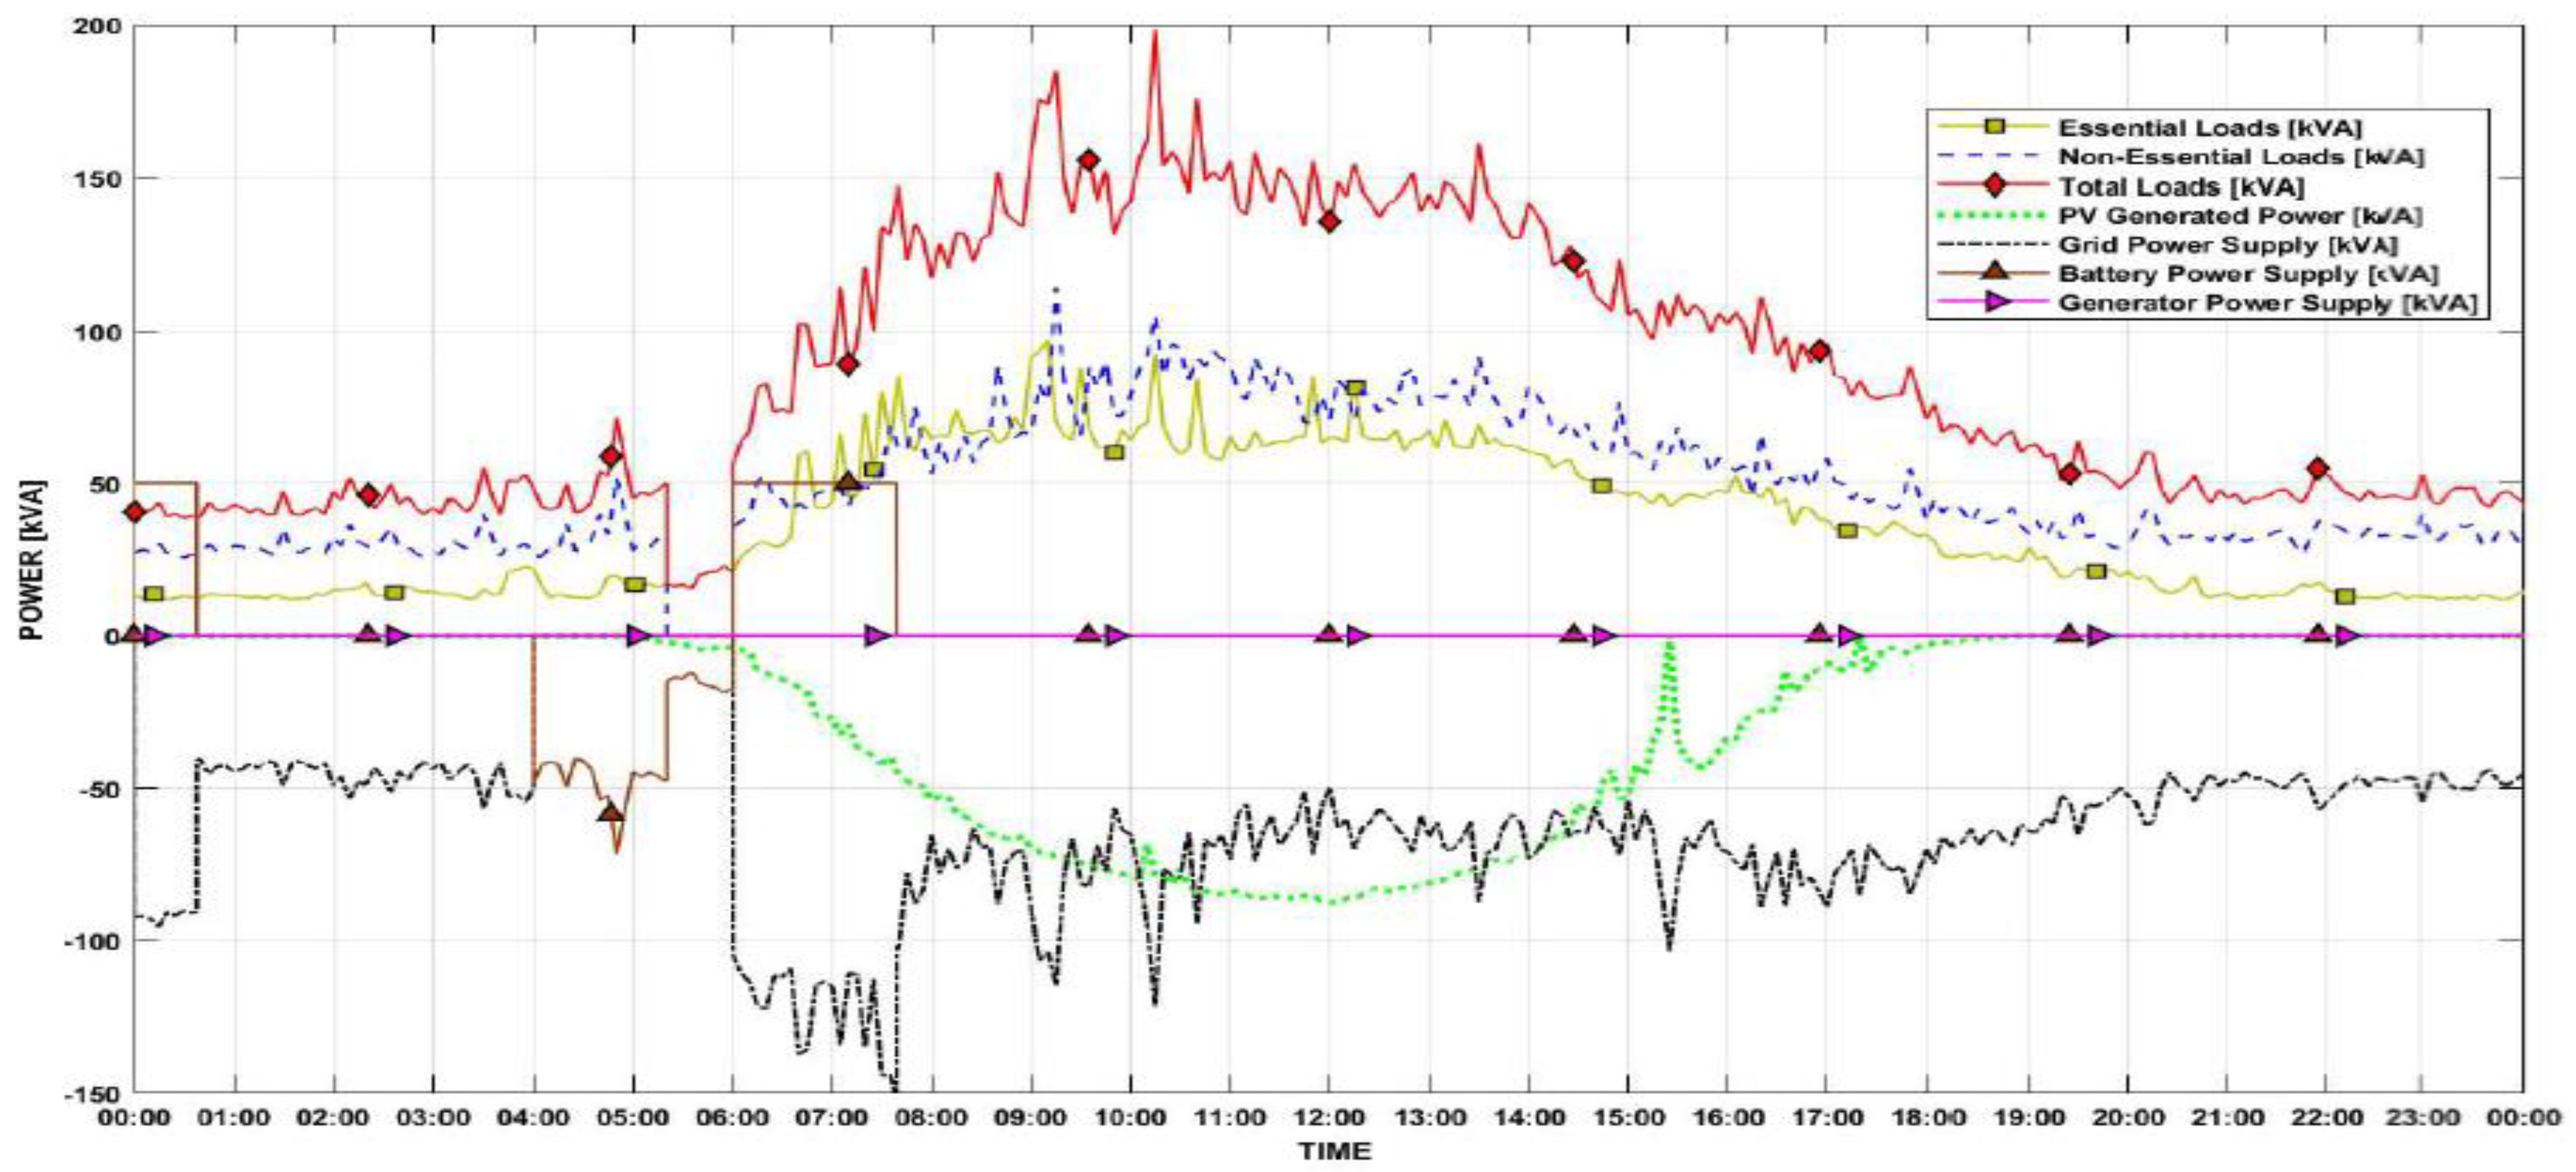
Figure 20 shows how the micro-grid reacts during an 8-h power cut occurring at 4 a.m. For the first 30 min, the battery system is charged from 75% to 95%. When the power cut occurs, the battery starts to supply power to all loads for over 1 h, and then the non-essential loads are shed. The battery continues to supply power to the essential loads for almost 3 h until about 7 a.m. The generator is shown to start from 7 a.m. until about 9:30 a.m., where the PV system generates enough energy to supply the essential load and starts to charge the battery banks. The power from the main grid is restored at noon, and the battery is charged back to 95%.
Figure 21 demonstrates the performance of the 150 kWh Energy Storage during an 8-h power cut. The initial SoC of the battery is set at 75%. Hence, it charges initially for 30 min. The power delivered by the battery during this period is 50 kVA for 30 min. At 4 a.m., the battery starts to supply power to all loads. When the battery SoC reaches 50%, the non-essential loads are shed, and the battery continues to discharge at a slower rate until it reaches 30% SoC. It starts to charge again at around 9 a.m. with the surplus energy generated by the PV. At noon, the battery SoC is restored to 55%, and when the power from the main grid is restored, it continues to charge until 1 p.m.
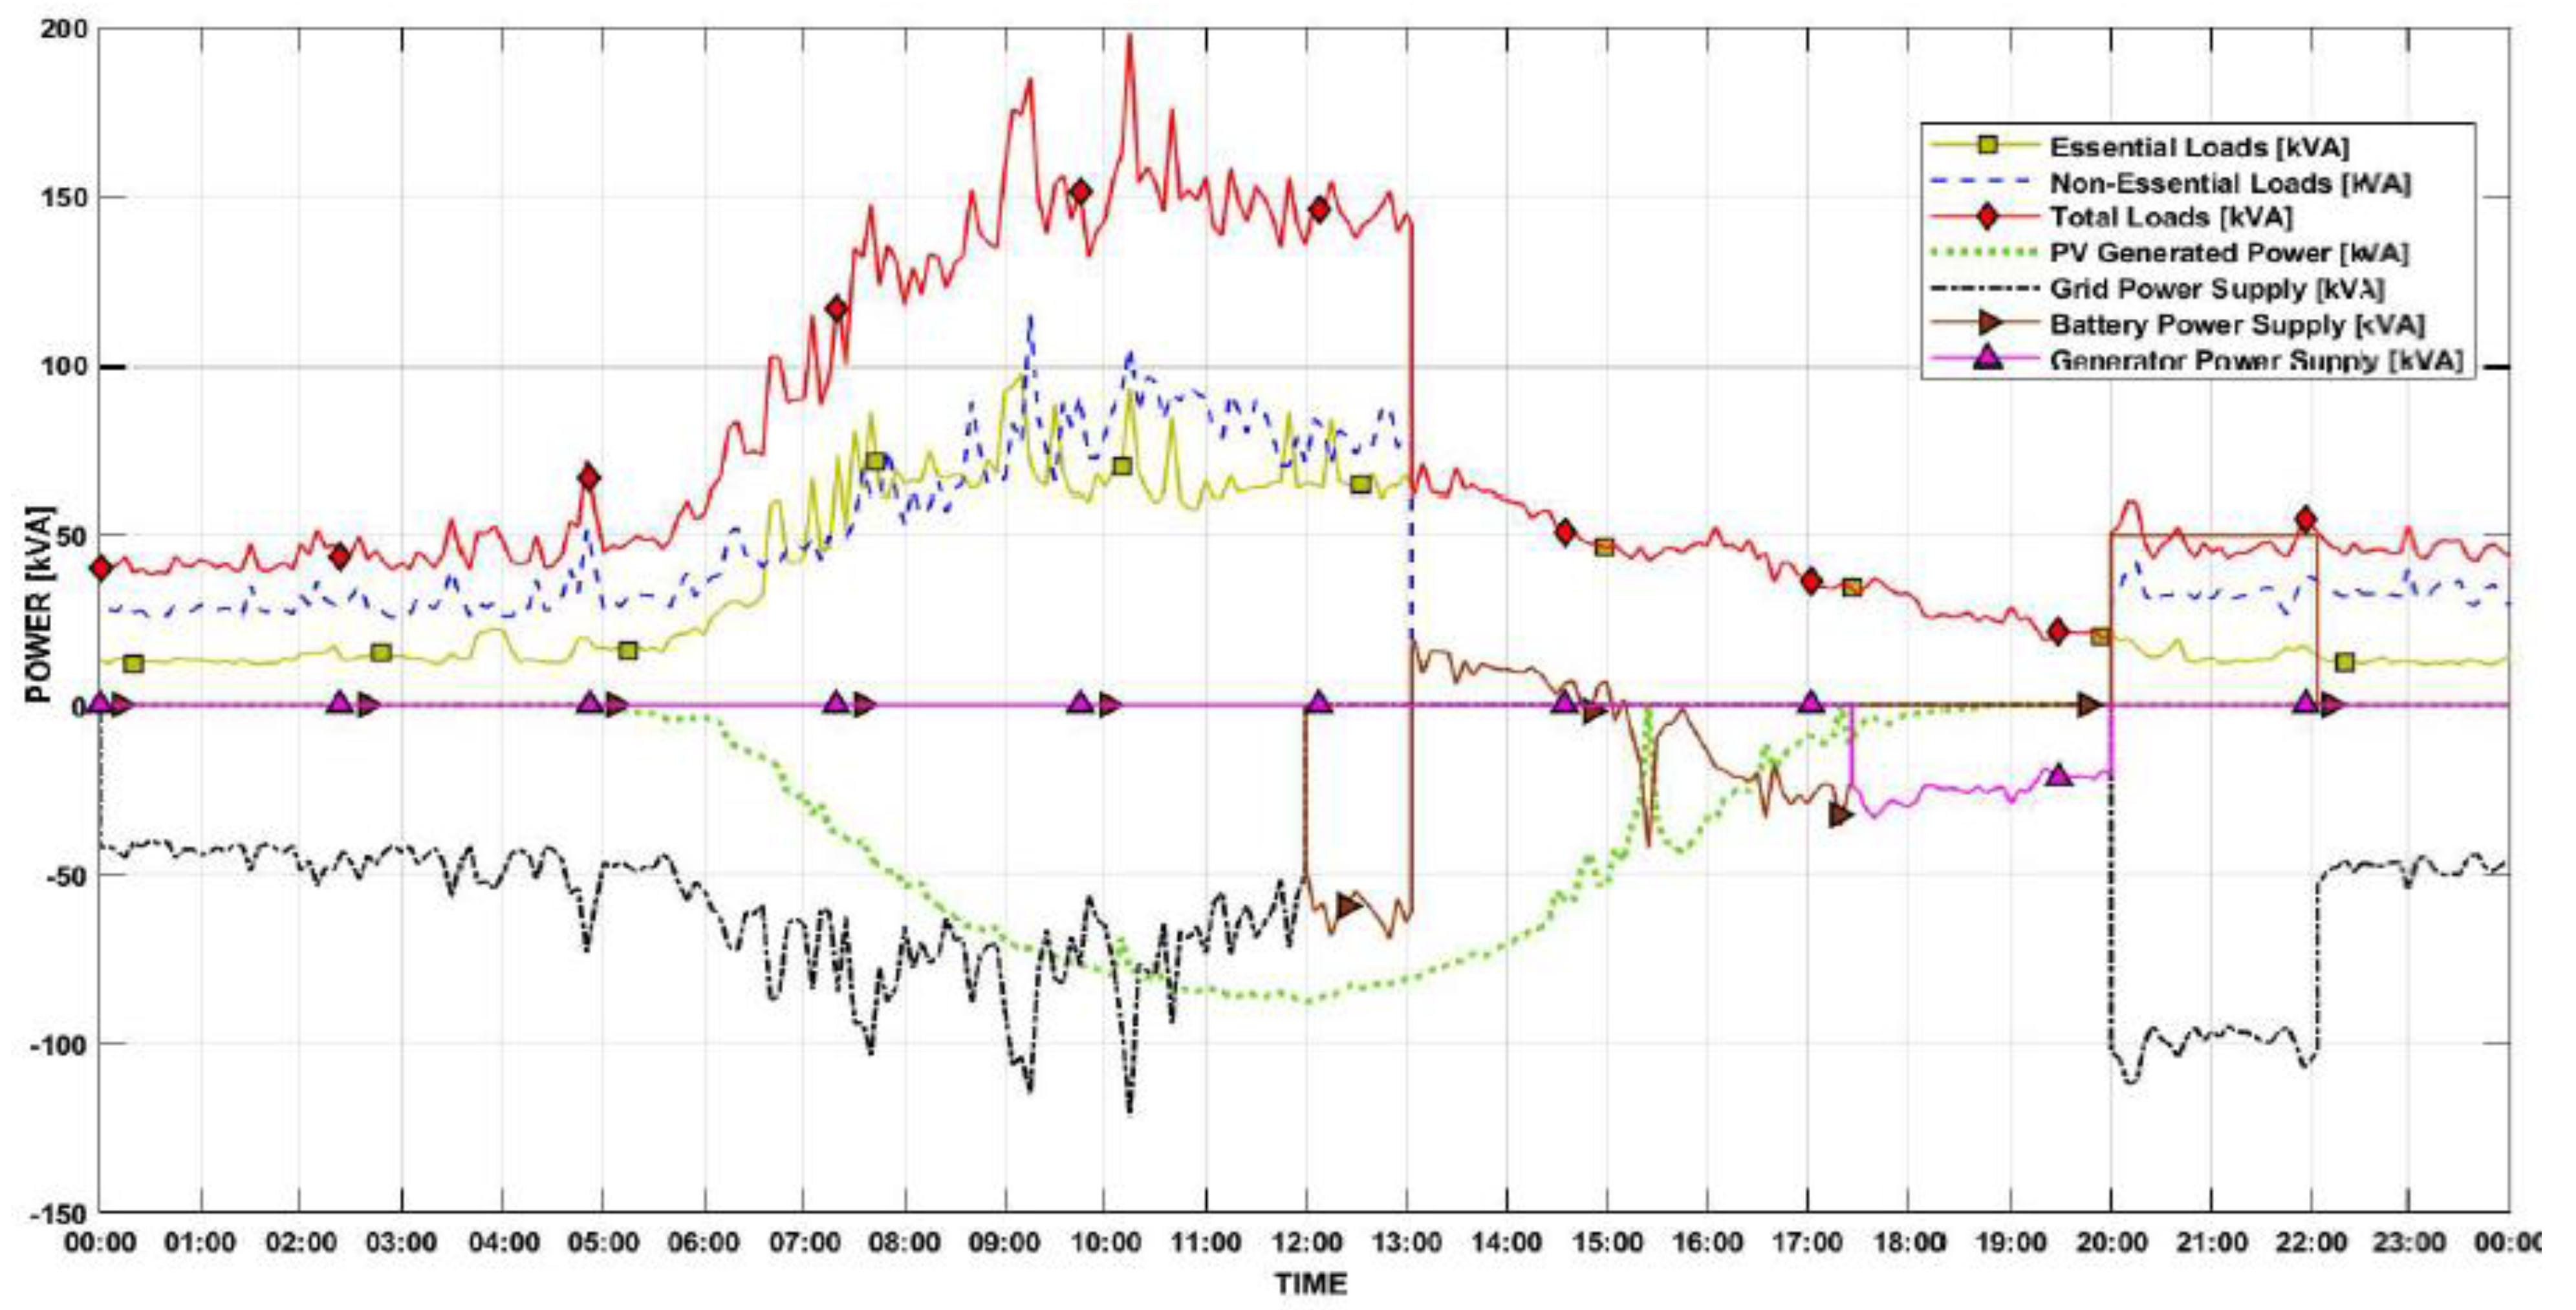
Since the 150 kWh BESS proved to be an optimum-sized system, we investigated two more scenarios. In these scenarios, an 8-h power cut occurring at noon and at 8 p.m. is simulated to analyze the system’s performance. Figure 22 displays the electrical network when the power cut occurs at noon. The 150 kWh BESS together with the PV system, maintains power to all loads of the micro-grid for another hour. Once the non-essential loads are shed at 1 p.m., the PV system generates enough power to supply the essential loads, and the excess power generated is used to charge the battery system. The battery system slowly discharges after 3 p.m. when the PV system reduces its power generation. After 5 p.m., the generator starts to supply power to the essential loads until 8 p.m. Similar to the previous scenarios, once the power is restored from the main grid, the battery system recharges again. The battery needs around 2 h to recharge from 30% to 95% SoC. The black curve shows that the power to recharge the battery is provided from the main grid.
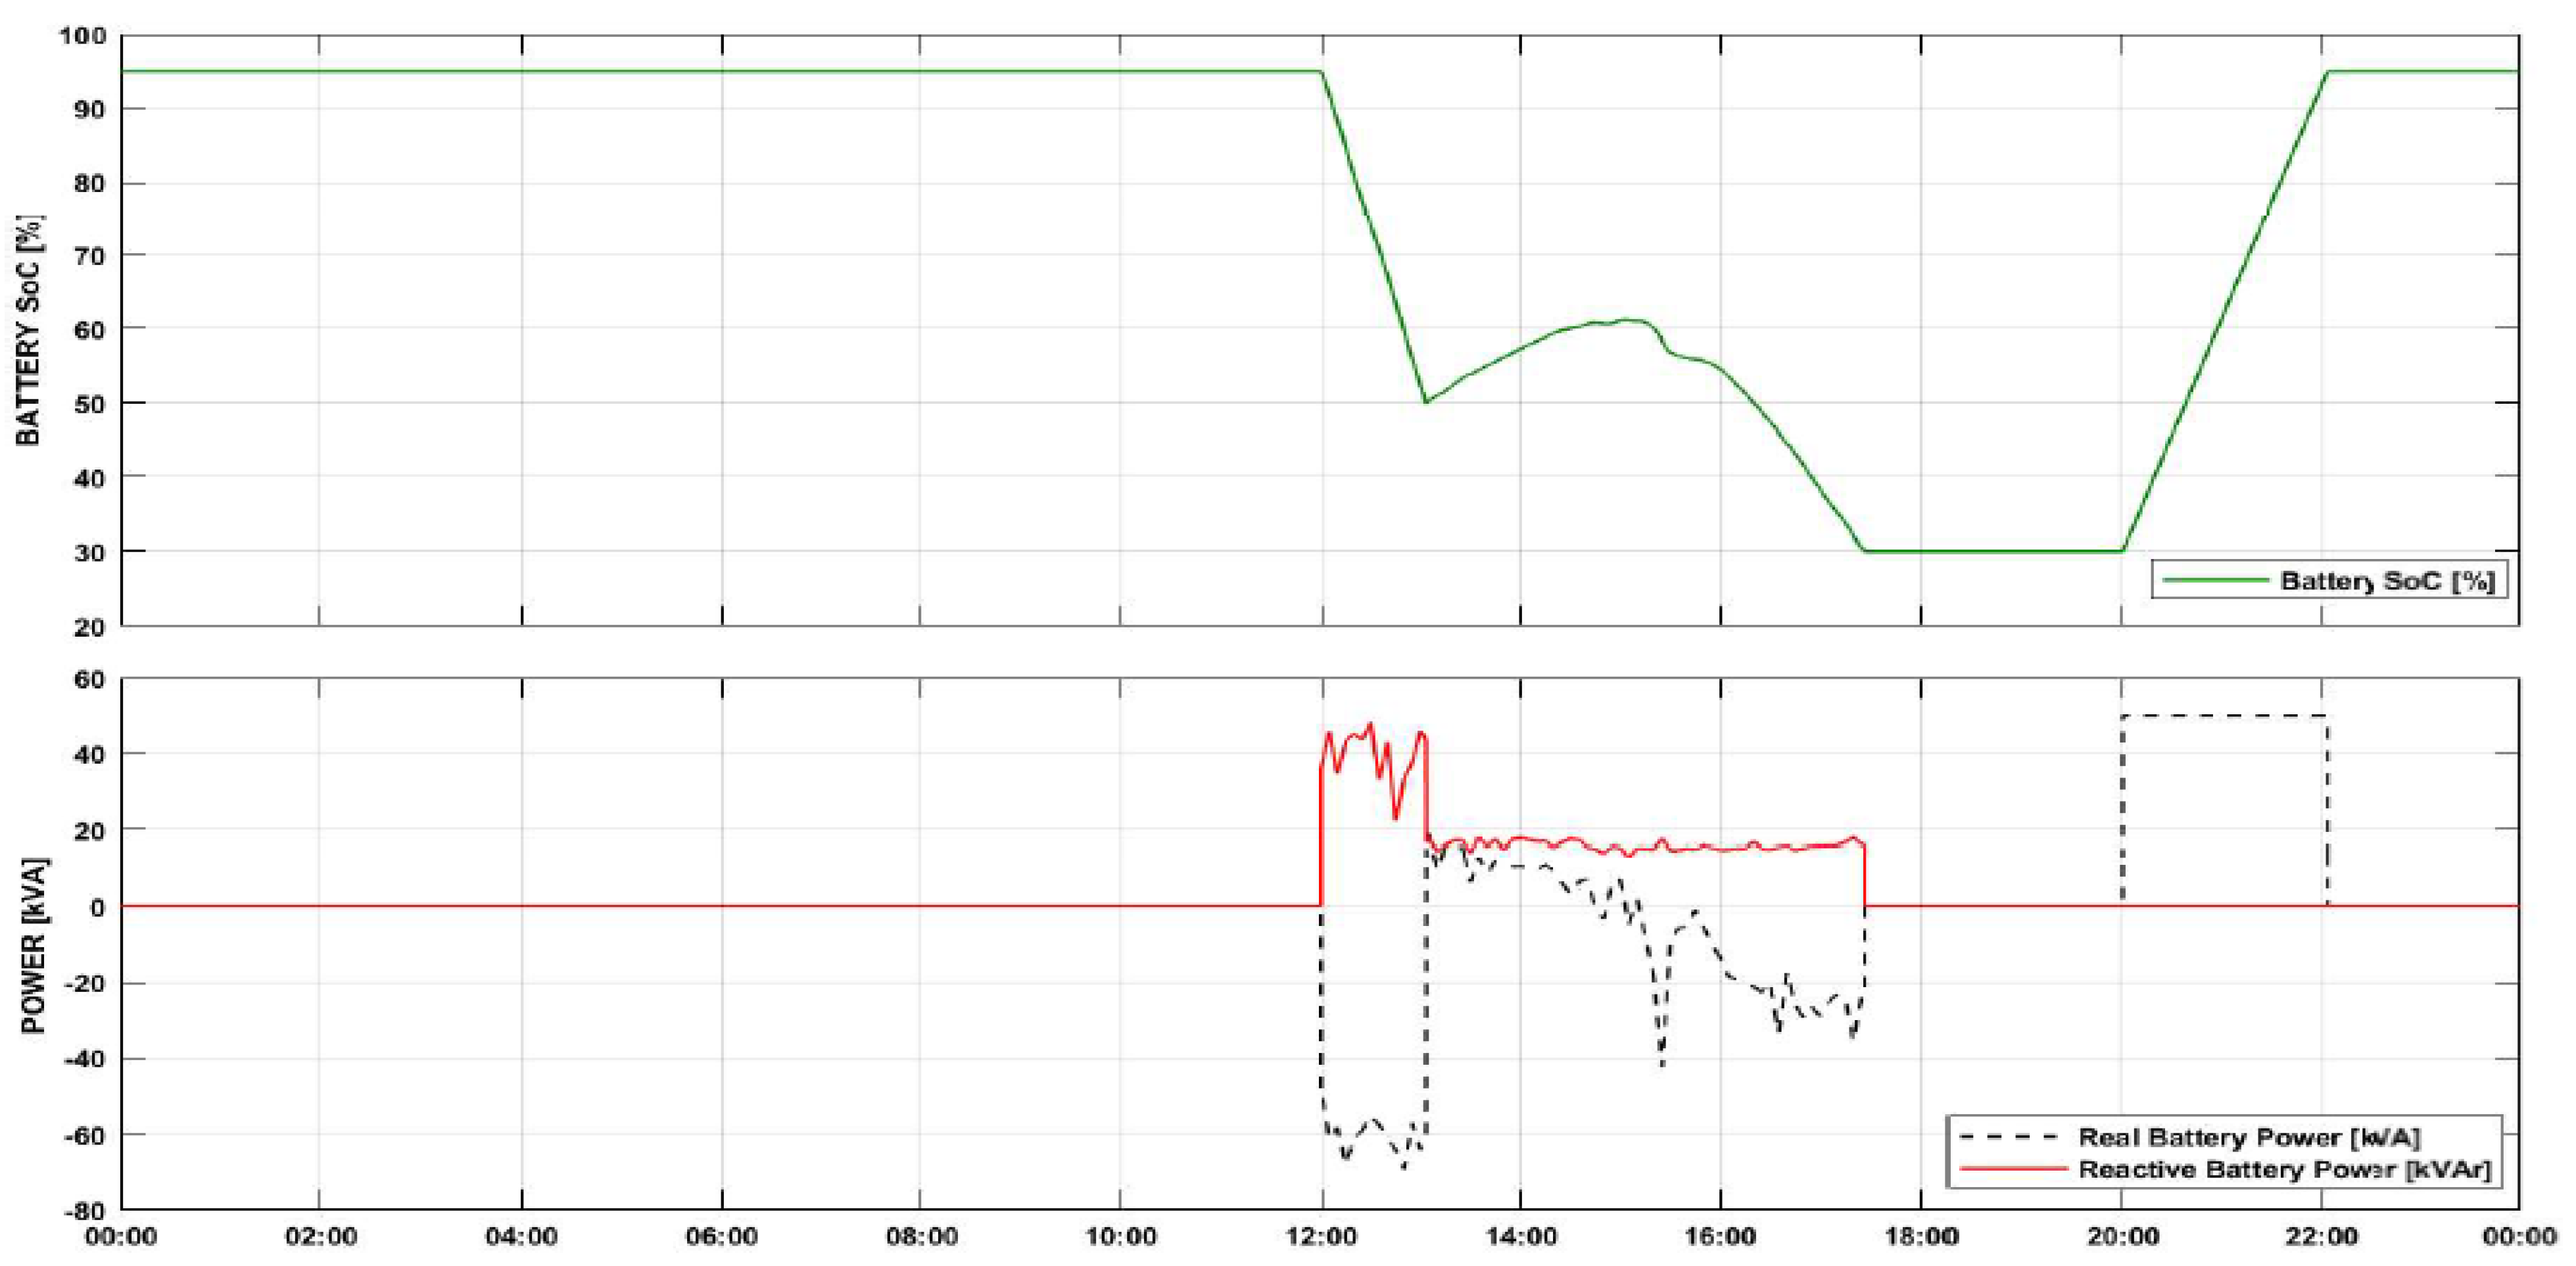
Figure 23 shows the battery SoC and power supplied/dissipated by the BESS when an 8-h power cut occurs at noon. The battery supplies all loads until its SoC is 50%. Since the non-essential loads are shed, the total demand is reduced by almost 50%, and the PV system is generating enough power to keep the essential loads running and charging the battery slowly. The battery SoC is increased between 1 p.m. and 3 p.m. It starts to discharge until its SoC is 30% after 3 p.m. when there is a mismatch between the power generated and the demand.
The last scenario using a 150 kWh BESS and 150 kVA generator is investigated for an 8-h power cut that occurs during the night. During this time, there is no power generation from the PV. The power cut occurs between 8 p.m. and 4 a.m. Therefore, the load profile is observed continuously for two typical weekdays.
Figure 24 shows that all loads are supplied for almost 2 h, and at 10 p.m., the non-essential loads are shed. The generator is switched on after 11 p.m. to supply about 20 kVA for almost 4.5 h until 4 a.m. Figure 25 illustrates the performance of the battery system where the SoC of the battery is reduced from 95% to 30% just before midnight. After midnight, no power is supplied from the battery to the electric network of the MCAST micro-grid. It is then recharged from 4 a.m. onwards.
4.4. With Integrated Electric Vehicles
The last case study investigates the concept of Vehicle to Grid (V2G) which is used for the peak shaving and valley filling of the total load demand. In addition, EVs can serve as an additional storage system in case of emergency, such as power cuts. V2G can be adopted if several electric charging points can offer the bidirectional G2V and V2G operation; that is, the same charging points can be used to charge and discharge the vehicles.
Currently, the parking lot at the MCAST campus holds 600 car spaces. The Maltese Government intends to promote Malta as a test-bed for electro-mobility. According to the Malta Transport Masterplan 2025, Malta has set an ambitious target of having 25% of the national fleet composed of non-conventional fueled vehicles, which indicates an increment to 50% of clean energy vehicles by 2030 [14].
In this case study, an assumption is taken in which the percentage of electric vehicles on campus is reduced to 15% of the total cars, which indicates that 90 electric cars out of 600 cars are estimated to be parked on campus. This assumption is taken to model a realistic scenario that can occur on the MCAST campus. Out of the 90 EVs, it is estimated that half of the EVs, i.e., 45 cars, will be plugged to ensure a bi-directional interface with the concurrence of car owners to use the battery of the cars as needed to support the grid. The estimated energy capacity of the EVs is 30 kWh, and the SoC of the cars is taken as 75% when they arrive at campus.
Moreover, vehicles are disconnected from the micro-grid when the SoC of the car battery falls to 50%. In this way, car owners can have enough charge to do extra errands before going home. The V2G operation aims to flatten the curve. In this case study, EVs are connected to the MCAST micro-grid for peak shaving and valley filling between 07:00 and 14:00 h. The aim of connecting the EVs is to reduce load fluctuations in micro-grid demand.
The micro-grid will be seen as a single point load to the main grid and, by utilizing V2G operation, the load demand will be stable. During the day, the surplus energy from the PV system can be used to charge the EVs to maximize the utilization of localized energy generation.
The following estimations were made based on the assumption of bidirectional V2G connections on the MCAST campus for 45 cars.
Table 2 shows the various parameters that were considered for a typical weekday on MCAST Campus.
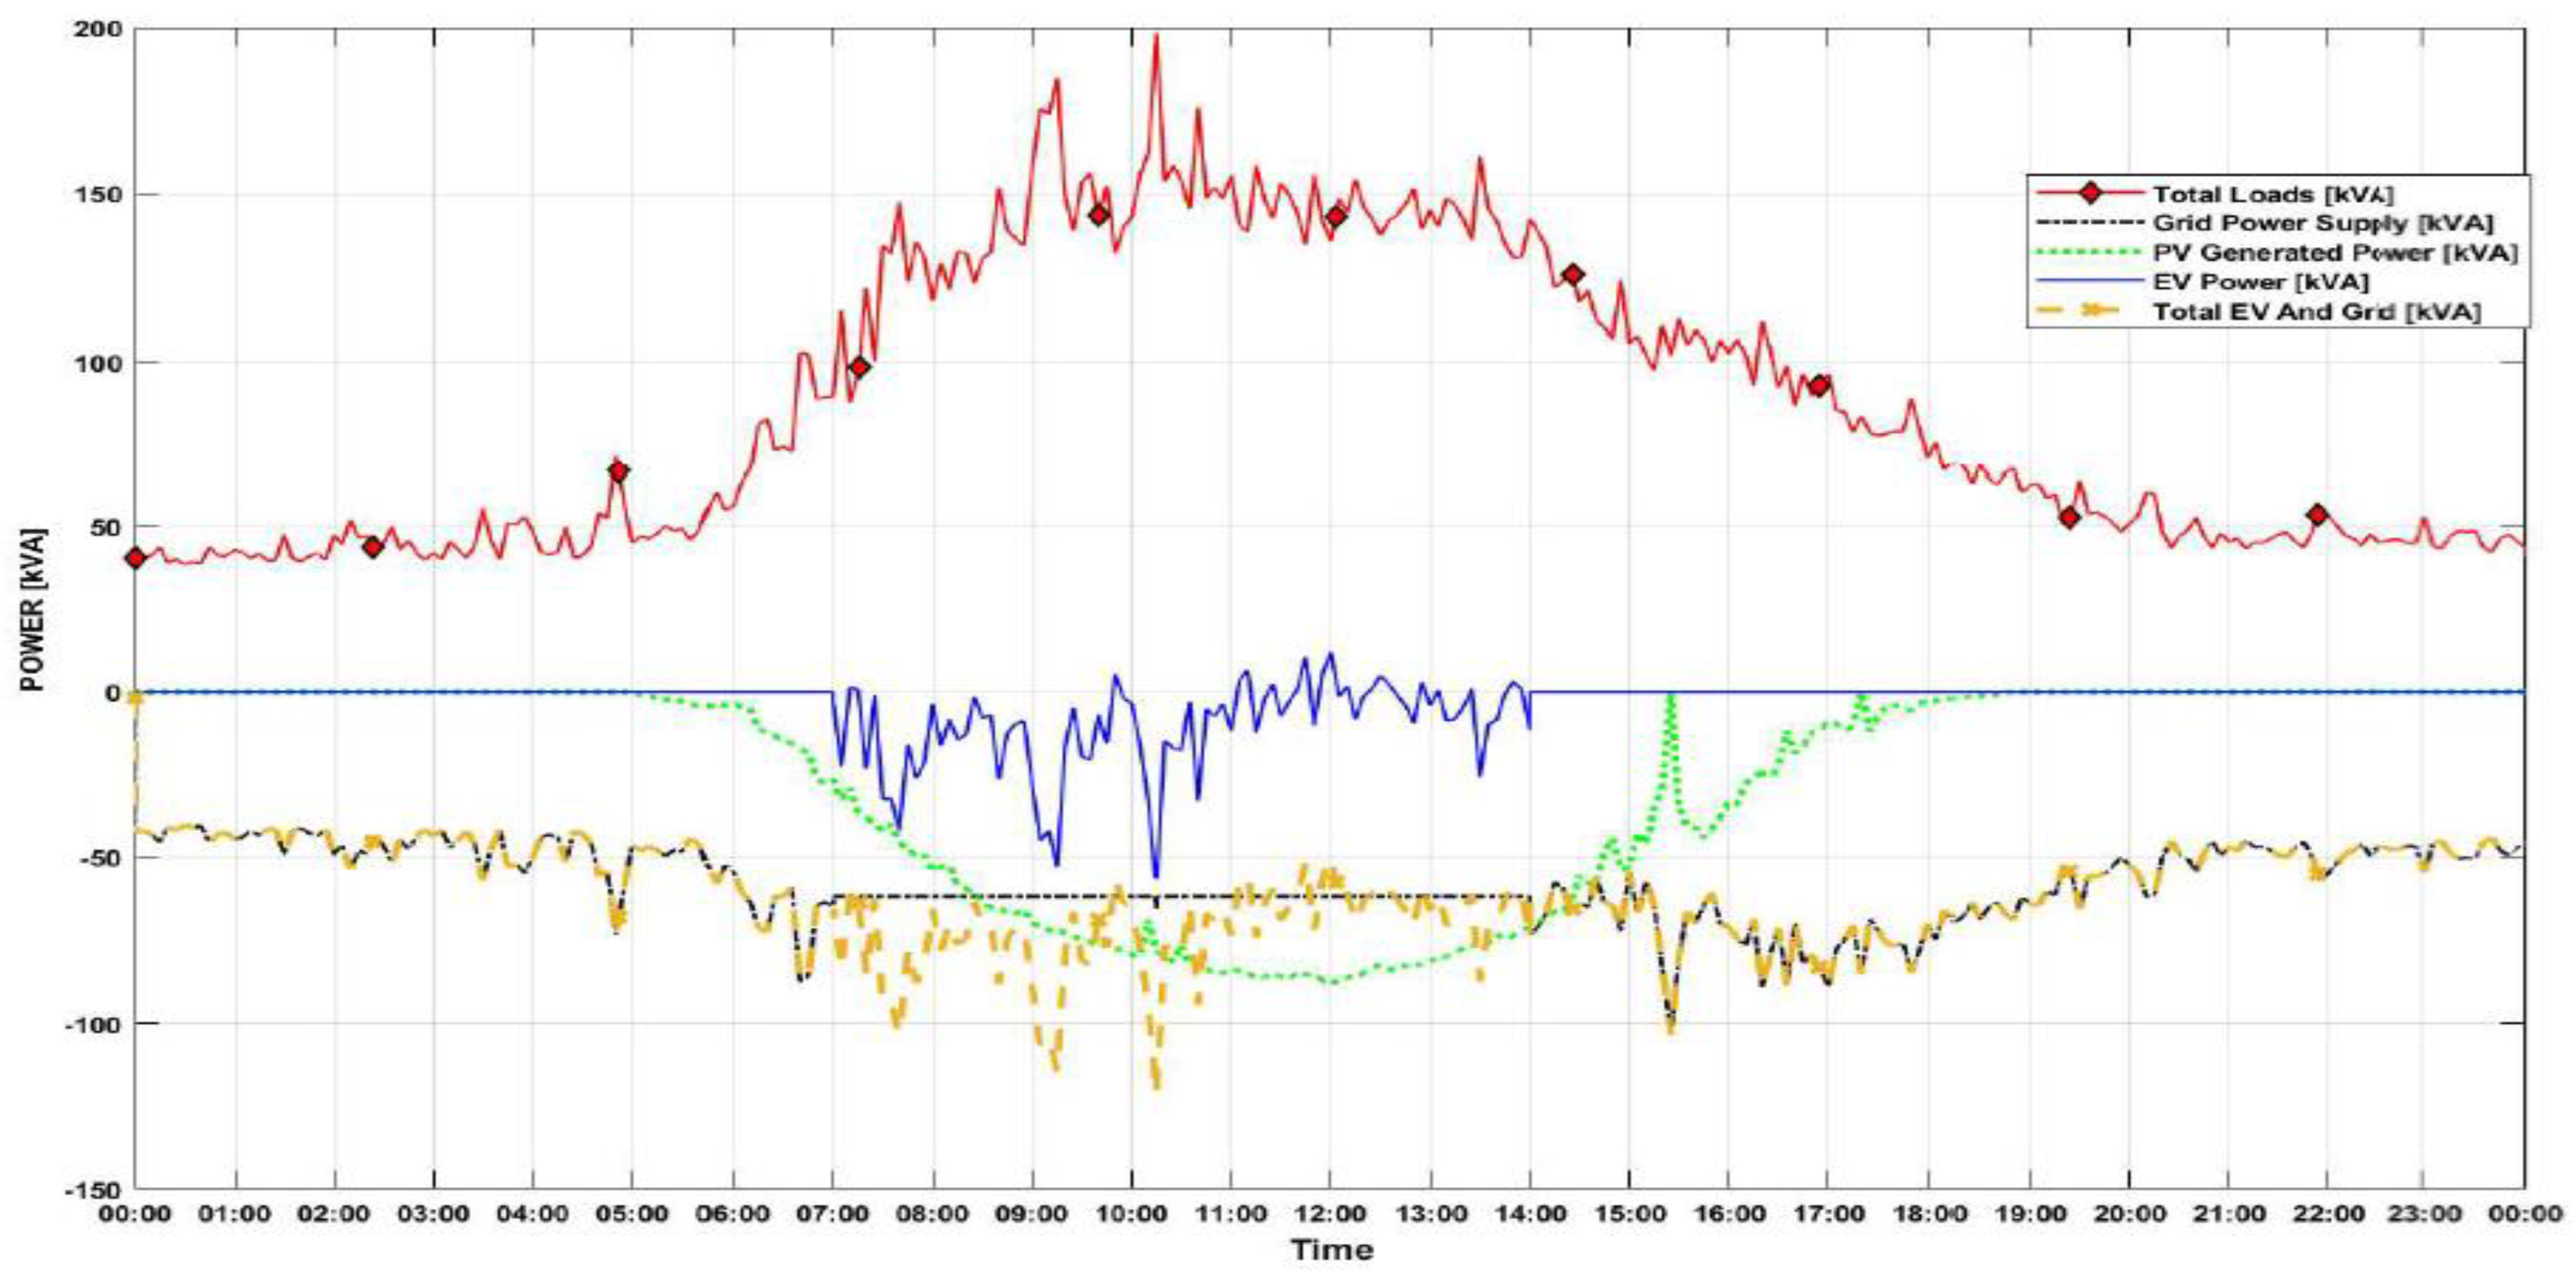
Figure 26 shows the behavior on a typical day with 45 EVs connected for peak shaving. It can be seen that 60 kVA is the maximum power delivered by the EVs at about 10 a.m., while some EV charging occurred between 11 a.m. and 1 p.m. Grid supply (black curve) is kept constant throughout the 8-h that the EVs were connected to the micro-grid.
Figure 27 shows three graphs that are related to the battery of EVs. The first graph shows the power supplied and dissipated by the batteries of EVs. The second graph shows the battery SoC that is reduced from 75% to 69%. In this way, the car users are only marginally affected by V2G, and thus would be more willing to connect their cars to the micro-grid. This scenario does not consider that the PVs generate any surplus energy since the difference between the power demand and power generated is still too large.
A similar application of this concept is beneficial in a situation when the power generation is still high and the demand decreases. In such a case, surplus energy can be utilized to charge the batteries. The last graph shows the control of the battery, where ‘2′ represents that the battery is available for charging and discharging purposes.
5. Key Performance Indices
A range of key performance indices (KPIs) based on economy, environmental, reliability, resiliency, power quality, and efficiency are briefly introduced and evaluated for assessing the micro-grid performance.
5.1. Capital Expenditure (CAPEX)
It is the initial cost of investment for the successful working of the micro-grid. Once the micro-grid capacity is updated, this value should be recalculated by considering the life of the equipment, return of investment, and other factors [15,16,17,18,19,20,21,22,23,24]:
where N is the total number of equipment purchased for the micro-grid, is the capital cost for each equipment k, is the life of each equipment, and CRF is the capital recovery factor determined by calculating the present value of an annuity based on an annual real interest rate .
5.2. Maintenance Cost (MAINTEX)
5.3. Replacement Cost (REPLEX)
REPLEX refers to the cost required to change equipment, generally evaluated based on the life of each equipment. As suggested in [26], it can be calculated as:
where, is the cost of replacement, is the life of each equipment (e.g., battery), and SFF is the sinking fund factor which is nothing, but the future value based on an interest rate .
5.4. Annual Energy Purchase Expenditure (AEPEX)
AEPEX is the yearly cost spent on purchasing electrical energy from the power utility. The lower this metric value, the higher will be a self-sufficient index of the micro-grid. It can also be represented as a percentage as is generally calculated as:
where, represents the energy bought in kWh and is the price per kWh for a 24 h period, which covers the price variations, for a total of days and months.
5.5. Levelized Cost of Energy (LCoE)
The levelized cost of energy are usually determined separately for each energy source of the micro-grid. This cost can help compare different energy resource technologies having different lifespans, capacity factors from an economical view [26]. It is generally the ratio of the total investment cost with the total energy output.
5.5.1. Levelized Cost of Energy from Renewables (LCoER)
5.5.2. Levelized Cost of Energy from Storage Systems (LCoES)
5.6. Reduction of GHG Emissions
In the MCAST micro-grid, the installed PVs also help reduce the greenhouse gas emissions present when generating electricity from burning fossil fuels.
where is the energy generated from PVs per year t, and is the translation coefficient to convert energy to kg (or tons) of CO2 emissions.
5.7. Reduction of Carbon Penalties (PNLRED)
Currently, penalties are being imposed on organizations by countries based on their carbon footprints for environmental benefits. These penalties vary for different countries and organizations. According to EC, there is a penalty for every ton of CO2 emitted above a given threshold [10,11,12,13,14,15,16,17,18,19,20,21,22,23].
where is the CO2 ton saved by the micro-grid for a year t, and is the cost in €/CO2 ton.
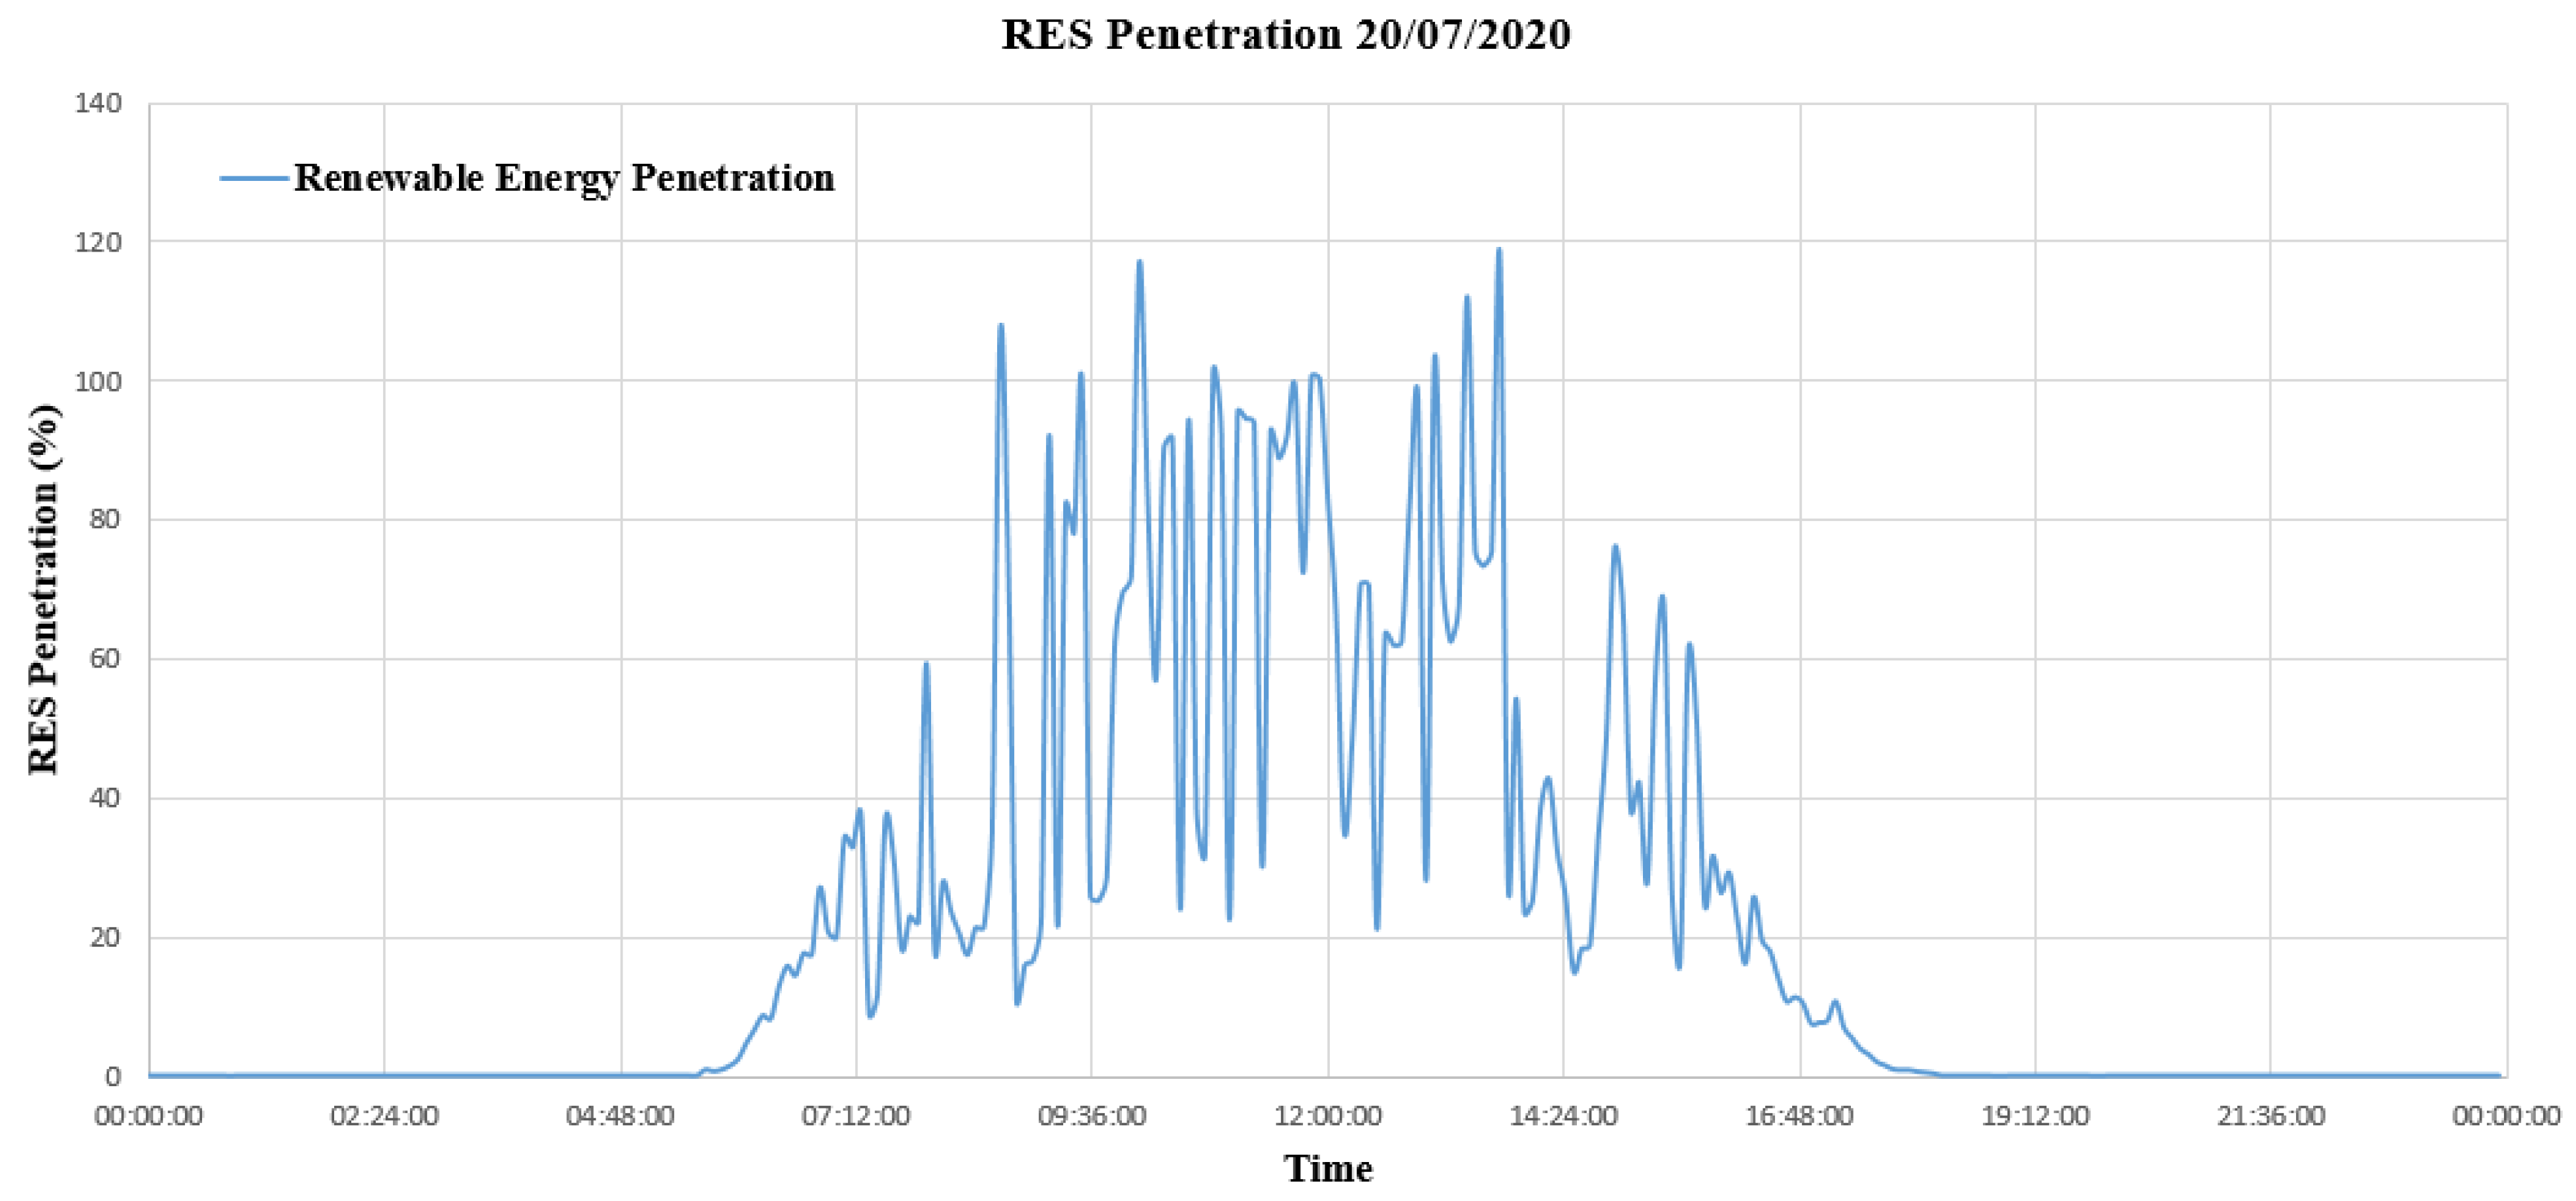
5.8. Renewable Energy Penetration (REPEN)
The REPEN is the percentage that tells us how “environmentally friendly” the micro-grid is. This penetration is the ratio of energy produced from renewable energy as compared to the total consumed energy in a given year.
where is the energy produced from PVs and is the total energy consumed by loads of the MCAST microgrid in one year. The REPEN for the MCAST micro-grid is shown in Figure 28.
5.9. Coverage from PVs
This is the ratio of peak power from PVs as compared to the total peak load.
where is the maximum power from PVs and is the maximum load demand of the microgrid at the time i.
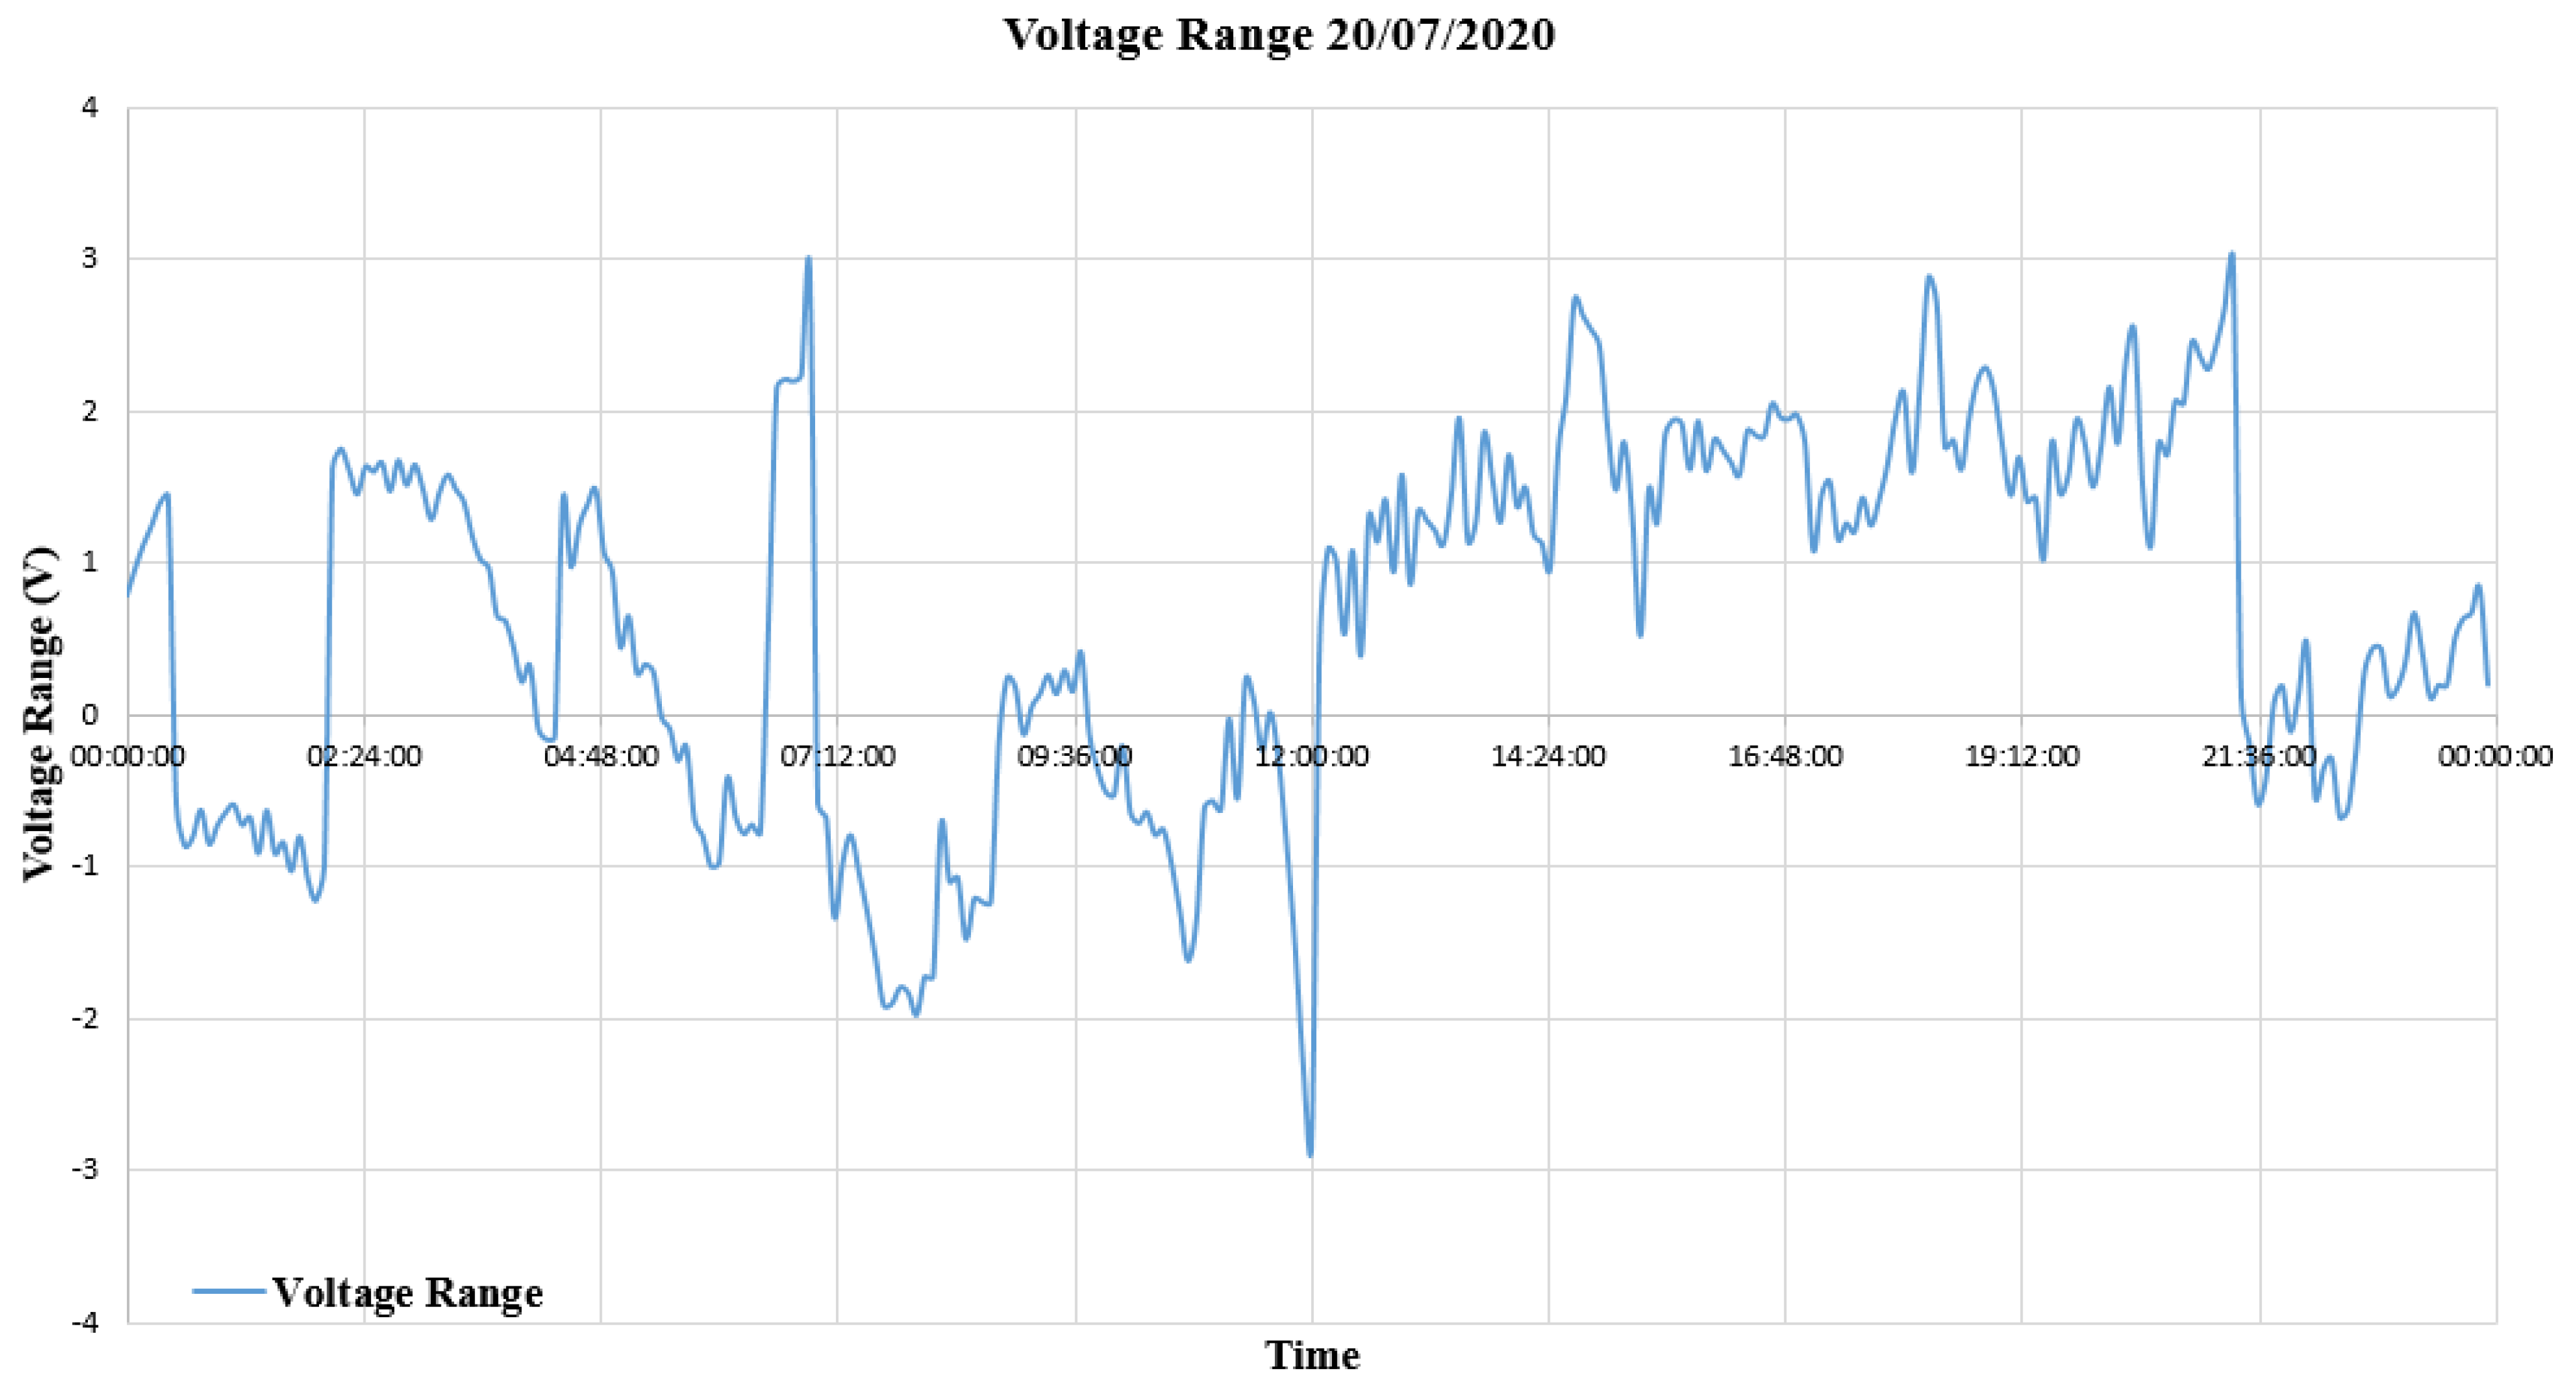
5.10. Voltage Range/Fluctuations (VLTR)
The voltage range is essential to determine the voltage level at the PCC.
5.11. Voltage Standard Deviation (VLSTD)
The voltage range refers to the divergence of the measured voltage from the nominal one.
The acceptable voltage deviation defined by Enemalta plc for the energy is +/− 10% of the nominal voltage; this means approximately +/− 23 V. The MCAST micro-grid operates within the allowed voltage limits evident from Figure 29.
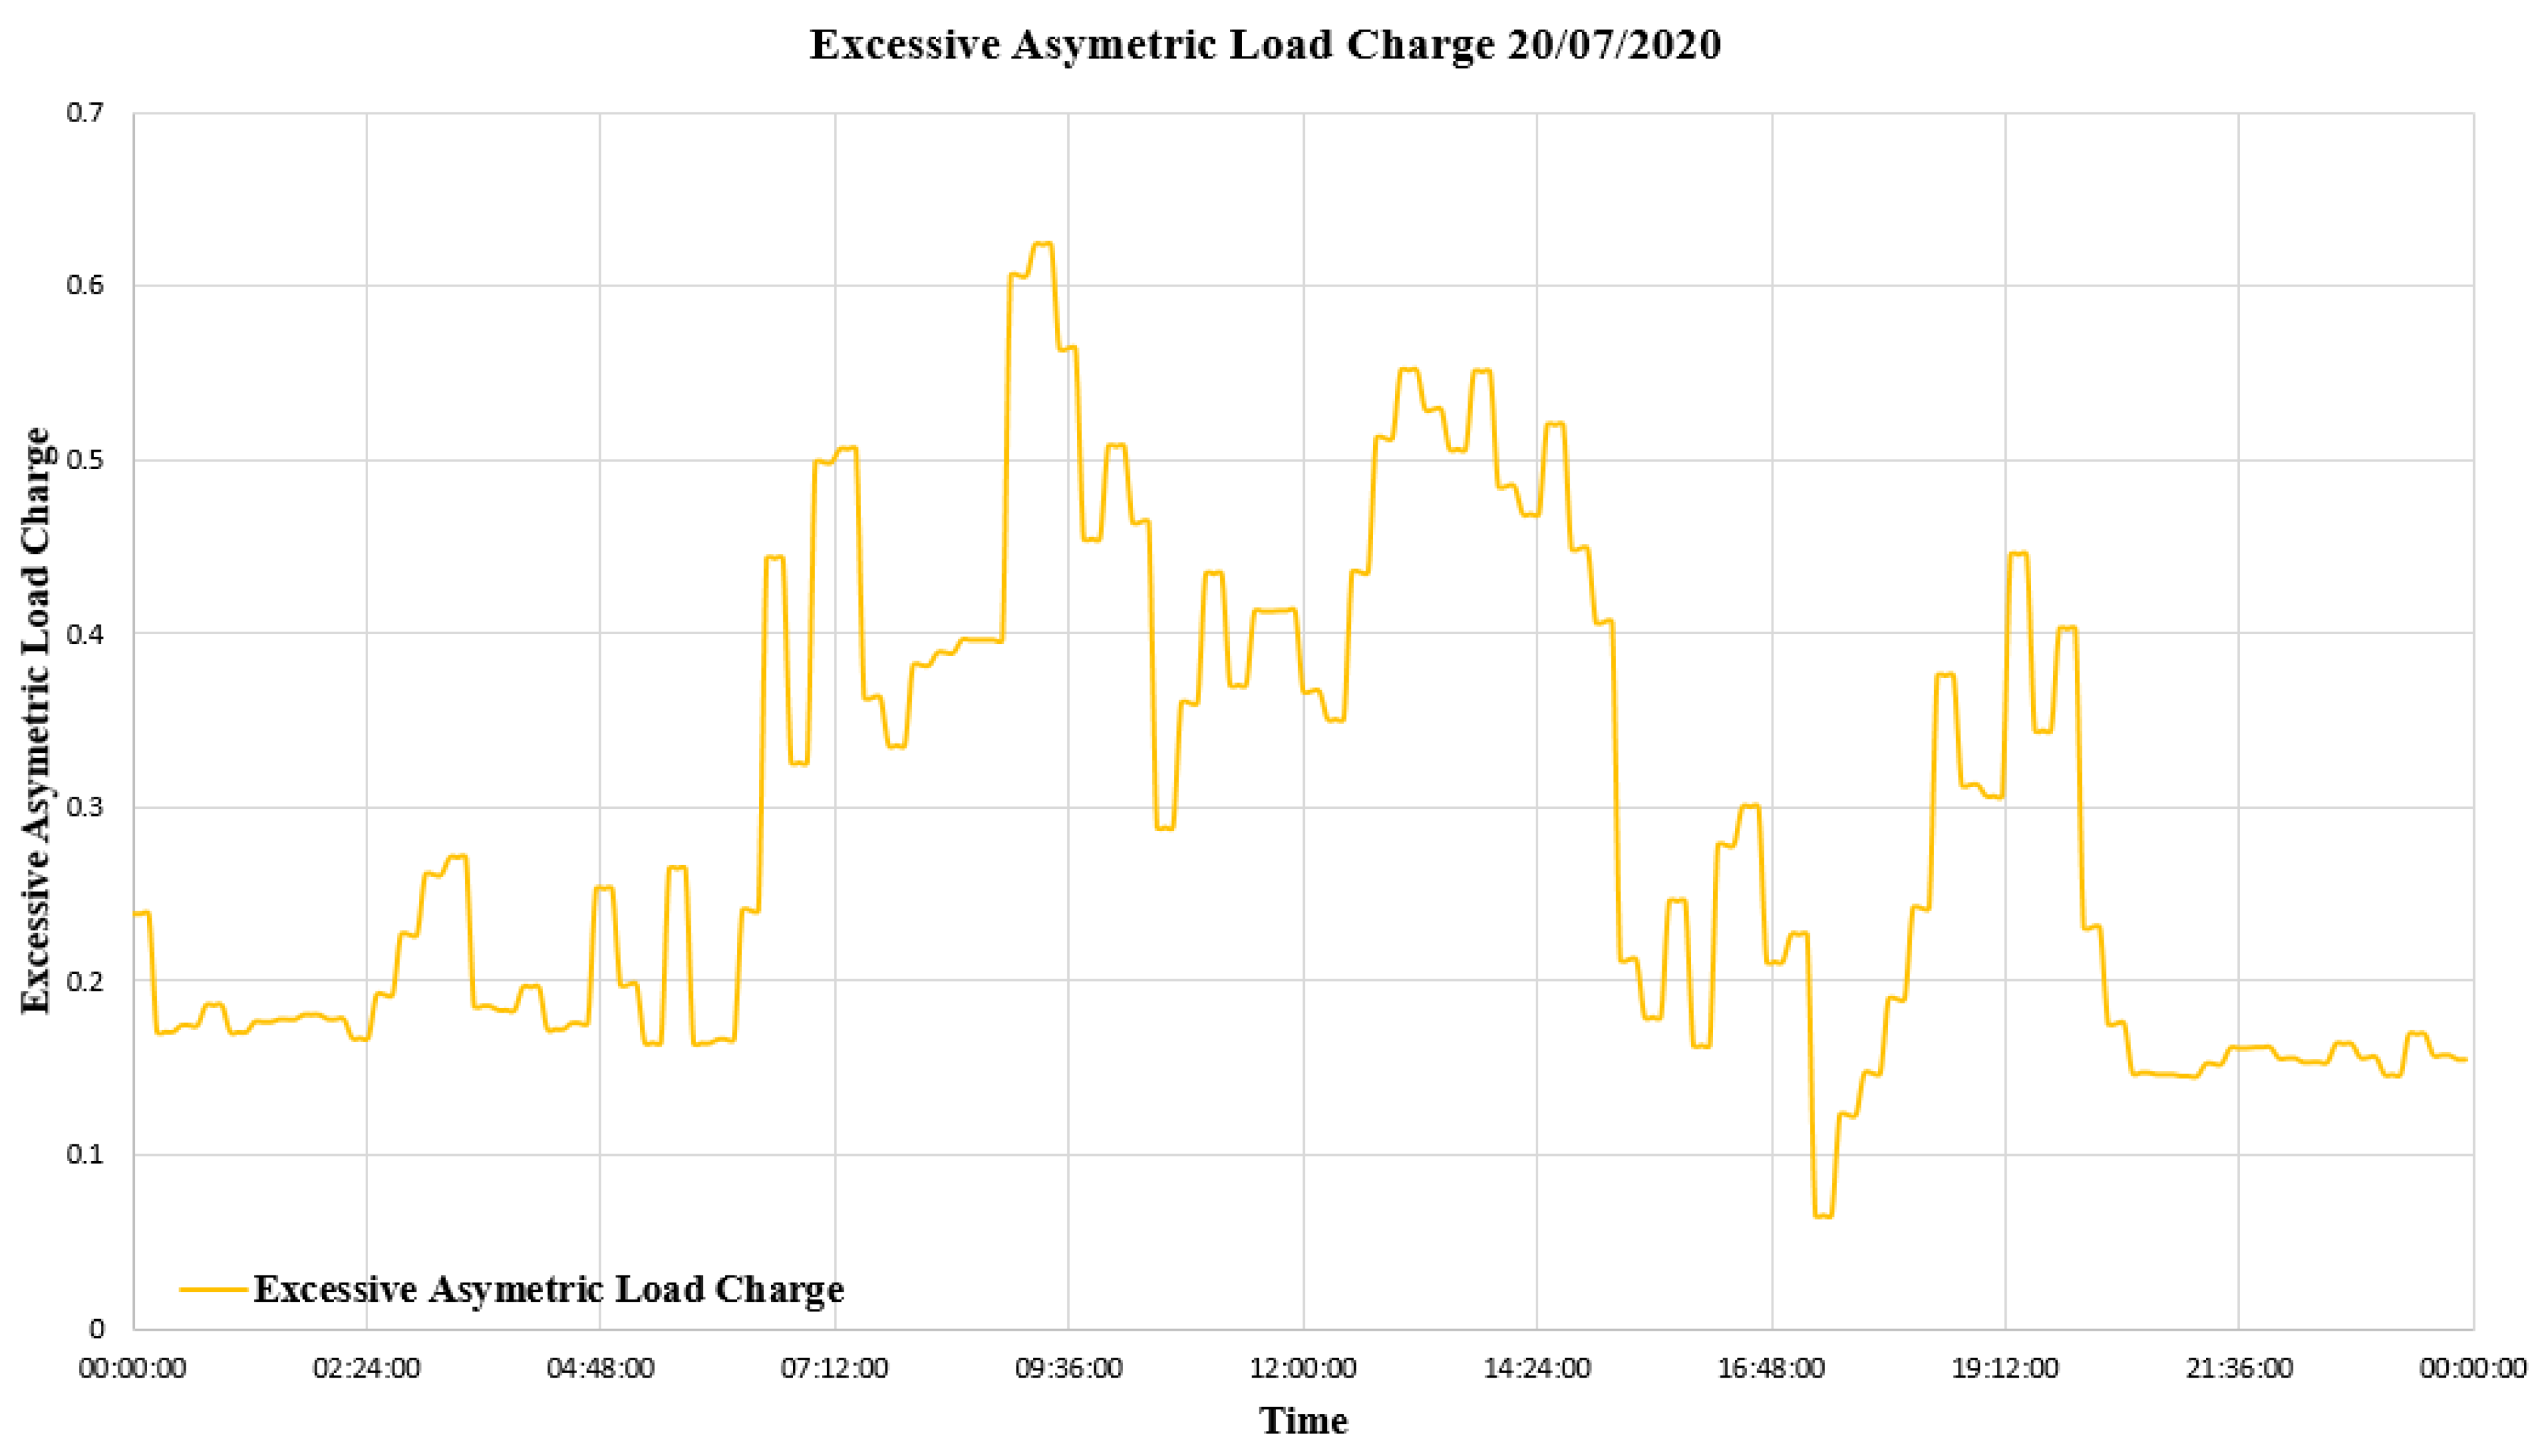
5.12. Asymmetric Load Change
This determines the unbalance in the three-phase micro-grid electrical system. As this value increases, higher problems regarding the power quality are created in the overall system. The asymmetric load charge of the MCAST micro-grid for a typical scholastic day is shown in Figure 30.
The values of the key performance indices (KPIs) for the MCAST micro-grid are shown in Table 3.
Among all the KPIs discussed and evaluated above, some need to be specially mentioned. For example, in KPI#6, the levelized cost of energy for renewable sources (LCoER) is evaluated at € 0.1825/kWh. This compares well with € 0.11 charge per kWh by Enemalta, PLC. However, as the cost of PV continues to drop, soon, the LCoER for the new PV plant may come out at par or even lower than the per-unit rate charged by Enemalta. Similarly, the trends for the cost of lithium-ion batteries, used as BESS, also show a continuous drop. However, overall costs of the system may vary depending on how major plant components like the PV panels and the storage systems change. Therefore, a detailed sensitivity analysis is done to study the effect of price change on the major KPIs of micro-grid. The results of this analysis are presented in the next section.
6. Sensitivity Analysis
During the last decade, the manufacturing industry for the PV modules has witnessed a serious disruption due to over-capacity, associated insolvency of many players, takeovers, and consolidation of holdings, and joining of giants in the race. Consequently, a decline in offered prices for the PV plant is visible, yet for cost of taxes on PV, subsidies for other generation technologies, etc., make the exact predictions uncertain [27]. Therefore, a sensitivity analysis carried out over a wide range of price variations is presented here.
Figure 31 shows the variation in the CAPEX of the micro-grid when various discounts are considered on the capital cost of the PV array, inverters, and BESS by keeping the annual real interest fixed at its present value at 7%. The variation in the CAPEX is also observed by taking small changes in the annual real interest rate by fixing the equipment’s capital cost at its present value. It is observed that if there is a 50% increase in the cost of both PV and BESS, the CAPEX of the micro-grid would be around € 26,578. On the other hand, a discount of 21% on the capital cost or the annual interest rate would reduce the capital expenditure to approx. € 14,000.
Figure 32 displays the sensitivity analysis carried out on the REPLEX of the PV system over a 30-year life span. In this analysis, the life span of the PV inverter is assumed to be 15 years, whereas the BESS is to be replaced every ten years. To carry out the sensitivity analysis on the REPLEX, different discount rates are applied to the replacement cost by fixing the interest rate at 7%. Thereafter, the REPLEX behavior is observed for different annual interest rates. It is seen that the variation in REPLEX due to annual interest is smaller as compared to the variation due to replacement cost. Hence, the replacement cost is the prominent factor in deciding the REPLEX.
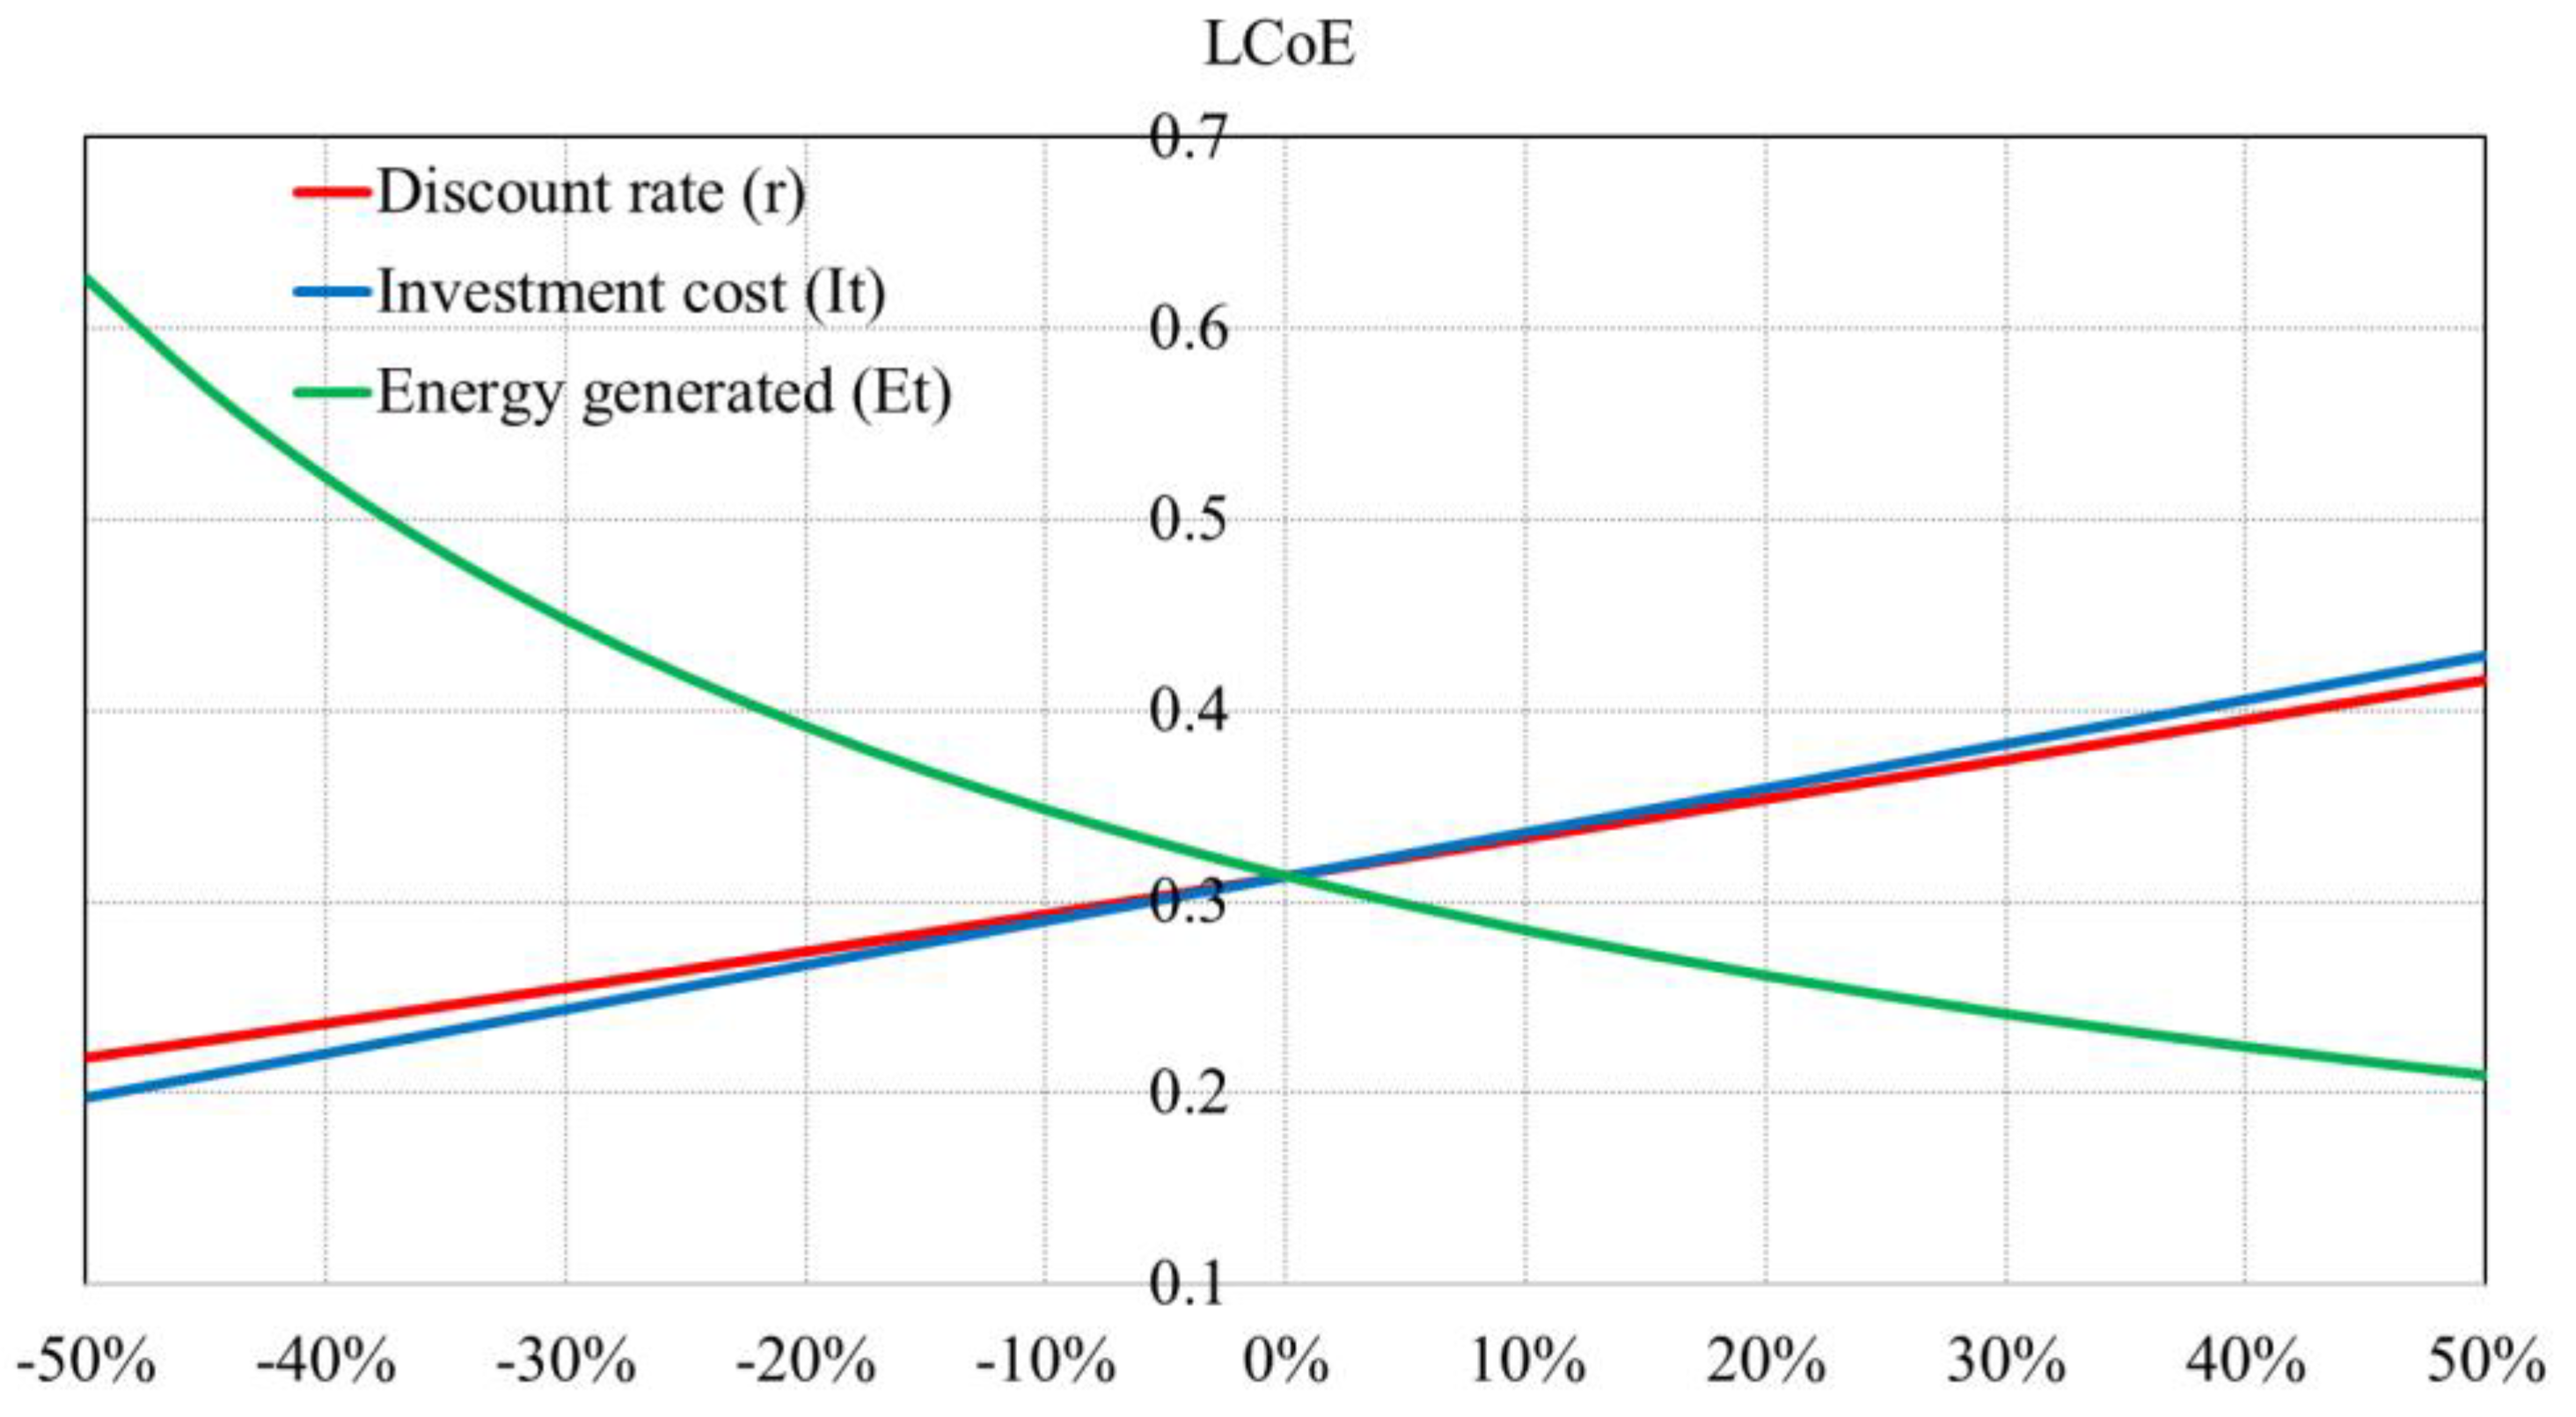
Figure 33 displays the sensitivity analysis of the LCoER of the PV system over the 30 years. In this analysis, the life span of the PV inverter is assumed to be 15 years [28]. The different discount rates applied on the capital investment of the system can help determine the most prominent factor that affects the levelized cost of energy from PV from an economic perspective. The analysis shows that levelized cost is higher as compared to the tariff of Enemalta, PLC. The energy generated from the PV is the most prominent factor in reducing the LCOE irrespective of the assumed discount rates on the CAPEX. This indicates that the annualized cost of PV array can quickly attain grid parity in Malta, irrespective of the chosen discount rate, because of a high solar irradiance capture.
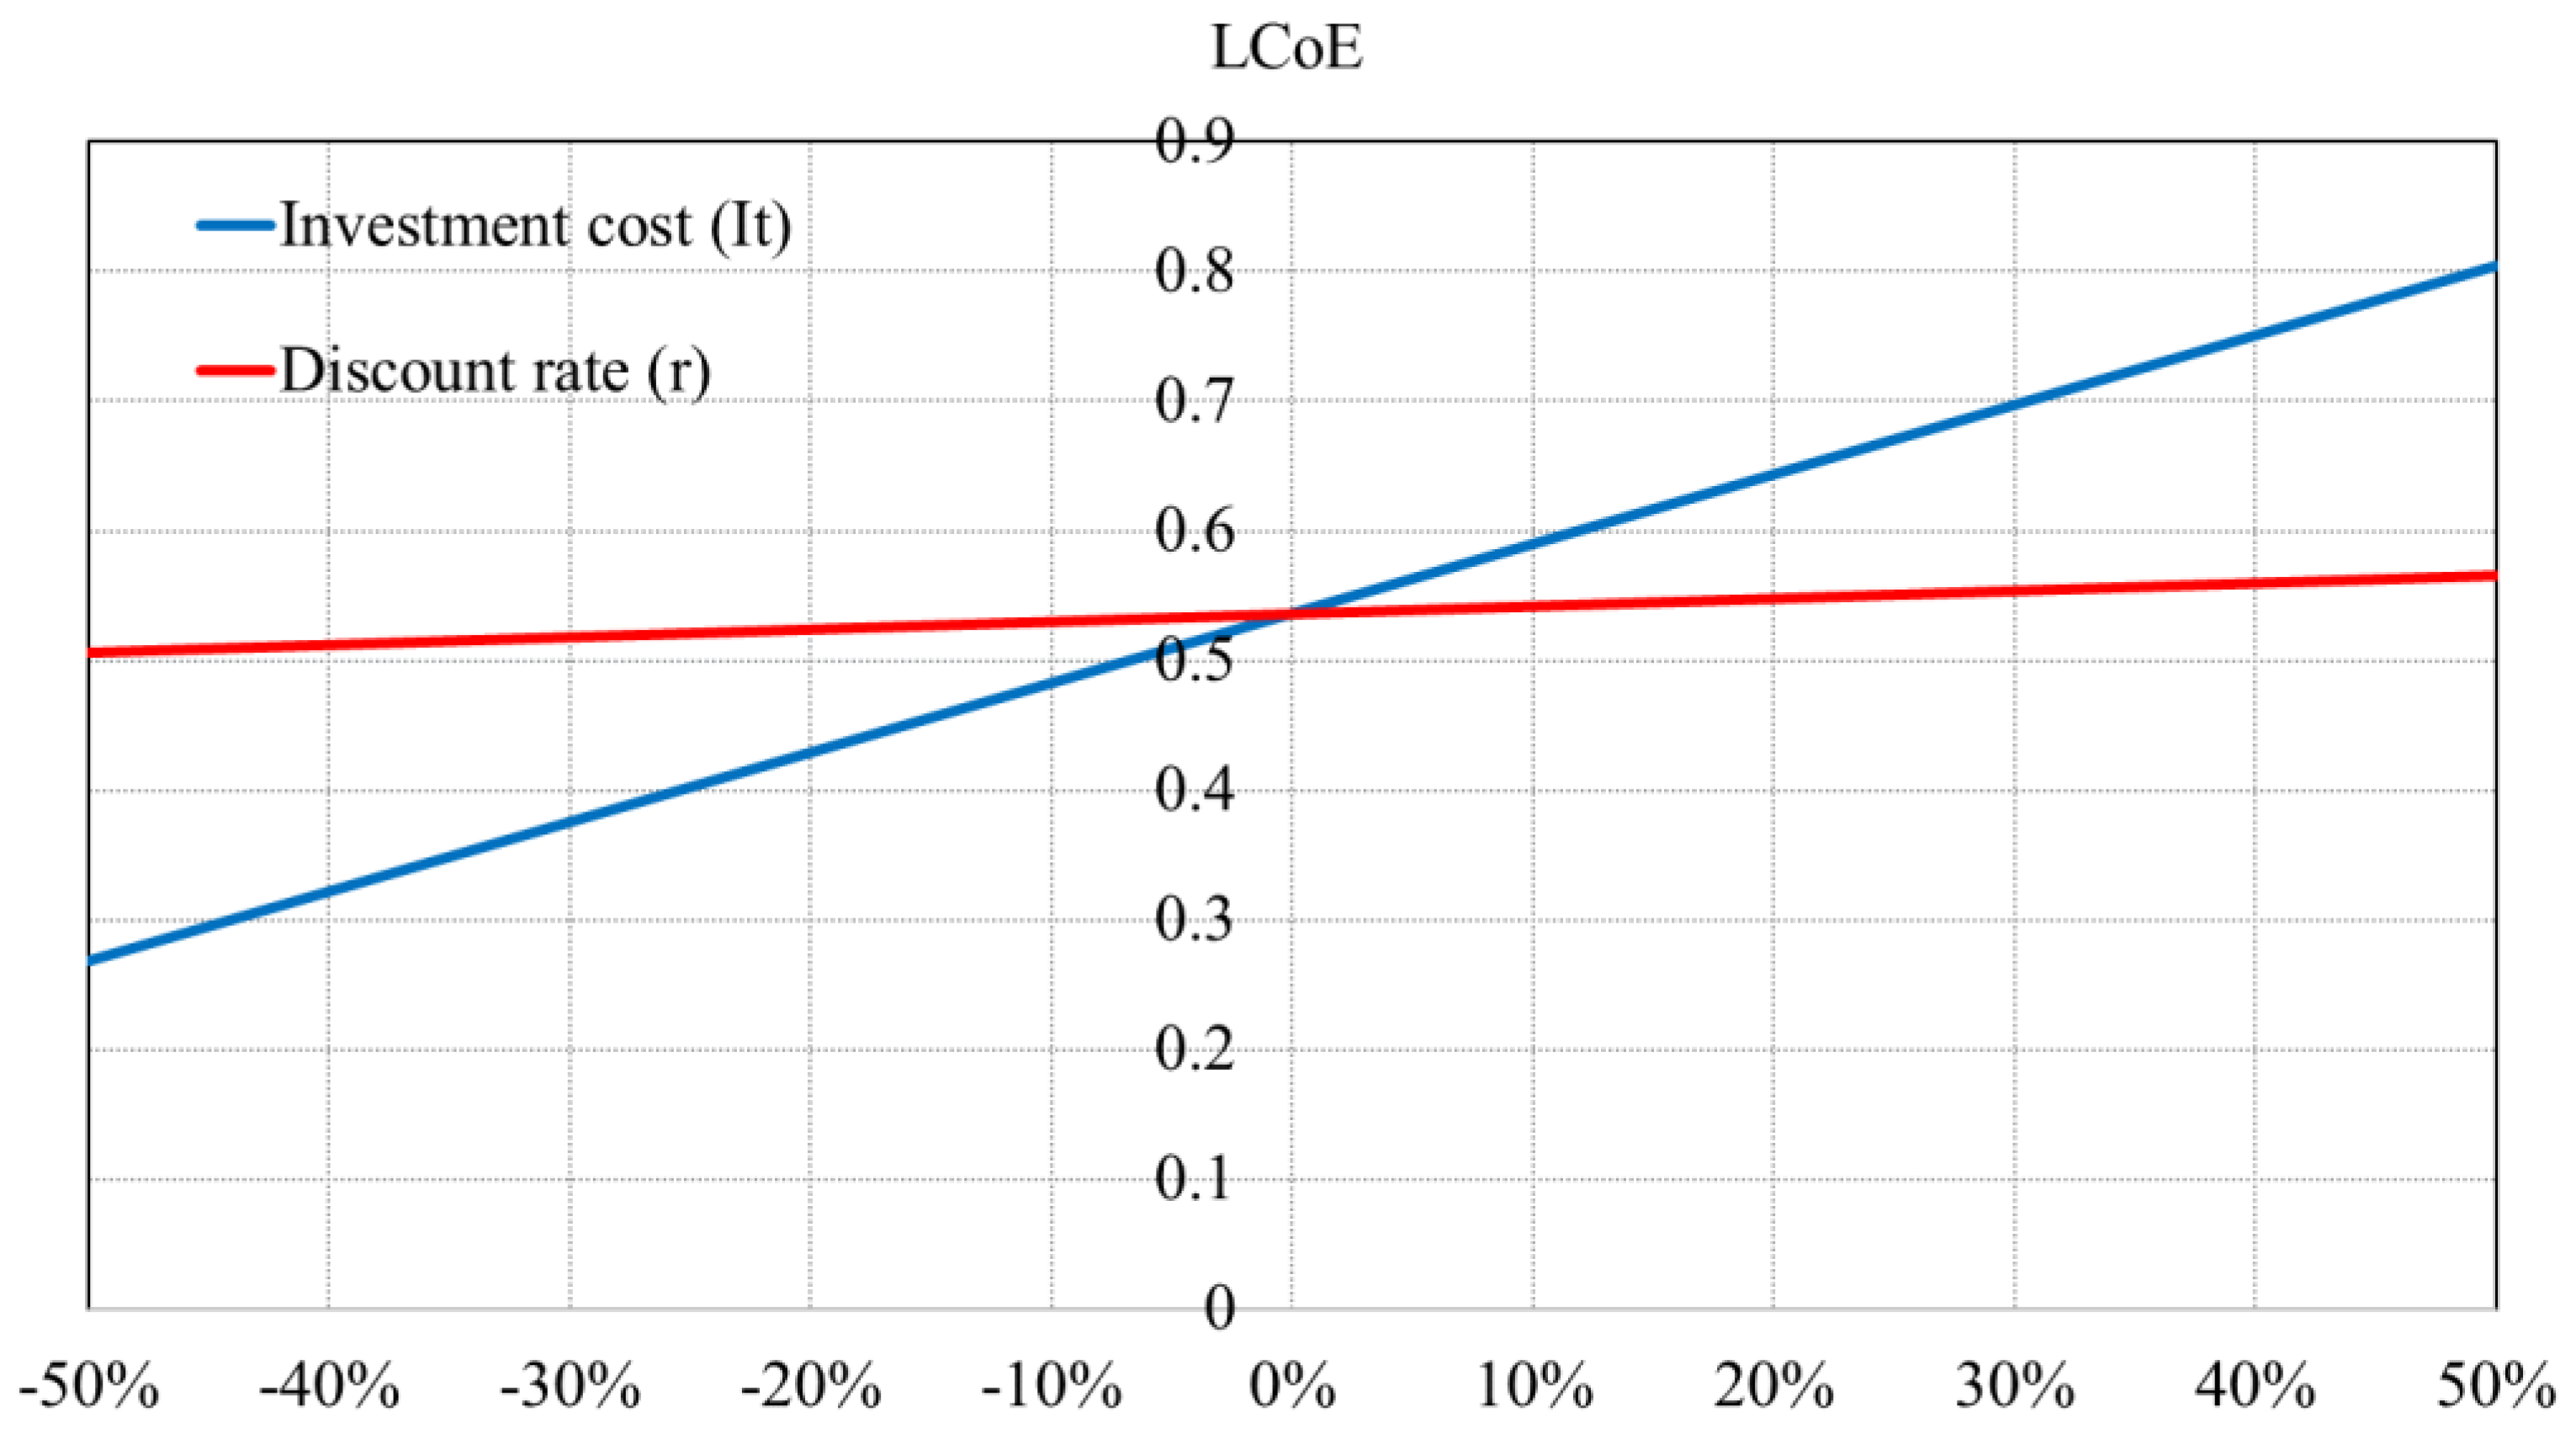
Figure 34 illustrates the sensitivity analysis of the LCoES of the BESS. A 50% increment in the cost of the BESS means that the LCoES of the BESS would be almost € 0.8/kWh, while a 50% discount reduces the LCoES to almost € 0.26/kWh. Moreover, the discount rate does not show a significant impact on the reduction of the levelized cost.
An observation of the results of the sensitivity analysis and the computed values of various KPIs displayed in Table 3 shows that the LCoER of Euro 0.197/kWh may well work out nearly the same as the rate of Euro 0.13/kWh charged by Enemalta due to the conservative assumptions made in evaluating this KPI. For example, CAPEX (KPI#1) may reduce due to a fall in the prices of PV modules, providing access to finances for the PV is brought to the level of other matured generation technologies [27,29,30]. Apart from a reduction in the cost of the PV modules, IRENA [31], projections suggest that the costs of Li-ion batteries may see a further decline of 54–61% in stationary applications by 2030. The cost depends on the chemistry used in Li-ion batteries, and it may vary from 145$ to 480 $/kWh for stationary applications. In [32], this range is mentioned as 165–24 €/kWh. Further, the use of rebuilt Li-ion batteries (second life) in stationary storage applications, after these are phased out from electric vehicles (EV)s, are being seriously considered by the industry as they have a potential of a possible 50% reduction in initial CAPEX (or REPLEX).
To keep the LCoES simple to compute, the cost of charging storage batteries has not been considered here because a consensus on the levelized cost of energy for storage is yet to emerge. However, some new metrics are being suggested for including the costs of charging etc. into the levelized costs whose effect will anyway be more than offset by a conservative assumption of five-year life of Li-ion batteries used in this study against the industry recommendation of 10 years [33,34,35].
The economics of finding a payback period for adding more PV capacity or/and storage to the existing PV assets have been kept as an option for further investigations, as the results obtained in this work indicate early grid parity.
7. Conclusions
This paper investigates the performance of the MCAST micro-grid. By carefully analyzing the current system, several case studies were formulated to provide valuable recommendations to upgrade the system based on choosing the optimum size of BESS and diesel generator. To assess the effectiveness of the micro-grid, its performance based on previously formulated key performance indicators, with emphasis on the levelized cost of production and reduction in GHG emissions, has been evaluated. A sensitivity analysis of major KPIs has also been done. The Levelized cost computed for this pilot micro-grid compares well with the rate being charged by Malta’s state monopoly electric utility, Enemalta. With a continuing fall in production costs of PV systems, associated interfacing electronics, and lithium-ion batteries, levelized cost of generation from micro-grid may become a lot more competitive with the rate being charged by Enemalta in the near future. It may come out to be cheaper if we take into consideration the carbon penalties. The substantial year-round solar insolation in the Mediterranean region adds to our confidence in the encouraging results obtained in this study.
Author Contributions
Conceptualization, V.J., B.A. and B.V.V.; methodology, S.A.; software, V.J. and S.A.; validation, S.A., B.V.V. and V.J.; formal analysis, V.J. and B.V.V.; investigation, B.V.V. and V.J.; resources, S.A.; data curation, S.A.; writing—original draft preparation, V.J.; writing—review and editing, V.J. and B.V.V.; supervision, B.A.; project administration, B.A.; funding acquisition, B.A. All authors have read and agreed to the published version of the manuscript.
Funding
This research work is supported in part by the European Commission H2020 TWINNING JUMP2Excel (Joint Universal activities for Mediterranean PV integration Excellence) project under grant 810809 and H2020 TWINNING NEEMO (Networking for Excellence in Electric Mobility Operations) project under grant 857484 as well as the Malta Council for Science and Technology (MCST) (Grant ENM-2016-002a) through the ERANETMED initiative of Member States, Associated Countries and Mediterranean Partner Countries (3DMgrid Project ID eranetmed_energy-11-286).
Conflicts of Interest
The authors declare no conflict of interest.
Abbreviations
| PV | Photovoltaic |
| EV | Electric Vehicle |
| BMS | Building Management System |
| V2G | Vehicle to Grid |
| GIS | Geographic Information System |
| BIM | Building Information Modeling |
| KPIs | Key Performance Indices |
| MG | Micro-grid |
| HVAC | Heating, Ventilation and Air Conditioning |
| PR | Pump Room |
| DOD | Depth of Discharge |
| MAINTEX | Maintenance Cost |
| AEPEX | Annual Energy Purchase Expenditure |
| LCoER | Levelized Cost of Energy from Renewables |
| GHGRED | Reduction of GHG Emissions |
| REPEN | Renewable Energy Penetration |
| VLTR | Voltage Range/Fluctuations |
| DERs | Distributed Energy Resources |
| GHG | Greenhouse gas |
| BESS | Battery Energy Storage System |
| SS1/SS2 | Substation ½ |
| MDB | Main Distribution Boards |
| NE | Non-Essential loads |
| ES | Essential loads |
| SoC | State of Charge |
| CP | Car Park |
| RES | Renewable Energy Sources |
| CAPEX | Capital Expenditure |
| REPLEX | Replacement Cost |
| LCoE | Levelized Cost of Energy |
| LCoES | Levelized Cost of Energy from Storage Systems |
| PNLRED | Reduction of Carbo Penalties |
| PVCOV | Coverage from PVs |
| VLSTD | Voltage Standard Deviation |
References
- Pashajavid, E.; Shahnia, F.; Ghosh, A.; Ehsan, P. Overload management of autonomous microgrids. In Proceedings of the 2015 IEEE 11th International Conference on Power Electronics and Drive Systems, Sydney, NSW, Australia, 9–12 June 2015; pp. 73–78. [Google Scholar]
- Greg, T. The Sonoma Community Micro-Grid Initiative; Clean Coalition: Santa Barbara, CA, USA, 2018. [Google Scholar]
- Chandrasena, R.P.; Shahnia, F.; Rajakaruna, S.; Ghosh, A. Dynamic operation and control of a hybrid nanogrid system for future community houses. IET Gener. Transm. Distrib. 2015, 9, 1168–1178. [Google Scholar] [CrossRef] [Green Version]
- Hayden, E. Introduction to Micro-Grids; Securicon: Alexandria, VA, USA, 2016. [Google Scholar]
- Ali, L.; Shahnia, F. Determination of an economically-suitable and sustainable standalone power system for an off-grid town in Western Australia. Renew. Energy 2017, 106, 243–254. [Google Scholar] [CrossRef] [Green Version]
- Shahnia, F.; Moghbel, M.; Arefi, A.; Shafiullah, G.M.; Anda, M.; Vahidnia, A. Levelized cost of energy and cash flow for a hybrid solar-wind-diesel microgrid on Rottnest island. In Proceedings of the 2017 Australasian Universities Power Engineering Conference (AUPEC), Melbourne, VIC, Australia, 19–22 November 2017; pp. 1–6. [Google Scholar]
- Pashajavid, E.; Shahnia, F.; Ghosh, A. Development of a Self-Healing Strategy to Enhance the Overloading Resilience of Islanded Microgrids. IEEE Trans. Smart Grid 2015, 8, 1. [Google Scholar] [CrossRef]
- Pashajavid, E.; Shahnia, F.; Ghosh, A. Provisional internal and external power exchange to support remote sustainable microgrids in the course of power deficiency. IET Gener. Transm. Distrib. 2017, 11, 246–260. [Google Scholar] [CrossRef]
- Arefi, A.; Shahnia, F. Tertiary Controller-Based Optimal Voltage and Frequency Management Technique for Multi-Microgrid Systems of Large Remote Towns. IEEE Trans. Smart Grid 2017, 9, 5962–5974. [Google Scholar] [CrossRef]
- Shahnia, F.; Bourbour, S.; Ghosh, A. Coupling Neighboring Microgrids for Overload Management Based on Dynamic Multicriteria Decision-Making. IEEE Trans. Smart Grid 2015, 8, 1. [Google Scholar] [CrossRef]
- Guarnieri, M.; Bovo, A.; Giovannelli, A.; Mattavelli, P. A Real Multitechnology Microgrid in Venice: A Design Review. IEEE Ind. Electron. Mag. 2018, 12, 19–31. [Google Scholar] [CrossRef]
- Venkatasubramanian, B.V.; Jately, V.; Azzopardi, B. Techno-Economic Framework for Optimal Capacity Expansion of Active Microgrid in the Mediterranean: A Case Study of MCAST. IEEE Access 2021, 9, 120451–120463. [Google Scholar] [CrossRef]
- Narayan, N.; Papakosta, T.; Vega-Garita, V.; Popovic-Gerber, J.; Bauer, P.; Zeman, M. A simple methodology for estimating battery lifetimes in Solar Home System design. In Proceedings of the 2017 IEEE AFRICON, Cape Town, South Africa, 18–20 September 2017. [Google Scholar]
- Malta, N.P.F. Alternative Fuel Infrastructure for Transport in Malta 2018–2030. Available online: https://mtip.gov.mt/en/Documents/NPF%20Malta.pdf (accessed on 20 May 2020).
- Defining a Microgrid Using IEEE 2030. 7—IEEE Standard for the Specification of Micro-grid Controllers; IEEE: Piscataway, NJ, USA, 2017. [Google Scholar]
- IEEE 2030. 8—IEEE Standard for the Testing of Micro-grid Controllers; IEEE: Piscataway, NJ, USA, 2018. [Google Scholar]
- Bollen, M.; Zhong, J.; Samuelsson, O.; Björnstedt, J. Performance indicators for microgrids during grid-connected and island operation. In Proceedings of the 2009 IEEE Bucharest PowerTech, Bucharest, Romania, 28 June–2 July 2009; pp. 1–6. [Google Scholar]
- Rahim, A.; Hussain, M. Evaluation and enhancement of dynamic performance of a microgrid including PV and wind generation systems. Math. Comput. Model. Dyn. Syst. 2013, 19, 201–219. [Google Scholar] [CrossRef]
- Wang, S.; Li, Z.; Wu, L.; Shahidehpour, M.; Li, Z. New Metrics for Assessing the Reliability and Economics of Microgrids in Distribution System. IEEE Trans. Power Syst. 2013, 28, 2852–2861. [Google Scholar] [CrossRef]
- Georgilakis, P.S.; Katsigiannis, Y.A. Reliability and economic evaluation of small autonomous power systems containing only renewable energy sources. Renew. Energy 2009, 34, 65–70. [Google Scholar] [CrossRef]
- Stamp, J. Assessment of Reliability and Performance of Microgrid Use Cases Toward Meeting the Defined Objectives. IEEE PES Annual Meeting. Available online: https://0-site-ieee-org.brum.beds.ac.uk/isgt2014/files/2014/03/Day1_Panel2A_Stamp.pdf (accessed on 20 November 2020).
- Gabbar, H.A.; Xiaoli, M.; Abdelsalam, A.A.; Honarmand, N. Key performance indicator modelling for micro grid design and operation evaluation. Int. J. Distrib. Energy Resour. Smart Grids 2014, 10, 219–242. [Google Scholar]
- Personal, E.; Guerrero, J.I.; Garcia, A.; Peña, M.; Leon, C. Key performance indicators: A useful tool to assess Smart Grid goals. Energy 2014, 76, 976–988. [Google Scholar] [CrossRef]
- Rangel, C.M.; Mascarella, D.; Joos, G. Real-time implementation & evaluation of grid-connected microgrid energy management systems. In Proceedings of the 2016 IEEE Electrical Power and Energy Conference (EPEC), Ottawa, ON, Canada, 12–14 October 2016; pp. 1–6. [Google Scholar]
- Pinceti, P.; Vanti, M.; Giannettoni, M. Technical KPIs for microgrids. In Proceedings of the 2017 IEEE International Systems Engineering Symposium (ISSE), Vienna, Austria, 11–13 October 2017; pp. 1–7. [Google Scholar] [CrossRef]
- Yang, H.; Wei, Z.; Chengzhi, L. Optimal design and techno-economic analysis of a hybrid solar—wind power generation system. Appl. Energy 2009, 86, 163–169. [Google Scholar] [CrossRef]
- Venkateswaran, V.B.; Saini, D.K.; Sharma, M. Environmental Constrained Optimal Hybrid Energy Storage System Planning for an Indian Distribution Network. IEEE Access 2020, 8, 97793–97808. [Google Scholar] [CrossRef]
- Jately, V.; Azzopardi, B.; Bartolo, B.; Mikalauskiene, R.; Bhattacharya, S. Techno-Economic Assessment of PV System for self-consumption Case Study of Malta. In Proceedings of the 2020 47th IEEE Photovoltaic Specialists Conference (PVSC), Calgary, AB, Canada, 15 June–21 August 2020. [Google Scholar]
- Lazard’s Levelised Cost of Storage Analysis, Version 3.0. Available online: https://www.lazard.com/media/450338/lazard-levelized-cost-of-storage-version-30.pdf (accessed on 20 November 2020).
- Saini, D.K.; Sharma, M. Techno-Economic Hardening Strategies to enhance Distribution System Resilience against Earthquake. Reliab. Eng. Syst. Saf. 2021, 213, 107682. [Google Scholar] [CrossRef]
- Lotfi, H.; Khodaei, A. Levelized cost of energy calculations for microgrids. In Proceedings of the 2016 IEEE Power and Energy Society General Meeting (PESGM), Boston, MA, USA, 17–21 July 2016; pp. 1–5. [Google Scholar]
- IRENA. Electricity Storage and Renewables: Costs and Markets to 2030. Available online: https://www.digitalsolar-storage.org/wp-content/uploads/2017/12/5Dec_10.30_Juan_Pablo_Ralon_Fonseca.pdf (accessed on 20 November 2020).
- Tsiropoulos, I.; Tarvydas, D.; Lebedeva, N. Li-Ion Batteries for Mobility and Stationary Storage Applications; Publications Office of the European Union: Luxembourg, 2018. [Google Scholar]
- Approaches for optimal planning of the energy storage units in distribution network and their impacts on system resiliency. CSEE J. Power Energy Syst. 2020, 6, 816–833. [CrossRef]
- Azzopardi, B.; Azzopardi, S.; Bartolo, B.; Jately, V.; Mikalauskine, R.; Bhattacharya, S.; Khalifeh, A.; Hadjidemetriou, L.; Tsolakis, A.; Martinez-Ramos, J.L.; et al. Micro-Grid Campus Concept from Data to Design: Case Study Malta. In Proceedings of the 2020 47th IEEE Photovoltaic Specialists Conference (PVSC), Calgary, AB, Canada, 15 June–21 August 2020; pp. 2001–2004. [Google Scholar]
Figure 1.
Aerial view of MCAST buildings as part of the micro-grid.

Figure 2.
MCAST micro-grid—Electrical Network.

Figure 3.
Basic setup for feeders being monitored.

Figure 4.
Effect of PVs on MCAST load demand.

Figure 5.
Monthly load duration curves.

Figure 6.
Segregation of essential loads.

Figure 7.
Essential load demand and PV generation during a scholastic day.

Figure 8.
Essential load demand and PV generation during a weekend.

Figure 9.
Block diagram of the simulation framework.

Figure 10.
The behavior of MCAST micro-grid without BESS on a typical weekday.

Figure 11.
The behavior of MCAST micro-grid without BESS on a typical Sunday.

Figure 12.
The behavior of MCAST micro-grid with increased PV capacity on a typical weekday.

Figure 13.
The behavior of MCAST micro-grid with increased PV capacity on a typical Sunday.

Figure 14.
The behavior of MCAST micro-grid integrated with a 250 kWh BESS and 150 kVA diesel generator during an 8-h power cut.
Figure 14.
The behavior of MCAST micro-grid integrated with a 250 kWh BESS and 150 kVA diesel generator during an 8-h power cut.

Figure 15.
Performance of 250 kWh BESS during an 8 h power cut.

Figure 16.
The behavior of MCAST micro-grid integrated with a 150 kWh BESS and 150 kVA diesel generator during a 2-h power cut.
Figure 16.
The behavior of MCAST micro-grid integrated with a 150 kWh BESS and 150 kVA diesel generator during a 2-h power cut.

Figure 17.
Performance of 150 kWh BESS during a 2-h power cut.

Figure 18.
The behavior of MCAST micro-grid integrated with a 150 kWh BESS and 150 kVA diesel generator during a 4-h power cut.
Figure 18.
The behavior of MCAST micro-grid integrated with a 150 kWh BESS and 150 kVA diesel generator during a 4-h power cut.

Figure 19.
Performance of 150 kWh BESS during a 4-h power cut.

Figure 20.
The behavior of MCAST micro-grid integrated with a 150 kWh BESS and 150 kVA diesel generator during an 8-h power cut at 4 a.m.
Figure 20.
The behavior of MCAST micro-grid integrated with a 150 kWh BESS and 150 kVA diesel generator during an 8-h power cut at 4 a.m.

Figure 21.
Performance of 150 kWh BESS during an 8-h power cut at 4 a.m.

Figure 22.
The behavior of MCAST micro-grid integrated with optimum-sized energy storage during an 8-h power cut at 12 p.m.
Figure 22.
The behavior of MCAST micro-grid integrated with optimum-sized energy storage during an 8-h power cut at 12 p.m.

Figure 23.
Performance of the optimum-sized energy storage during an 8-h power cut at 12 p.m.

Figure 24.
The behavior of MCAST micro-grid integrated with optimum-sized energy storage during an 8-h power cut at 8 p.m.
Figure 24.
The behavior of MCAST micro-grid integrated with optimum-sized energy storage during an 8-h power cut at 8 p.m.

Figure 25.
Performance of the optimum-sized energy storage during an 8-h power cut at 8 p.m.

Figure 26.
The behavior of MCAST micro-grid integrated with electric vehicles.

Figure 27.
Performance of the EV battery.

Figure 28.
PV penetration of the MCAST micro-grid during a typical weekday.

Figure 29.
Voltage deviation observed within the MCAST micro-grid during a typical weekday.

Figure 30.
Load change observed within the MCAST micro-grid during a typical weekday.

Figure 31.
Sensitivity analysis on the CAPEX.

Figure 32.
Sensitivity analysis on the REPLEX.

Figure 33.
Sensitivity analysis on the LCoE of the PV array.

Figure 34.
Sensitivity analysis on the LCoE of the BESS.


Table 1.
Description of layout labels.
| Block D | Block F | Block J | SS1 | SS2 |
|---|---|---|---|---|
| Institute of Business Management and Commerce | Students House | Institute of Applied Science | Substation 1 | Substation 2 |
Table 2.
EV integration parameters.
| Number of EVs Available | Average EV Capacity | EV Power | Initial SoC of EV Battery | Minimum SoC of EV Battery | Time of Day |
|---|---|---|---|---|---|
| 45 cars | 30 kWh | 1.25 kW | 75% | 50% | 7 a.m.–2 p.m. |
Table 3.
KPIs evaluated for the MCAST micro-grid.
| KPI#Number | Average EV Capacity |
|---|---|
| KPI#1, CAPEX | € 15,808.95 |
| KPI#2, MAINTEX | € 3086.04 |
| KPI#3, REPLEX | € 9923.28 |
| KPI#4 AEPEX | € 129,086.1 |
| KPI#5, LCoER | € 0.1825/kWh, |
| KPI#6, LCoES | € 0.5362/kWh |
| KPI#7, GHGRED | 32.381 ton of CO2/year |
| KPI#8, PNLRED | € 3238/year |
| KPI#9, REPEN | 7.85% |
| KPI#10, PVCOV | 36.1% |
| KPI#11(a), VLTRmax | 2.93 V |
| KPI#11(b), VLTRmin | 2.81 V |
| KPI#12, VLTSTD | 1.16 V |
Publisher’s Note: MDPI stays neutral with regard to jurisdictional claims in published maps and institutional affiliations. |
© 2021 by the authors. Licensee MDPI, Basel, Switzerland. This article is an open access article distributed under the terms and conditions of the Creative Commons Attribution (CC BY) license (https://creativecommons.org/licenses/by/4.0/).
Share and Cite
MDPI and ACS Style
Jately, V.; V., B.V.; Azzopardi, S.; Azzopardi, B. Design and Performance Investigation of a Pilot Micro-Grid in the Mediterranean: MCAST Case Study. Energies 2021, 14, 6846. https://0-doi-org.brum.beds.ac.uk/10.3390/en14206846
AMA Style
Jately V, V. BV, Azzopardi S, Azzopardi B. Design and Performance Investigation of a Pilot Micro-Grid in the Mediterranean: MCAST Case Study. Energies. 2021; 14(20):6846. https://0-doi-org.brum.beds.ac.uk/10.3390/en14206846
Chicago/Turabian StyleJately, Vibhu, Balaji Venkateswaran V., Stefan Azzopardi, and Brian Azzopardi. 2021. "Design and Performance Investigation of a Pilot Micro-Grid in the Mediterranean: MCAST Case Study" Energies 14, no. 20: 6846. https://0-doi-org.brum.beds.ac.uk/10.3390/en14206846
Note that from the first issue of 2016, this journal uses article numbers instead of page numbers. See further details here.