
Mission-Oriented Policies and Technological Sovereignty: The Case of Climate Mitigation Technologies


1
Department of Economics, Roma Tre University, 00145 Rome, Italy
2
SEEDS Interuniversity Research Centre, Department of Economics and Management, University of Ferrara, 44121 Ferrara, Italy
*
Author to whom correspondence should be addressed.
Energies 2021, 14(20), 6854; https://0-doi-org.brum.beds.ac.uk/10.3390/en14206854
Submission received: 19 September 2021
/
Revised: 12 October 2021
/
Accepted: 15 October 2021
/
Published: 19 October 2021
(This article belongs to the Special Issue Industry and Tertiary Sectors towards Clean Energy Transition)
Abstract
:The rapid decarbonization of the global economy represents the main challenge for the next decades to combat climate change. The European Union (EU) is leading the negotiation process under the Paris Agreement and recently approved an ambitious unilateral mitigation strategy known as the European Green Deal (EGD). In this paper, we present a novel approach based on the analysis of patent data related to climate change and mitigation technologies (CCMTs) with the aim of describing the evolutionary pattern of the EU in green technology. Based on our analysis, two of our main results deserve attention. First, at the global level, the pace of generation of new green technologies as measured by patent data is slowing down in recent years. This trend, if not inverted, casts some doubts on the economic sustainability of the ambitious environmental targets set by the EC. Second, the current EU technological positioning with respect to green areas appears to be problematic in terms of technological sovereignty, with serious risks of potential technological dependences from other countries. Given the radical technological shift required for the implementation of a full decarbonization pattern, the EU must realize a mission-oriented technology policy with additional and directed investments to ensure technological independence, together with a low-carbon and energy secure economy.
1. Introduction
The European Union (EU) is a key player in international climate negotiations given the ambitious mitigation targets declared under the Paris Agreement (PA) framework. Such a challenging decarbonization pattern is the only road to a more sustainable development of human activities as emphasized by the main available assessments based on future projections of greenhouse gas (GHG) emissions related to anthropic activities [1,2].
Given the attitude of the EU to design complex strategies devoted to the mitigation process by using different regulatory and voluntary measures, the final evolution of the institutional setting is based on the carbon-neutral policy package formed by the blueprint for this transformational change represented by the European Green Deal (EGD) and the latest practical planning known as the Fit for 55 package. The EGD represents an ambitious long-term strategy with the primary objective to ensure the complete decarbonization of the EU by involving all policy levels as well as the civil society and the private economic sectors [3]. With the Fit for 55 package, the EU shapes an additional set of inter-connected proposals in order to find practical solutions to ensure a fair, competitive, and green transition by 2030 and beyond by exploiting potential benefits arising from the specific measures designed until now [4]. The involvement of a high number of stakeholders is a source of positive spillovers emerging from the fruitful interaction of different agents and the co-evolution of knowledge and skills [5]. At the same time, relevant transaction costs might slow down the technological shift required for the sustainable transition if adequate complementary policies and instruments fail to provide the institutional and economic environment required to support the weaker players such as energy-intensive industries or sectors with a low speed in adapting to new technological solutions [6].
Given that the rationale underlying the EGD is based on long-term economic growth, the targets highlighted in the roadmap to make Europe the first climate-neutral continent by 2050 must rely on a set of measures to assist the economic and industrial transformation [7]. If we look at the difference between the EU carbon emissions projected under a baseline scenario [8] and the full decarbonization pattern compatible with the target declared by the EU, the emissions gap is so steep that the cost of achieving the final 2050 CO2 level might be prohibitive without a massive investment in the technological transition [9].
According to Tagliapietra et al. [9], among the priorities the EU strategy must address in the near future to be on track with the transition process, a key role is played by the resources invested in the development of new technologies and, more importantly, in the achievement of a leading competitive position in the international market.
The design of an ambitious policy strategy is a necessary condition to push the system toward a radical shift in the technological content of the economic system. Nonetheless, such a process is formed by different stages in the innovation process, from the invention of new technologies, through to the development of commercial devices and the diffusion among final consumers. All these stages are associated with different policy instruments that mainly impact one dimension of the transition process. For instance, instruments designed to influence the final demand of those technologies aim at respecting the standards, also known as demand-pull policies, which are typically associated with the deployment of existing technologies or to the development of incremental innovation [10,11]. In contrast, the direct financial support to research and development (R&D) activities carried out by the public and private sectors is more suitable for tracing a radical shift in the technological trajectory, allowing the system to escape from technological lock-in [12]. The recent development of the EU energy strategy seems to go in this direction thanks to the introduction of the Innovation Fund (IF), designed to support the development of low-carbon technologies with a budget of around EUR 10 billion over the period 2020–2030. Nonetheless, according to Bassi et al. [7], the resources to be directed toward the development and adoption of clean energy technologies should amount at 10 times the value of the IF. The estimates are based on a dynamic computable general equilibrium model that allows including the contribution of green technologies in achieving the decarbonization target at the lowest possible cost. In other words, they quantify the financial resources to be directed to the technology-based radical shift of the EU economy in order to transform the cost of cutting emissions into a development opportunity. A carbon price mechanism alone would negatively impact domestic income with a drop in GDP by 2050 of around −13%, meaning that only a de-growth process with a substantial reduction in production and consumption patterns might ensure the fulfilment of carbon mitigation targets [13]. In contrast, the full adoption of a sustainable transition strategy including the development and the diffusion of clean energy technologies and related infrastructures, along the whole production value chain and the consumption pattern, would ensure the system a positive GDP growth rate combined with a substantial emissions reduction.
Building on these projections, there are several key issues to be further investigated.
First, there is still uncertainty on the quantification of financial resources needed to be collected and activated by the public budget to sustain such a transition, compatible with the constraints on public finance related to the EU fiscal sustainability rules [14]. In this respect, there are some theoretical proposals mainly based on the adoption of a revenue recycling mechanism applied to carbon (and energy) taxation and practical advice suggesting the use of complementary resources directed toward technological development under investment plans to recover from the COVID-19 crisis [15,16].
The number of public resources to be invested by EU countries in this direction is substantially different if Europe’s transition to full decarbonization should take place by developing green technologies in-house (the make option) instead of acquiring them abroad (the buy option). However, the choice between the two strategies is by no means neutral. For instance, undertaking the buy option might result in a sustainable transition process where the EU would significantly reduce the energy dependence from external sources thanks to the production of renewable energies at the expense of increasing the technological dependence from abroad if the innovative process takes place outside the EU borders. Such a possibility cannot be ruled out if one considers the marginal role historically played by technology-push instruments in climate-related policy packages planned by the EU and, more in general, the inability by past R&D policies (especially the Framework Programs and the European Fund for Strategic Investments) in fostering the innovation process at the point of bridging the scientific and technological gap of the EU vis-à-vis the United States, Japan, and, in the immediate future, China [17,18].
This last argument inevitably recalls the heated discussion on “technological sovereignty” that arose in Europe during the COVID-19 pandemic. The current crisis showed the deep technological capacity gap of Europe with both the U.S. and China in a variety of key domains, from health apparatus and vaccines to digital sectors [19,20].
According to its early notion, having “technological sovereignty” in a given area means that a country (or a group of countries) holds and preserves the ability to autonomously master knowledge in that field. Considering the globalized and interconnected nature of economies, the current meaning of “technological sovereignty” has transcended national boundaries and rather represents the appropriate level of technological capability to be held in order to avoid structural dependence with third parties [21]. This may be reached autonomously or, more likely, through mutual exchanges with other countries based on reliant alliances and partnerships [22]. In turn, technological sovereignty is a pre-condition for a plethora of other forms of sovereignty [23] such as innovation sovereignty (the ability to locally exploit technologies for the development of present and future economic activities), economic sovereignty (the ability to generate value added and prosperity through independent activities), and strategic autonomy (the ability to play an autonomous and strategic role in the geopolitical context) on issues of global importance including the green transition process.
With respect to the latter, its relevance in terms of technological sovereignty is stated by the recently published first work program for the European Innovation Council (EIC) that shapes innovation objectives on the EU’s priorities for transiting to a sustainable, digital, and healthy society [24]. This calls for profound technological and innovation breakthroughs in a number of domains including green-related areas such as, as reported by the document, new pathways for green hydrogen production and engineered living materials such as advanced high-performance computing, edge computing, quantum technologies, cyber-security, artificial intelligence, block-chain, cloud infrastructure technologies and technologies for the Internet of Things, AI-driven tools for early diagnosis, point-of-care diagnostics, new approaches in cell and gene therapy, bio-processing 4.0, health intelligence services, and e-health solutions.
From a policy perspective, obtaining “technological sovereignty” in the green fields would mean exploiting the current and post-COVID-19 recovery instruments including the Next Generation EU recovery fund to devote massive resources to R&D and innovation in areas of greater scientific and technological opportunities such as green focal domains. This would require the adoption of specific green-related mission-oriented policies based on a systemic public policy toolkit that draws on frontier knowledge to attain the climate neutrality goals by contextually acquiring “technological control” over this area.
Indeed, mission-oriented innovation policies often contribute to the improvement in national competitiveness, since they are ambitious and cross-disciplinary in tackling societal and/or technological challenges [25]. Given that such policies focus on radical innovations to achieve goals of national importance (e.g., defense, infrastructure, and energy security), they create new markets and expand institutional actors of national innovation systems [26].
Seen through this lens, the EU climate strategy and technological sovereignty objectives are supposed to go hand in hand to maximize both sustainable and growth opportunities from the transformation of the economy. Therefore, the key question to be asked is whether, given the current technological state-of-the-art of Europe in the green domain, the 2050 carbon neutrality target is, as of today, compatible with the EU’s existing technological capabilities (i.e., the current level of technological sovereignty in the green area) or, on the contrary, the achievement of the EU sustainable transition could led to beneficial environmental effects at the risk of triggering structural dependencies on external players, unless specific mission-oriented policies are launched.
From this point of view, assessing the current level of depth of technological sovereignty held by EU members in the green area is of paramount importance to better evaluate the potential trade-off between the make/buy options as well as to estimate the current and the desirable level of technological sovereignty to be held in environmental technologies including their costs in terms of investments, time needed, and possible efficiency losses.
To this end, our contribution aims at analyzing the technological position of the EU and other world leading countries with respect to climate change mitigation technologies (CMMTs) over the last three decades. In particular, this study is based on the analysis of patent trends, shares, and patent-related indicators in CMMTs for the period 1990–2016. Indeed, being focused on the result of the innovative process [27,28], patent data provide a wealth of information on the local presence (absence) of the scientific-technological competences needed to produce knowledge with a certain degree of autonomy, thus retrieving relevant insights with respect to the degree (lack) of technological sovereignty held by countries in a given area. Nevertheless, by reflecting the implementation of radical solutions in the field of technology, environmental-related patent data can be considered as the best proxy of a country’s potential to achieve a low-emission economy through its internal knowledge resources.
The reminder of the paper is structured as follows. Section 2 describes the original database on eco-innovation built on patent data and the synthetic indexes elaborated for the analysis; Section 3 presents the main trends and evolution of CCMTs for the EU and other key players; Section 4 discusses the main relevant issues emerging from the statistical investigation that might inform the policy discourse; and Section 5 summarizes the main challenges the sustainable transition process would face in the next decades and suggests some insights for the development of an optimal policy mix design.
2. Materials and Methods
In this section, we propose a methodology based on the use of patent data to define a country’s positioning in terms of technological capabilities in clean energy areas.
The dataset used for the present exercise draws information from the OECD-REGPAT database. To provide a better comparison across countries, the analysis is restricted to the most relevant patents, in other words, triadic patent families (TPFs) registered over time by the most important patent offices in the world: the United States Patent and Trademark Office (USPTO), the European Patent Office (EPO), and the Japanese Patent Office (JPO).
The tagging system for green patents follows the 4-digit Y02-Y04S classification scheme for CMMTs developed by the EPO [29]. By covering nine main categories—from energy, buildings, greenhouse gases (GHG) capture, Information & Communication Technologies (ICT), energy, transport and waste and wastewater management to smart grids—this classification provides a comprehensive overview of the technologies that, due to their technical attributes, can be referred to in the energy saving and decarbonization goals (Table 1).
The analysis was carried out on two distinct datasets that provide complementary information. The first was built by assigning the CMMT flag to any patent family (identified by a univocal id_family number) labeled with at least one of the nine CMMT subclasses. Then, in order to measure the inventive capacity of a country in decarbonization and clean energy areas, we applied the fractional counting to assign the patent application according to the inventor’s place of residence. By following this criterion, if one application has more than one inventor, the application is divided equally among all of them and subsequently among their country (fractional counting), thus avoiding double counting. In the second dataset, the fractional counting was maintained, but the statistical unit was replaced by the specific CMMT subclass to which the TPF belongs. This implies that triadic patents with more than one CCMT subclass are double counted, with the final data representing the number of TPF applications filled by a country c in a given CMMT subclass in years. To ensure high data quality, we focused on the timeframe 1990–2016, thus dropping the last three-year period 2017–2019 as we detected a large decrease in patent applications due to time lags between the patent application and granting processes. This is mainly explained by the temporal gap in transforming the applied patent into published documents in OECD patent databases [30]. Finally, to further increase data reliability, we used a five-year moving average to compute yearly patent values.
To measure the actual “success” of country c in CCMTs, we built a set of indicators based on shares and growth rates related to patents. Therefore, we enriched the analysis with specialization and rarity indexes in order to provide complementary information with respect to the level of technological sovereignty possessed by countries in this domain. On one hand, the specialization index indicates whether a country concentrates in a specific domain with a larger share of its average innovation compared to the world average (or any other regional aggregate). On the other hand, building on the idea that technological sovereignty does not imply the need to achieve complete autonomy in a given domain but rather the ability to acquire and use technological knowledge developed elsewhere through reliable partnerships, thus avoiding unilateral dependencies [21], the rarity index provides a useful complementary measure as it is related to the number of countries specialized in it. It follows that the rarer a technology, the fewer the countries from which knowledge can be acquired, and hence the greater the risk of unilateral structural dependencies [20].
Following Hidalgo and Hausmann [31], the starting point of our analysis consists of calculating the revealed technology advantage indicator (RTA) using patent data [32]. In general, the RTA indicates whether country c = 1, …, C is specialized in a given technology t based on the comparison between the relative frequency of patenting in a given technology t in country c, with the relative frequency of patenting in the same technology t at the world level (Equation (1)). More specifically, the RTA was here computed on the CCMT patents filed in each country during 2000–2016. Therefore, RTA can be obtained as follows:
where
is the number of triadic patent families of country c in technology t; is the number of countries; and is the number of technological fields. Thus, it follows that represents a threshold of specialization: when , the country is said to be specialized in the generation of technology and vice versa (Equation (2)):
Once is measured and transformed into a dichotomic specification (1, 0), it is possible to calculate the rarity index , which is equal to the ratio of the number of countries with in CCMT domains to the total number of countries C (Equation (3)):
As far as the is typically conceived, it could be considered as one of the potential observable outcomes stemming from a country’s technological specialization pattern. Technological specialization is a process sustained, among other key enabling factors, by specific mission-oriented policy programs explicitly aimed at mastering knowledge in a given strategic field through the convergence of resources and capabilities in that direction. To put it differently, the , and to a greater extent, its dynamics over time, suggests whether or not a country is pursuing a specialization strategy in fields deemed particularly strategic, as in the case of CCMTS technologies. However, to avoid any potential bias related to the incomparability of the index on both sides of unity (given that more weight is assigned to values above 1 compared to observations below 1 when the standard is applied to quantitative analysis application), we transformed the index into a symmetrical adjusted version. According to [33], the scale of relative specialization is normalized from −100 to +100 based on a hyperbolic tangent function (Equation (4)):
where = patent applications, c = country, t = technology field. Based on this formula, a country c is said to be specialized in technology t when .
3. Results
3.1. Patent Dynamics in the CCMT: An Overview
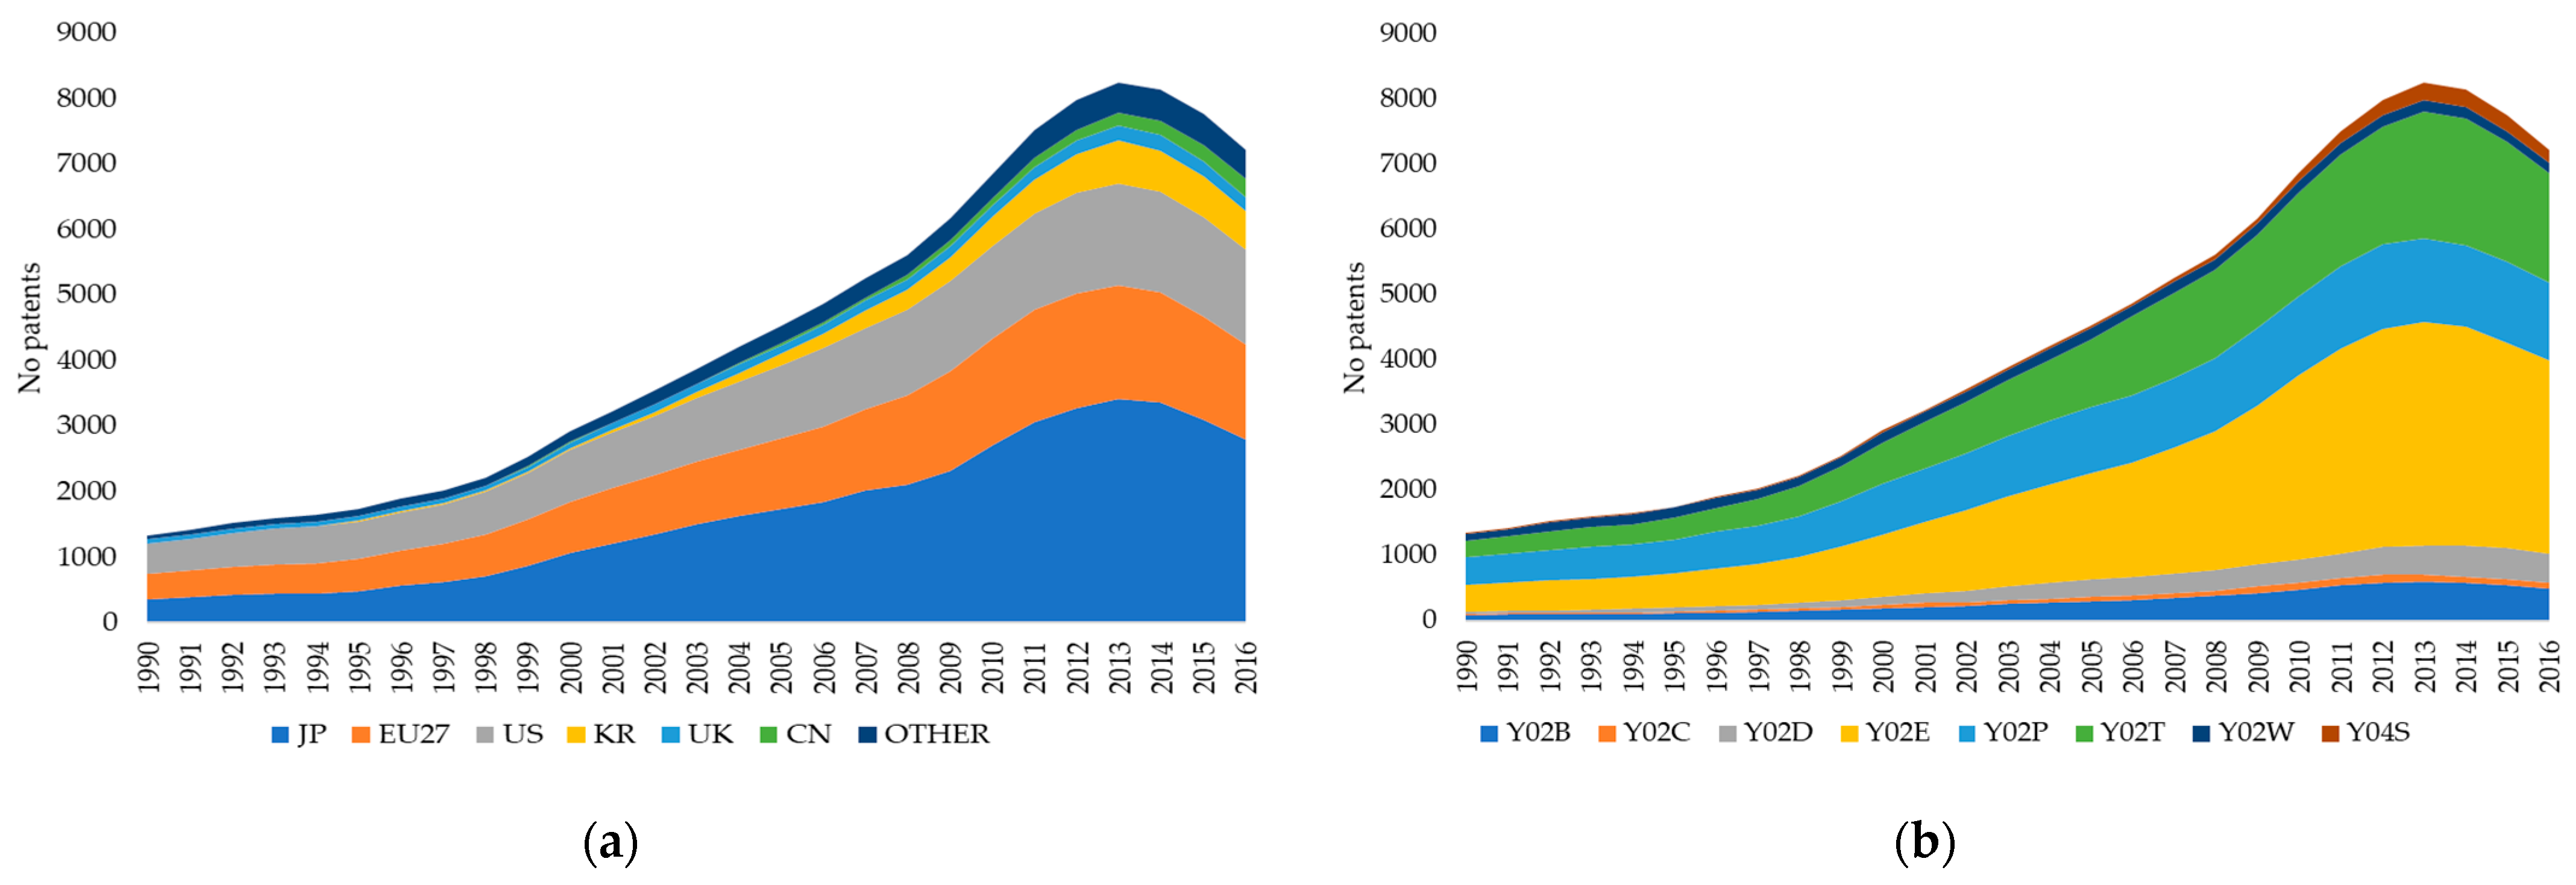
As a starting point of the analysis, we describe the main trends of CCMT-TPFs over the last three decades distributed by the leading top inventors on the basis of world shares (Japan, USA, EU, South Korea, UK, and China) (Figure 1a) and by CMMT subclasses (Figure 1b). Although the temporal setting refers to a period where the UK was a member of the EU, we considered only the EU with 27 members, since the analysis was developed to address the features of the EU technological trajectory in CCMTs to provide elements for the future design of the climate neutrality package that will involve the 27 EU states. In line with other patent-based studies [34,35,36], it showed an increasing trend until 2010, which results from stringent environmental regulations [37,38] and successful technology policies, jointly implemented both on the supply and demand-side [39,40,41], along with a growing environmental awareness in civil society. However, similar to other contributions on this topic [42,43], we also recognize a downward trend after 2011. Following Urbaniec et al. [36], this could be due a to a combination of factors such as the financial crisis, the oversupply of some innovative energy equipment due to mass production in China, the reduction in investing incentives (as happened in Germany for subsidies for renewables), and the growing implementation of less innovative environmental practices caused by the increasing level of environmental pressure. Hence, this first evidence suggests that the ambitious environmental targets set by the EU are not coupled by a contemporaneous growth of CCMT related innovations, that, as already stated, represents a necessary condition to reduce the economic burden of climate change related policies.
Considering patent dynamics across countries, Japan appears by far the dominant player in the domain under scrutiny. According to Fujii and Managi [44], the Japanese supremacy in green technologies involves different causes including the new business opportunities created by the Kyoto Protocol in 2005; the efficiency improvement in patent applications due to changes in national rules governing patents (i.e., Japanese Bayh–Dole Act and the National University Corporation Act in 2003 for strengthening business–academic collaborations); and national eco-friendly policies (granted subsidies for hybrid and electric cars) as part of the emergency economic measures undertaken in response to the 2008 recession.
In the second and third positions, we observed that the EU and the U.S. had average quotas of 25% and 14%, respectively. As sustained by Waltz et al. [35], compared to the “South” of the world, both EU members and the U.S share better framework conditions for innovation as well as common ground for environmental policies and related externalities. Furthermore, Quitzow et al. [45] argue that, as environmental quality is a superior economic good with high income elasticity of demand, in high income countries such as the EU and the U.S., lead users for sustainability innovations would be typically found.
South Korea and China are in fourth and sixth places, respectively, with the UK in between. More in general, the increase in patents registered by the two Asiatic powers has been noticeable in many technological areas [46], as driven by a successful pattern of economic development built on competitive advance, export, and innovation [36]. For these reasons, both the CNIPA (Intellectual Property Administration of the People’s Republic of China) and KIPO (Korean Intellectual Property Office) have been included among the largest patent offices (together with USPO, JPO, and EPO), recording an increase in applications from 17% to 43.4% during 2009–2019 [46]. According to Lema et al. [40] and Corrocher et al. [41], the process of growth in green patenting activity in the most successful latecomer countries such as China and South Korea is the result of a catch-up process enabled by mission-oriented policy actions targeted at stimulating technological opportunities (policies for the development of local technological capabilities together with the implementation of regulation and other policies) together with increasing the domestic firms’ capability building, R&D investment, and new modes of knowledge transfer. Furthermore, with specific regard to the Chinese case, new green technological opportunities have been opened up by the acquisition of companies in countries that are leaders in this field [47,48].
CMMTs are not a homogeneous technological domain but a constellation of different technological sectors with differentiated technological pace over time and different degree of strategic relevance. By disentangling the CMMTs across three-digit Y02–Y04 subclasses (Figure 1b), we observed several differences among the various technology domains. Patents for decarbonization technologies applied in the energy (Y02E), transport (Y02T), and construction (Y02B) sectors are dominant during the whole period. Such evidence in rather obvious as, traditionally, the key targets of environmental policies worldwide have been represented by the most polluting industries characterized by energy and row material intensive production processes. However, new green technological patterns are emerging. For example, the systematic growth found for technologies related to environmentally-friendly ICT technologies (Y02D class) in the years 1993–2016 demonstrates the increasing pervasiveness of the digital paradigm in all areas of the technological progress. Moreover, a similar argument may explain the sharp increase in Y04S (smart grids) patent applications, whose importance has emerged since 2008 [49]. These frontier technologies make use of new digital communication, for instance, artificial intelligence (AI), to create intelligent (efficient) energy systems. Thanks to the analysis of big data trend collected for weather, energy demand, generation assets, cheapest cost, and highest efficiency of energy sources, Y04S-related applications have a great potential to directly contribute to the achievement of decarbonization and sustainable targets.
3.2. Country Specialization in CCMTs
Narrowing the analysis to the period 2000–2016 and focusing on the top-10 countries to have emerged over the last years (2010–2016), several differences appear over time and across technologies. Considering the whole Y02–Y04S area, we recognize the good positioning of the EU countries that ranked second as an aggregate, below Japan and behind the U.S. However, the EU technological performance worsens over time, moving from a share of around 25% in 2000–2009 to a share of 21.4% in 2010–2016. In the last period, EU countries have increased their presence only in the Y02W domain, a more traditional technology field related to water and waste management, while their shares have decreased in the remaining sectors.
More importantly, the greatest weakness of EU countries was in those classes at the technological frontier such as Y02D (with an average share of 9.3%) and Y04S (with an average share of 11%), representing technologies based on the use of digital devices to achieve better environmental performance. Technological supremacy over the highly strategic Y02D class was held by the U.S., which filled about 40% of patents in this domain. At some distance, the U.S. were followed by Japan (25%) and China, which showed a share of 9.6% from an initial value of 1.5% registered in the previous period. The Y04S class was dominated by Japan, where about 50% of the inventions made in this technology sector were generated. Overall, we observed a polarizing trend in favor of Japan, which reinforces its leadership in most green technologies, while the U.S. increased its relevance only in another strategic sub-domain (Y02D). Finally, South Korea and China showed the best performance in terms of dynamics, increasing their shares in all nine CMMT areas.
Similar conclusions could be made by observing, for the same countries and periods, the referring to both total CCMT patents and subdomains. As shown in Table 2, within countries ranked according to their 2010–2016 values, the strongest specialization was found for South Korea ( 23.3), which outperformed Japan and France with values of 7.5 and 7, respectively. South Korea’s superior green specialization pattern, which is particularly notable in the Y02E sub-domain, could be explained by the growing market demand for energy-saving innovations, driven by the long-term policy strategy (2009–2050 Strategy for Green Growth) together with green finance mechanisms [48]. Japan has a strong specialization in the frontier domain of smart grids (Y04S) where it recorded a by 35.2, while France showed the best in more traditional areas such as transport and water/waste management, with values slightly below 40. The remaining countries displayed negative specializations with some exceptions among the CCMT subclasses. On average, the for total CCMT patents of EU members worsened to −7.3 from a previous value of −0.9. Although the EU preserves a specialization advantage in many subdomains (Y02B; Y02C; Y02P; Y02W), its specialization appeared particularly weak in the more advanced and strategic fields such as Y04D and Y04S. In particular, with regard to the Y04D class, we recognized a strong specialization advantage for both the U.S. and China, suggesting that the technological positioning of the two economies in the environmental area is concentrated in fields on the technological frontier.
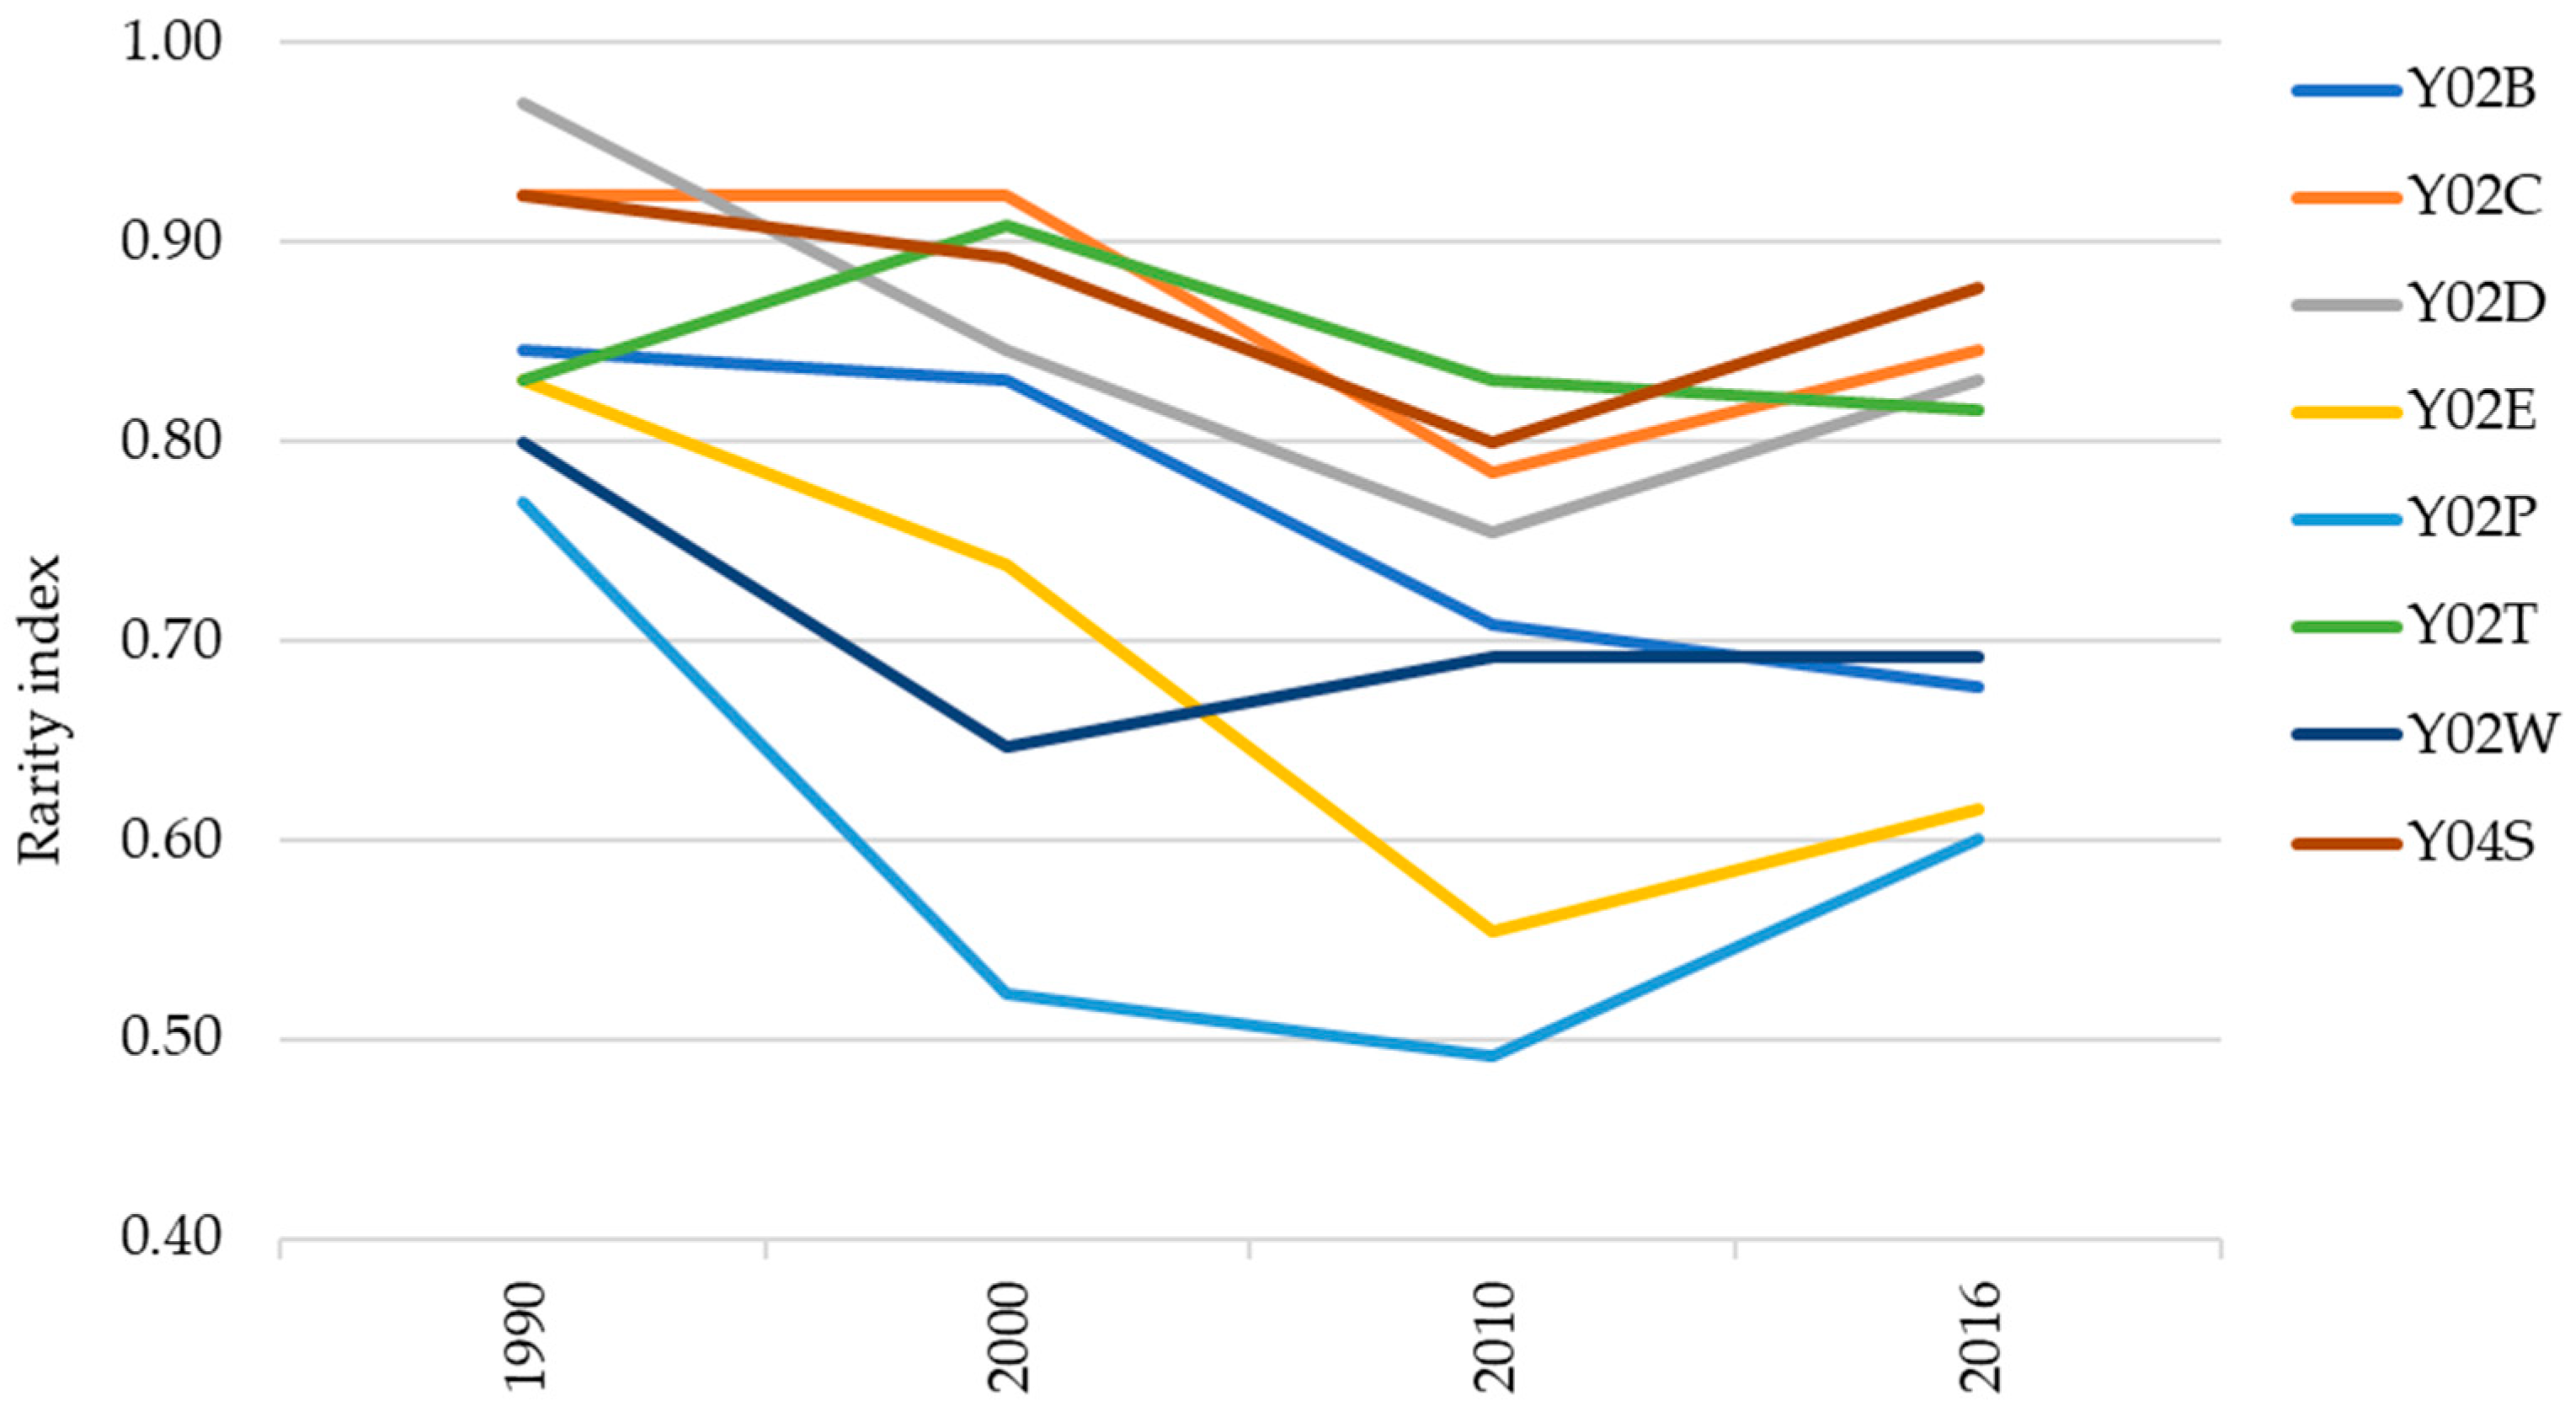
The relevance of classes Y02D and Y04S from the perspective of technological sovereignty can also be inferred by observing the dynamics over time of the rarity index (for specific CCMT technologies (Table 3). In general, environmental technologies appeared less rare than the average (black dashed line), suggesting that the number of countries with a specialization advantage in these knowledge areas is higher than that recorded for other technologies.
As already pointed out to explain the increasing trend observed for CCMT patent applications, this diffusion process in terms of specialization advantages can be seen as the result of international policy efforts and growing ecological awareness worldwide. However, for the majority of CCMTs, we observed a slight increase in during the last years. The significant reduction in the number of countries specialized in environmental-related inventions could reasonably be attributed to the general decline in green patenting trends after 2011, caused by the aftermath of the 2008 crisis and the faster diffusion of less innovative environmentally-friendly solutions. Furthermore, the nine green technologies can be divided into groups characterized by low-rarity and high- rarity degree (Figure 2).
Unsurprisingly, the first group embraced the more traditional technologies such as those related to water/waste management (Y02W), buildings (Y02B), energy generation, transmission or distribution (Y02E), and industry (Y02P). Conversely, among the rarer environmental technologies, we found both smart grids (Y04S) and digital technologies (Y02D) together with transport related (Y02T) green patents and those applied for capturing and storing greenhouse gases (Y02C).
3.3. Climate Change Related Technologies in EU Countries
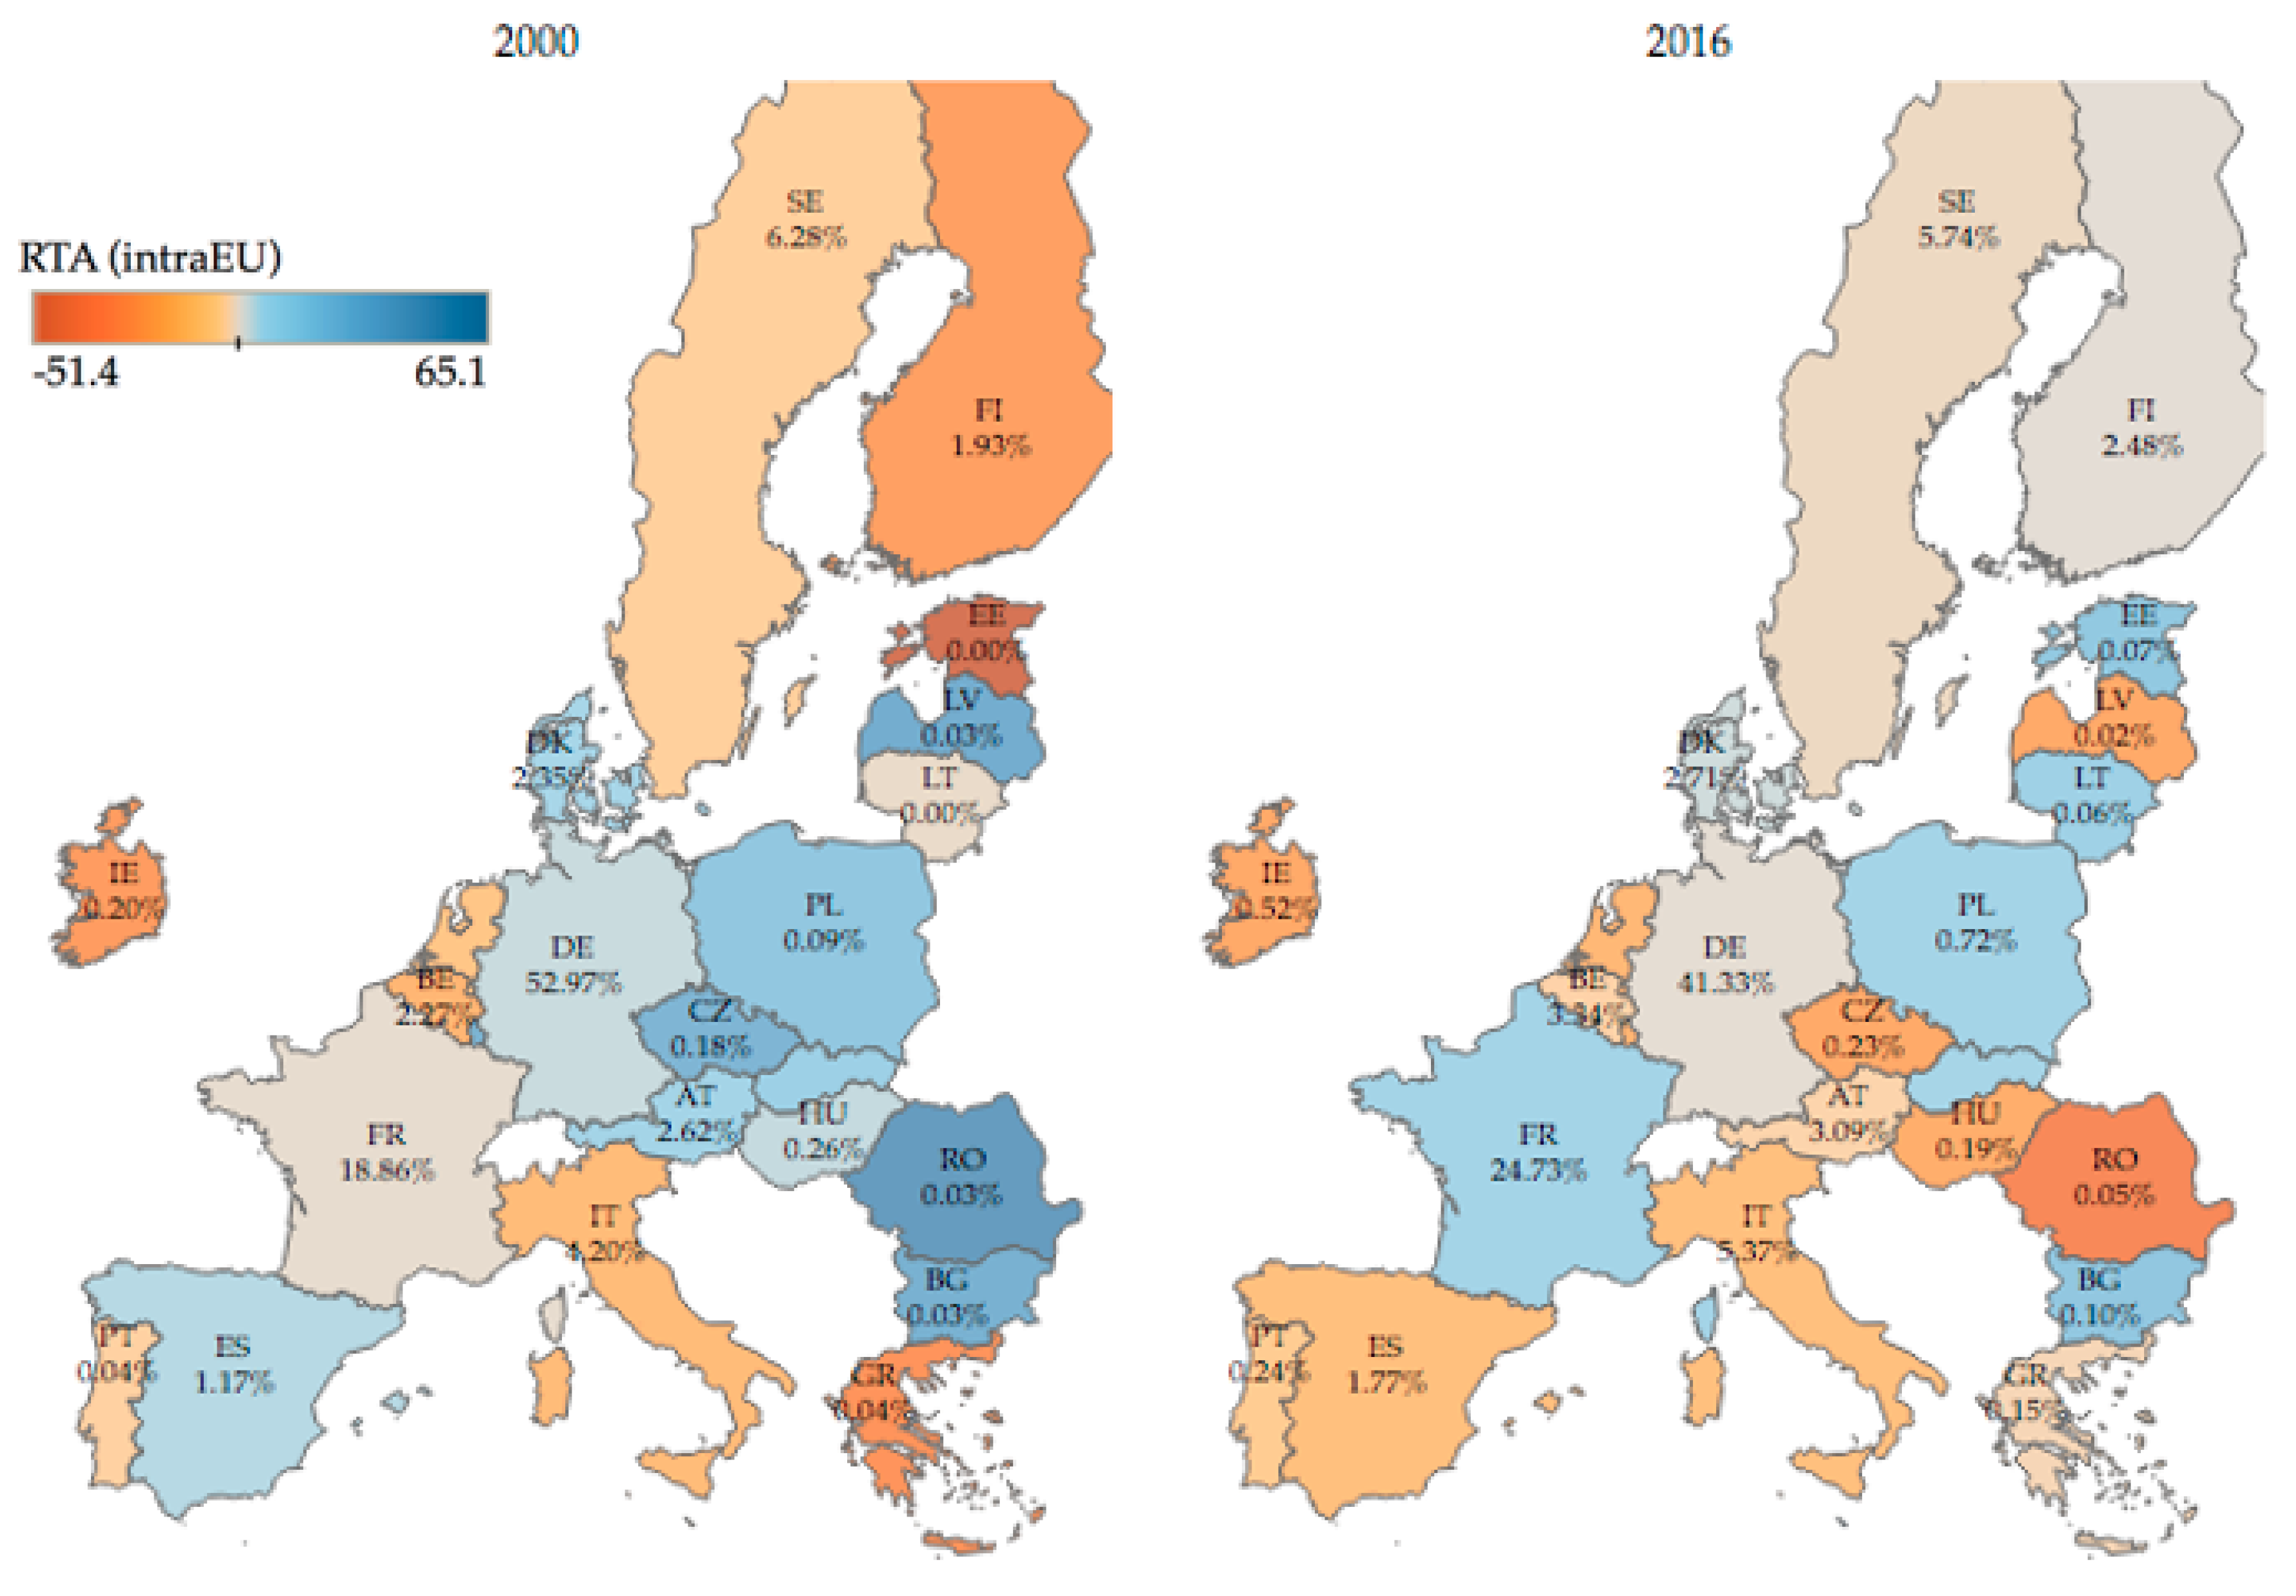
Focusing on the evolution of CCMT-TPFs within the EU countries over the last three decades (Figure 3), significant differences can be detected across countries and years both in absolute shares and (here calculated with the EU used as the reference territorial aggregate). With respect to the latter, a pattern of de-specialization emerged in Spain, Germany, the Scandinavian area (Denmark, Sweden, Finland) and, to a greater extent, in Eastern Europe, except for Poland, Slovakia, and Bulgaria. France was the only country to maintain a specialization advantage over the considered time span, with a positive value of in both 2000 and 2016. In contrast, Italy and Portugal preserved a negative , as in the case of northern countries such as Ireland, the Netherlands, and Belgium. In terms of patent shares calculated intra-EU, Germany showed the most significant variation, decreasing its share from 53% in 2000 to 41% in 2016. Actually, after 2011, Germany experienced a significant cut in public support directed to the renewable energy sector, with a progressive reduction, especially in market-based incentives such as the feed-in-tariff scheme for solar and wind energy [50]. At the same time, for the remaining EU countries, we detected a generalized increasing trend, which is particularly relevant for France, which during 2000–2016, increased its quota by 6p.p. from an initial value of 18.9%. The third player in 2016 was Sweden with an average share of 5% (4.2% in 1990, 6.3% in 2000 and 5.8% in 2016), followed by Italy with similar quotas.
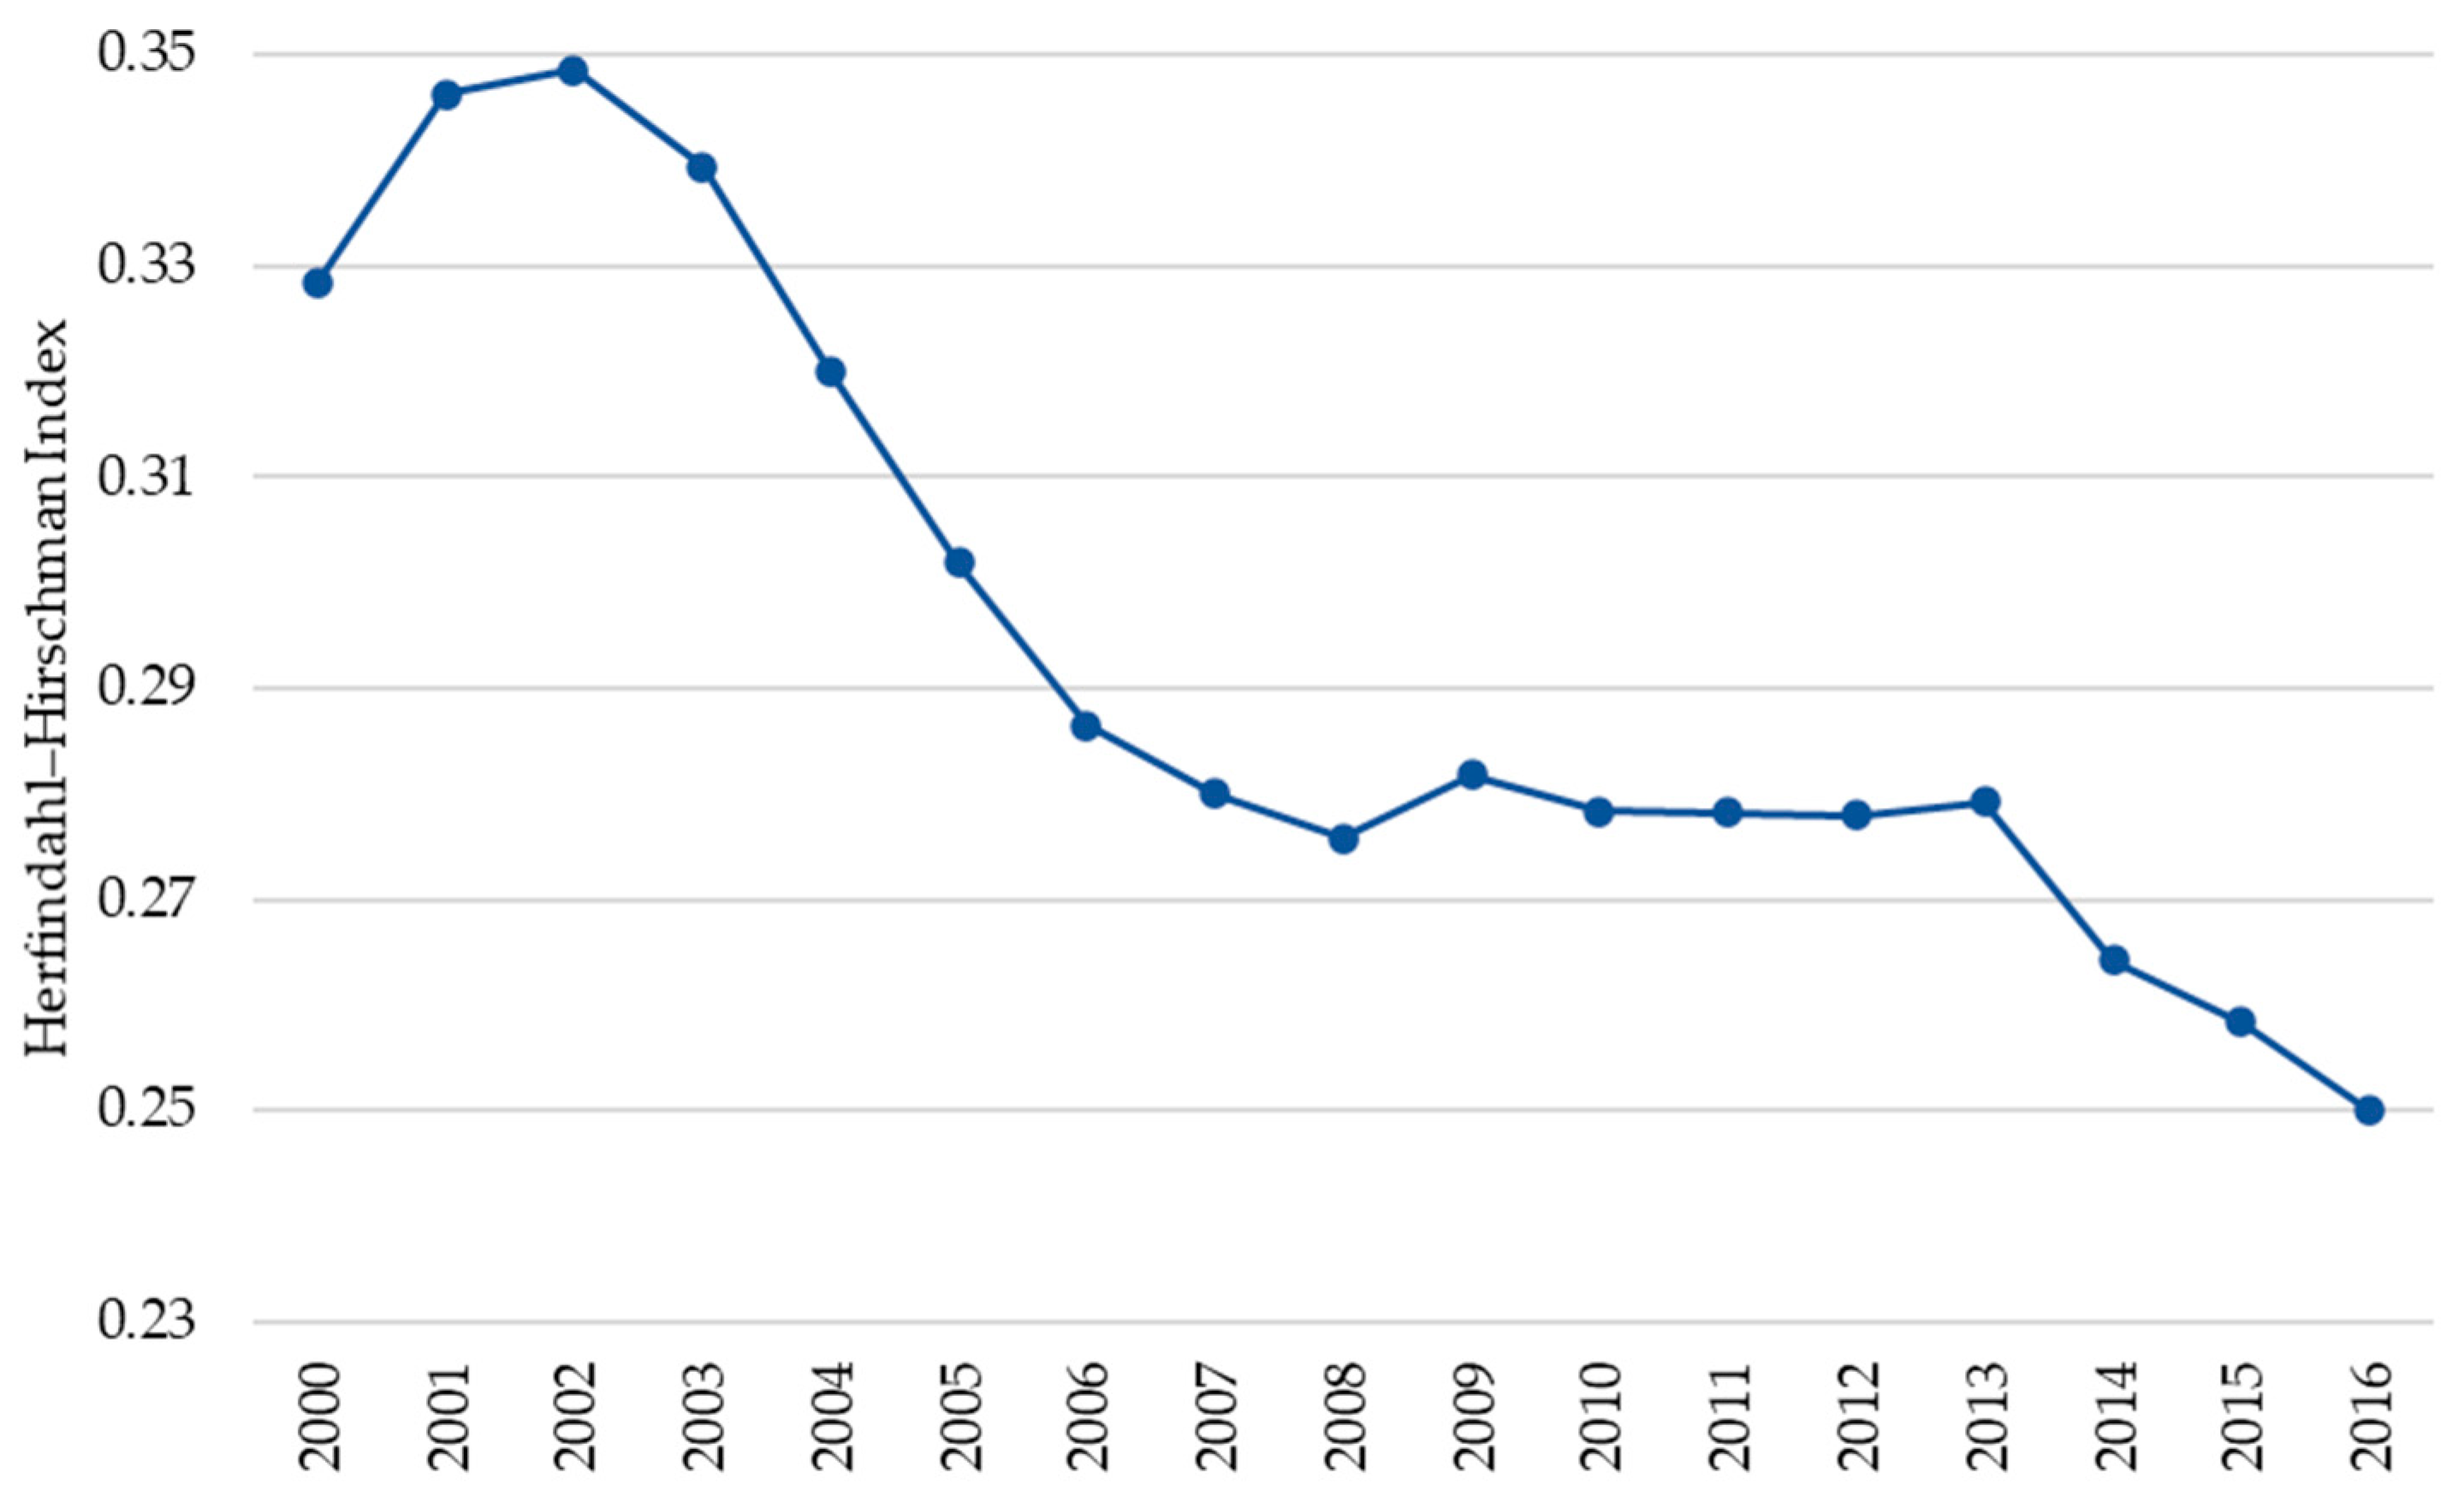
Finally, to better measure the market concentration of CCMT-TPFs at the EU level, we relied on the Herfindahl–Hirschman Index (HHI), which is calculated by squaring the market share of each country and then summing up the resulting numbers. As shown in Figure 4, which reports the HHI values, the market concentration in this patenting area decreased from around 0.33 in 2000 to 0.25 in 2016. Such a reduction in the HHI could result from a cross-national policy convergence in environmental protection [51], enabled by international legal agreements that shaped national environmental policy plans, along with more diffused practices due to cross-national imitation, emulation, and learning processes [52].
4. Discussion
In the global effort to fight climate change, the EU is at the forefront. The aim to become the world’s first climate-neutral continent by 2050 is at the core of a comprehensive package of policy measures formed by the EGD and the recent Fit for 55. The climate goals represent the potential final outcome of a successful decarbonization pattern based on the development and deployment of energy-efficient, renewable, and low-carbon technologies. Accordingly, technological progress is the very engine of the European green transition. Indeed, the ability of EU countries to master technology in this direction is of paramount importance in leading the green transformation without depending on foreign partners. Furthermore, at a time of increasing geopolitical tensions and fierce global competition, having a strong technological base for developing, deploying, and using climate change mitigation technologies would represent a concrete opportunity for the EU to increase its strategical autonomy as a global economic power. In other words, ambitious environmental targets should be necessarily coupled by mission-oriented technology policies aiming at EU technological leadership in key CCMTs in order to avoid the risk of being trapped into technological structural dependences with third parties.
Based on our analysis, two main results deserve attention. First, at the global level, the pace of the generation of new green technologies as measured by patent data has slowed down in recent years. This could be explained by the existence of strict linkages between diversification patterns and existing competences. Indeed, according to Perruchas et al. [53], countries move along cumulative paths of specialization, and toward more mature green technologies. This trend, if not inverted, casts some doubts on the economic sustainability of the ambitious EU environmental targets. Second, the current EU technological positioning with respect to green domains appears to be problematic in terms of technological sovereignty, with serious risks of potential technological dependences from other countries.
In more detail, the EU shows a good ranking, being in second place for CCMT inventions filed during the last three decades. However, the dynamics over time suggests a declining trend in this area, with a significant reduction in shares. This is particularly relevant in the domains related to digital, ICT (Y02D), and smart grids (Y04S), which are considered as highly strategic in enabling speed and scale in achieving the EU’s decarbonization goals, thus paving the way for the EU’s “twin transition” to climate neutrality and digital leadership.
The majority of CCMT patents were applied by Japan, which in the Y04S sub-domain reached a 40% share combined with a high specialization advantage (35.2), as measured by the RTA index. The exception is the Y02D class, where the U.S. is particularly strong both in terms of quota (39.7) and specialization (79.3). In addition, we observed that the green technology arena is being reshaped by the emergence of lagging economies such as China and South Korea, which during 2010–2016 covered together about 10% of CCMT patent applications. Fueled by strong innovation-oriented policy support aimed at strengthening the whole technological environment, the increase in green patents showed by China and South Korea demonstrates that enhancing and exploiting national knowledge capabilities through policy leverage is essential to take an active role in the sustainable transition process.
Returning to the old continent, the EU is also losing ground in terms of specialization, with a share of CCMT patents on total patents that is lower than the world average, suggesting that the mission-oriented policies planned by the EU in recent years have missed the goal of concentrating innovation efforts in this area while, at the same time, past climate and energy policies have been too weak under the technology-push lever. European de-specialization was greatest in the most strategic sub-domains, namely Y02D and Y04S, which, as expected, turned out to be the rarest technologies. This has important implications in terms of technological sovereignty, as the rarity of a technology increases the risk for EU states to be structurally dependent on a few countries specializing in it. Our analysis showed that in the specific case of Y02D, with the exclusion of the U.S., the best specialization pattern was found for China (41.5): two countries on which the EU is already highly dependent for the supply of digital technologies in general [20].
Within European borders, we observed a generalized trend toward de-specialization combined with a spread of related patents, as confirmed by the dynamics of the HHI during 2000–2016. These results provide evidence of a pattern of convergence at the European level regarding the diffusion of green-related technological capabilities, a process mostly enabled by past R&D policy interventions, which appear to be successful in this respect. However, the increasing de-specialization found for CCMTs shows that Europe is still far from establishing a successful technological specialization in the green area, probably due to the lack of effective mission-oriented policy actions taken in this direction. Moreover, despite this, the massive production of green patents at the European level is mainly based in Germany and France and, to a lesser extent, in Sweden and Italy. This implies that the remaining EU members still play a rather marginal role as green innovators and further efforts in exploiting complementary skills and knowledge developed in other technological domains are required to close the gap in regional convergence [54].
The present analytical setting, despite its strength in transforming complex information into simple descriptive tools, presents a strong limitation in exploring linkages across complementary technological domains given the low degree of detail in the definition of patent families. An additional work to be developed as a future research agenda will be an in-depth analysis of cross-fertilization of inventions working with raw information on patent data.
5. Conclusions
We propose a simple analytical tool to describe the technological position of the EU and other world leading countries with respect to climate change mitigation technologies (CMMTs) over the last three decades. In particular, this study was based on the analysis of patent trends, shares, and patent-related indicators in CMMTs for the period 1990–2016. Based on our analysis, two main results appear to be relevant. First, the pace of the generation of new green technologies, as measured by patent data, has slowed down in recent years at the global level, revealing a mismatch with the urgent requirements of a rapid and radical shift in the socio-technical systems to enhance the sustainable transition. Second, the current EU technological performance in CMMTs appears to not be fully satisfactory, thus raising issues in terms of technological sovereignty, with potential technological dependences from other countries.
While the ambitious EU climate strategy represents a great opportunity for the European countries to change the development pattern, this would require additional resources to be invested for exploiting synergies and complementarities between policy actions aimed at replacing fossil fuels with cleaner alternatives. The future strategic design on the EU recovery actions should go hand in hand with the climate strategy in order to better support EU countries to compete at the technology frontier while enhancing the convergence process within European borders. In this respect, appropriate mission-oriented technology policies are required to ensure, at the same time, the meeting of ambitious environmental targets and technological independence with respect to key technologies.
Author Contributions
Conceptualization, V.C. and F.C.; Methodology, S.C., V.C. and F.C.; Software, S.C.; Validation, S.C., V.C. and F.C.; Formal analysis, S.C.; Investigation, S.C., V.C. and F.C.; Resources, V.C. and F.C.; Data curation, S.C.; Writing—original draft preparation, S.C., V.C. and F.C.; Writing—review and editing, S.C., V.C. and F.C.; Visualization, S.C., V.C. and F.C.; Funding acquisition, V.C. and F.C. All authors have read and agreed to the published version of the manuscript.
Funding
This research was funded by the Italian Ministry of University and Research (MIUR), Scientific Research Program of National Relevance PRIN2017 project “Innovation for global challenges in a connected world: the role of local resources and socioeconomic conditions”. The support of Centro Economia Digitale is also gratefully acknowledged.
Institutional Review Board Statement
Not applicable.
Informed Consent Statement
Not applicable.
Data Availability Statement
Data for patents in environmental technologies are covered by copyright and can be used only by PATSTAT subscribers.
Acknowledgments
Comments, discussions, and suggestions from several persons enriched the current development of the research.
Conflicts of Interest
The authors declare no conflict of interest.
References
- IEA (International Energy Agency). World Energy Outlook 2020; IEA: Paris, France, 2020. [Google Scholar]
- Dellink, R.; Chateau, J.; Lanzi, E.; Magné, B. Long-term economic growth projections in the Shared Socioeconomic Pathways. Glob. Environ. Chang. 2017, 42, 200–214. [Google Scholar] [CrossRef]
- EC (European Commission) Communication from the Commission. The European Green Deal. COM (2019)640 2020; European Commission: Bruxelles, Belgium, 2020. [Google Scholar]
- EC (European Commission) Communication from the Commission. Fit for 55: Delivering the EU’s 2030 Climate Target on the Way to Climate Neutrality. COM (2021)550Final 2021; European Commission: Bruxelles, Belgium, 2021. [Google Scholar]
- Rogge, K.S.; Reichardt, K. Policy mixes for sustainability transitions: An extended concept and framework for analysis. Res. Policy 2016, 45, 1620–1635. [Google Scholar] [CrossRef]
- Crespi, F.; Mazzanti, M.; Managi, S. Green growth, eco-innovation and sustainable transitions. Environ. Econ. Policy Stud. 2016, 18, 137–141. [Google Scholar] [CrossRef] [Green Version]
- Bassi, A.M.; Costantini, V.; Paglialunga, E. Modelling the European Union Sustainability Transition: A Soft-Linking Approach. Sustainability 2021, 13, 6303. [Google Scholar] [CrossRef]
- Keramidas, K.; Diaz Vazquez, A.; Weitzel, M.; Vandyck, T.; Tamba, M.; Tchung-Ming, S.; Soria-Ramirez, A.; Krause, J.; Van Dingenen, R.; Chai, Q.; et al. Global Energy and Climate Outlook 2019: Electrification for the Low-Carbon Transition; JRC119619; Institute for Energy and Transport: Seville, Spain, 2020. [Google Scholar] [CrossRef]
- Tagliapietra, S.; Zachmann, G.; Edenhofer, O.; Glachant, J.M.; Linares, P.; Loeschel, A. The European union energy transition: Key priorities for the next five years. Energy Policy 2019, 132, 950–954. [Google Scholar] [CrossRef] [Green Version]
- Costantini, V.; Crespi, F.; Palma, A. Characterizing the policy mix and its impact on eco-innovation: A patent analysis of energy-efficient technologies. Res. Policy 2017, 46, 799–819. [Google Scholar] [CrossRef]
- Hoppmann, J.; Peters, M.; Schneider, M.; Hoffmann, V.H. The two faces of market support—How deployment policies affect technological exploration and exploitation in the solar photovoltaic industry. Res. Policy 2013, 42, 989–1003. [Google Scholar] [CrossRef]
- Costantini, V.; Crespi, F.; Martini, C.; Pennacchio, L. Demand-pull and technology-push public support for eco-innovation: The case of the biofuels sector. Res. Policy 2015, 44, 577–595. [Google Scholar] [CrossRef]
- Kallis, G.; Kostakis, V.; Lange, S.; Muraca, B.; Paulson, S.; Schmelzer, M. Research on degrowth. Annu. Rev. Environ. Resour. 2018, 43, 291–316. [Google Scholar] [CrossRef] [Green Version]
- Speck, S.; Zoboli, R.; Paleari, S.; Marin, G.; Mazzanti, M.; Bassi, A. The Sustainability Transition in Europe in an Age of Demographic and Technological Change. Environmnetal European Agency (EEA) Report No 23/2019. Available online: https://www.eea.europa.eu/publications/sustainability-transition-in-europe (accessed on 21 June 2021).
- Elkerbout, M.; Egenhofer, C.; Núñez Ferrer, J.; Catuti, M.; Kustova, I.; Rizos, V. The European Green Deal after Corona: Implications for EU Climate Policy. CEPS Policy Insights 2020, 1–12. Available online: https://www.sipotra.it/wp-content/uploads/2020/04/The-European-Green-Deal-after-Corona-Implications-for-EU-climate-policy.pdf (accessed on 18 June 2021).
- Sueyoshi, T.; Ryu, Y.; Yun, J.-Y. COVID-19 Response and Prospects of Clean/Sustainable Energy Transition in Industrial Nations: New Environmental Assessment. Energies 2021, 14, 1174. [Google Scholar] [CrossRef]
- Archibugi, D.; Filippetti, A.; Frenz, M. Investment in innovation for European recovery: A public policy priority. Sci. Public Policy 2020, 47, 92–102. [Google Scholar] [CrossRef]
- Archibugi, D.; Mariella, V. Is a European recovery possible without high-tech public corporations? Intereconomics 2021, 56, 160–166. [Google Scholar] [CrossRef] [PubMed]
- Crespi, F.; Caravella, S.; Menghini, M.; Salvatori, C. European Technological Sovereignty: An emerging framework for policy strategy. Intereconomics 2021, 6. in press. [Google Scholar]
- Cerra, R.; Crespi, F. Sovranità Tecnologica: Elementi per Una Strategia Italiana ed Europea; Centro Economia Digitale (CED): Rome, Italy, 2021; Available online: https://www.centroeconomiadigitale.com/wp-content/uploads/2021/03/CED-Sovranita-Tecnologica.pdf (accessed on 3 September 2021).
- Edler, J.; Blind, K.; Frietsch, R.; Kimpeler, S.; Kroll, H.; Lerch, C.; Reiss, T.; Roth, F.; Schubert, T.; Schuler, J.; et al. Technology Sovereignty: From Demand to Concept. Fraunhofer Institute for Systems and Innovation Research Policy Brief No. 02/2020. Available online: https://www.econstor.eu/bitstream/10419/233462/1/policy-brief-02-2020.pdf (accessed on 3 September 2021).
- Bauer, M.; Erixon, F. Europe’s Quest for Technology Sovereignty: Opportunities and Pitfalls. ECIPE Occasional Paper, No. 02/2020. Available online: https://cdn.ecipe.org/wp-content/uploads/2020/06/2020_05_26_Event-Technology-Sovereignty-1.pdf (accessed on 3 September 2021).
- Kelly, E.; Zubascu, F.; Naujokaityte, G.; Moran, N.; Pringle, D.; Wallace, N. What Is ‘Tech Sovereignty’? Science Business Publishing: Brussels, Belgium, 2020; Available online: https://sciencebusiness.net/system/files/reports/2020-TECH-1.pdf (accessed on 3 September 2021).
- EC (European Commission). Decision on European Innovation Council (EIC) Established by the European Commission, under the Horizon Europe Programme (2021-27) C(2021)1510 2021; European Commission: Bruxelles, Belgium, 2021. [Google Scholar]
- Mowery, D.C.; Nelson, R.R.; Martin, B.R. Technology policy and global warming: Why new policy models are needed (or why putting new wine in old bottles won’t work). Res. Policy 2010, 39, 1011–1023. [Google Scholar] [CrossRef]
- Mazzucato, M. From market fixing to market-creating: A new framework for innovation policy. Ind. Innov. 2016, 23, 140–156. [Google Scholar] [CrossRef]
- Albino, V.; Ardito, L.; Dangelico, R.M.; Petruzzelli, A.M. Understanding the development trends of low-carbon energy technologies: A patent analysis. Appl. Energy 2014, 135, 836–854. [Google Scholar] [CrossRef]
- Haščič, I.; Migotto, M. Measuring Environmental Innovation Using Patent Data; OECD: Paris, France, 2015. [Google Scholar] [CrossRef]
- Angelucci, S.; Hurtado-Albir, F.J.; Volpe, A. Supporting global initiatives on climate change: The EPO’s “Y02-Y04S” tagging scheme. World Pat. Inf. 2020, 54, S85–S92. [Google Scholar] [CrossRef]
- Dernis, H. Nowcasting Patent Indicators; Science and Technology Indicators, Working Paper 2007/3 Statistical Analysis of Science, Technology and Industry; OECD: Paris, France, 2007. [Google Scholar]
- Hidalgo, C.A.; Hausmann, R. The building blocks of economic complexity. Proc. Natl. Acad. Sci. USA 2009, 106, 10570–10575. [Google Scholar] [CrossRef] [Green Version]
- Antonelli, C.; Crespi, F.; Mongeau Ospina, C.A.; Scellato, G. Knowledge composition, Jacobs externalities and innovation performance in European regions. Reg. Stud. 2017, 51, 1708–1720. [Google Scholar] [CrossRef]
- Grupp, H. Foundations of the Economics of Innovation; Edward Elgar Publishing: Cheltenham, UK; Lyme, CN, USA, 1998. [Google Scholar]
- Karvonen, M.; Kapoor, R.; Uusitalo, A.; Ojanen, V. Technology competition in the internal combustion engine waste heat recovery: A patent landscape analysis. J. Clean. Prod. 2016, 112, 3735–3743. [Google Scholar] [CrossRef]
- Walz, R.; Pfaff, M.; Marscheider-Weidemann, F.; Glöser-Chahoud, S. Innovations for reaching the green sustainable development goals–where will they come from? Int. Econ. Econ. Policy 2017, 14, 449–480. [Google Scholar] [CrossRef]
- Urbaniec, M.; Tomala, J.; Martinez, S. Measurements and Trends in Technological Eco-Innovation: Evidence from Environment-Related Patents. Resources 2021, 10, 68. [Google Scholar] [CrossRef]
- Sterlacchini, A. Trends and determinants of energy innovations: Patents, environmental policies and oil prices. J. Econ. Policy Reform 2020, 23, 49–66. [Google Scholar] [CrossRef]
- Horbach, J.; Rammer, C.; Rennings, K. Determinants of eco-innovations by type of environmental impact—the role of regulatory push/pull, technology push and market pull. Ecol. Econ. 2012, 78, 112–122. [Google Scholar] [CrossRef] [Green Version]
- Mazzucato, M. Mission-oriented innovation policies: Challenges and opportunities. Ind. Corps. Chang. 2018, 27, 803–815. [Google Scholar] [CrossRef] [Green Version]
- Lema, R.; Fu, X.; Rabellotti, R. Green windows of opportunity: Latecomer development in the age of transformation toward sustainability. Ind. Corp. Chang. 2020, 29, 1193–1209. [Google Scholar] [CrossRef]
- Corrocher, N.; Malerba, F.; Morrison, A. Technological regimes, patent growth, and catching-up in green technologies. Ind. Corp. Chang. 2021, dtab025. [Google Scholar] [CrossRef]
- Dechezleprêtre, A. How to Reverse the Dangerous Decline in Low-Carbon Innovation. Conversation. 2016. Available online: https://theconversation.com/how-to-reverse-the-dangerous-decline-in-low-carbon-innovation-66944 (accessed on 3 September 2021).
- Cornwall, W. Clean Energy Patent Slump in US Stirs Concern. Science. 2017. Available online: https://www.sciencemag.org/news/2017/04/clean-energy-patent-slump-us-stirs-concern (accessed on 27 July 2021).
- Fujii, H.; Managi, S. Research and development strategy for environmental technology in Japan: A comparative study of the private and public sectors. Technol. Forecast. Soc. Chang. 2016, 112, 293–302. [Google Scholar] [CrossRef] [Green Version]
- Quitzow, R.; Walz, R.; Köhler, J.; Rennings, K. The concept of “lead markets” revisited: Contribution to environmental innovation theory. Environ. Innov. Soc. Transit. 2014, 10, 4–19. [Google Scholar] [CrossRef]
- WIPO. World Intellectual Property Indicators 2020; World Intellectual Property Organization: Geneva, Switzerland, 2020; Available online: https://www.wipo.int/edocs/pubdocs/en/wipo_pub_941_2020.pdf (accessed on 27 July 2021).
- Hansen, U.E.; Fold, N.; Hansen, T. Upgrading to lead firm position via international acquisition: Learning from the global biomass power plant industry. J. Econ. Geogr. 2016, 16, 131–153. [Google Scholar] [CrossRef]
- Tolliver, C.; Fujii, H.; Keeley, A.R.; Managi, S. Green innovation and finance in Asia. Asian Econ. Policy Rev. 2021, 16, 67–87. [Google Scholar] [CrossRef]
- Marku, E.; Zaitsava, M. Smart Grid Domain: Technology structure and innovation trends. Int. J. Econ. Bus. Manag. Res. 2018, 2, 390–440. [Google Scholar]
- OECD. Environmental Policy: Renewable Energy Feed-in Tariffs. OECD Environment Statistics (Database). 2021. Available online: https://0-doi-org.brum.beds.ac.uk/10.1787/f68de84b-en (accessed on 12 October 2021).
- Holzinger, K.; Knill, C.; Sommerer, T. Environmental policy convergence: The impact of international harmonization, transnational communication, and regulatory competition. Int. Organ. 2018, 62, 553–587. [Google Scholar] [CrossRef] [Green Version]
- Busch, P.O.; Jörgens, H. The international sources of policy convergence: Explaining the spread of environmental policy innovations. J. Eur. Public Policy 2005, 12, 860–884. [Google Scholar] [CrossRef]
- Perruchas, F.; Consoli, D.; Barbieri, N. Specialisation, diversification and the ladder of green technology development. Res. Policy 2020, 49, 103922. [Google Scholar] [CrossRef]
- Montresor, S.; Quatraro, F. Green technologies and Smart Specialisation Strategies: A European patent-based analysis of the intertwining of technological relatedness and key enabling technologies. Reg. Stud. 2020, 54, 1354–1365. [Google Scholar] [CrossRef] [Green Version]
Figure 1.
CCMT-TPF trends in absolute values (1990–2016; 5-year MA): (a) by country, (b) by patent class.
Figure 1.
CCMT-TPF trends in absolute values (1990–2016; 5-year MA): (a) by country, (b) by patent class.

Figure 2.
Rarity ( in CCMT-TPFs by CPC class (2000, 2010, 2016; 5-year MA).

Figure 3.
Shares (text) and RTA (color range) in CCMT-TPFs in Europe (2000 and 2016; 5-year MA).

Figure 4.
The HHI in CCMT-TPFs in Europe (2000–2016; 5-year moving average).


Table 1.
Climate change mitigation technology classes.
| CMMTs Subclasses | Description |
|---|---|
| Y02A—Adaptation to climate change | CMMT technologies that allow adapting to the adverse effects of climate change in human, industrial (including agriculture and livestock), and economic activities. |
| Y02B—Buildings | CMMT technologies related to buildings, e.g., housing, house appliances or related end-user applications. |
| Y02C—Capture and storage of GHG | CMMT technologies for capture, storage, sequestration or disposal of greenhouse gases (GHG) included nitrous oxide (N2O), methane (CH4), perfluorocarbons (PFC), hydrofluorocarbons (HFC), or sulfur hexafluoride (SF6). |
| Y02D—ICT | CMMT technologies in information and communication technologies (ICT), i.e., information and communication technologies aiming at the reduction in their own energy use. |
| Y02E—Energy | CMMT technologies related to energy generation, transmission, or distribution that allow reducing greenhouse gas (GHG) emissions. |
| Y02P—Industry and agriculture | CMMT technologies in the production or processing of goods in any kind of industrial processing or production activity including the agri-food industry, agriculture, fishing, ranching, and the like. |
| Y02T—Transportation | CMMT technologies related to transportation (road transport, transportation via railways, e.g., energy recovery or reducing air resistance; aeronautics or air transport; maritime or waterways transport). |
| Y02W—Waste and wastewater | CMMT technologies related to solid waste management, solid waste management, enabling technologies or technologies with a potential or indirect contribution to greenhouse gas (GHG) emissions mitigation. |
| Y04S—Smart grids | Systems integrating technologies related to power network operation, communication, or information technologies for improving the electrical power generation, transmission, distribution, management, or usage. |
Table 2.
Shares in CCMT-TPFs; total and by CPC class (2000–2009, 2010–2016; 5-year MA), (2010–2016 top-10 patenting countries plus EU27).
Table 2.
Shares in CCMT-TPFs; total and by CPC class (2000–2009, 2010–2016; 5-year MA), (2010–2016 top-10 patenting countries plus EU27).
| Country | Period | Y02–Y04S | CCMT Subclasses | |||||||
|---|---|---|---|---|---|---|---|---|---|---|
| - | Y02B | Y02C | Y02D | Y02E | Y02P | Y02T | Y02W | Y04S | ||
| JP | 2000–2009 | 38.0 | 33.8 | 23.8 | 29.3 | 39.4 | 32.0 | 47.6 | 32.3 | 31.9 |
| 2010–2016 | 40.4 | 39.4 | 32.3 | 25.1 | 40.1 | 33.2 | 53.6 | 25.1 | 49.7 | |
| EU27 | 2000–2009 | 24.5 | 27.5 | 26.2 | 14.9 | 21.4 | 27.5 | 26.3 | 26.0 | 19.1 |
| 2010–2016 | 21.4 | 22.6 | 19.4 | 9.3 | 20.6 | 25.1 | 21.0 | 30.2 | 11.1 | |
| US | 2000–2009 | 24.3 | 23.7 | 33.6 | 38.1 | 23.4 | 27.3 | 18.8 | 23.1 | 32.1 |
| 2010–2016 | 19.5 | 18.4 | 29.2 | 39.7 | 17.0 | 22.0 | 14.6 | 24.5 | 23.6 | |
| DE | 2000–2009 | 12.2 | 12.6 | 9.7 | 3.9 | 10.8 | 13.2 | 14.9 | 9.4 | 8.51 |
| 2010–2016 | 9.3 | 7.9 | 7.7 | 2.7 | 9.6 | 11.0 | 9.2 | 9.3 | 3.9 | |
| KR | 2000–2009 | 3.7 | 4.7 | 1.5 | 6.2 | 5.6 | 2.8 | 1.1 | 2.5 | 2.2 |
| 2010–2016 | 7.5 | 5.2 | 1.9 | 6.7 | 11.6 | 6.2 | 4.3 | 2.4 | 4.4 | |
| FR | 2000–2009 | 5.3 | 3.4 | 9.0 | 2.4 | 4.5 | 4.8 | 7.1 | 5.3 | 4.9 |
| 2010–2016 | 5.6 | 3.9 | 4.9 | 1.8 | 5.2 | 5.4 | 7.4 | 7.5 | 2.4 | |
| UK | 2000–2009 | 3.0 | 2.5 | 5.6 | 4.3 | 2.9 | 3.4 | 2.3 | 3.4 | 3.1 |
| 2010–2016 | 2.8 | 2.5 | 3.3 | 3.0 | 2.8 | 2.8 | 2.5 | 3.1 | 2.1 | |
| CN | 2000–2009 | 0.6 | 0.9 | 0.3 | 1.5 | 0.7 | 0.6 | 0.3 | 1.1 | 1.2 |
| 2010–2016 | 2.6 | 3.6 | 1.2 | 9.6 | 2.1 | 2.8 | 0.9 | 3.1 | 2.1 | |
| NL | 2000–2009 | 1.7 | 6.5 | 2.9 | 2.6 | 1.2 | 2.0 | 0.4 | 1.5 | 1.0 |
| 2010–2016 | 1.4 | 6.0 | 1.3 | 0.9 | 1.0 | 1.7 | 0.3 | 1.4 | 1.5 | |
| SE | 2000–2009 | 1.2 | 1.0 | 1.1 | 2.6 | 1.0 | 0.9 | 1.4 | 1.2 | 1.3 |
| 2010–2016 | 1.1 | 0.7 | 1.0 | 2.0 | 0.7 | 1.1 | 1.4 | 1.8 | 0.5 | |
| CH | 2000–2009 | 1.0 | 1.0 | 1.6 | 0.5 | 1.1 | 1.4 | 0.7 | 1.7 | 2.6 |
| 2010–2016 | 1.0 | 0.9 | 1.7 | 0.2 | 1.1 | 1.4 | 0.6 | 1.9 | 0.7 | |
Table 3.
in CCMT-TPFs; total and by CPC class (2000–2009, 2010–2016; 5-year MA), (2010–2016 top-10 patenting countries plus EU27).
Table 3.
in CCMT-TPFs; total and by CPC class (2000–2009, 2010–2016; 5-year MA), (2010–2016 top-10 patenting countries plus EU27).
| Country | Period | Y02–Y04S | CCMTs Subclasses | |||||||
|---|---|---|---|---|---|---|---|---|---|---|
| - | - | Y02B | Y02C | Y02D | Y02E | Y02P | Y02T | Y02W | Y04S | |
| KR | 2000–2009 | 3.4 | 46.4 | −38.0 | 63.8 | 34.0 | −9.4 | −79.8 | −3.9 | 20.4 |
| 2010–2016 | 23.3 | 17.9 | −58.1 | 40.7 | 75.3 | 34.6 | −4.5 | −51.7 | 1.4 | |
| JP | 2000–2009 | 8.3 | 11.0 | −21.7 | −3.6 | 26.6 | 5.2 | 40.8 | 6.1 | 2.8 |
| 2010–2016 | 7.5 | 15.1 | −4.8 | −28.3 | 17.0 | −1.8 | 43.0 | −29.0 | 35.2 | |
| FR | 2000–2009 | 0.4 | −39.1 | 52.8 | −51.4 | −14.9 | −3.0 | 21.9 | 2.3 | 12.3 |
| 2010–2016 | 7.0 | −25.4 | −4.4 | −75.1 | 6.8 | 10.8 | 39.0 | 38.8 | −61.0 | |
| DE | 2000–2009 | 0.5 | 6.1 | −20.2 | −76.7 | −7.0 | 10.7 | 25.0 | −22.4 | −27.4 |
| 2010–2016 | −0.4 | −18.8 | −21.7 | −84.6 | 2.0 | 15.2 | −3.1 | 0.4 | −68.3 | |
| EU27 | 2000–2009 | −0.9 | 4.7 | 20.6 | −13.3 | −9.8 | 23.5 | −27.5 | 31.6 | 20.4 |
| 2010–2016 | −7.3 | 8.8 | 16.8 | −30.3 | −8.1 | 22.1 | −23.3 | 41.8 | −28.0 | |
| UK | 2000–2009 | −10.0 | −38.1 | 36.3 | 12.5 | −24.9 | −11.5 | −46.0 | −12.4 | −24.8 |
| 2010–2016 | −6.3 | −27.3 | −1.4 | −7.2 | −16.4 | −13.8 | −26.0 | −5.2 | −36.9 | |
| SE | 2000–2009 | −10.0 | −38.1 | 36.3 | 12.5 | −24.9 | −11.5 | −46.0 | −12.4 | −24.8 |
| 2010–2016 | −6.33 | −27.3 | −1.4 | −7.2 | −16.4 | −13.8 | −26.0 | −5.2 | −36.9 | |
| CN | 2000–2009 | −9.9 | −39.5 | −1.2 | 45.8 | −34.6 | −47.2 | −9.2 | −19.5 | 38.3 |
| 2010–2016 | −9.0 | −37.2 | −12.6 | 41.5 | −58.4 | −14.8 | 8.6 | 3.0 | −60.1 | |
| US | 2000–2009 | −3.4 | 35.4 | 5.4 | 48.3 | 4.1 | −14.9 | −62.9 | 58.6 | 79.7 |
| 2010–2016 | −9.5 | 16.5 | −59.8 | 79.3 | −29.4 | −4.4 | −84.3 | 5.4 | −37.1 | |
| NL | 2000–2009 | −6.6 | −21.6 | 11.5 | 22.2 | −23.9 | −9.1 | −42.3 | −25.8 | 4.8 |
| 2010–2016 | −11.5 | −31.4 | 14.0 | 41.8 | −37.9 | −14.3 | −50.1 | −3.7 | −6.6 | |
| CH | 2000–2009 | −17.4 | 77.9 | 20.2 | 10.3 | −51.0 | −12.9 | −94.5 | −37.7 | −21.6 |
| 2010–2016 | −14.5 | 80.8 | −20.1 | −58.5 | −59.3 | −13.0 | −93.7 | −27.3 | −19.1 | |
Publisher’s Note: MDPI stays neutral with regard to jurisdictional claims in published maps and institutional affiliations. |
© 2021 by the authors. Licensee MDPI, Basel, Switzerland. This article is an open access article distributed under the terms and conditions of the Creative Commons Attribution (CC BY) license (https://creativecommons.org/licenses/by/4.0/).
Share and Cite
MDPI and ACS Style
Caravella, S.; Costantini, V.; Crespi, F. Mission-Oriented Policies and Technological Sovereignty: The Case of Climate Mitigation Technologies. Energies 2021, 14, 6854. https://0-doi-org.brum.beds.ac.uk/10.3390/en14206854
AMA Style
Caravella S, Costantini V, Crespi F. Mission-Oriented Policies and Technological Sovereignty: The Case of Climate Mitigation Technologies. Energies. 2021; 14(20):6854. https://0-doi-org.brum.beds.ac.uk/10.3390/en14206854
Chicago/Turabian StyleCaravella, Serenella, Valeria Costantini, and Francesco Crespi. 2021. "Mission-Oriented Policies and Technological Sovereignty: The Case of Climate Mitigation Technologies" Energies 14, no. 20: 6854. https://0-doi-org.brum.beds.ac.uk/10.3390/en14206854
Note that from the first issue of 2016, this journal uses article numbers instead of page numbers. See further details here.