
Effects of Air Temperature and Humidity on the Kinetics of Sludge Drying at Low Temperatures
by
 ,
,
Zhenyu Wang
1, 
Lin Xu
2,
Dong Liu
2,*,
Qing Zhang
1,2,
Anjie Hu
2,
Ruheng Wang
2 and
Yongcan Chen
1,* 1
School of Environment and Resources, Southwest University of Science and Technology, Mianyang 621010, China
2
School of Civil Engineering and Architecture, Southwest University of Science and Technology, Mianyang 621010, China
*
Authors to whom correspondence should be addressed.
Energies 2021, 14(22), 7722; https://0-doi-org.brum.beds.ac.uk/10.3390/en14227722
Submission received: 16 October 2021
/
Revised: 13 November 2021
/
Accepted: 15 November 2021
/
Published: 18 November 2021
(This article belongs to the Topic Solid Waste Management)
Abstract
:In this study, a low-air temperature sludge drying system was constructed and the effects of temperature and relative humidity on the characteristics of the system were investigated. The results showed that the drying rate of sludge increased with an increase in air temperature and a decrease in the air’s relative humidity. The influence of temperature on the average drying rate exhibited an approximate quadratic distribution, while the influence of relative humidity on the average drying rate exhibited an almost linear distribution. The relationship equations of the average drying rate, temperature, and humidity were summarized and compared with the experimental results, and the maximum relative error was 7.6375%. By comparing the experimental results with the commonly used thin-layer drying models, it was found that the sludge drying characteristics were more consistent with the Midilli model. Based on the relevant parameters of the Midilli model, the relationship between the segmented drying moisture content and the average drying rate was proposed, and the empirical formula of the drying rate and MR under different conditions was fitted.
1. Introduction
With the development of cities and industries, large quantities of sewage are produced by daily life and industry. During the sewage treatment process, sludge is inevitably generated. Domestic sludge produced in the process of urban life and industrial production is directly discharged into the environment without treatment, causing serious pollution [1]. At present, popular methods for sludge reduction include natural drying, sludge thickening, electrical dehydration, and mechanical dehydration. The most common method is mechanical dehydration, and many researchers have attempted to improve the dewatering capacity of sludge. Yu et al. [2] investigated the relationship between the repulsive force of sludge flocs, hydrophilicity/hydrophobicity, and sludge dewatering capacity and found that the dewatering capacity of waste-activated sludge was improved by reducing the interaction of sludge flocs. Wei et al. [3] studied the modification of near-anode sludge by adding different doses of calcium oxide (CaO) to a sludge electrical dehydration system and found that the addition of 4% mu of CaO for near-anode modification resulted in the best dewatering effect in the shortest time. According to these results, most mechanical dehydration methods can only remove surface water. However, Otero et al. [4] considered that after mechanical dehydration, sludge has a highwater content, low calorific value, and large transportation volume, which are unsuitable characteristics for incineration during subsequent treatment; therefore, further drying of the sludge after mechanical dewatering is important. Accordingly, a key direction in sludge treatment research is the development of drying technology.
To improve sludge drying, the corresponding process and law must be investigated. Sludge drying is a very complicated process, which can be understood as an unsteady heat and mass coupling and transfer process. Keey [5] considered that solid drying could be divided into two parts: the evaporation of moisture on the surface of the solid and the diffusion of moisture from the inside of the solid to the surface. The internal and external concentration gradients are the driving force for moisture diffusion and follow Fick’s law. Many researchers have investigated this heat–mass transfer process and determined the drying curve to describe the sludge-drying process [6,7,8,9,10,11,12]. However, different studies have determined different drying curves and focused on the characteristics of sludge and the temperature of the drying atmosphere. From the perspective of heat and mass transfer, sludge is a porous medium, and its drying process can be divided into two parts: internal diffusion and external convection. Therefore, when the solid is considered as thin-layer one-dimensional diffusion, a theoretical model of the moisture content of one-dimensional diffusion with time can be obtained. This thin-layer drying model has been widely used, and researchers have proposed a semi-theoretical model and empirical model. The authors of [13,14] added parameters to the model proposed by previous studies based on their experiment and then compared it with the existing model and selected experimental data to propose a new thin-layer drying model. Although the proposed model does not provide a theoretical basis, it has practical application value. Ghazanfari et al. [15] modified the Midilli model. Corzo et al. [16] subsequently modified and optimized the model to give meaning to the parameters of the equation, and proposed the Weibull model to describe the drying phenomenon of materials more accurately. Reyes et al. [17] conducted research on the drying kinetics of sludge from a municipal sewage treatment plant at different temperatures and wind speeds and proposed a generalized drying curve equation based on the modified quasi-stationary method and Fick’s second law. The authors of [18] found that the improved Page model could better describe the drying process of paper mill sludge in an oven. Yue et al. [19] found that the drying characteristic curve of a mixture of municipal sludge and sawdust fit well with the Wang–Singh model. Guo et al. [20] used two heating methods of constant temperature and constant power to dry two common sludges: mechanical dewatering and compost dewatering methods. The results showed that the output power had the greatest influence on energy consumption, energy efficiency, and drying efficiency, followed by constant temperature and initial quality. The Midilli–Kucuk model can better fit the constant-temperature drying mode. The aforementioned studies conducted experiments and simulations for the drying of different materials and established different drying models, most of which are for high-temperature drying. The main influencing factors are the nature of the material and temperature, and experiments are often required to determine the related parameters.
For sludge drying, the existing drying temperature is generally above 80 °C. The main factors affecting drying are the physical properties, structure, and drying temperature of sludge. When the drying temperature is below 80 °C, the relative humidity of the dry air directly affects the drying effect; however, the current drying model does not analyze this influence. To study the low-temperature drying characteristics of sludge, this study conducted an experiment on the low-temperature drying characteristics of municipal sludge obtained from the Mianyang area. The influences of sludge characteristics, temperature, and relative humidity parameters on the average drying rate were considered. The relationship between humidity changes and the thin-layer drying model based on the average drying rate was summarized.
2. Materials and Methods
2.1. Materials
The test sludge was obtained from the Qixingba Municipal Sewage Treatment Plant in Mianyang, Sichuan. The sludge was dewatered by a centrifugal thickening and dewatering integrated machine process. Its composition was mainly colloidal with a complex structure and a strong affinity for water, and it contained sediment, fibers, animal and plant residues, condensed flocs, mycelium formed by a variety of microorganisms and the adsorbed organic matter, parasite eggs, a low concentration of pathogenic microorganisms, heavy metal salts, and other substances. The initial average wet-base moisture content was approximately 64.6%.
2.2. Experimental Device and Test Process
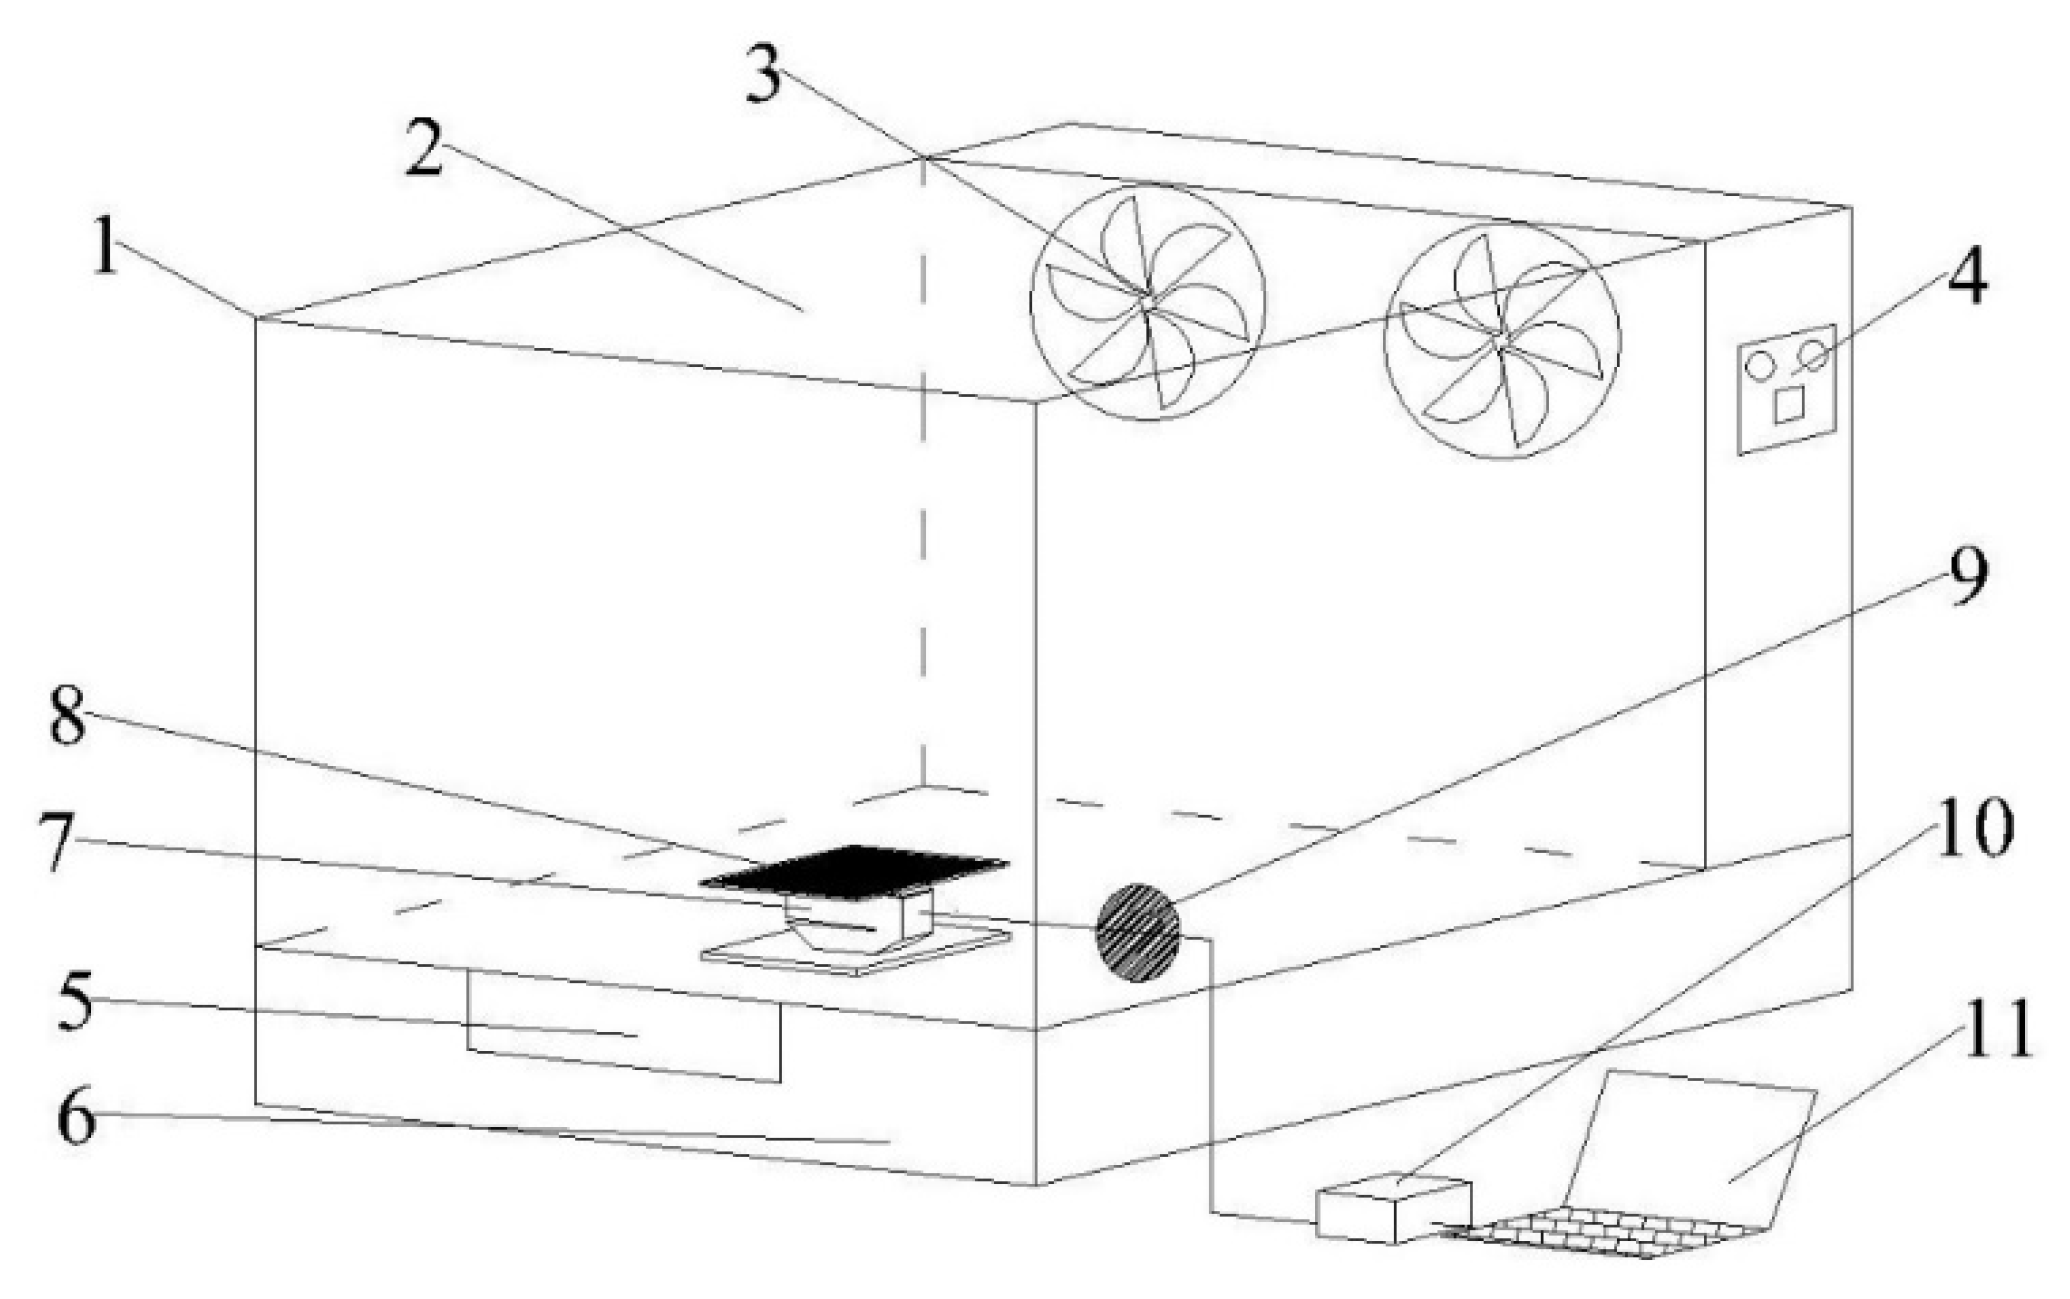
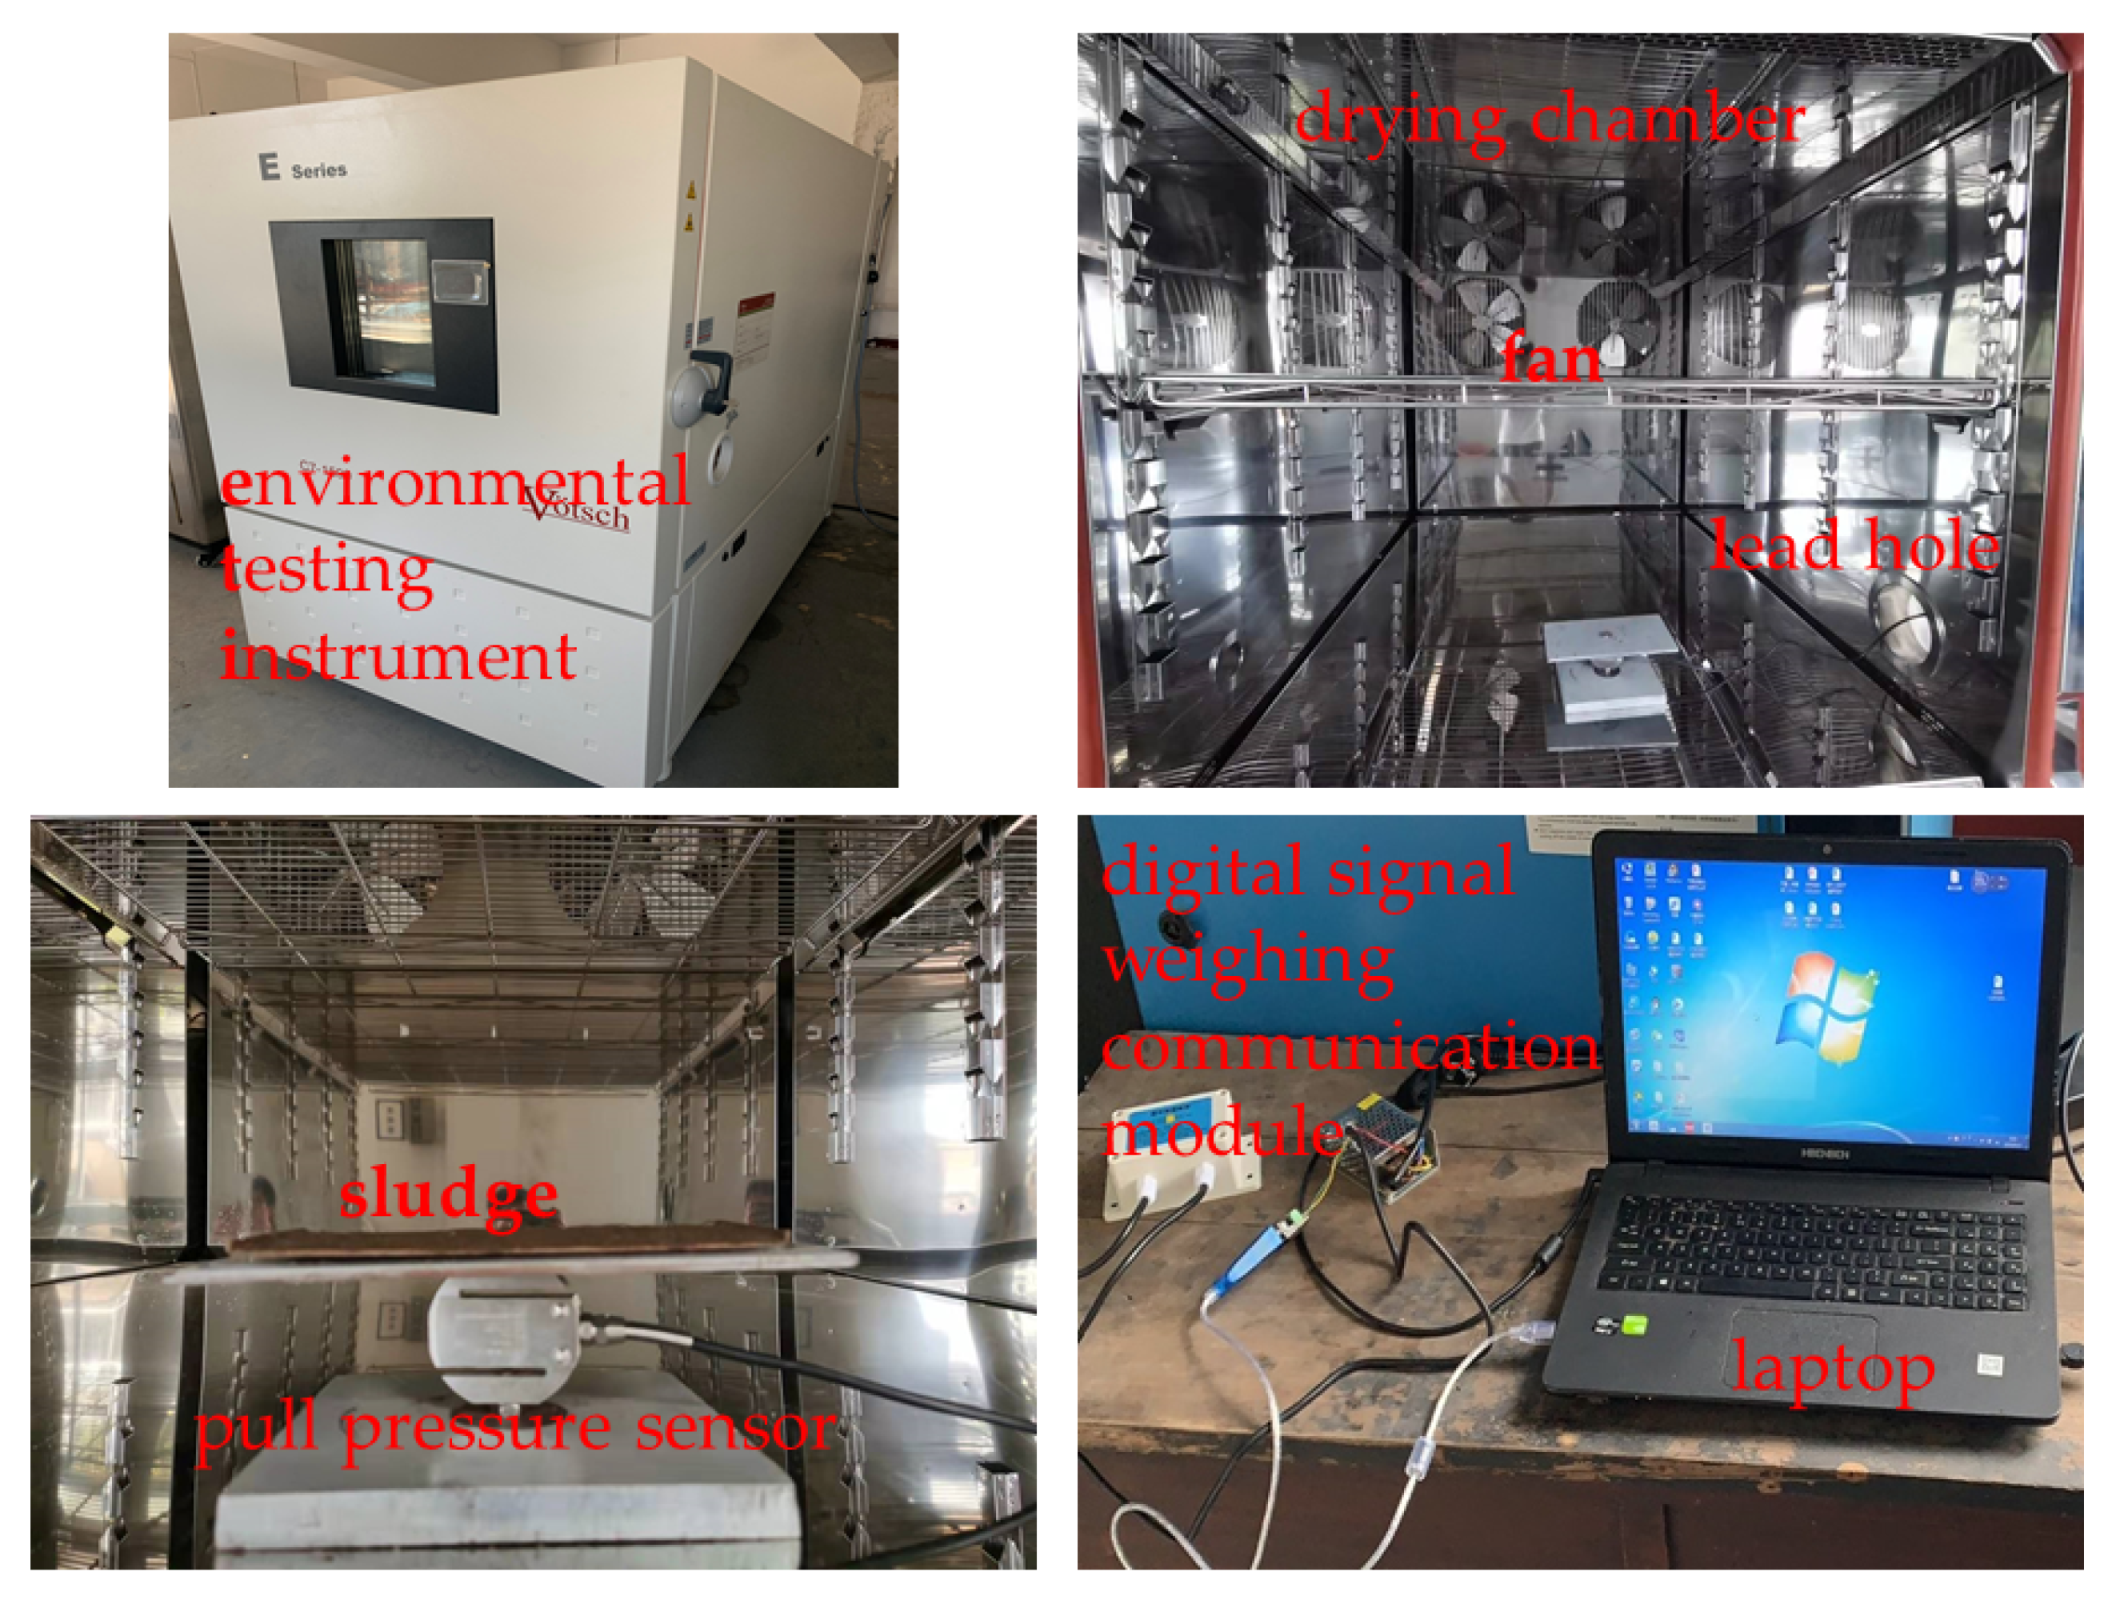
The experimental device used for low-temperature hot-air drying is shown in Figure 1 and Figure 2. The experimental device was mainly composed of an environmental simulation box (C7-1500 E series, Weiss Fuchs Environmental Testing Instrument, Taicang Co., Ltd.: Taicang, China), and had a temperature accuracy of ±0.3 °C and humidity accuracy of ±3%. A pull pressure sensor (HYLY-008 S series, Hengyuan Sensor Co., Ltd.: Tianjin, China; accuracy of ±0.1 g) was used to measure the sludge quality, and a digital signal weighing communication module (HYRS-485 MODBUS) was used to record the sludge quality in real time and input the data into a computer, which were used to control the temperature and relative humidity of the air.
In the experiment, sludge (of the same quality) was dewatered by the centrifugal thickening and dehydrating integrated machine and was then loaded onto a 200 mm × 200 mm × 2 mm steel plate. After forming, the quality and density of the thin sludge layer (2 mm thick) remained constant. The climate simulation box was opened, the temperature of the intelligent temperature controller was set to the preset values (40 °C, 50 °C, and 60 °C), the relative humidity was set to the preset values (30%, 40%, 50%, and 60%), and the wind speed was set to 1.5 m/s. When the environment in the climate simulation box reached a stable state, the pre-prepared test materials were placed in the drying room and real-time data were collected. The test data were automatically collected once every 10 min, and each test was repeated three times.
2.3. Data Processing
- (1)
- Dimensionless sludge movement content ratio
The dimensionless sludge movement content ratio was calculated using Equation (1) [21]:
where MR is the dimensionless sludge movement content ratio, M0 is the initial dry basis moisture content of the sludge (g/g), Me is the dry basis moisture content of the sludge at equilibrium (g/g), and Mt is the dry basis moisture content of the sludge at time t during the drying process (g/g). Because Me is very small compared to M0, which can be ignored [22], Equation (1) can be simplified as follows:
- (2)
- Drying rate
The drying rate (DR) refers to the amount of water removed per unit time (min), which is calculated using by Equation (3) [23].
where Δt is the time between data collection, which in this experiment is 10 min.
- (3)
- Average drying rate
The average drying rate () is the ratio of the difference between the moisture content of the dry basis of the sludge before and after drying to the total drying time (g/(g·min)) and can be calculated as follows:
where Mend is the moisture content of dry base after drying and ttotal is the total time from the beginning to the end of drying.
To better evaluate the accuracy of the model, the coefficient of determination (R2), root mean square error (RMSE), and Chi-square (χ2) were determined using Equations (5)–(7), respectively:
where MRexp,i and MRpre,i are the experimental and predicted dimensionless moisture contents, respectively; n is the number of observations; and z is the number of constants. The larger the R2, the smaller the χ2 and RMSE values, and the better the fit between the test value and the drying model [24].
3. Results
3.1. Influence of Drying Temperature on Sludge Drying Behavior
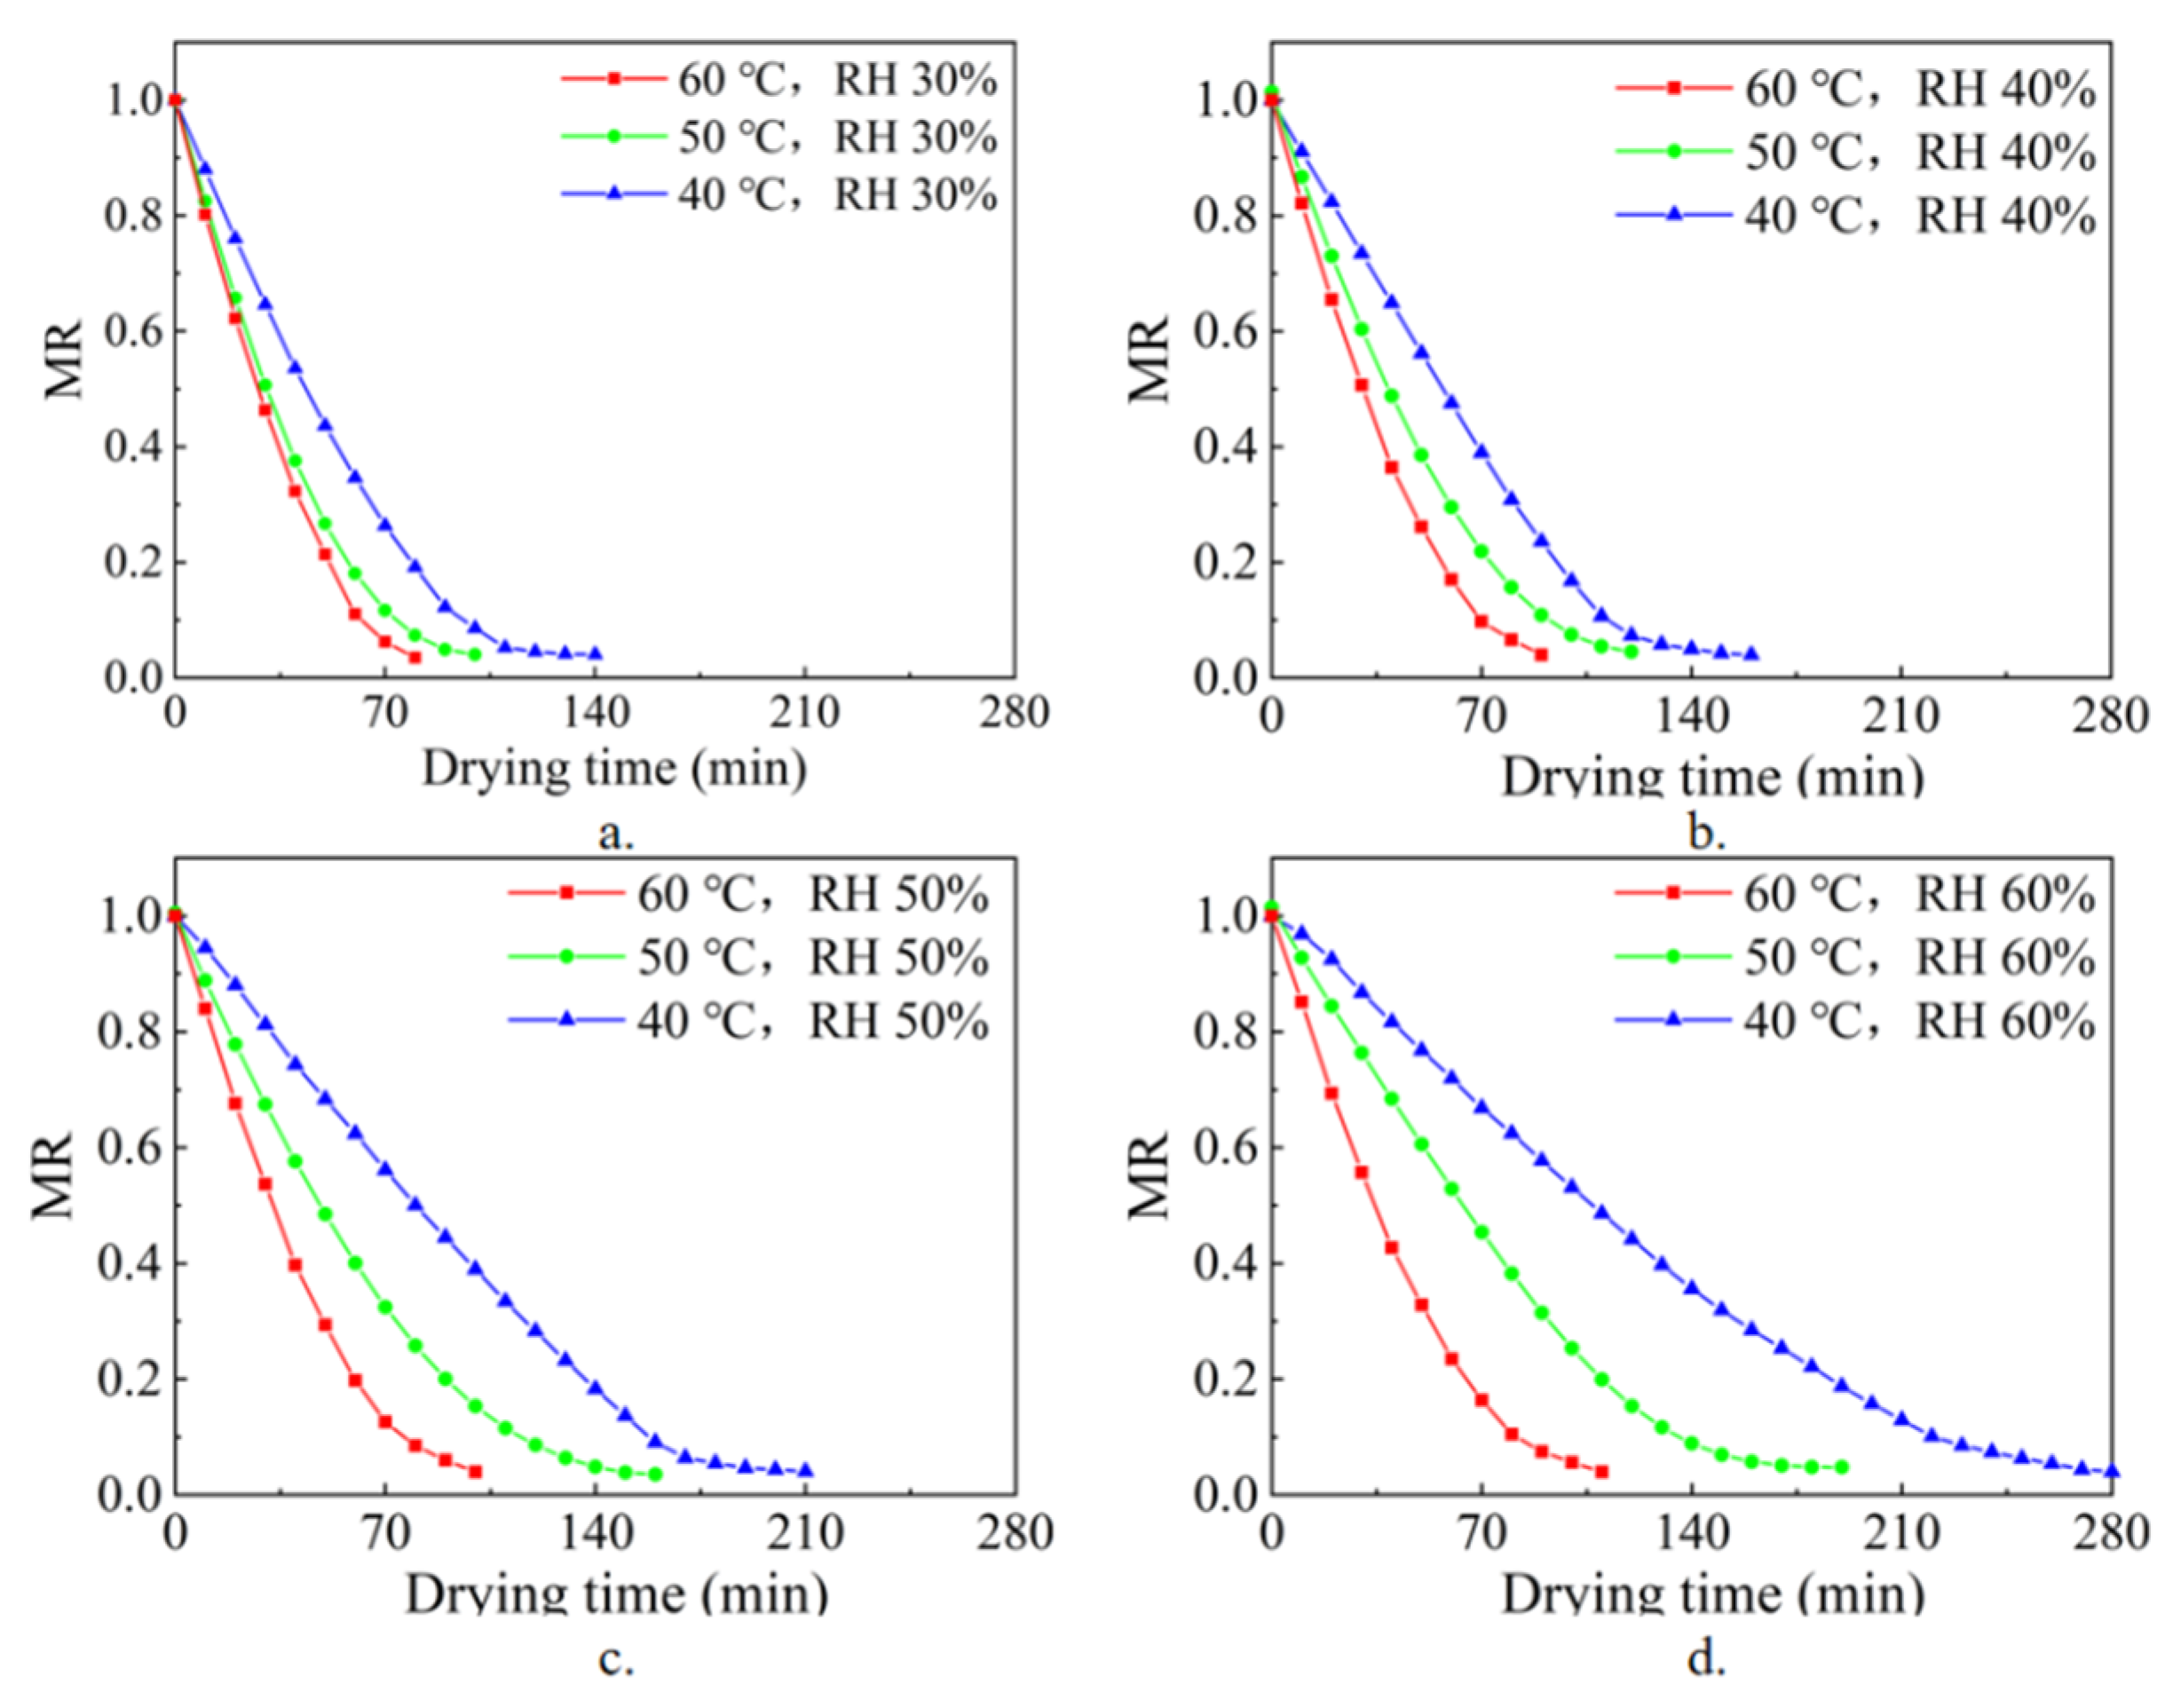
Under different relative humidities, the sludge moisture content changed over time (Figure 3 and Figure 4). At a relative humidity of 60%, the drying time (when the sludge MR decreased from 100% to 10%) reduced from 220 min to 80 min when the drying temperature increased from 40 °C to 60 °C. As the relative humidity decreased, the drying time decreased. At a relative humidity of 30%, the drying time (when the sludge MR decreased from 100% to 10%) reduced from 100 min to 70 min when the drying temperature increased from 40 °C to 60 °C. Therefore, under the same relative humidity, the higher the drying temperature, the shorter the time required for the sludge MR to decrease.
A comparison of Figure 3a–d reveals that when the drying temperature was 60 °C and the relative humidity of the drying environment was reduced from 60% to 30%, the drying time (when the sludge MR decreased from 100% to 10%) decreased from 90 min to 70 min. As the drying temperature decreased, the drying time increased. When the drying temperature was 40 °C and the relative humidity of the drying environment was reduced from 60% to 30%, the sludge MR decreased from 100% to 10% and the drying time decreased from 220 min to 90 min. Therefore, at the same drying temperature, more time was required for the sludge water ratio to decrease with an increase in the relative humidity of the drying environment. At high temperatures, the time taken to dry materials to a moisture content of 0.2 is very small [25], and the process is basically unaffected by the relative humidity of the air. When sludge is dried at low temperatures, the change in the MR is affected by the relative humidity of the air in the dry environment, as well as the drying temperature. This can be seen from the characteristics of moist air at low temperatures, whereby the relative humidity of moist air is significantly affected by the change in moisture content. The lower the relative humidity, the greater the moisture absorption capacity. At high temperatures, the relative humidity of humid air is less affected by the change in the moisture content, and the moisture absorption capacity of humid air is not significantly affected by the relative humidity.
To better illustrate the influence of temperature on the drying characteristics of sludge, Figure 5 plots the sludge drying rate against the sludge MR. This shows that the drying rate decreased as the MR decreased and that, under the same relative humidity of the air, the maximum drying rate increased with an increase in temperature. The maximum drying rate at 60 °C was 0.029 g/(g·min), representing an increase of 34% compared with the maximum drying rate at 40 °C. At a relative humidity of 30%, the maximum drying rate at 60 °C was 0.036 g/(g·min), representing an increase of 61% compared with the maximum drying rate at 40 °C. Under the same drying relative humidity, the moisture required for the humid air to reach saturation increased with an increase in temperature, thereby enhancing the evaporation of free water on the surface of the sludge. At the same time, the increase in temperature also accelerates the diffusion migration of water molecules inside the sludge, thereby increasing the drying rate.
At the same air temperature, the maximum drying rate of the sludge decreased with an increase in the relative humidity of the air. At 60 °C, the relative humidity of the air increased from 30% to 60%, while the maximum drying rate decreased from 0.036 g/(g·min) to 0.028 g/(g·min) (reduction rate of 77.8%). Similarly, at 40 °C, the relative humidity of the air increased from 30% to 60%, while the maximum drying rate decreased from 0.022 g/(g·min) to 0.010 g/(g·min) (reduction rate of 45.5%). From the heat and mass transfer characteristics of humid air, it was found that when the relative humidity of the air increased, its moisture absorption capacity decreased, resulting in a decrease in the drying rate. This phenomenon is more obvious when the temperature is not too low.
Figure 5 shows that the sludge drying process was mainly composed of three phases with a reduction in the MR: I, rapidly increasing; II, gradually decreasing (or relatively stable); and III, rapidly reducing drying ratio. The higher the temperature, the lower the relative humidity and the shorter the gradually decreasing phase. This is because as the evaporation rate of free water on the surface of the sludge increased, the diffusion rate inside the sludge could not be balanced with the evaporation rate of free water on the sludge surface. The critical moisture content during phase I was approximately 0.8, whereas it was approximately 0.1 during phases II and III because the moisture content of the sludge stabilized and the effect of temperature could not lead to further dehydration. Moreover, at different temperatures, the large difference in the drying rate was mainly observed at the stage of the MR changing from 0.8 to 0.1. This indicates that the phases where the sludge drying rate varied considerable at different temperatures were mainly the constant-rate drying and first deceleration phases.
3.2. Influence of Different Relative Humidities and Temperatures on the Average Drying Rate of Sludge
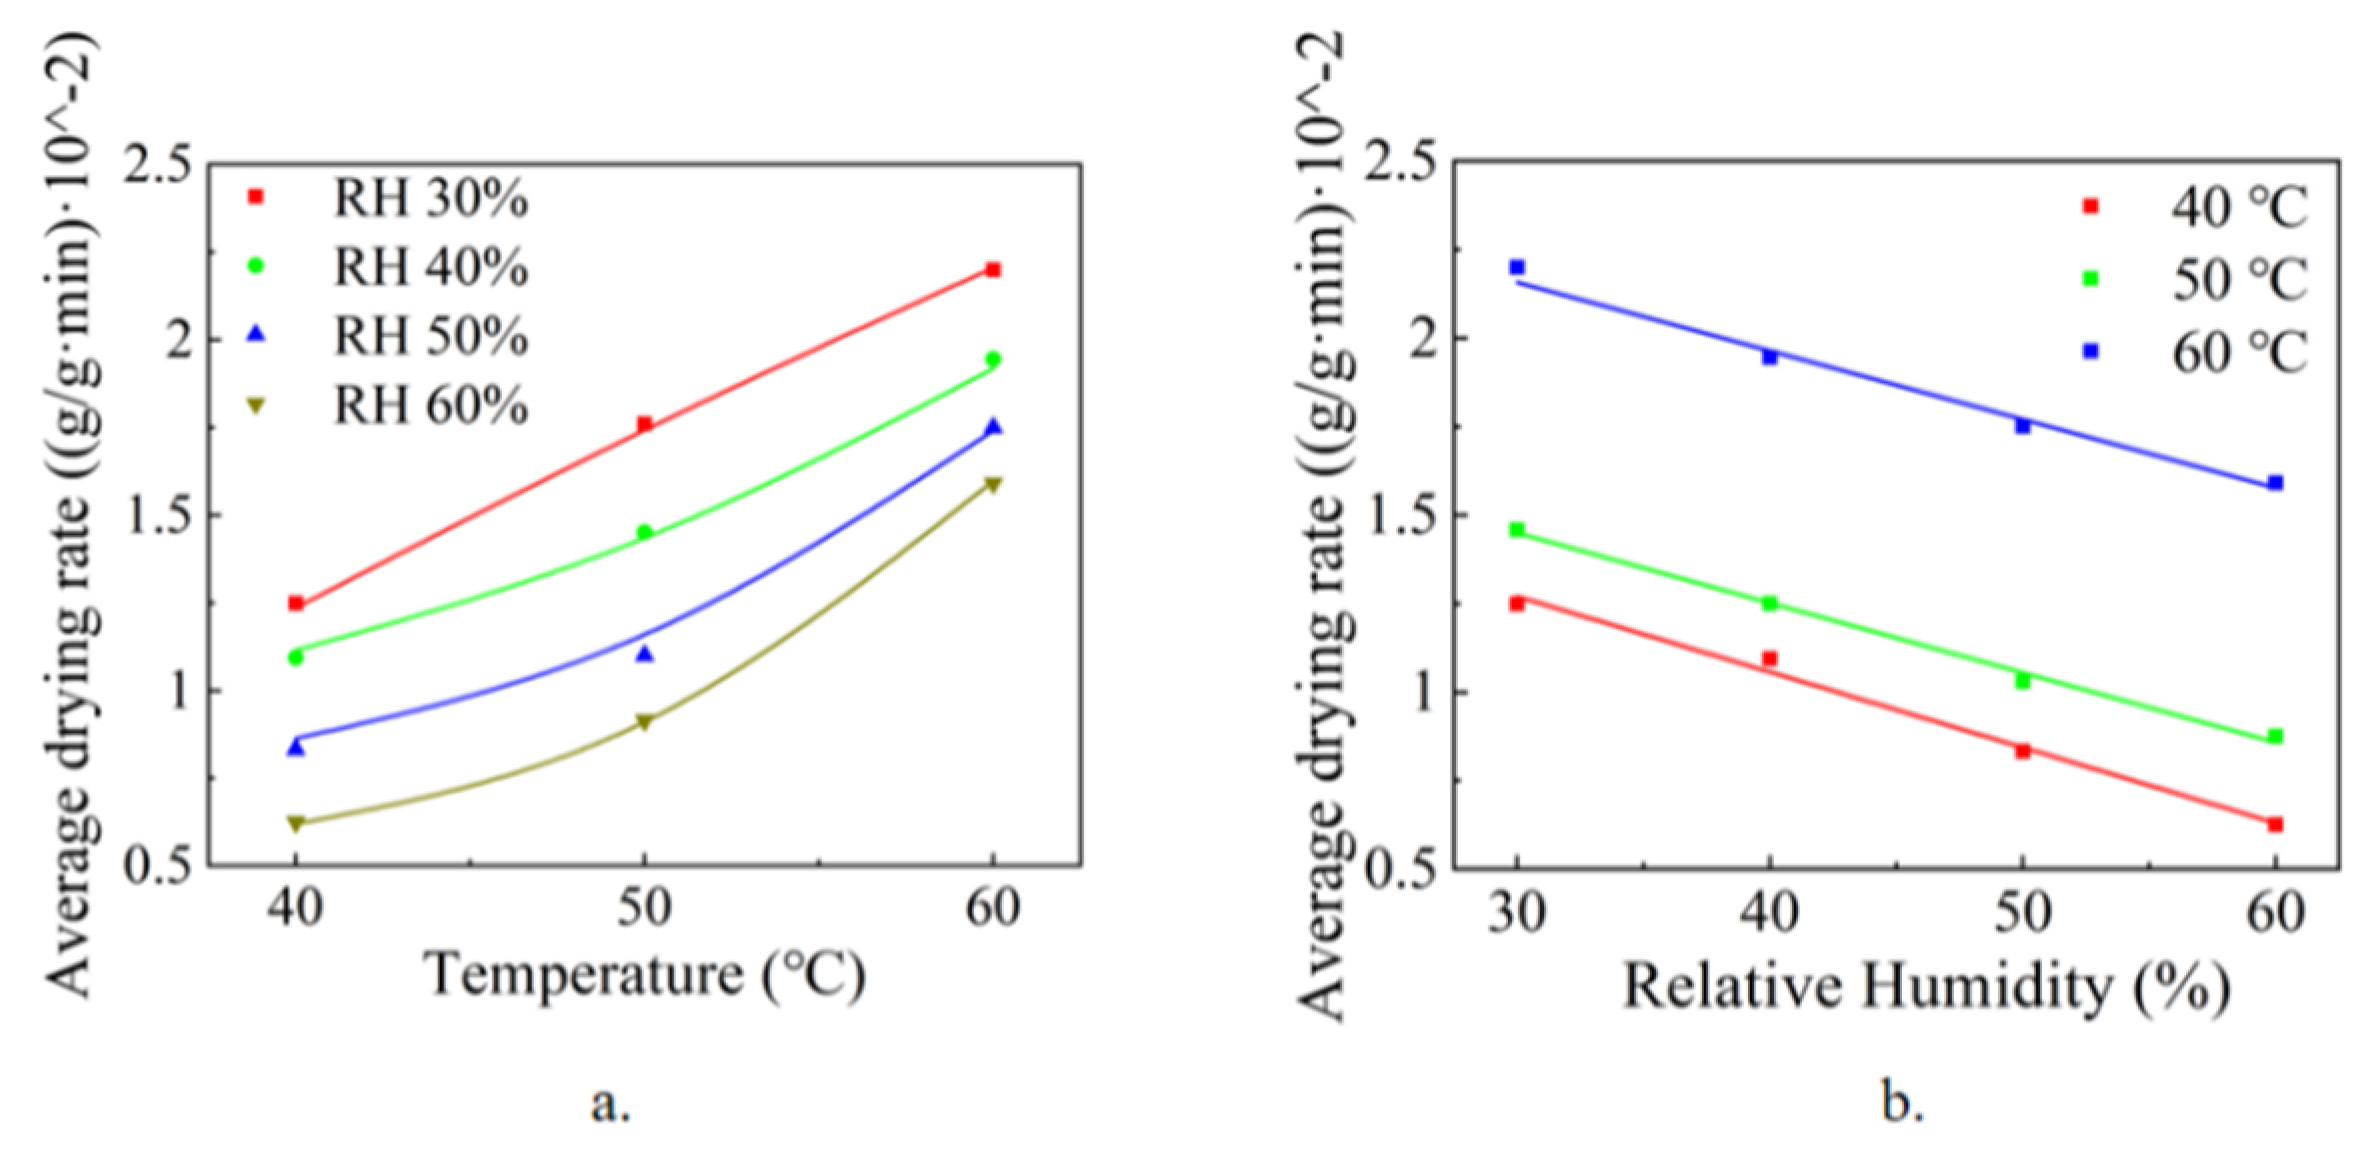
From the analysis above, it can be found that the low-temperature drying characteristics of the sludge used in this study were closely related to the temperature and relative humidity of the humid air. To better express its correlation, the average drying rate of the sludge is plotted as a function of temperature and relative humidity in Figure 6. Figure 6a shows that under the same relative humidity, the variation in the average drying rate with temperature exhibited an approximate quadratic distribution. In contrast, as the relative humidity decreased, the variation tended to be linear. Figure 6b shows that under the same temperature, the average drying rate tended to be linearly distributed with the relative humidity because the low-temperature drying of the sludge involved two processes. The first was the evaporation of water on the surface of the sludge, and the second was the diffusion of water from the inside of the sludge to the surface. When the temperature increased, the evaporation of the surface and the diffusion of internal water both accelerated such that the law of change was a quadratic curve. When the relative humidity decreased, the evaporation of water on the surface of the sludge accelerated, whereas the diffusion of internal water was unaffected, thus presenting a linear distribution.
Owing to the obvious characteristics of the low-temperature drying of sludge, the experimental law of changes in the average drying rate of sludge with temperature and relative humidity was fitted. The air temperature and relative humidity data have different orders of magnitude. When the levels of each index are very different, if the original index value is used directly for analysis, it will highlight the role of the index with a higher value in the comprehensive analysis, and the relative weakening value will be low. Therefore, the role of indicators is to standardize the original data to ensure the reliability of the results. The temperature and relative humidity data were normalized as follows:
The value of the average drying rate is used as the dependent variable, and the normalized air temperature and relative humidity values are used as the independent variables. Linear regression fitting is performed on the experimental law of the average drying rate changing with temperature and relative humidity. The fitting formula is shown in Equation (10):
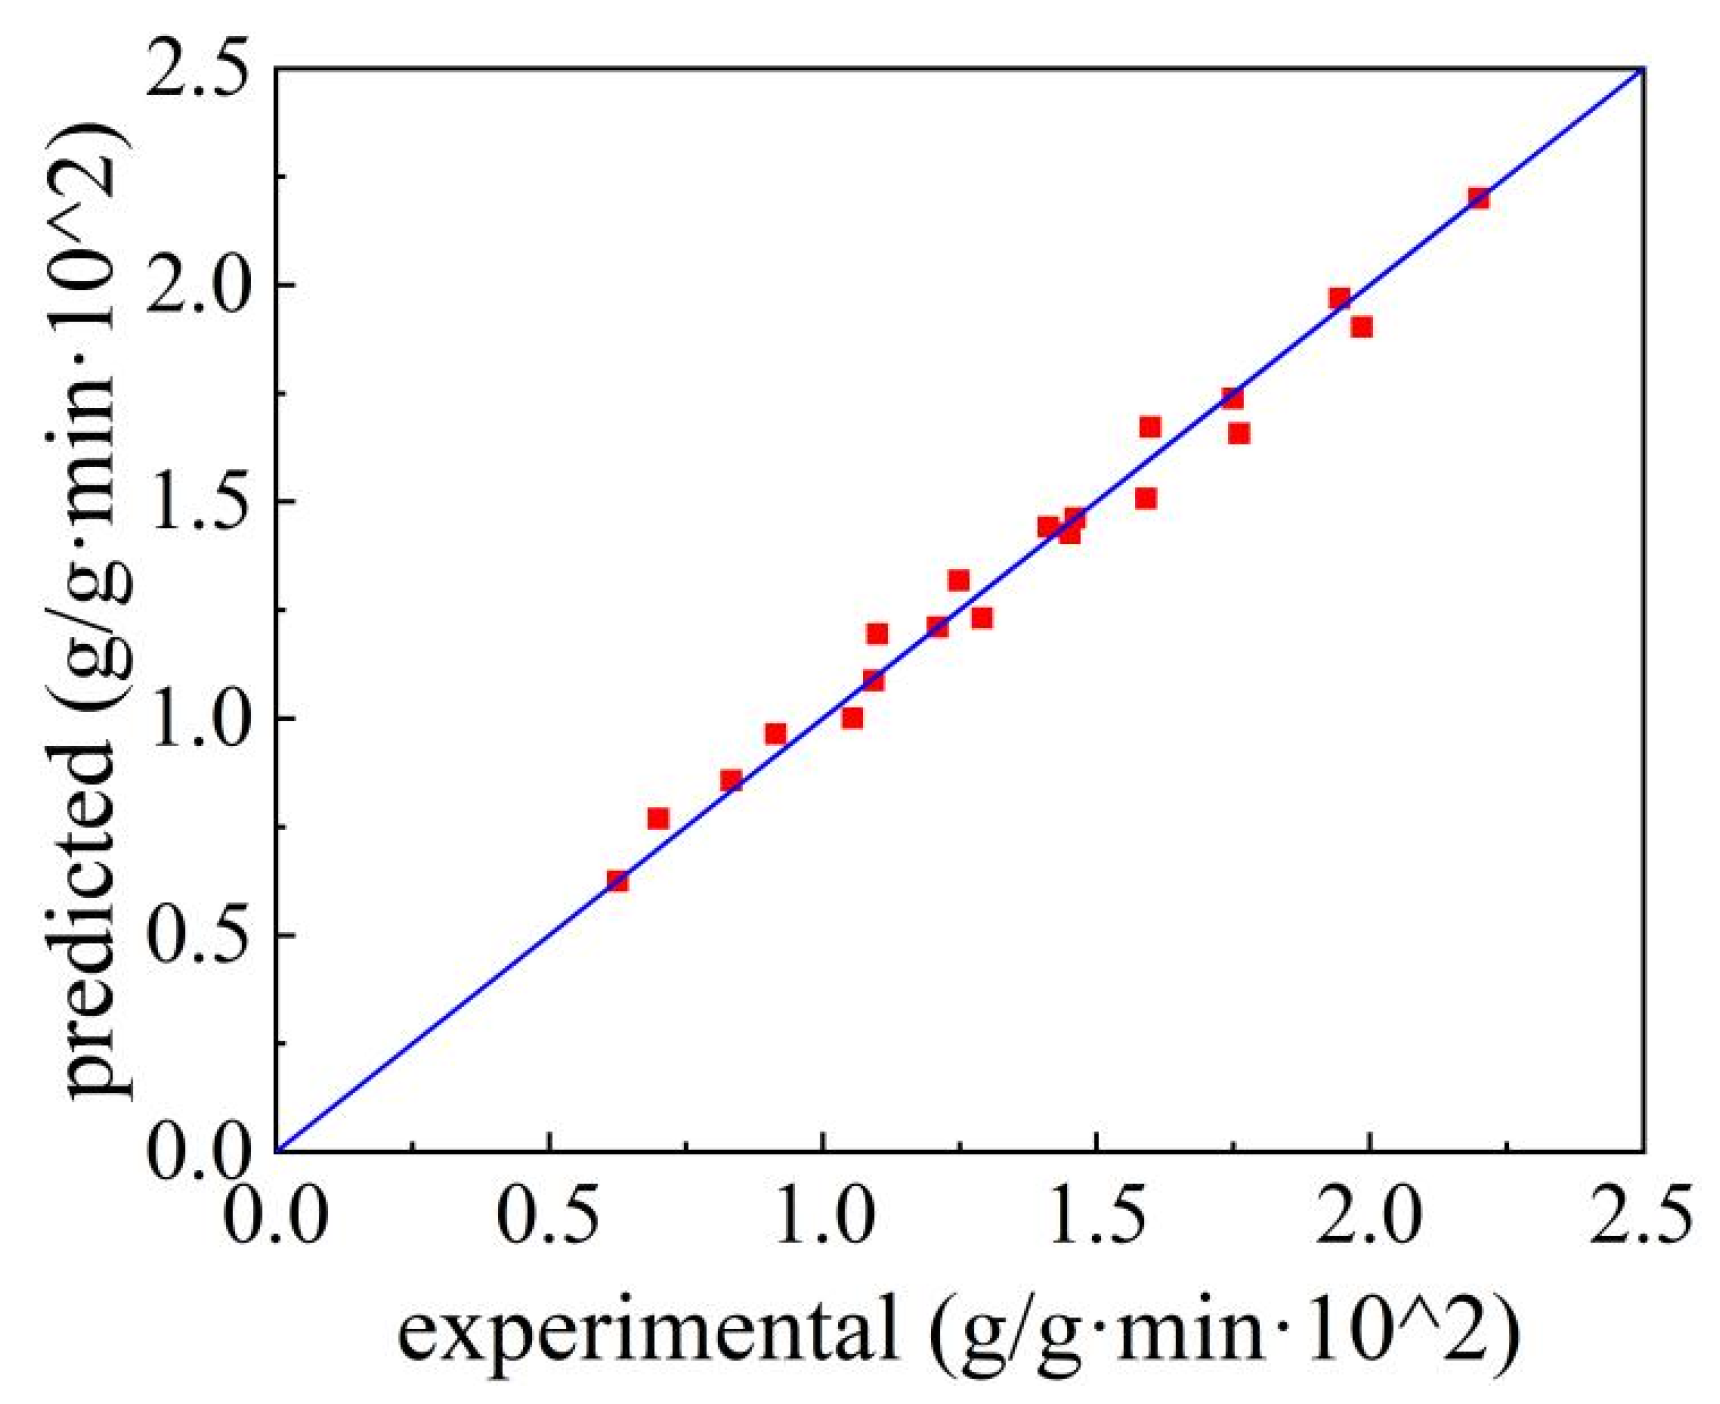
The calculation results of the fitted formula compared with the experimental results are shown in Figure 7, which shows that the maximum relative error between the predicted and experimental values was 7.6%. Therefore, this formula can well reflect the low-temperature-drying characteristics of sludge.
3.3. Comparison and Discussion of Thin-Layer Drying Models
The drying process of sludge mainly involves the transfer of moisture to the outer surface through pores and then transfer to the air by means of moisture migration. In this process, there may be many forms of material migration within the sludge, and the driving force for migration also differs. Therefore, people have proposed a variety of drying mechanism models, among which the most widely used is the thin-layer drying model. The specific forms are listed in Table 1.
In order to better characterize the drying characteristics of sludge, 12 groups of different air temperatures (60 °C, 50 °C, 40 °C) and relative humidity (30%, 40%, 50%, 60%) were selected for the change of sludge MR with drying time. The data were substituted into the thin layer drying model (Table 1). Drying time was the independent variable, and MR was the dependent variable. The model was calculated by nonlinear regression method of the Levenberg–Marquardt algorithm. The 12 groups of fitting results of each model were analyzed, and R2, χ2, and RMSE were averaged to obtain Table 2. Table 2 shows that the Midilli model had the best fitting effect, with the highest R2 and lowest RMSE and χ2 compared with the other models.
By analyzing the Midilli model and substituting the experimental data under different ambient temperatures and relative humidities into Table 3, it was found that the changes in temperature and relative humidity had a considerable impact on the model coefficient k but a small effect on coefficients a and n. Coefficient b was unaffected by changes in temperature and relative humidity and represents the model’s correction coefficient. The increase in temperature and the decrease in relative humidity increased coefficient k, the value of which can reflect the average drying rate.
In actual engineering, it is difficult to determine the parameters for different temperatures and humidity using the Midilli model; hence, it is limited to certain restrictions when applied in engineering. To better express the drying characteristics of sludge, the average drying rate was used for fitting. is the drying speed of the material under certain working conditions. Therefore, when the material thickness, air flow rate, and other conditions are constant, under different air temperature and relative humidity, there will be different values. Therefore, can be used to characterize the degree of influence of air temperature and relative humidity on the drying of materials. Adding as a coefficient to the thin-layer drying model formula can predict the drying of the material under different air temperature and relative humidity conditions when the material thickness, air flow rate, and other conditions are constant in the actual project.
A new model is proposed based on the average drying rate. When the sludge is dried below an MR of 0.2, the pores inside the sludge begin to collapse, which is different from the previous drying process; thus, the drying process is divided into two stages. The first stage is when the sludge begins to dry to a MR of 0.2, and the second stage is when the sludge is dried to the state at a MR of 0.2. The first-stage calculation is given by Equation (11):
The first term of the model represents the effect of temperature and relative humidity upon drying, the second term represents the effect of other factors on sludge drying, and is the average drying rate.
The fitting results for the first stage are listed in Table 4. For the sludge used in this experiment, coefficient n = 1.201, coefficient a = 0.01, and coefficient m = 1. After fitting, the average RMSE, χ2, and R2 were 0.0120, 0.0006, and 0.9979, respectively.
The second-stage calculation is given by Equation (12):
where t0 represents the time spent at the end of the first stage.
The fitting results for the second stage are listed in Table 5. Coefficient a did not change, whereas coefficients n and m did change (n = 1.118; m = 1.12). Coefficient b was 2.431 × 10⁻⁵, and coefficient c was −0.1236. The average RMSE, χ2, and R2 values after fitting were 0.0010, 0.0002, and 0.9831, respectively.
Figure 8 displays the relationship between the fitting MR errors under different conditions over time for the first and second stages. The maximum error was 10.9%, indicating that the model could adequately describe the drying characteristics of sludge. Hence, by combining Equation (10) with Equations (11) and (12), the change in the sludge MR can be calculated based on the environmental temperature, humidity, and sludge characteristics, thus providing excellent engineering application value.
4. Conclusions
In this study, sludge was dried at low temperatures, and the drying rate and MR curve under different temperatures and relative humidities were obtained through experiments. The following conclusions were made:
- 1.
- Through regression analysis, the change law of average drying rate with temperature and relative humidity was studied. The results showed that the influence of temperature on the average drying rate exhibited an approximate quadratic curve distribution, while the influence of relative humidity on the average drying rate exhibited an almost linear distribution. The influence of temperature and relative humidity on the average drying rate can be described by . The maximum relative error calculated using the formula was 7.6%.
- 2.
- Combining the Midilli model and coupling its k value to the average drying rate, a two-stage model based on the average drying rate was proposed. After fitting the relationships of different stages, a maximum error of 10.9% was obtained. The calculation method of sludge drying determined in this study has good application value.
Author Contributions
Experimental test, Z.W.; writing—original draft preparation, L.X.; writing—review and editing, D.L.; acquisition and analysis of data, Q.Z.; analysis of data, A.H.; supervision, R.W.; supervision, Y.C. All authors have read and agreed to the published version of the manuscript.
Funding
This research was funded by National Natural Science Foundation of China, grant number 11572269, The Project of Education Department in Sichuan, grant number 17ZA0405, 17ZB0439, and Open Fund of Key Laboratory of Icing and Anti/De-icing, grant number IADL20190311.
Institutional Review Board Statement
Not applicable.
Informed Consent Statement
Not applicable.
Data Availability Statement
Data is contained within the article.
Conflicts of Interest
The authors declare no conflict of interest.
References
- Couillard, D.; Zhu, S. Bacterial leaching of heavy metals from sewage sludge for agricultural application. Water Air Soil Pollut. 1992, 63, 67–80. [Google Scholar] [CrossRef]
- Yu, W.; Wan, Y.; Wang, Y.; Zhu, Y.; Yang, J. Enhancing waste activated sludge dewaterability by reducing interaction energy of sludge flocs. Environ. Res. 2020, 196, 110328. [Google Scholar] [CrossRef]
- Wei, Y.; Zhou, X.; Zhou, L.; Liu, C.; Liu, J. Electro-dewatering of sewage sludge: Effect of near-anode sludge modification with different dosages of calcium oxide. Environ. Res. 2020, 186, 109487. [Google Scholar] [CrossRef] [PubMed]
- Otero, M.; Calvo, L.F.; Gil, M.V.; Garcia, A.I.; Moran, A. Co-combustion of different sewage sludge and coal: A non-isothermal thermogravimetric kinetic analysis. Bioresour. Technol. 2008, 99, 6311–6319. [Google Scholar] [CrossRef]
- Keey, R.B. Drying principles and practice. In SERBIULA (Sistema Librum 2.0); Pergamon Press: Oxford, UK, 1972. [Google Scholar]
- Léonard, A.; Blacher, S.; Marchot, P.; Pirard, J.P.; Crine, M. Convective Drying of Wastewater Sludges: Influence of Air Temperature, Superficial Velocity, and Humidity on the Kinetics. Dry. Technol. 2003, 23, 1667–1679. [Google Scholar] [CrossRef]
- Sherwood, T.K. The Drying of Solids—I. Ind. Eng. Chem. 2002, 21, 12–16. [Google Scholar] [CrossRef]
- Coackley, P.; Allos, R. The drying characteristics of some sewage sludges. J. Proc. Inst. of Sew. Purif. 1962, 6, 557–564. [Google Scholar]
- Wei, L.; Wang, X.; Li, R.; Pan, S. Experimental research and regression analysis for isothermal drying characteristics of dewatered sewage sludge. Acta Sci. Circumstantiae 2011, 31, 123–129. [Google Scholar]
- Bennamoun, L.; Fraikin, L.; Léonard, A. Modeling and Simulation of Heat and Mass Transfer During Convective Drying of Wastewater Sludge with Introduction of Shrinkage Phenomena. Dry. Technol. 2014, 32, 13–22. [Google Scholar] [CrossRef]
- Vaxelaire, J.; Cézac, P. Moisture distribution in activated sludges: A review. Water Res. 2004, 38, 2215–2230. [Google Scholar] [CrossRef]
- Deng, W.Y.; Yan, J.H.; Li, X.D.; Fei, W.; Lu, S.Y.; Yong, C.; Cen, K.F. Measurement and simulation of the contact drying of sewage sludge in a Nara-type paddle dryer. Chem. Eng. Sci. 2009, 64, 5117–5124. [Google Scholar] [CrossRef]
- Midilli, A.; Kucuk, H.; Yapar, Z. A new model for single-layer drying. Dry. Technol. 2002, 20, 1503–1513. [Google Scholar] [CrossRef]
- McMinn, W.A.M. Thin-layer modelling of the convective, microwave, microwave-convective and microwave-vacuum drying of lactose powder—Science Direct. J. Food Eng. 2006, 72, 113–123. [Google Scholar] [CrossRef]
- Ghazanfari, A.; Emami, S.; Tabil, L.G.; Panigrahi, S. Thin-Layer Drying of Flax Fiber: II. Modeling Drying Process Using Semi-Theoretical and Empirical Models. Dry. Technol. 2006, 24, 1637–1642. [Google Scholar] [CrossRef]
- Corzo, O.; Bracho, N.; Pereira, A.; Vásquez, A. Weibull distribution for modeling air drying of coroba slices. LWT-Food Sci. Technol. 2008, 41, 2023–2028. [Google Scholar] [CrossRef]
- Reyes, A.; Eckholt, M.; Troncoso, F.; Efremov, G. Drying Kinetics of Sludge from a Wastewater Treatment Plant. Dry. Technol. 2004, 22, 2135–2150. [Google Scholar] [CrossRef]
- Kai, L.; Xiao-Qian, M.A.; Han-Min, X. Experiment and kinetics model analysis on thin layer drying of paper mill sludge. J. Fuel Chem. Technol. 2011, 39, 149–154. [Google Scholar]
- Yue, L.; Wu, Z.; Nie, H. Thin layer drying characteristics and kinetics model of municipal sludge and sawdust mixture. Dry. Technol. Equip. 2013, 11, 51. [Google Scholar]
- Guo, J.; Zheng, L.; Li, Z. Microwave drying behavior, energy consumption, and mathematical modeling of sewage sludge in a novel pilot-scale microwave drying system. Sci. Total Environ. 2021, 777, 146109. [Google Scholar] [CrossRef]
- Mbegbu, N.N.; Nwajinka, C.O.; Amaefule, D.O. Thin layer drying models and characteristics of scent leaves (Ocimum gratissimum) and lemon basil leaves (Ocimum africanum). Heliyon 2021, 7, e05945. [Google Scholar] [CrossRef]
- Toğrul, İ.T.; Pehlivan, D. Mathematical modelling of solar drying of apricots in thin layers. J. Food Eng. 2002, 55, 209–216. [Google Scholar] [CrossRef]
- Falade, K.O.; Abbo, E.S. Air-drying and rehydration characteristics of date palm (Phoenix dactylifera L.) fruits. J. Food Eng. 2007, 79, 724–730. [Google Scholar] [CrossRef]
- Doymaz, B. Drying kinetics, rehydration and colour characteristics of convective hot-air drying of carrot slices. Heat Mass Transf. 2016, 53, 25–35. [Google Scholar] [CrossRef]
- Ramachandran, R.P.; Paliwal, J.; Cenkowski, S. Modeling of effective moisture diffusivity and activation energy of distillers’ spent grain pellets with solubles during superheated steam drying. Biomass Bioenergy 2017, 116, 39–48. [Google Scholar] [CrossRef]
- Henderson, S.M.; Pabis, S. Grain drying theory, II. Temperature effects on drying coefficients. J. Agric. Eng. Res. 1961, 44, 1111–1122. [Google Scholar]
- Pirone, B.N.; Michelis, A.D.; Salvatori, D.M. Pretreatments Effect in Drying Behaviour and Colour of Mature and Immature ‘Napolitana’ Sweet Cherries. Food Bioprocess Technol. 2014, 7, 1640–1655. [Google Scholar] [CrossRef]
- Bi, J.; Yang, A.; Liu, X.; Wu, X.; Chen, Q.; Wang, Q.; Lv, J.; Wang, X. Effects of pretreatments on explosion puffing drying kinetics of apple chips. LWT-Food Sci. Technol. 2015, 60, 1136–1142. [Google Scholar] [CrossRef]
Figure 1.
Schematic of the experimental device (1. environmental testing instrument; 2. drying chamber; 3. fan; 4. main power panel; 5. temperature and humidity test sensor; 6. water tank; 7. pull pressure sensor; 8. sludge; 9. lead hole; 10. digital signal weighing communication module; 11. laptop).

Figure 2.
Pictures of experimental device.

Figure 3.
Sludge MR versus drying time for different relative humidities: (a) 30%, (b) 40%, (c) 50%, and (d) 60%.
Figure 3.
Sludge MR versus drying time for different relative humidities: (a) 30%, (b) 40%, (c) 50%, and (d) 60%.

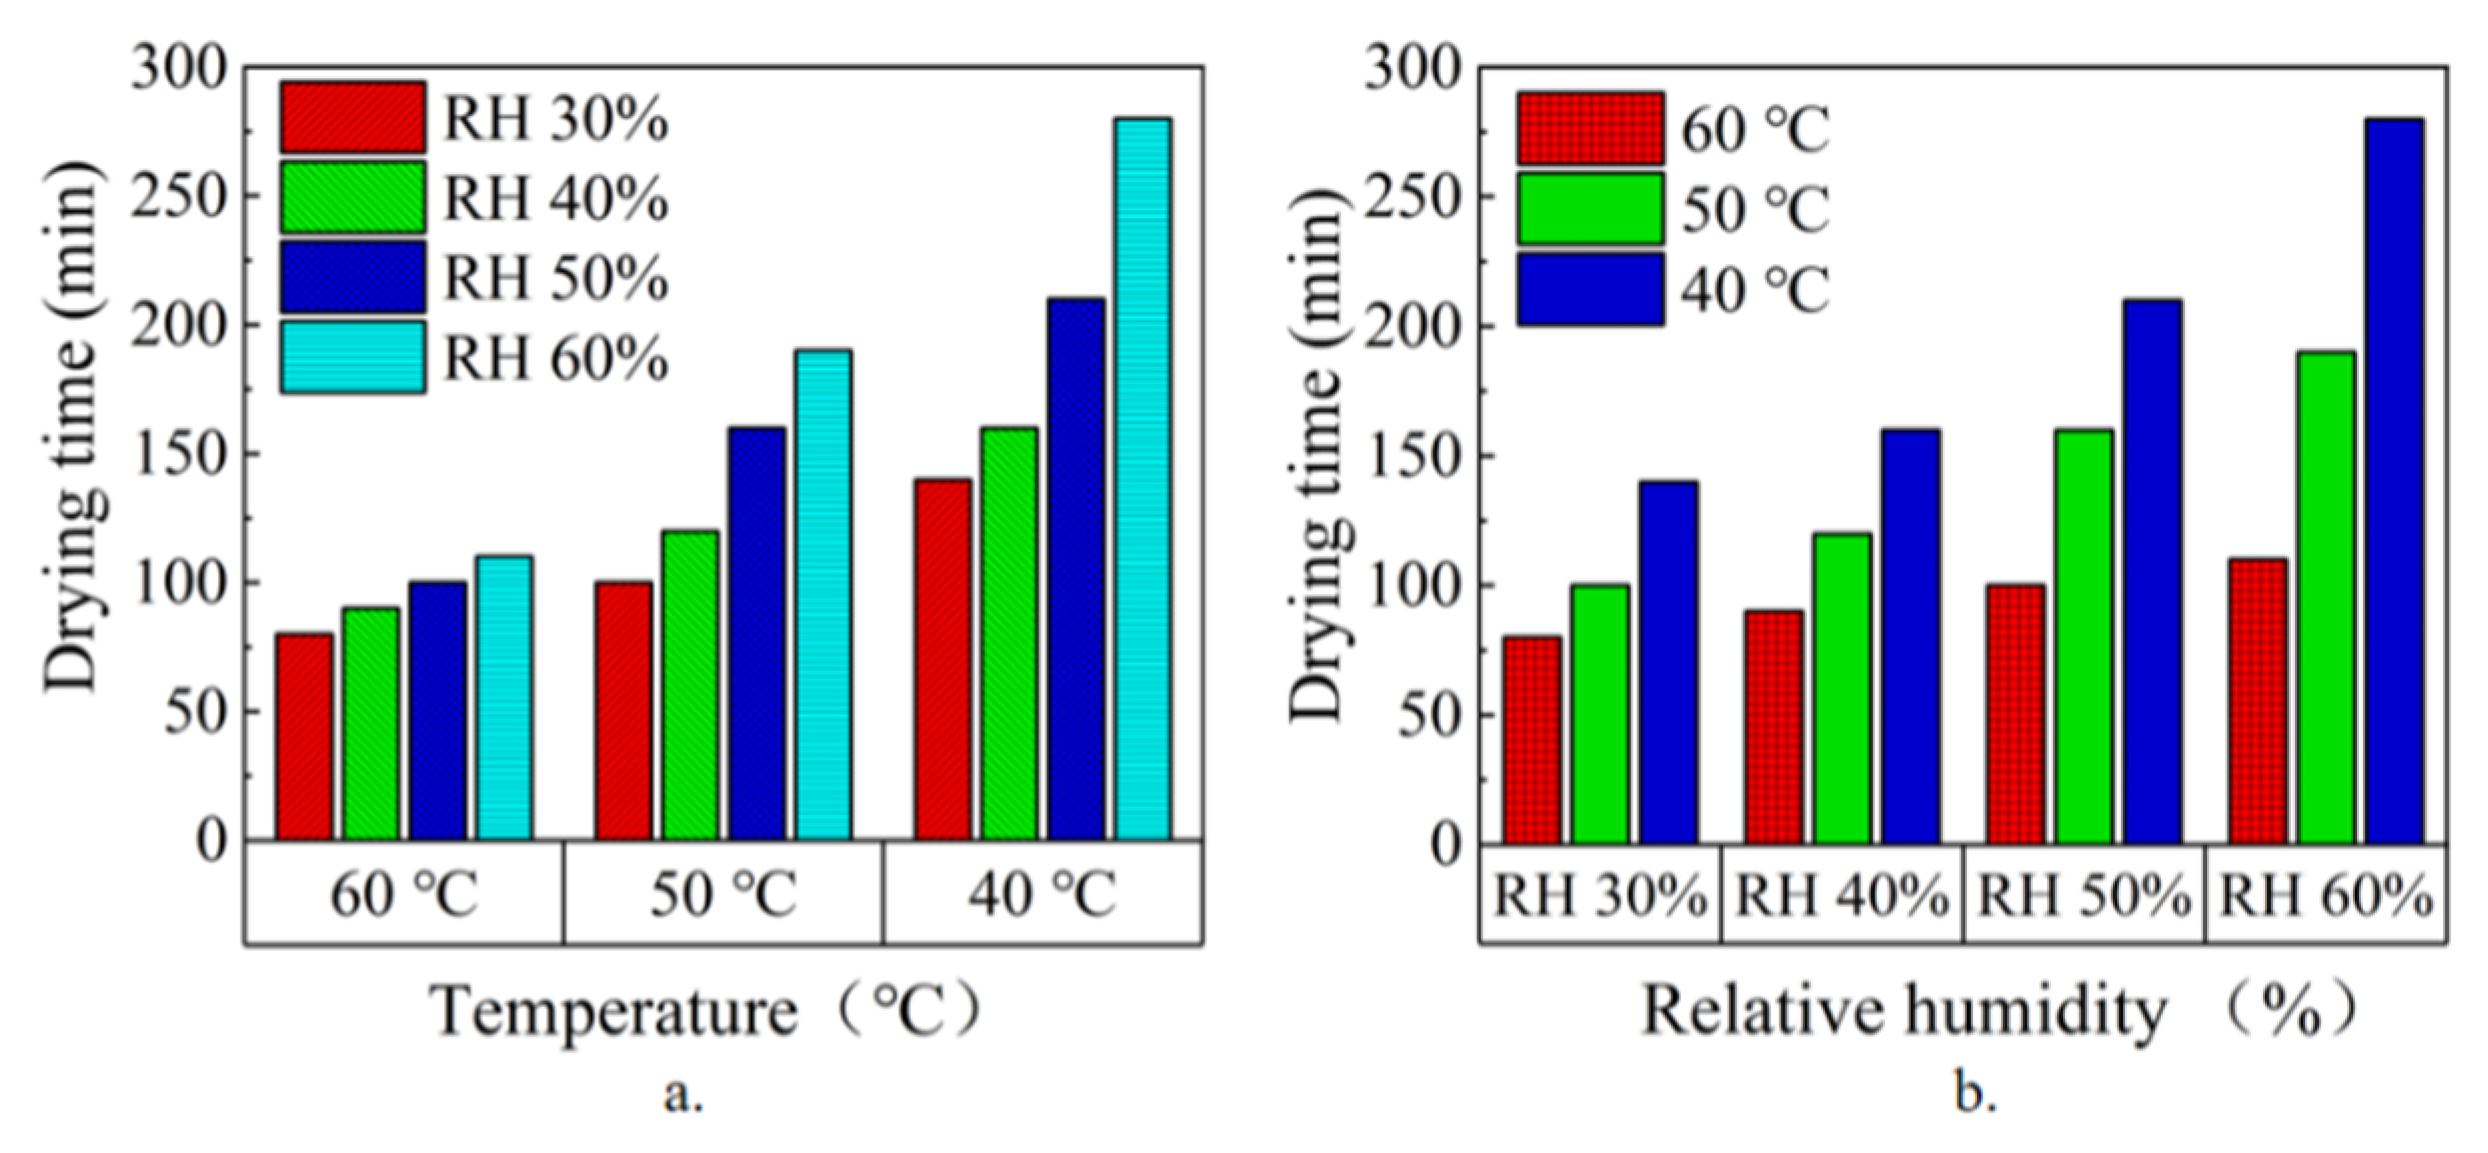
Figure 4.
Plot of drying time versus (a) temperature and (b) relative humidity.

Figure 5.
Sludge drying ratio versus the MR under different temperatures at a relative humidity of (a) 30%, (b) 40%, (c) 50%, and (d) 60%.
Figure 5.
Sludge drying ratio versus the MR under different temperatures at a relative humidity of (a) 30%, (b) 40%, (c) 50%, and (d) 60%.

Figure 6.
Average drying rate versus (a) temperature and (b) relative humidity.

Figure 7.
Comparison of the average drying rate predicted and experimental.

Figure 8.
Relationship between the modelled and experimental MR errors under different conditions (a) the first stage (b) the second stage over time.
Figure 8.
Relationship between the modelled and experimental MR errors under different conditions (a) the first stage (b) the second stage over time.


Table 1.
Commonly used mathematical models of drying.
| Model | Evaluation | References |
|---|---|---|
| Henderson and Pabis | [26] | |
| Midilli et al. | [13] | |
| Weibull | [16] | |
| Logarithmic | [27] | |
| Parabolic | [28] |
Note: MR is the dimensionless sludge movement content ratio, t is the drying time (min), and k, n, a, and c are related parameters.
Table 2.
Statistical analysis data of the thin-layer drying model for sludge drying.
| Model | R2 | χ2 | RMSE |
|---|---|---|---|
| Henderson and Pabis | 0.9776 | 0.0181 | 0.0451 |
| Logarithmic | 0.9931 | 0.0033 | 0.0238 |
| Midilli et al. | 0.9983 | 0.0006 | 0.0118 |
| Parabolic | 0.9979 | 0.0011 | 0.0131 |
| Weibull | 0.9975 | 0.0020 | 0.0153 |
Table 3.
Statistical analysis data of the Midilli model for sludge drying.
| T (°C) | RH (%) | Coefficient | R2 | χ2 | RMSE | Number of Experimental Results |
|---|---|---|---|---|---|---|
| 40 | 30 | a = 0.984 k = 0.00385 n = 1.3747 b = −9.7391 × 10⁻⁵ | 0.9975 | 0.0008 | 0.0142 | 15 |
| 40 | a = 0.97226 k = 0.00135 n = 1.54124 b = −1.0484 × 10⁻⁴ | 0.9964 | 0.0013 | 0.0186 | 17 | |
| 50 | a = 0.98104 k = 0.00126 n = 1.42174 b = −3.35016 × 10⁻⁴ | 0.9970 | 0.0014 | 0.0195 | 22 | |
| 60 | a = 0.9912 k = 0.00107 n = 1.3721 b = −2.33806 × 10⁻⁴ | 0.9991 | 0.0005 | 0.0119 | 29 | |
| 50 | 30 | a = 0.991 k = 0.00688 n = 1.3578 b = 2.04084 × 10⁻⁴ | 0.9991 | 0.0002 | 0.0079 | 11 |
| 40 | a = 0.99141 k = 0.00488 n = 1.37061 b = 1.4504 × 10⁻⁴ | 0.9989 | 0.0003 | 0.0094 | 13 | |
| 50 | a = 0.98938 k = 0.00392 n = 1.32722 b = − 2.75094 × 10⁻⁵ | 0.9979 | 0.0007475 | 0.0141 | 17 | |
| 60 | a = 0.97369 k = 0.00139 n = 1.49661 b = 2.13556 × 10⁻⁵ | 0.9975 | 0.0011 | 0.0174 | 20 | |
| 60 | 30 | a = 0.99558 k = 0.01148 n = 1.2222 b = − 8.28901 × 10⁻⁴ | 0.9985 | 0.0002 | 0.0077 | 9 |
| 40 | a = 0.99492 k = 0.00985 n = 1.24047 b = −4.78734 × 10⁻⁴ | 0.9990 | 0.0002 | 0.0069 | 10 | |
| 50 | a = 0.99422 k = 0.00795 n = 1.28398 b = −2.15831 × 10⁻⁴ | 0.9991 | 0.0002 | 0.0070 | 11 | |
| 60 | a = 0.995 k = 0.0078 n = 1.26838 b = −1.5784 × 10⁻⁴ | 0.9993 | 0.0002 | 0.0065 | 12 |
Table 4.
Statistical analysis data of the first stage of the new model for sludge drying.
| T (°C) | RH (%) | Coefficient | R2 | χ2 | RMSE | Number of Experimental Results |
|---|---|---|---|---|---|---|
| 40 | 30 | = 0.01321 n = 1.201 a = 0.01 m = 1 | 0.9981 | 0.0005 | 0.0123 | 9 |
| 40 | = 0.010794 n = 1.201 a = 0.01 m = 1 | 0.9932 | 0.0020 | 0.0232 | 11 | |
| 50 | = 0.008378 n = 1.201 a = 0.01 m = 1 | 0.9961 | 0.0013 | 0.0164 | 15 | |
| 60 | = 0.005962 n = 1.201 a = 0.01 m = 1 | 0.9983 | 0.0008 | 0.0109 | 20 | |
| 50 | 30 | = 0.016747 n = 1.201 a = 0.01 m = 1 | 0.9987 | 0.0003 | 0.0108 | 7 |
| 40 | = 0.014331 n = 1.201 a = 0.01 m = 1 | 0.999 | 0.0002 | 0.0089 | 8 | |
| 50 | = 0.011915 n = 1.201 a = 0.01 m = 1 | 0.9995 | 0.0001 | 0.0057 | 10 | |
| 60 | = 0.009499 n = 1.201 a = 0.01 m = 1 | 0.9970 | 0.0008 | 0.0145 | 12 | |
| 60 | 30 | = 0.022286 n = 1.201 a = 0.01 m = 1 | 0.9987 | 0.0002 | 0.0106 | 6 |
| 40 | = 0.01987 n = 1.201 a = 0.01 m = 1 | 0.9985 | 0.0003 | 0.0117 | 7 | |
| 50 | = 0.017454 n = 1.201 a = 0.01 m = 1 | 0.9988 | 0.0002 | 0.0103 | 7 | |
| 60 | = 0.015038 n = 1.201 a = 0.01 m = 1 | 0.9992 | 0.0002 | 0.0085 | 8 |
Table 5.
Statistical analysis data of the second stage of the new model for sludge drying.
| T (°C) | RH (%) | Coefficient | R2 | χ2 | RMSE | Number of Experimental Results |
|---|---|---|---|---|---|---|
| 40 | 30 | = 0.01321 n = 1.201, a = 0.01, m = 1.12 b = 2.431 × 10⁻⁵ c = −0.1236 | 0.9746 | 0.0003 | 0.0148 | 6 |
| 40 | = 0.010794 n = 1.201, a = 0.01, m = 1.12 b = 2.431 × 10⁻⁵, c = −0.1236 | 0.9807 | 0.0001 | 0.0090 | 6 | |
| 50 | = 0.008378 n = 1.201, a = 0.01, m = 1.12 b = 2.431 × 10⁻⁵, c = −0.1236 | 0.9793 | 0.0002 | 0.0111 | 7 | |
| 60 | = 0.005962 n = 1.201, a = 0.01, m = 1.12 b = 2.431 × 10⁻⁵, c = −0.1236 | 0.9912 | 0.0001 | 0.0047 | 9 | |
| 50 | 30 | = 0.016747 n = 1.201, a = 0.01, m = 1.12 b = 2.431 × 10⁻⁵, c = −0.1236 | 0.9913 | 0.0001 | 0.0040 | 4 |
| 40 | = 0.014331 n = 1.201, a = 0.01, m = 1.12 b = 2.431 × 10⁻⁵, c = −0.1236 | 0.9938 | 0.0002 | 0.0037 | 5 | |
| 50 | = 0.011915 n = 1.201, a = 0.01, m = 1.12 b = 2.431 × 10⁻⁵, c = −0.1236 | 0.9636 | 0.0002 | 0.0091 | 7 | |
| 60 | = 0.009499 n = 1.201, a = 0.01, m = 1.12 b = 2.431 × 10⁻⁵, c = −0.1236 | 0.9692 | 0.0001 | 0.0072 | 8 | |
| 60 | 30 | = 0.022286 n = 1.201, a = 0.01, m = 1.12 b = 2.431 × 10⁻⁵, c = −0.1236 | 0.9732 | 0.0005 | 0.0223 | 3 |
| 40 | = 0.01987 n = 1.201, a = 0.01, m = 1.12 b = 2.431 × 10⁻⁵, c = −0.1236 | 0.989 | 0.0004 | 0.0188 | 3 | |
| 50 | = 0.017454 n = 1.201, a = 0.01, m = 1.12 b = 2.431 × 10⁻⁵, c = −0.1236 | 0.9966 | 0.0001 | 0.0073 | 4 | |
| 60 | = 0.015038 n = 1.201, a = 0.01, m = 1.12 b = 2.431 × 10⁻⁵, c = −0.1236 | 0.9941 | 0.0001 | 0.0075 | 4 |
Publisher’s Note: MDPI stays neutral with regard to jurisdictional claims in published maps and institutional affiliations. |
© 2021 by the authors. Licensee MDPI, Basel, Switzerland. This article is an open access article distributed under the terms and conditions of the Creative Commons Attribution (CC BY) license (https://creativecommons.org/licenses/by/4.0/).
Share and Cite
MDPI and ACS Style
Wang, Z.; Xu, L.; Liu, D.; Zhang, Q.; Hu, A.; Wang, R.; Chen, Y. Effects of Air Temperature and Humidity on the Kinetics of Sludge Drying at Low Temperatures. Energies 2021, 14, 7722. https://0-doi-org.brum.beds.ac.uk/10.3390/en14227722
AMA Style
Wang Z, Xu L, Liu D, Zhang Q, Hu A, Wang R, Chen Y. Effects of Air Temperature and Humidity on the Kinetics of Sludge Drying at Low Temperatures. Energies. 2021; 14(22):7722. https://0-doi-org.brum.beds.ac.uk/10.3390/en14227722
Chicago/Turabian StyleWang, Zhenyu, Lin Xu, Dong Liu, Qing Zhang, Anjie Hu, Ruheng Wang, and Yongcan Chen. 2021. "Effects of Air Temperature and Humidity on the Kinetics of Sludge Drying at Low Temperatures" Energies 14, no. 22: 7722. https://0-doi-org.brum.beds.ac.uk/10.3390/en14227722
Note that from the first issue of 2016, this journal uses article numbers instead of page numbers. See further details here.