
Experimental Quantification of the Lateral Mixing of Binary Solids in Bubbling Fluidized Beds


Energy Research Institute, Qilu University of Technology (Shandong Academy of Sciences), Jinan 250014, China
*
Author to whom correspondence should be addressed.
Energies 2021, 14(22), 7796; https://0-doi-org.brum.beds.ac.uk/10.3390/en14227796
Submission received: 30 October 2021
/
Revised: 12 November 2021
/
Accepted: 15 November 2021
/
Published: 22 November 2021
(This article belongs to the Topic Solid Waste Management)
Abstract
:A novel experimental method for the lateral mixing of binary solids in bubbling fluidized beds was developed based on the capacitance probe technique. The evolutions of local mixing ratios in a fluidized bed which can be assumed as one mixing cell were analyzed in detail. The solids mixing within one mixing cell was resolved and the effect of convection and diffusion mechanism on lateral mixing was evaluated individually. The results show that at lower part of the fluidized bed, convection plays a more important role in the mixing process near the wall; meanwhile, diffusion is very important for the mixing around the center line. This is opposite with that at the higher part. A lateral micro dispersion coefficient was proposed to characterize the lateral mixing within the mixing cell and the value is generally between 0.005 and 0.025 m/s. A new mixing index was proposed to evaluate the lateral mixing quality of binary solids. It was found that at the lower part of the fluidized bed, the best mixing is acquired at the half radius, whereas mixing at the center line is the worst. At the higher part, solid mixing is better when increasing the distance from the wall. The influences of gas velocity and static bed on the lateral mixing were also discussed from a microscopic perspective.
1. Introduction
Fluidized beds have been very popular in many chemical industries because of the advantage of excellent heat and mass transfer efficiency [1,2,3]. In many industrial processes, for example, clean utilization of coal [4] and gasification of biomass [5], the treatment of two or more types of particles differing in density and/or diameter is needed. The lateral mixing of dissimilar particles is crucial to the distribution of volatiles over the cross section and its importance has been clarified by many researchers [6,7]. In addition, an increase in the lateral mixing of the bed materials creates a more homogeneous temperature field across the cross-section of the bed. However, compared with solids mixing in the vertical direction, solids mixing in the lateral direction is at least one order of magnitude slower and is usually the limiting process that requires closer investigation [6].
There has been an increasing interest in the lateral mixing of particles in fluidized beds in the past two decades. It has been confirmed that rising bubble is the main driving force of lateral mixing. Three main mechanisms for the lateral mixing of particles have been identified [8,9]: (1) the eruptions of bubbles at the bed surface eject particles into the splash zone with a certain horizontal velocity; (2) emulsion solids drift in a downward direction around rising bubbles to fill the gap created by the bubbles; (3) the dragging of particles from surrounding emulsion solids into the wake behind the rising bubbles. In the literature, the lateral mixing of solids was commonly characterized using the dispersive approach which was proposed by Rowe et al. [10] and has been experimentally confirmed in many studies [11,12,13,14,15]. In the dispersive approach, the fluidized bed is divided into many mixing cells in the lateral direction. The lateral mixing process was simplified by lumping bubble-induced convection and particle diffusion in one effective dispersion coefficient, D, which is used in a diffusion-like model to describe the solids dispersion [11].
Many experimental methods have been developed to derive the distribution of tracer particles in fluidized beds and fit the lateral mixing process by the diffusion equation to determine the lateral dispersion coefficient. Castilla et al. [16] proposed a novel thermal experimental method which utilizes the finite volume analysis of the temperature field over the bed surface to determine the solids dispersion coefficient in a bubbling fluidized bed. The dispersion coefficients were in the order of 10−3 m2/s. The effects of gas velocity, particle size on the mixing process were discussed and it was found that the lateral dispersion coefficient decreased when increasing the particle size and increased when increasing the fluidization velocity. Sette et al. [15] utilized an indirect particle tracing method using magnetic separation to investigate the influences of different parameters on the lateral dispersion coefficient in a bubbling fluidized bed. The dispersion coefficients were in the order of 10−2 m2/s, which were two orders of magnitude greater than the reported values in fluidized beds with similar operating conditions conducted by Shi and Fan [17] and Berruti et al. [18]. Sette et al. [15] also proposed a bubble mixing factor to elucidate the influence of bubble flow on solids mixing but found that the bubble mixing factor did not show a clear dependence on the bed height. Liu and Chen [19] developed a novel sampling approach based on the bed frozen method to determine the lateral dispersion coefficient in a 3D fluidized bed. The lateral dispersion coefficient was 0.0005 m2/s and agreed well with other reported values for lab-scale fluidized beds. Niklasson et al. [20] combined drying and devolatilization of the fuel and cross-sectional measurements of the water concentration above the bottom bed, from which the lateral dispersion coefficient of fuel particles is determined. They reported a lateral dispersion coefficient of 0.1 m2/s in a large fluidized bed, which was two orders of magnitude higher than the dispersion coefficient in fluidized beds with similar size reported by Olsson et al. [11]. Other researchers also applied magnetic resonance imaging method [21], thermal tracing method [22], subliming tracing method [23], emission tracing method [24] to characterize the lateral mixing of solids in fluidized beds.
However, it is quite confusing that the lateral dispersion coefficient reported in the literature differed by up to four orders of magnitude [14,15,16,17,18,19,20,21,22,23,24,25,26]. Even for fluidized beds operated in similar conditions, the difference between reported lateral dispersion coefficients may be up to two orders of magnitude. The lateral dispersion coefficient is influenced by many operating conditions such as bed size, gas velocity, and particle property. However, researchers also found that the lateral dispersion coefficient may change significantly with the experimental techniques applied [25,26,27,28]. In addition, former research on lateral mixing of solids in fluidized beds mainly fit the lateral mixing process by the Fickian-type diffusion equation to derive the lateral dispersion coefficient. This type of research only describes the macro lateral mixing process since the effects of convection and diffusion are lumped into the single dispersion coefficient parameter, D. The main shortage of this type of research is that the mixing process within the mixing cell cannot be resolved [15]. It has been pointed out that quantifying lateral mixing through an effective dispersion coefficient yields no information about the physical mechanisms governing the mixing process [11]. The understanding about lateral mixing mechanism of solids in bubbling fluidized beds is still not clear and further investigations are needed.
The research on the lateral mixing in bubbling fluidized beds is limited by the measurement method for solids mixing. Here, the disadvantages of existing measurement methods for solids mixing are discussed. In the bed frozen method, the measurement would interrupt the fluidization and it is difficult to evaluate the overall mixing process of solids. Another disadvantage of the bed frozen method is that a certain deal of uncertainty may be caused because of the lateral rearrangements of particles during the collapsing process [29]. Common particle tracing methods, namely color tracing, phosphorescent tracing and thermal tracing, are inapplicable in thick bubbling fluidized beds because tracer particles are hidden by bed materials and cannot be detected by the imaging system. These particle tracing methods based on radioactive techniques, such as neutron tracing, X- or γ-rays tracing, magnetic resonance imaging, and PEPT, are complex, expensive and have high safety requirements. In addition, because many factors such as particle size, density, shape and surface properties can be the dominant causes for mixing or segregation, any marking of particles for quantitative measurement may severely influence the mixing parameter to be measured [30]. An appropriate experimental method for lateral solids mixing in bubbling fluidized beds is still lacking. It is a more challenging task to measure the mixing parameters within bubbling fluidized beds in the whole mixing process.
A novel experimental method for the lateral mixing of solids in bubbling fluidized beds was developed in this article. This method utilizes the capacitance probe technique to acquire the local mixing ratio at different lateral positions according to the effective permittivity of binary mixtures. In the conventional utilizations of capacitance probe technique [31,32,33], the bed materials were composed of only one type of particle and the local volume fraction of solids was measured. In this paper, binary solids were used in the fluidized bed and the capacitance probe technique was employed to measure the mixing ratio. As mentioned above, the “macro mixing” of solids in fluidized bed was characterized in former research. Since the measuring field of the capacitance probe sensor is smaller than the sampling volume used in these existing measurement methods for solids mixing by one or two orders of magnitude [34,35], the mixing ratio measured by the novel method is referred to as “micro mixing ratio” in this article.
The focus of present research is the lateral mixing process of solids within a single mixing cell. The aim was to evaluate the importance of the convection/diffusion mechanism on lateral mixing and quantify the dispersion process within the mixing cell. Towards this goal, the aspect ratio of the fluidized bed was set to unity and the bed assumed as one mixing cell. Binary solids with equal size but different densities and belonging to Geldart D type were used. The effects of bed height, gas velocity and static bed on the lateral mixing of binary solids were studied.
The discussion of lateral mixing of binary solids is organized as follows. Firstly, the lateral mixing process is analyzed in detail by examining the evolutions of micro mixing ratios with time for different lateral positions of the fluidized bed. The effect of convection/diffusion on lateral mixing is evaluated by the fluctuation property of micro mixing ratio. Secondly, a micro dispersion coefficient for the lateral mixing within the mixing cell is proposed and its relationship between the convection/diffusion mechanisms is analyzed. Finally, a new mixing index is proposed to evaluate the micro mixing extent and the lateral distributions of mixing index are acquired to determine the lateral mixing quality.
2. Methodology of Measuring the Micro Mixing Ratio of Binary Mixtures
2.1. Measuring Principle of the Capacitance Probe Method in Fluidized Beds Dealing with Binary Mixtures
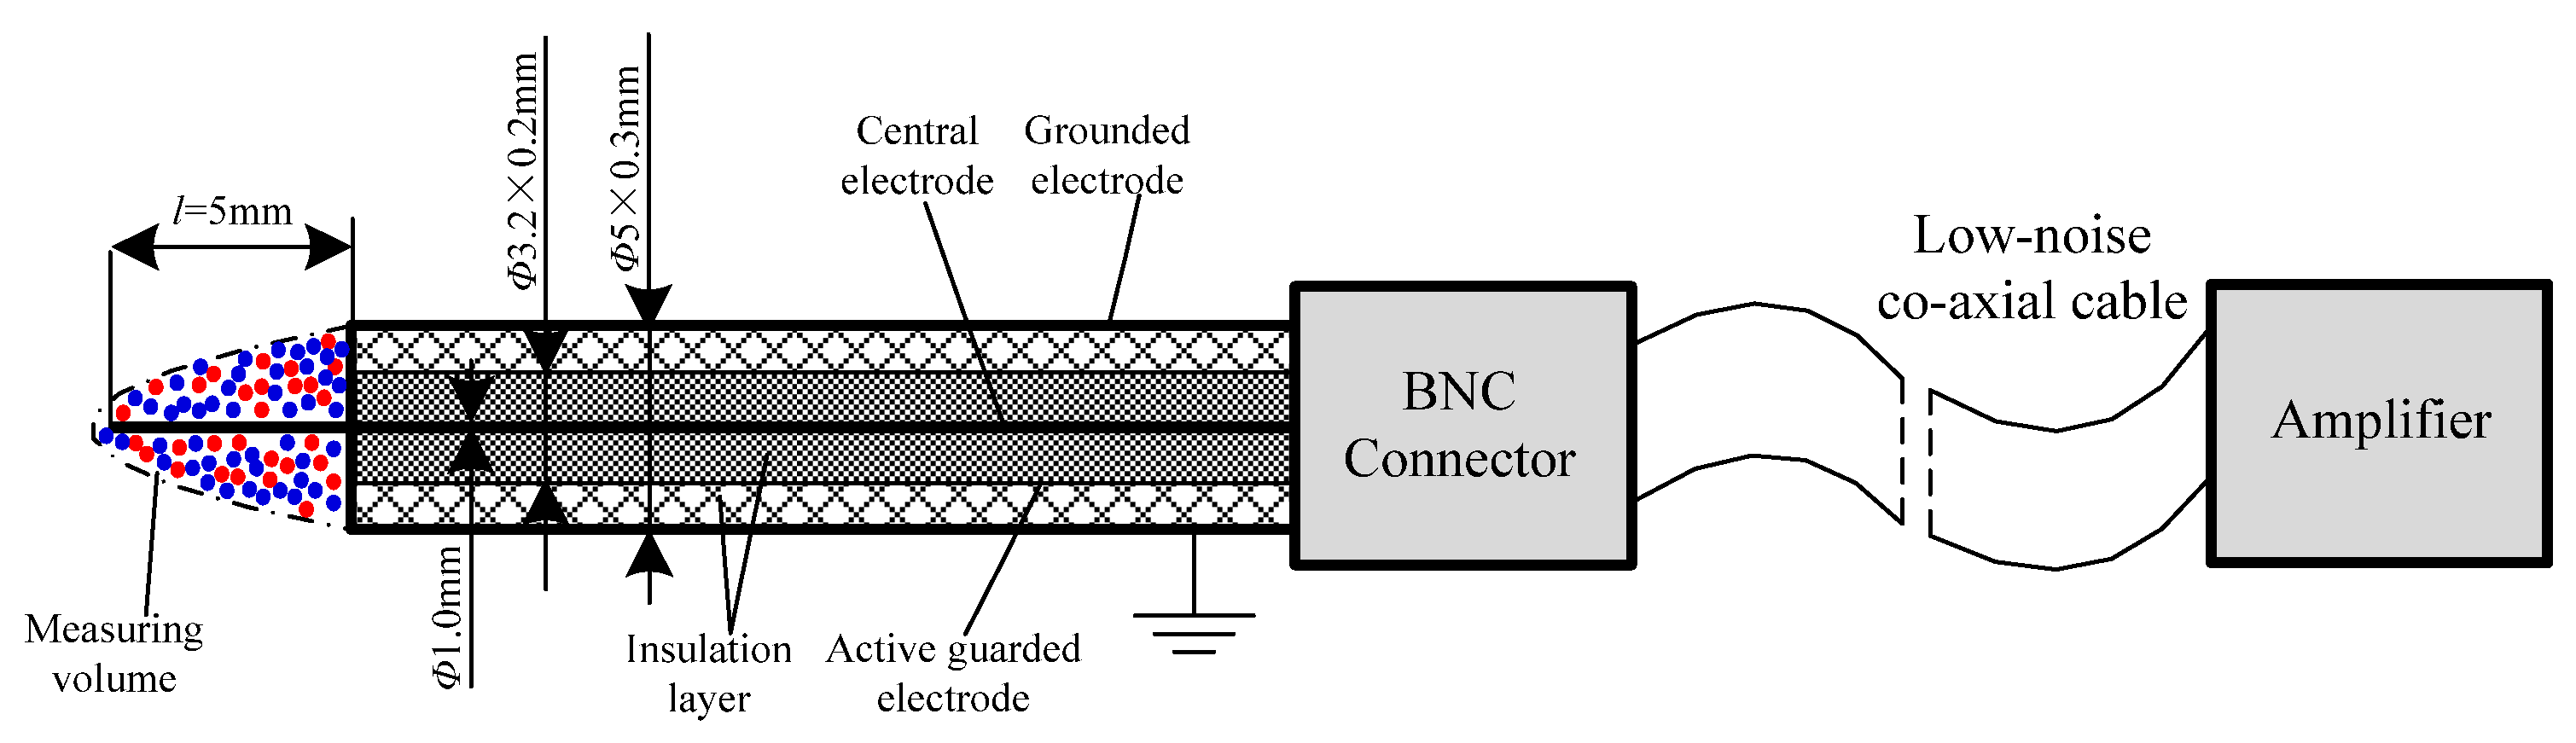
Figure 1 depicts the structure of the capacitance probe measurement system. The capacitance probe sensor consists of three electrodes from the inside to the outside, namely, sensing electrode, active guarded electrode and grounded shell. The capacitance probe sensor is connected to a customized amplifier (MTI Instruments, AS–500 SP) through a standard BNC connector and a low-noise co-axial cable. The electric potential of the active guarded electrode is kept the same as the sensing electrode. In this way, the stray capacitance caused by the coaxial cable can be eliminated. The measuring volume is the conical space made up of the protruding part of sensing electrode and grounded shell as shown in Figure 1.
When the capacitance probe is used in fluidized beds dealing with binary solids, the following equation is derived:
where Fj, Ff, Fa is the volume fraction of dense particles, light particles and air in the measuring field of the capacitance probe sensor.
Fj + Ff + Fa = 1
The output signal of capacitance probe system will change because of the presence of particles in the sensing field. The relationship between the output signal of capacitance probe system and particle concentration has been studied in the literature and the research results were applied in present research. Wiesendorf and Werther [31] found that in gas-solids suspensions, the output signal of capacitance probe system changes linearly with the volume fraction of particles in the sensing field of probe sensor. Therefore, we assume that the output signal changes linearly with the volume fraction of components in the sensing field of probe sensor. Based on this, Equation (2) is derived:
where v is the output signal of the capacitance probe measurement system; va is the output signal when the capacitance probe is exposed in air; vj or vf is the output signal assuming that the sensing field is filled with pure substance of dense or light particles. The vj and vf are not measured values in present research. It is worth noting that vj is fixed value for a given kind of dense particles. This is same for vf. Combining Equations (1) and (2), the following equation is derived:
in which
Fjvj + Ffvf + Fava = v
Because the particles in bubbling fluidized beds are mainly in the emulsion phase, only when the capacitance probe sensor is immersed in emulsion phase, the output electric signal can be processed to derive the volume fraction of dense particles according to Equation (3). Firstly, the theoretical calibration constants k and b in Equation (3) are predicted from Equations (4) and (5). The measuring instrument (MTI Instrument AS–500) used in present research yields the output electric signal based on the capacitance of probe sensor according to
where Kamp is the amplification factor of the measuring instrument and the value is 2.5 pF·V; C is the capacitance of the probe sensor. The capacitance of probe sensor is calculated according to the base capacitance C0 (capacitance when probe sensor is in air):
where Ke is the relative permittivity of mixtures in the measuring field of capacitance probe sensor.
The physical properties of particles used in present research are given in Table 1. The particles are classified as Geldart D type particles. According to the equations given above, vj and vf in Equation (4) can be predicted by dividing va by the relative permittivity of dense particles and light particles respectively. When the capacitance probe sensor is in air, the output signal va is 9.8 v. Thus, the vj and vf in Equation (4) are predicted to be 0.93 v and 2.58 v respectively, from which k is calculated and the value is −0.606. The Fa of emulsion phase should be determined before predicting b using Equation (5). According to the “two-phase flow” theory [36], in bubbling fluidized beds dealing with Geldart B or D type particles, Fa of emulsion phase is kept the same with the minimum fluidization state. Therefore, Fa of emulsion phase is determined in minimum fluidization by drainage method and the value is 0.43. Thus, b is calculated, and the value is 1.66. Given the calibration constants k and b, the volume fraction of dense particles in emulsion can be predicted theoretically according to Equation (3).
In addition, the actual volume fractions of dense particles and output signals are fitted by Equation (3) to derive the calibration constants k and b. The dense particles are fully mixed with light particles according to a preset volume fraction and then the mixtures are maintained at minimum fluidization. The output signal of the capacitance probe system is recorded. The fitted calibration constants k and b from experiments is −0.343 and 1.16 respectively. The relative errors between the fitted k, b from Equation (3) with the predicted ones from Equations (4) and (5) are 43.4%, 30.1% respectively. When using Equations (4) and (5), the parameters including Fa, relative permittivity of dense and light particles must be predicted first which may be different from the actual values. Therefore, errors of the theoretical k, b predicted from Equations (4) and (5) are caused. It is suggested that fitted k, b from experiments be used to derive the volume fraction of dense particles. In conclusion, under the experimental condition in present research, the volume fraction of dense particles can be calculated according to the following equation:
Although the volume fraction of dense particles can be acquired through the equation given above, it is not suggested to characterize the local mixing state using Fj because it is inconvenient for readers to understand the mixing state. The Fj is 0.57 when there are only dense particles at the measurement point and 0.0 when there are only light particles at the measurement point. It is suggested to use the micro mixing ratio of dense particles (fj) to characterize local mixing state in this article. The micro mixing ratio of dense particles is the volume fraction of dense particles in only particles neglecting the air. When micro mixing ratio of dense particles is 1.0, the particles in the sensing field of the capacitance probe sensor are only dense particles. When the micro mixing ratio of dense particles is 0.0, the particles in the measuring field of capacitance probe sensor are only light particles. The micro mixing ratio of dense particles can be calculated in a convenient way based on the linear calibration of output signal since it has been proven to be above that when the probe sensor is in emulsion, the output signal varies linearly with the volume fraction of dense particles. Specifically, when the micro mixing ratio of dense particles increases from 0.0 to 1.0, the output signal changes linearly from Vf (output signal when emulsion solids are composed of light particles only) to Vj (output signal when emulsion solids are composed of dense particles only). Thus, the micro mixing ratio can be calculated according to the following equation:
where fj is the micro mixing ratio of dense particles in the measuring field of capacitance probe sensor; Vj is the output voltage signal when there are only dense particles in emulsion solids which is measured to be 1.54 v; Vf is the output voltage signal when there are only light particles in emulsion solids which is measured to be 3.36 v. Then, the micro mixing ratio of dense particles at the measurement point can be calculated according to
The diameter of the in-house fabricated capacitance probe sensor is only 5 mm, which makes the measuring field of the capacitance probe sensor one or two orders of magnitude smaller than the sampling cells used in former experimental research. Therefore, the fj measured by capacitance probe method is referred to as the micro mixing ratio in the present research. It is worth mentioning that micro mixing ratio is actually a relative term which indicates the mixing ratio of binary solids in a very small volume.
2.2. Processing Method of the Output Signal
The output signal of the capacitance probe measurement system is processed according to the following method to acquire the micro mixing ratio at different lateral positions of the annular fluidized bed. In bubbling fluidized beds, the gas in excess of that required to maintain minimum fluidization flows through the bed in the form of bubble. There are two types of flow structure in bubbling fluidized beds, i.e., bubble and emulsion solids. Accordingly, at one measurement point, the output signal of the capacitance probe system mainly includes two parts: the bubble part and the emulsion part. The output signal of capacitance probe measurement system is checked carefully in chronological order. Because there are nearly no particles in the bubble, the output signals when bubbles pass by the measurement point are neglected. When emulsion solids flow through the measurement point, the output signal from when emulsion solids reach this position to when the emulsion solids leave this position is picked out. This part of signal is averaged to calculate the local mixing ratio at the current time according to Equation (10).
2.3. Validation of the Measurement System for Micro Mixing Ratio
In order to examine the accuracy of the capacitance probe measurement system in fluidized beds dealing with binary solids, a validation experiment was carried out. Silicon carbide particles and quartz sands were fully mixed at a preset mixing ratio and poured into fluidized bed. Then, the binary mixtures were maintained at approximately minimum fluidization and the capacitance probe was fully immersed in binary mixtures to measure the mixing ratio. The experimental procedure was repeated ten times and the averaged measured value was acquired and compared with the actual value. The comparison between the measured values and real values is given in Figure 2. The relative error of the measuring results is 4.3%. Therefore, the capacitance probe measurement system proves to be accurate.
2.4. Advantages and Disadvantages of the New Measurement Method
The capacitance probe method shows great potential in developing an in-depth understanding about the lateral mixing mechanism of solids in fluidized beds. Compared with the existing methods for solid mixing, the main benefits of the novel method are its convenience, cost effectiveness, and utilization in dense or three-dimensional fluidized beds. Bellow, the advantages of the new measurement method for solids mixing are discussed.
Firstly, the sampling cell in the particle tracing method is usually several cubic centimeters and even larger in the bed frozen method [34,35]. By comparison, the measuring volume of the capacitance probe sensor is one or two orders of magnitude smaller. In this way, the micro mixing ratio of solids can be measured by the new measurement method.
Secondly, because the thickness of fluidized beds is usually much larger than the diameter of particles, the tracer particles inside the bed may be hidden by bed materials and failed to be detected. As a result, certain measuring error may be caused. In the new measurement method, because of the penetration of electric filed, such a measuring error can be eliminated.
Thirdly, because many factors such as the particle size, density, shape and surface property can be the dominant causes for the mixing or segregation, any marking of particles for quantitative measurement may severely influence the mixing property to be measured [30]. In the new measurement method, the mixing ratio is measured based on the difference between the dielectric constants of binary solids and any marking of particles is avoided.
The cost of the capacitance probe measurement system is evaluated as follows. The cost of the capacitance probe sensor is 20 USD per sensor. The costs of the capacitance amplifier and data acquisition equipment are 15,000 and 2000 USD, respectively. The total cost of this novel measurement is about 17,000 USD. The cost of this method is much lower than that of X- or γ-ray imaging, neutron imaging, and RPT measurement system. In addition, the capacitance probe is very firm and is applicable in high-pressure and high-temperature fluidized beds. Therefore, it is possible to apply this method in industry in the future.
The main disadvantages of the novel measurement method are also discussed here. On the one hand, this method cannot be used in liquid-solids fluidized beds. On the other hand, this method cannot be used in fluidized beds dealing with three or more types of particles.
The interference of the capacitance probe sensor to fluidization was analyzed. Maurer et al. [37] evaluated the influence of probe sensor to a bubbling fluidized bed using X-ray measurement method. In their research, two probe sensors (diameter of 5 mm) were mounted in the bed, 10 mm vertically apart. The results showed that bubble size, splitting and shape as well as rise velocity is nearly unaffected by the probe sensor. In the present research, the diameter of the capacitance probe sensor is the same as that employed by Maurer et al. [37]. Therefore, the interference of capacitance probe sensors to fluidization can be neglected.
3. Methodology of Fluidized Bed Experiment
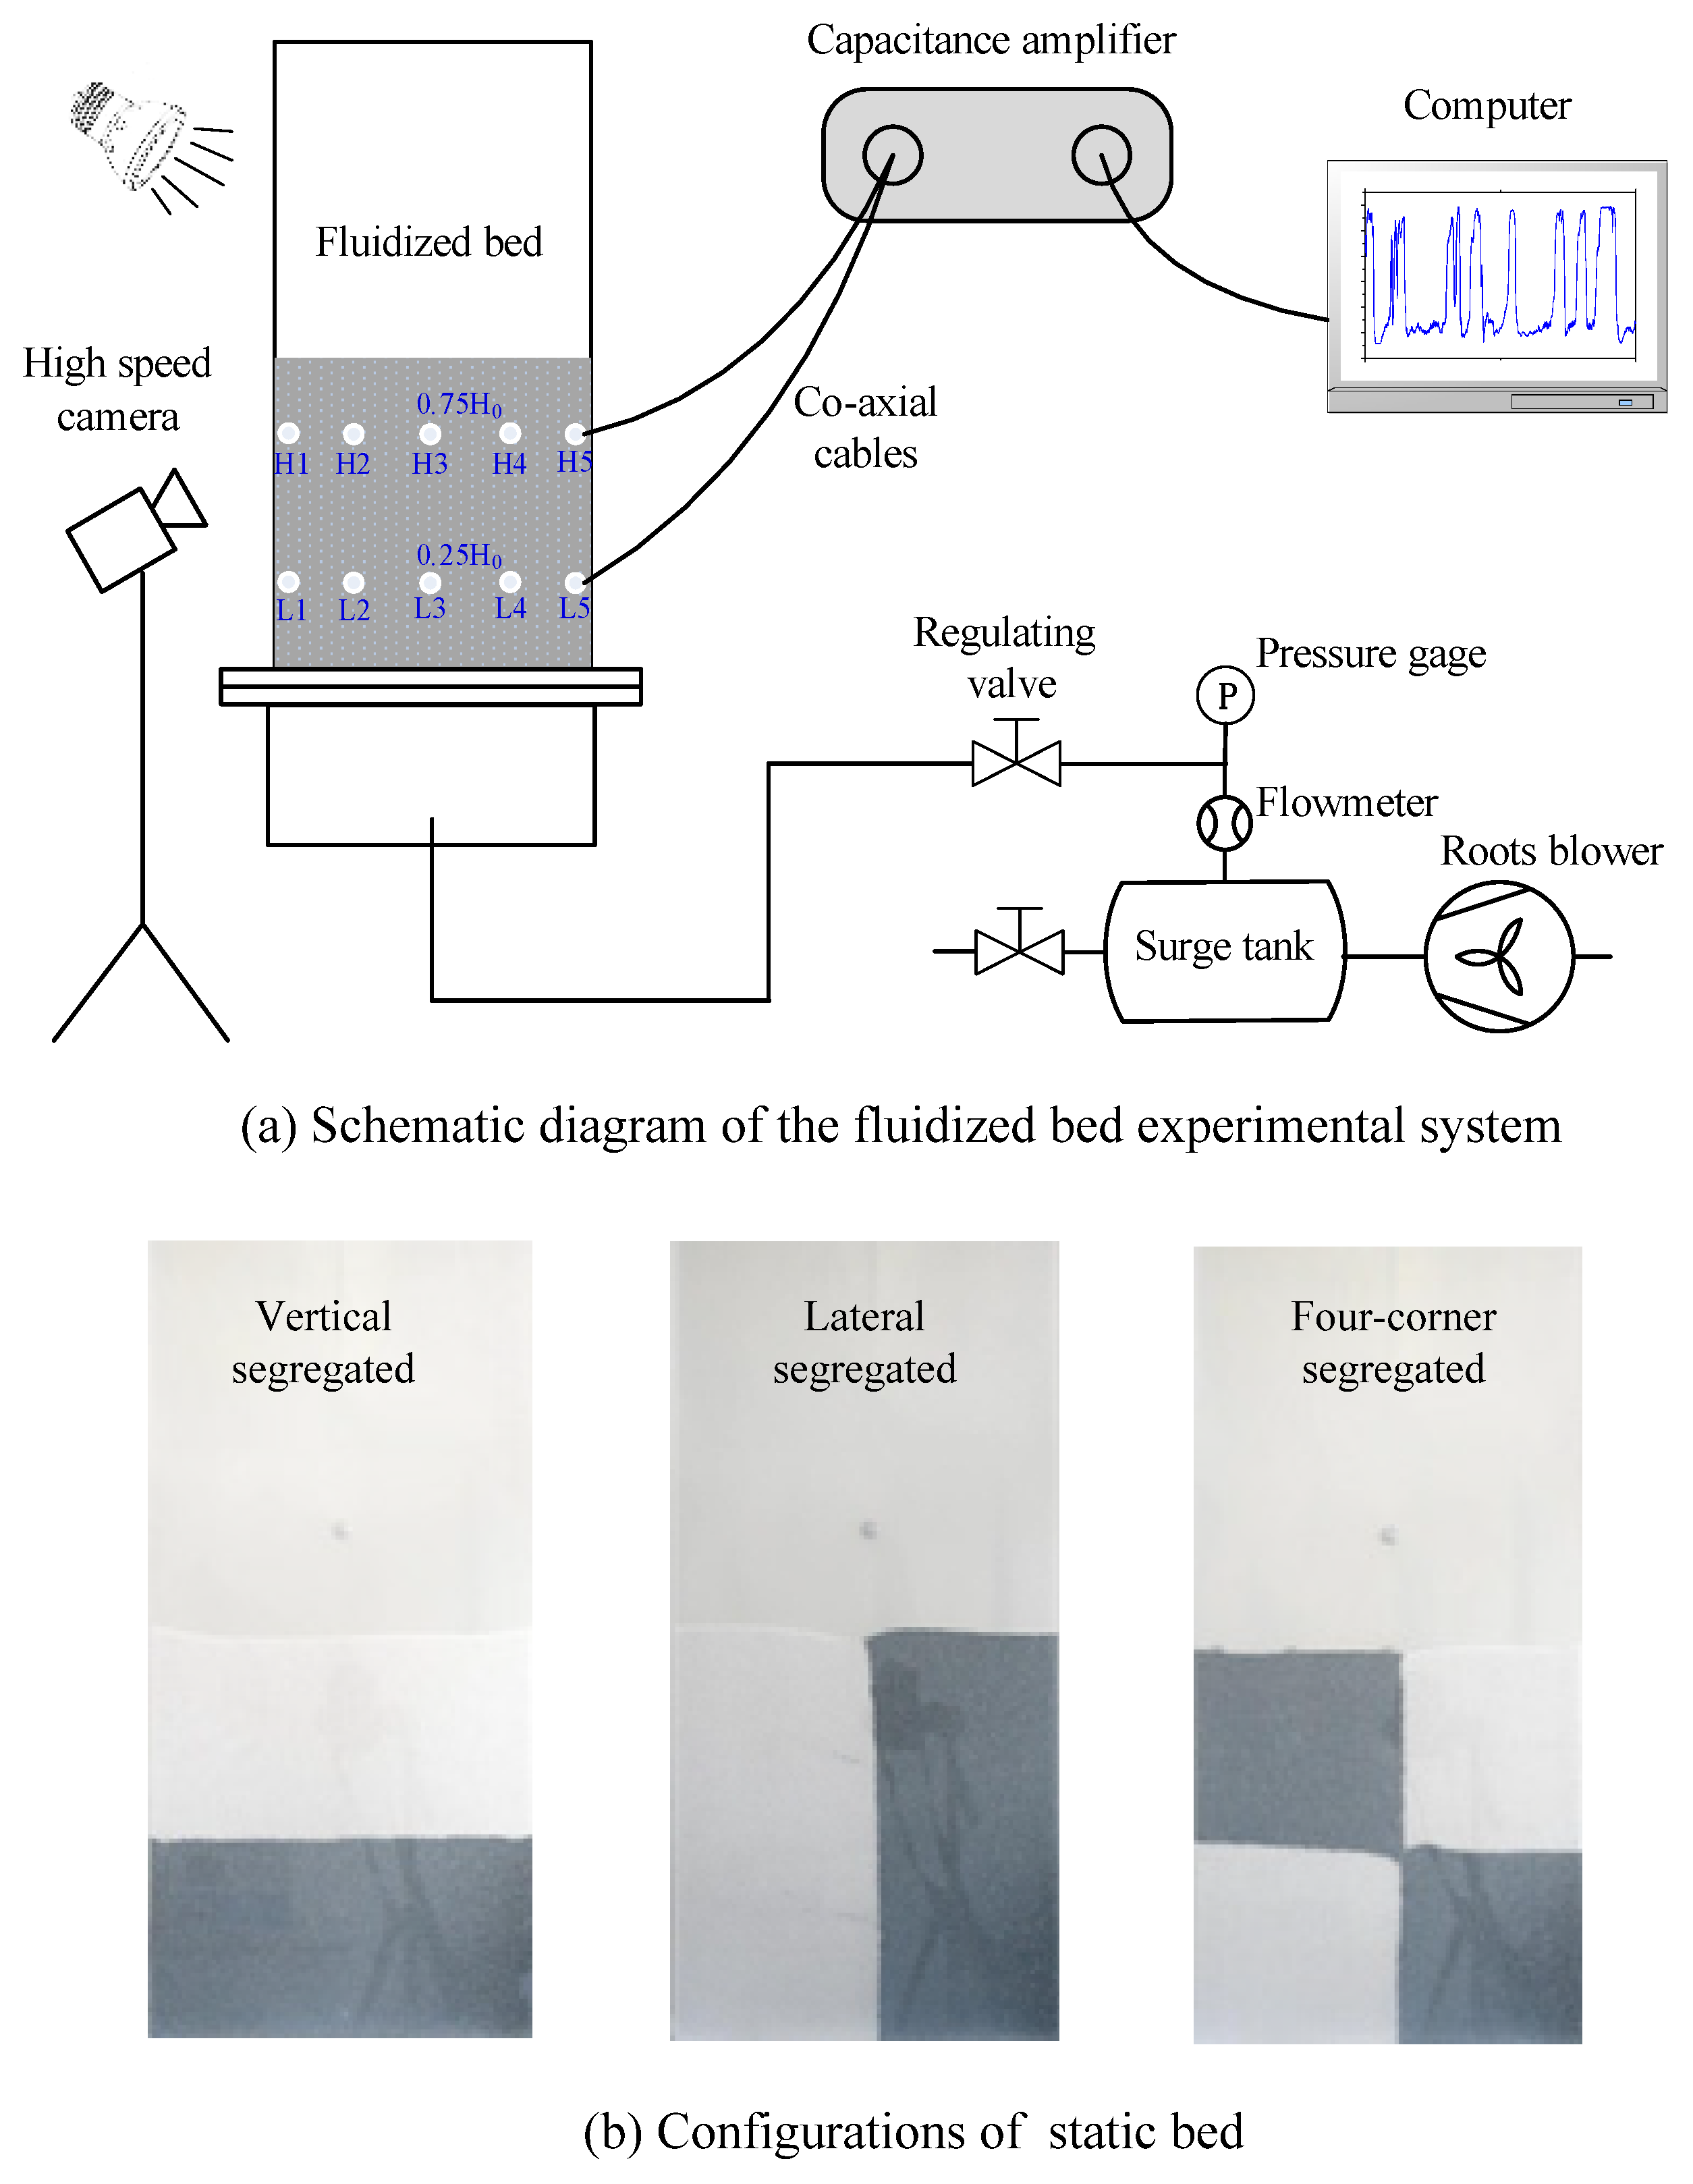
Figure 3a shows a schematic diagram of the fluidized bed experimental system. The fluidized bed is 300 mm in width and 30 mm in depth and made of transparent acrylic glass. Atmospheric air is pumped into the fluidized bed by a Roots-type blower. A perforated plate with a pore size of 2.0 mm and an open area ratio of 3.1% is used as the gas distributer. The gas velocity in the fluidized bed is measured by a vortex flow meter.
Binary solids, that is, silicon carbide particles and quartz sands with an equal diameter of 0.77 mm and a density ratio of 0.85 are used to study the lateral mixing property. The height of the static bed is 30 cm. In the present research, the following three types of static bed whose configurations, illustrated in Figure 3b, were used.
- Dense particles are poured into the bed first. Then, light particles are poured upon the dense particles with the same volume, which forms a vertical segregated static bed.
- Dense particles are at the right side, and light particles are at the left side, which forms a lateral segregated static bed.
- Dense particles are upon light particles at the left side, whereas light particles are upon dense particles at the right side, which forms a four-corner segregated static bed.
The arrangement of measurement points for micro mixing ratio of binary solids is shown in Figure 3a. Five measurement points are uniformly distributed in the lateral direction when the height is 0.25 H0 and 0.75 H0 respectively. For each type of static bed, the gas velocity is suddenly raised from zero to a preset value, and the fluidization is maintained for five minutes. In the mixing process, the micro mixing ratios at all measurement points are recorded simultaneously using the capacitance probe measurement system.
4. Results and Discussion
4.1. Effect of Convection and Diffusion Mechanism on the Lateral Mixing Process
The aspect ratio of the fluidized bed used in the present research is 1.0. Generally, there is only one bubble bursting at the surface of the fluidized bed at one time in the mixing process. This is confirmed by a visual analysis of the snapshots of fluidized bed, as shown in Figure 4. The eruption of bubbles is not limited by the walls of the bed. Therefore, the fluidized bed can be assumed as one so-called “mixing cell”. The micro mixing ratios at different lateral positions are measured, from which the detailed mechanism about lateral mixing within the mixing cell can be revealed.
In bubbling fluidized beds, the lateral mixing resulted from convective bubble flow and random motion of particles [11,12,13,14,15]. On the one hand, as particles in the fluidized beds are quite random, diffusion mixing results from the local relative motion of particles. On the other hand, when a bubble rises, it carries a large number of particles up together in its wake and simultaneously pushes emulsion solids aside, resulting in ascending and descending emulsion solids. The relative motion of emulsion solids causes convection mixing. The diffusion and convection mechanisms are related to the motion of particles. In the convection mixing caused by the ascending and descending emulsion solids, diffusion mixing also exists due to the local relative motion of particles. The particle cluster size and particle velocity will change at different positions, which means that diffusion may develop into convection with the variation of position and vice versa.
In order to figure out the effect of convection and diffusion mechanism on the mixing process, first, the relationship between the micro mixing ratio and convection/diffusion must be established. According to the discussions above, when convection mixing happens, the micro mixing ratio will change largely with time because particle clusters that containing different types of particles flow through the measurement point. The particle cluster here means a large number of particles that are driven by bubbles and having similar velocity. On the contrary, the diffusion mixing is believed to be induced by the exchanging of positions of particles with their nearest neighbors. Therefore, when diffusion mixing happens, the micro mixing ratio will change slightly with time because there is no sudden change of mixing state at the measurement point.
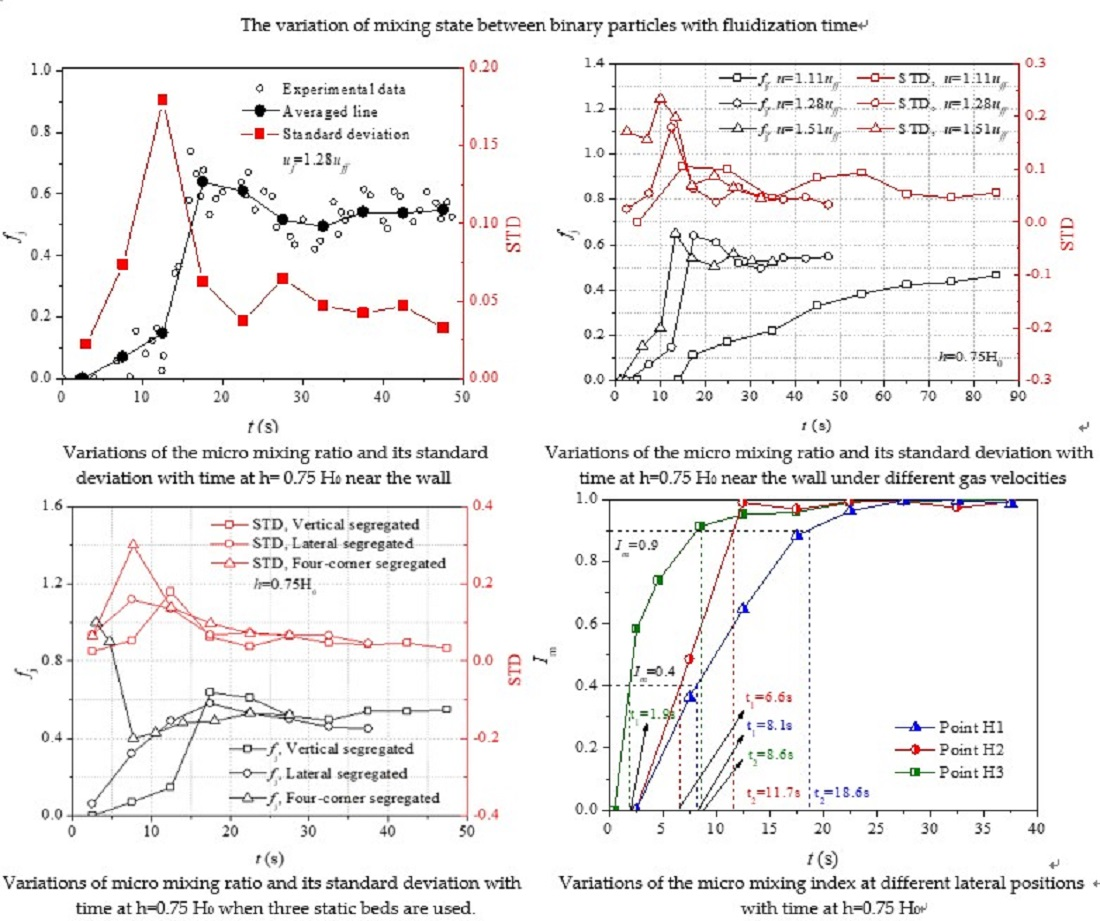
The mixing processes at different lateral positions are analyzed in detail to characterize the role of convection and diffusion in the lateral mixing process of solids. Silicon carbide particles and quartz sands are vertically segregated in the static bed and the gas velocity is 1.28 times the fully fluidization velocity (uff) which is determined by bed pressure drop method. The evolutions of the micro mixing ratio of dense particle (fj) with time at different lateral positions when the bed height is 0.25 H0 are shown in Figure 5. In the mixing process, when emulsion solids flow through the measurement point, the section of signal from when emulsion solids reach the measurement point to when emulsion solids leave the measurement point are picked out. The averaged value of this section of signal is used to calculate the mixing ratio at the measurement point according to Equation (7) and the mixing ratio is shown as a scatter in Figure 5. The averaged line is calculated by averaging the fj in each five seconds. The standard deviations (STD) of fj in each five seconds are calculated to characterize the fluctuation of fj with time, from which the effect of convection and diffusion on the mixing process is analyzed.
Figure 5a shows that fj near the wall decreases quickly from 1 to 0 between t = 0 s and 12.5 s, and then increases quickly to 0.65 at t = 27.5 s. The significant variation of fj results in a large STD in the beginning of mixing. As can be seen from the figure that the STD is higher before t = 22.5 s, which means that convection plays a more important role in the mixing process near the wall. The phenomenon can be explained in the way that from a macro perspective, it has been found that bubbles tend to rise along the center line of fluidized bed and carry a large number of particles to the top [2]. According to the principle of conservation, particles near the wall will gather and flow down [38]. Therefore, solids mixing near the wall is mainly accomplished through the coordinated motion of particle clusters. From a micro perspective, because in bubbling fluidized bed gas velocity near the wall is much lower than that in the main flow region, the drag force exerted on the particles near the wall is smaller and there is a poor mobility of particles [39,40]. The above factors result in that convective is the main mechanism of solids mixing near the wall. After t = 27.5 s, quasi-steady mixing is formed in which the averaged line is about 0.56 and nearly does not vary with time. Moreover, STD decreases slowly with time after t = 22.5 s, indicating that the latter part of the mixing process is mainly accomplished by diffusion. The explanation may be that the component in different particle clusters is similar and solids mixing is mainly accomplished by the relative motion of particles.
Figure 5b,c show that the evolutions of fj and its STD with time at half radius (measurement point L2) and center line (measurement point L3) of the fluidized bed are similar, but very different from that near the wall. After a stagnant of about 10 s, the averaged fj at the half radius and center line of fluidized bed decreases directly with time and show moderate fluctuation. The STD at the half radius and center line is smaller than that near the wall, which means that diffusion mixing is enhanced at the half radius and center line. The explanation may be that the particles at the half radius and center line have a better mobility due to the larger drag force compared with the particles near the wall [39]. In this way, the relative motion between particles is enhanced and diffusion becomes more important in the mixing process.
In addition, STD at the center line is higher than that at the half radius, which means that convection mixing is more significant at the center line. The phenomenon can be explained in the way that the mixing behavior at the half radius is mainly determined by the mobility of particles. As mentioned above, particles at the center line are carried up by bubbles and then particles near the wall flow down. The half radius is at the interface between the upstream and downstream of particles. Chanchal et al. [1] found that at the lower part of the bubbling fluidized bed, a vortex of particles exists at the half radius where the trajectory of particle changes greatly. Therefore, diffusion mixing is more evident at the half radius. Meanwhile, a large number of particles around the center line are carried up by the bubbles in the wake, the coordinated motion of particle clusters are enhanced and convection mixing is more significant at the center line.
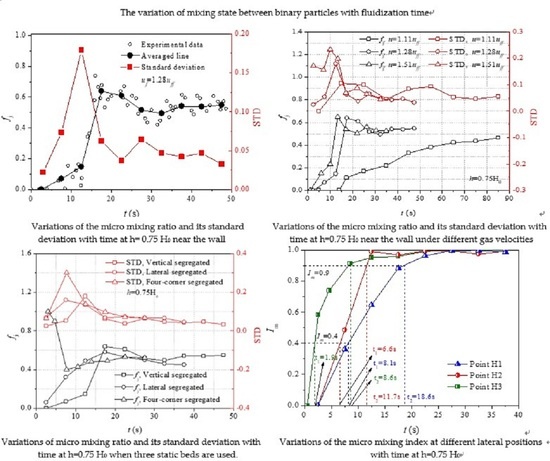
The evolutions of fj and its STD with time at different lateral positions when the bed height is 0.75 H0 are shown in Figure 6. Figure 6a,b shows that the averaged fj near the wall and half radius follow a similar trend. The STD near the wall and half radius also follow similar distribution that both large and small STD is observed before t = 22.5 s. Therefore, the mixing near the wall and at half radius is accomplished by both convection and diffusion. At the higher part of fluidized bed, the bubbles become larger and have a wider influence on the motion of particles. During the rise of big bubble, particles at the radius and near the wall are in the cloud of the bubble and flow down around the boundary of bubble to the wake, which give a rise to diffusion mixing. In addition, because the coordinated motion of larger particle clusters is induced by the bubbles at a higher part of the fluidized bed, convection mixing is also enhanced. After t = 27.5 s, the smaller STD means that diffusion plays a more important role in the later part of mixing process. The mixing mechanism of the later part of the mixing process is similar with that discussed above and not repeated here.
Figure 6c shows that fj at the center line varies largely from 0 to 0.8 from the beginning of mixing. Correspondingly, the STD is very high which means that convection plays a major role in solids mixing process at the center line. Moreover, STD is much larger than that at half radius and near the wall. Sette et al. [15] concluded that many dense particles at the center of the fluidized bed are carried up by bubbles in the wake. Meanwhile, light particles around rising bubbles drift in a downward direction to fill the gap created by the bubbles. In this way, the coordinated motion of particle clusters is significant and convection is the main mixing mechanism at the center line. In addition, the STD decreases quickly with time, which may be due to the fact that in the beginning, particle mixing is very fast and after t = 17.5 s the compositions of particles in different particle clusters are similar.
Gas velocity is one of the major factors that influence the mixing behavior of solids in fluidized bed. In order to study the effect of gas velocity on the lateral mixing of solids, the variations of fj and its STD with time at different lateral positions (h = 0.75 H0) when the gas velocity increases from 1.11 uff to 1.51 uff are shown in Figure 7.
Figure 7a shows that when the gas velocity increases from 1.11 uff to 1.28 uff, a significant difference between the evolutions of fj near the wall is observed. However, the evolution of fj changes a little when the gas velocity increases from 1.28 uff to 1.51 uff. Moreover, it is observed that STD of fj is larger at a higher gas velocity, indicating that convection becomes more important in solids mixing with the increase of gas velocity. It has been proven that [41] with the increase of gas velocity, the circulation of solids in bubbling fluidized beds is accelerated and particles near the wall flow down more quickly. Therefore, the coordinated motion of particle clusters near the wall is enhanced and convection becomes more important in the mixing process.
For the mixing process at center line, it can be observed from Figure 7b that a significant difference resulted both when the gas velocity increases from 1.1 uff to 1.28 uff and from 1.28 uff to 1.51 uff. Moreover, a larger STD of fj is observed at a higher gas velocity, indicating that convection plays a more important role in the mixing process with the increase in gas velocity. As discussed above, at the higher part of the bubbling fluidized bed, the mixing at center line is mainly accomplished by the dragging of particles from surrounding dense phase into the wake behind the rising bubbles. Because the diameter of the bubble will increase exponentially with the increase of gas velocity [2], more particles are dragged into the wake of bubbles. Therefore, a large difference between the evolutions of fj at different gas velocities results for the mixing at the center line. However, Figure 7b also shows that at the center line, when u = 1.51 uff, the STD is smaller than that when u = 1.28 uff, indicating that diffusion is more evident despite the increase in bubble size. The reason may be that coalesce and creak of bubbles are more frequent at higher gas velocities, which results in instability of the fluidization system and inconsistency of the motion of particles is caused.
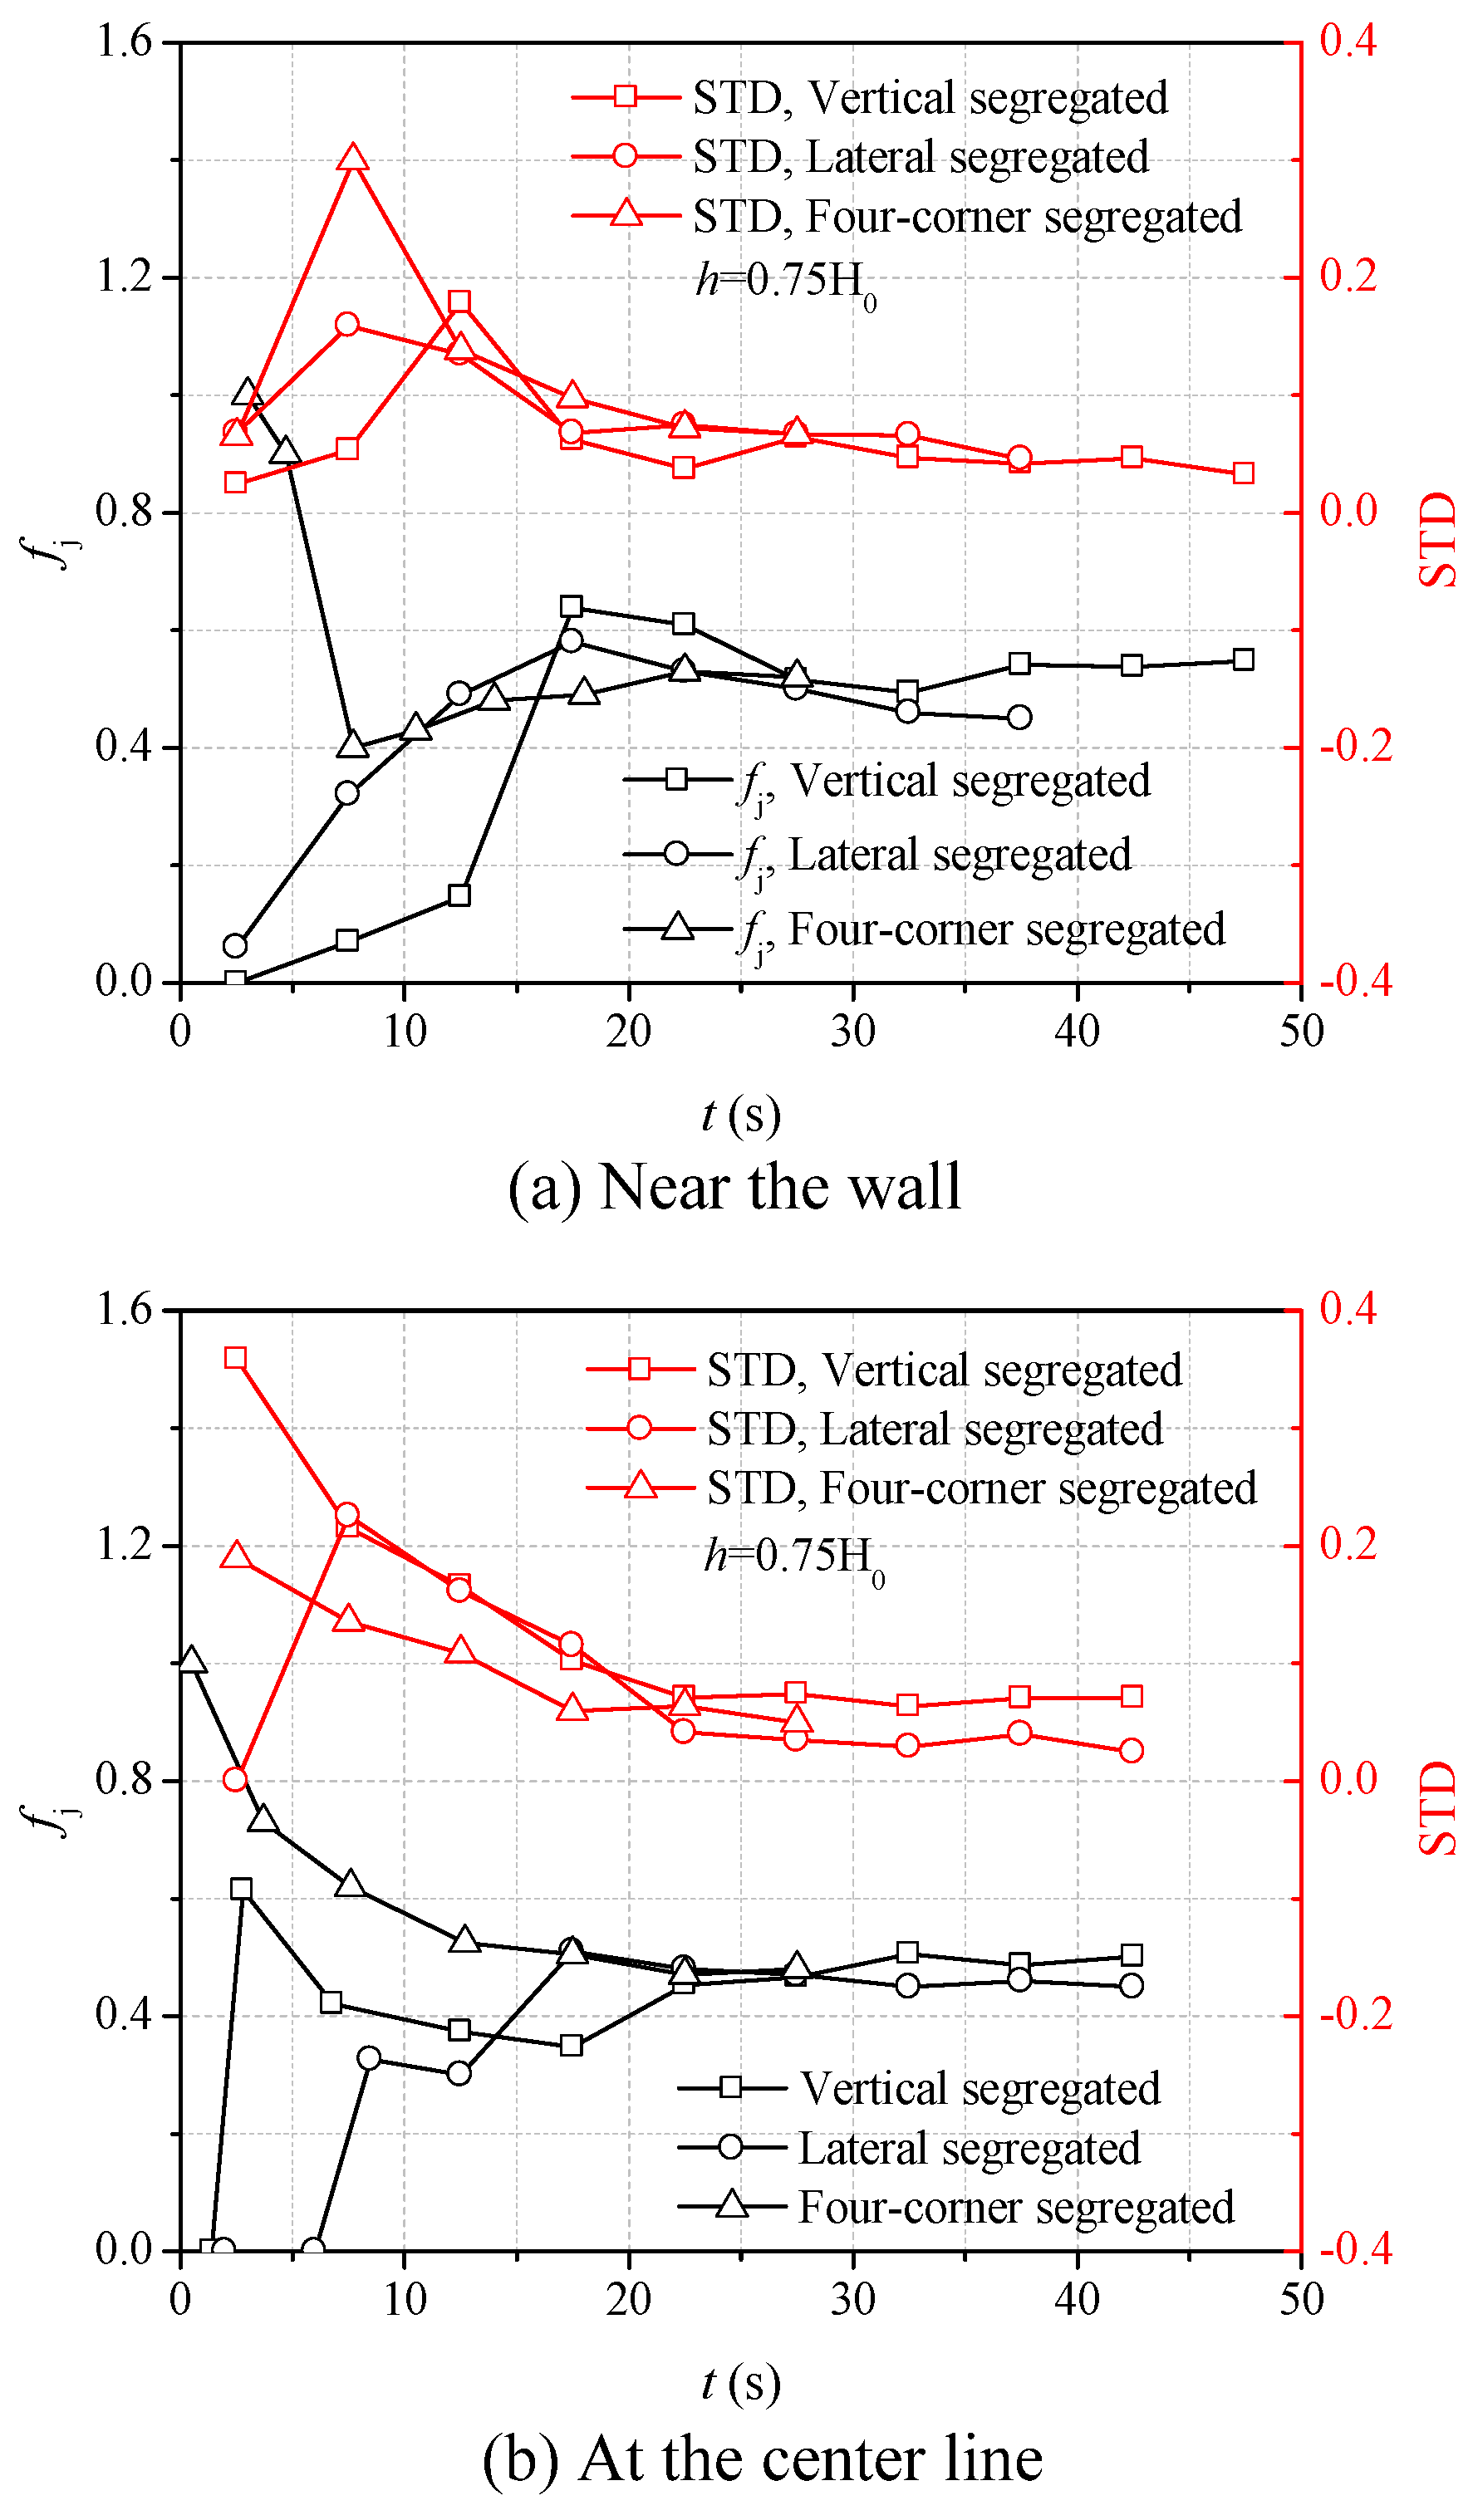
A comprehensive understanding about the effect of static bed on lateral mixing of binary solids may provide useful guidance for determining the feeding way of fluidized bed reactor. In order to get a quantitative understanding about the effect of static bed on lateral mixing, the evolutions of fj and its STD at different lateral positions are shown in Figure 8. Figure 8a shows that when the lateral and vertical segregated static beds are used, a quick increase of fj near the left wall is observed in the beginning of mixing and then fj decreases with time. A faster increase of fj is found when lateral segregated static bed is used. On the contrary, when four-corner segregated static bed is used, a sudden decreases of fj near the left wall results in the beginning and then fj increases slowly to about 0.52 when t = 27.5 s. At the beginning of mixing, larger STD is observed when the four-corner segregated static bed is used.
Figure 8b shows that at the center line of fluidized bed, when different static beds are used, the variations of fj are similar with that near the left wall except for two things. On the one hand, in the beginning, the increase of fj is faster when a vertical segregated static fixed bed is used. On the other hand, when a four-corner segregated static bed is used, the averaged fj varies inversely with time. Because of the accumulation of dense particles at the right side when the lateral segregated static bed is used, the final value of fj at measurement points H1 and H3 is approximately 0.44, which is smaller than that when the other two types of static beds are used.
4.2. Micro Lateral Dispersion Coefficient of Solids
From the discussions above, it is found that the mixing mechanism of solids is very different at various positions of the mixing cell. Therefore, it is necessary to characterize the local solids dispersion at different positions of the fluidized bed. In the present research, the fluidized bed is assumed as one mixing cell and the diffusion-like equation is inapplicable to describe the solids dispersion. Moreover, the local mixing ratio of dense particles measured by the novel measurement method is dimensionless. Under these conditions, in order to characterize the local solids dispersion, a new micro dispersion coefficient is proposed which is based on Fick’s first law. The definition of micro dispersion coefficient is given below:
where DmL is the local lateral micro dispersion coefficient at the measurement point; JL is the local lateral flux of dense particles through per unit area in unit time at the measurement point, respectively. The JL near the wall is evaluated by the increase of micro mixing ratio of dense particles in unit time since the wall is the boundary of mixing in lateral direction. The JL near the wall is calculated by the time-averaged increase of micro mixing ratio in each five-second interval. Then, the JL at half radius is evaluated by summing up the time-averaged increase of micro mixing ratio at half radius and the JL near the wall.
The lateral gradients of mixing ratio on the right sides of Equation (11) are calculated based on the time-averaged micro mixing ratio in each five-second interval. Although the measured micro mixing ratio at one measurement point is scattered, the time-averaged mixing ratio can reflect the effective local mixing state at this measurement point. The rationale in calculating the lateral micro dispersion coefficient is same with that of the macro dispersion coefficient in the literature. However, because the measured micro mixing ratio by the novel method is dimensionless, the unit of lateral micro dispersion coefficient is m/s, which is different from that of macro dispersion coefficient. The micro dispersion coefficient can be used to evaluate the local lateral dispersion of solids in fluidized bed given local mixing ratios or volume fractions of dense particles.
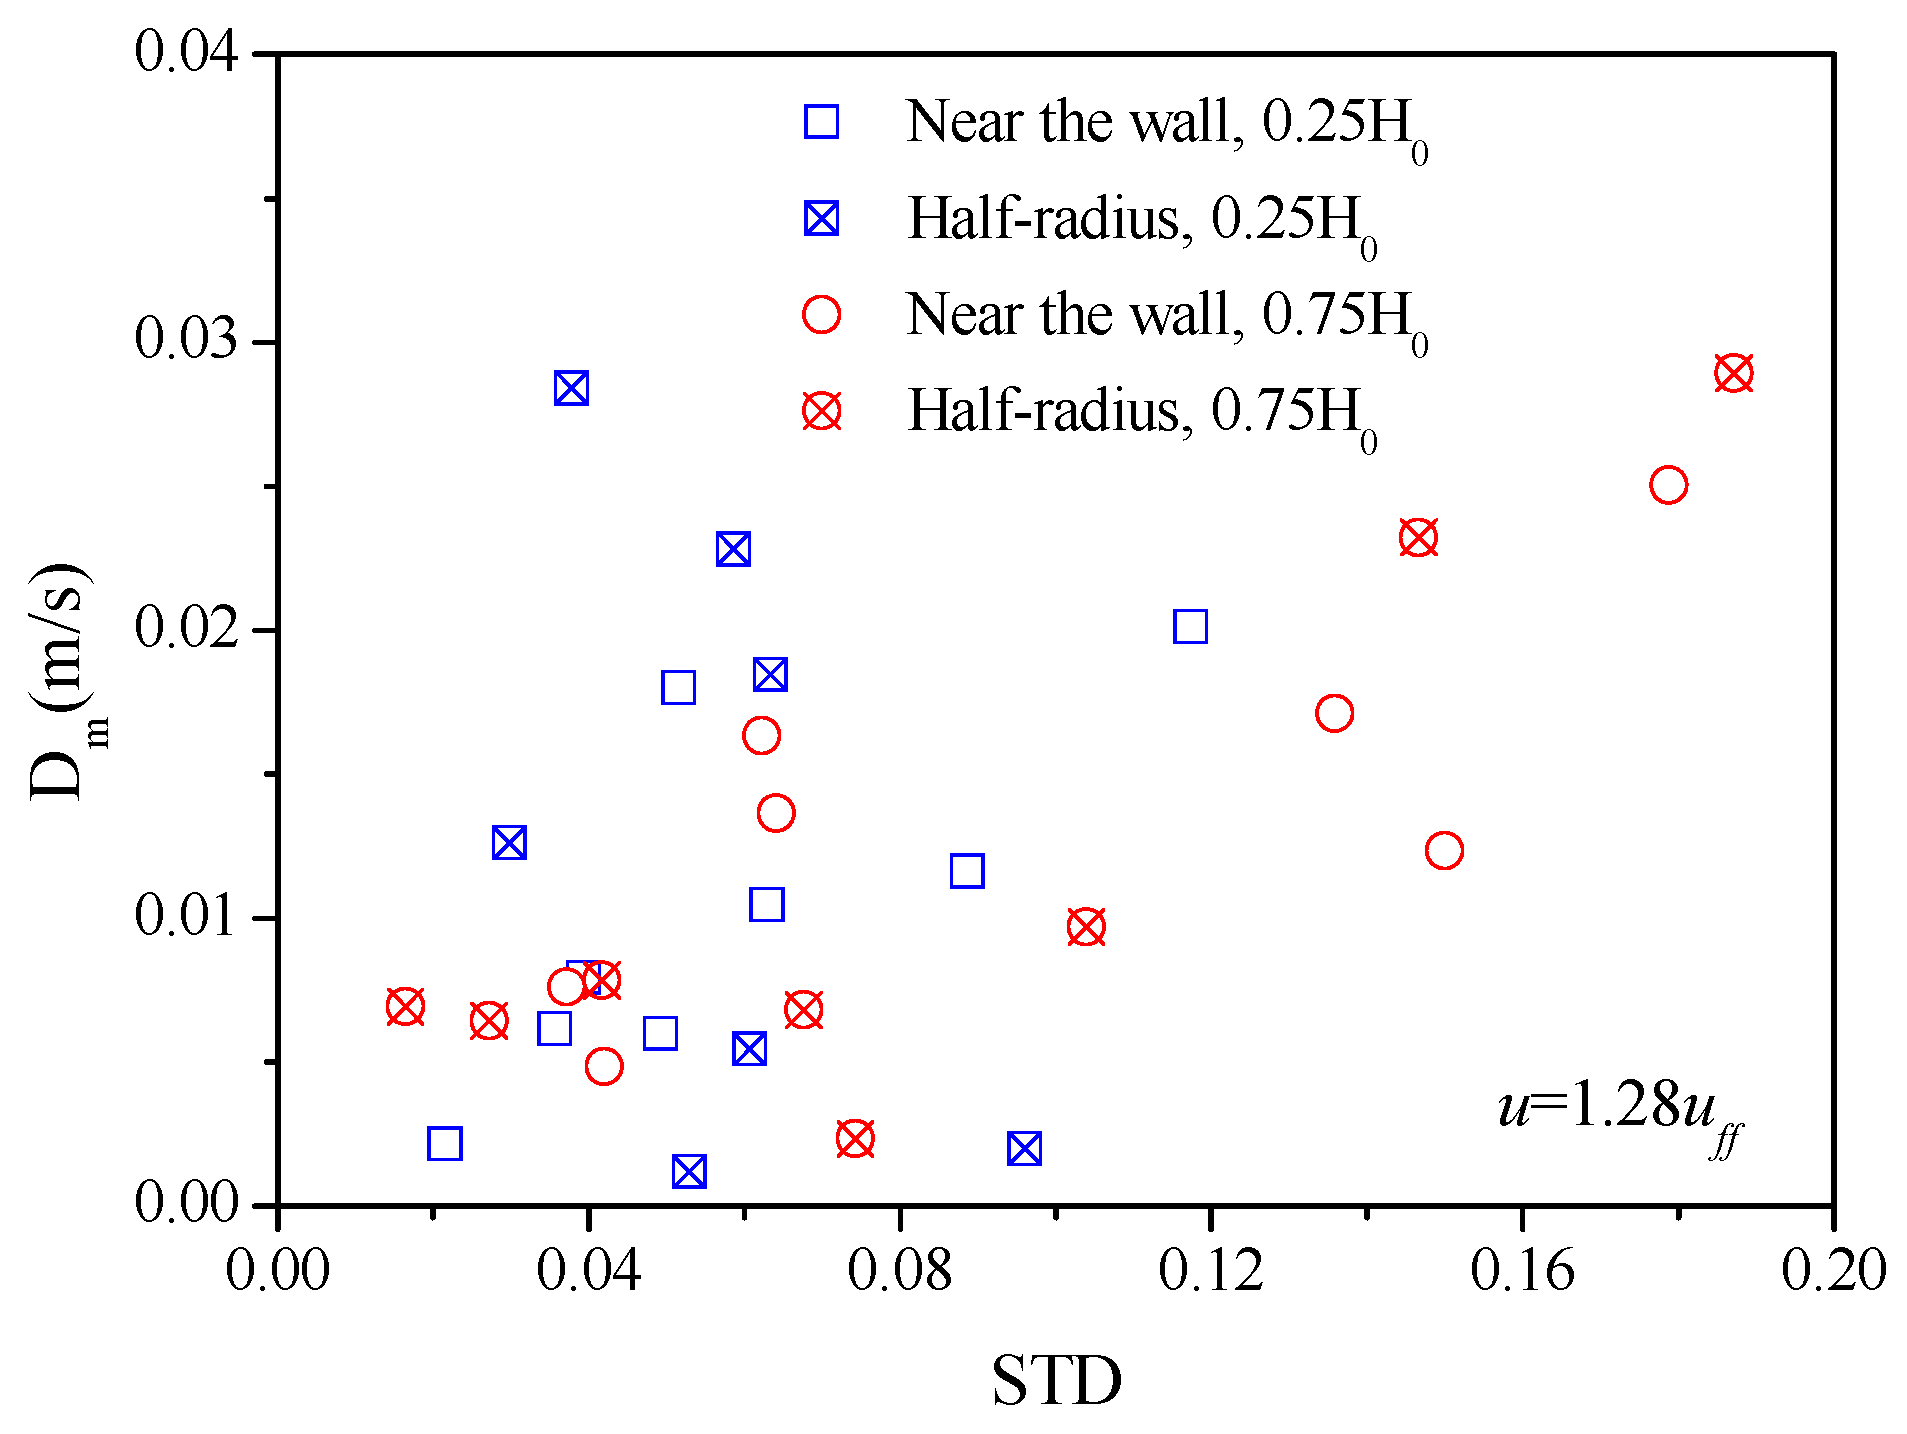
Figure 9 and Figure 10 show the variations of Dm with STD at different bed heights and gas velocities, respectively. The static bed is composed of silicon carbide particles and quartz sands which are vertically segregated. In our experiments, the micro lateral dispersion coefficient within the mixing cell mainly falls between 0.005 and 0.025 m/s. It can be observed from Figure 9 that when the bed height is 0.25 H0, the variations of Dm with STD are different at different lateral positions. The Dm is higher when there is a larger STD near the wall, which means that convection play a major role in the lateral mixing of solids. The reason may be that the voidage near the wall is lower and the lateral mixing is mainly accomplished through the coordinated motion of particle clusters. However, the variation of Dm with STD at the half radius is opposite with that near the wall. The STD at the half radius is generally lower than 0.12 and Dm is higher when there is a smaller STD. This means that diffusion is more important for lateral mixing at half radius. As mentioned above, the half radius is at the interface between the upstream and downstream of particles and a vortex of particles is formed where the trajectory of particle changes greatly, which results in the mixing being mainly accomplished by diffusion.
When the bed height is 0.75 H0, the Dm near the wall and at half radius increase with STD, indicating that convection has a more important influence on lateral mixing with the increase of bed height. Because bubbles grow larger with the increase of bed height, the bubble induced coordinated motion of particle clusters becomes very important in the lateral mixing at the upper part. In addition, when there is a larger STD, Dm at half radius is higher than that near the wall, meanwhile when there is a smaller STD, Dm at the half radius is lower. This means that convection is more important for lateral mixing at the half radius than that near the wall, which may be due to the rising bubbles having a more important influence on the particles at the half radius.
The influence of gas velocity on the micro lateral dispersion coefficient is shown in Figure 10. It can be observed from Figure 10a that at a lower gas velocity, the STD near the wall is smaller and Dm is generally lower than 0.013. With the increase of gas velocity, Dm increases quickly with STD, which means that convection plays a more important role in lateral mixing at a higher gas velocity. The variation of Dm with gas velocity is mainly caused by the change of bubble dynamics. At a higher gas velocity, bubbles become larger and rise faster in the fluidized bed, which will make the particle clusters near the wall flow down faster [41]. In this way, the lateral dispersion of solids is enhanced. This finding is in accordance with the experimental results acquired by Castilla et al. [16] and Liu and Chen [19].
Figure 10b shows that at the half radius, Dm increases quickly when the gas velocity changes from 1.11 to 1.28 uff, indicating that convection becomes more important in the lateral mixing of solids. However, when increasing the gas velocity to 1.51 uff, a higher Dm is found when there is a smaller STD. This means that when u = 1.51 uff, apart from convection, diffusion also plays an important role in the lateral mixing of solids. The enhancement of diffusion mixing at a higher gas velocity may be due to the fact that on the one hand, bubbles become larger and rise faster at higher gas velocity. During the rise of large bubble, particles flow down quickly around the boundary of the big bubble to the wake, which enhances the diffusion mixing. On the other hand, the coalesce and creak of bubbles are more frequent at a higher gas velocity, which results in instability of the fluidization system. Therefore, inconsistency of the motion of particles is caused and diffusion becomes more important in the lateral mixing of solids.
4.3. Lateral Mixing Quality of Solids
The above discussion gives knowledge about the effect of convection and diffusion on lateral dispersion process/coefficient in fluidized beds. However, higher dispersion coefficient does not always represent better mixing [25]. Therefore, an effective evaluation of the lateral mixing quality is necessary in the present work. In the literature, there are mainly four methods used to calculate the mixing index of binary mixtures, namely average-height method [42], nearest-neighbors method [43], Lacey’s method [44] and particle concentration method [45]. A brief introduction to these methods is given below.
In the average-height method, the average height of the dense particles is calculated and normalized by the average height of all particles in the fluidized bed. Then, the normalized average vertical position of the dense particles is used to calculate the mixing index. The average-height method is used to calculate the mixing index of particles in the whole fluidized bed. The equation for the average-height method is
where is the normalized average vertical position of the dense particles. The mixing index is defined as:
which means that M is 0 for totally unmixed bed and 1 for fully mixed bed.
In the nearest-neighbors method, the number of particles surrounding a target particle is acquired. The mixing index is calculated by counting the number of particles having the same density or color as the target particle. The definition of the mixing index is expressed as follows:
where ndiff is the number of nearest neighbors having different density or color, nnb is the number of nearest neighbors.
In the average-height method and nearest-neighbors method, the mixing index is calculated given the coordinated of all the particles. Therefore, they are mainly used in numerical simulations.
In Lacey’s method, the fluidized bed is divided into many cells and the variance for the concentration of dense particles in each cell is calculated according to the following equation:
where N is the number of cells in fluidized bed, is the concentration of dense particles in cell i, and is the average concentration of dense particles in the bed. and are defined as
Then the mixing index can be calculated as
Lacey’s method is mainly used to calculate the mixing index of particles in the whole fluidized bed given the concentration of dense particles in all cells. It can be used in numerical simulation and experimental research.
In the particle concentration method, the mixing index is calculated knowing the percentage of concentration of jetsam at different parts of the fluidized bed. The definition of mixing index is expressed as
where X is % of dense particles at the measurement point, Xbed is % of dense particles in the bed.
The particle concentration method is mainly used to calculate the mixing index when the mixing reaches steady. But in the present research, the whole mixing process of binary mixtures in fluidized bed is studied. When there are only dense particles or light particles at the measurement point, the mixing index for such totally unmixed states calculated by concentration method is 0 or 2. Therefore, it is difficult to evaluate the local mixing quality of binary mixtures effectively in the mixing process.
It can be found that the methods mentioned above are inapplicable when evaluating the local mixing quality in the dynamic mixing process. For this problem, a new mixing index is proposed based on Shannon entropy in this article. The formula is given in Equation (20).
where Im is the micro mixing index at the measurement point, which will be 0.0 for the totally segregated state and 1.0 for any completely mixed state; n is the number of kind of particles, and the value is 2 in this study; fi is the micro mixing ratio of ith particle in the measuring field of capacitance probe sensor. Compared with the existing methods for mixing index, an effective evaluation of the local mixing quality of binary mixtures in the whole mixing process can be acquired through the new solids mixing index.
The evolutions of Im with time at different lateral positions when the bed height is 0.25 H0 and 0.75 H0 are shown in Figure 11a,b, respectively. More specifically, the time required for the mixing indices at different lateral positions to reach 0.4 and 0.9 is also illustrated in the figures. The gas velocity is 1.28 uff. Figure 11a shows that when the bed height is 0.25 H0, the fastest mixing is found at the half radius. Although the bubbles have a more important influence on the mixing at center line, the mixing at center line is the slowest. The phenomenon can be explained in the way that the half radius is at the interface between the upstream of particles at center line and downstream of particles near the wall, and a vortex of particles is formed at the half radius where the trajectory of particle changes significantly. The flow pattern at the half radius is very suitable for solids mixing. As for the mixing at the center line, because of the large drag force exerted on the particles, particles are forced to move in approximately the same velocity and the mixing is slowed down. After about t = 45 s, steady lateral mixing is reached, and it is found that the final mixing quality at different lateral positions is similar.
The evolutions of Im at different lateral positions when the bed height is 0.75 H0 are shown in Figure 11b. The time required to reach certain mixing quality at different lateral positions is also illustrated in the figure. It can be seen from the figure that fastest mixing is acquired at the center line and mixing rate slows down quickly with the increase of the distance from the center line. The phenomenon can be explained by the way that at the higher part of the bubbling fluidized bed, because of the growth of bubbles, more particles are carried to the top by bubbles in the wake. Meanwhile, the particles above will fall due to the creak of bubbles. The relative motion between particle clusters is more evident, which is good for the mixing at the center line. It has been proven that at the higher part of bubbling fluidized beds, the gas velocity near the wall is much smaller than that in the main flow region [40,41,42]. Therefore, smaller drag force is exerted on the particles near the wall and poor mobility of the particles is resulted, which slows down the mixing.
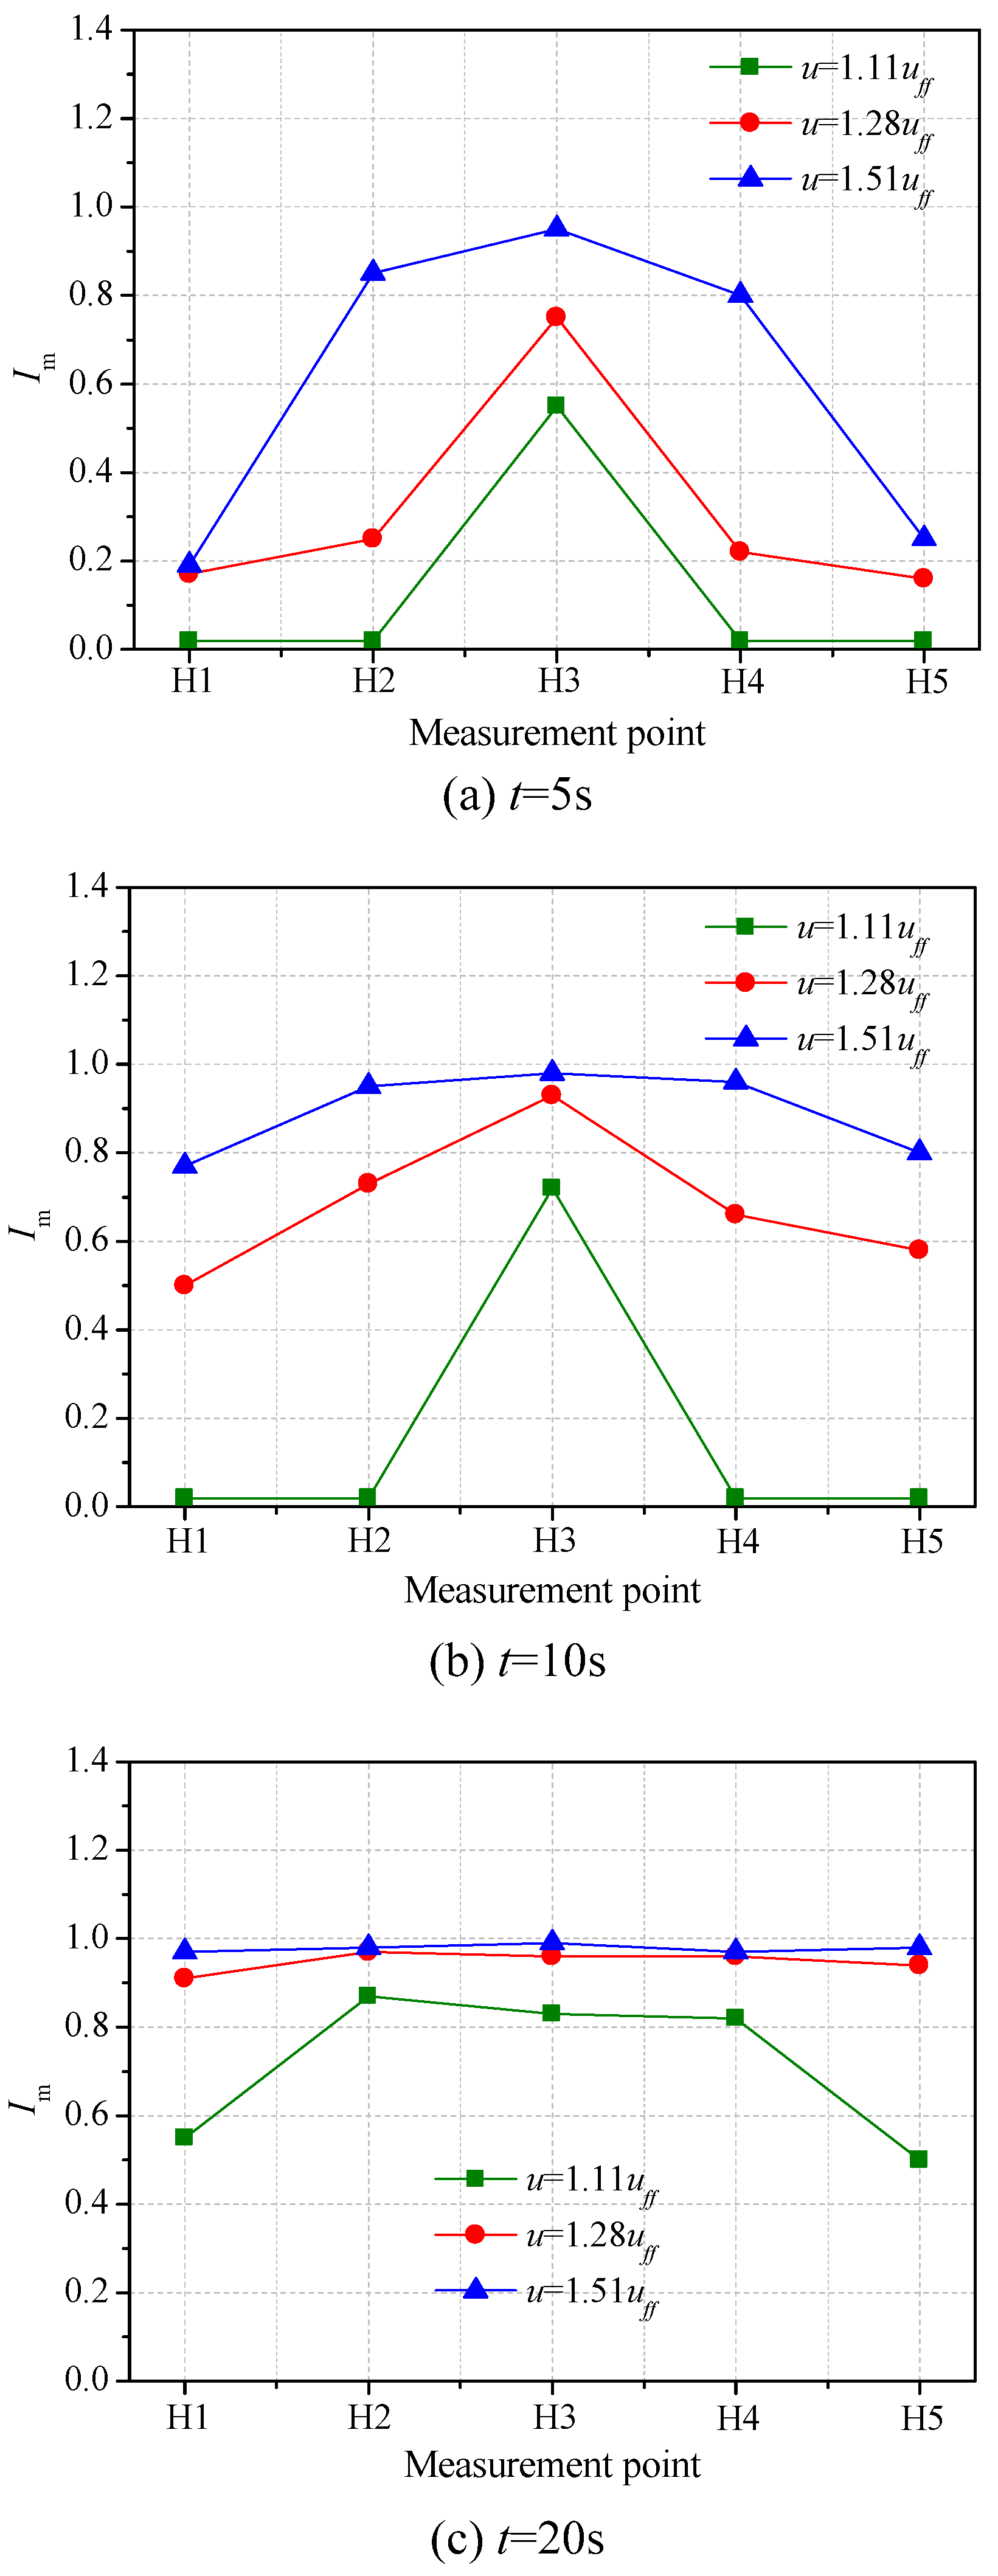
Furthermore, the lateral distributions of Im under different gas velocities when the bed height is 0.75 H0 are shown in Figure 12 to evaluate the lateral mixing quality. Figure 12a depicts that at t = 5 s, a peak is found at the middle of the distribution curve of Im when u = 1.11 uff or 1.28 uff, whereas the lateral distribution of Im when u = 1.51 uff is more like a parabolic. The simultaneous rise of Im at measurement points H2, H3 and H4 when u = 1.51 uff may be due to the bubbles being larger and the mobility of particles at a wider range is improved by the bubbles. Figure 12b shows that at t= 10 s, the lateral distribution of mixing index is quite flat when u = 1.51 uff. With the decrease of gas velocity, Im at the center line changes slightly, but Im near the walls decrease very fast. Figure 12c shows that at t = 20 s, the lateral distributions of Im are quite flat when u = 1.28 uff and 1.51 uff, whereas when u = 1.11 uff, the overall Im is still lower specifically near the walls. In general, the influence of gas velocity on the lateral mixing of solids is more important in the mixing process, but the final mixing extent is similar.
Figure 13 shows the lateral distributions of Im at h = 0.75 H0 when different static beds are used and the gas velocity is 1.28 uff. At t = 5 s, a symmetric lateral distribution of Im with a peak at the middle is formed when the vertical segregated static bed is used. By contrast, asymmetric distributions of Im are formed when the other two types of static bed are used. When the lateral segregated static bed is used, lateral mixing at the left side is much better than that at the right side. Because when the lateral segregated static bed is used, the flow resistance on the left (light particles) is lower than that on the right (dense particles), the gas flows through the bed mainly along the left wall which improves the mobility of particles at the left side. In general, better lateral mixing is observed when the four-corner segregated binary solids are used at t = 5 s, which may be due to there being more interfaces between binary solids and dissimilar particles have more opportunities to contact with each other. Figure 13b shows that at t = 10 s, when the lateral and four-corner segregated static beds are used, the particle mixing quality at the left side is similar, which is higher than that when the vertical segregated static bed is used. However, dead areas of mixing are formed when the lateral and four-corner segregated static beds are used near the right wall, and the dead area is larger when lateral segregated static bed is used.
A deeper understanding about the lateral mixing mechanism can be acquired through the combination of dynamic modeling and this experiment. A dynamic modeling of the lateral mixing process of binary mixtures in a fluidized bed can complement the understanding about the mixing mechanism acquired by this experiment. Moreover, the experimental results in the present research can provide useful data for model validation in the dynamic modeling. The dynamic modeling of the lateral mixing of binary solids in bubbling fluidized beds will be conducted in our on-going research.
5. Conclusions
A novel experimental approach for the lateral mixing of binary solids in bubbling fluidized beds was developed based on the capacitance probe method. The micro mixing ratios and their standard deviations at different lateral positions of a fluidized bed which can be assumed as one mixing cell were analyzed to characterize the effect of convection and diffusion on lateral mixing of solids. A micro lateral dispersion coefficient was proposed to characterize the lateral mixing of solids within the mixing cell, and a micro mixing index was proposed to determine the lateral mixing quality. Compared with former research in which the effect of convection and diffusion are lumped into one effective dispersion coefficient to characterize the lateral mixing process, the effect of convection and diffusion mechanism on mixing was evaluated individually. The main conclusions are as follows.
- The micro lateral dispersion coefficient within the mixing cell mainly falls between 0.005 and 0.025 m/s. At the lower part of fluidized bed, convection has a more important effect on mixing process, whereas mixing at half radius is mainly accomplished by diffusion. Convection becomes more important for lateral mixing at the higher part of the bed.
- At the higher part of fluidized bed, solids mixing is fastest at the center line and slows down when increasing the distance from the center line. However, at the lower part of fluidized bed, solids mixing at the half radius is the fastest whereas mixing at the center line is the slowest.
- Gas velocity has a more important effect on the mixing at the half radius and center line than that near the wall. With the increase of gas velocity, the lateral distribution of the mixing index becomes a parabolic. Asymmetric distributions of mixing index are formed when the lateral and four-corner segregated static beds are used. When four-corner segregated static bed is used, the lateral mixing of binary solids is fastest. Dead areas of mixing are formed when lateral and four-corner segregated static beds are used, and the dead area is larger for the lateral segregated static bed.
Author Contributions
Conceptualization, methodology, software, validation, formal analysis, H.L. and J.H.; investigation, resources, data curation, writing—original draft preparation, Z.L.; writing—review and editing, visualization, supervision, M.L.; project administration, funding acquisition, C.J.; All authors have read and agreed to the published version of the manuscript.
Funding
This work was financially supported by the National Natural Science Foundation of China through contract Nos. 52006111 and 52076113, and the Natural Science Foundation of Shandong Academy of Sciences through contract Nos. 2020QN008, 2019No.2 and 2020KJC-GH04, and the Shandong Provincial Key Research and Development Program through contract No. 2019GSF109074.
Conflicts of Interest
The authors declare no conflict of interest.
Abbreviation
| C | Capacitance of the probe sensor |
| D | Macro lateral dispersion coefficient of solids |
| Dm | Micro lateral dispersion coefficient |
| F | Volume fraction of tracer particles |
| Fa | Volume fraction of air in measuring field of capacitance probe sensor |
| Ff | Volume fraction of light particles in measuring field |
| fi | Micro mixing ratio of ith particle in measuring field |
| fj | Micro mixing ratio of dense particles in measuring field |
| Fj | Volume fraction of dense particles in measuring field |
| Im | Micro mixing index at the measurement point |
| n | Number of kind of particles |
| t | Mixing time |
| v | Output signal of the capacitance probe measurement system |
| va | Output signal when the capacitance probe is exposed in air |
| vf | Output signal assuming that measuring field is filled with pure substance of light particles |
| Vf | Output signal when the capacitance probe is immersed in light particles |
| vj | Output signal assuming that measuring field is filled with pure substance of dense particles |
| Vj | Output signal when the capacitance probe is immersed in dense particles |
References
- Chanchal, L.; Himadri, C.; Pradip, K.C. Assessment of drag models in simulating bubbling fluidized bed hydrodynamics. Chem. Eng. Sci. 2012, 75, 400–407. [Google Scholar]
- Busciglio, A.; Vella, G.; Micale, G. Analysis of the bubbling behaviour of 2D gas solid fluidized beds: Part II. Comparison between experiments and numerical simulations via Digital Image Analysis Technique. Chem. Eng. J. 2009, 148, 145–163. [Google Scholar] [CrossRef]
- Matthias, S.; Teklay, A.; Hans, K. Numerical and experimental investigation of bubbling gas solid fluidized beds with dense immersed tube bundles. Ind. Eng. Chem. Res. 2011, 50, 7653–7666. [Google Scholar]
- Lv, B.; Luo, Z.F.; Zhang, B.; Qin, X.Z. Particle mixing and separation performance of gas-solid separation fluidized beds containing binary mixtures. Fuel 2018, 226, 462–471. [Google Scholar] [CrossRef]
- Pei, P.; Zhang, K.; Yu, B. Dynamic characteristics of binary mixtures in a two-jet fluidized bed. Chem. Eng. Sci. 2011, 66, 1702–1714. [Google Scholar] [CrossRef]
- Köhler, A.; Cano-Pleite, E.; Soria-Verdugo, A.; Pallarès, D.; Johnsson, F. Modeling the motion of fuel particles in a fluidized bed. Fuel 2021, 305, 121424. [Google Scholar] [CrossRef]
- Zahra, A.; Salman, M. Bubble-induced particle mixing in a 2-D gas-solid fluidized bed with different bed aspect ratios: A CFD-DPM study. Powder Technol. 2017, 320, 637–645. [Google Scholar]
- Almendros-Ibáñez, J.A.; Sobrino, C.; Vega, M.D.; Santana, D. A new model for ejected particle velocity from erupting bubbles in 2-D fluidized beds. Chem. Eng. Sci. 2006, 61, 5981–5990. [Google Scholar] [CrossRef] [Green Version]
- Sánchez-Delgado, S.; Marugán-Cruz, C.; Acosta-Iborra, A.; Santana, D. Dense-phase velocity fluctuation in a 2-D fluidized bed. Powder Technol. 2010, 200, 37–45. [Google Scholar] [CrossRef] [Green Version]
- Rowe, P.N.; Partridge, B.A. An X-ray study of bubbles in fluidised beds. Trans. Inst. Chem. Eng. 1965, 43, 157–175. [Google Scholar] [CrossRef]
- Olsson, J.; Pallarès, D.; Johnsson, F. Lateral fuel dispersion in a large-scale bubbling fluidized bed. Chem. Eng. Sci. 2012, 74, 148–159. [Google Scholar] [CrossRef]
- Sette, E.; Pallarès, D.; Johnsson, F. Experimental quantification of lateral mixing of fuels in fluid-dynamically down-scaled bubbling fluidized beds. Appl. Energy 2014, 136, 671–681. [Google Scholar] [CrossRef]
- Sette, E.; Pallarès, D.; Johnsson, F. Influence of bulk solids cross-flow on lateral mixing of fuel in dual fluidized beds. Fuel Process. Technol. 2015, 140, 245–251. [Google Scholar] [CrossRef]
- Liu, D.; Chen, X. Lateral solids dispersion coefficient in large-scale fluidized beds. Combust. Flame 2010, 157, 2116–2124. [Google Scholar] [CrossRef]
- Sette, E.; Pallarès, D.; Johnsson, F. Experimental evaluation of lateral mixing of bulk solids in a fluid-dynamically down-scaled bubbling fluidized bed. Powder Technol. 2014, 263, 74–80. [Google Scholar] [CrossRef]
- Castilla, G.M.; Larsson, A.; Lundberg, L.; Johnsson, F.; Pallarès, D. A novel experimental method for determining lateral mixing of solids in fluidized beds-Quantification of the splash-zone contribution. Powder Technol. 2020, 370, 96–103. [Google Scholar] [CrossRef]
- Shi, Y.F.; Fan, L.T. Lateral mixing of solids in batch gas-solids fluidized beds. Ind. Eng. Chem. Process Des. Dev. 1984, 23, 337–341. [Google Scholar] [CrossRef]
- Berruti, F.; Scott, D.S.; Rhodes, E. Measuring and modelling lateral solid mixing in a three-dimensional batch gas-solid fluidized bed reactor. Can. J. Chem. Eng. 1986, 64, 48–56. [Google Scholar] [CrossRef]
- Liu, D.; Chen, X. Experimental profiles of lateral mixing of feed particles in a three-dimensional fluidized bed. AIChE J. 2011, 57, 1459–1469. [Google Scholar] [CrossRef]
- Niklasson, F.; Thunman, H.; Johnsson, F.; Leckner, B. Estimation of solids mixing in a fluidized-bed combustor. Ind. Eng. Chem. Res. 2002, 41, 4663–4673. [Google Scholar] [CrossRef]
- Muller, C.R.; Holland, D.J.; Sederman, A.J.; Mantle, M.D.; Gladden, L.F.; Davidson, J.F. Magnetic resonance imaging of fluidized beds. Powder Technol. 2008, 183, 53–62. [Google Scholar] [CrossRef]
- Glicksman, L.; Carr, E.; Noymer, P. Particle injection and mixing experiments in a one-quarter scale model bubbling fluidized bed. Powder Technol. 2008, 180, 284–288. [Google Scholar] [CrossRef]
- Schlichthaerle, P.; Werther, J. Solids mixing in the bottom zone of a circulating fluidized bed. Powder Technol. 2001, 120, 21–33. [Google Scholar] [CrossRef]
- Stein, M.; Ding, Y.L.; Seville, J.P.K.; Parker, D.J. Solids motion in bubbling gas fluidised beds. Chem. Eng. Sci. 2000, 55, 5291–5300. [Google Scholar] [CrossRef]
- Li, Y.; Rong, J.; Zhang, K.; Fan, X. Impact of solid and gas flow patterns on solid mixing in bubbling fluidized beds. Chem. Eng. Res. Des. 2018, 132, 1037–1053. [Google Scholar] [CrossRef]
- Breault, R.W. A review of gas–solid dispersion and mass transfer coefficient correlations in circulating fluidized beds. Powder Technol. 2006, 163, 9–17. [Google Scholar] [CrossRef]
- Sette, E.; Berdugo, V.T.; Pallarès, D.; Johnsson, F. Measuring fuel mixing under industrial fluidized-bed conditions-a camera-probe based fuel tracking system. Appl. Energy 2016, 163, 304–312. [Google Scholar] [CrossRef]
- Sánchez-Prieto, J.; Hernández-Jiménez, F.; Garcia-Gutierrez, L.M.; Soria-Verdugo, A. Experimental study on the characteristic mixing time of solids and its link with the lateral dispersion coefficient in bubbling fluidized beds. Chem. Eng. J. 2017, 307, 113–121. [Google Scholar] [CrossRef]
- Jin, B.S.; Zhang, Y.; Zhong, W.Q.; Xiao, R. Experimental Study of the Effect of Particle Density on Mixing Behavior in a Spout-Fluid Bed. Ind. Eng. Chem. Res. 2009, 48, 10055–10064. [Google Scholar] [CrossRef]
- Umekawa, H.; Furui, S.; Oshima, Y.; Okura, M. Quantitative measurement of segregation phenomena in a binary-mixture fluidized bed by neutron radiography. Nucl. Instrum. Methods Phys. Res. 2005, 542, 219–225. [Google Scholar] [CrossRef]
- Wiesendorf, V.; Werther, J. Capacitance probes for solids volume concentration and velocity measurements in industrial fluidized bed reactors. Powder Technol. 2000, 110, 143–157. [Google Scholar] [CrossRef]
- Sutton, C.R.; Chen, J.C. A local transient approach to monitoring fluidization quality in freely bubbling beds. Powder Technol. 2008, 180, 296–306. [Google Scholar] [CrossRef]
- Collin, A.; Wirth, K.E.; Strder, M. Experimental characterization of the flow pattern in an annular fluidized bed. Can. J. Chem. Eng. 2008, 86, 536–542. [Google Scholar] [CrossRef]
- Zhang, Y.; Jin, B.S.; Zhong, W.Q. Experimental investigation on mixing and segregation behavior of biomass particle in fluidized bed. Chem. Eng. Process. 2009, 48, 745–754. [Google Scholar] [CrossRef]
- Gorji-Kandi, S.; Alavi-Amleshi, S.M.; Mostoufi, N. A solids mixing rate correlation for small scale fluidized beds. Particuology 2015, 21, 55–64. [Google Scholar] [CrossRef]
- Davidson, J.F.; Harrison, D. Fluidized Particles; Cambridge University Press: London, UK, 1963; p. 33. [Google Scholar]
- Maurer, S.; Wagner, E.C.; Schildhauer, T.J. X-ray measurements on the influence of optical probes on gas–solid fluidized beds. Int. J. Multiph. Flow 2015, 74, 143–147. [Google Scholar] [CrossRef]
- Huang, J.K.; Lu, Y.J.; Jia, L. Experimental Study on the Two-Phase Flow Structure in a Supercritical Water-Fluidized Bed. Ind. Eng. Chem. Res. 2019, 58, 20099–20108. [Google Scholar] [CrossRef]
- Lu, H.L.; He, Y.R.; Gidaspow, D. Size segregation of binary mixture of solids in bubbling fluidized beds. Powder Technol. 2003, 134, 86–97. [Google Scholar]
- Mostafazadeh, M.; Rahimzadeh, H.; Hamzei, M. Numerical analysis of the mixing process in a gas–solid fluidized bed reactor. Powder Technol. 2013, 239, 422–433. [Google Scholar] [CrossRef]
- Limtrakul, S.; Chalermwattanatai, A.; Unggurawirote, K.; Tsuji, Y. Discrete particle simulation of solids motion in a gas-solid fluidized bed. Chem. Eng. Sci. 2003, 58, 915–921. [Google Scholar] [CrossRef]
- Hoomans, B.P.B.; Kuipers, J.A.M.; van Swaaij, W.P.M. Granular dynamics simulation of segregation phenomena in bubbling gas fluidised beds. Powder Technol. 2000, 109, 41–48. [Google Scholar] [CrossRef]
- Deen, N.G.; Willem, G.; Sander, G.; Kuipers, J.A.M. Numerical analysis of solids mixing in pressurized fluidized beds. Ind. Eng. Chem. Res. 2010, 49, 5246–5253. [Google Scholar] [CrossRef]
- Lacey, P. Developments in theory of particulate mixing. J. Appl. Chem. 1954, 4, 257–268. [Google Scholar] [CrossRef]
- Sahoo, A.; Roy, G.K. Mixing characteristic of homogeneous binary mixture of regular particles in a gas–solid fluidized bed. Powder Technol. 2005, 159, 150–154. [Google Scholar] [CrossRef]
Figure 1.
Structure of the capacitance probe measurement system.

Figure 2.
Comparison between the actual and measured values by the novel method.

Figure 3.
The fluidized bed system. (a) Schematic diagram of the fluidized bed experimental system. (b) Configurations of static bed.
Figure 3.
The fluidized bed system. (a) Schematic diagram of the fluidized bed experimental system. (b) Configurations of static bed.

Figure 4.
Snapshots of the mixing process of binary solids.

Figure 5.
Variations of the micro mixing ratio and its standard deviation with time at different lateral positions when the bed height is 0.25 H0. (a) Near the wall. (b) Half radius. (c) Center line.
Figure 5.
Variations of the micro mixing ratio and its standard deviation with time at different lateral positions when the bed height is 0.25 H0. (a) Near the wall. (b) Half radius. (c) Center line.

Figure 6.
Variations of the micro mixing ratio and its standard deviation with time at different lateral positions when the bed height is 0.75 H0. (a) Near the wall. (b) Half radius. (c) Center line.
Figure 6.
Variations of the micro mixing ratio and its standard deviation with time at different lateral positions when the bed height is 0.75 H0. (a) Near the wall. (b) Half radius. (c) Center line.

Figure 7.
Variations of the micro mixing ratio and its standard deviation with time at different lateral positions under different gas velocities. (a) Near the wall. (b) At the center line.
Figure 7.
Variations of the micro mixing ratio and its standard deviation with time at different lateral positions under different gas velocities. (a) Near the wall. (b) At the center line.

Figure 8.
Variations of micro mixing ratio and its standard deviation with time at different lateral positions when three static beds are used. (a) Near the wall. (b) At the center line.
Figure 8.
Variations of micro mixing ratio and its standard deviation with time at different lateral positions when three static beds are used. (a) Near the wall. (b) At the center line.

Figure 9.
The variations of micro lateral dispersion coefficient of particles with STD at different lateral positions and bed heights when uf = 1.28 uff.
Figure 9.
The variations of micro lateral dispersion coefficient of particles with STD at different lateral positions and bed heights when uf = 1.28 uff.

Figure 10.
The variations of micro lateral dispersion coefficient of particles with STD at different gas velocities. (a) Near the wall. (b) At the half-radius.
Figure 10.
The variations of micro lateral dispersion coefficient of particles with STD at different gas velocities. (a) Near the wall. (b) At the half-radius.

Figure 11.
Variations of the micro mixing index at different lateral positions with time at different bed heights. (a) h = 0.25 H0. (b) h = 0.75 H0.
Figure 11.
Variations of the micro mixing index at different lateral positions with time at different bed heights. (a) h = 0.25 H0. (b) h = 0.75 H0.

Figure 12.
Variations of lateral distribution of mixing index with gas velocity after different time. (a) t = 5 s. (b) t = 10 s. (c) t = 20 s.
Figure 12.
Variations of lateral distribution of mixing index with gas velocity after different time. (a) t = 5 s. (b) t = 10 s. (c) t = 20 s.

Figure 13.
Lateral distributions of mixing index when three static beds are used after different time. (a) t = 5 s. (b) t = 10 s.
Figure 13.
Lateral distributions of mixing index when three static beds are used after different time. (a) t = 5 s. (b) t = 10 s.


Table 1.
Physical properties of particle materials.
| Particle | Bulk Density (kg/m3) | Diameter (mm) | Relative Permittivity [32] | Stacking Angle (°) | Minimum Fluidization Velocity (m/s) |
|---|---|---|---|---|---|
| Quartz sands | 1857 | 0.77 | 3.8 | 32 | 0.76 |
| Silicon carbide | 2184 | 0.77 | 10.5 | 34 | 0.92 |
Publisher’s Note: MDPI stays neutral with regard to jurisdictional claims in published maps and institutional affiliations. |
© 2021 by the authors. Licensee MDPI, Basel, Switzerland. This article is an open access article distributed under the terms and conditions of the Creative Commons Attribution (CC BY) license (https://creativecommons.org/licenses/by/4.0/).
Share and Cite
MDPI and ACS Style
Li, H.; Huang, J.; Liu, Z.; Lv, M.; Ji, C. Experimental Quantification of the Lateral Mixing of Binary Solids in Bubbling Fluidized Beds. Energies 2021, 14, 7796. https://0-doi-org.brum.beds.ac.uk/10.3390/en14227796
AMA Style
Li H, Huang J, Liu Z, Lv M, Ji C. Experimental Quantification of the Lateral Mixing of Binary Solids in Bubbling Fluidized Beds. Energies. 2021; 14(22):7796. https://0-doi-org.brum.beds.ac.uk/10.3390/en14227796
Chicago/Turabian StyleLi, Huanan, Jikai Huang, Zhigang Liu, Mingming Lv, and Can Ji. 2021. "Experimental Quantification of the Lateral Mixing of Binary Solids in Bubbling Fluidized Beds" Energies 14, no. 22: 7796. https://0-doi-org.brum.beds.ac.uk/10.3390/en14227796
Note that from the first issue of 2016, this journal uses article numbers instead of page numbers. See further details here.