
Melting and Heat Transfer Characteristics of Urea Water Solution According to a Heating Module’s Operating Conditions in a Frozen Urea Tank


Abstract
:1. Introduction
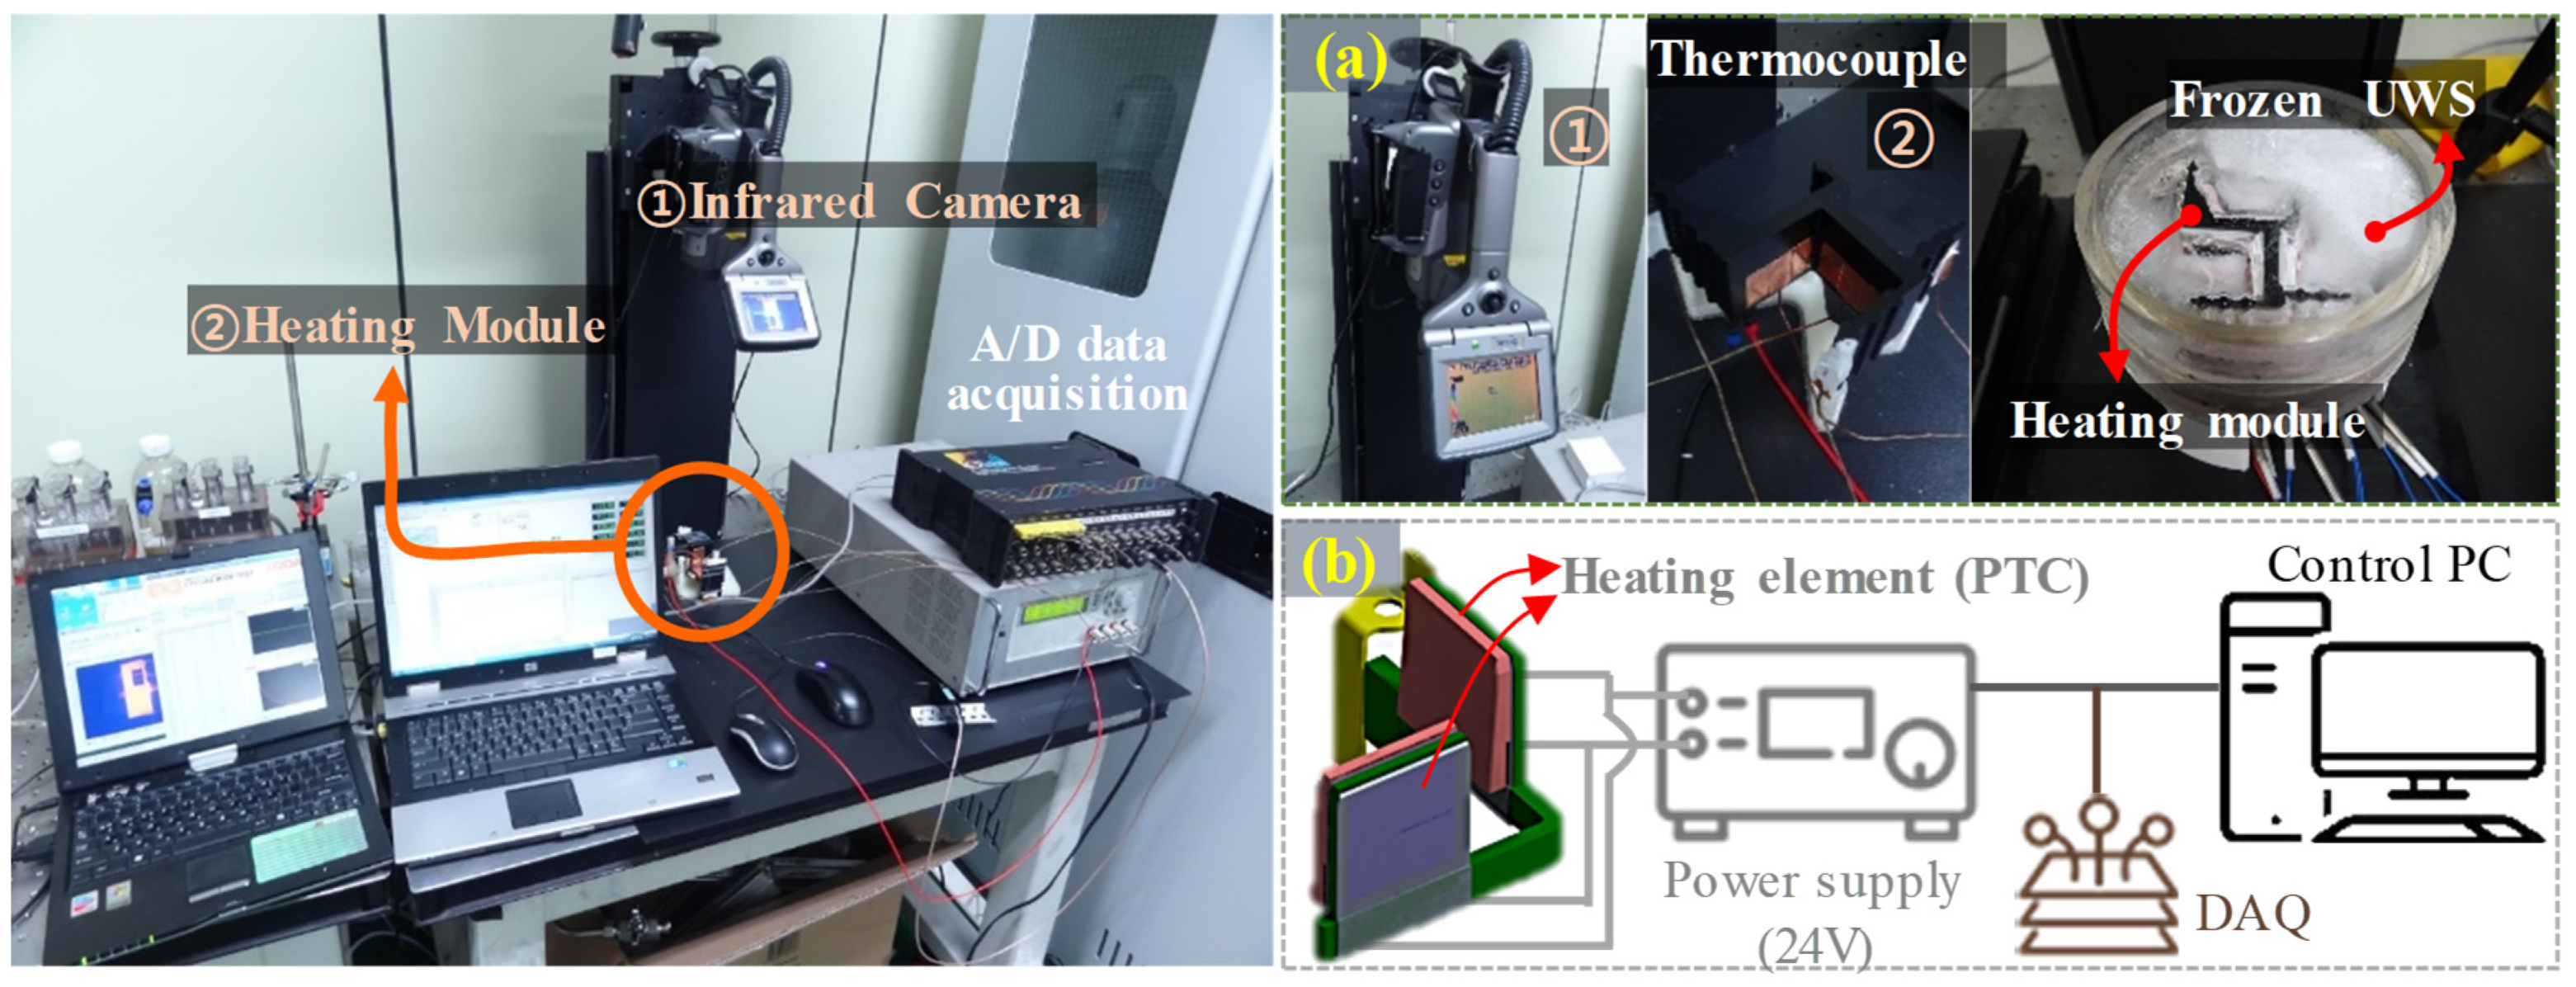
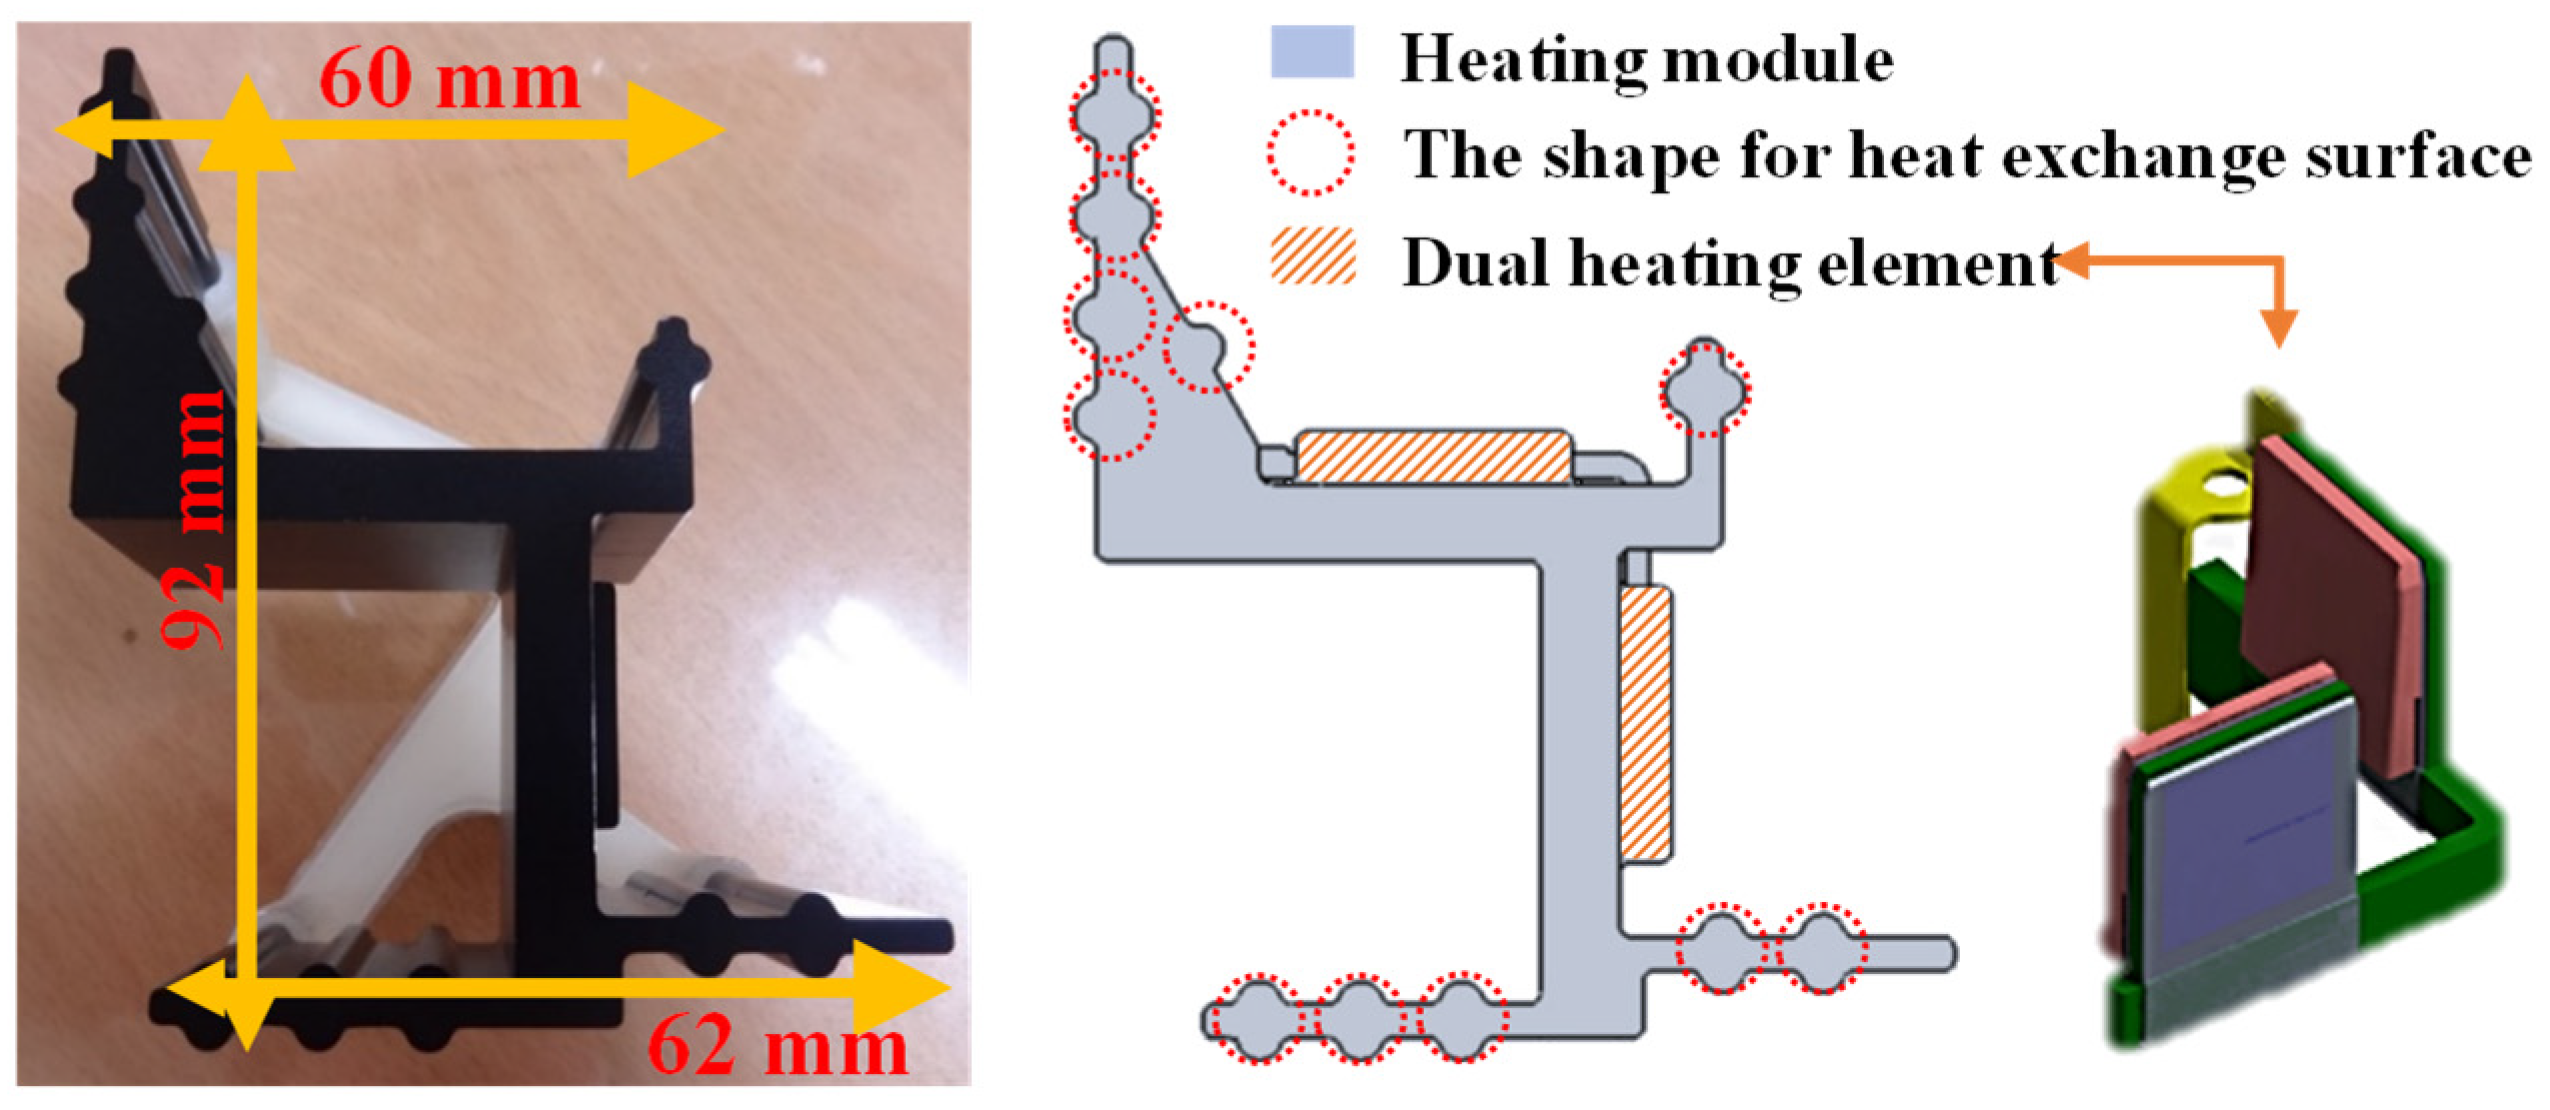
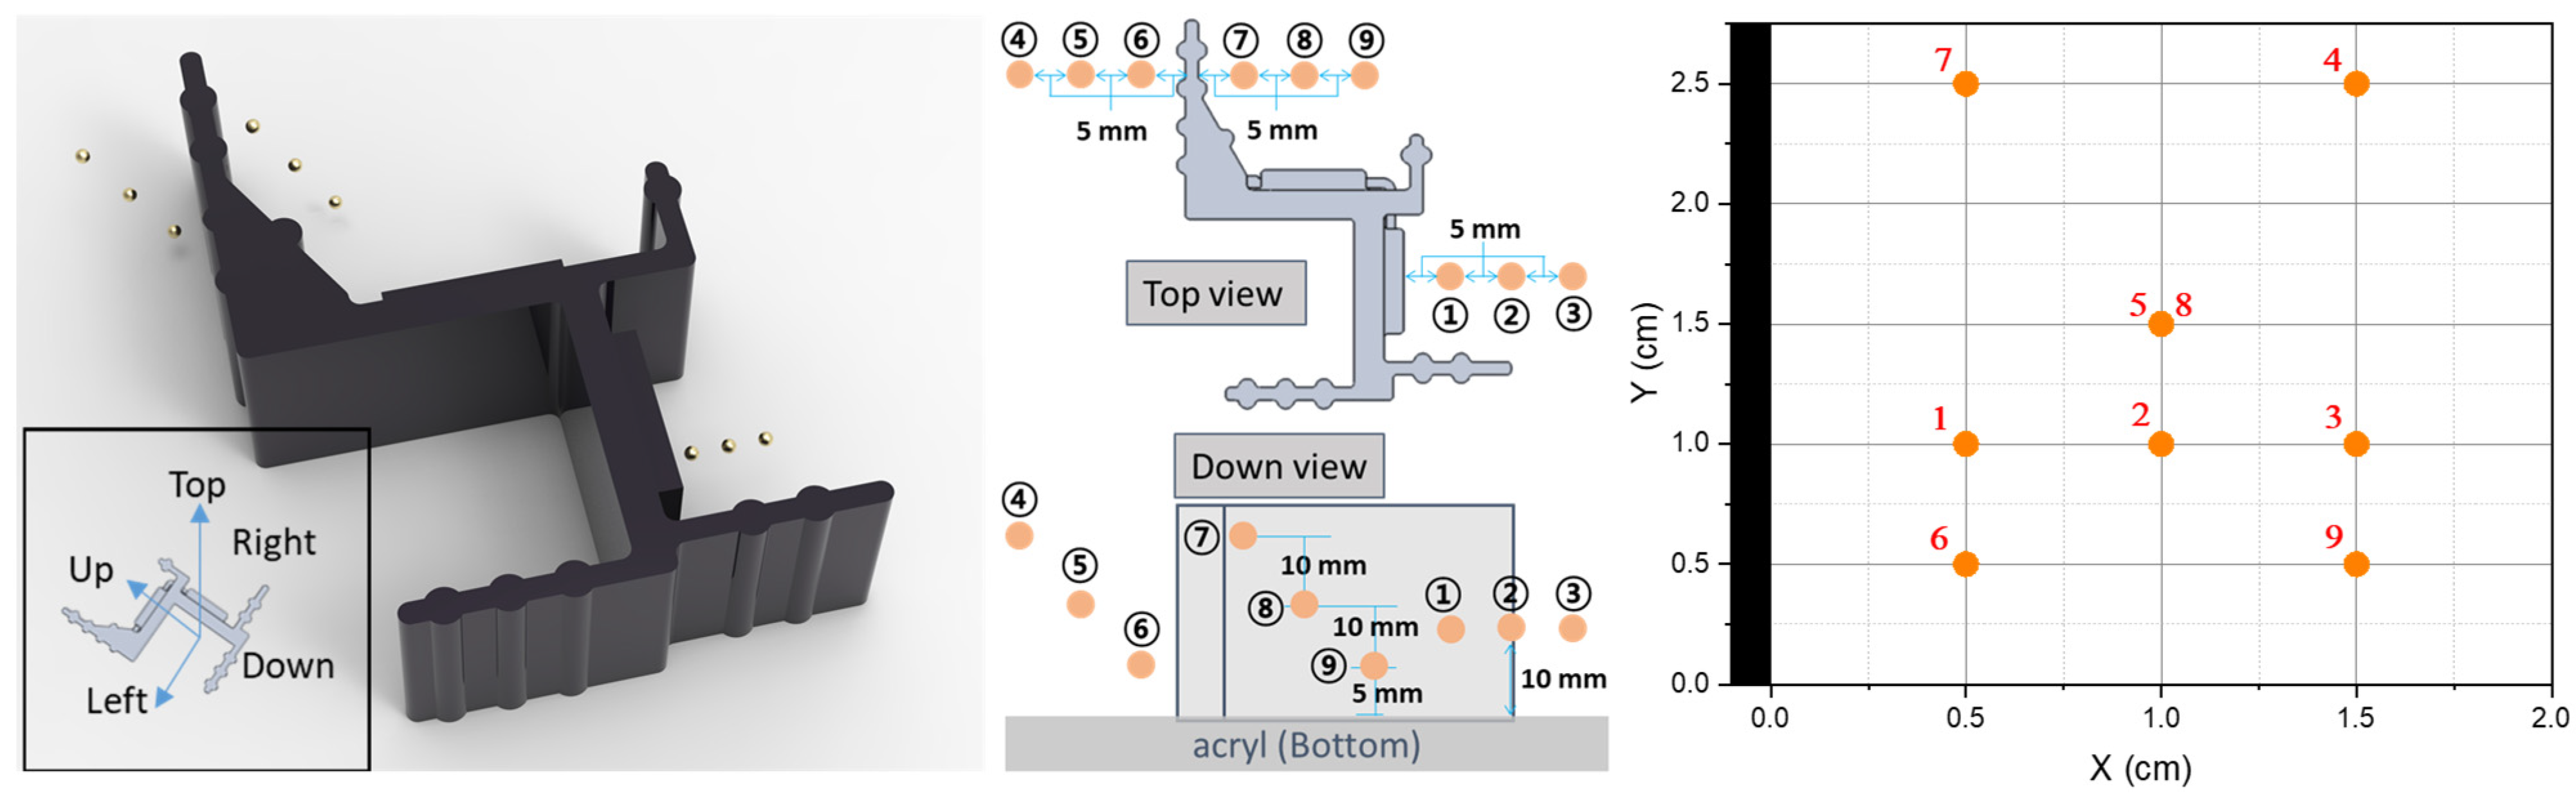
2. Experimental Setup and Method
3. Results and Discussion
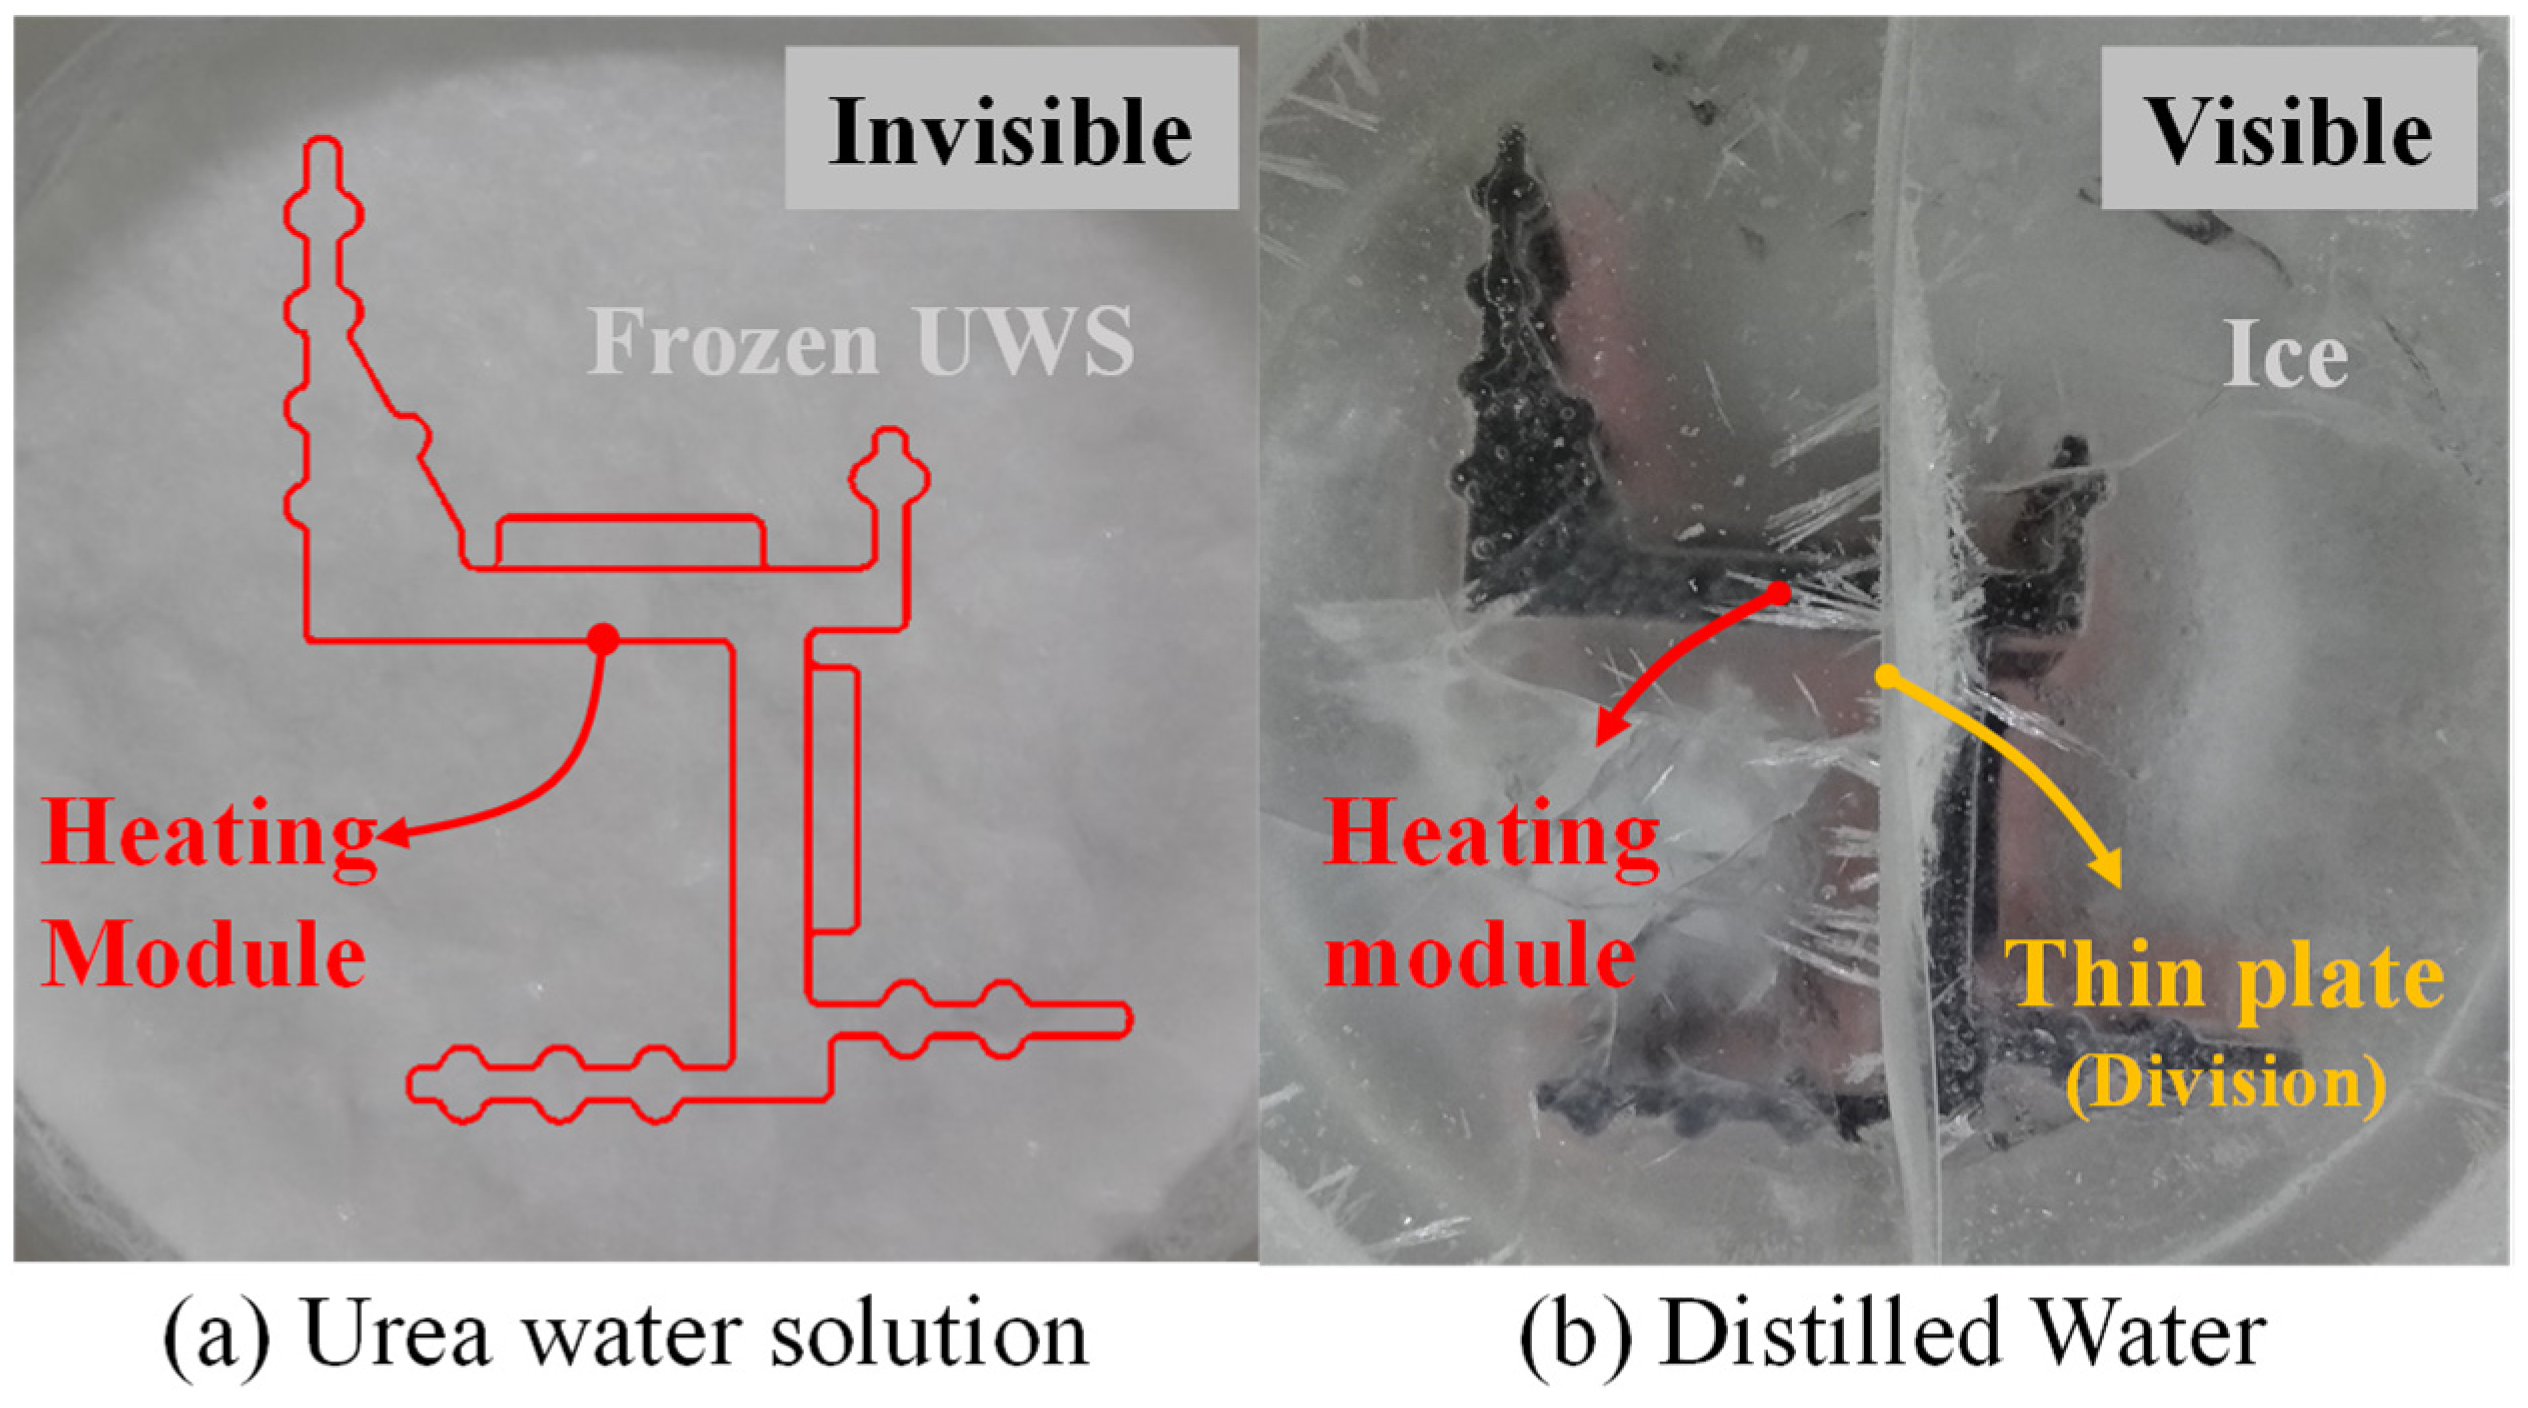
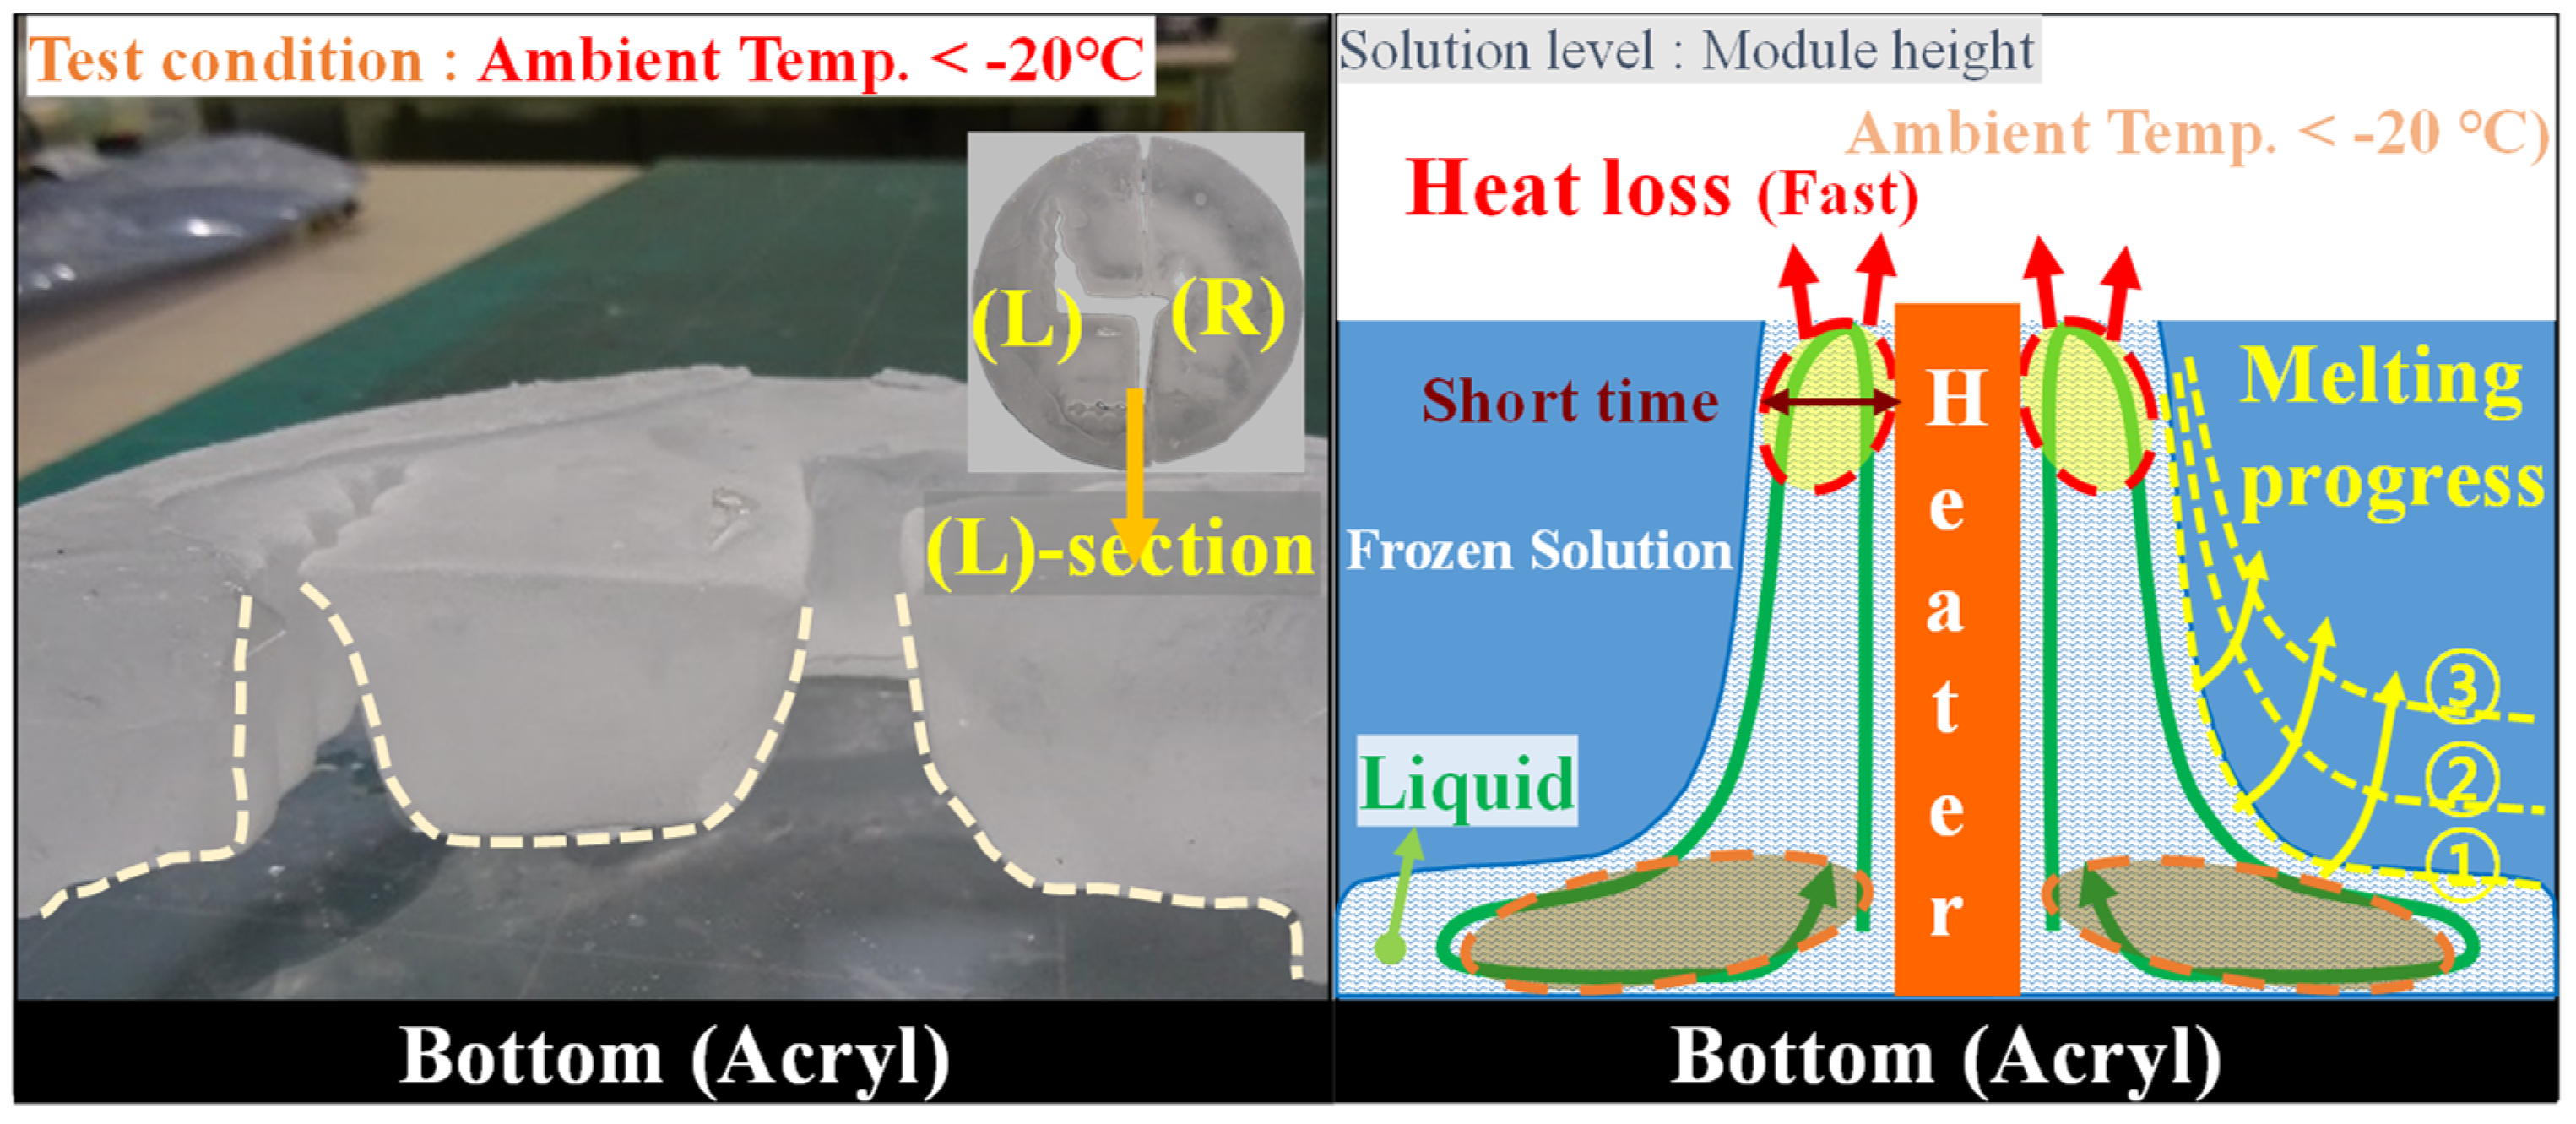
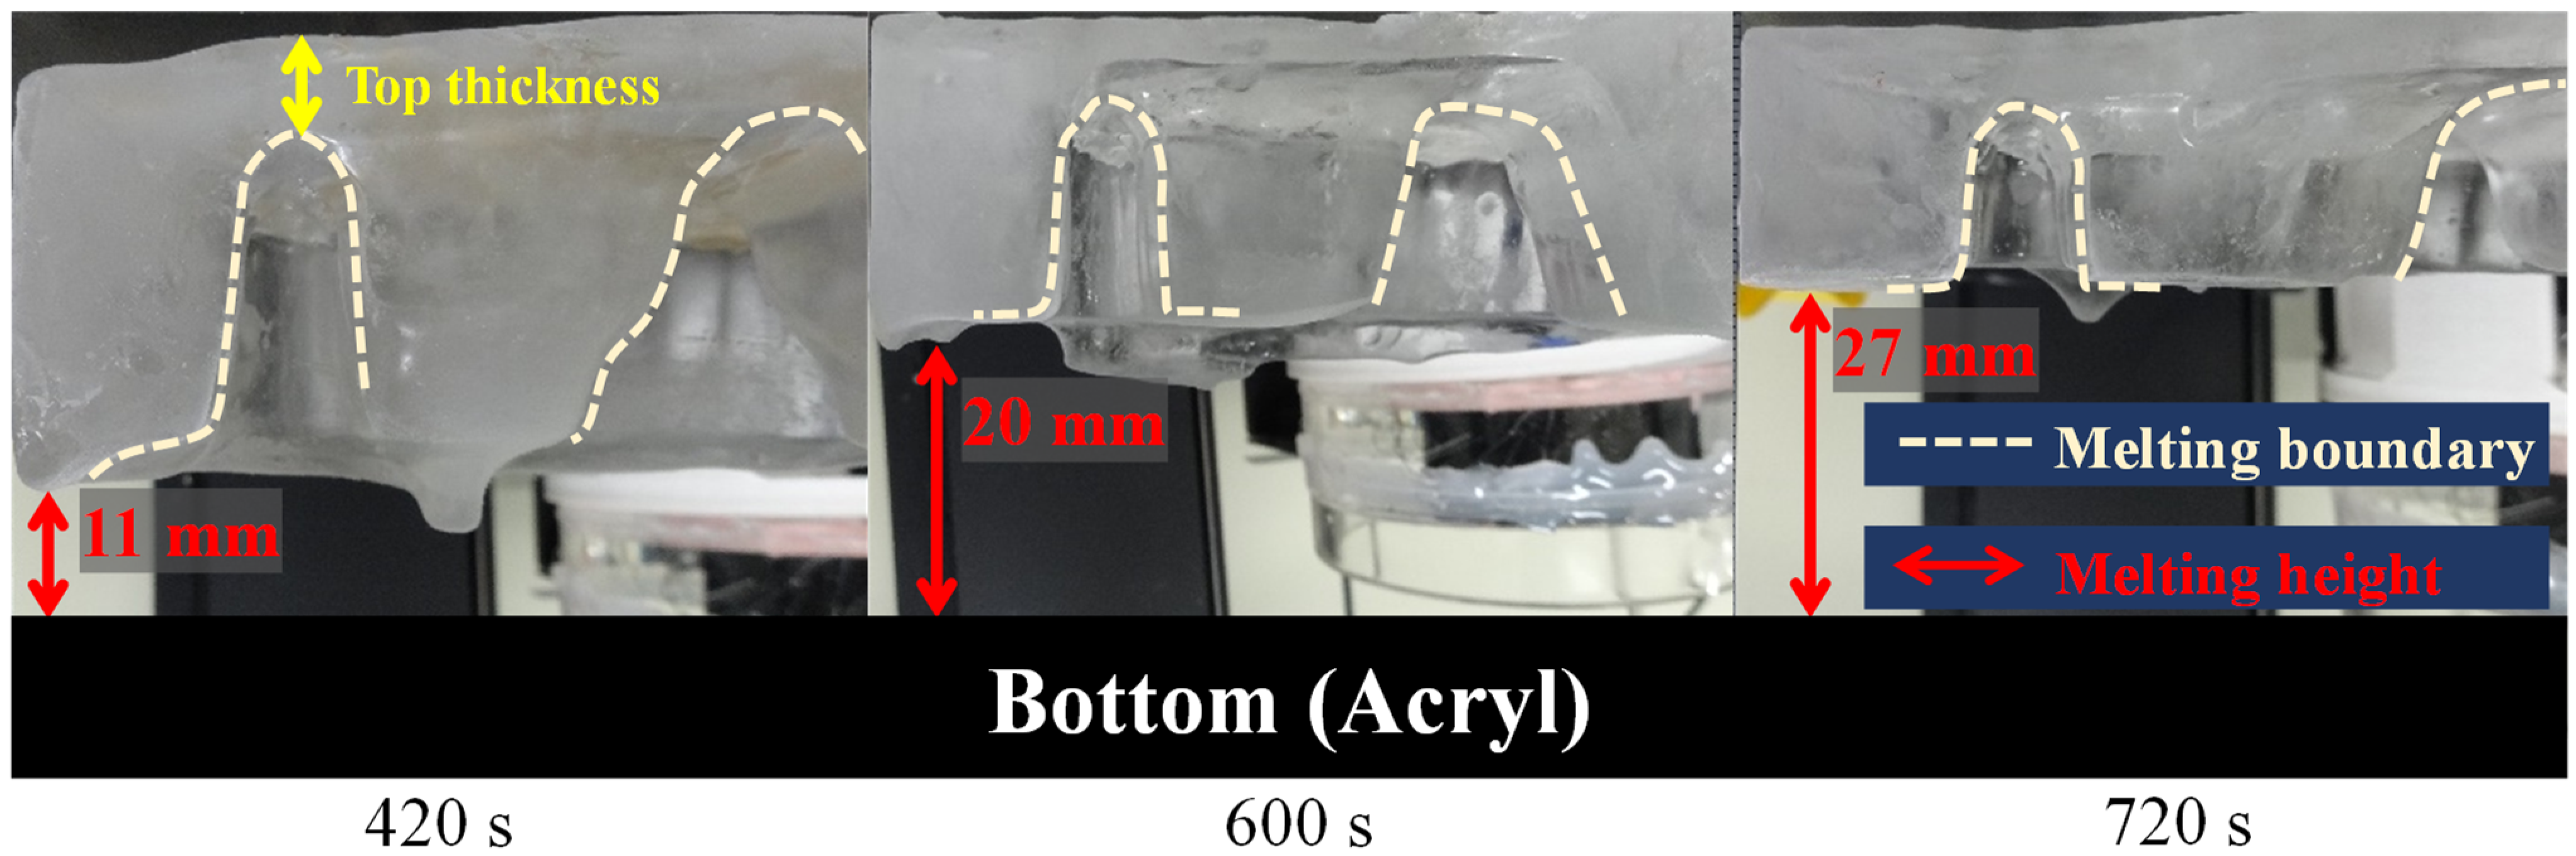
3.1. Melting Shape
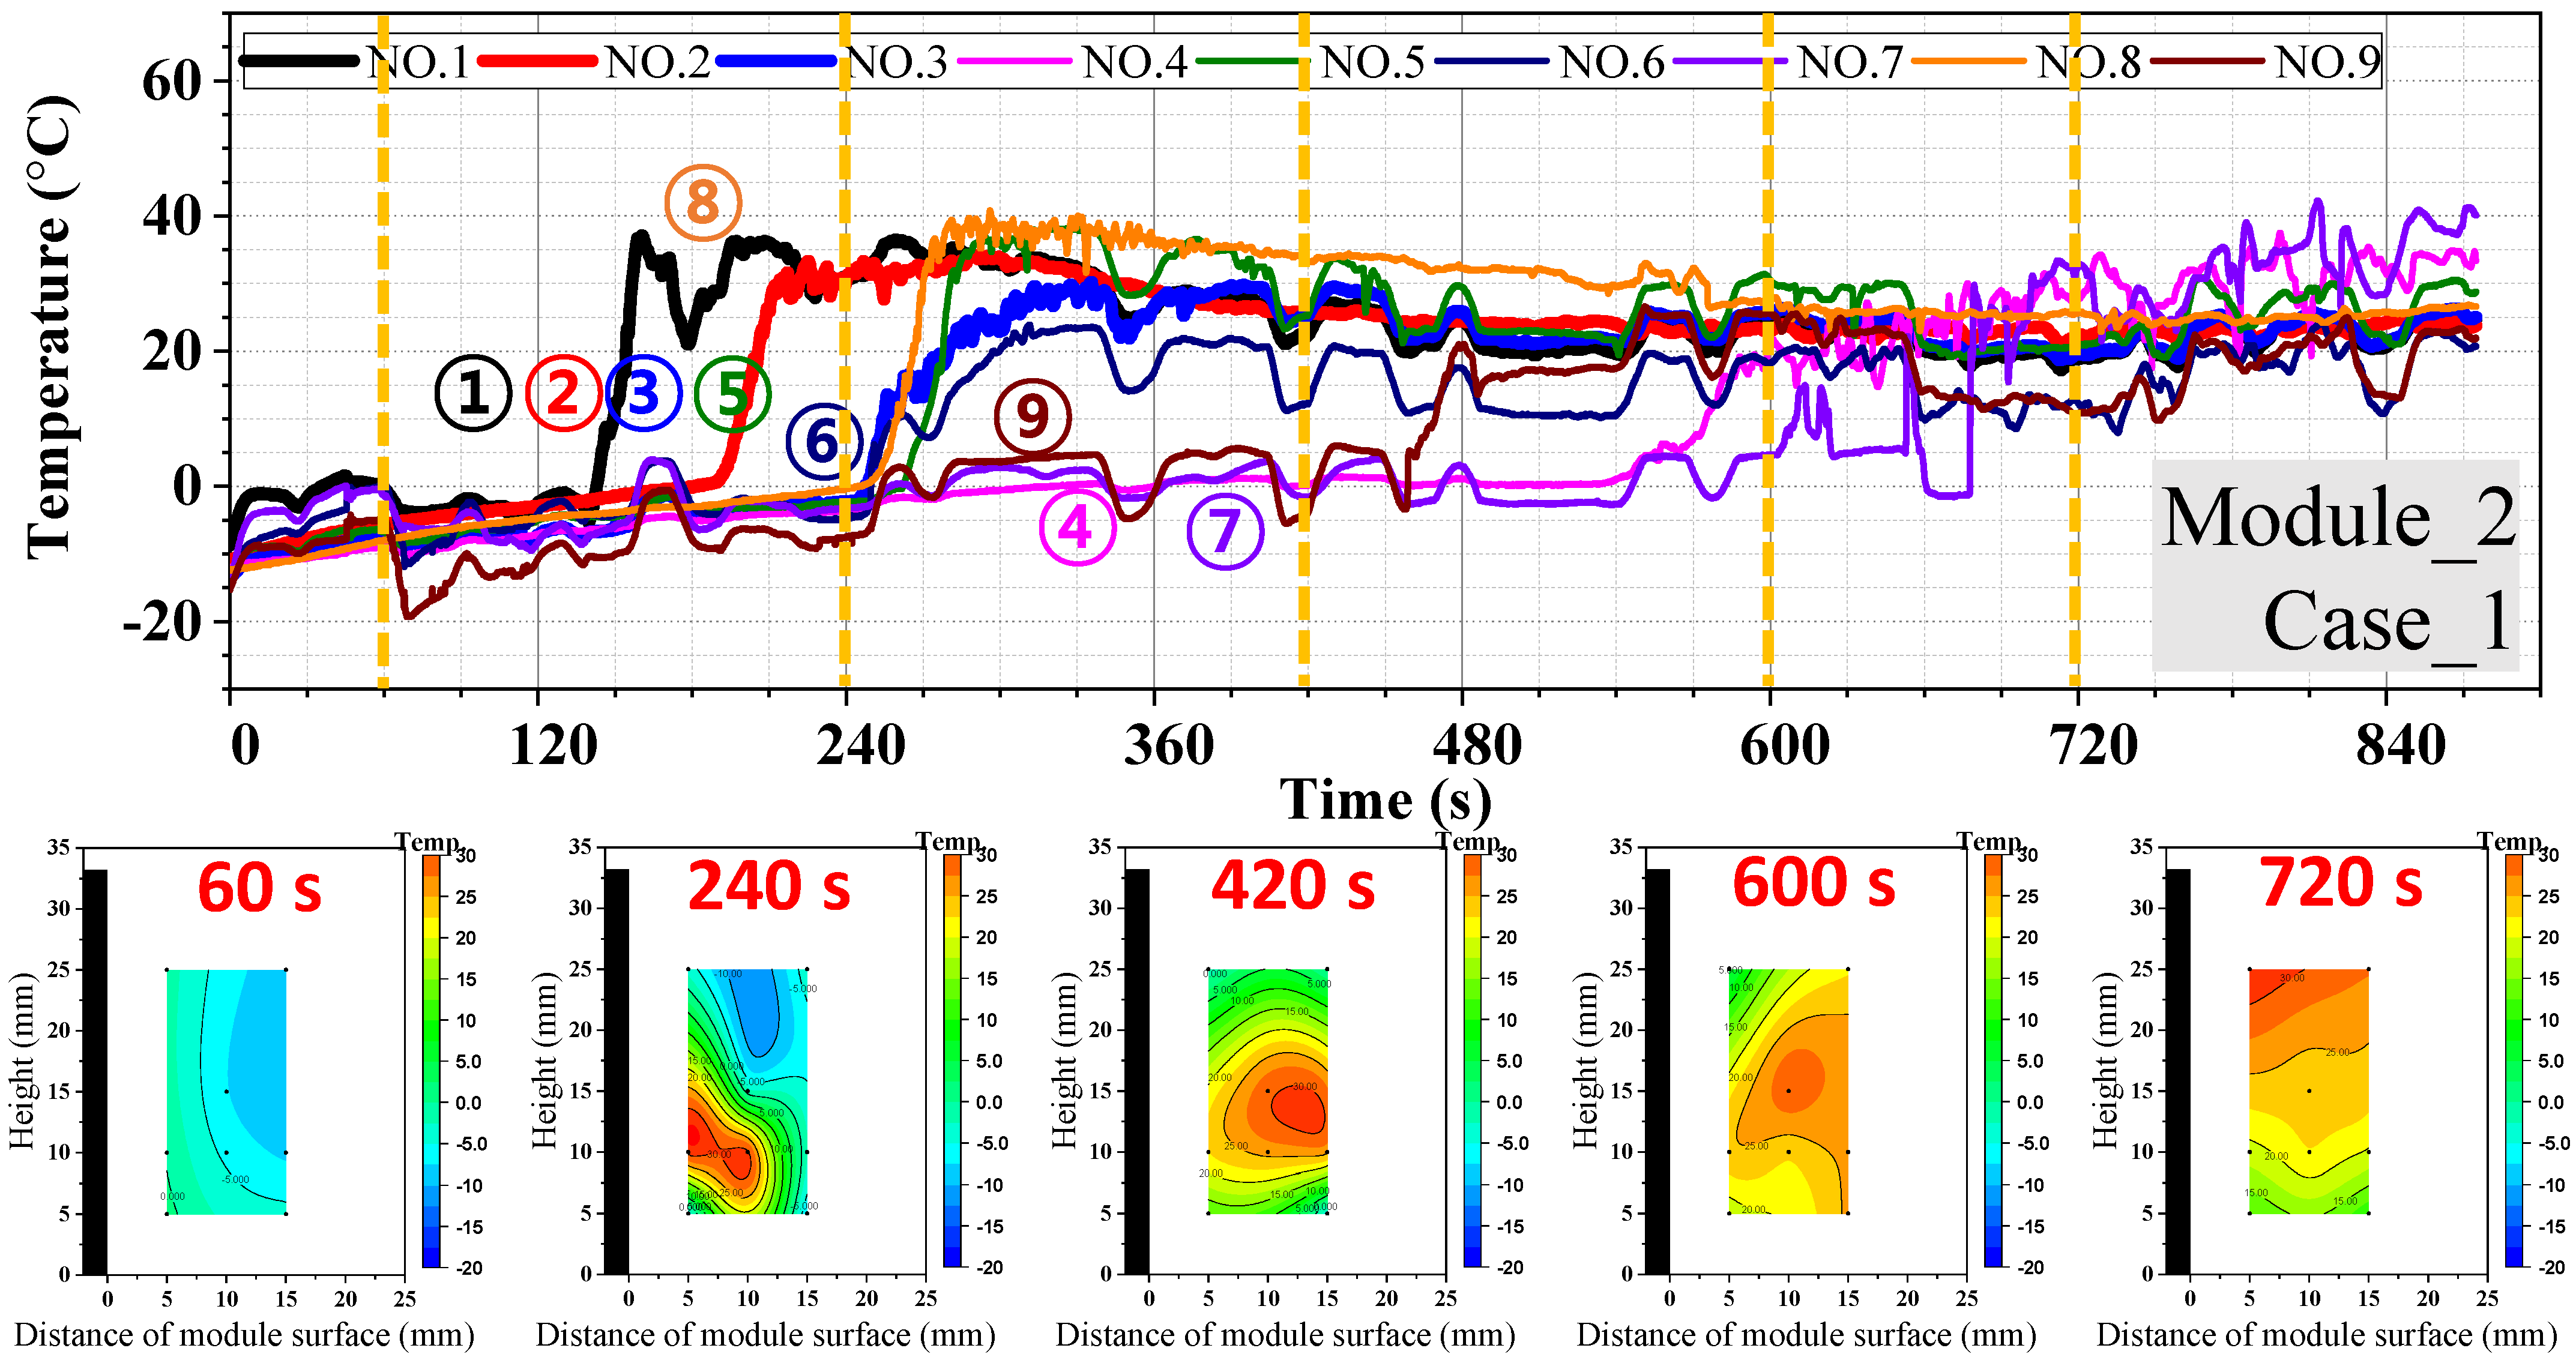
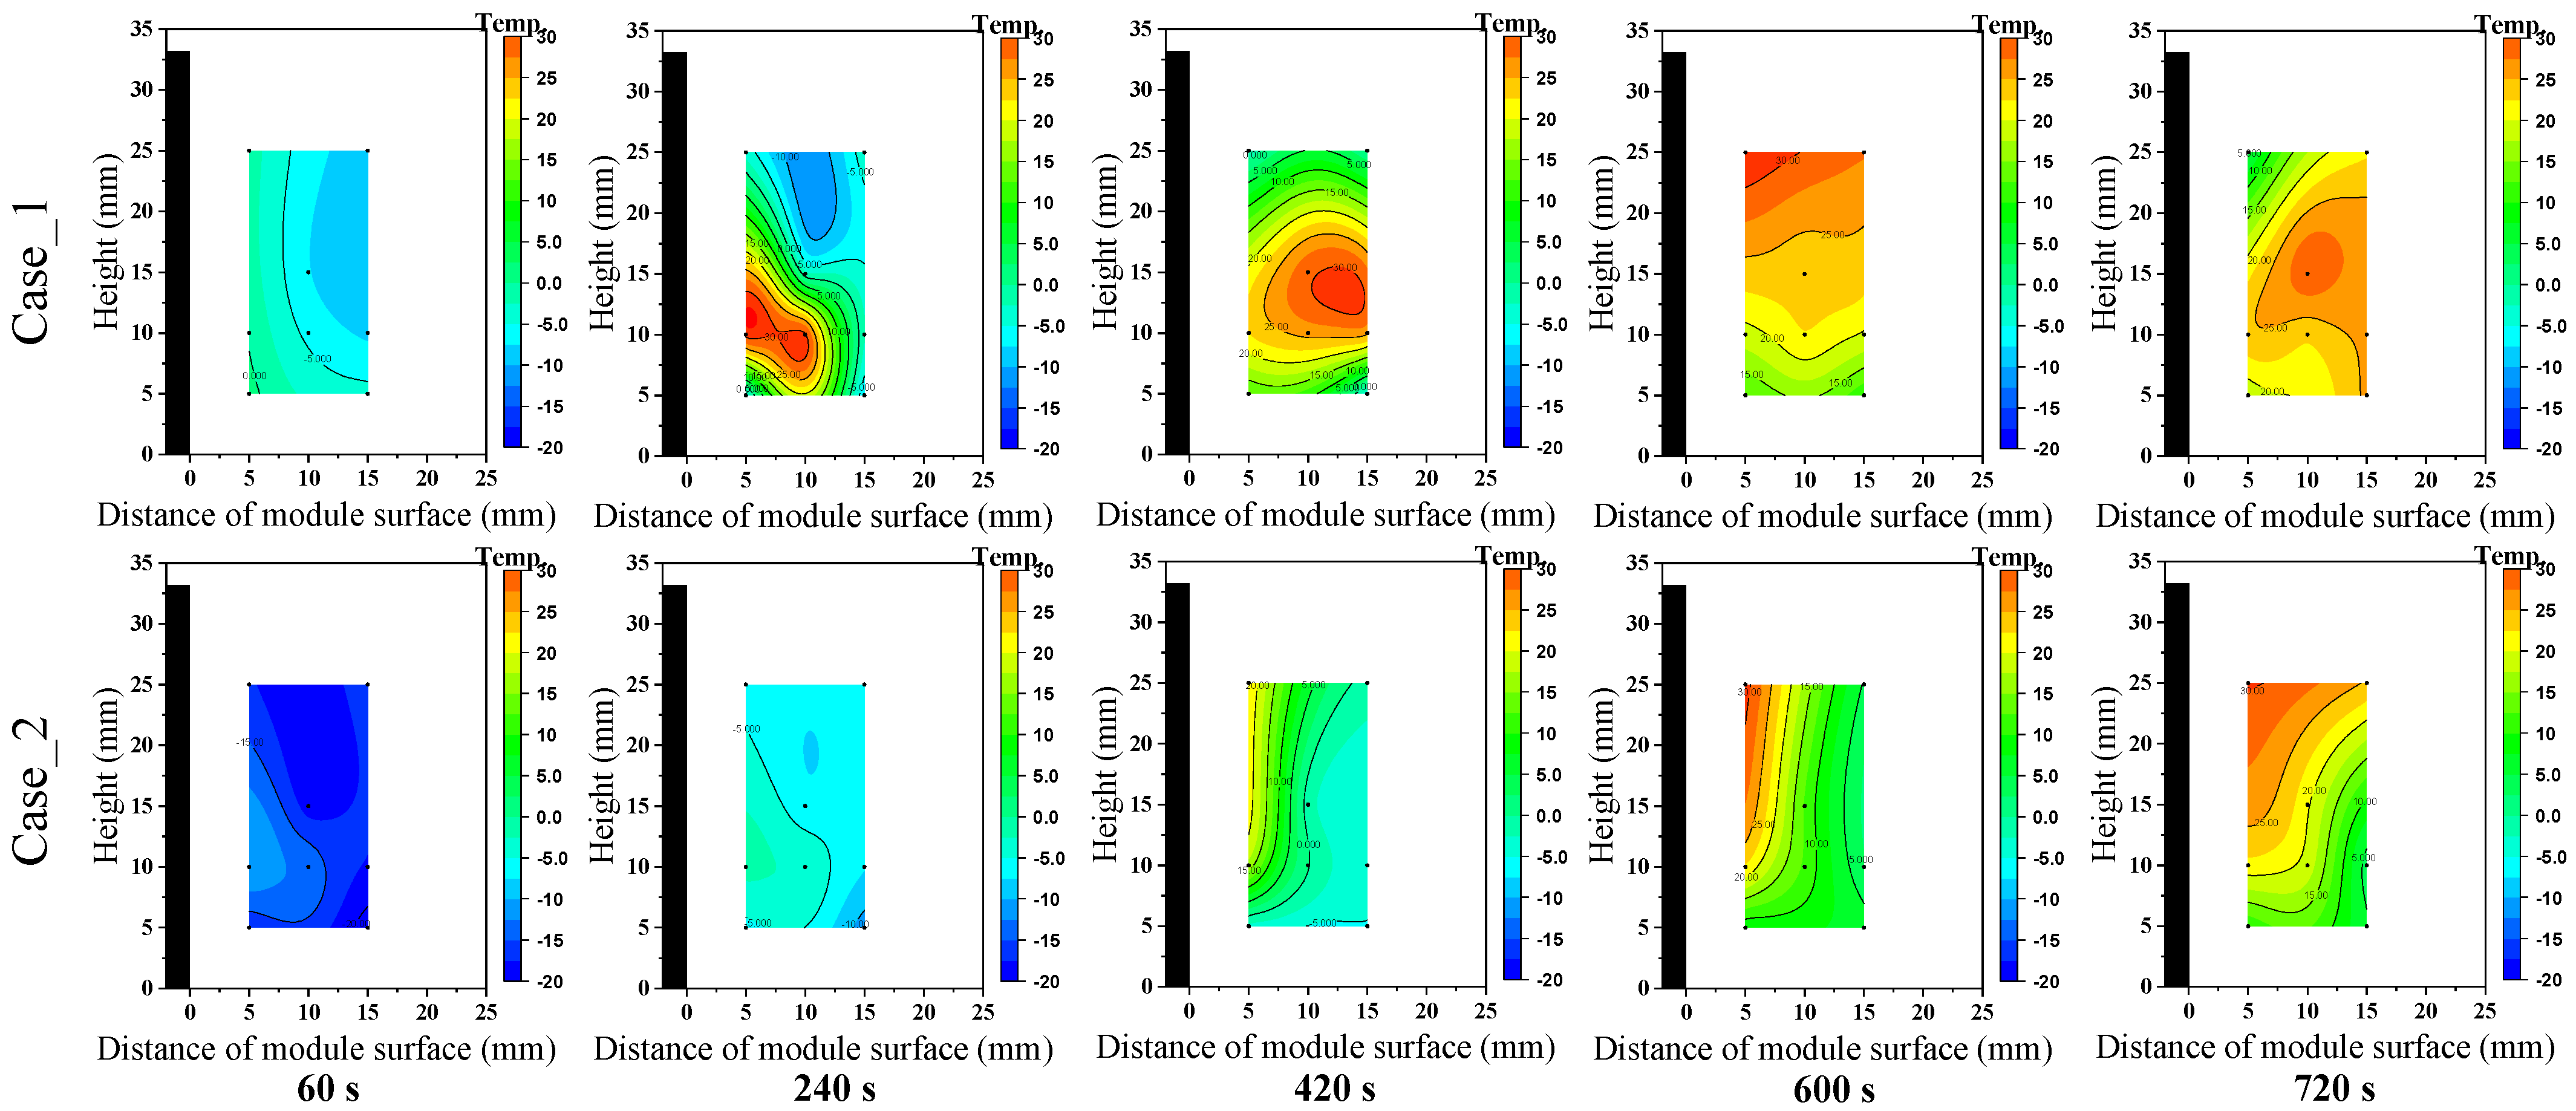
3.2. Temperature Distribution Characteristics
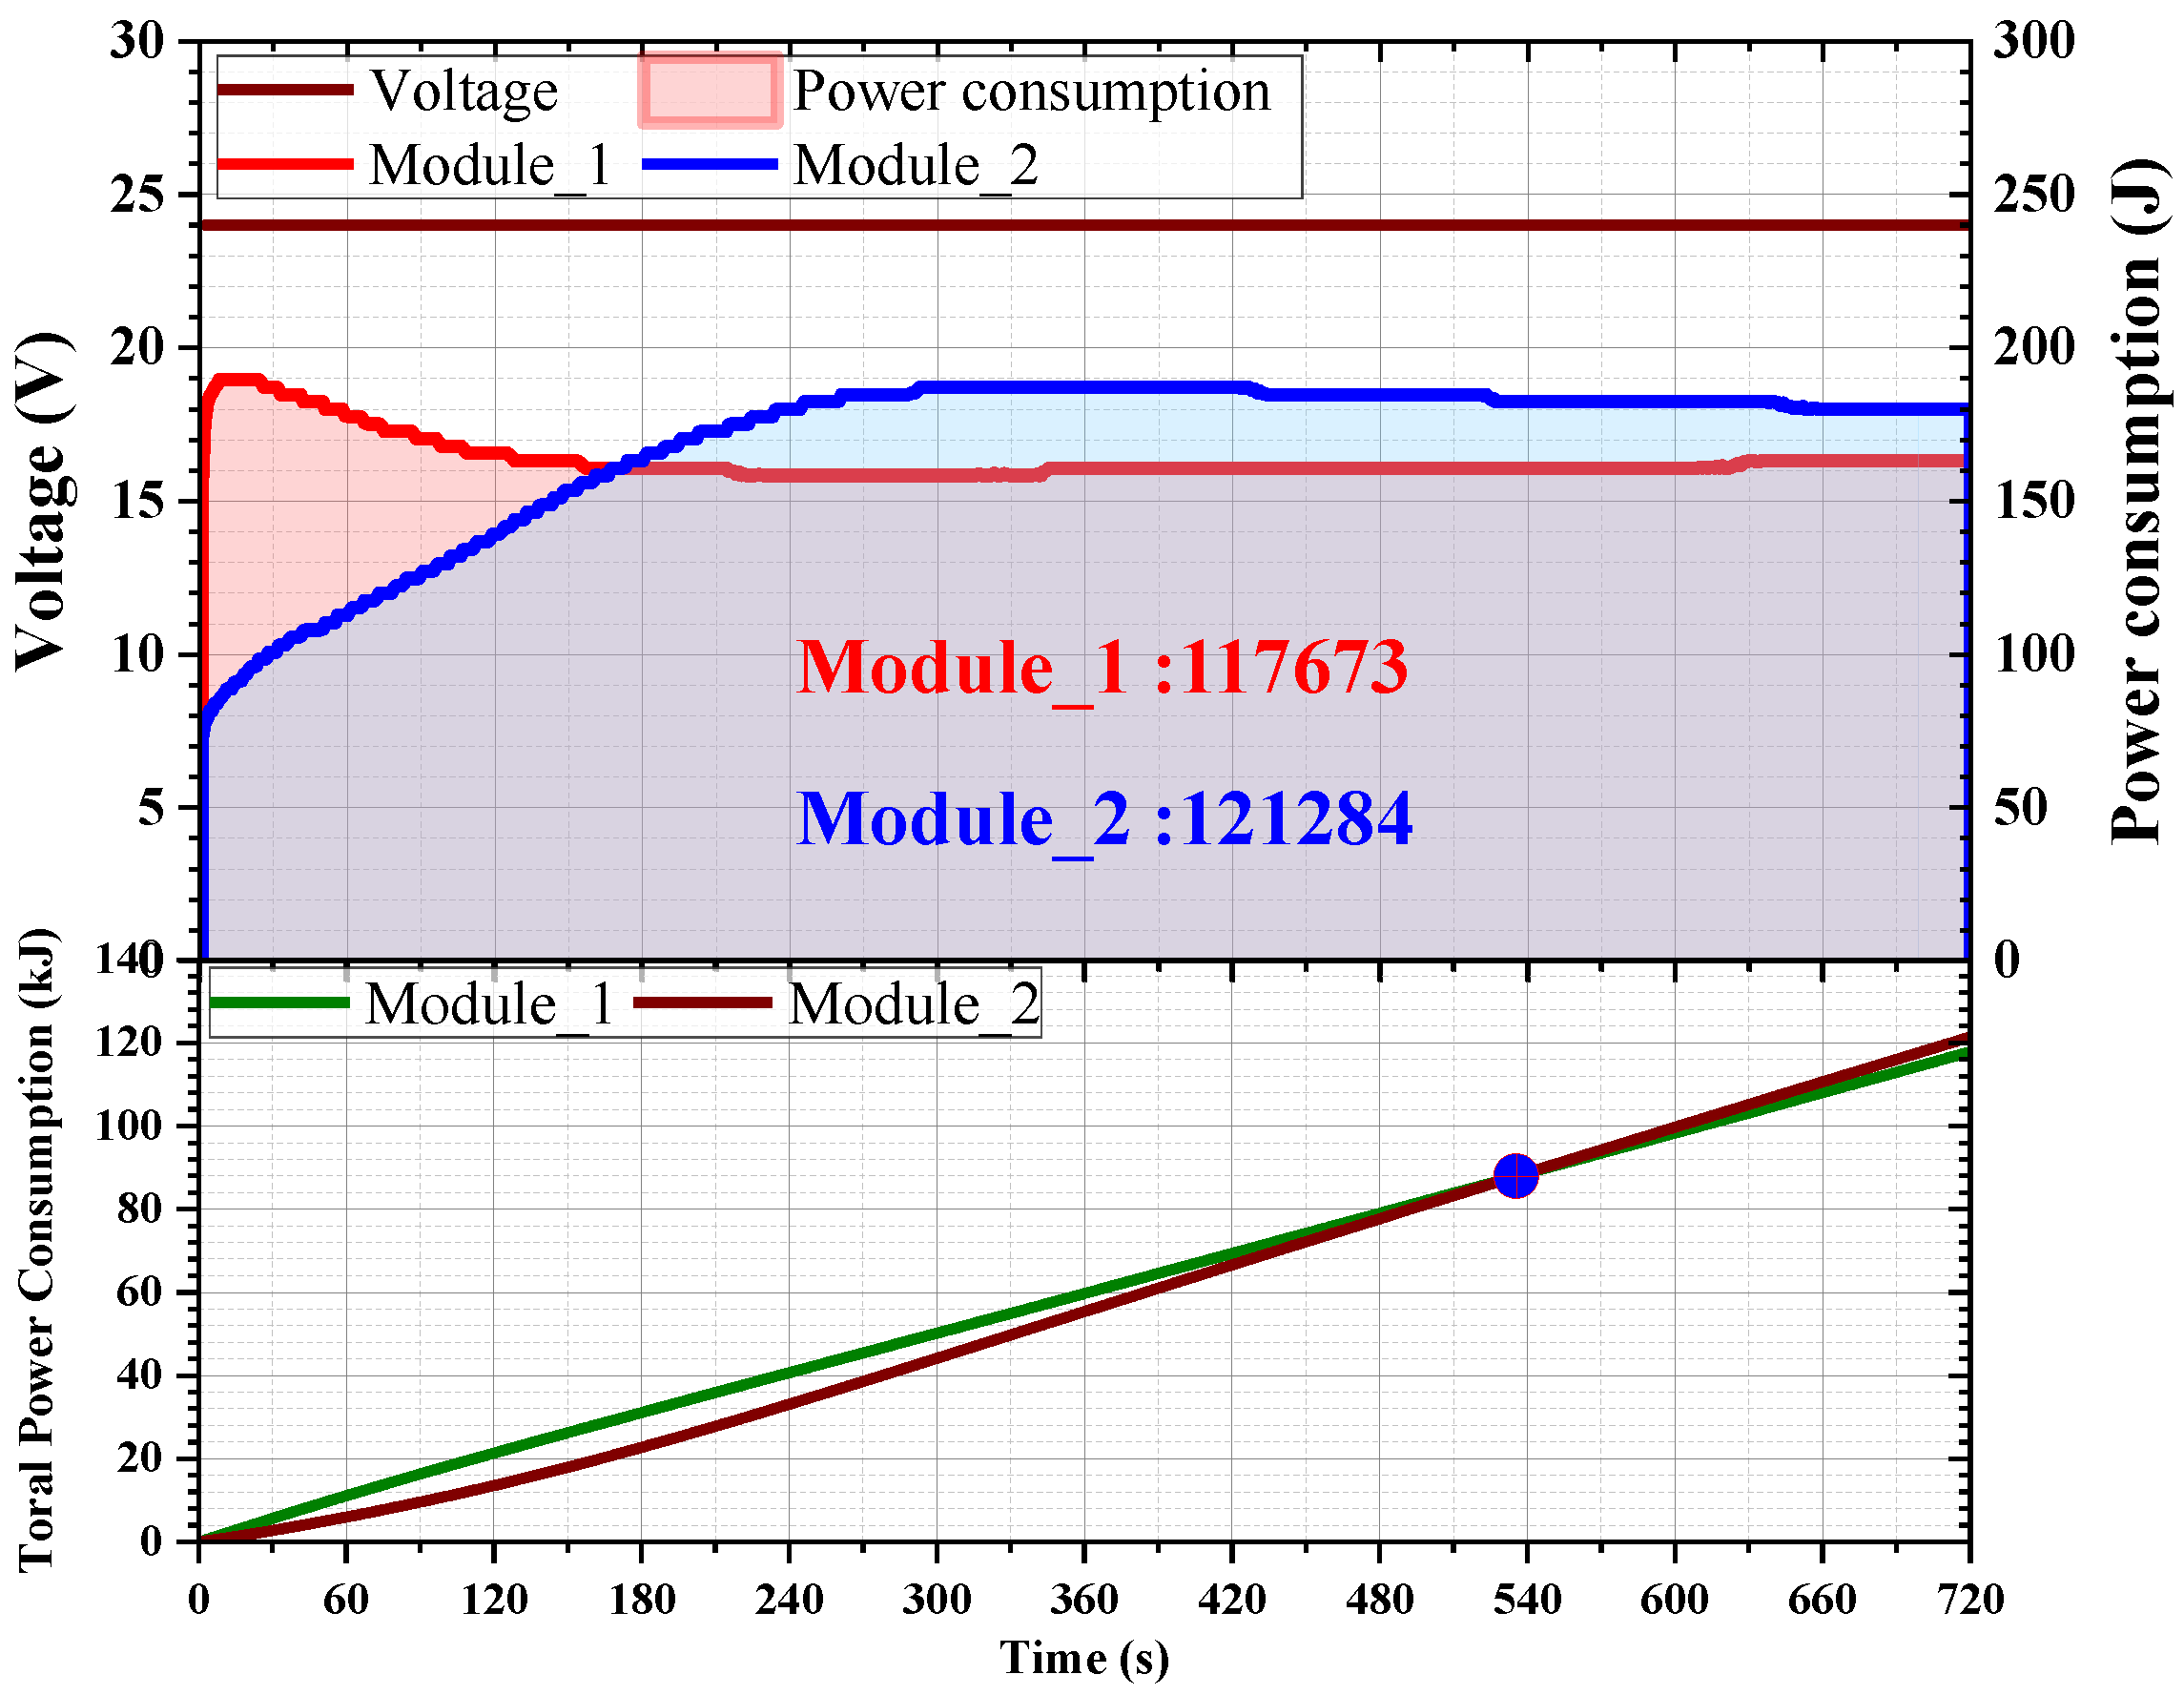
3.3. Mass of Melt with the Passage of Time
4. Conclusions
- (1)
- When the initial freezing conditions of the heating module corresponded to Case_1 and Case_2, different flow characteristics were observed around the module during melting;
- (2)
- In Case_1, convection by buoyancy occurred because of heating, and the rate of heat loss was relatively slow. As a result, the melted solution flowed over a wide shape, and the cross section of the solution melted into a sectoral shape with an open top;
- (3)
- In Case_2, a gas layer formed between the module and the unmelted solid solution owing to the volume difference between the gas generated during melting and the phase change. In addition, the solid solution blocked contact between the melted solution and external ambient air;
- (4)
- In Case_2, the heated liquid solution was buoyant and rose to the top, but the frozen solution covering the upper part of the module caused rapid heat loss. Consequently, a wide flow did not form in the upper part, but it formed in the lower part, and the melting process was concentrated in the lower part;
- (5)
- Compared with the results of previous studies, in the case of numerical analysis, the general convection phenomenon was the same, and the mass of melt was confirmed to be predictable to some extent through numerical analysis;
- (6)
- However, most of the previous studies did not consider the gas and volumetric volume generated during melting, and it was confirmed that the shape of melting was different from that obtained in the experiment. Therefore, in the future, studies should consider the shape of melting for the buoyancy effect.
Author Contributions
Funding
Conflicts of Interest
References
- Heywood, J.B. Internal Combustion Engine Fundamentals; McGraw-Hill Book Company: New York, NY, USA, 2005; pp. 586–642. [Google Scholar]
- Shim, E.J.; Park, H.W.; Bae, C.S. Effects of Hot and Cooled EGR for HC Reduction in a Dual-Fuel Premixed Charge Compression Ignition Engine; SAE Technical Paper: Warrendale, PA, USA, 2018. [Google Scholar] [CrossRef]
- Marasri, S.; Ewphun, P.P.; Srichai, P.; Charoenphonphanich, C.; Karin, P.; Tongrooon, M.; Kosaka, H. Combustion characteristics of hydrotreated vegetable oil-diesel blends under EGR and low temperature combustion conditions. Int. J. Automot. Technol. 2019, 20, 569–578. [Google Scholar] [CrossRef]
- Mohamad, A.C.M.A.; Ali, K.; Himmet, Ö.; Keskin, Z. Properties of ethyl alcohol-water mixtures as a reductant in a SCR system at low exhaust gas temperatures. Energy Sources Part A Recovery Util. Environ. Effects 2020, 1–12. [Google Scholar] [CrossRef]
- Da, S.; Li, B.; Liu, Z. Large eddy simulation of transient turbulent flow and mixing process in an SCR denitration system. Chem. Eng. Res. Des. 2019, 141, 279–289. [Google Scholar]
- Yuan, M.; Su, Y.; Deng, W.; Zhou, H. Porous clay heterostructures (PCHs) modified with copper ferrite spinel as catalyst for SCR of NO with C3H6. Chem. Eng. J. 2019, 375, 122091. [Google Scholar] [CrossRef]
- Andreata, M.; Millo, F.; Mallamo, F.; Mercuri, D.; Pozzi, C. Experimental Investigation on Three Different Ceramic Substrate Materials for a Diesel Particulate Filter; SAE Technical Paper: Warrendale, PA, USA, 2013. [Google Scholar] [CrossRef]
- Yamaguchi, S.; Fujii, S.; Kai, R.; Miyazaki, M.; Miyairi, Y.; Miwa, S.; Busch, P. Design Optimization of Wall Flow Type Catalyzed Cordierite Particulate Filter for Heavy Duty Diesel; SAE Technical Paper: Warrendale, PA, USA, 2005. [Google Scholar] [CrossRef]
- Yang, H. LNT NOx Storage Modeling and Estimation via NARX; SAE Paper: Warrendale, PA, USA, 2010. [Google Scholar] [CrossRef]
- Lundström, A.; Andersson, B.; Olsson, L. Urea thermolysis studied under flow reactor conditions using DSC and FT-IR. Chem. Eng. J. 2009, 150, 544–550. [Google Scholar] [CrossRef]
- Ko, S.C.; Oh, K.C.; Seo, C.K.; Lee, C.B. Characteristics on NOx adsorption and intermediates of LNT catalyst. Int. J. Automot. Technol. 2014, 15, 347–352. [Google Scholar] [CrossRef]
- Guan, B.; Zhan, R.; Lin, H.; Huang, Z. Review of state of the art technologies of selective catalytic reduction of NOx from diesel engine exhaust. Appl. Therm. Eng. 2014, 66, 395–414. [Google Scholar] [CrossRef]
- Jun, W.; Yipan, H.; Yixi, C.; Chuang, Z.; Lei, Z.; Chen, Z.; Hang, F. Influence of urea-SCR system parameters on NOx conversion rate and liquid film. Energy Sources Part A Recovery Util. Environ. Effects 2019, 43, 2027–2040. [Google Scholar] [CrossRef]
- Han, J.; Kim, E.; Lee, T.; Kim, J.; Ahn, N.; Han, H.; Heesung, C. Urea-SCR Catalysts with Improved Low Temperature Activity; SAE Technical Paper: Warrendale, PA, USA, 2011. [Google Scholar] [CrossRef]
- Blakeman, P.; Arnby, K.; Marsh, P.; Newman, C.; Smedler, G. Vanadia-Based SCR Systems to Achieve EUIV HDD Legislation; SAE Technical Paper: Warrendale, PA, USA, 2009. [Google Scholar] [CrossRef]
- Koebel, M.; Elsener, M.; Kleemann, M. Urea-SCR: A promising technique to reduce NOx emissions from automotive diesel engines. Catal. Today 2000, 59, 335–345. [Google Scholar] [CrossRef]
- Enderle, C.; Vent, G.; Paule, M. BLUETEC Diesel Technology—Clean, Efficient and Powerful; SAE Technical Paper: Warrendale, PA, USA, 2008. [Google Scholar] [CrossRef]
- Stefan, W. Numerical heat transfer and thermal engineering of AdBlue(SCR) tanks for combustion engine emission reduction. Appl. Therm. Eng. 2007, 27, 1790–1798. [Google Scholar]
- El-Sharkawy, A.; Kalantzis, P.D.; Syed, M.A.; Snyder, D.J. Thermal Analysis of Urea Tank Solution Warm Up for Selective Catalytic Reduction (SCR); SAE Paper: Warrendale, PA, USA, 2009. [Google Scholar] [CrossRef]
- Choi, B.C.; Kim, Y.K.; Jhung, W.N.; Lee, C.H.; Hwang, C.Y. Experimental investigation on melting characteristics of frozen urea-water-solutions for a diesel SCR de-NOx-system. Appl. Therm. Eng. 2013, 50, 1235–1245. [Google Scholar] [CrossRef]
- Choi, B.C.; Woo, S.M. Numerical analysis of the optimum heating pipe to melt frozen urea-water-solution of a diesel urea-SCR system. Appl. Therm. Eng. 2015, 89, 860–870. [Google Scholar] [CrossRef]
- Lee, S.Y.; Kim, M.Y. Numerical investigation on the urea melting characteristics with coolant and electric heaters. Trans. Korean Soc. Mech. Eng. 2016, 40, 1–7. (In Korean) [Google Scholar] [CrossRef]
- Lee, D.K.; Kim, M.Y.; Oh, K.C. A numerical study on the melting and heat transfer characteristics of the urea-water solution with electric heating module. In Proceedings of the 16th International Heat Transfer Conference, Beijing, China, 10–15 August 2018. [Google Scholar]


| Variable | Unit | Value | |
|---|---|---|---|
| Heating module | Material | - | AL606 |
| Density | kg/m−3 | 2700 | |
| Specific Heat | J/kg∙K | 900 | |
| Thermal conductivity | W/m∙K | 170 | |
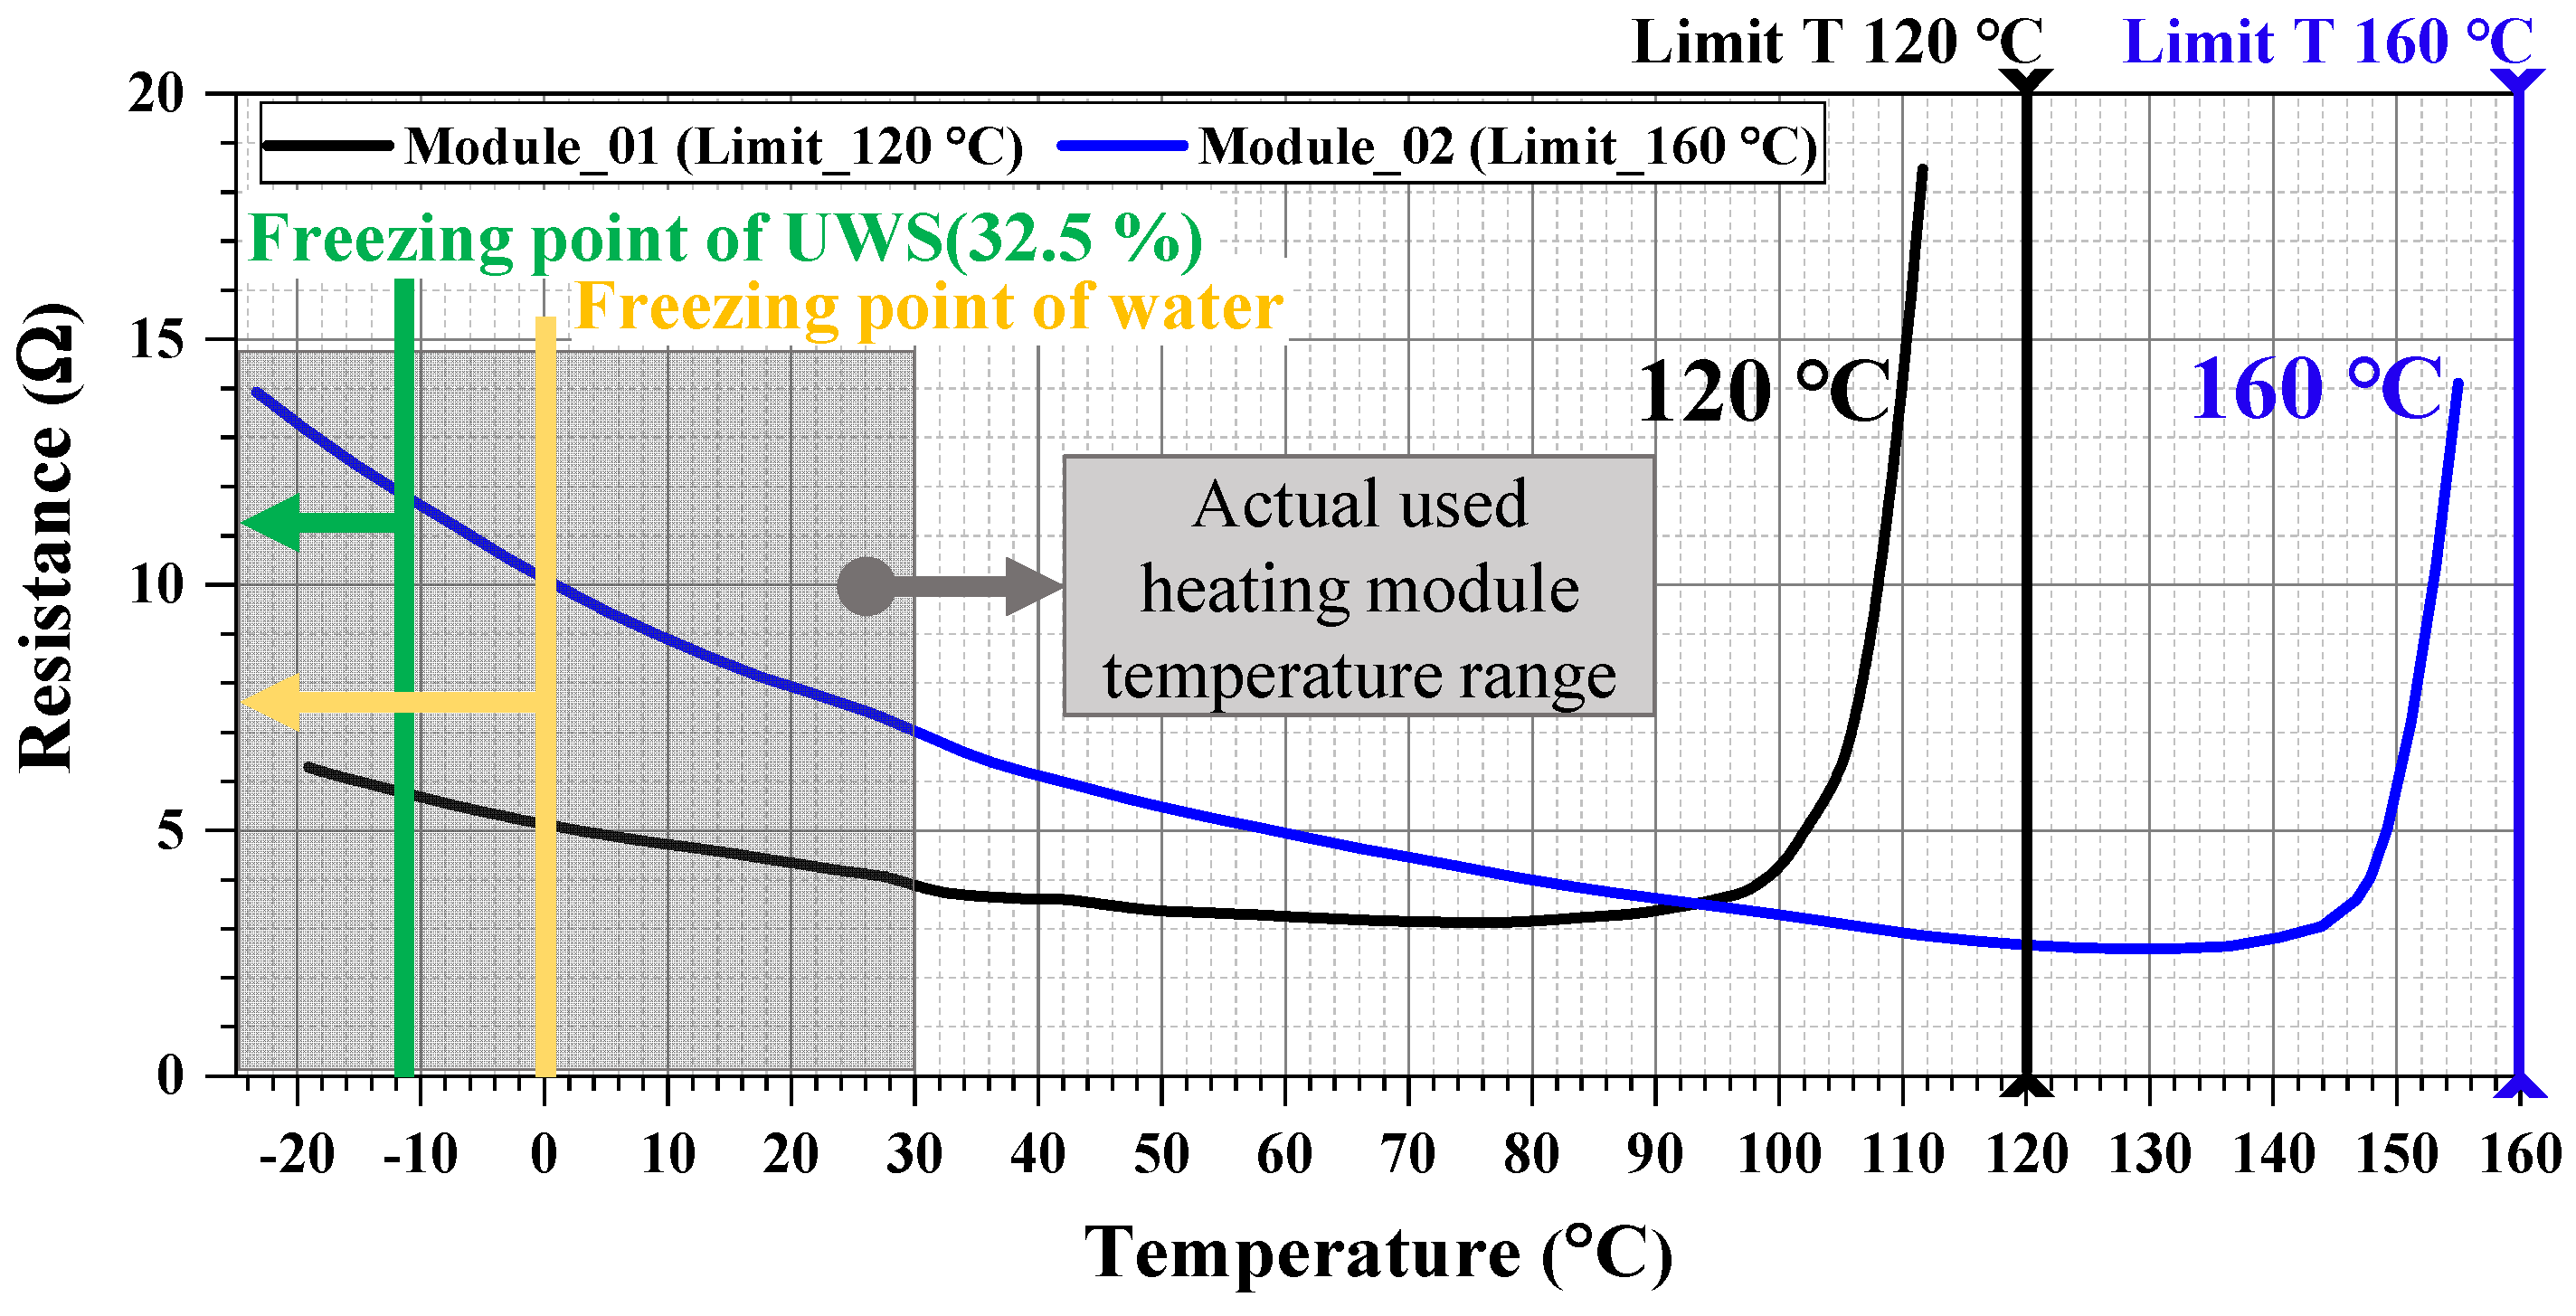
| PTC thermistor (Heating elements) | Power supply | Voltage | 24 |
| Limit Temp. | °C | 120, 160 |
| Distilled Water | Urea Water Solution | Unit | |
|---|---|---|---|
| Density (20 °C) | 0.9982 | 1.0870–1.0930 | g/cm3 |
| Melting enthalpy | 333.55 | 270 | J/g |
| Time | Melting Amount | Energy | ||||
|---|---|---|---|---|---|---|
| s | g | kJ | mg/kJ | |||
| Solution: Distilled Water | ||||||
| 300 | 87.0 | 74.0 | 57.946 | 47.540 | 1.4997 | 1.5566 |
| 420 | 151.8 | 118.0 | 81.972 | 70.620 | 1.8519 | 1.6709 |
| 600 | 188.4 | 184.4 | 95.880 | 101.083 | 1.9650 | 1.8242 |
| 720 | 225.1 | 229.9 | 117.673 | 121.284 | 1.9129 | 1.8956 |
| Solution: Urea Water Solution | ||||||
| 600 | 207.7 | 181.1 | 100.970 | 88.860 | 2.0570 | 2.0380 |
| Module_1 | Module_2 | Module_1 | Module_2 | Module_1 | Module_2 | |
Publisher’s Note: MDPI stays neutral with regard to jurisdictional claims in published maps and institutional affiliations. |
© 2021 by the authors. Licensee MDPI, Basel, Switzerland. This article is an open access article distributed under the terms and conditions of the Creative Commons Attribution (CC BY) license (https://creativecommons.org/licenses/by/4.0/).
Share and Cite
Jeong, B.G.; Oh, K.C.; Jang, S.U. Melting and Heat Transfer Characteristics of Urea Water Solution According to a Heating Module’s Operating Conditions in a Frozen Urea Tank. Energies 2021, 14, 8164. https://0-doi-org.brum.beds.ac.uk/10.3390/en14238164
Jeong BG, Oh KC, Jang SU. Melting and Heat Transfer Characteristics of Urea Water Solution According to a Heating Module’s Operating Conditions in a Frozen Urea Tank. Energies. 2021; 14(23):8164. https://0-doi-org.brum.beds.ac.uk/10.3390/en14238164
Chicago/Turabian StyleJeong, Byeong Gyu, Kwang Chul Oh, and Seong Uk Jang. 2021. "Melting and Heat Transfer Characteristics of Urea Water Solution According to a Heating Module’s Operating Conditions in a Frozen Urea Tank" Energies 14, no. 23: 8164. https://0-doi-org.brum.beds.ac.uk/10.3390/en14238164