
A QoS-Aware Machine Learning-Based Framework for AMI Applications in Smart Grids
by
 , , and
Asfandyar Khan
1,
Arif Iqbal Umar
1,*,
Arslan Munir
2,*,
Syed Hamad Shirazi
1,
Muazzam A. Khan
3 and
Muhammad Adnan
1 1
Department of Information Technology, Hazara University Mansehra, Mansehra 21120, Pakistan
2
Intelligent Systems, Computer Architecture, Analytics, and Security (ISCAAS) Laboratory, Department of Computer Science, Kansas State University, Manhattan, KA 66506, USA
3
Department of Computer Science, Quid-i-Azam University, Islamabad 44000, Pakistan
*
Authors to whom correspondence should be addressed.
Energies 2021, 14(23), 8171; https://0-doi-org.brum.beds.ac.uk/10.3390/en14238171
Submission received: 22 October 2021
/
Revised: 18 November 2021
/
Accepted: 2 December 2021
/
Published: 6 December 2021
Abstract
:The Internet of things (IoT) enables a diverse set of applications such as distribution automation, smart cities, wireless sensor networks, and advanced metering infrastructure (AMI). In smart grids (SGs), quality of service (QoS) and AMI traffic management need to be considered in the design of efficient AMI architectures. In this article, we propose a QoS-aware machine-learning-based framework for AMI applications in smart grids. Our proposed framework comprises a three-tier hierarchical architecture for AMI applications, a machine-learning-based hierarchical clustering approach, and a priority-based scheduling technique to ensure QoS in AMI applications in smart grids. We introduce a three-tier hierarchical architecture for AMI applications in smart grids to take advantage of IoT communication technologies and the cloud infrastructure. In this architecture, smart meters are deployed over a georeferenced area where the control center has remote access over the Internet to these network devices. More specifically, these devices can be digitally controlled and monitored using simple web interfaces such as REST APIs. We modify the existing K-means algorithm to construct a hierarchical clustering topology that employs Wi-SUN technology for bi-directional communication between smart meters and data concentrators. Further, we develop a queuing model in which different priorities are assigned to each item of the critical and normal AMI traffic based on its latency and packet size. The critical AMI traffic is scheduled first using priority-based scheduling while the normal traffic is scheduled with a first-in–first-out scheduling scheme to ensure the QoS requirements of both traffic classes in the smart grid network. The numerical results demonstrate that the target coverage and connectivity requirements of all smart meters are fulfilled with the least number of data concentrators in the design. Additionally, the numerical results show that the architectural cost is reduced, and the bottleneck problem of the data concentrator is eliminated. Furthermore, the performance of the proposed framework is evaluated and validated on the CloudSim simulator. The simulation results of our proposed framework show efficient performance in terms of CPU utilization compared to a traditional framework that uses single-hop communication from smart meters to data concentrators with a first-in–first-out scheduling scheme.
1. Introduction
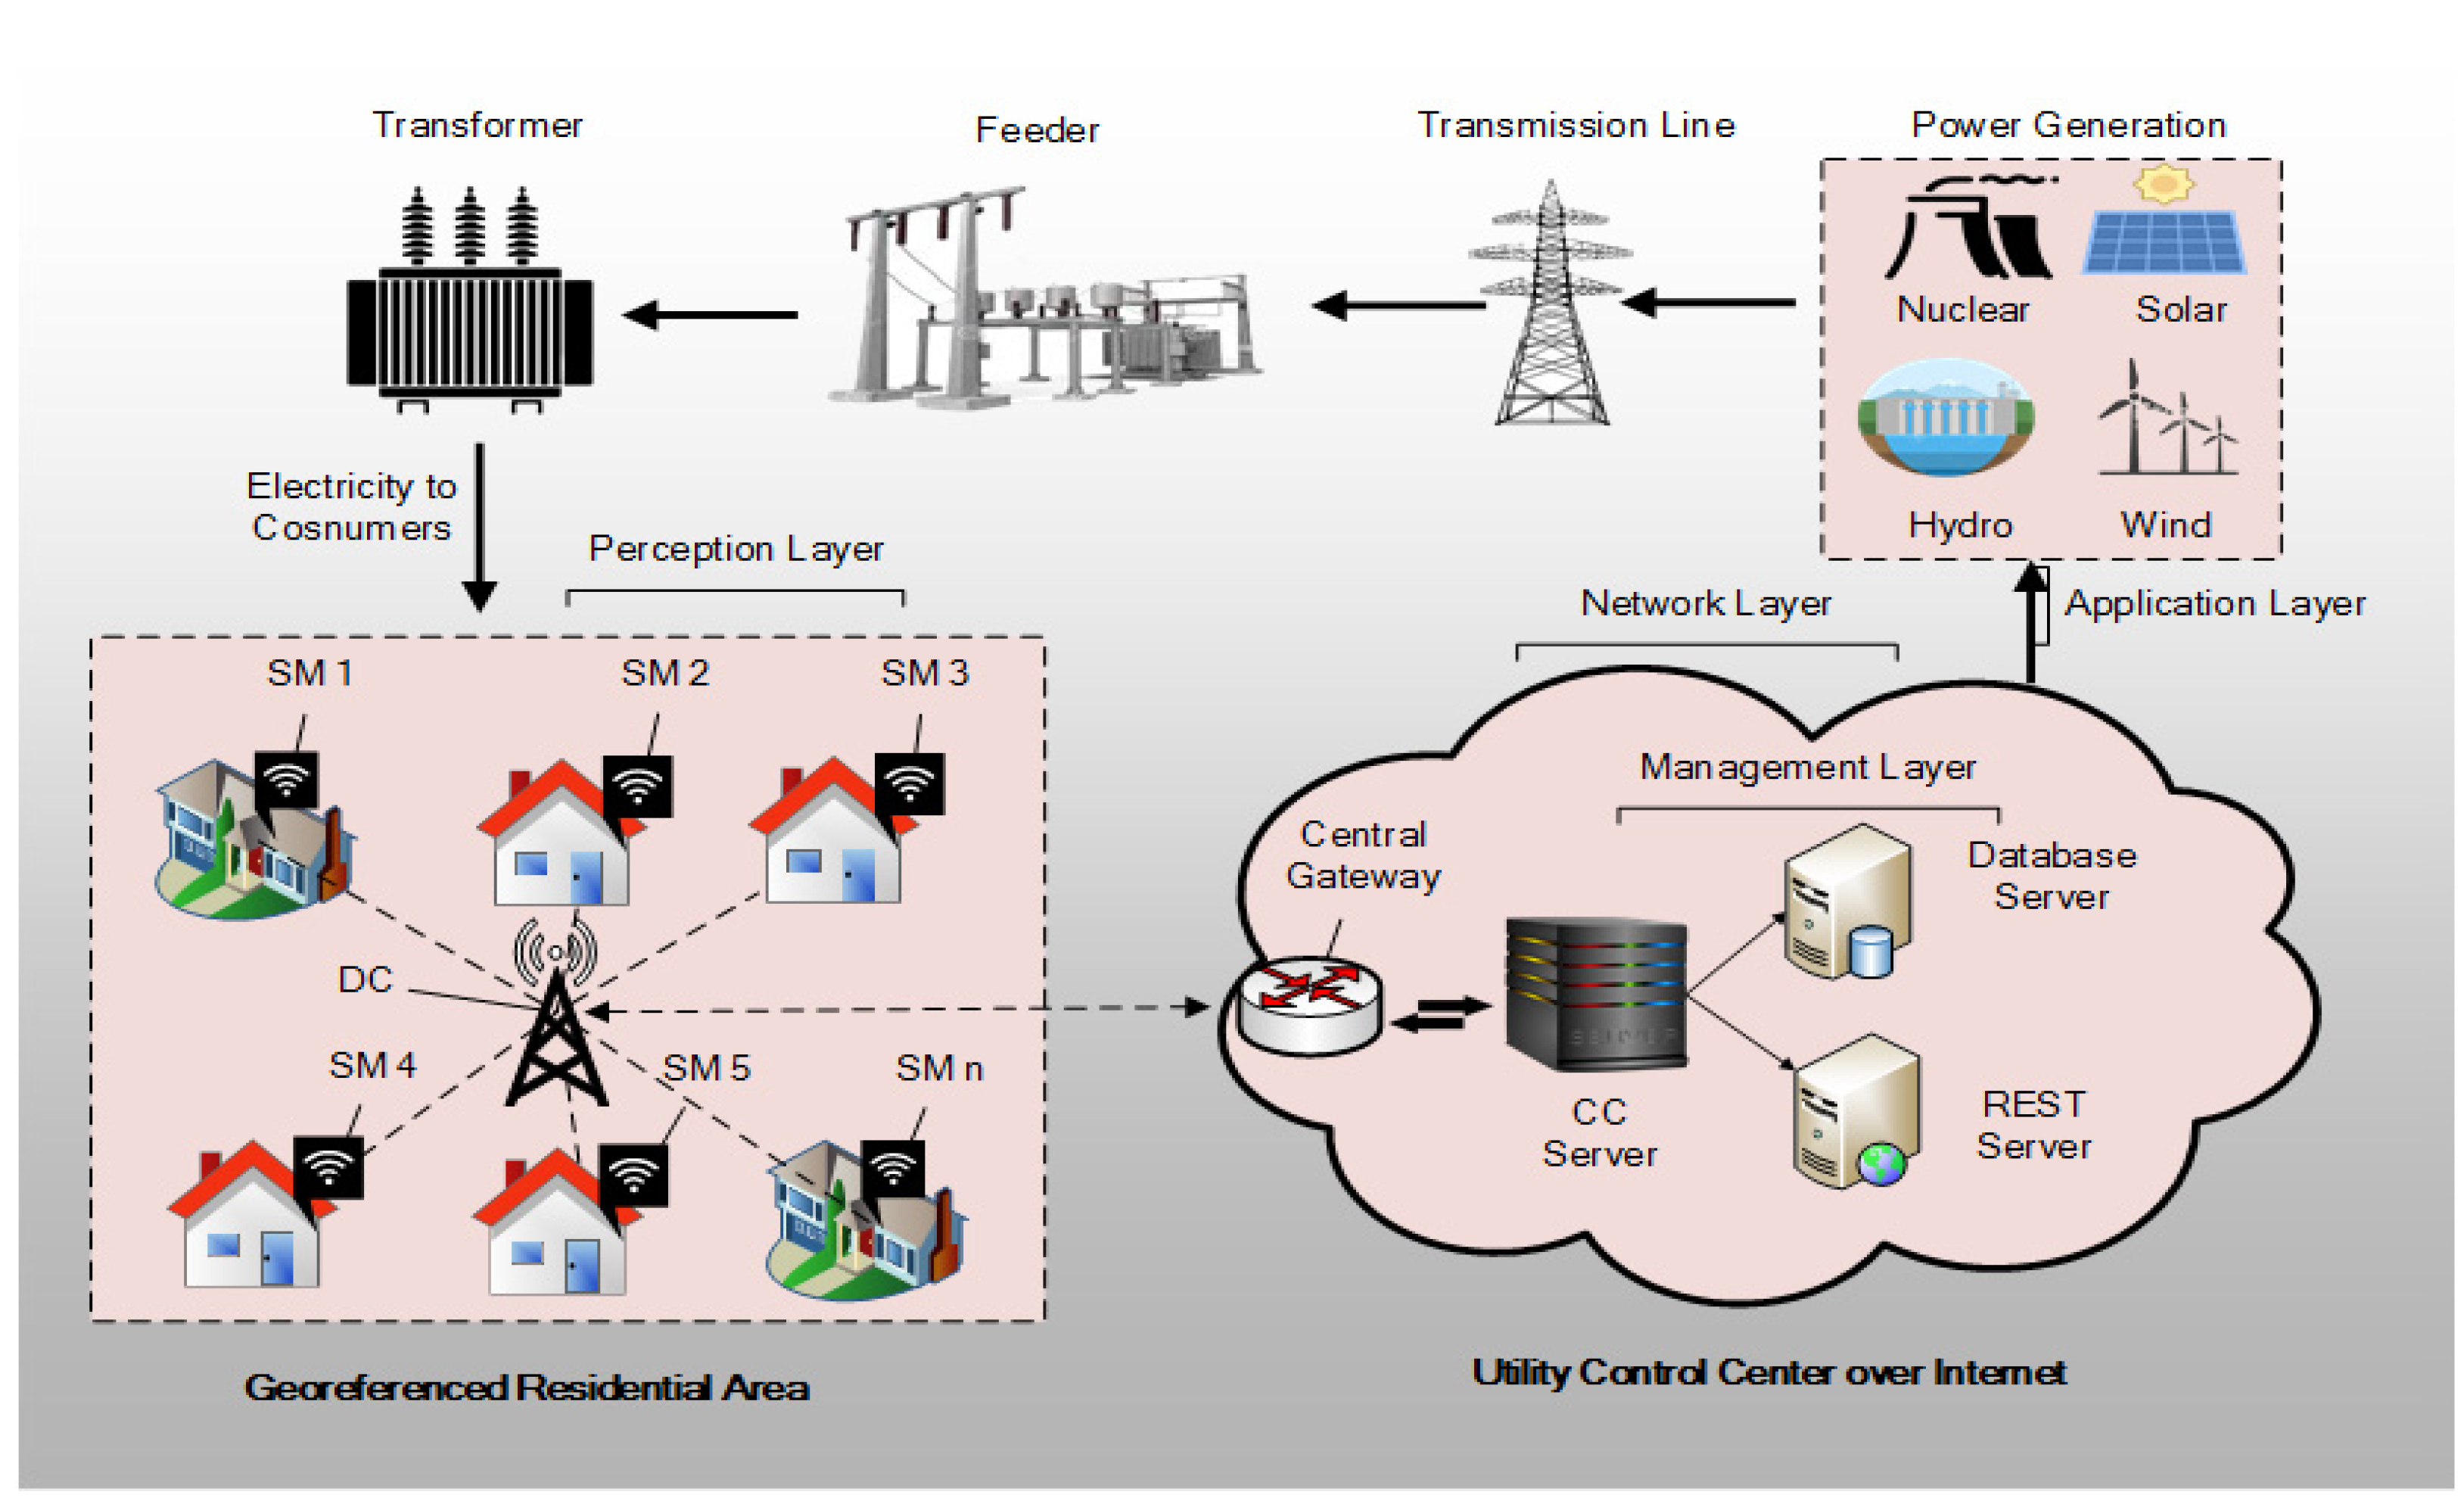
The advanced metering infrastructure (AMI) [1,2,3] is one of the core network infrastructures commonly deployed at the customer side in a smart grid (SG) [4,5,6,7,8,9]. As depicted in Figure 1, a typical AMI consists of a large number of smart meters (SMs), data concentrators (DCs), and wide-area networks (WANs), together with a metering data management system (MDMS) [4,5,6]. All these new devices, services, standards, and protocols are integrated with the existing power grid, which makes an SG system very complex. Commonly, communication technologies [5,6,7,8] are utilized between the entities of the AMI architecture to set up a two-way connection in a single-hop or a multi-hop manner, to exchange interactive messages such as power usage data, power status, event notifications, and other control commands between SMs and the control-center server (CCS) of the utility provider. To fully exploit the benefits of AMI architectures, it is imperative to select suitable communication standards and appropriate network topologies that will provide two-way end-to-end communication support for various metering data [10] and other SG applications [11,12,13,14] that have different packet sizes, arrival rates, and latency requirements in the SG.
The communication methods of the AMI network are mostly similar to those of the most recently emerged IoT communication models [15,16,17,18,19], utilizing several communication standards (cellular, WiFi, etc.), multi-layered structures (fog, edge, cloud), and protocols to provide remarkable end-to-end IoT services in the SG system with lower cost, increased coverage range, and lower power consumption. Recent developments in the leading LPWAN wireless technologies [9] such as NB-IOT [15] and long-range radio (LoRa) [16] are specially designed to enable low-power devices (e.g., SMs) to communicate over a long range with the control center (CC) for Internet-connected applications (e.g., metering, monitoring, etc.). In this way, the CC fully exploits the features of the Internet of things (IoT) to access SMs at customer premises remotely, to obtain accurate energy consumption data [20]. In particular, the CC should be able to adjust the energy supply according to the real-time demands of the consumers. Therefore, an intelligent communication system is required between SMs and the CC that will enable the SG network to handle the dynamic changes in electricity demand and supply in the electrical network.
However, given the SMs’ geographic information and transmission ranges, there is a little research in the literature on how to utilize SMs as relay nodes in an n-hop manner to minimize the DC installation cost and to improve the quality-of-service (QoS) metrics with minimum communication delay in the AMI network. Several studies on key device (i.e., DC) placement have been reported which have particularly emphasized how to minimize the infrastructure cost, further boost network capacity, and extend the service coverage [21,22,23,24,25]. Alternatively, deploying SMs as relay nodes can provide a competitive solution to a number of legacy problems in existing AMI networks. Various AMI applications rely heavily on two stringent requirements in SG communication, namely, delivery of a large volume of messages and communication latency. Therefore, in potential emergency situations (e.g., blackouts, power theft, etc.), the communication network should be able to handle and deliver a large number of delay-sensitive and bandwidth-intensive messages to the CC in an efficient and reliable manner. In practice, it is observed that SMs have very limited resources (i.e., low memory, limited processing capability, and limited link capacity). Furthermore, it is imperative that the data delivery process between SMs and the CC is instant and precise for real-time control and monitoring of the SG network. Hence, if too high a workload (e.g., costly computations) is assigned, traffic congestion can occur at the SM, which can result in messages being delayed or even dropped on the way to the CC. In this case, the CC will miss detailed information from the SMs at the user side, which can result in incorrect decisions being taken by the CC regarding energy supply and demand.
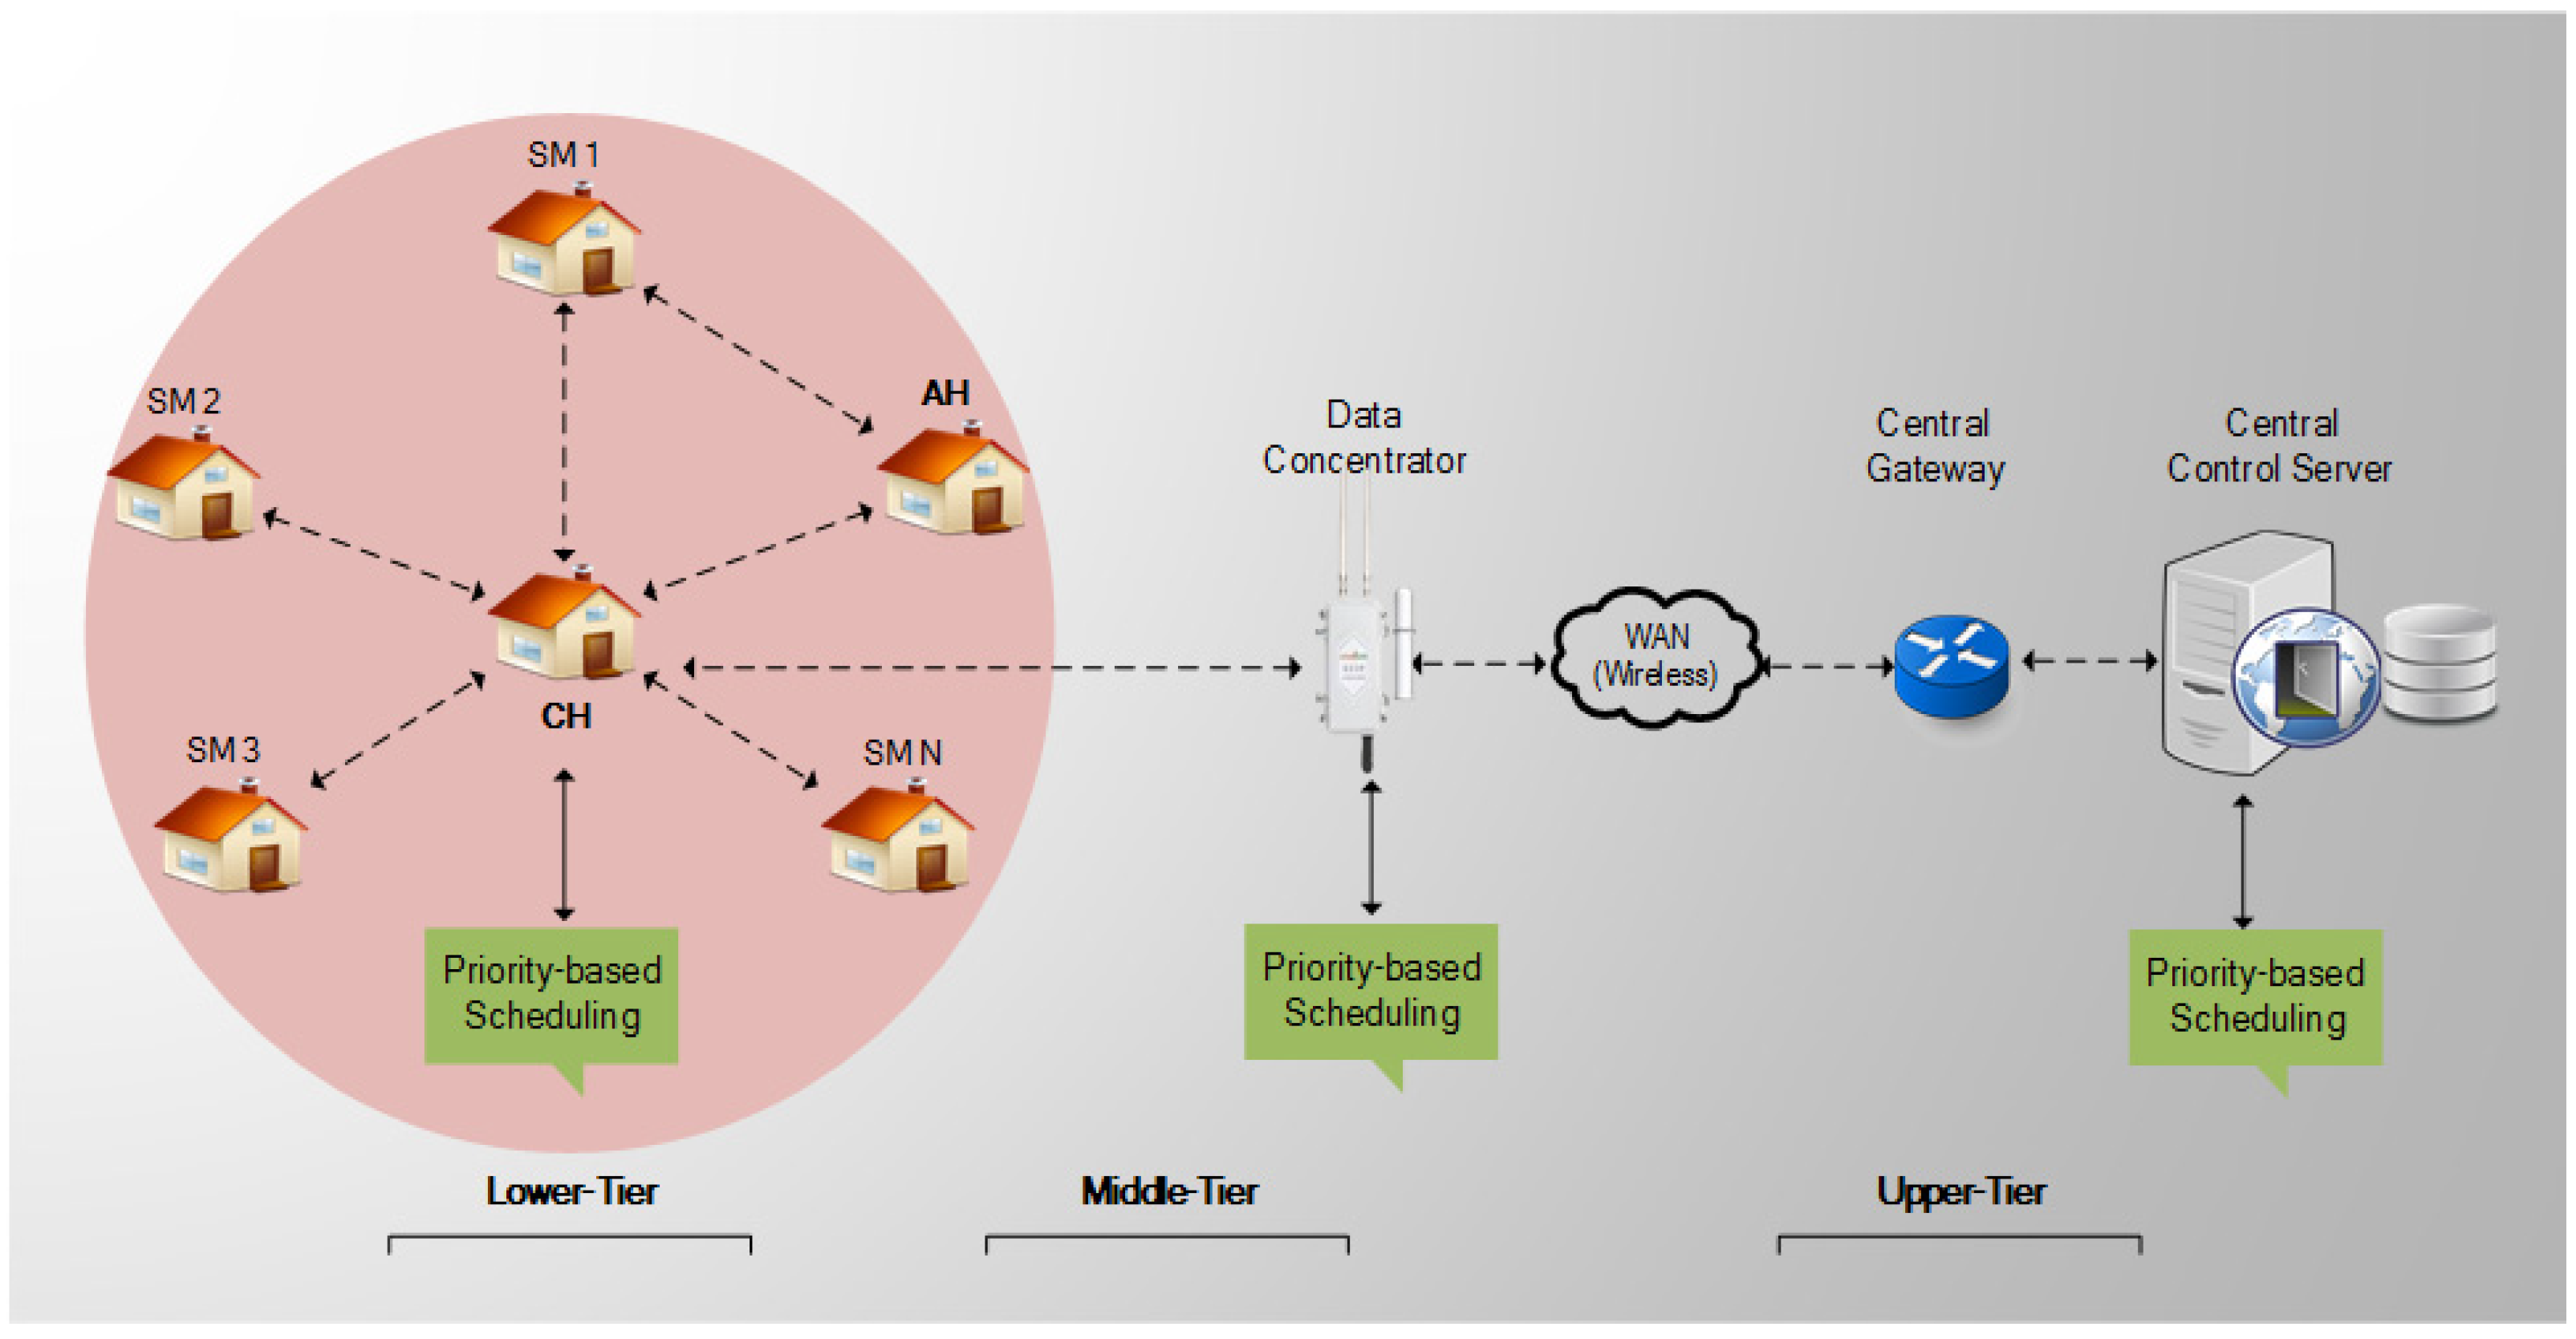
Motivated by the foregoing discussion, we propose a three-tier hierarchical architecture (detailed in Section 5) which employs a clustering approach to configure the SMs into clusters of bounded radii and an optimal data delivery route with n hops, established between the SMs and the DC for major AMI applications in the network topology at the lower tier in the architecture. In this article, a modified K-means algorithm is proposed in which the optimal K-value for every cluster is decided based on the size and the number of nodes (SMs) deployed in the residential area. Further, the geographic coordinates of the nodes are used in the distance formula (haversine formula) for dual-head selection and cluster formation. During the cluster formation, dual heads, namely, a cluster head (CH) and aggregator head (AH), are selected in each cluster. The CH is used in intra-cluster as well as inter-cluster communication for relaying metering traffic between SMs and the DC, and this minimizes the number of DCs required in the AMI network. However, due to the resource-constrained nature of the SM (as CH), an AH is introduced to collect interval meter readings (IMRs) from the cluster members, aggregate these readings, and send them to the CH for onward transmission towards the CCS. This eases congestion, provides fault tolerance and reduces workload at the CH in each cluster. With this clustering topology in place, data from SMs traverse three tiers to reach the CCS and vice versa. At the lower tier, SMs generate two types of AMI traffic [24,25,26,27], namely, normal and critical traffic. The normal traffic, such as IMRs, is sent to the AH for traffic aggregation, while the critical traffic (delay-sensitive traffic) is sent directly to the CH for onward transmission. At the middle tier, the CH receives the normal and critical traffic into two different queues, schedules both types of traffic on a priority basis through the CSMA/CA and TDMA slots in the IEEE 802.15.4g [28] MAC protocol, and sends the traffic to the DC directly or via other CHs. Finally, the AMI traffic received at the DC is forwarded to the utility CCS at the upper tier, over the Internet. For ease of understanding, important notations used in this paper are summarized in the Abbreviations.
1.1. Contributions
Considering the knowledge gap in the literature, there are five main contributions in this article. Firstly, this study primarily aims to use SMs as relay nodes (CH, AH) to maximize the coverage and connectivity requirements of all SMs in the AMI network. Secondly, the proposed heuristic improves the QoS of different AMI applications through priority-based scheduling schemes. Thirdly, this study intends to mitigate the hotspot problem of the DC to meet the robustness requirement by uniformly distributing the workload between the CH and AH to ensure service availability when a DC fails. Fourthly, the proposed hierarchical topology minimizes the total number of DCs required, which substantially reduces cost [29] in terms of the purchase and installation of new DCs and electric poles. Finally, extensive performance evaluation and simulation results obtained through different scenario-based experiments demonstrate the significance and verification of the proposed framework for AMI applications.
1.2. Paper Organization
The rest of the article is structured as follows. Section 2 presents a review of the recent literature on AMI applications in SGs. Section 3 describes the problem. The proposed framework is mathematically formulated in Section 4. In Section 5, we describe in detail the proposed three-tier hierarchical architecture for AMI applications. Section 6 presents the numerical and simulation results. Finally, Section 7 concludes the paper.
2. Literature Review
This section briefly describes the recent research efforts that are most relevant to our proposed scheme in this article. Our research work was mainly inspired by two major concepts in the literature: the QoS requirement of AMI applications and cluster-based hierarchical routing for increasing the coverage of AMI devices in SGs. However, due to the resource constraints of AMI devices, designing an efficient routing architecture for AMI applications in SGs has always presented a challenge for researchers and industry.
In [24,25,26], an optimal data aggregation point (DAP) placement problem was formulated and solved. The network model in [24] uses modified K-means on electric pole locations for DAP placement, and all devices communicate over a single hop to extend the network coverage. However, the QoS for AMI traffic was not considered in this study, and the one-hop communication limits the transmission ability. The work was extended in [25], where a greedy algorithm is used to identify pole locations suitable for DAP placement, and Dijkstra’s algorithm is used to identify reliable routes for SMs in the network. In this study, the CH works as a DC in the clustering topology, with QoS support for various types of AMI traffic. However, the CH is fixed and burdened with a heavy workload, which may lead to the bottleneck problem (i.e., the CH receives more work requests than it can process at its maximum throughput capacity), because CH rotation is not considered in the study. Following this work, power line communication (PLC) technology was used for scheduling the delay-sensitive data of SMs in [26], using priority-based carrier sense multiple access/collision avoidance (CSMA/CA) and queuing analysis, such that minimum installation costs are guaranteed, together with traffic reliability. However, PLC has significant technical issues (channel distortion, noise, interference, and a low data rate) which limit its adoption in SG networks.
The authors in [27,30] addressed the DAP placement problem together with the QoS requirements for the AMI scenario. In [27], the author considered a wireless neighborhood area network (NAN) where a large number of SMs are divided into groups to communicate over a single hop to a DC that is connected via wired backhaul to the CC. The proposed analytical model ensures certain QoS metrics for demand–response applications in the communication network. However, the work presented needs to ensure certain latency requirements for different types of AMI traffic. Similarly, in [30], the optimization problem is formulated to minimize the cost of DAP by grouping SMs into clusters such that the risk of inter-network cascading failures due to DAP failure is avoided in the power network.
The authors in [31] developed a K-means-based method to select poles to deploy a fixed number of DCs in a multi-hop radio-frequency mesh AMI network. The objective was to minimize the transmission delays by limiting the number of hops that the SM traffic needs to traverse through to reach the selected DCs. However, their work ignores the congestion delay occurring at each hop. The studies presented in [32,33] developed optimization models that focus on design parameters such as coverage and capacity in a cost-effective manner. The heuristic in [32] uses a near-optimal clustering topology for the deployment of SMs with a bi-directional hybrid communication (wireless–fiber) system for the integration of smart microgrids. The authors in [33] proposed an evolved network architecture considering SMs, universal DAPs, BS, and an optimal route map based on wireless heterogeneous networks (WHNs) to achieve connectivity and coverage of SMs with the optimum use of technological resources.
In [34], an optimization problem is formulated to assist device-to-device (D2D) cellular communications in clusters and to efficiently allocate resources to guarantee QoS and maximize spectral efficiency in the AMI. Since cellular service (bandwidth) is shared with mobile users, this may affect the network performance and may create congestion in the network. The authors in [35,36] investigated the DAP placement problem and analyzed it using cluster-based algorithms aimed at reducing the maximum and average distance between SMs and the DAP. A stochastic geometry-based model was applied to power grids in [37,38], in order to achieve two objectives: optimized phasor measurement units (PMUs) allocation and interdependent communication power networks. The power grid in [37] is clustered using a K-means algorithm to construct trees based on the physical buses, such that redundant SM allocations are avoided and certain financial budget and technical constraints are met. The work in [38] demonstrates tight coupling between the power grid and the communication network using stochastic geometry. The mathematical formulation satisfies the packet-drop-ratio and queuing-delay constraints on communication nodes (CNs) by using a dynamic priority-based queuing model.
In [39], a proportioned strategy was adopted to optimize collectors and router positions jointly in multi-hop radio-frequency mesh networks, to reduce the running time for highly dense networks as well as to minimize the effect on QoS metrics. The authors in [40] developed a two-hop evolutionary aggregation approach (EAA) using a clustering technique for a wireless remote-metering network. The model aims at full coverage and connectivity of SMs, while the infrastructure cost is minimized by reducing the number of local data aggregation centers. The model proposed in [41,42] exchanges metering and control information between SMs and the CC using a multi-hop method with hybrid communication technologies in a NAN to achieve message integrity and minimize the communication and computational overhead incurred during SG communication. Finally, the proposed approach in [43] divides the data reporting process into two stages: online and offline. Considering that SMs have limited computational and bandwidth ability, most of the costly computations are pre-processed in the offline phase to avoid the efficiency bottleneck of SMs in SG communications. In addition, the authors improved the communication efficiency by performing dynamic cluster formation such that the online electricity usage reports of all SMs could be received by the CC in a fast and secure manner.
We summarize the above discussion in two main parts. Firstly, most of the recent studies have specifically addressed the DAP placement problem as a communication problem. Secondly, this problem can be solved through optimal workload partitioning based on a clustering algorithm to improve the performance of the AMI network. We present a generalized classification and comparison of recently proposed AMI schemes in Table 1.
3. Problem Description
In this article, we consider the coverage and QoS issues of AMI applications in an SG network. The optimization problem is described as follows.
In an AMI network, the DC has limited transmission range and a capacity constraint that allows connection of up to a maximum of 2000 [44] SMs. When the residential area (RA) becomes too large, there will be some SMs outside the radio range of a single DC centered at the RA. Since data from all SMs are routed towards a single DC, it suffers from a higher workload, leading to a hotspot in the SG network. Further, to satisfy the need for full coverage of all SMs and to transfer an optimum percentage of metering traffic to the utility CC within the recommended latency range [4,5] while ensuring stringent QoS and robustness requirements, a reliable and cost-efficient AMI infrastructure is required.
For instance, AMI applications such as interval meter reading may tolerate a delay of up to a few minutes, whereas remote control commands have stringent latency requirements, especially during peak hours. Therefore, data from these delay-sensitive applications need prioritization and availability of the communication network between SMs and the CCS. Furthermore, the DC and SMs have limited resources (e.g., processing, storage, and bandwidth), and thus high resource utilization in these devices will cause congestion and communication interference during peak hours. In such situations, device shutdown or failure (bottleneck) occurs due to which packets (data) may be delayed or even dropped in the communication network. Therefore, a uniform workload distribution strategy is needed to mitigate the hotspot (bottleneck) problem in case of communication failures and defects in SMs and DCs, to maintain the robustness in the network, and to maintain the QoS requirement of AMI applications.
We attempted to solve the optimization problem by logically partitioning the RA into a set of disjoint clusters with bounded radii, to fulfill the connectivity and coverage requirements of AMI applications in the SG communication network. We defined algorithms to construct a hierarchical clustering topology and to fulfill the robustness requirements for dual-head (CH and AH) selection and rotation. Further, we developed a queuing model in which different priorities are assigned to each item of the critical and normal AMI traffic based on its latency and packet size, to ensure the QoS requirement in the AMI network.
4. Problem Formulation
As discussed earlier, the optimization problem is formulated as follows.
Given the geographic locations, the latency requirements of different types of AMI traffic, and the radio range of the DC and SMs, the coverage maximization dual-head placement (CMDP) problem is to fully extend the coverage and connectivity of AMI network, denoted as C, by selecting a set of dual heads (⊂) in each cluster, subject to the QoS and robustness constraints.
The decision variables are introduced in the optimization problem. The binary variable indicates that each SM is connected to a single DC . The binary variable indicates that metering data of each SM are passed through a dual head towards DC , where represents the fact that SM is assigned to at least one dual head in a cluster. Recall that , and are the upper bounds on the transmission radius, the maximum number of hops allowed to reach the DC, and the capacity constraint of the DC and cluster, respectively. The notations in the problem formulation are described in the Abbreviations. The CMDP problem is mathematically formulated as follows.
subject to:
The objective function in Equation (1) describes the coverage and connectivity requirements of each SM in the AMI network that are fulfilled with multiple dual heads in order to relay traffic between SMs and the DC such that the network coverage is maximized. In Equation (2), optimal deployment of the georeferenced SMs and DC is ensured at the RA. Equation (3) fulfills the connectivity requirement such that the haversine distance between any two devices is less than or equal to the allowable wireless transmission range (). Equation (4) ensures that each SM is exclusively connected to one DC via a CH or AH. Equation (5) specifies that dual heads are allocated to SMs in each cluster. Equation (6) restricts the maximum number of hops to in the route of the topology. With a limit on the hopping depth, the packet loss and n-hop delay [6] are minimized. Equation (7) ensures that the AMI traffic received with an average [5] from SMs is less than the offered of the DC. Equation (8) ensures that maximum connections do not exceed the capacity limit () of the DC. The last condition indicates that are binary variables.
5. Proposed Three-Tier Hierarchical Architecture
In this section, a three-tier hierarchical architecture is proposed that is different from the current schemes in the literature and represents a realistic AMI scenario, as depicted in Figure 2. The tree-tier architecture comprises a lower tier, a middle tier, and an upper tier. To maximize the design efficiency with regard to the context, a cooperative relaying strategy (dual head) is adopted in the clustered view of the AMI network such that the coverage is maximized, and the required QoS and robustness are ensured using different channel and queuing scheduling schemes. The network model and the proposed algorithms in this study are discussed in detail in the following subsections.
5.1. Network Model
In the proposed AMI architecture, the network model needs four main components (IoT nodes) in the deployment of the network topology: the SMs, the DC, the central gateway (acting as a router), and the CCS at the CC’s premises, all provided with an uninterrupted power supply. To model the network, we consider square-shaped georeferenced RAs where homogeneous SMs are evenly distributed and randomly deployed at low altitudes in homes, building the targeted AMI scenario. Further, we assume that a DC is installed by the utility provider at the center of the RA that is connected through bi-directional wireless links to a subset of SMs and to the utility CCS at the CC through a central gateway. The CCS has up-to-date information on all registered devices in the AMI network, stored in a database. The RA is partitioned into logically non-overlapping clusters that employ a dual-head method, where the cluster head (CH) is mainly used for relaying traffic and the aggregator head (AH) is used for traffic aggregation. Using SMs as intermediate heads, a near-optimal route map for SMs–CH–DC and SMs–AH–CH–DC is obtained in the clustering topology towards the utility CC gateway over the Internet. The proposed clustering topology is modeled over an adjacency matrix , also called a direct connectivity graph, where each denotes the set of all vertices (SMs, DC) having a symmetric transmission range , while a wireless link between any two vertices is denoted by an edge . Subsequently, this model uses the haversine formula [32] to calculate the single-hop distance denoted by between each pair of vertices at the lower tier that is represented by a distance matrix . Hence, two neighbors are a single hop away in a cluster if and only if . In addition, a maximum of hops are allowed in the route map towards the DC, to ensure the connectivity requirements of all SMs in the network are met. Further, each vertex is equipped with IEEE 802.15.4g [28]. Similarly, the DC supports two interfaces: IEEE 802.15.4g for internal traffic and LoRa for the outbound traffic towards the centralized gateway of the CC. The Walfisch–Ikegami model [45] is used as the propagation model best suited to outdoor transmission in urban areas.
We make the following few reasonable assumptions to simplify our network model:
- All devices are georeferenced and pre-configured with a unique ID;
- All SMs are restricted so that data are not sent directly to the DC;
- Each SM is aware of the identity of the cluster to which it belongs;
- All devices are fully synchronized with the utility CCS;
- Security aspects are not considered here.
5.2. Hierarchical Cluster Formation
In this section, we describe the design methodology adopted in this article to construct the proposed hierarchical clustering topology at the lower tier for AMI applications in an SG. In addition, to ensure full coverage of all SMs in the AMI network, we must consider the capacity constraint and transmission radius of the DC. However, due to the limited transmission radius, there will be some SMs outside the transmission circle of the DC if , and then the RA needs to be partitioned into a number of uniform-sized disjoint cells, each referred to as a cluster. Here, is a predefined square number [46] obtained using knowledge of , , , and the dimensions () of the RA. As well as addressing the coverage requirement, the reason behind such partitioning is to effectively reduce the number of data transmissions towards the DC and uniformly distribute the workload of the DC between the CH and AH such that the QoS and robustness requirements are met. Once the formation of cells is completed, Algorithm 1 proceeds to select a set of header nodes (here, SMs) in each cell using a modified K-means algorithm based on the optimization formulation. Initially, the SM closest to the centroid in each cell is selected as the CH. The criterion for the selection of the AH is an SM in the vicinity of the CH. Further, only those SMs in each cell will be selected as the CH and AH whose distance to the centroid is less than or equal to a certain distance threshold , appropriately set to achieve optimal performance. To improve the robustness at the lower tier, when unexpected failure of the dual head is detected or its timer expires, the role of the dual head is rotated among the SMs relatively close to the mid-point based on in every cell. The information on the newly selected dual head is shared among all cluster members and the adjacent neighborhood CHs. Finally, the set of CHs, together with the DC, constructs an optimal route map towards the CCS central gateway, as shown in Figure 2. We modified the traditional K-means algorithm to use the haversine distance metric to efficiently partition the residential area under consideration with regard to dual-head selection and to construct the optimal route map for AMI applications in the SG network. Our modified K-means clustering technique yields promising results compared to the previously proposed methods in the literature, achieving full coverage, robustness and the QoS requirements of the AMI applications. Furthermore, our proposed framework can also be adapted to other communication technologies (either wired or wireless). The pseudocode for Algorithm 1 is given below.
| Algorithm 1 for dividing the residential area into virtual clusters. | |
| Input: | |
| 1: | |
| 2: | |
| 3: | |
| 4: | |
| 5: | |
| 6: | |
| 7: | |
| 8: | |
| 9: | |
| 10: | |
| 11: | |
| 12: | |
| 13: | |
| 14: | |
| 15: | |
| 16: | |
| 17: | |
| 18: | |
| 19: | |
| 20: | |
| 21: | |
| 22: | |
| 23: | |
| 24: | |
| 25: | |
| 26: | |
| 27: | |
| 28: | |
| 29: | |
| 30: | |
| Output: Save cluster to , centroid to | |
In Algorithm 1 above, the first step that the DC performs in lines 3–6, is to partition the RA into clusters in order to achieve the objective function expressed in (1), based on the upper-bound capacity (), that is, to fulfill the constraint of Equation (8) and the transmission radius () constraint (Equation (3)) of the DC to ensure that all the SMs are connected to at least one DC in the AMI network, that is, to fulfill the constraint of Equation (4). Next, in lines 7–25, the modified K-means algorithm is used, centroids (as CHs) in all clusters are chosen, and the SMs are associated based on the shortest distance to the closest centroid of the cluster, to satisfy the constraints of Equations (2) and (5). The output of the Algorithm 1 is obtained in line 26 and includes the clusters (CK) along with their corresponding centroids (). The else lines 27–29 show that the network configuration already meets the optimal connectivity requirement. In order to ensure QoS and reduce the AMI traffic in the network, we propose Algorithm 2, whose pseudocode and other details are given below.
| Algorithm 2 for dual-head selection and rotation for optimal route formation. | |
| Input: | |
| 1: | |
| 2: | |
| 3: | |
| 4: | |
| 5: | |
| 6: | |
| 7: | |
| 8: | |
| 9: | |
| 11: | |
| 12: | |
| 13: | |
| 14: | |
| 15: | |
| 16: | |
| 17: | |
| 18: | |
| 19: | |
| 20: | |
| 21: | |
| 22: | |
| 23: | |
| 24: | |
| 25: | |
| 26: | |
| 27: | |
| 28: | |
| 29: | |
| 30: | |
| 31: | |
| 32: | |
| 33: | |
| 34: | |
| 35: | |
| 36: | |
| 37: | |
| 38: | |
| 39: | |
| 40: | |
| 41: | |
| 42: | |
| 43: | |
| 44: | |
| 45: | |
In Algorithm 2 above, a subset of SMs from all cluster members () based on a threshold distance () from each centroid () is calculated, added to a priority queue (PQ), and then sorted (lines 2–18). Only SMs from the PQ take part in CH and AH selection. The newly selected CH ( information is shared with cluster members through a message, and cluster members send messages to dual heads to obtain the optimal route map in each round (lines 20–28). Further, the maximum-hops constraint in Equation (6) is checked in lines 29–35. To meet the robustness requirement in the network topology, lines 37–44 are used to rotate the role of the dual head in cases of unexpected failures or once the maxTime expires for each round. In line 45, Algorithm 2 returns the output that includes the sets of dual heads (CH, AH) and the optimal valid route map for each cluster. Finally, once the cluster formation, dual-head selection and a near-optimal route map are obtained, we move on to the transmission phase of AMI applications.
5.3. Transmission of AMI Applications
In this section, we give details of the AMI application’s transmission in the proposed IoT-based three-tier hierarchical architecture which consists of a lower tier (intra-cluster), a middle tier (inter-cluster), and an upper tier where the metering data is forwarded by the DC towards the CCS and vice versa. In this article, we consider two traffic classes in AMI applications [4,5], generally categorized as normal and critical classes. The normal traffic consists of IMRs, on-demand meter readings (ODMRs), and on-demand reading responses (ODRRs). The IMR represents the customer electricity consumption typically captured at every fixed-length interval (e.g., 5–60 min). The ODMR is the meter-reading demand for the customer SM sent by the utility CCS that may be used for load forecasting and a demand–response program. The ODRR is the SM response sent to the CCS. Similarly, the critical traffic consists of remote-control commands (RCCs), power-control commands (PCCs), and alert notifications (ANs). Moreover, RCCs include remote disconnect/reconnect, PCCs include load-control signals, and ANs comprise meter tampering and similar messages. Table 2 shows the characteristics of AMI applications that require a reliable and priority-based transmission based on their latency requirement in the SG communication network. In Table 2, ToT stands for type of traffic, ToA for type of AMI application, Pkt-Size for packet size, for recommended latency, and FG for data generation frequency per day.
In the lower-tier transmission, each cluster member is aware of the AMI applications, and the ToT and ToA fields in the outgoing packets P = {1, 2, ... n} are set for each destination head (CH, AH). The destination head receives one or more packets; each follows a Poisson arrival process [26]. The CH places the normal traffic into the low-priority normal queue (NQ) and the critical traffic into the high-priority critical queue (CQ), as shown in Figure 2. The CH assigns a to each packet in these queues based on the packet size and recommended latency, using the following equation.
where denotes the generation time (recent or early) of the metering application. It should be noted that the critical-class-related data must be transmitted within the recommended latency range of the AMI application for immediate response in the SG communication network. The CH will check and compare the values of the packets in both queues, and the highest-priority packet is forwarded first to the nearest CH or directly to the DC for further processing at the middle tier, assuming that the service rate is higher than the arrival rate to satisfy Equation (7). Similarly, the IEEE 802.15.4g standard [28] uses two types of channel-access periods within each frame, namely, a contention access period (CAP) and contention-free periods (CFPs), to avoid traffic congestion and co-channel interference between the CH and DC, to further improve the QoS and avoid unnecessary packet dropping in the network. The normal traffic is scheduled through the CAP slots using the CSMA/CA schedule while the critical traffic is sent via the CFPs slots using the TDMA schedule, to avoid channel allocation conflict. The available time slots per frame in the CAP and CFP periods of the MAC protocol, which are denoted by and , respectively, can be computed using the following equations:
where is the total available spectrum, is the guard band used to separate the channels, that is, to avoid channel overlapping, is the number of SMs (users) separated according to time, and is the bandwidth of a channel in the spectrum. Finally, in the upper-tier transmission, the DC forwards the pre-processed classified AMI data through the SG communication core network (Internet) to the CCS. After the metering data is further classified, processed, and analyzed, relevant responses, e.g., commands, are sent back to the SMs in the manner established by Algorithms 1 and 2, using the IoT-based communication network in the SG.
6. Design and Implementation
This section gives details of our three-tier hierarchical architecture and its design and implementation for the SM infrastructure. In the following subsections, we discuss the geographical area assumed for our network model and the simulation setup details, and discuss the numerical and simulation results obtained for the considered scenarios.
6.1. Geographical Area Assumption
We designed our network model using realistic geographic information over the map of Mansehra, KPK, Pakistan, where each residence is considered as a single SM and a transformer pole is at the center of the RA for the DC location. The geographic coordinates (longitude and latitude) of each device were found by visual search using OpenStreetMap [47] and cross-checked by comparing with the dataset taken from Google Maps [48]. In addition, the dataset was stored in the MS SQL server database at the cloud server, which is a key requirement in Algorithms 1 and 2 to configure the proposed clustering topology at the lower tier. The communication technology (Wi-SUN) adopts PHY layer multi-rate and multi-regional frequency shift keying (MR-FSK), which operates in the frequency band 902–928 (US) [28] with 129 channels and is compatible with the 2.4 GHz industrial, scientific, and medical (ISM) band (Wi-SUN router) with a maximum transmission rate of 50–200 kbps. The transmission radius of all SMs and the DC is set to 500 m in the configured topology. These devices are deployed in an area of approximately 1 km2. For those SMs which cannot communicate directly with the DC, their metering data is relayed via CHs to the DC with the limit on the maximum number of wireless hops () set to 2 or 3. We adopted the traffic specifications listed in Table 2 both for normal and critical traffic.
6.2. Simulation Setup
The Eclipse IDE and the CloudSim simulator [49] were used to model both the hardware entities (hosts, network topology, data centers) and software entities (virtual machines (VMs), brokers, cloudlets) in the cloud infrastructure for real-time AMI applications in the SG. This was accomplished by extending the Java classes offered in CloudSim for the mentioned entities, according to the simulation requirements. The events are fired for communication at specified time intervals and randomly, that is, the simulation is event-driven according to the real case scenarios. Cloudlets are created by data center brokers and AMI traffic is managed between SMs and the cloud applications by these message brokers using publish/subscribe protocols. In addition, these brokers control the VMs and execute each cloudlet on the VMs according to the selection algorithm (e.g., spaced–shared policy), considering the resources of the physical hosts in the data center. In this simulation, we used a two-tier broker architecture: the first tier receives the incoming traffic from the local SMs network at the DC and the second tier receives the incoming traffic from the connected DCs at the cloud gateways. The details of the network nodes are given in the Topology.brite file at the data center, as listed in Table 3, and are similar to the network model in Section 5.1.
In addition, the detailed configuration of the cloud server is given below in Table 4.
Similarly, web interfaces were implemented using VS code (Java script) and node.js, relying on a set of REST APIs (CustomerInfo, MeterInfo, BlackListMeters, MeterRead, BillInfo, etc.), which enabled all the IoT nodes to communicate and allowed remote access to IoT applications. Here, we used REST APIs to pass (push) all the metering data in JSON format between the SMs and the remote CCS (cloud REST server) over the Internet, using HTTP 1.1 POST methods. The simulation was run for 60 min (i.e., 1 h) and we took an average of 10 simulation runs. Thus, the IMR data was sampled four times, whereas the other metering data was assumed to be sent only once in the simulation period.
6.3. Scenario Description
In this simulation, we considered two different scenarios for AMI applications with different network topologies and queuing models. Scenario-1 was based on our proposed network model with a priority-based scheduling scheme. In Scenario-2, we considered a clustering topology with single-hop communication to the DCs based on Wi-SUN technology and a FIFO scheduling scheme (default).
6.4. Performance Evaluation
The performance of our simulation model was analyzed and compared in two scenarios for satisfying the stringent QoS requirement of AMI applications. In the simulation model, the incoming REST API requests (e.g., HTTP POST requests) were routed dynamically in the form of cloudlets to the cloud for accessing cloud applications. Furthermore, the cloud server dynamically allocated the available resources (i.e., VMs, RAM, BW, and CPU) to these incoming cloudlets. To compare the performance of the two scenarios (Section 6.3) based on allocation policies (FIFO and priority-based), we evaluated a varying number of cloudlets (40–120) and measured the resources (computation time) utilized by each cloudlet in the simulation environment.
6.5. Numerical and Simulation Results
Prior to all the simulation experiments, we studied the impact of the required number of DCs on the clusters in each scenario to cover all the SMs. The numerical results obtained from the network model are shown in Figure 3 and Figure 4. In order to achieve 100% coverage of the AMI network in both scenarios, we can observe that the required number of DCs is lower for the dual-head relaying strategy in Scenario-1. In contrast, the number of required DCs is substantially higher in Scenario-2, due to the traditional non-cooperative relaying strategy for AMI applications.
Furthermore, the results demonstrate that the network model in Scenario-1 satisfies the target coverage of the SMs and contributes substantially to reducing the overall cost in terms of deployment and purchase of DCs in the AMI network, as shown in Figure 4. For example, for K = 16, Scenario 1 requires only 20% of the number of DCs required by Scenario 2; that is, Scenario-1 consistently utilizes a lower number of DCs than Scenario-2, due to our proposed Algorithms 1 and 2. Hence, the comparison here shows that the proposed three-tier architecture in Scenario-1 with a cooperative relaying strategy (dual-head strategy) decreases the number of DCs required and offers more benefits than Scenario-2 with a non-cooperative relaying mode. It also achieves 100% coverage of SMs for AMI applications in the SG.
In addition, Figure 4 compares the purchase cost of DCs in each scenario. For instance, we can see that as the number of DCs increases, the purchase cost in Scenario-2 is five times higher than in Scenario-1. Thus, the cost reduction is 80% in Scenario-1, clearly outperforming Scenario-2 in the deployment cost of DCs. Next, the performances of the two scenarios were evaluated by five simulation experiments, with parameters summarized in Table 5.
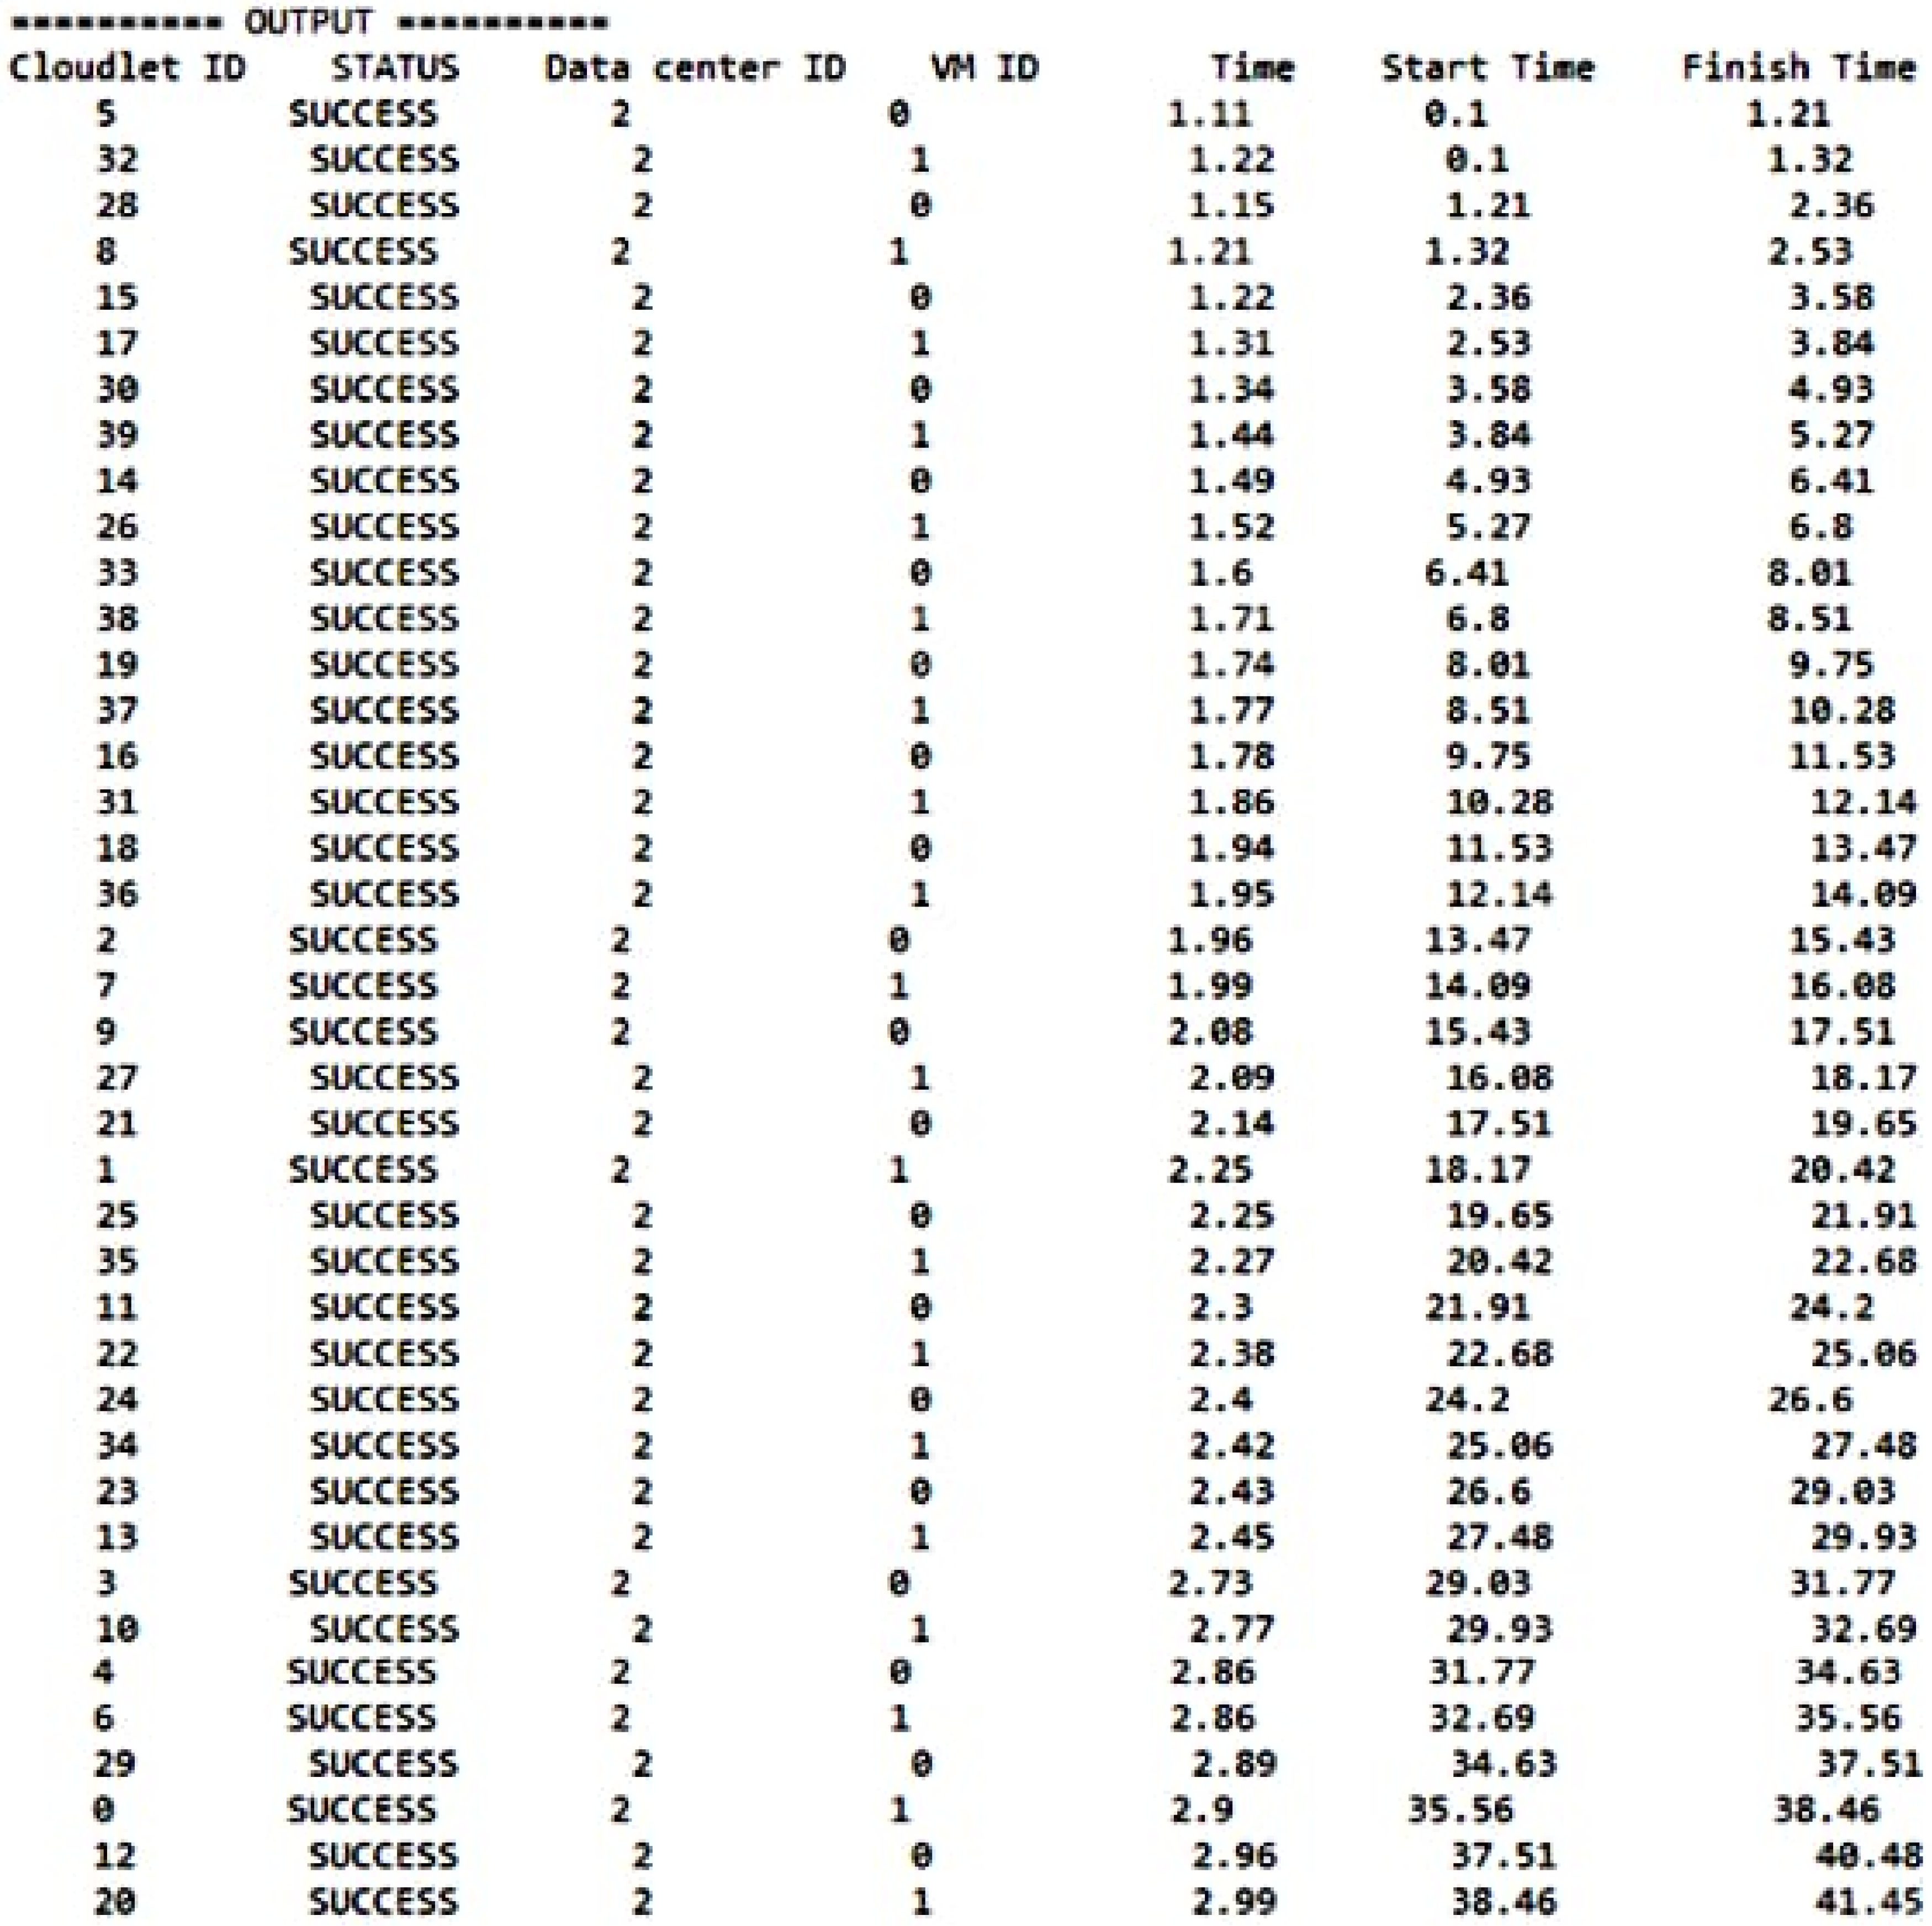
Figure 5 shows the simulation results of Experiment 1 for the first scenario in terms of computation time (milliseconds) utilized for scheduling the critical traffic items based on their priorities. These results were obtained from the data center using the CloudSim simulator.
All the experimental results of the two scenarios obtained by CloudSim are shown in Table 6. Table 6 presents the total time taken by all cloudlets in a given experiment by summing the start time and finish time for all cloudlets in the experiment and calculating the total computation time and waiting time from the measurements presented in Figure 5. The sum of the computation time and waiting time in each experiment is used to evaluate the performances of the two scenarios.
Figure 6 shows the total computation time with a varying number of cloudlets in the two scenarios. We see that the total computation time in Scenario-2 increases dramatically as the number of cloudlets increases. However, the total computation time incurred in Scenario-1 shows that the critical traffic is processed in less time, demonstrating its computational efficiency and scalability in large-scale networks.
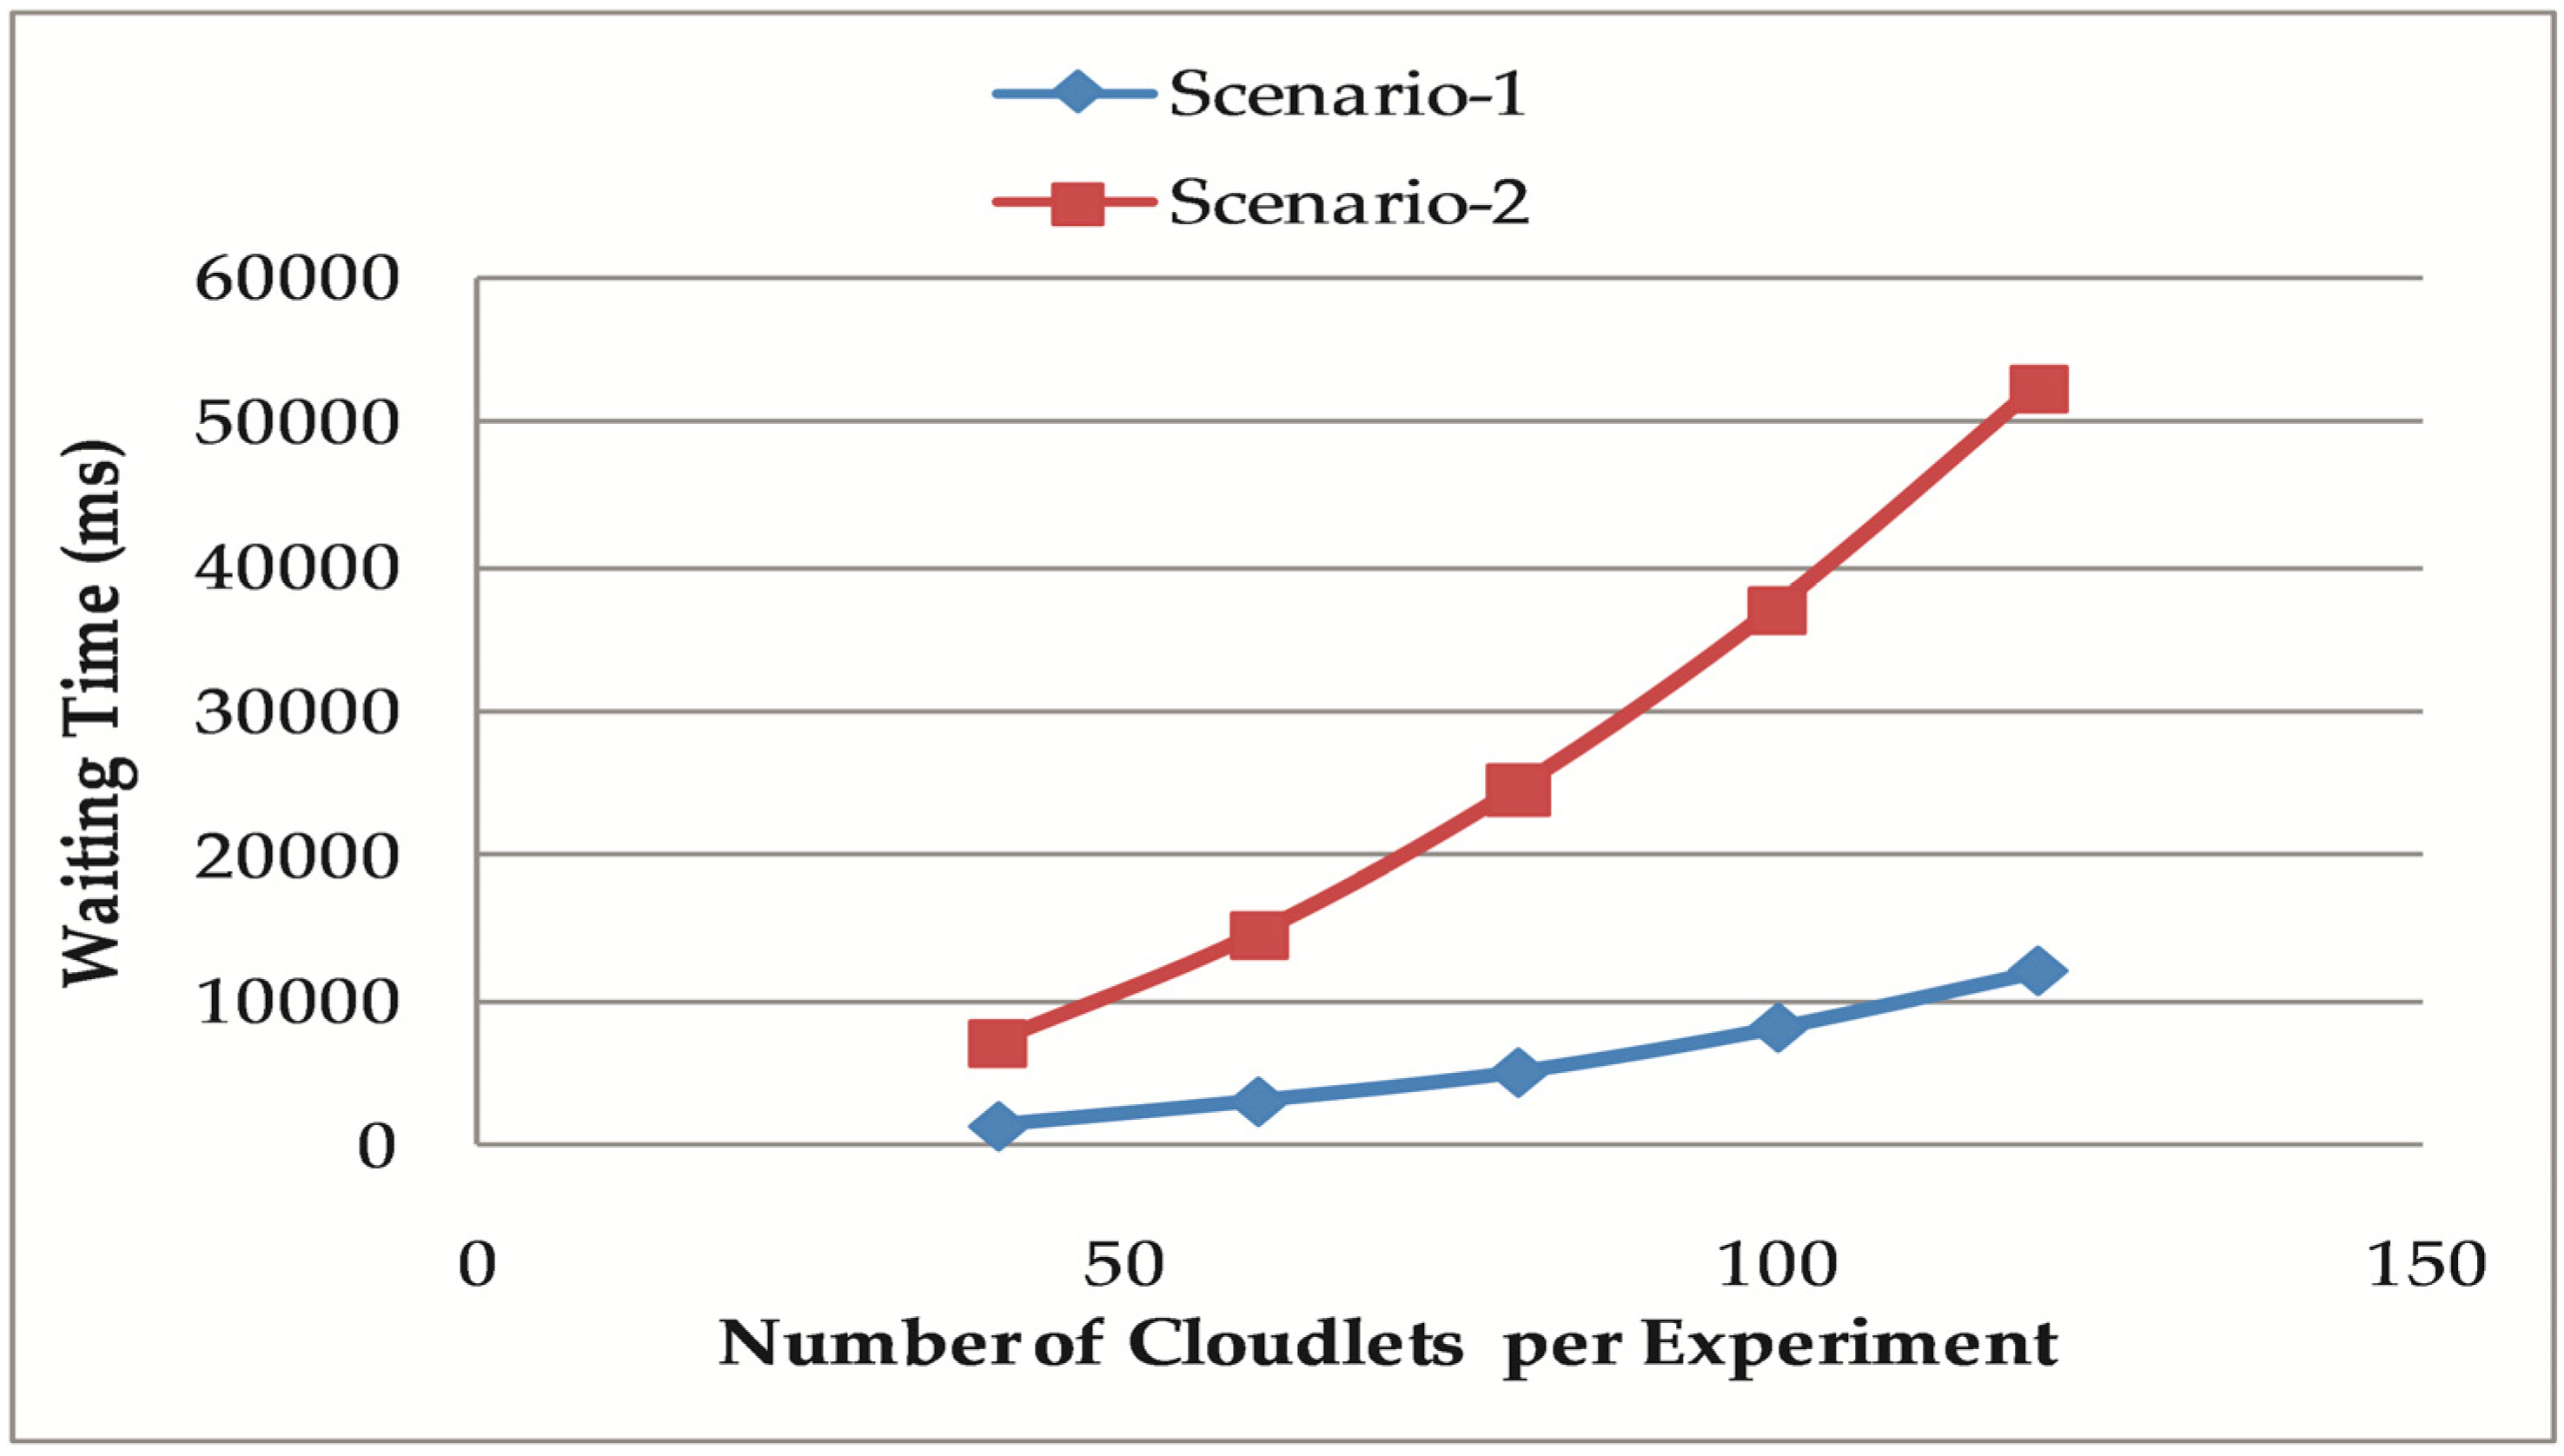
Similarly, Figure 7 shows the total waiting time for different numbers of cloudlets in each experiment in the two scenarios. We note that when the number of cloudlets increases from 40 to 120, as shown in Table 5, based on the number of requests per SM made in each experiment, the total waiting time of Scenario-2 increases significantly compared to the waiting time of Scenario-1. The comparison reveals that the tasks in Scenario-1 are processed at a very high speed and spend less time in the queue, due to the priority-based scheduling.
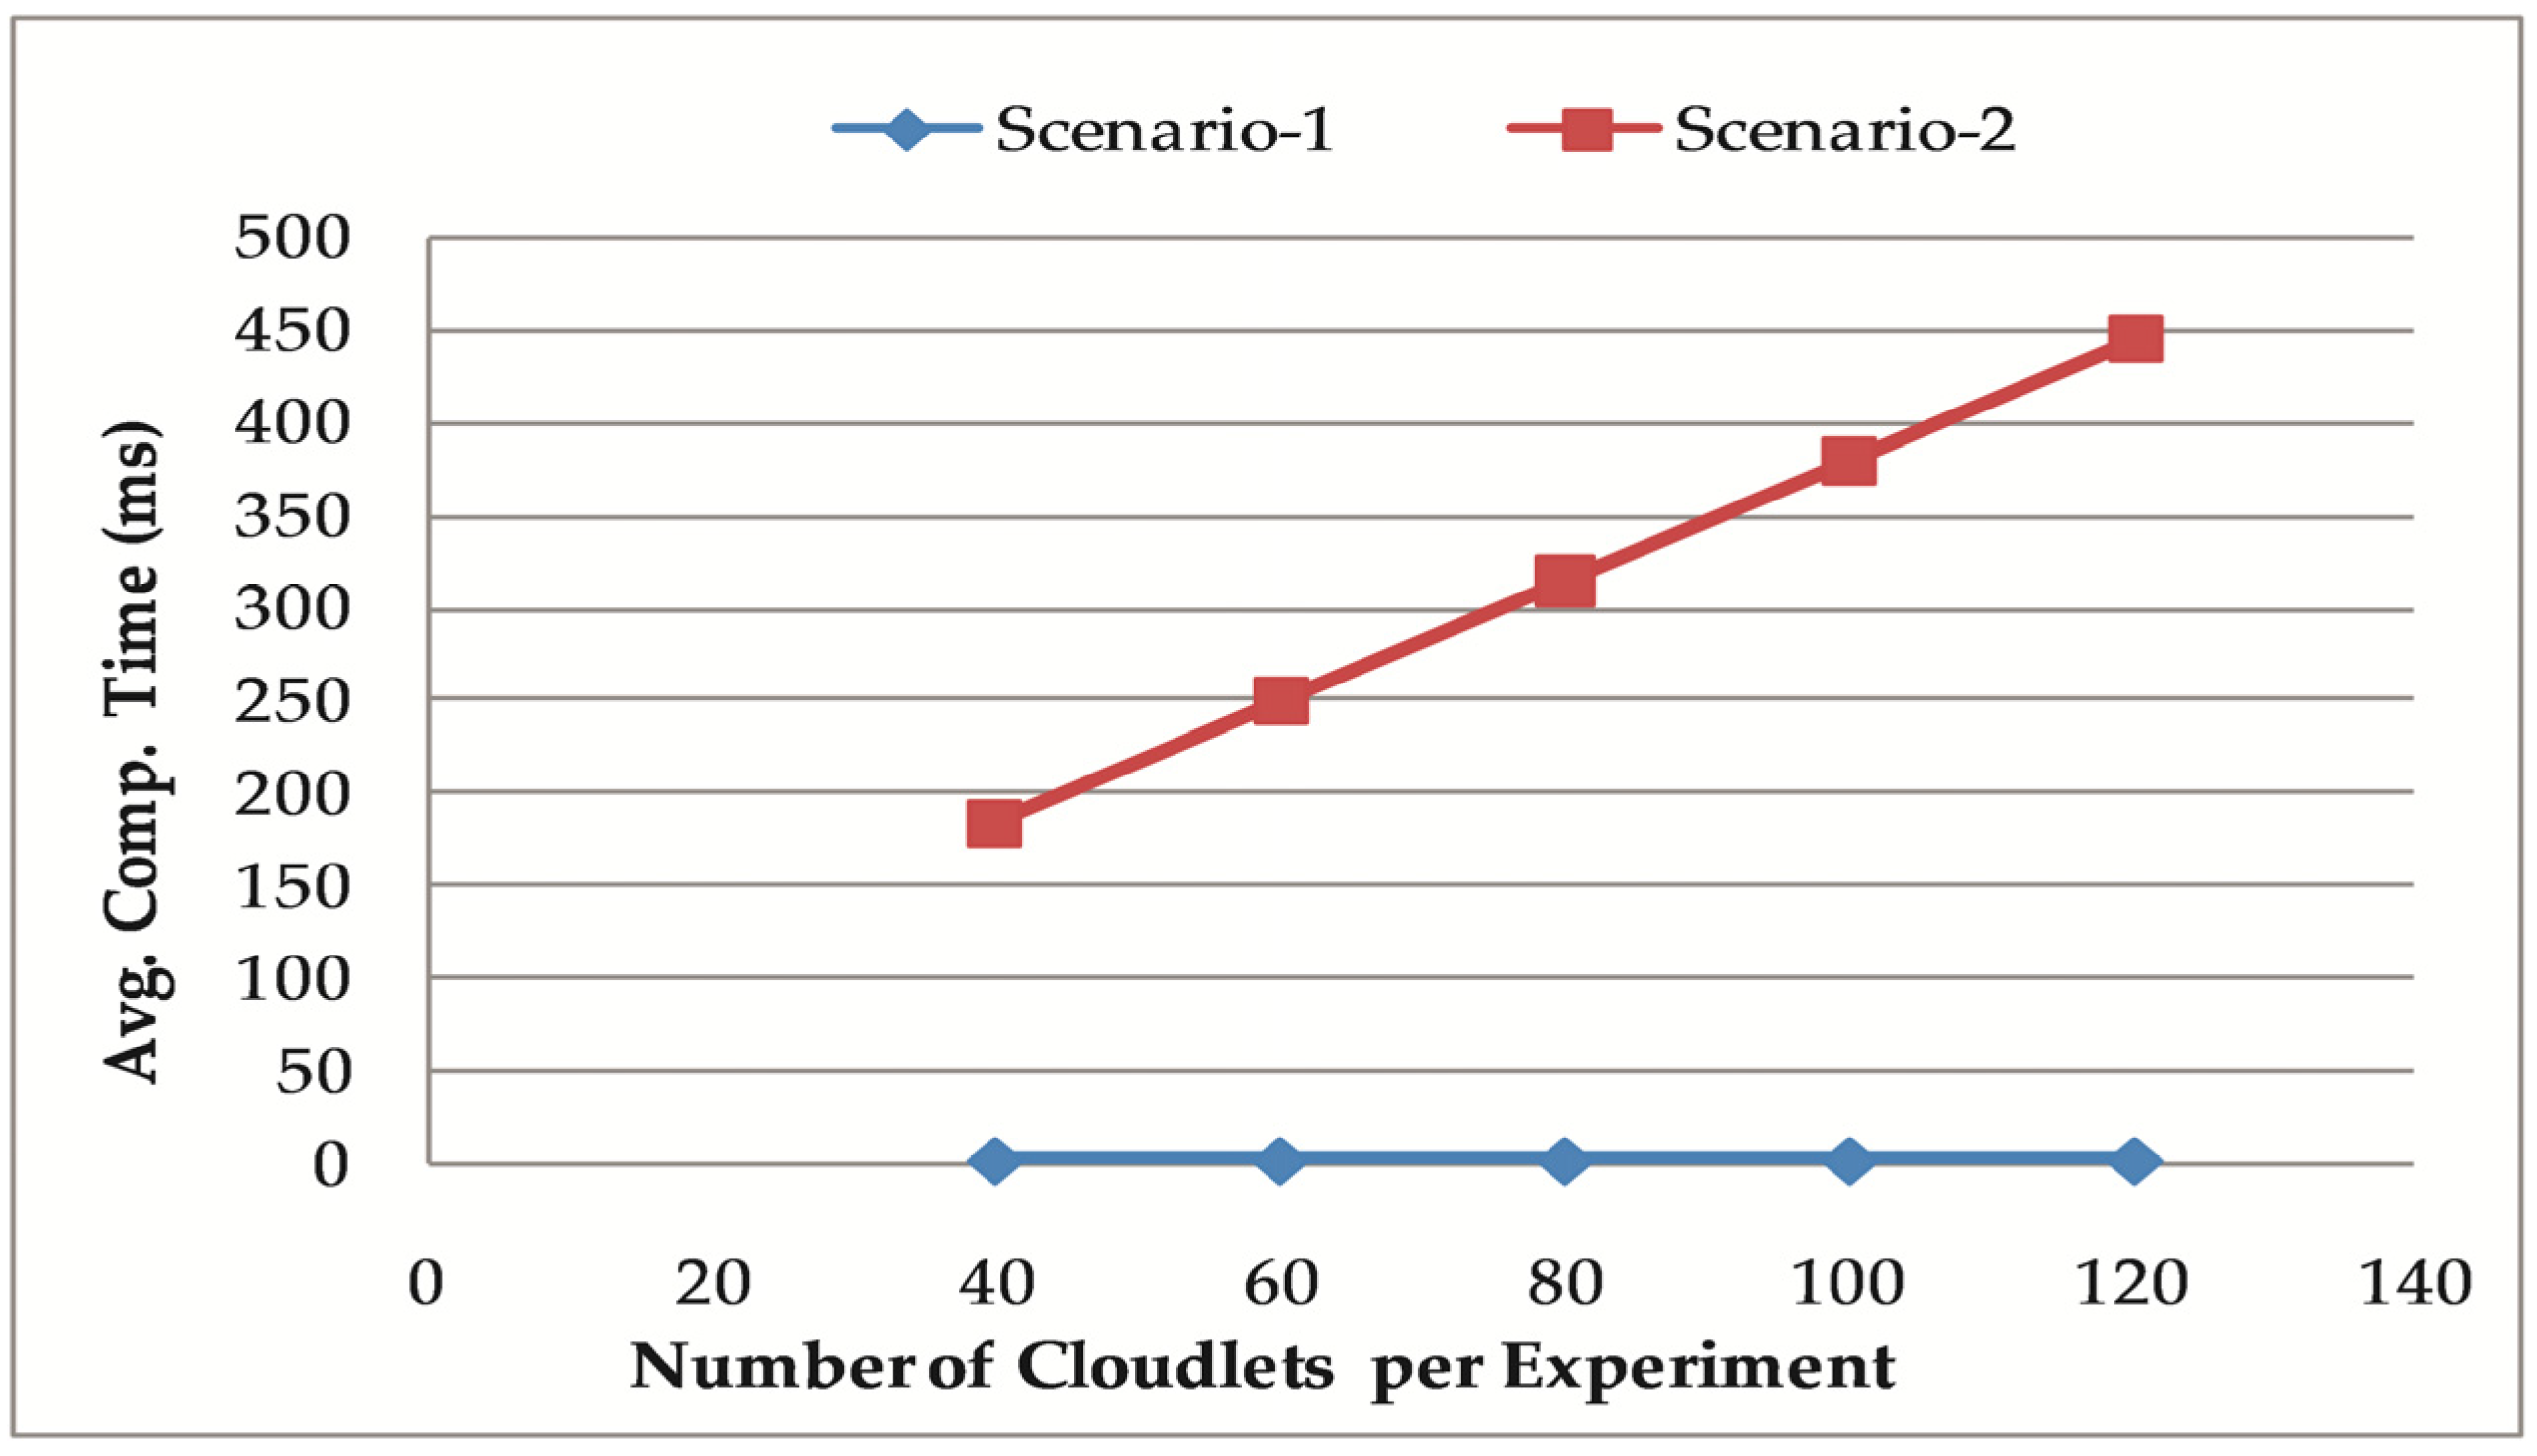
The computation and waiting times of the simulation experiments are averaged in Table 7 to give the average computation and waiting time per cloudlet for a comparative analysis of the two scenarios. For example, 40 cloudlets are used in Experiment 1 (refer Table 5), hence we divide the computation and waiting times in Table 6 to obtain the average computation and waiting times per cloudlet, that is, for Scenario-1 Experiment 1, average computation time = 81.73/40 = 2.04325 ms, and average waiting time = 1334.38/40 = 33.3595 ms.
Figure 8 plots the effect on the average computation time in the two scenarios when the number of cloudlets varies. We see a linear increase in the average computation time for different numbers of cloudlets in Scenario-1. In contrast, the average computation time is significantly increased in Scenario-2 for cloudlet completion. The numerical results in Table 7 obtained in the simulation experiments show that the sum of the average computation and waiting times for Scenario-1 is almost 10 times better for time of execution and completion of tasks than that for Scenario-2, demonstrating the computational efficiency of Scenario-1, especially in large-scale AMI networks.
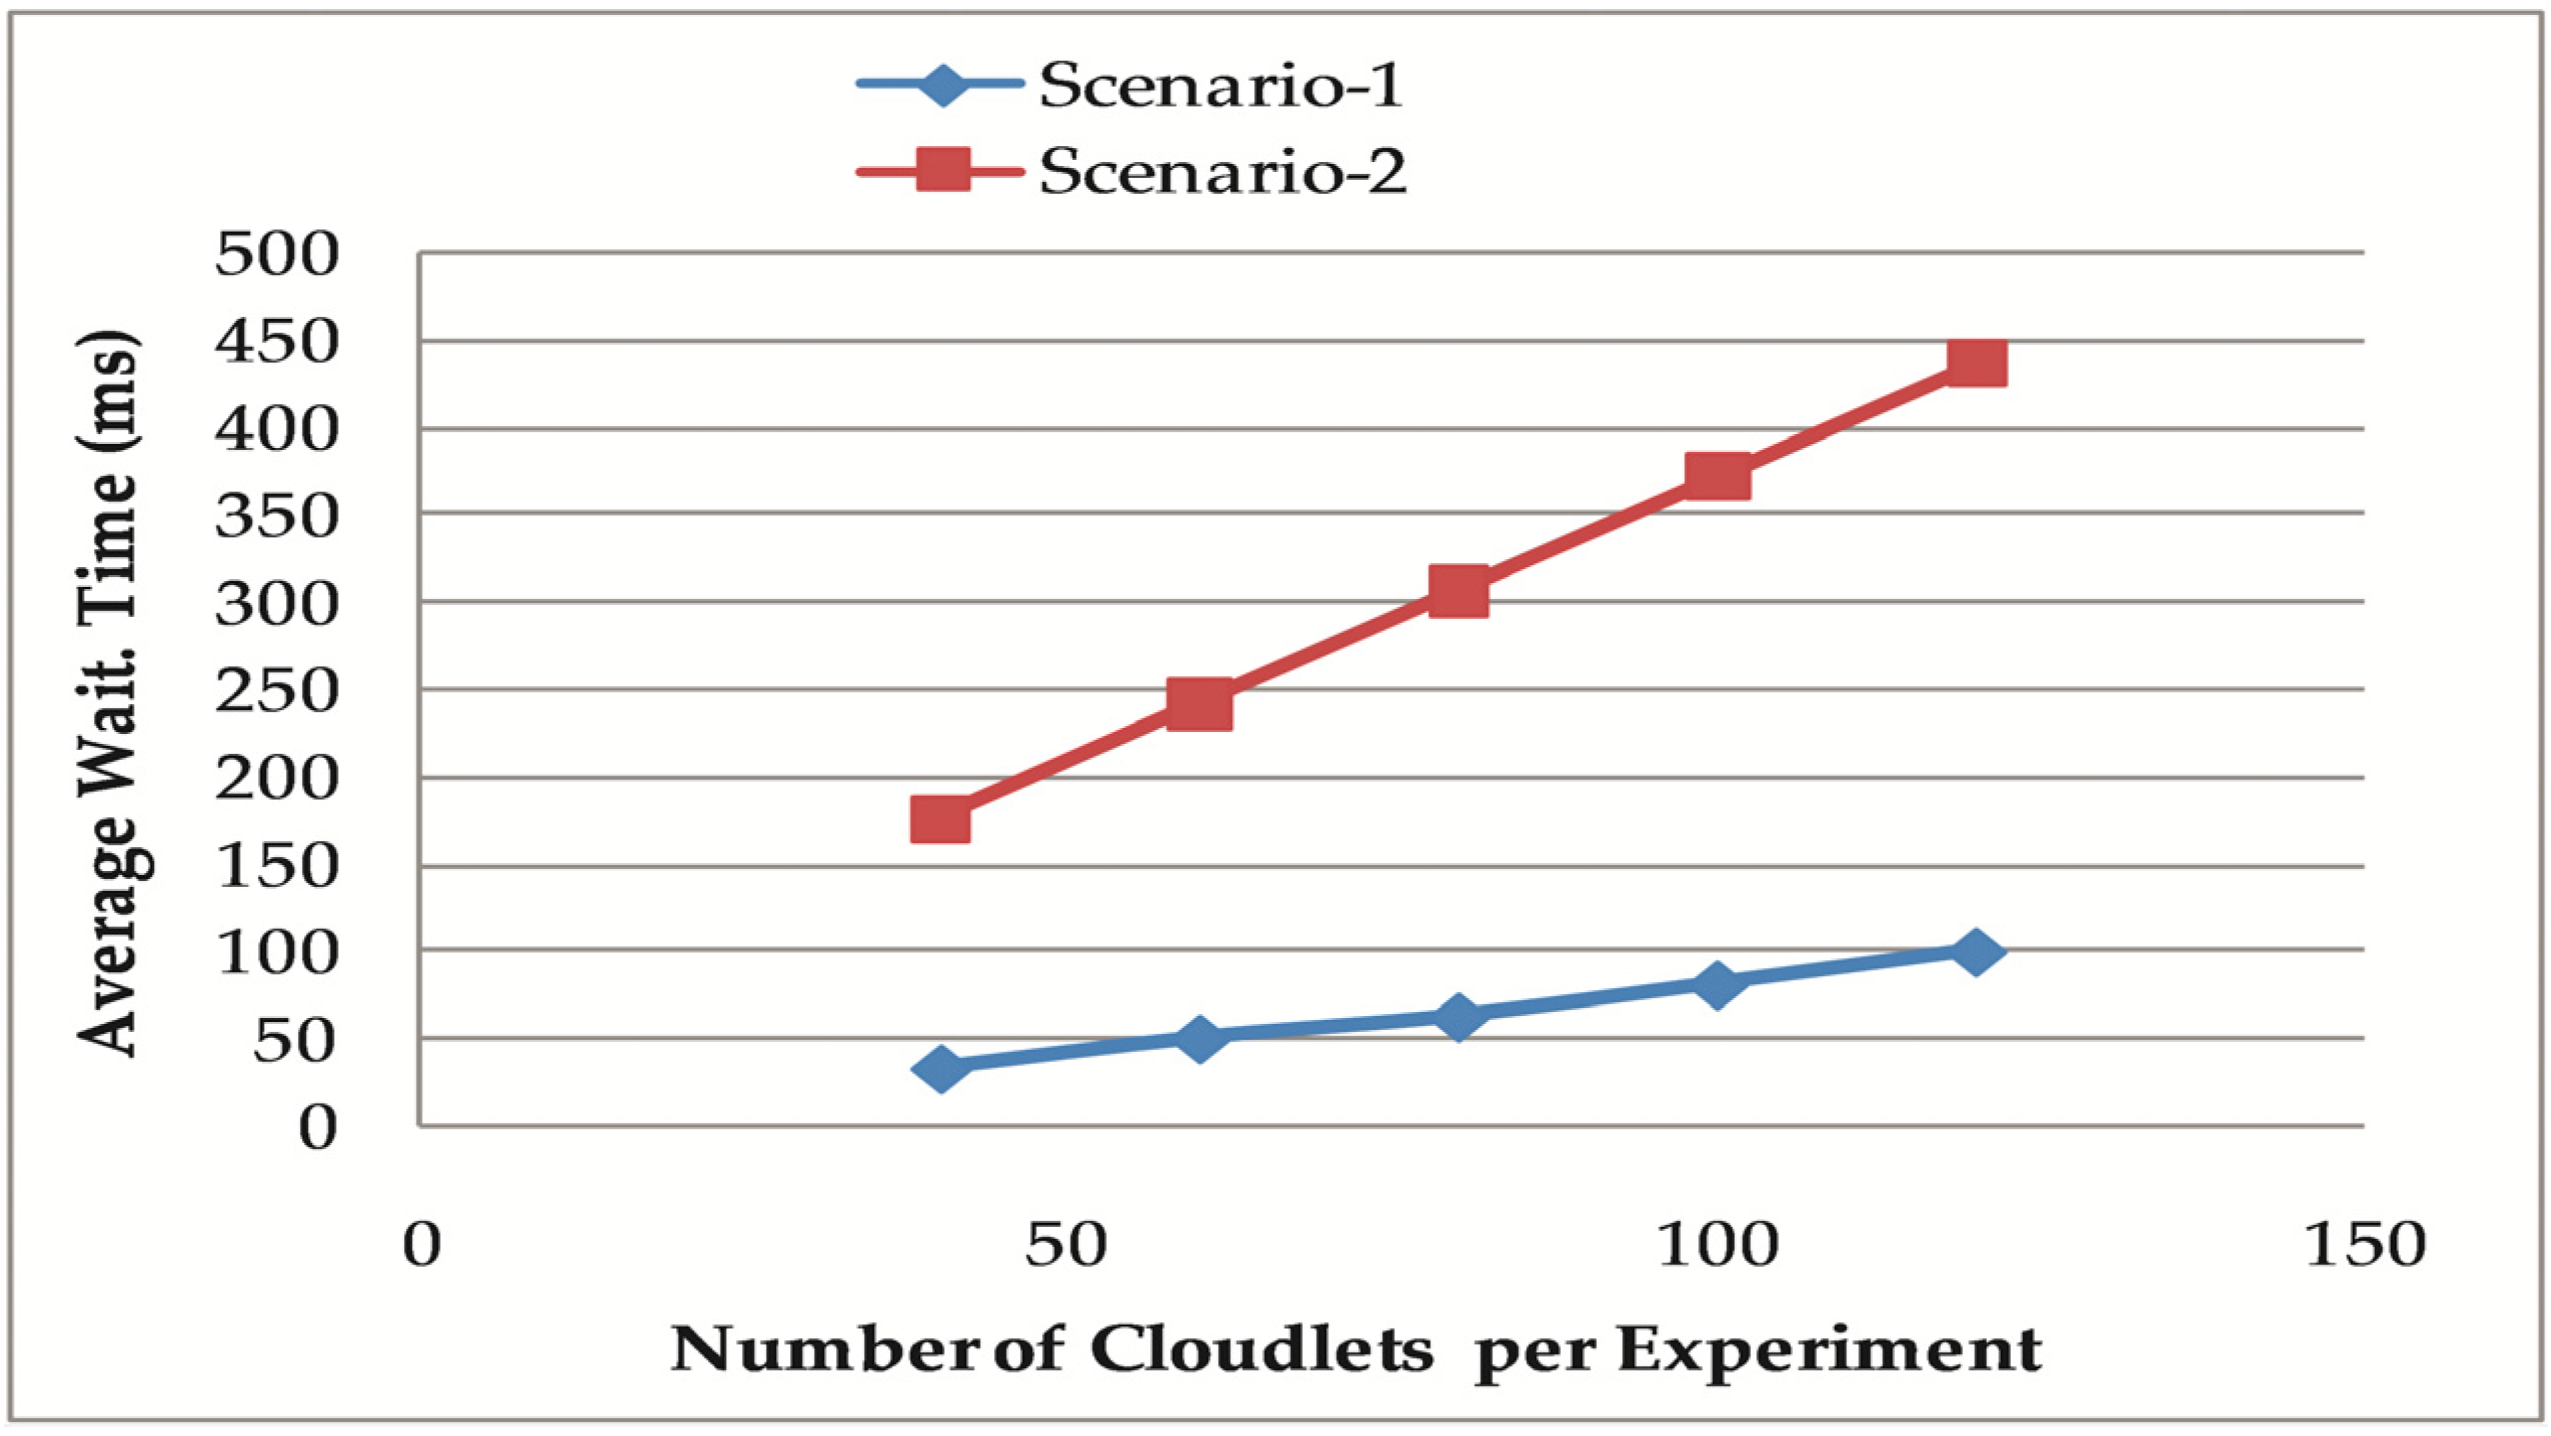
Figure 9 plots the effect of the number of cloudlets on the average waiting time in the two scenarios. We note that the Scenario-1 gives better performance compared to the average waiting time for the tasks in Scenario-2. The main reason is that Scenario-2 schedules the heavy cloudlets first and queues the high-priority cloudlets with a small size, which are scheduled afterwards, and this greatly affects the average waiting time. In short, we can see from Figure 9 that as the number of cloudlets increases, the average waiting time drops by 84% in our proposed model, compared with Scenario-2.
7. Conclusions
In this article, we proposed a QoS-aware machine-learning-based framework for AMI applications in SGs. The proposed framework incorporates a three-tier hierarchical architecture based on IoT technology and a cloud environment that enables the control center to remotely access and monitor the SMs in residential areas. In order to satisfy the stringent QoS and coverage requirements, we formulated a mathematical optimization problem. We modified the existing K-means algorithm to construct a hierarchical clustering topology for bi-directional communication between SMs and DCs. We proposed algorithms for defining the network topology and dividing the residential area into virtual clusters, and for dual-head (CH and AH) selection and rotation for optimal route formation. It was observed that the modified K-means algorithm provided a near-optimal solution within the proposed framework for AMI applications in the SG network.
Further, we developed a queuing model in which different priorities were assigned to each item of critical and normal AMI traffic based on its latency and packet size. The network model clearly defines the coverage area, clustering technique, the number of DCs required, and the fixed number of hops between SMs and the DC that finally connects over the Internet to the utility provider’s control server. Furthermore, we used a queuing model for transmission of AMI applications and used two different scheduling schemes in two scenarios (corresponding to two frameworks) with contrasting features in the simulation. The first scenario/framework was based on our proposed network model with a priority-based scheduling scheme, while the second scenario/framework considered a clustering topology with single-hop communication to the DCs and a FIFO scheduling scheme. The numerical results showed that our proposed framework with a three-tier hierarchical architecture utilized a smaller number of DCs, which contributes substantially to reducing the overall purchase cost by up to 80%, while still providing full coverage and connectivity between SMs and DCs.
Furthermore, we described a set of simulation experiments for different configurations to estimate and analyze the performance of the two scenarios using the CloudSim simulator. The simulation results obtained in all five experiments showed that our proposed model efficiently utilized the CPUs in terms of processing time, due to the priority-based scheduling scheme. In summary, the proposed framework performed better than the traditional framework (Scenario-2). These results show the suitability of our proposed framework for AMI applications in an SG network.
Our future work will focus on developing lightweight security schemes to ensure the privacy, integrity, and confidentiality of metering data in the SG.
Author Contributions
Conceptualization, A.K. and A.I.U.; methodology, A.K.; software, A.K.; validation, A.K., A.M. and S.H.S.; formal analysis, A.K.; investigation, A.K.; data curation, A.K.; writing—original draft preparation, A.K.; writing—review and editing, A.K. and A.M.; visualization, M.A.; supervision, A.I.U.; project administration, A.K.; funding acquisition, A.I.U., A.M. and M.A.K. All authors have read and agreed to the published version of the manuscript.
Funding
The APC was funded by Kansas State University.
Institutional Review Board Statement
Not Applicable.
Informed Consent Statement
Not Applicable.
Data Availability Statement
Not applicable.
Acknowledgments
The authors would like to thank Bei Yu, CSE Department, Chinese University of Hong Kong for his valuable suggestions and comments and for providing laboratory resources used for experiments that improved this article.
Conflicts of Interest
The authors declare no conflict of interest.
Abbreviations
| Notation | Description |
| RA | Georeferenced residential area |
| DC | Data concentrator |
| CC | Control center |
| CCS | Control center server |
| WANs | Wide-area networks |
| MDMS | Metering data management system |
| BS | Base station |
| PMUs | Phasor measurement units |
| Unique identity of ith device | |
| Smart meter with longitude and latitude | |
| Total number of installed SMs in RA | |
| Cluster head of Kth cluster | |
| Aggregator head of Kth cluster | |
| Number of SMs in Kth cluster | |
| Number of DCs | |
| DH | Dual head |
| Number of dual heads | |
| Transmission priority | |
| Recommended latency | |
| Number of hops allowed to reach DC | |
| True if ith SM connects to jth DC | |
| True if data is routed through kth DH | |
| Data generation rate of ith SM | |
| Packet service rates of jth DC | |
| K | Number of clusters in RA |
| LPWAN | Low-power wide-area networks |
| LoRa | Long-range radio |
| NB-IOT | Narrow band IoT |
| DAP | Data aggregation point |
| PLC | Power line communication |
| WHN | Wireless heterogeneous networks |
| CNs | Communication nodes |
| DAC | Data aggregator centers |
| D2D | Device to device |
| NAN | Neighborhood area network |
| Wi-SUN | Wireless smart utility network |
| Hop between ith and jth device | |
| CUB | Capacity upper bound |
| L, W | Length and width of RA |
| Diagonal distance of RA | |
| Transmission radius of DC and SM | |
| Distance between ith and jth device | |
| Threshold distance from centroid | |
| Critical queue of kth CH | |
| PQ | Priority queue |
| Normal queue of Kth CH | |
| maxTime | Maximum time of CH and AH |
| At least one DH is assigned to ith device |
References
- NETL. Advanced metering infrastructure. In Modern Grid Strategy Powering our 21st-Century Economy; U.S. Department of Energy, Office of Electricity Delivery and Energy Reliability: Washington, DC, USA, 2008; p. 34. [Google Scholar]
- Bian, D.; Kuzlu, M.; Pipattanasomporn, M.; Rahman, S. Analysis of communication schemes for advanced metering infrastructure (AMI). In Proceedings of the 2014 IEEE PES General Meeting|Conference & Exposition, National Harbor, MD, USA, 27–31 July 2014; pp. 1–5. [Google Scholar]
- Kabalci, Y. A survey on smart metering and smart grid communication. Renew. Sustain. Energy Rev. 2016, 57, 302–318. [Google Scholar] [CrossRef]
- Meng, W.; Ma, R.; Chen, H.-H. Smart grid neighborhood area networks: A survey. IEEE Netw. 2014, 28, 24–32. [Google Scholar] [CrossRef]
- Kuzlu, M.; Pipattanasomporn, M.; Rahman, S. Communication network requirements for major smart grid applications in HAN, NAN and WAN. Comput. Netw. 2014, 67, 74–88. [Google Scholar] [CrossRef]
- Gungor, V.C.; Sahin, D.; Kocak, T.; Ergut, S.; Buccella, C.; Cecati, C.; Hancke, G.P. Smart grid technologies: Communication technologies and standards. IEEE Trans. Ind. Inform. 2011, 7, 529–539. [Google Scholar] [CrossRef] [Green Version]
- Open Smart Grid-OpenSG. Available online: http://osgug.org/default.aspx (accessed on 10 November 2021).
- Ho, Q.D.; Le-Ngoc, T. Smart grid communications networks: Wireless technologies protocols issues and standards. In Handbook of Green Information and Communication Systems; Obaidat, I.W.M., Anpalagan, A., Eds.; Elsevier: Amsterdam, The Netherlands, 2012; pp. 115–146. [Google Scholar]
- Kabalci, Y.; Kabalci, E.; Padmanaban, S.; Holm-Nielsen, J.B.; Blaabjerg, F. Internet of things applications as energy internet in smart grids and smart environments. Electronics 2019, 8, 972. [Google Scholar] [CrossRef] [Green Version]
- Tureczek, A.M.; Nielsen, P.S. Structured literature review of electricity consumption classification using smart meter data. Energies 2017, 10, 584. [Google Scholar] [CrossRef] [Green Version]
- Huang, S.-C.; Lu, C.-N.; Lo, Y.-L. Evaluation of AMI and SCADA data synergy for distribution feeder modeling. IEEE Trans. Smart Grid 2015, 6, 1639–1647. [Google Scholar] [CrossRef]
- Gatsis, N.; Giannakis, G.B. Residential load control: Distributed scheduling and convergence with lost AMI messages. IEEE Trans. Smart Grid 2012, 3, 770–786. [Google Scholar] [CrossRef]
- Meng, Y.; Yu, Z.; Shi, D.; Bian, D.; Wang, Z. Forced oscillation source location via multivariate time series classification. In Proceedings of the 2018 IEEE/PES Transmission and Distribution Conference and Exposition (T&D), Denver, CO, USA, 16–19 April 2018; pp. 1–5. [Google Scholar]
- Ullah, R.; Faheem, Y.; Kim, B.-S. Energy and congestion-aware routing metric for smart grid AMI networks in smart city. IEEE Access 2017, 5, 13799–13810. [Google Scholar] [CrossRef]
- Chen, M.; Miao, Y.; Hao, Y.; Hwang, K. Narrow band internet of things. IEEE Access 2017, 5, 20557–20577. [Google Scholar] [CrossRef]
- Petäjäjärvi, J.; Mikhaylov, K.; Pettissalo, M.; Janhunen, J.; Iinatti, J. Performance of a low-power wide-area network based on lora technology: Doppler robustness, scalability, and coverage. Int. J. Distrib. Sens. Netw. 2017, 13. [Google Scholar] [CrossRef] [Green Version]
- Collier, S.E. The emerging enernet: Convergence of the smart grid with the internet of things. IEEE Ind. Appl. Mag. 2016, 23, 12–16. [Google Scholar] [CrossRef]
- Da Xu, L.; He, W.; Li, S. Internet of things in industries: A survey. IEEE Trans. Ind. Inform. 2014, 10, 2233–2243. [Google Scholar]
- Alrawais, A.; Alhothaily, A.; Hu, C.; Cheng, X. Fog computing for the internet of things: Security and privacy issues. IEEE Internet Comput. 2017, 21, 34–42. [Google Scholar] [CrossRef]
- Arghira, N.; Hawarah, L.; Ploix, S.; Jacomino, M. Prediction of appliances energy use in smart homes. Energy 2012, 48, 128–134. [Google Scholar] [CrossRef]
- Rolim, G.; Passos, D.; Moraes, I.; Albuquerque, C. Modelling the data aggregator positioning problem in smart grids. In Proceedings of the 2015 IEEE International Conference on Computer and Information Technology; Ubiquitous Computing and Communications; Dependable, Autonomic and Secure Computing; Pervasive Intelligence and Computing, Liverpool, UK, 26–28 October 2015; pp. 632–639. [Google Scholar]
- Karimi, B.; Namboodiri, V. Capacity analysis of a wireless backhaul for metering in the smart grid. In Proceedings of the 2012 Proceedings IEEE INFOCOM Workshops, Orlando, FL, USA, 25–30 March 2012; pp. 61–66. [Google Scholar]
- Malandra, F.; Sansò, B. Analytical performance analysis of a large-scale RF-mesh smart meter communication system. In Proceedings of the 2015 IEEE Power & Energy Society Innovative Smart Grid Technologies Conference (ISGT), Washington, DC, USA, 18–20 February 2015; pp. 1–5. [Google Scholar]
- Aalamifar, F.; Shirazi, G.N.; Noori, M.; Lampe, L. Cost-efficient data aggregation point placement for advanced metering infrastructure. In Proceedings of the 2014 IEEE International Conference on Smart Grid Communications (SmartGridComm), Venice, Italy, 3–6 November 2014; pp. 344–349. [Google Scholar]
- Aalamifar, F.; Lampe, L. Cost-efficient QoS-aware data acquisition point placement for advanced metering infrastructure. IEEE Trans. Commun. 2018, 66, 6260–6274. [Google Scholar] [CrossRef]
- Aalamifar, F.; Lampe, L. Optimized data acquisition point placement for an advanced metering infrastructure based on power line communication technology. IEEE Access 2018, 6, 45347–45358. [Google Scholar] [CrossRef]
- Kong, P.-Y. Wireless neighborhood area networks with QoS support for demand response in smart grid. IEEE Trans. Smart Grid 2015, 7, 1913–1923. [Google Scholar] [CrossRef]
- Harada, H.; Mizutani, K.; Fujiwara, J.; Mochizuki, K.; Obata, K.; Okumura, R. IEEE 802.15.4g based Wi-SUN communication systems. IEICE Trans. Commun. 2017, E100B, 1032–1043. [Google Scholar] [CrossRef] [Green Version]
- Kong, P.; Liu, C.; Jiang, J. Cost-efficient placement of communication connections for transmission line monitoring. IEEE Trans. Ind. Electron. 2017, 64, 4058–4067. [Google Scholar] [CrossRef]
- Kong, P.-Y. Cost efficient data aggregation point placement with interdependent communication and power networks in smart grid. IEEE Trans. Smart Grid 2017, 10, 74–83. [Google Scholar] [CrossRef]
- Souza, G.; Mestrando, F.V.; Lima, C.; Junior, G.; Castro, M.; Sérgio, A. Optimal positioning of GPRS concentrators for minimizing node hops in smart grids considering routing in mesh networks. In Proceedings of the 2013 IEEE PES Conference on Innovative Smart Grid Technologies (ISGT Latin America), Sao Paulo, Brazil, 15–17 April 2013; pp. 1–7. [Google Scholar]
- Inga, E.; Campaña, M.; Hincapié, R.; Moscoso-Zea, O. Optimal deployment of FiWi networks using heuristic method for integration microgrids with smart metering. Sensors 2018, 18, 2724. [Google Scholar] [CrossRef] [Green Version]
- Inga, E.; Cespedes, S.; Hincapie, R.; Cardenas, C.A. Scalable route map for advanced metering infrastructure based on optimal routing of wireless heterogeneous networks. IEEE Wirel. Commun. 2017, 24, 26–33. [Google Scholar] [CrossRef]
- Song, Y.; Kong, P.-Y.; Kim, Y.; Baek, S.; Choi, Y. Cellular-assisted D2D communications for advanced metering infrastructure in smart gird. IEEE Syst. J. 2019, 13, 1347–1358. [Google Scholar] [CrossRef]
- Wang, G.; Zhao, Y.; Ying, Y.; Huang, J.; Winter, R.M. A clustering algorithm for the DAP placement problem in smart grid. In Proceedings of the International Conference on Advanced Hybrid Information Processing, Harbin, China, 17–18 July 2017; pp. 349–359. [Google Scholar]
- Hassan, A.; Zhao, Y.; Pu, L.; Wang, G.; Sun, H.; Winter, R.M. Evaluation of clustering algorithms for DAP placement in wireless smart meter network. In Proceedings of the 2017 9th International Conference on Modelling, Identification and Control (ICMIC), Kunming, China, 10–12 July 2017; pp. 1085–1090. [Google Scholar]
- Atat, R.; Ismail, M.; Shaaban, M.F.; Serpedin, E.; Overbye, T. Stochastic geometry-based model for dynamic allocation of metering equipment in spatio-temporal expanding power grids. IEEE Trans. Smart Grid 2020, 11, 2080–2091. [Google Scholar] [CrossRef]
- Atat, R.; Ismail, M.; Refaat, S.S.; Serpedin, E. Stochastic geometry model for interdependent cyber-physical communication-power networks. In Proceedings of the ICC 2020–2020 IEEE International Conference on Communications (ICC), Dublin, Ireland, 7–11 June 2020; pp. 1–6. [Google Scholar]
- Mezher, A.M.; Rivera, P.E.I.; Cárdenas-Barrera, J.; Meng, J.; Guerra, E.C. Efficient strategy to optimize key devices positions in large-scale RF mesh networks. Ad Hoc Netw. 2020, 106, 102192. [Google Scholar] [CrossRef]
- Miao, H.; Chen, G.; Zhao, Z.; Zhang, F. Evolutionary aggregation approach for multihop energy metering in smart grid for residential energy management. IEEE Trans. Ind. Inform. 2021, 17, 1058–1068. [Google Scholar] [CrossRef]
- Sadhukhan, D.; Ray, S.; Obaidat, M.S.; Dasgupta, M. A secure and privacy preserving lightweight authentication scheme for smart-grid communication using elliptic curve cryptography. J. Syst. Archit. 2021, 114, 101938. [Google Scholar] [CrossRef]
- Mahmood, K.; Chaudhry, S.A.; Naqvi, H.; Shon, T.; Ahmad, H.F. A lightweight message authentication scheme for smart grid communications in power sector. Comput. Electr. Eng. 2016, 52, 114–124. [Google Scholar] [CrossRef]
- Bao, H.; Chen, L. A lightweight privacy-preserving scheme with data integrity for smart grid communications. Concurr. Comput. Pract. Exp. 2016, 28, 1094–1110. [Google Scholar] [CrossRef]
- Cypher, D.E.; Golmie, N.T. NIST SGIP priority action plan 2, guidelines for assessing wireless standards for smart grid applications. NIST Interag. Intern. Rep. 2014, 7761. [Google Scholar]
- Hägerling, C.; Ide, C.; Wietfeld, C. Coverage and capacity analysis of wireless M2M technologies for smart distribution grid services. In Proceedings of the 2014 IEEE International Conference on Smart Grid Communications (SmartGridComm), Venice, Italy, 3–6 November 2014; pp. 368–373. [Google Scholar]
- Khan, A.W.; Abdullah, A.H.; Razzaque, M.A.; Bangash, J.I. VGDRA: A virtual grid-based dynamic routes adjustment scheme for mobile sink-based wireless sensor networks. IEEE Sens. J. 2014, 15, 526–534. [Google Scholar] [CrossRef] [Green Version]
- OpenStreetMap. Available online: https://www.openstreetmap.org/search?query=#map=5/51.500/-0.100 (accessed on 5 November 2021).
- Google Maps. Available online: https://www.google.com/maps (accessed on 10 November 2021).
- Wadhonkar, A.; Theng, D. An analysis of priority length and deadline based task scheduling algorithms in cloud computing. IJCSN 2016, 5, 360–364. [Google Scholar]
Figure 1.
IoT-based general AMI example in smart grid (redrawn from [9]).
Figure 1.
IoT-based general AMI example in smart grid (redrawn from [9]).

Figure 2.
Proposed three-tier hierarchical architecture for AMI applications.

Figure 3.
Required number of DCs for SM coverage.

Figure 4.
Purchase cost versus required number of DCs.

Figure 5.
Simulation results of Experiment 1 in terms of computation time for Scenario-1.

Figure 6.
Computation time versus number of cloudlets.

Figure 7.
Waiting time versus number of cloudlets.

Figure 8.
Average computation time versus number of cloudlets.

Figure 9.
Average waiting time versus number of cloudlets.


Table 1.
Comparison of existing AMI schemes.
| Schemes (Year) | Problem Specification | Virtual Structure (Topology) | Algorithm (Technique) | Communication Technology | AMI Applications | Objectives |
|---|---|---|---|---|---|---|
| [24,25,26] (2014, 2018, 2018) | DAP placement problem | Single-hop, multi-hop clustering | Modified K-means, Greedy and Dijkstra’s | IEEE 802.15.4g, WiMAX relay, Fiber Optics, PRIME PLC | IMR, ODMR Alert Notifications, SCADA, Alarm | Minimize installation, maintenance, and transmission cost; maximize coverage and connectivity; QoS and latency is ensured |
| [27,30] (2015, 2017) | Concentrator placement problem | Single-hop clustering wireless NAN | Analytical model, DAP-CSA | IEEE 802.15.4g, WiFi, ZigBee, Fiber Optics | DR, control commands and sensor data | Optimize DC density to support a given SMs density; ensure QoS; minimize installation cost and DAP failures |
| [31] (2013) | Optimal positioning of concentrators (GPRS) | Multi-hop RF Mesh | K-means, BFS, Dijkstra’s | IEEE802.15.4 (ZigBee), GPRS | IDR | Reduce hops and average delay; improve network throughput |
| [32] (2018) | Optimal deployment of SM networks | Multi-hop tree-based clustering | N-NST, ODB, Dijkstra’s | WiFi, Cellular, Fiber Optics | Electricity consumption | Identify supply and demand; maximize coverage and capacity; minimize end-to-end delay and data aggregation cost |
| [33] (2017) | Optimal routing of WHN | Single-hop wireless HWN | OPDWHN-AMI | LTE cellular | Consumption reading and VoIP | Maximize coverage and capacity; minimize cost |
| [34] (2019) | Cluster-based D2D cellular communication | Single-hop clustering | Cluster formation, channel allocation | Cellular and Wired Link | ODR and IDR | Guarantee throughput and data aggregation; ensure QoS and spectral efficiency |
| [35,36] (2018, 2017) | DAP-placement problem | Multi-hop clustering topology | K-means and fuzzy c-means | Wireless | Collect information | Minimize the average and maximum distance between SMs and DAPs |
| [37,38] (2019, 2020) | Optimal PMUs allocation and interdependent cyber-physical networks | Multi-hop tree-based clustering | K-means | IEEE 123-bus | Load and connectivity data | Minimize financial budget and technical constraint |
| [39] (2020) | Optimize key devices positions | Multi-hop RF Mesh | K-means | IEEE 802.15.4 | Real dataset of meters | To ensure QoS, i.e., improve packet delivery ratio and minimize end-to-end delay |
| [40] (2020) | Optimize number and location of DAC | Two-hop clustering | Improved EAA | Wireless | Metering data | Ensure full coverage and connectivity; minimize infrastructure cost |
| [41,42] (2021, 2016) | Secure SG communication | Multi-hop hybrid NAN | ECC and hybrid Diffie–Hellman | ZigBee, WiMAX and Fiber Optic | Metering and control data | Achieve message integrity; minimize communication and computation cost |
| [43] (2016) | Processes bottleneck in SM | Multi-hop cluster-based tree | N/A | N/A | Electricity usage data | To improve efficiency; ensure data integrity and privacy |
| Proposed (2021) | Coverage Maximization dual-head placement | Fixed-hop clustering topology | Modified K-means | Wi-SUN, LoRa | Both normal and critical traffic | Maximize coverage, reduce cost, improve QoS and efficiently utilize CPU resources using IoT technologies |
Table 2.
Classification of AMI traffic types and their characteristics in SG.
| SNO | ToT | ToA | Pkt_Size | FG | |
|---|---|---|---|---|---|
| 1 | Normal | IMR | 250 Bytes | 5–60 min | 12–24 (Residential) |
| ODMR | 50 Bytes | 30 s | as per need | ||
| ODRR | 100 Bytes | 30 s | 5 days | ||
| 2 | Critical | RCC | 100 Bytes | 1 s | as per need |
| PCC | 100 Bytes | 1 s | as per need | ||
| AN | 50 Bytes | 3 s | as per need |
Table 3.
Details of IoT nodes used in simulation for the proposed three-tier hierarchical architecture.
Table 3.
Details of IoT nodes used in simulation for the proposed three-tier hierarchical architecture.
| IoT Node | Field Study | Node Location | Number | Specification |
|---|---|---|---|---|
| Node | Fixed SMs | RA (Urban) | 100–400 | Residential SMs with short-range communication technology [28] |
| Relay node | SMs (as CH, AH) | RA (Urban) | 8 | Aggregate and forward metering data on priority-basis to the DC |
| Gateway | DC | center of RA | 1 | Receive and forward data with short- [28] and long-range technology [16] |
| Router | Router | On CC premises | 1 | Receive traffic from the DC and forward it to the CCS and vice versa |
| Server (Physical Host) | CCS (Data Center) | CC of the Utility | 1 | Server running VM with database and has high-speed Internet connection |
Table 4.
Configuration details of cloud server.
| Cloud Server | Configuration |
|---|---|
| Virtual Machine (VM) | Xen |
| Architecture | X86 |
| Processor | Intel(R) Core™ i3-3110M CPU@ 2.40 GHz, 3 MB cache |
| Processor Rate | 250 MIPS |
| RAM | 4 GB |
| Hard Disk | 500 GB |
| Bandwidth | 1 Gbps |
| Operating System | Windows 7 Professional SP 1 |
Table 5.
Detailed configuration of simulation experiments.
| No. of SMs | Req. per SM | No. of Brokers | Data Transfer | No. of VMs | No. of Cloudlets | Simulation Time (min) | Simulation Experiment No. |
|---|---|---|---|---|---|---|---|
| 20 | 1–5 | 2 | 1 MB | 2 | 40 | 60 | 1 |
| 30 | 1–5 | 2 | 1 MB | 2 | 60 | 60 | 2 |
| 40 | 1–5 | 2 | 1 MB | 2 | 80 | 60 | 3 |
| 50 | 1–5 | 2 | 1 MB | 2 | 100 | 60 | 4 |
| 60 | 1–5 | 2 | 1 MB | 2 | 120 | 60 | 5 |
| Total | 5 |
Table 6.
Total computation time (ms) and waiting time (ms) in Scenario-1 and Scenario-2.
| Experiment No. | Scenario-1 | Scenario-2 | ||||||
|---|---|---|---|---|---|---|---|---|
| Start Time | Finish Time | Comp. Time | Wait. Time | Start Time | Finish Time | Comp. Time | Wait. Time | |
| 1 | 651 | 732.73 | 81.73 | 1334.38 | 52,543.64 | 59,922.84 | 7379.2 | 7061.99 |
| 2 | 1495.79 | 1617.8 | 122.01 | 3040 | 158,288.91 | 173,246.48 | 14,957.57 | 14,516.36 |
| 3 | 2496.56 | 2653.19 | 156.63 | 5055.93 | 351,483.98 | 376,607.97 | 25,123.99 | 24,554.38 |
| 4 | 4045.32 | 4245.19 | 199.87 | 8170.01 | 657,969.85 | 695,843.94 | 37,874.09 | 37,176.07 |
| 5 | 6075.92 | 6318.73 | 242.81 | 12102.3 | 1,103,842.49 | 1,157,060.33 | 53,217.84 | 52,381.41 |
Table 7.
Comparative analysis based on computation time (ms) and waiting time (ms).
| Experiment No. | Avg. Computation Time | Avg. Waiting Time | Avg. Computation Time + Avg. Waiting Time | |||
|---|---|---|---|---|---|---|
| Scenario-1 | Scenario-2 | Scenario-1 | Scenario-2 | Scenario-1 | Scenario-2 | |
| 1 | 2.04325 | 184.48 | 33.3595 | 176.54975 | 35.40275 | 361.02975 |
| 2 | 2.0335 | 249.2928333 | 50.66667 | 241.9393333 | 52.70017 | 491.2321666 |
| 3 | 1.957875 | 314.049875 | 63.199125 | 306.92975 | 65.157 | 620.979625 |
| 4 | 1.9987 | 378.7409 | 81.7001 | 371.7607 | 83.6988 | 750.5016 |
| 5 | 2.023416667 | 443.482 | 100.8525 | 436.51175 | 102.8759 | 879.99375 |
Publisher’s Note: MDPI stays neutral with regard to jurisdictional claims in published maps and institutional affiliations. |
© 2021 by the authors. Licensee MDPI, Basel, Switzerland. This article is an open access article distributed under the terms and conditions of the Creative Commons Attribution (CC BY) license (https://creativecommons.org/licenses/by/4.0/).
Share and Cite
MDPI and ACS Style
Khan, A.; Umar, A.I.; Munir, A.; Shirazi, S.H.; Khan, M.A.; Adnan, M. A QoS-Aware Machine Learning-Based Framework for AMI Applications in Smart Grids. Energies 2021, 14, 8171. https://0-doi-org.brum.beds.ac.uk/10.3390/en14238171
AMA Style
Khan A, Umar AI, Munir A, Shirazi SH, Khan MA, Adnan M. A QoS-Aware Machine Learning-Based Framework for AMI Applications in Smart Grids. Energies. 2021; 14(23):8171. https://0-doi-org.brum.beds.ac.uk/10.3390/en14238171
Chicago/Turabian StyleKhan, Asfandyar, Arif Iqbal Umar, Arslan Munir, Syed Hamad Shirazi, Muazzam A. Khan, and Muhammad Adnan. 2021. "A QoS-Aware Machine Learning-Based Framework for AMI Applications in Smart Grids" Energies 14, no. 23: 8171. https://0-doi-org.brum.beds.ac.uk/10.3390/en14238171
Note that from the first issue of 2016, this journal uses article numbers instead of page numbers. See further details here.