
Analysis Performance of SRM Based on the Novel Dependent Torque Control Method


The Faculty of Electrical and Computer Engineering, Rzeszow University of Technology, 35-959 Rzeszow, Poland
*
Author to whom correspondence should be addressed.
Energies 2021, 14(24), 8203; https://0-doi-org.brum.beds.ac.uk/10.3390/en14248203
Submission received: 18 November 2021
/
Revised: 28 November 2021
/
Accepted: 1 December 2021
/
Published: 7 December 2021
(This article belongs to the Special Issue Selected Issues of Electrical Engineering, Electronics and Mechatronics)
Abstract
:This paper presents a description and the results of simulations and laboratory tests of proposed methods for dependent torque control in a Switched Reluctance Motor (SRM). The proposed methods are based on Dependent Torque Motor Control (Rising Slope), DTMC(RC), and Dependent Torque Motor Control (Falling Slope), DTMC(FC). The results of these studies were compared with those on the Classical Torque Motor Control (CTMC) method. Studies were conducted for each of the analyzed control methods by determining the efficiency of the drive and the RMS of the source current and analyzing the vibrations generated for each of the control methods. The harmonics of the phase currents, which caused an increase in the level of vibrations generated, were determined. The usefulness of the proposed methods for controlling SRMs was assessed based on simulations and experiments. Additionally, the natural frequencies of the stator of the tested SRM were determined by a simulation using the Ansys Maxwell suite. The levels of vibration acceleration generated by the SRM were compared for the considered control methods.
1. Introduction
Switched Reluctance Motors (SRMs) belong to a group of machines with electronic commutation. They are highly efficient, have a simple design, and lack permanent magnets and windings on the rotor. This makes SRMs less expensive to manufacture than Induction Machines (IMs), especially Permanent Magnet Machines (PMMs). The very simple design of an SRM and the typical half-bridge power supply make the drive exceptionally resistant to faults and able to operate in the case of partial faults [1,2,3]. Switched reluctance machines are being continuously developed for applications in aviation [3,4,5] and electric cars [6,7,8,9,10] as an alternative to more expensive and more failure-prone drives with induction and permanent magnet machines. It should be noted that SRMs have a very wide range of speed control and a constant power operation. This is especially beneficial in electric vehicle drive applications. Unfortunately, despite their many advantages, SRMs also have disadvantages, including a high ripple torque generation, noisy operation and high ripple in the current drawn from the power source.
Torque ripples can be minimized structurally by increasing the number of phases and poles of the machine and optimizing the shape or span of its poles [11,12,13,14]. Algorithmic methods are a second group of methods used for reducing torque ripple. In general, there are methods based on a torque sharing function (TSF) [15,16,17] or on direct instantaneous torque control (DITC) [18,19]. The modifications of these methods, in addition to the main purpose of reducing torque ripple, also enable the reduction in losses in the machine windings [16,19,20,21]. An important problem in SRMs is the reduction in the source current ripple, which affects the RMS current and thus the level of losses occurring in the power source. In the case of an electric vehicle drive, an increase in the RMS current drawn causes the battery to discharge faster. A ripple reduction in the current drawn from the power source is discussed in papers [22,23,24]. Paper [22] describes a control method used to limit the capacitance included in the DC-link, which limits the amount of energy transferred from the motor to the power system. In [23], the classical power supply system was modified in such a way as to enable the regulation of the voltage powering the motor windings. Such a solution allows the reduction in the ripple of the current drawn from the battery pack. In [24], a modification of the power supply circuits and control algorithms was applied so that the power factor correction (PFC) was close to one when supplied from the power grid. A partial reduction in the source current ripple was achieved algorithmically at specific operating points of the SRM [25]. A different method of reducing both torque ripple and source current ripple was used in paper [14], based on the suitable shaping of the rotor poles. In [25], a Dependent Current Control is presented. The authors of this study have no knowledge of other attempts at using Dependent Torque Control in an SRM drive system.
The purpose of this paper is to present the results of studies determining the effect of the proposed methods of dependent torque control on the properties of a Switched Reluctance Motor. The details of the methods and the results of the simulation and experimental studies are presented in the following sections. As a result of these studies, it was found that the transition between the tested control algorithms at a given point of operation caused a change in the level of vibrations generated in the machine. Thus, the authors conducted tests to determine their cause. The conclusion section presents the advantages and disadvantages of the proposed control methods and the conclusions drawn from the results of the study.
This paper is organized as follows. In Section 2, the parameters of the tested machine, a diagram of the power supply, and a description of the classic torque control method are presented. The idea of the proposed Dependent Torque Control method is described in Section 3. The results are shown in Section 4 (simulation) and Section 5 (experimental). In Section 6 and Section 7, the study results and the enclosed conclusions are summarized.
2. Switched Reluctance Drive
2.1. Studied Object
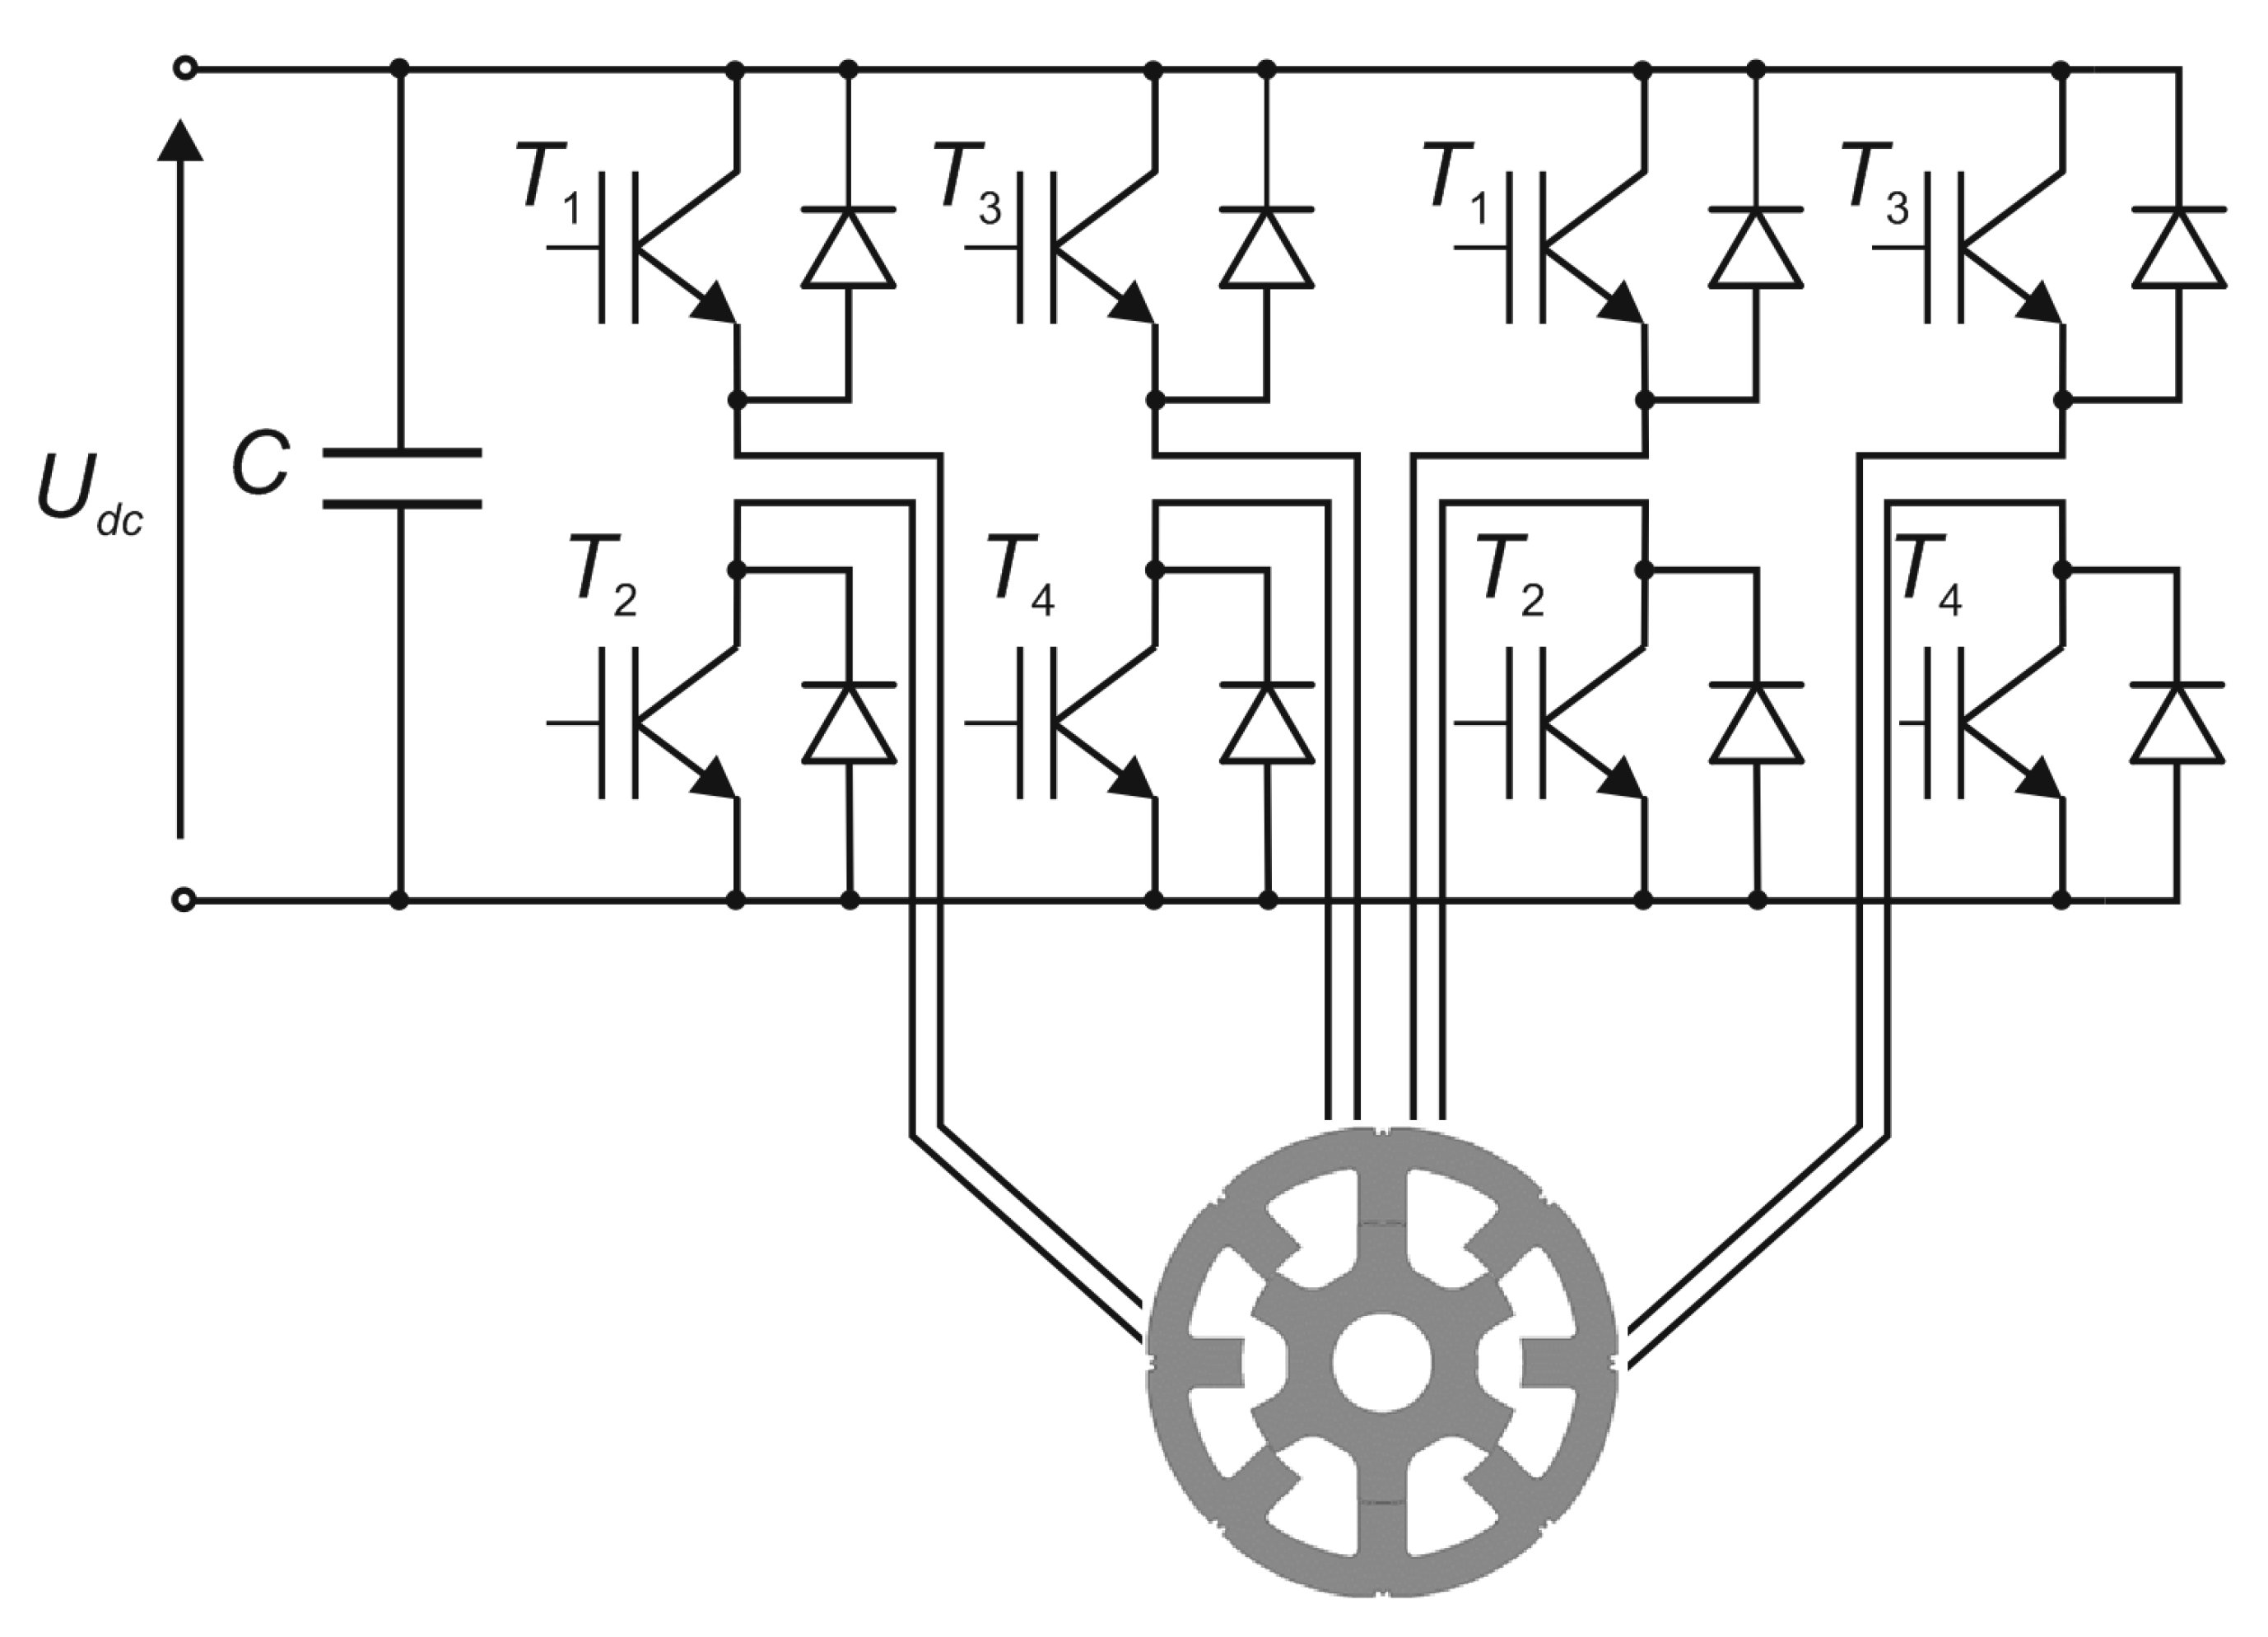
The studied object is a four-phase SRM with an 8/6 structure powered by a half-bridge converter. A diagram of the machine’s power supply is shown in Figure 1.
The basic parameters of the studied SRM are given in Table 1.
2.2. Classical Torque Current Control
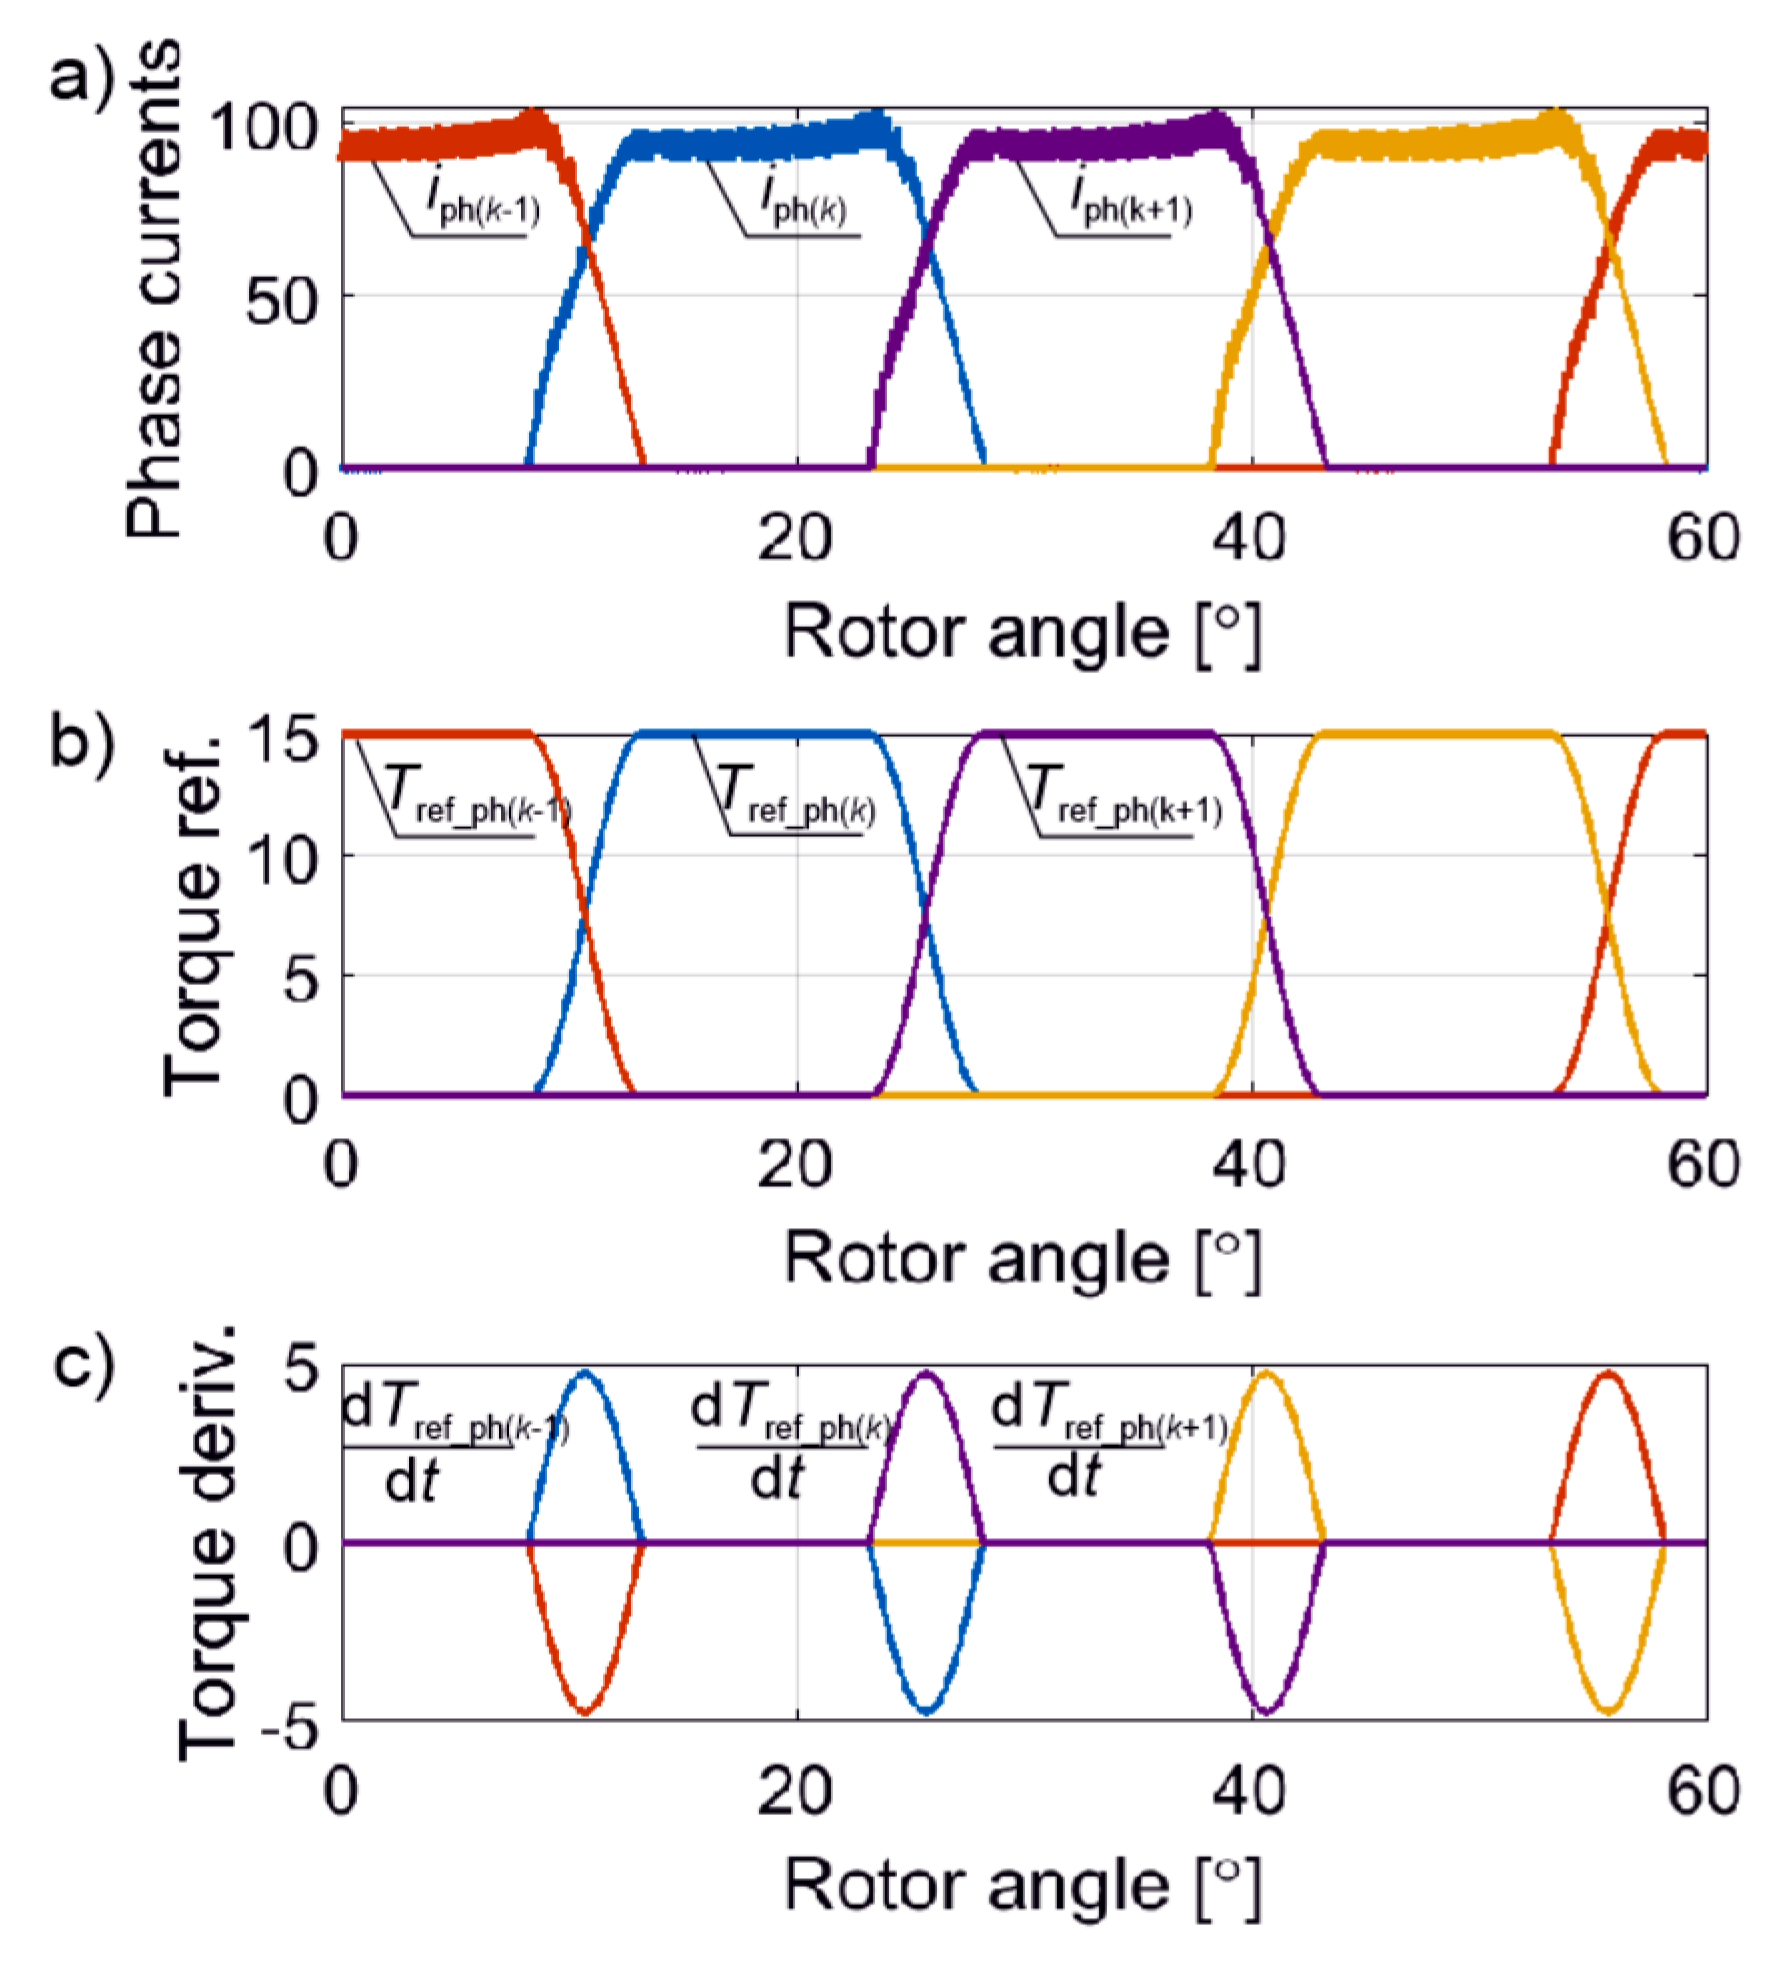
The use of a torque sharing function to minimize the torque ripple requires an adjustment of the phase currents in a way that maintains the required shape of the torques generated by each phase [14,16,17]. Figure 2 shows examples of the waveforms of phase currents, phase torque sharing functions (with cosine slopes) [15], and derivatives of torque sharing functions, with an indication of the individual phases: outgoing (k − 1), current (k) and incoming (k + 1).
The reference method adopted is Classical Torque Motor Control (CTMC), where three-level hysteresis delta torque controllers are used to control the torques of the individual phases. The operation of a single-phase torque controller is described by the control function:
where Tref(k) is the reference torque of the k-th phase, Te(k) is the instantaneous torque of the k-th phase, and ΔT is the hysteresis of the controllers.
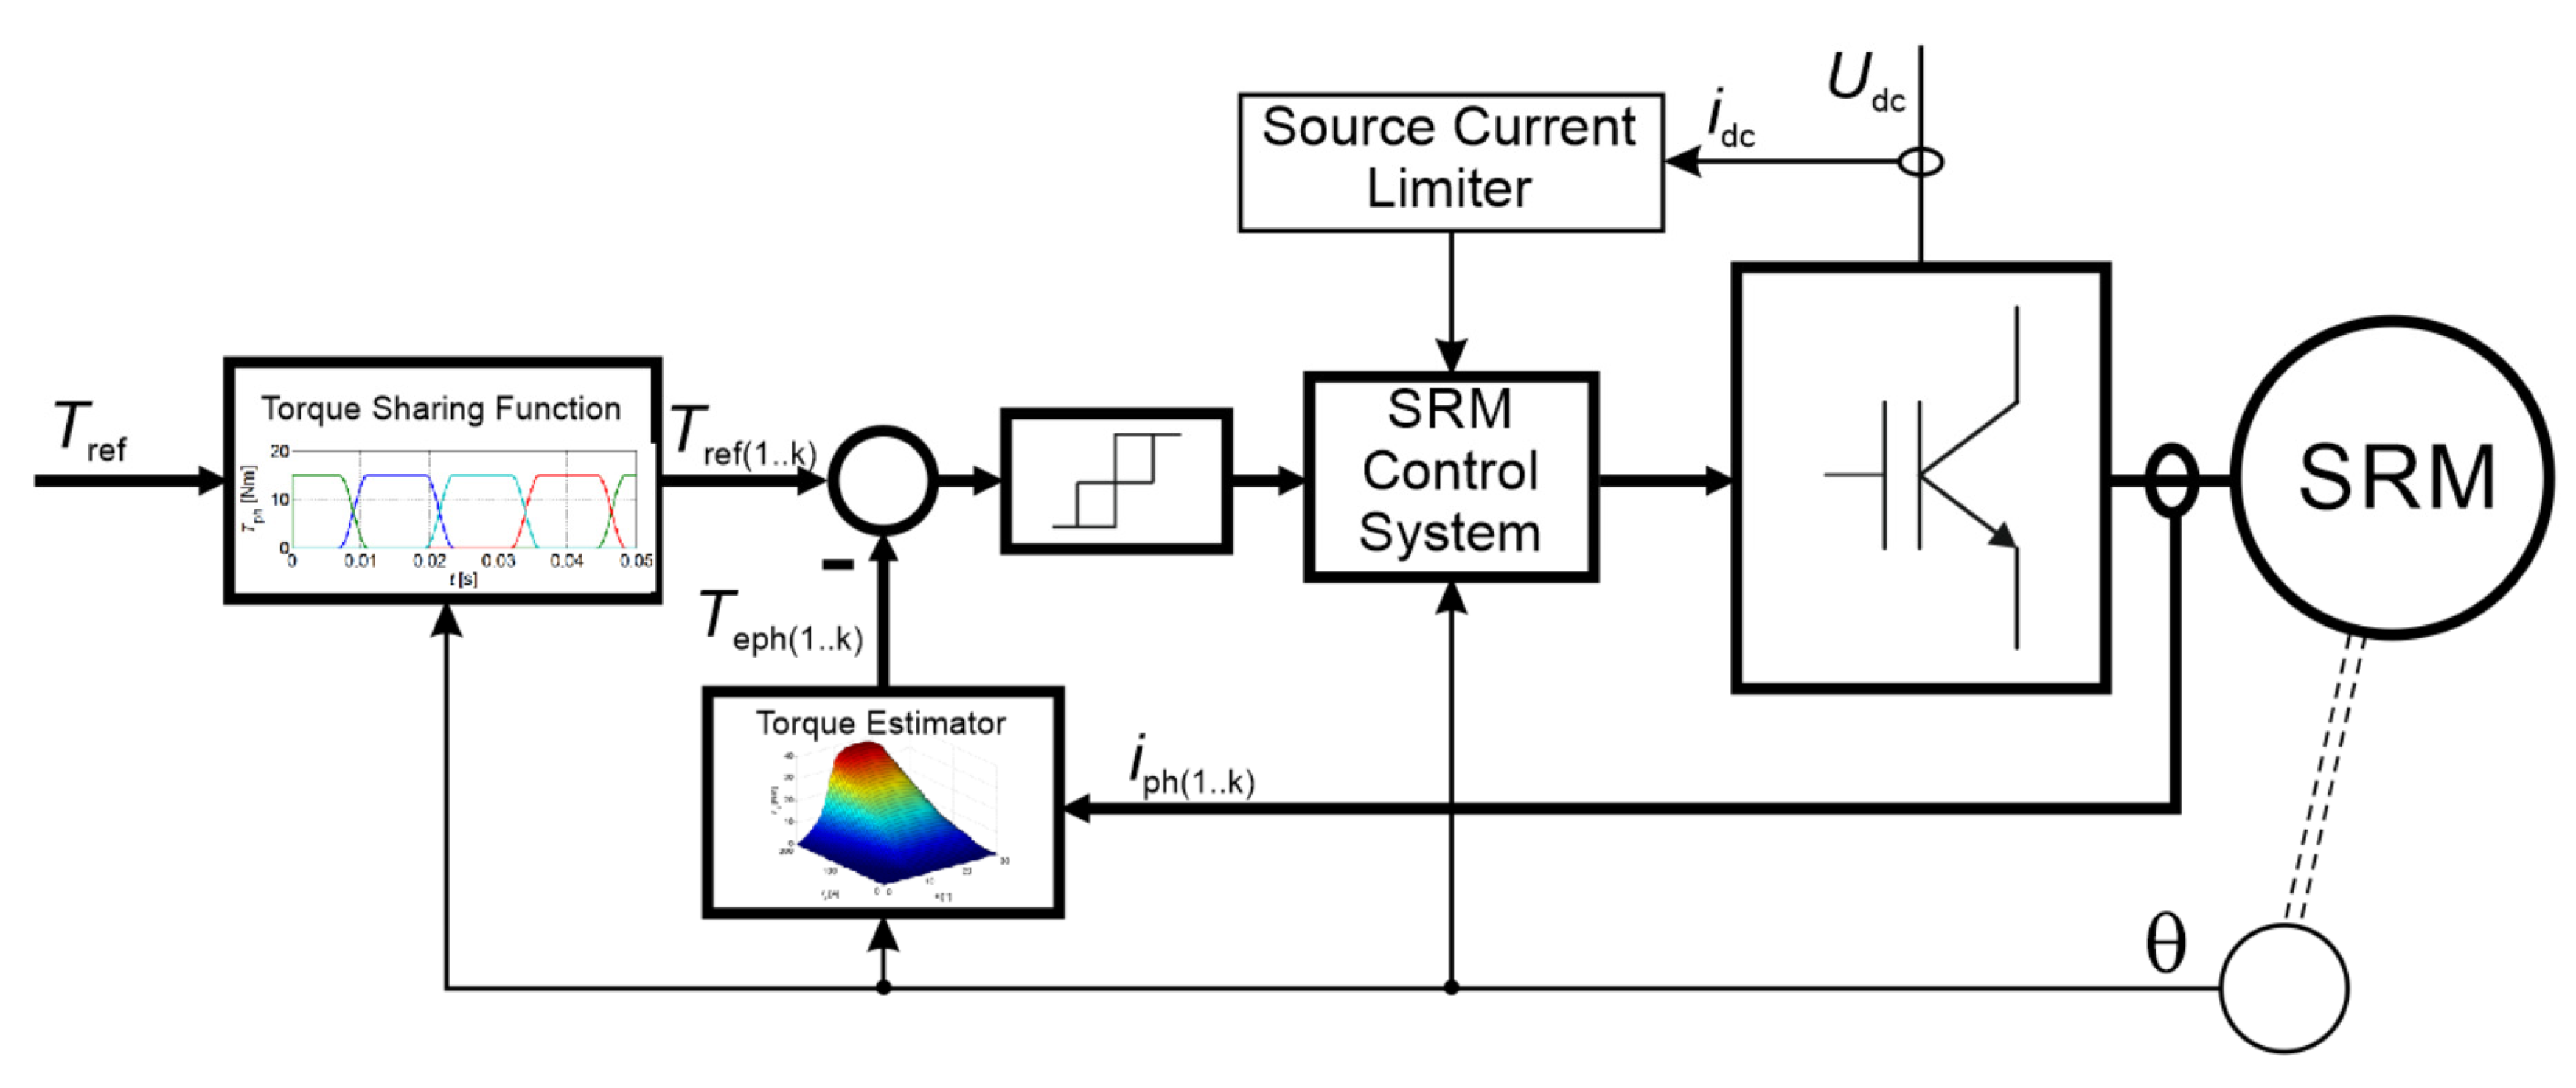
A diagram of the torque control structure in an SRM using CTMC is shown in Figure 3. To protect the system and the power source from excessive current consumption, a source current limiter, which activates in the case of a failure of any of the torque controllers, is used.
3. Proposed Dependent Torque Control Method
By modifying the CTMC method in such a way that the operation of the torque controllers of the individual phases in commutation periods was made dependent using the method described by Formulas (2) and (3), new characteristics of drive operation were obtained, which are studied and described in this paper.
The research compared three control cases:
- −
- Classical Torque Motor Control (CTMC);
- −
- Dependent Torque Motor Control (rising control) (DTMC(RC));
- −
- Dependent Torque Motor Control (falling control) (DTMC(FC)).
In each of these control algorithms, a torque sharing function with cosine slopes was used (Figure 2b). A separate controller was used to control the torque of each phase.
Paper [25] presents a method of dependent current control (DCC) in a switched reluctance machine. That method consists of controlling the phase currents in such a way that the windings are not powered simultaneously during the commutation period. This paper proposes the DTMC(RC) and DTMC(FC) algorithms, which operate based on a similar principle. The function of the DTMC(RC) controller is described by the relationship:
The operation of the torque controller is based on the principle that in the interval in which the derivative dTref(k)/dθ > 0 (rising slope—Figure 2c), the output state of this controller (k) depends on the state of the controller in the outgoing phase (k − 1). Outside of the commutation range, the torque controller operates as in the CTMC method. The controller operates similarly in the DTMC(FC) method, except that dependent control occurs when the slope of the function Tref(k) is falling. The function implementing DTMC(FC) control can be described by the following relationship:
Formulas (2) and (3) specify the proposed algorithms in the intervals of rising or falling torque. It may be observed that, in the intervals where the reference torque is constant, the controller function operates as in the CTMC algorithm.
4. Simulation Studies
4.1. Steady State of Machine Operation
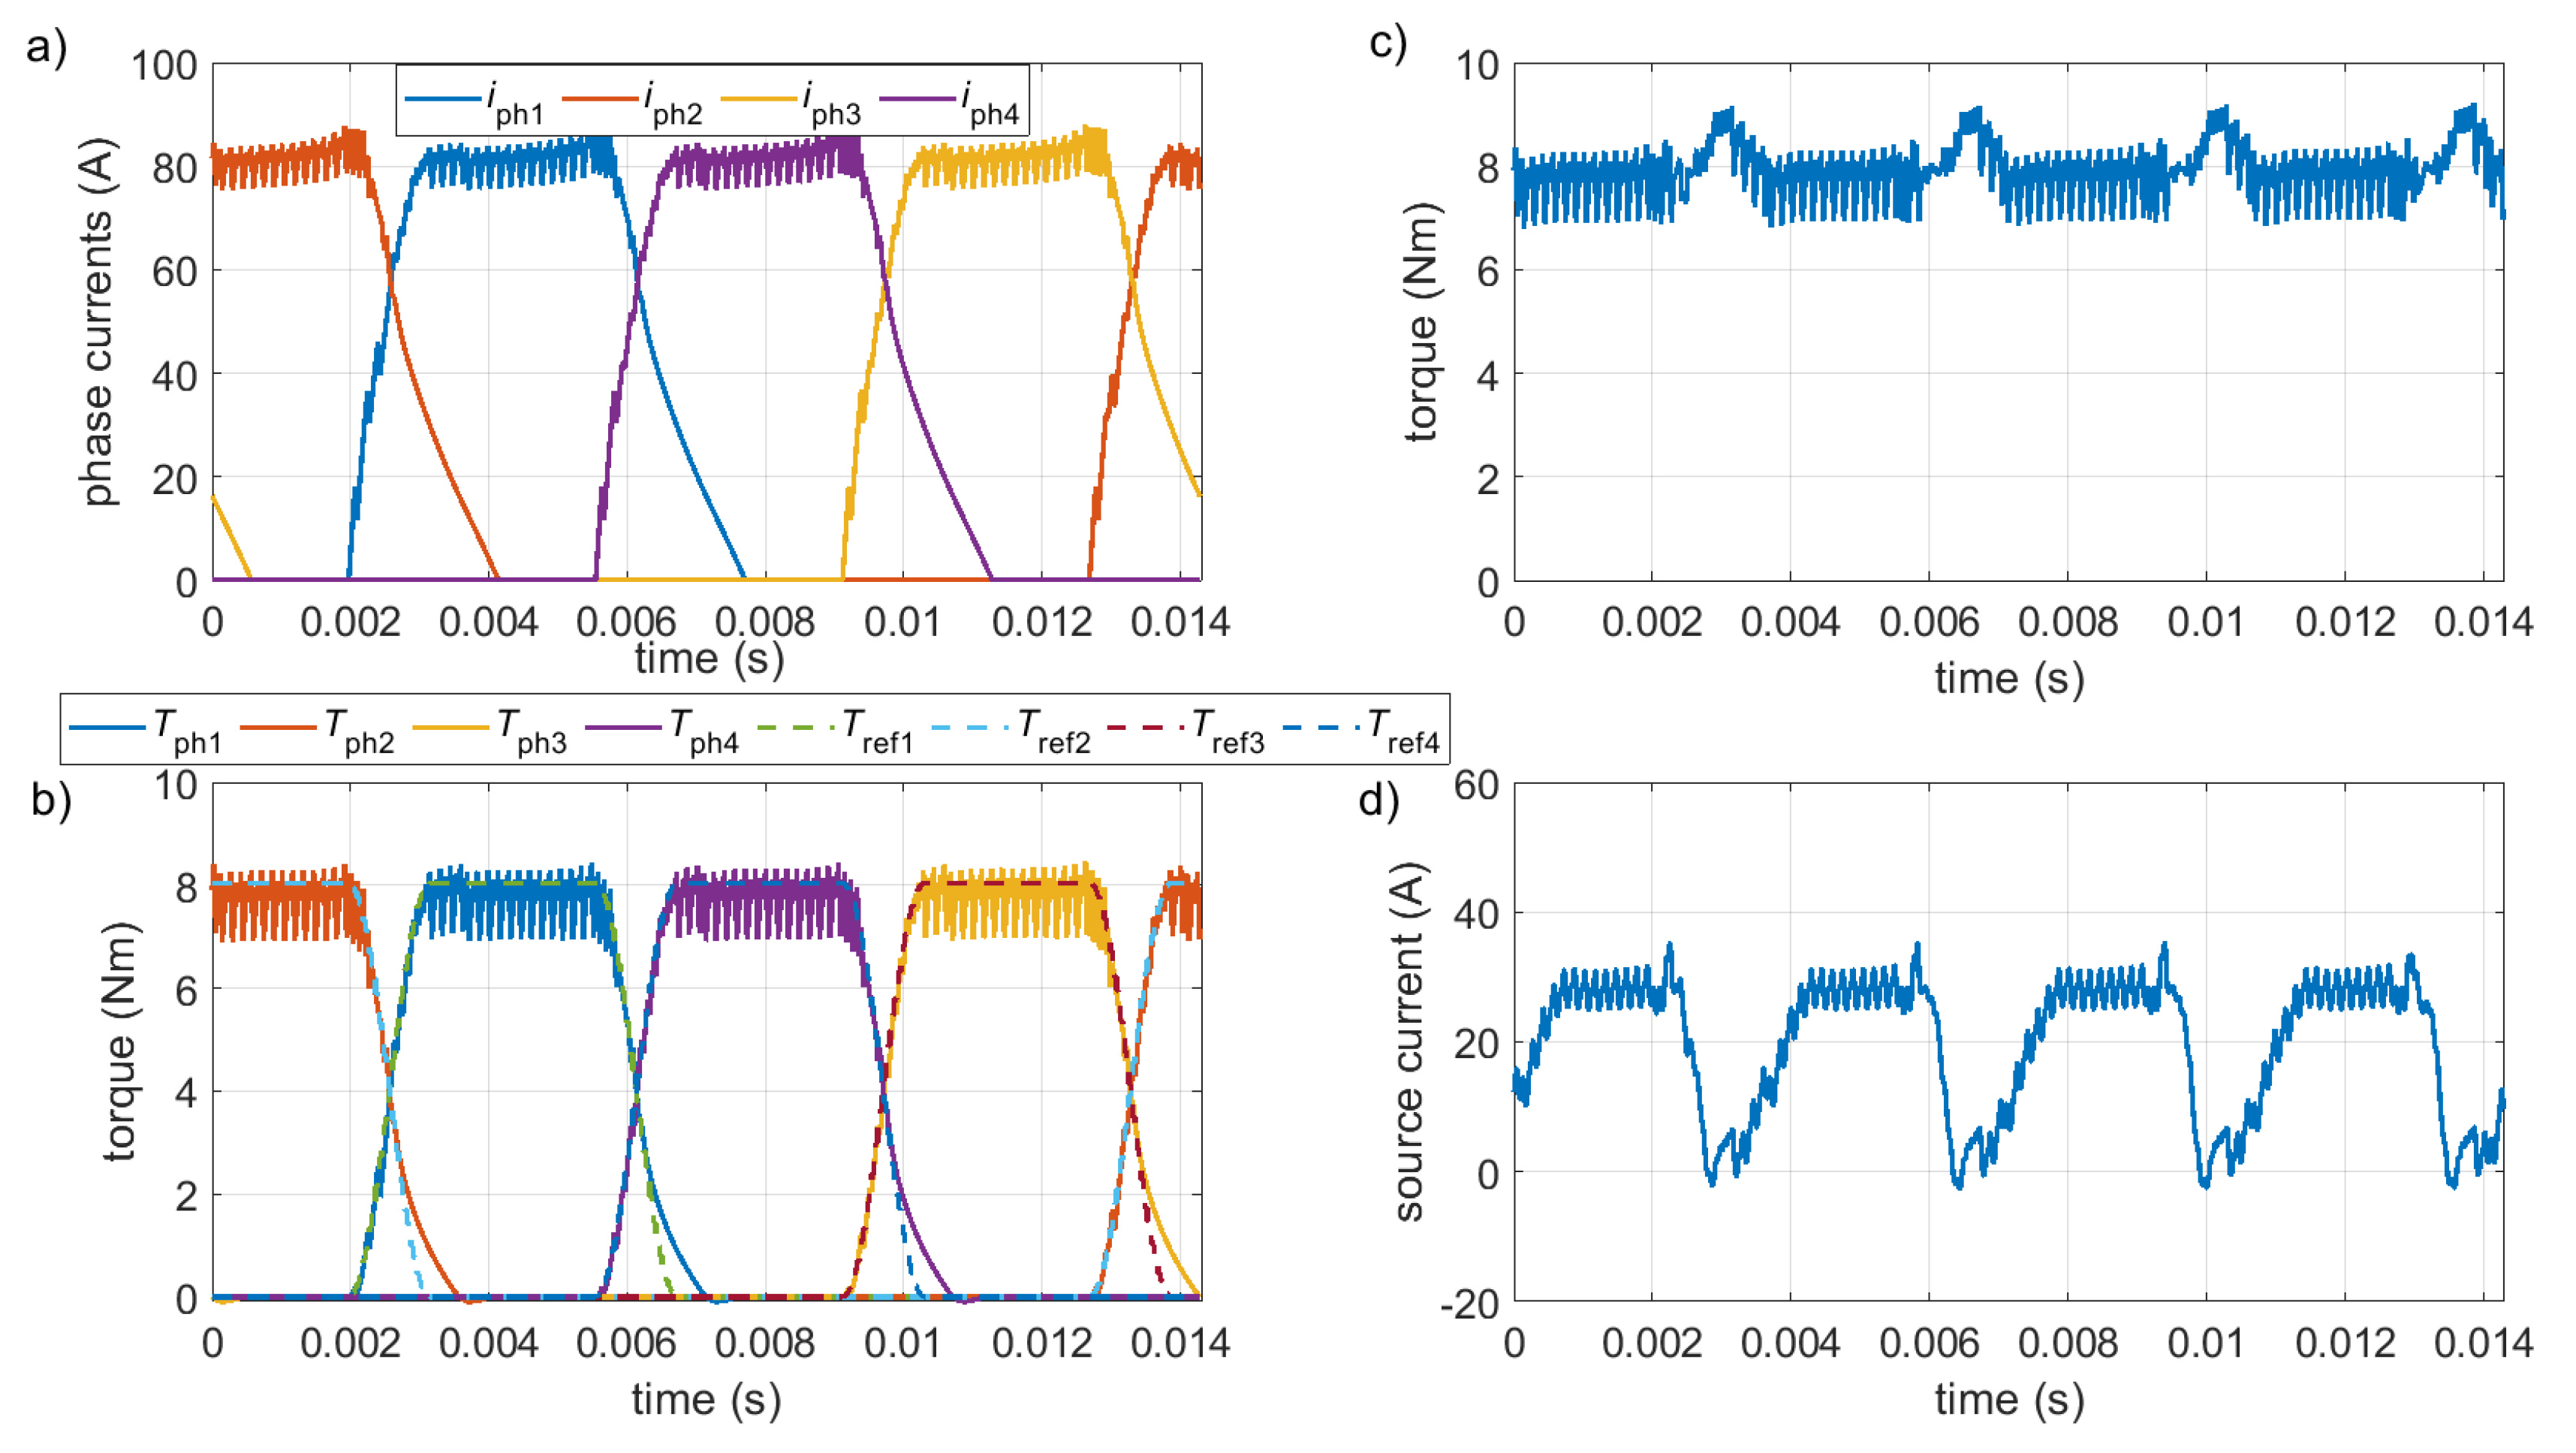
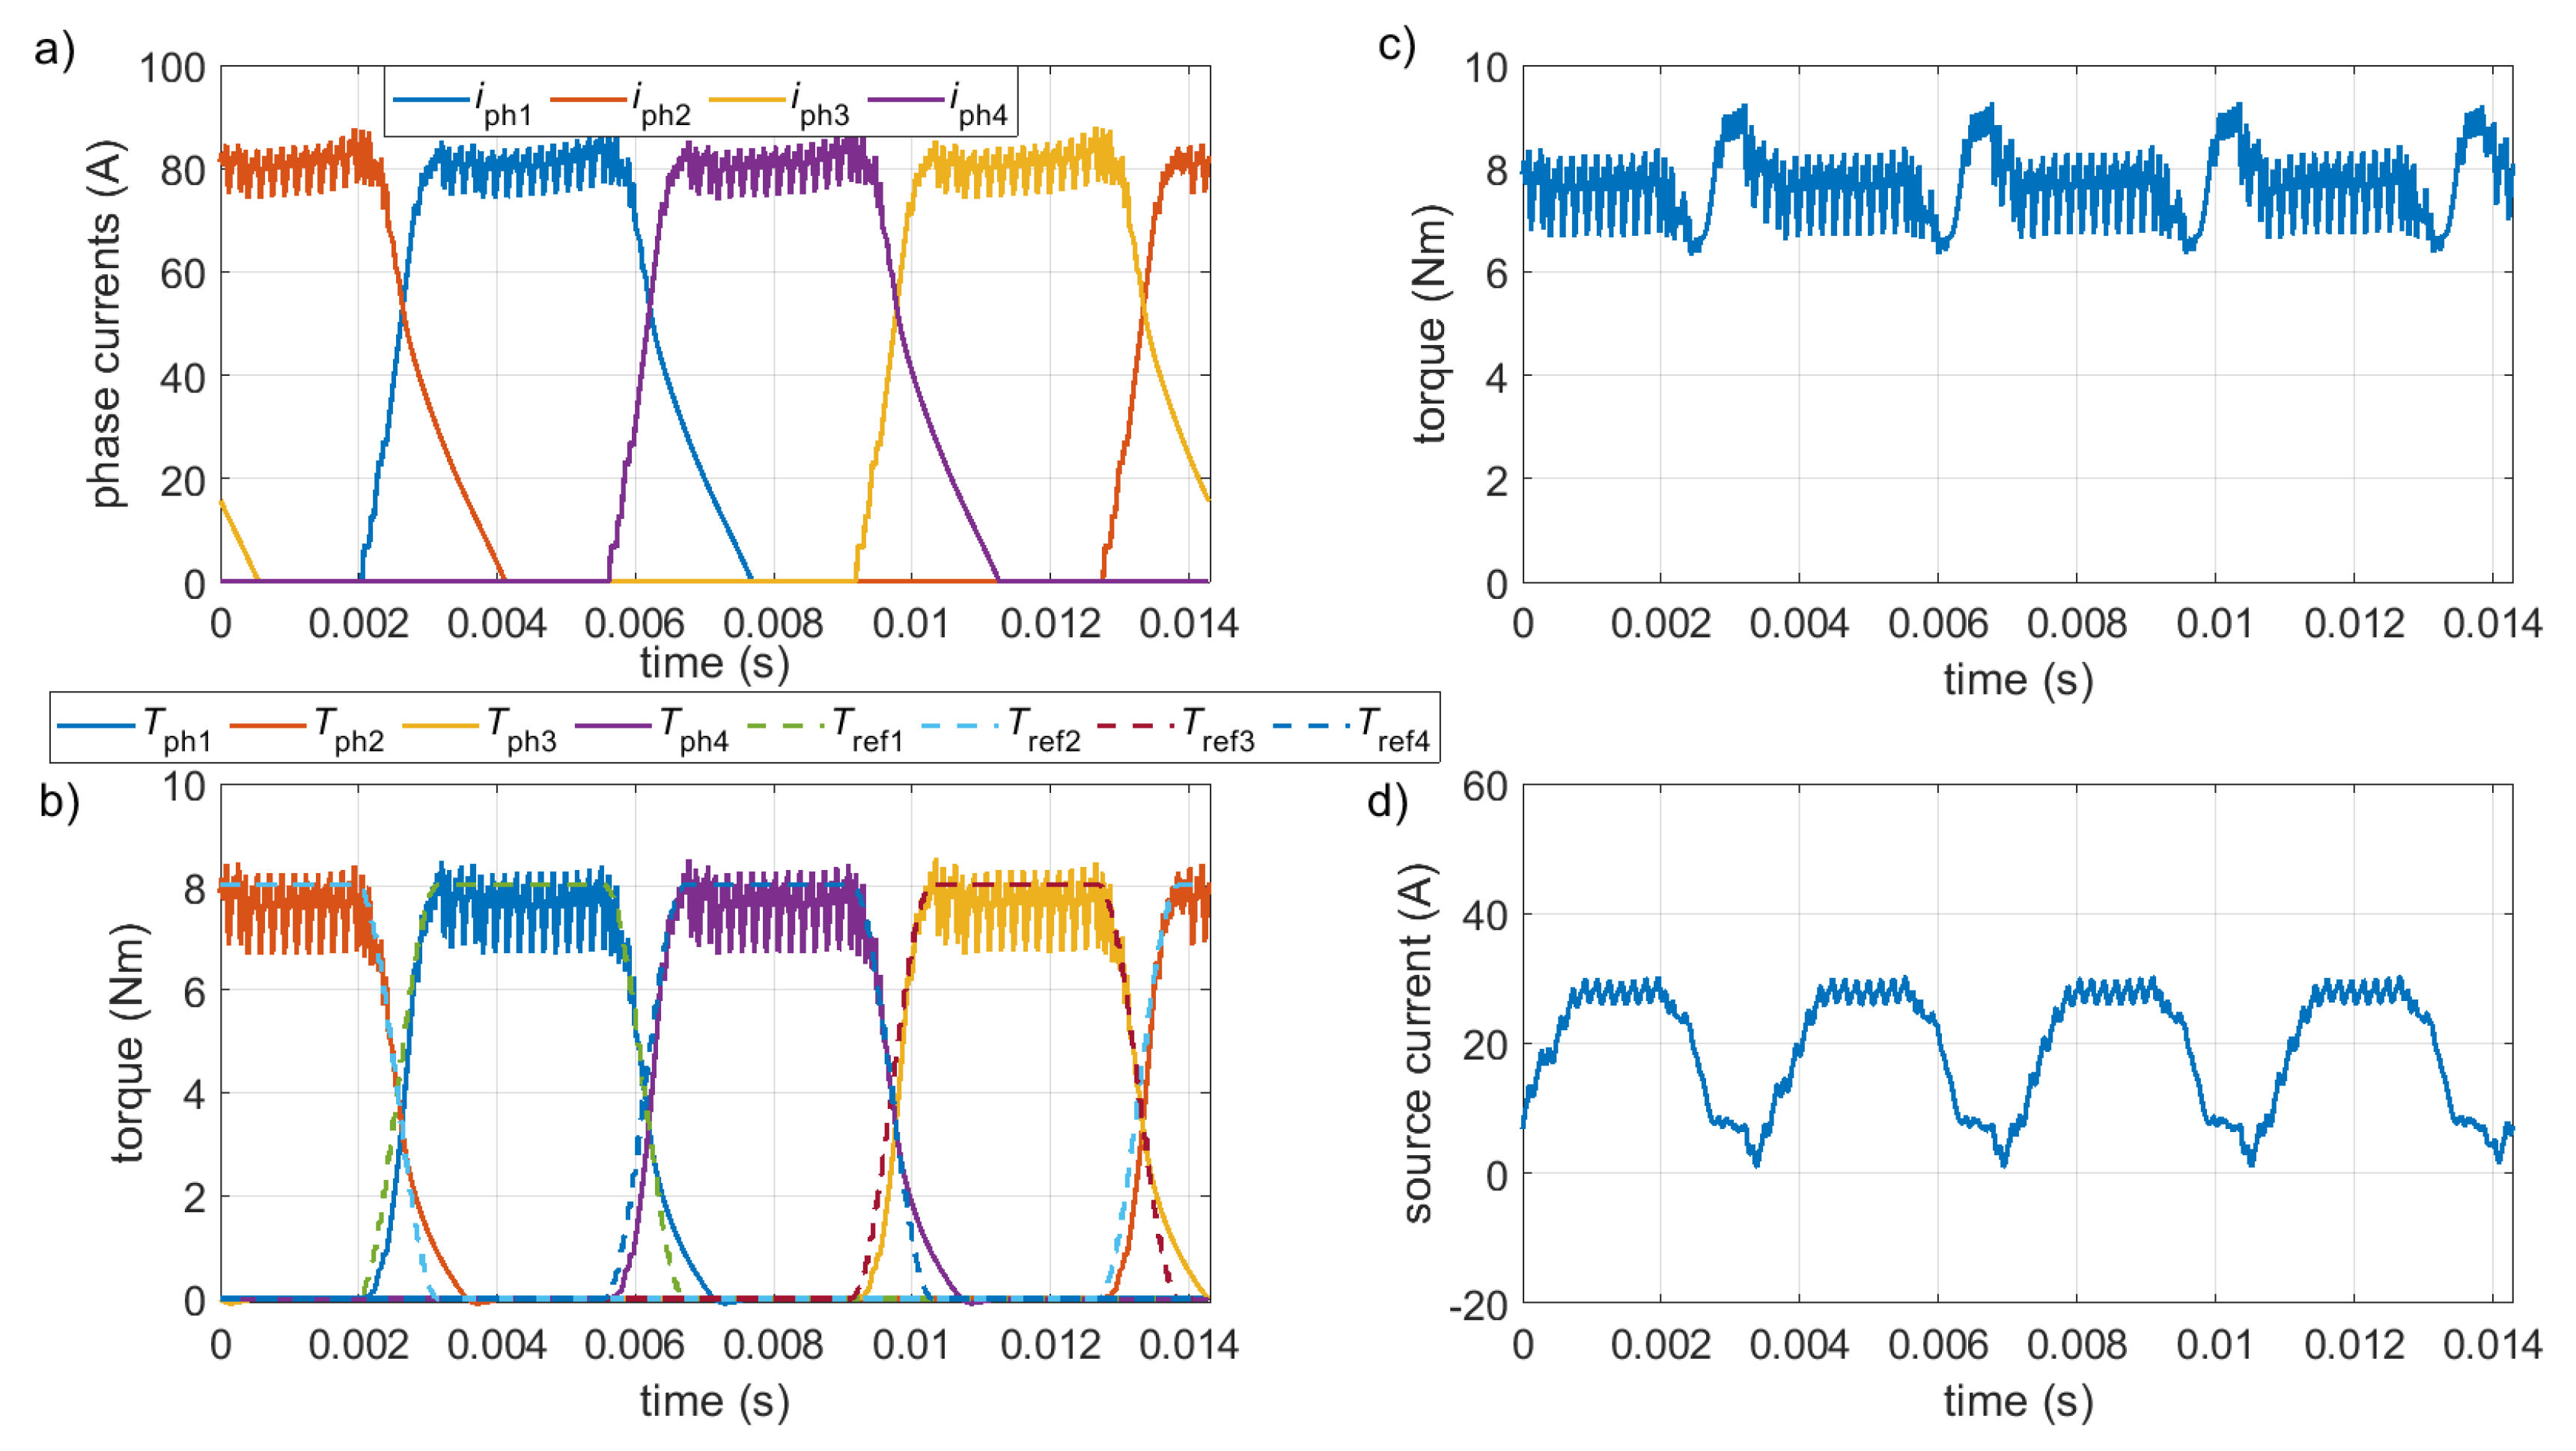
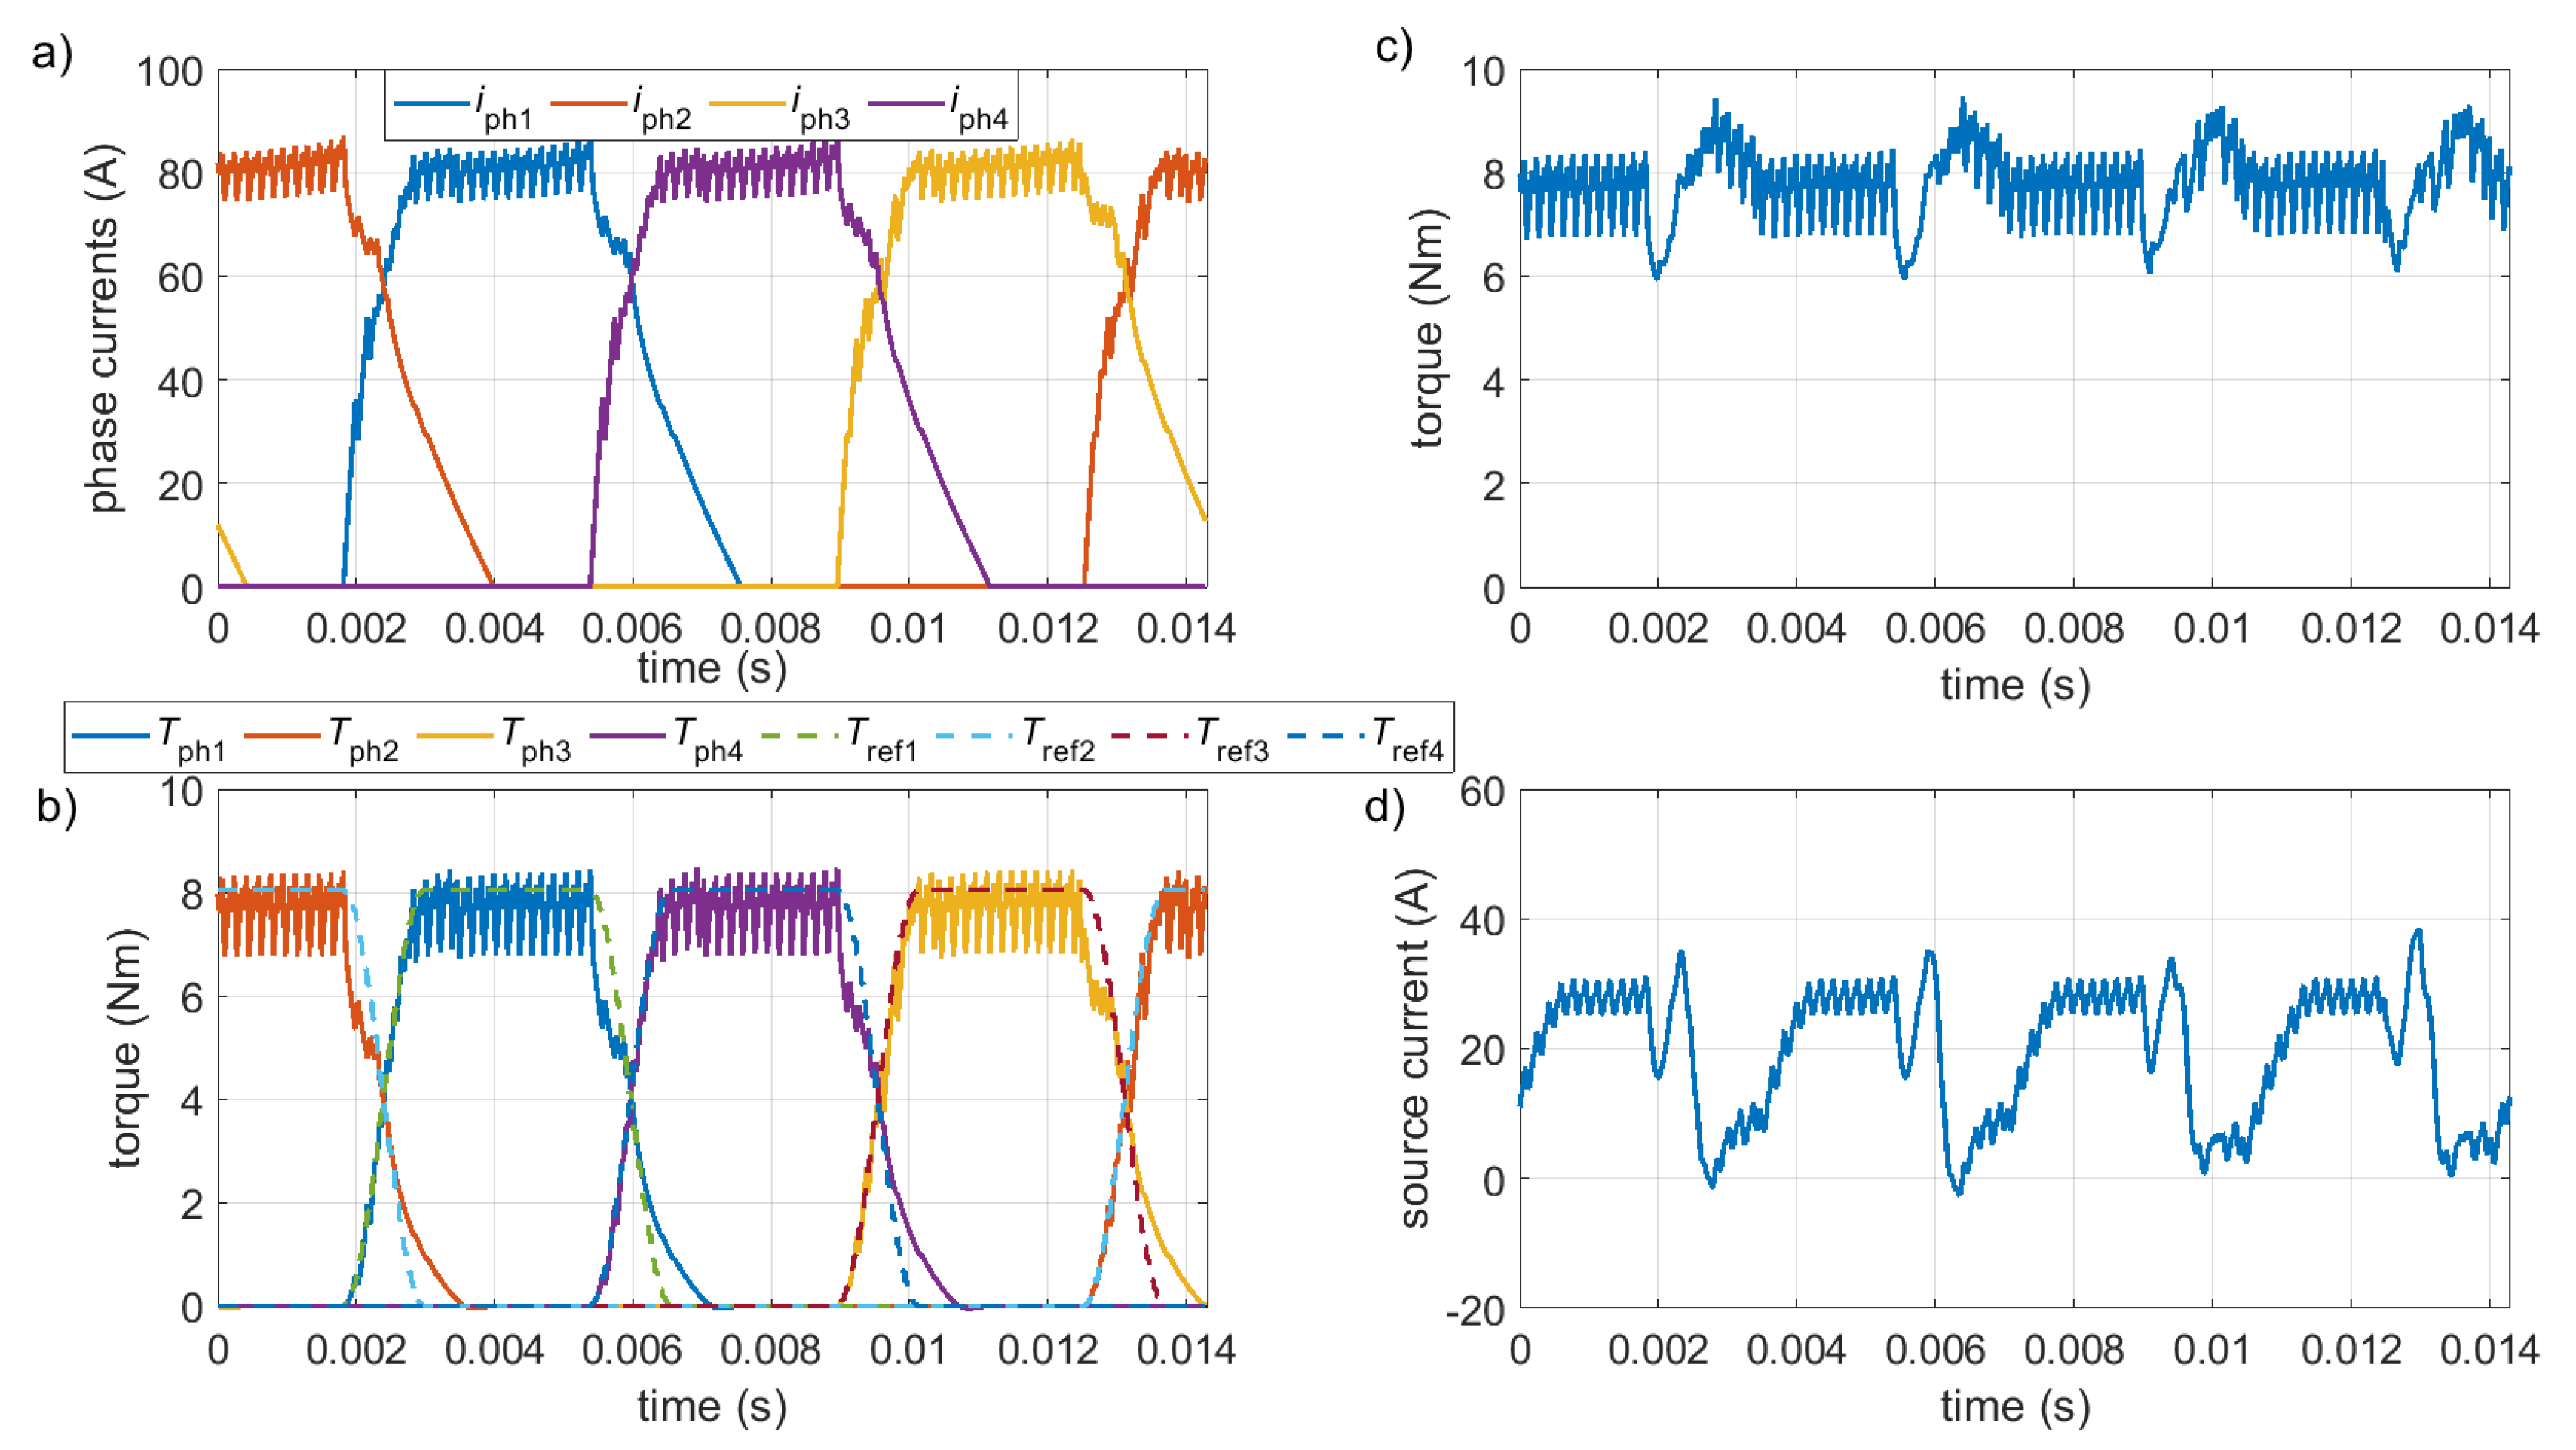
To perform simulation studies, an SRM model was built in Matlab/Simulink [25]. The flux–current–angle and torque–current–angle characteristics were determined when designing the machine using the Ansys Maxwell package. These characteristics were then entered in the Lookup Table blocks of the Matlab/Simulink suite. MOSFET transistors, available in the Simscape library, were used to control the machine. Figure 4, Figure 5 and Figure 6 show the waveforms of phase currents (iph1-iph4) and torques (Tph1-Tph4), reference phase torques (Tref1-Tref4), total electromagnetic torques (Te), and source currents (idc) for the CTMC (Figure 4), DTMC(RC) (Figure 5), and DTMC(FC) (Figure 6) control methods. These waveforms were determined at 700 rpm with a reference torque of 8 Nm. The sampling time of the controllers was 35 μs.
Motor control according to the functions described by Formulas (1)–(3) caused a slight change in the shape of the phase currents and torques. Figure 4, Figure 5 and Figure 6, determined at n = 700 rpm, show that in the case of the control using the CTMC and DTMC(FC) methods, the rising slope of the reference torque (Tref(k)) is very well represented. The representation of the rising slope of the reference torque in the DTMC(RC) control method slightly deviates from the assumed shape, as the controller operates in dependent mode in the rising slope interval.
Additionally, the BEMF voltage in the descending torque range is too high for the accurate representation of the set torque profile (Figure 6). Based on the simulation results, the question arises as to whether these ‘slight’ changes in the shape of the phase currents and torques affect the performance characteristics of the drive. To check this, the latter part of this paper presents a simulation (Figure 7, Table 2) and experimental tests.
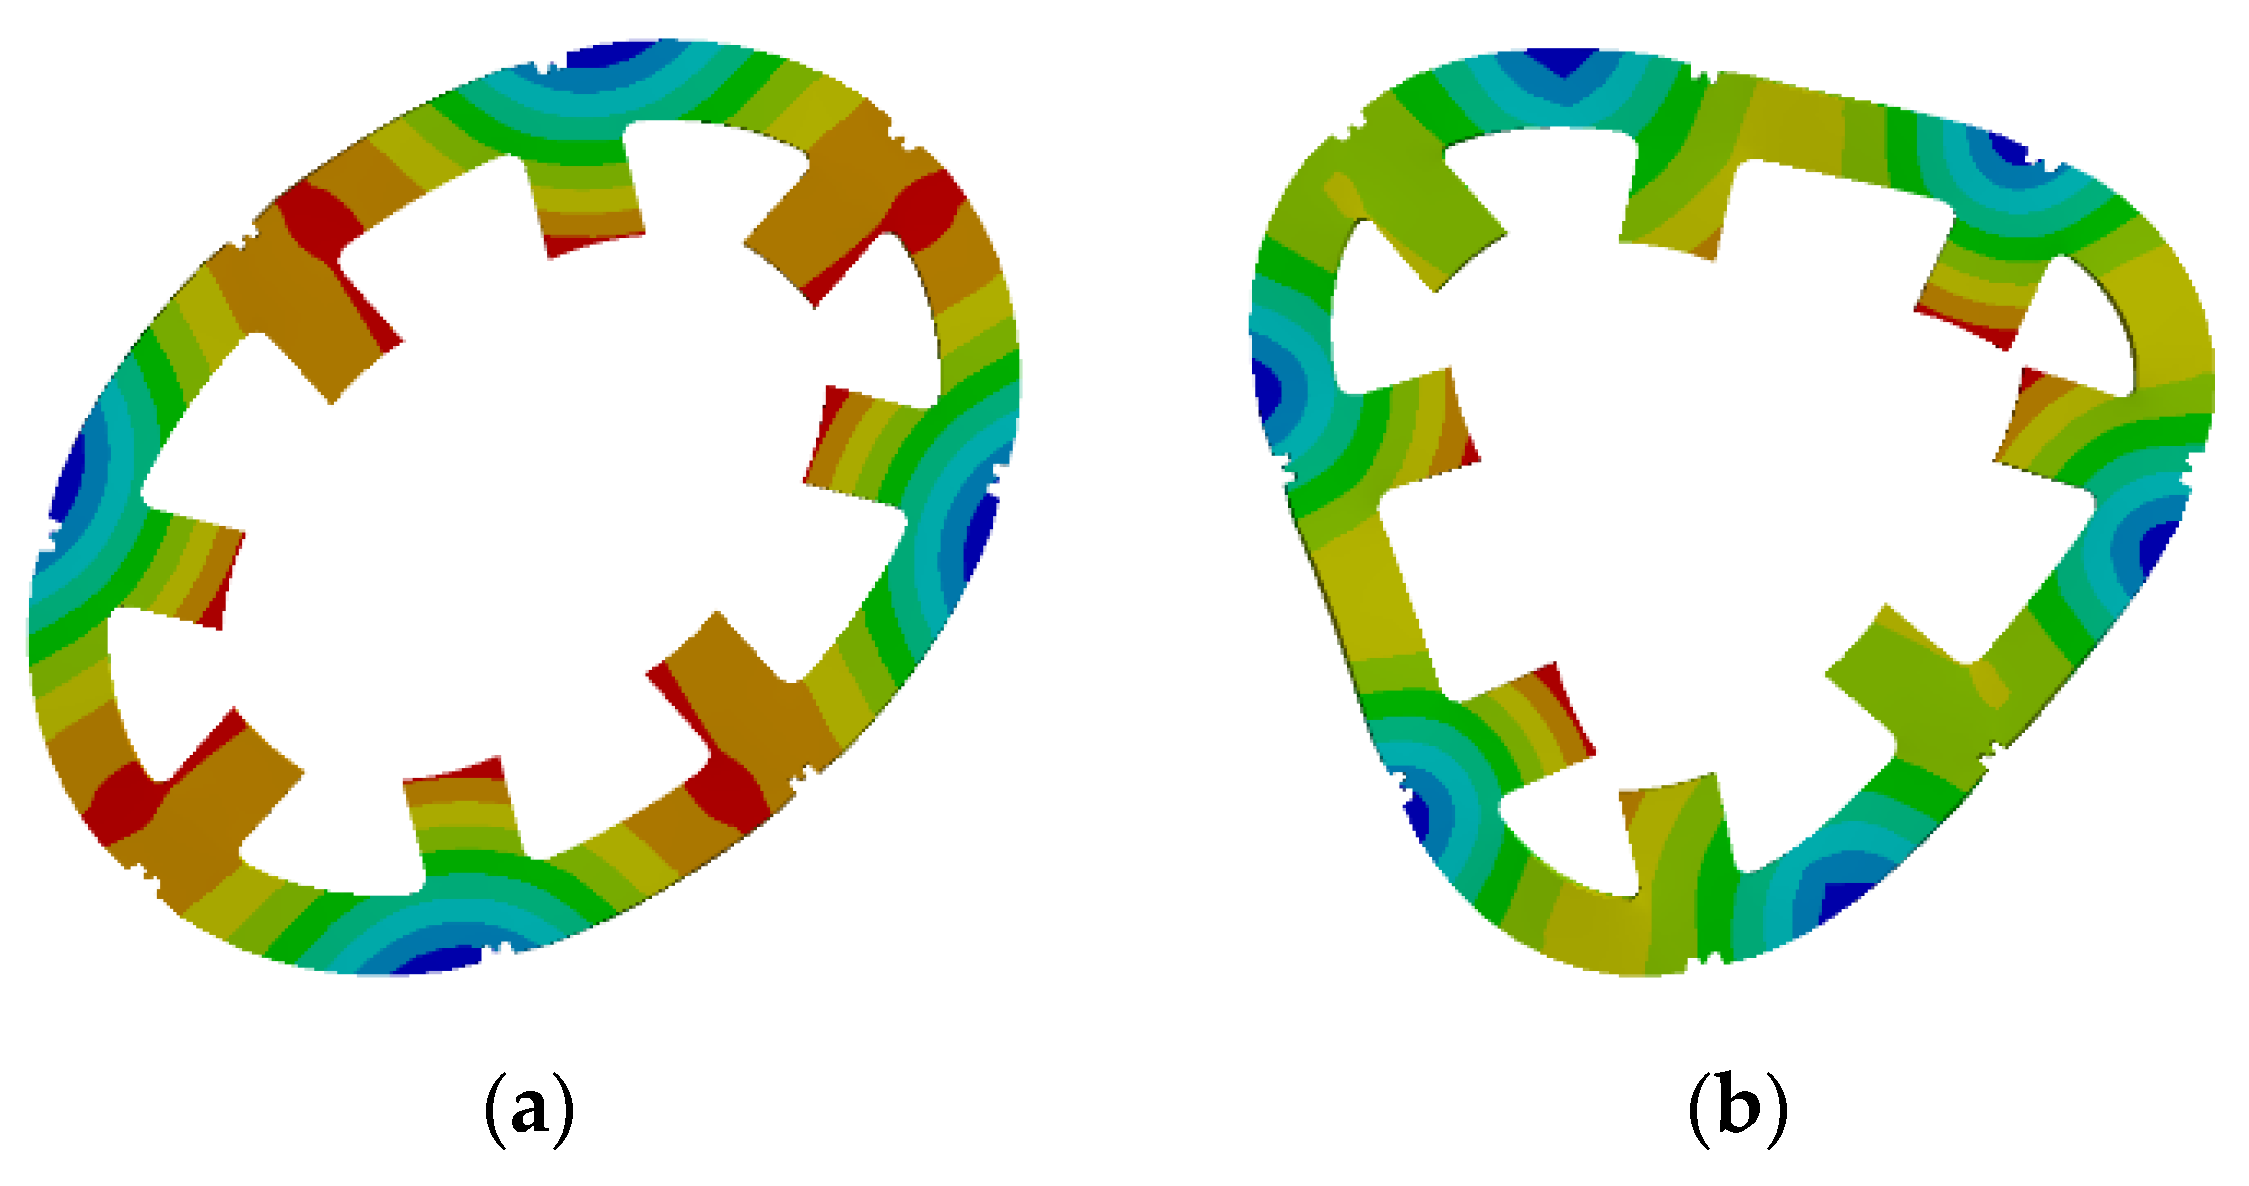
4.2. Determination of the Natural Frequency of the Stator
Due to the tendency of SRMs to generate vibrations, the natural frequencies of the stator of the tested SRM were determined by simulation using the Ansys Maxwell suite. Figure 7 shows examples of stator deformation images at the frequencies 1265 Hz and 3361 Hz. A summary of the resonant frequencies calculated on the basis of modal analysis is shown in Table 2.
Determining these frequencies will make it possible to establish whether the implemented control algorithms will significantly affect the noise generated during the operation of the drive.
5. Results of Experimental Tests
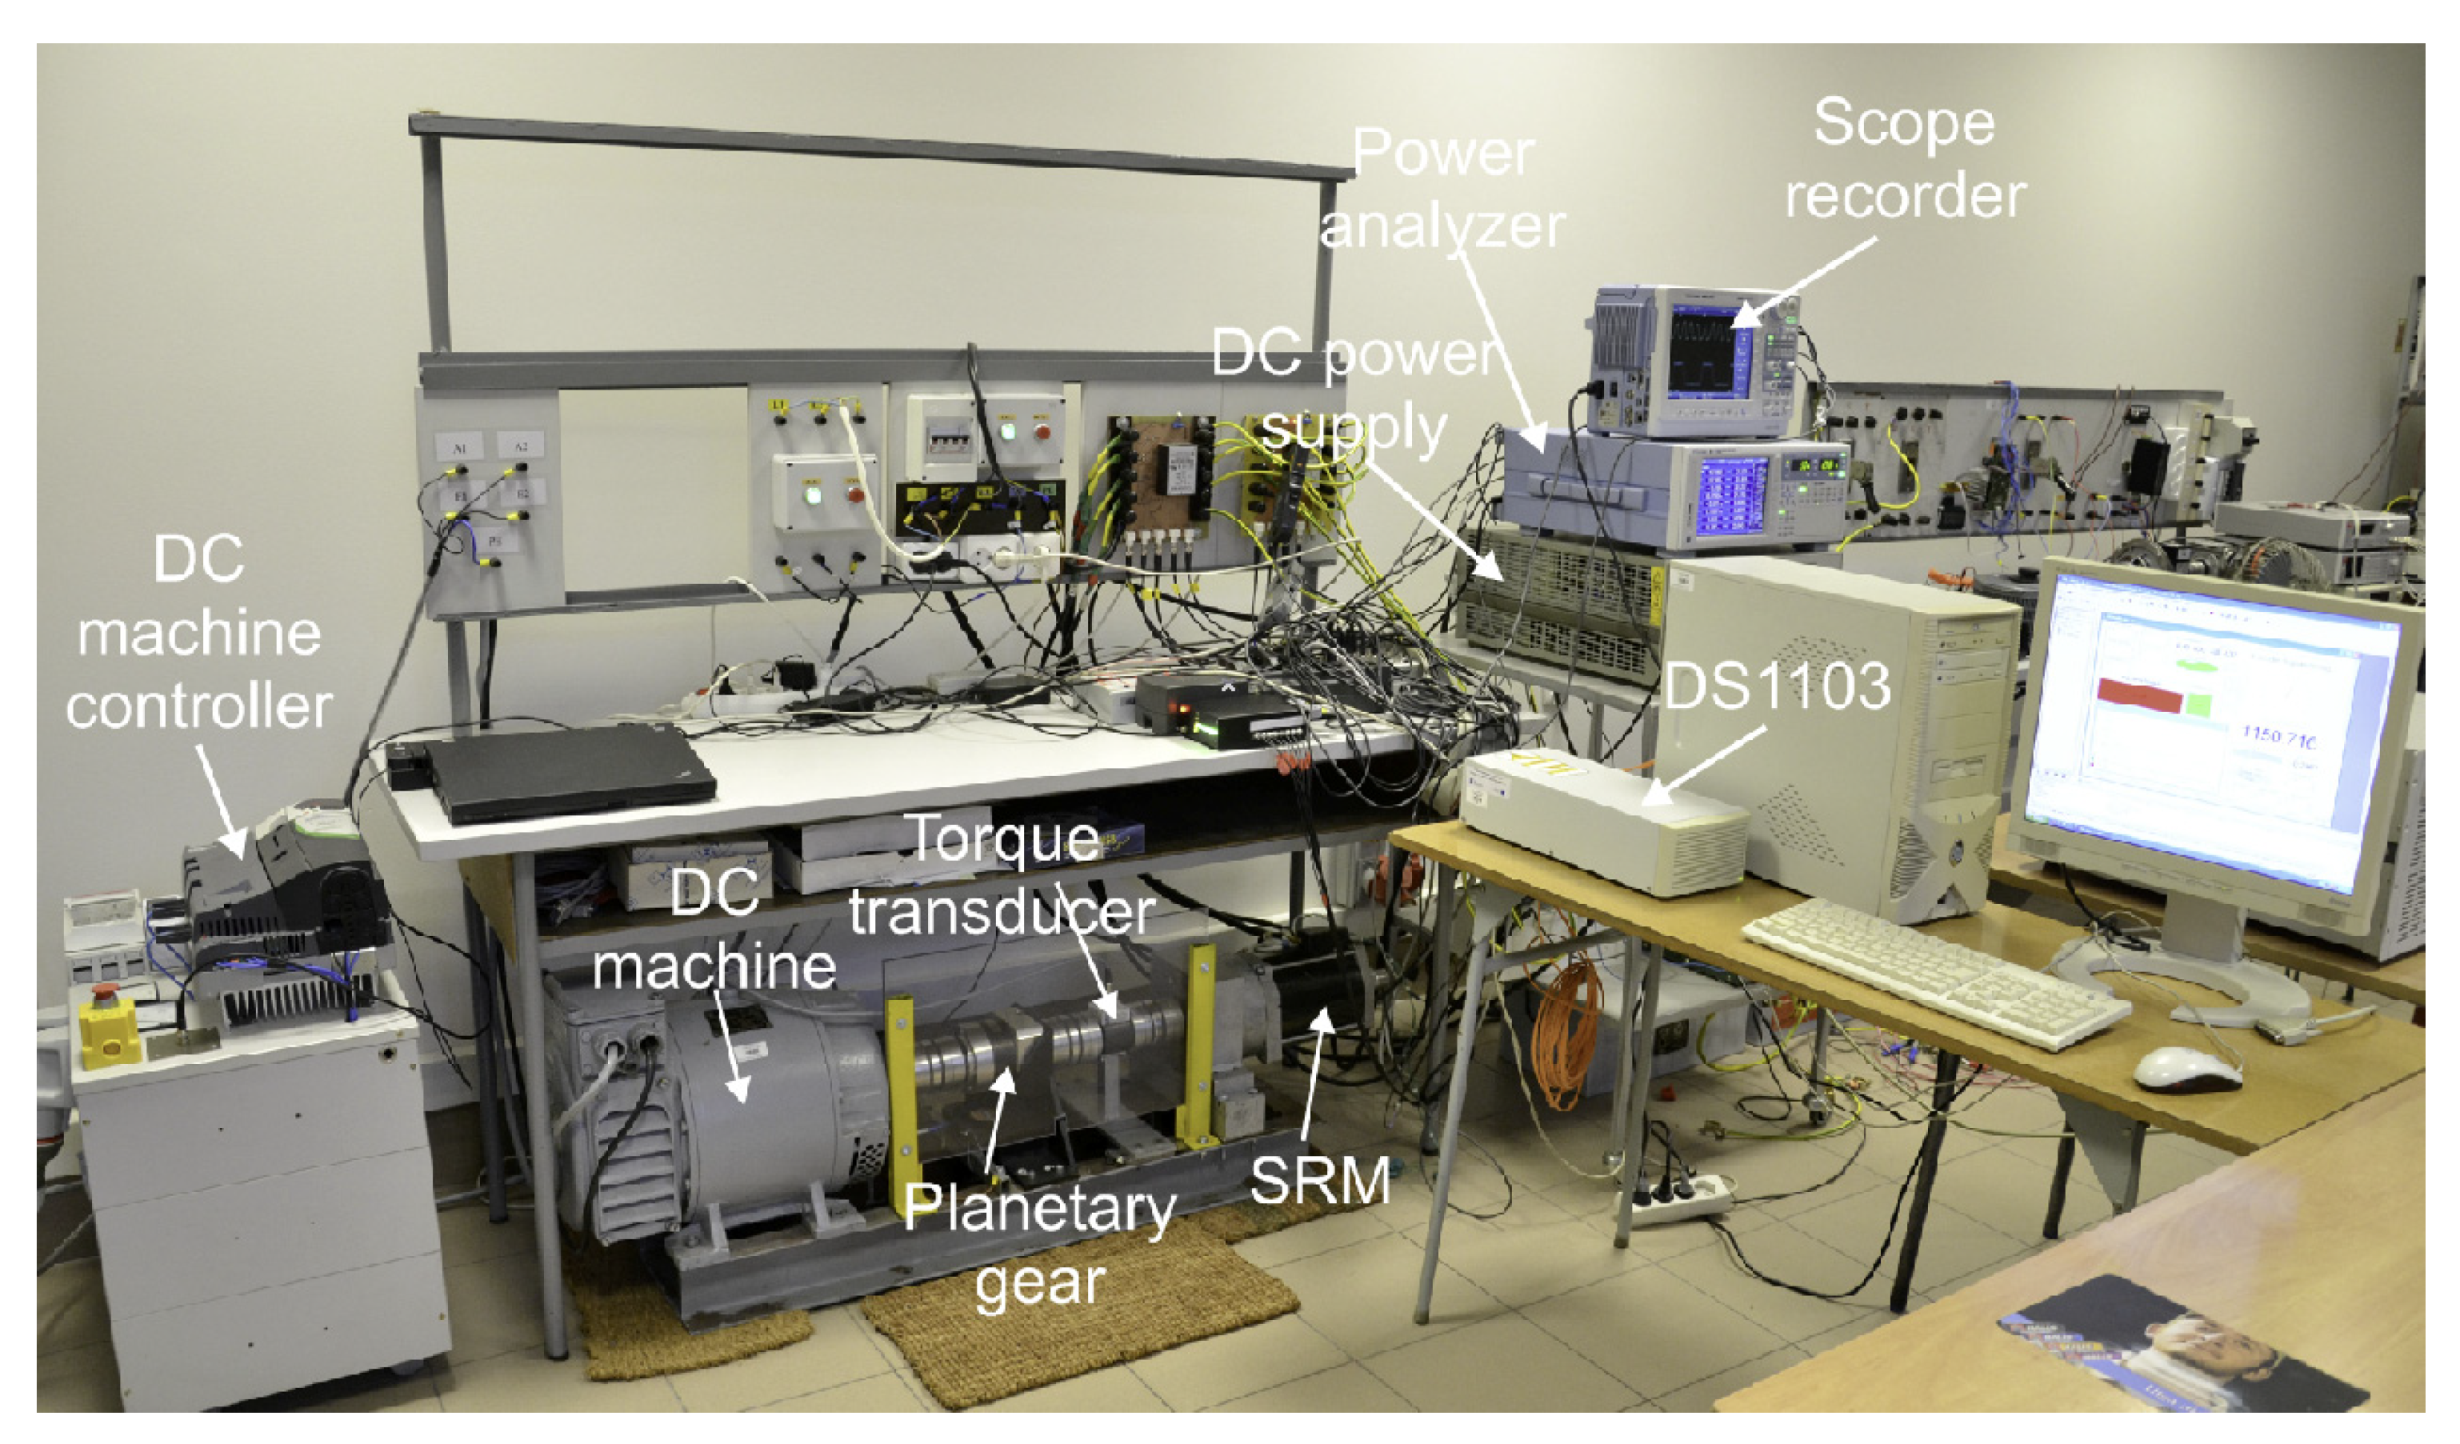
5.1. Laboratory Test Stand
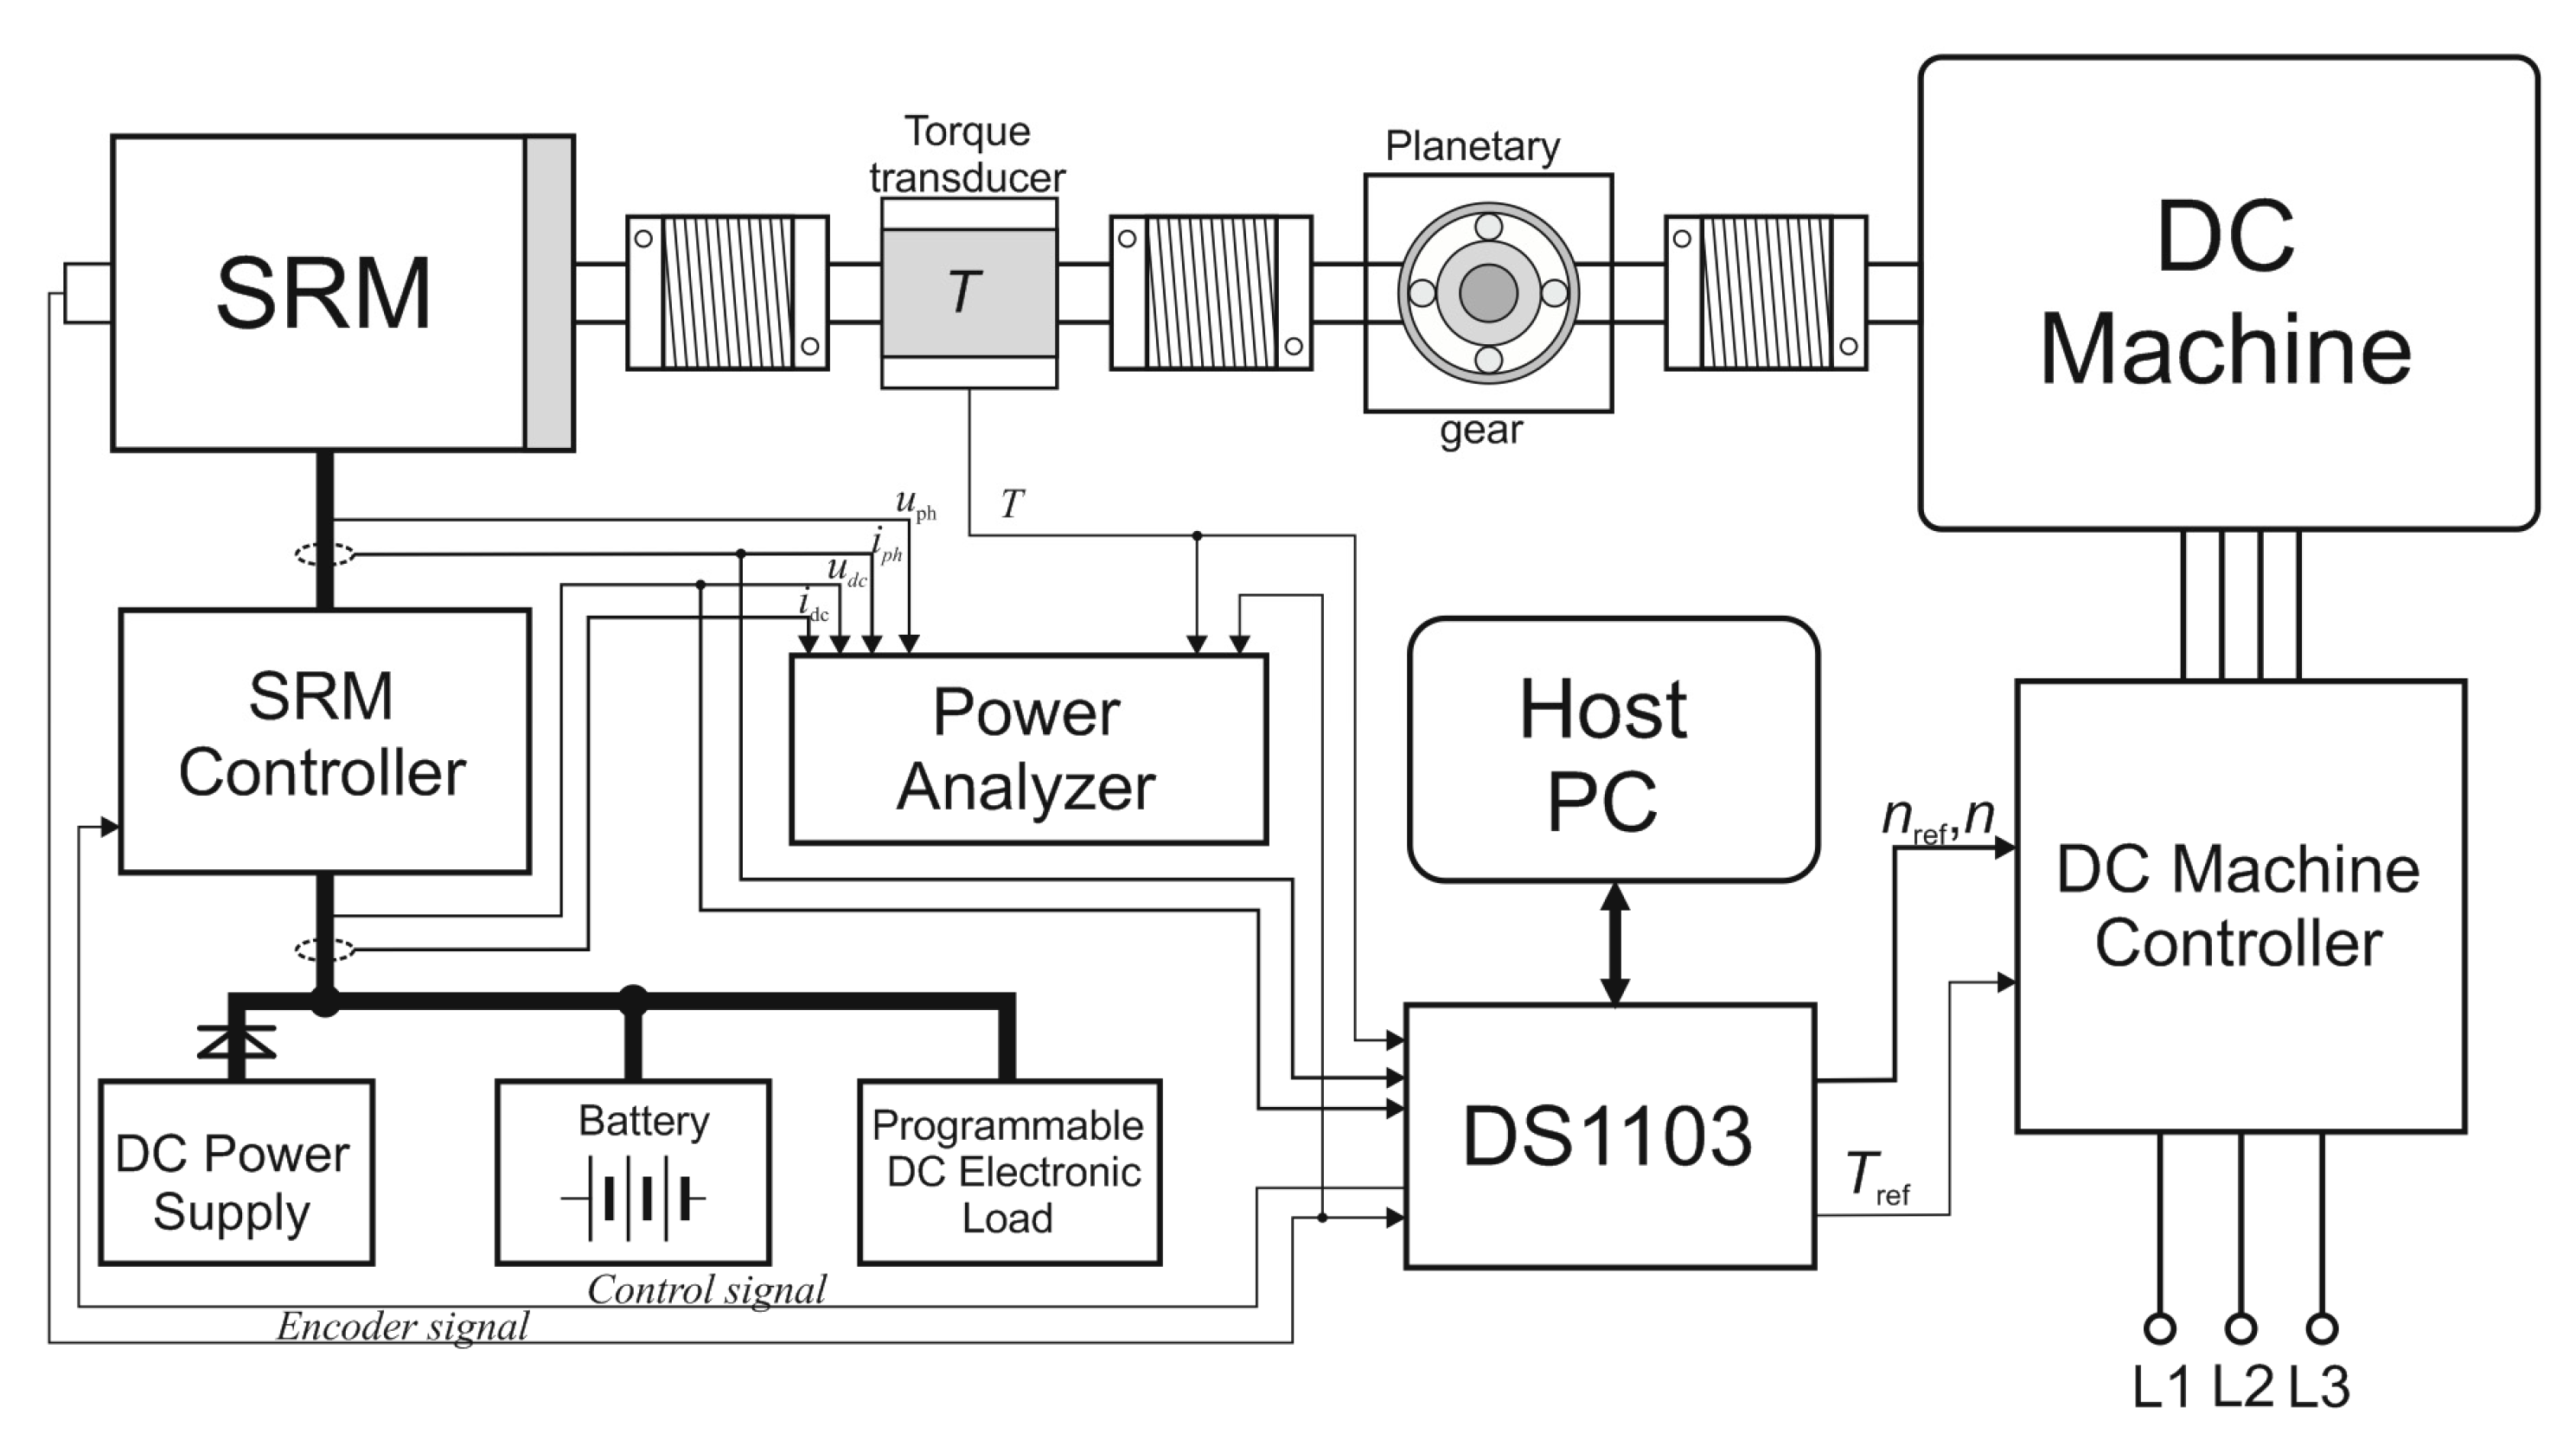
Laboratory experiments were carried out on a test stand that enabled testing in static and dynamic states of machine operation. A block diagram of this test stand is shown in Figure 8.
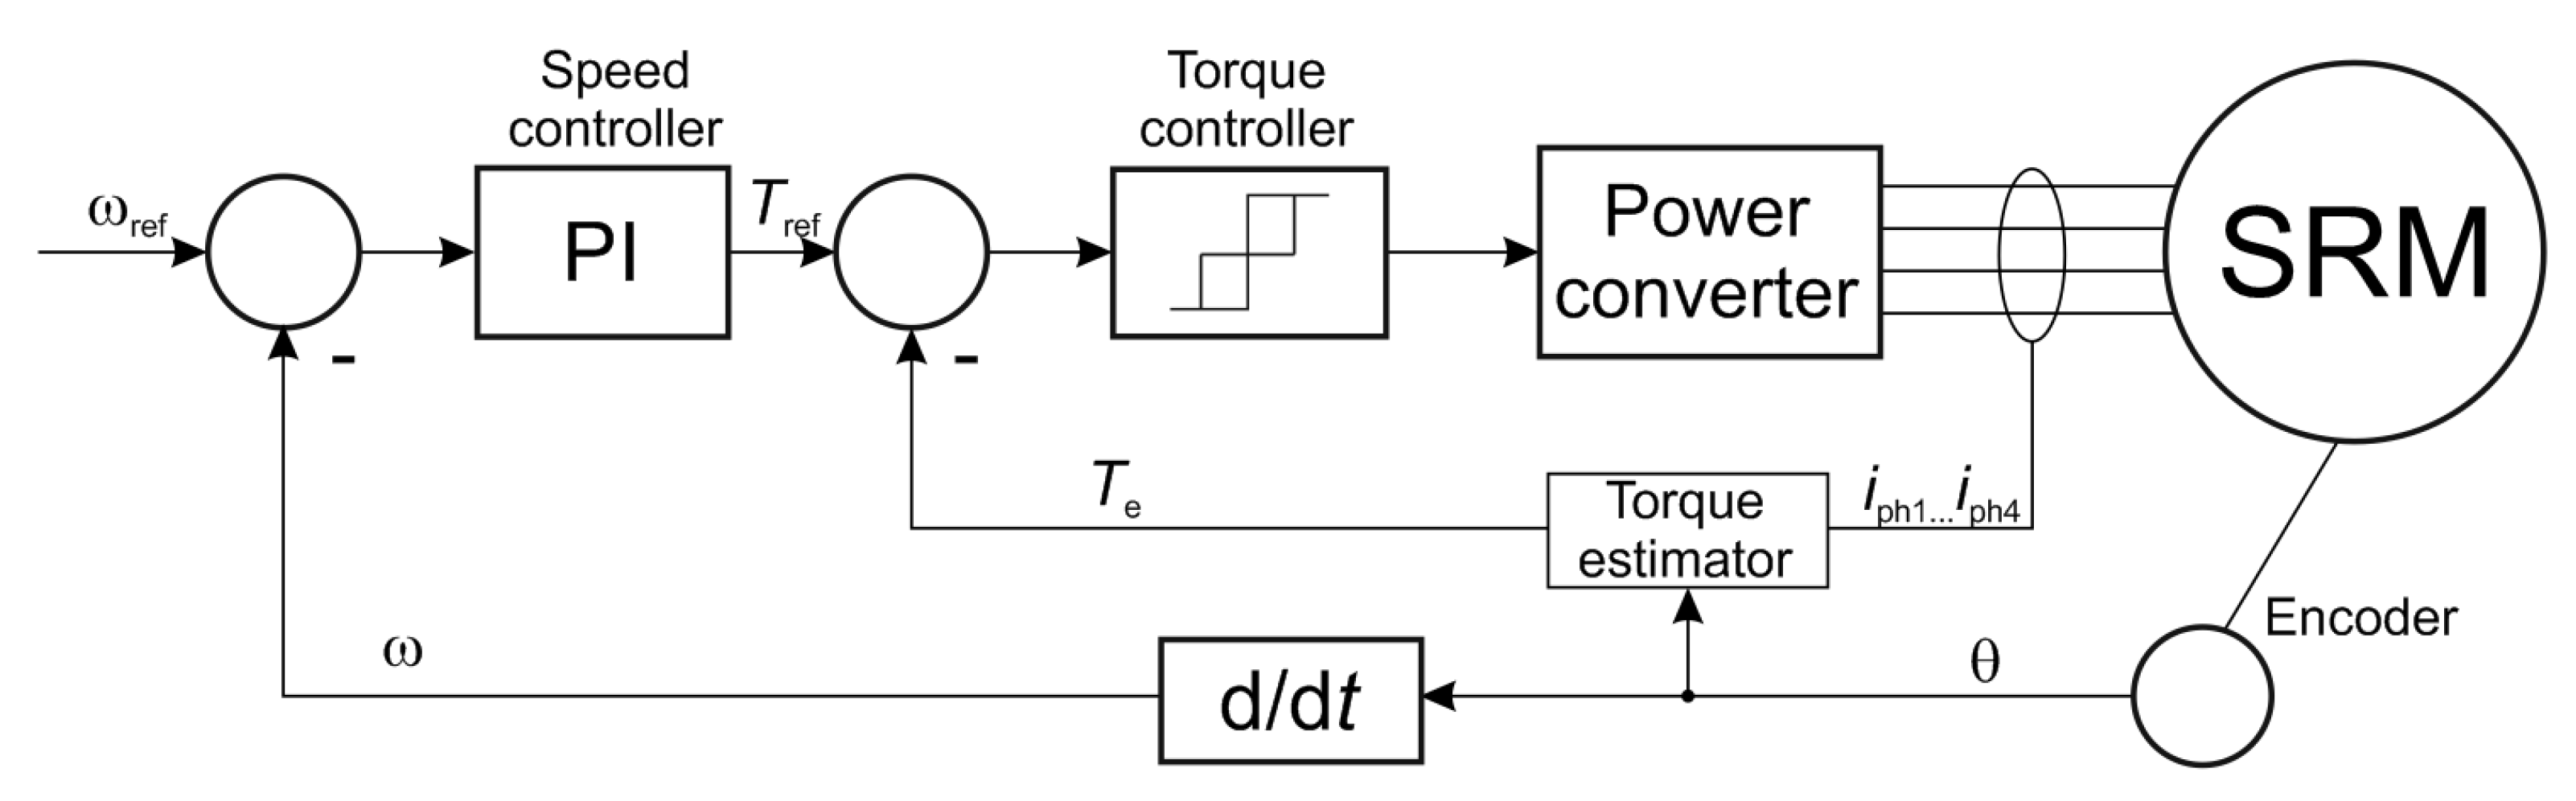
A DC commutator machine was used to load the SRM. To match the speed of the tested SRM with that of the DC machine, a planetary gear with a 1:3 ratio was used. A DS1103 card was used to control the SRM and manage the four-quadrant DC machine controller. A DL850 oscilloscope recorder was used to record the waveforms, and a Yokogawa WT1800 power analyzer was used to measure the static characteristics. A view of the test stand is shown in Figure 9. The drive was powered using the system shown in Figure 8, utilizing a power supply and a battery pack. This solution makes it possible to protect the power supply from reverse current. The reverse current in this circuit is taken up by the battery pack. During the laboratory tests, the drive operated in a closed speed control system—see the block diagram in Figure 10.
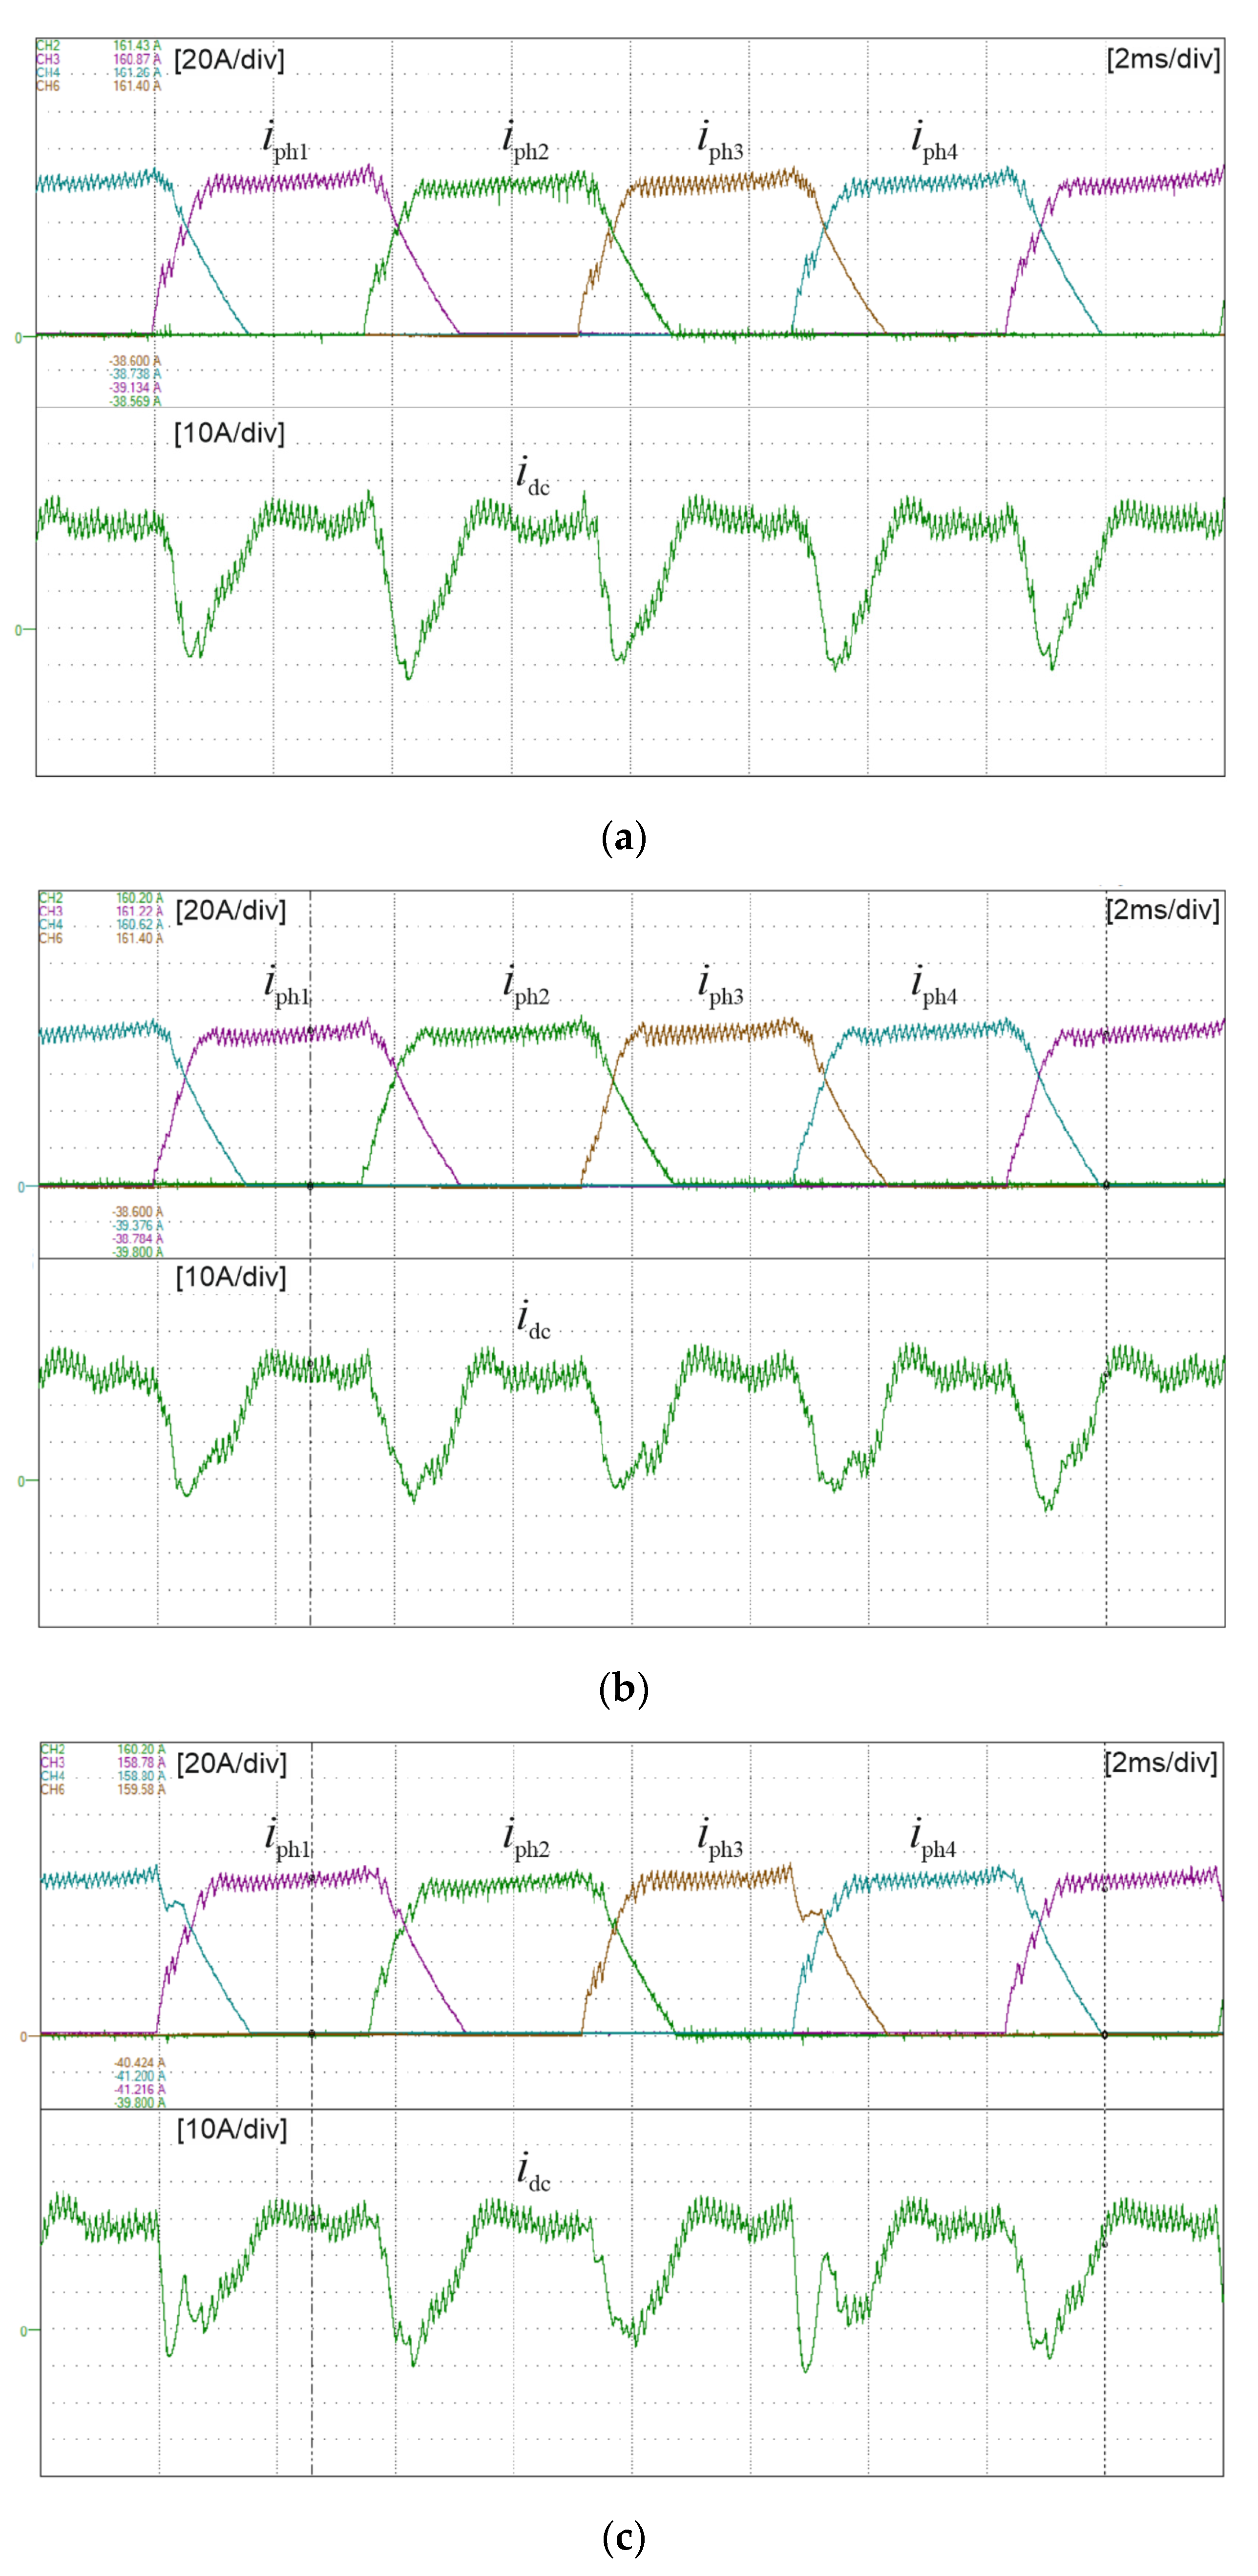
5.2. Oscillograms
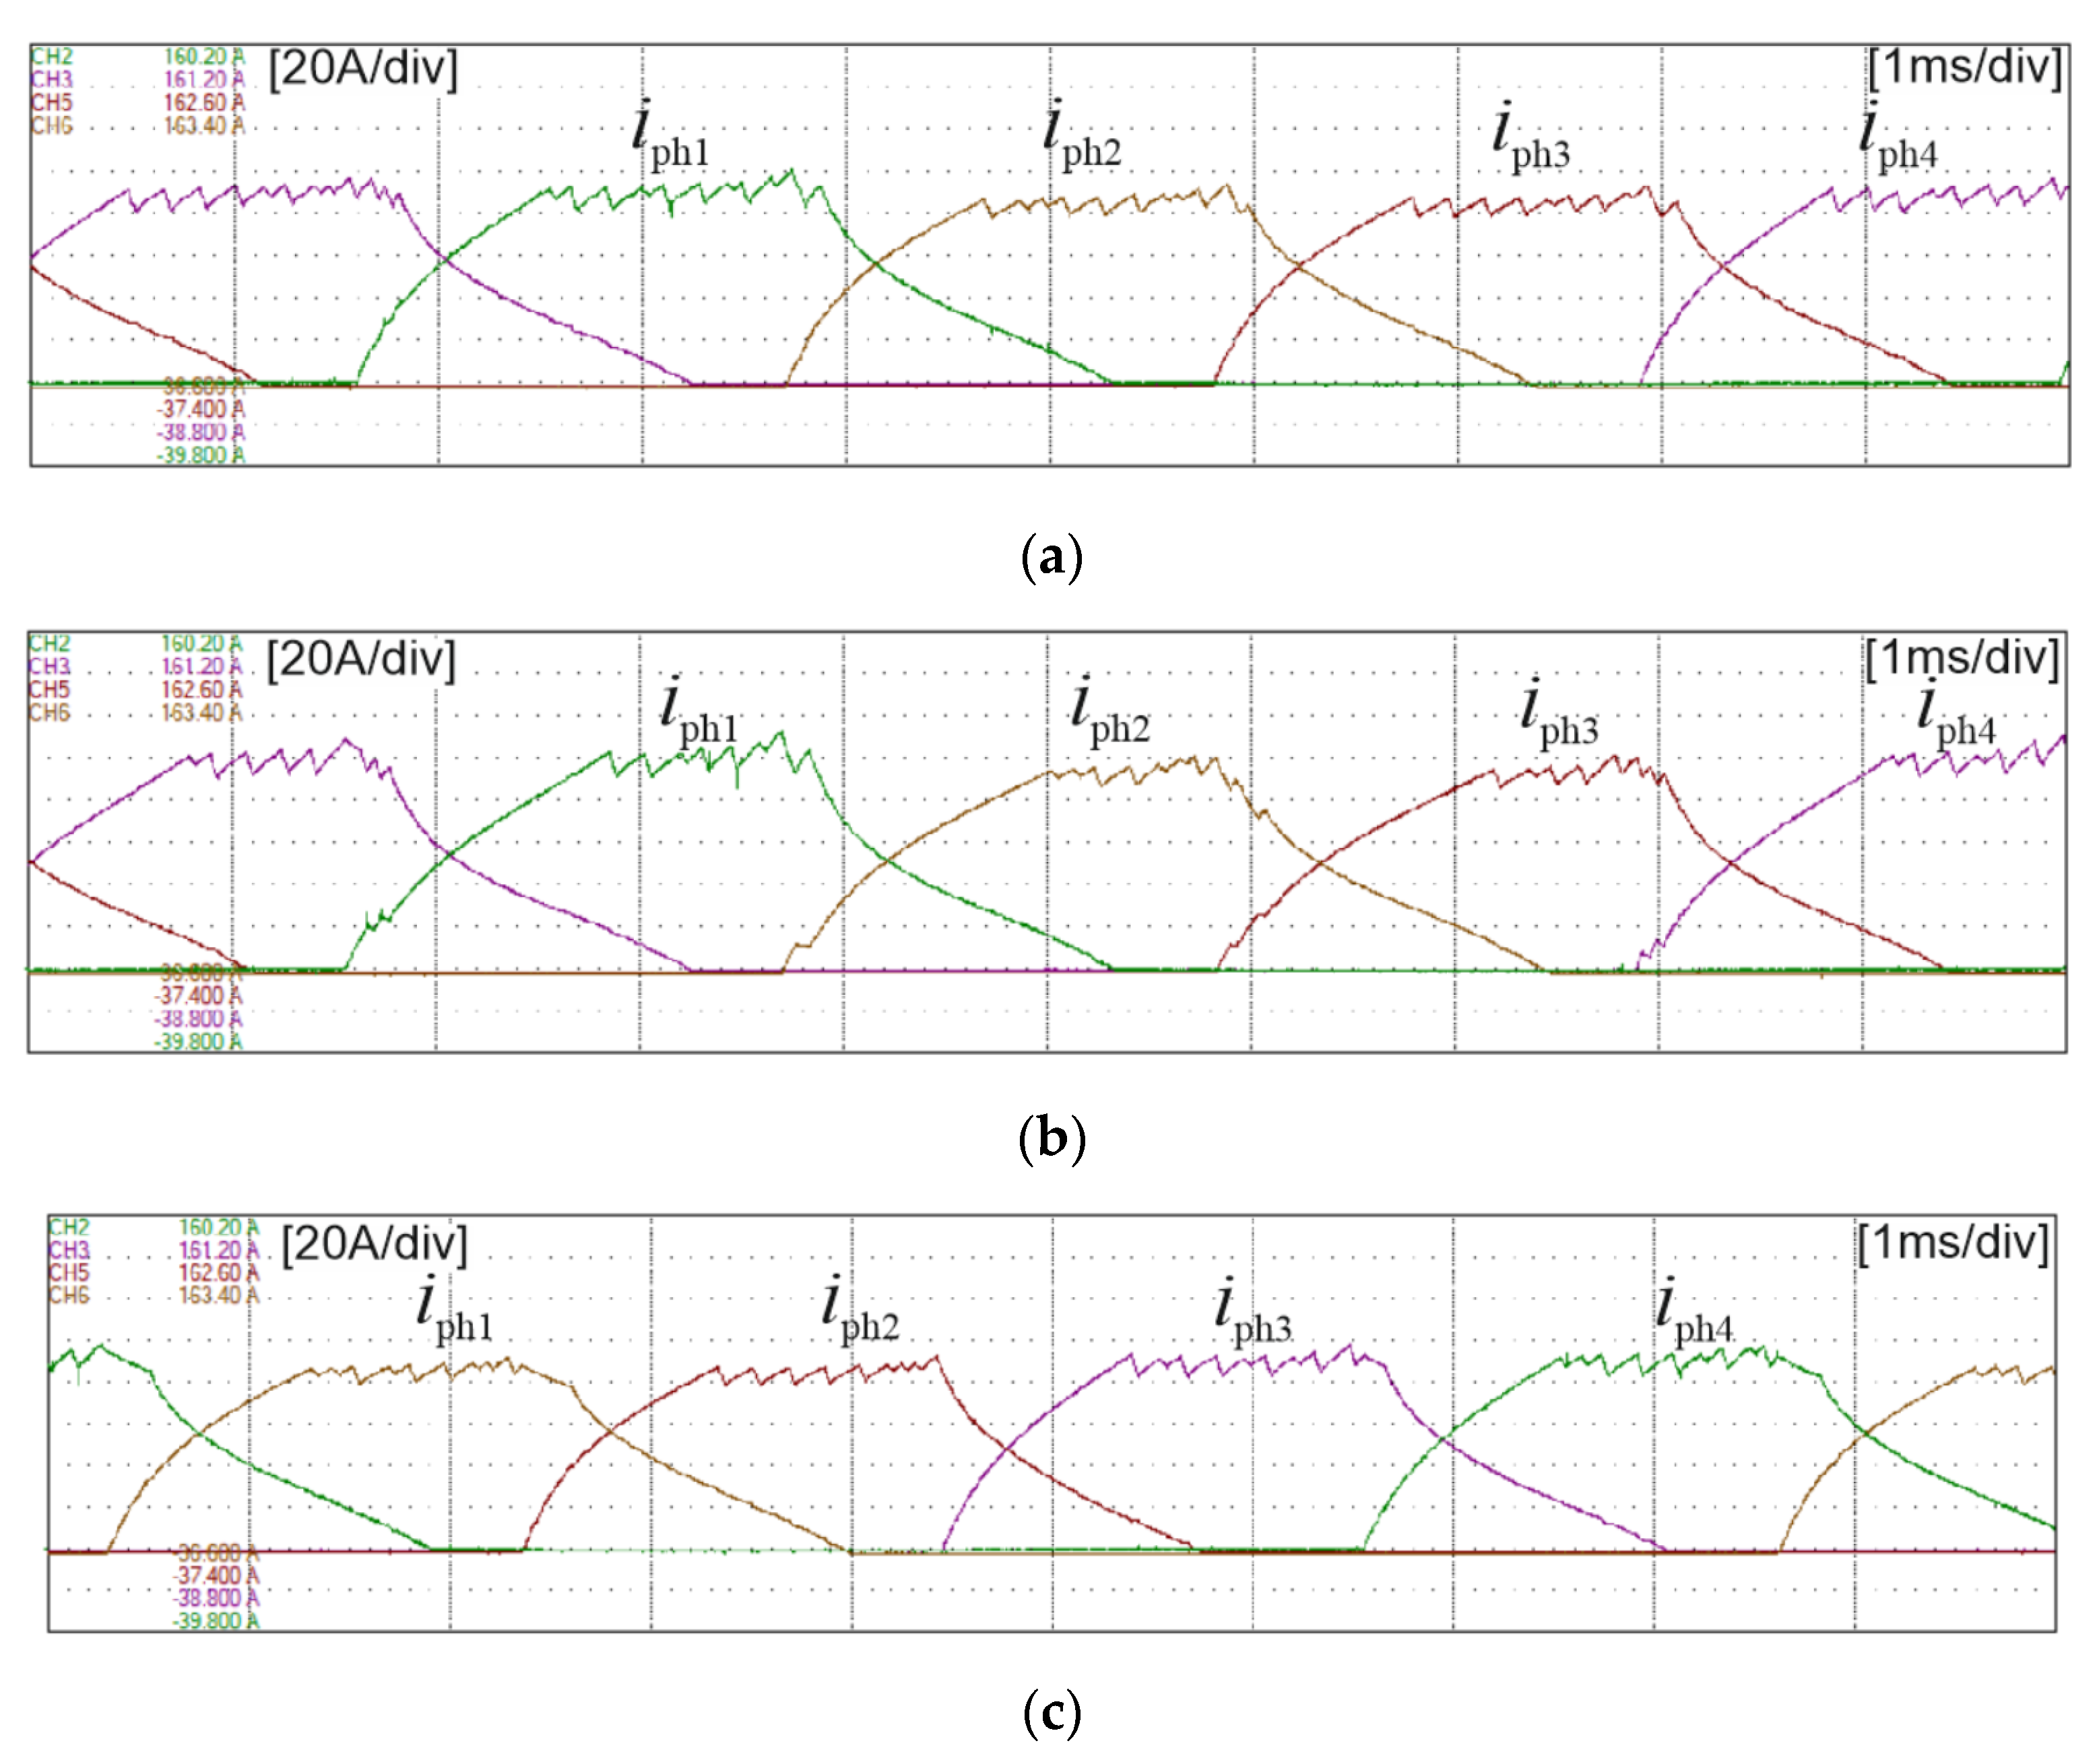
Figure 11 shows the oscillograms of the phase currents and the source current for the CTMC (Figure 11a), DTMC(RC) (Figure 11b), and DTMC(FC) (Figure 11c) control methods.
These oscillograms were recorded at n = 700 rpm with a dc-link voltage Udc = 53 V and load torque TL = 7.5 Nm. The sampling time of the torque controllers was 35 μs. The SRM operated under closed-loop speed control during the determination of these waveforms. Figure 11 shows the differences in the shapes of the phase currents (particularly during commutation periods) and the source current depending on the control method used.
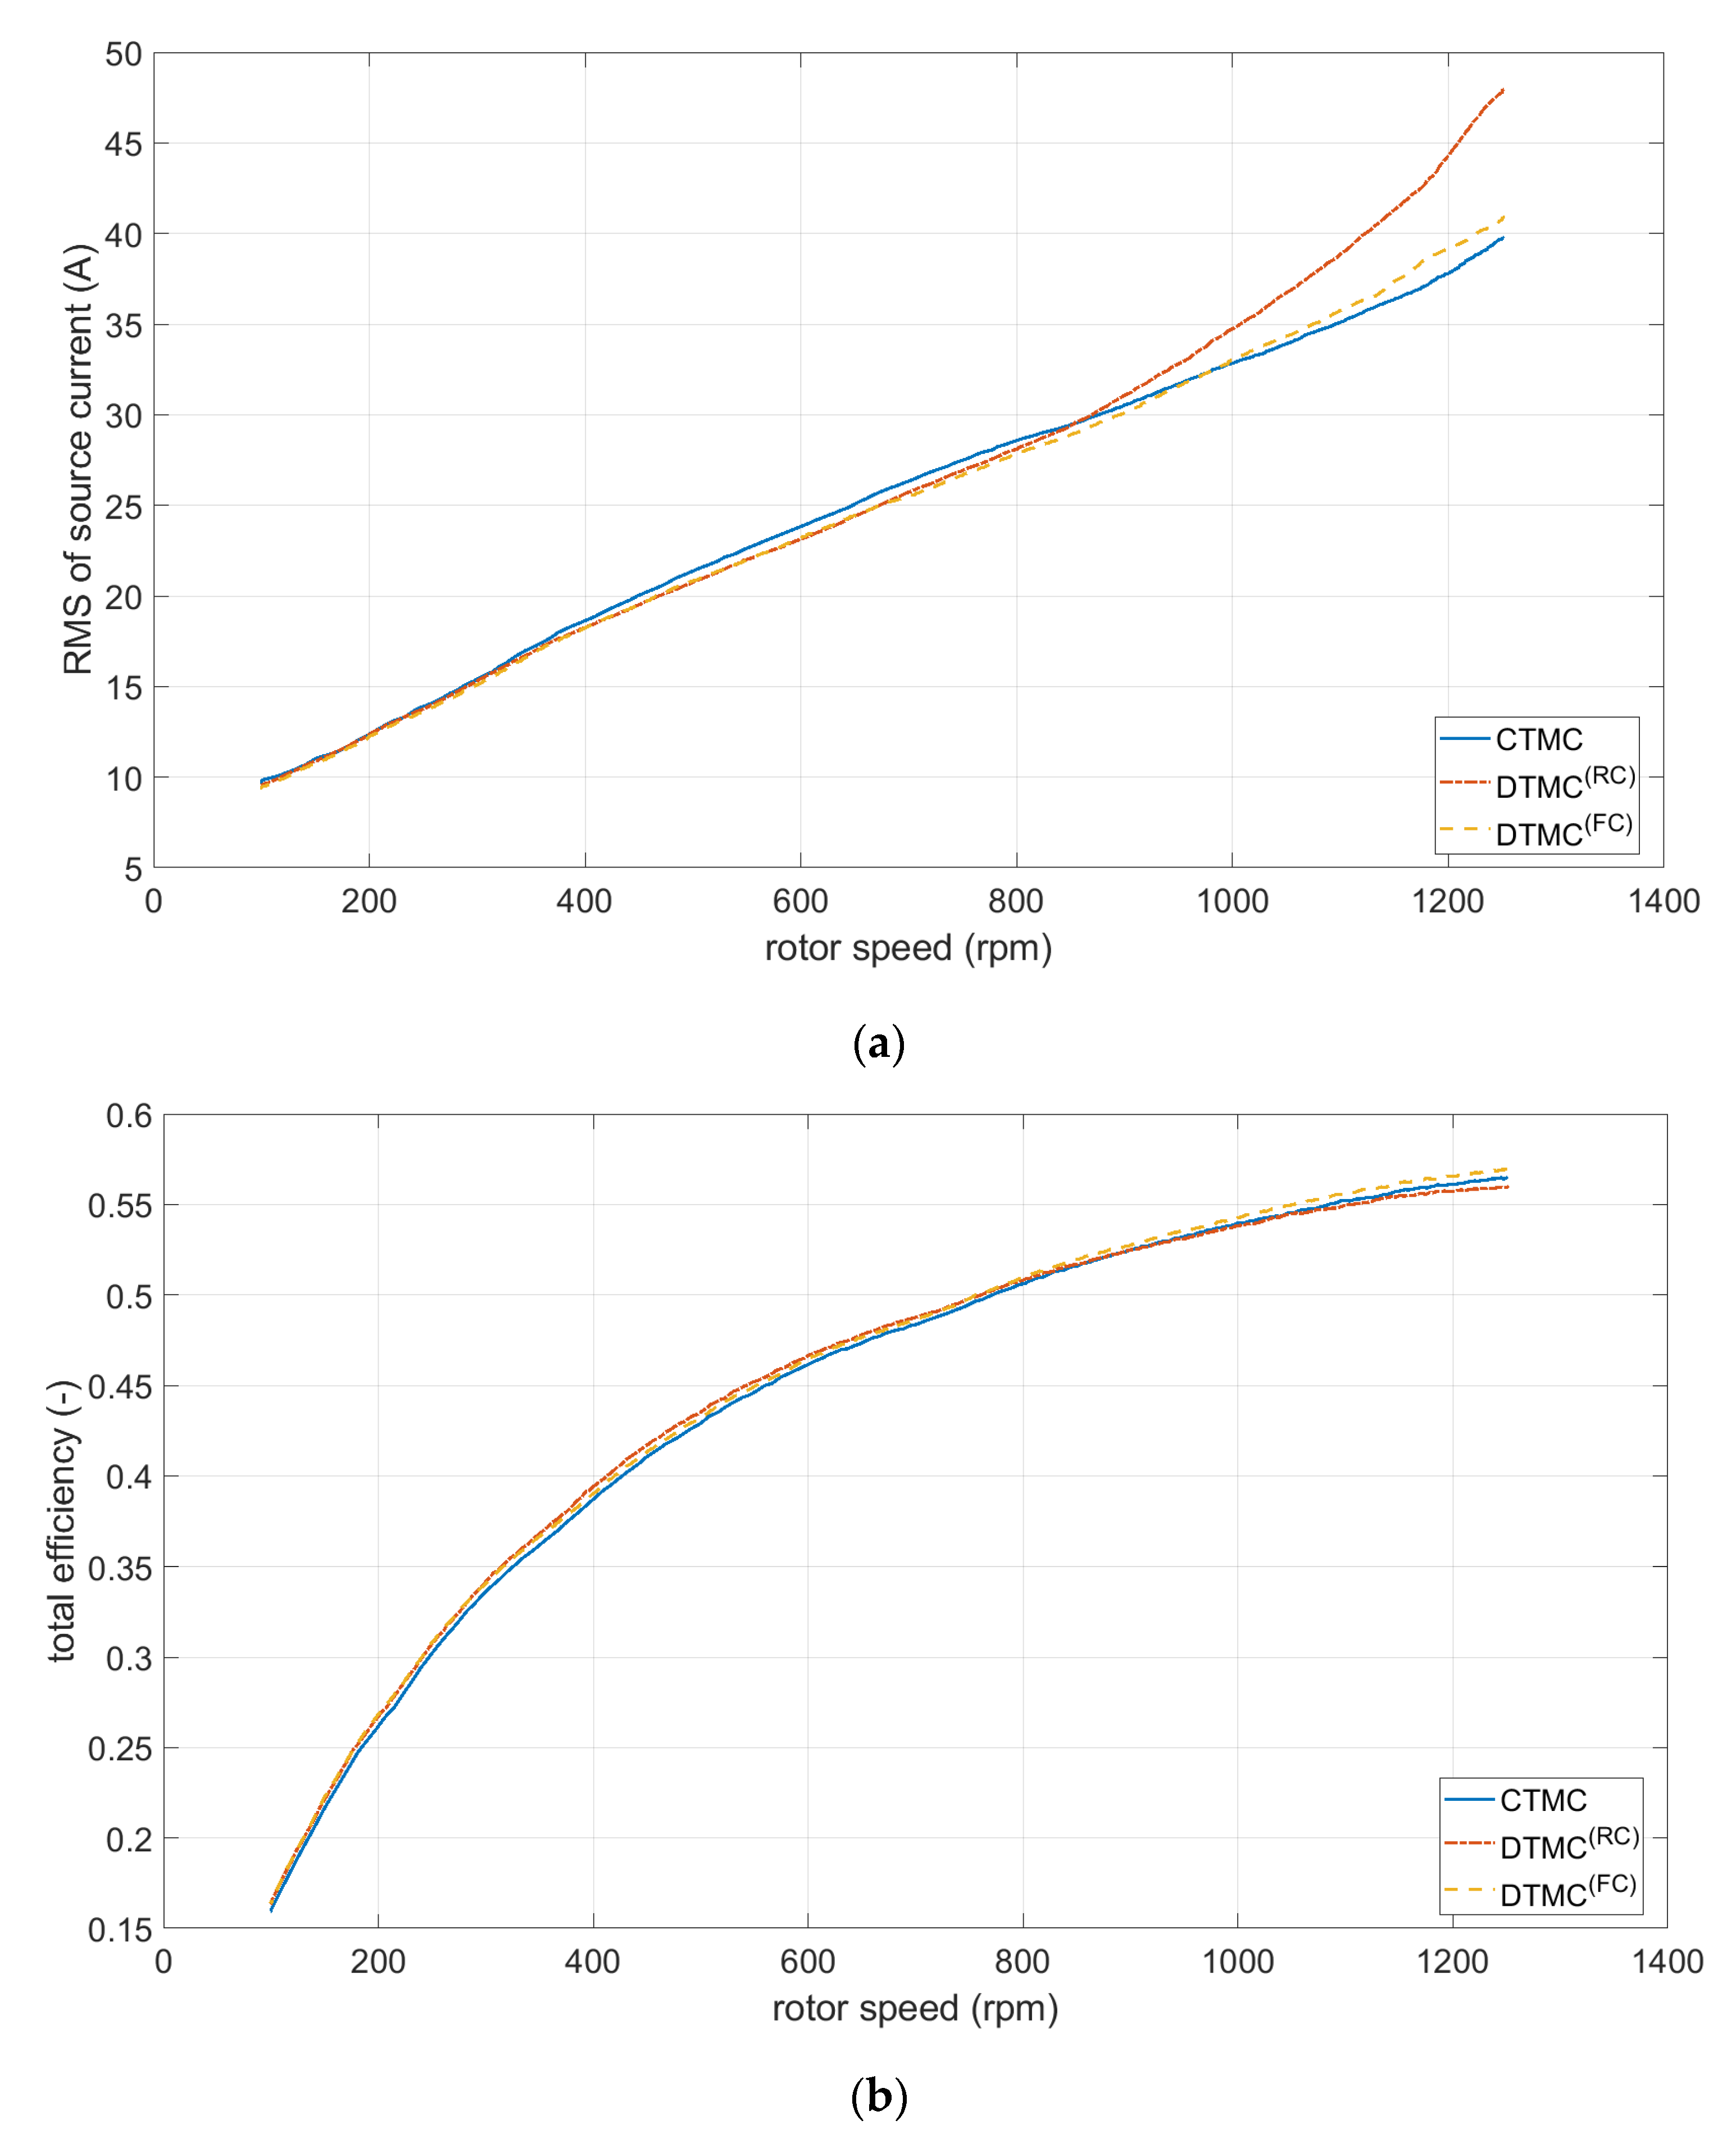
5.3. Static Characteristics
The static characteristics of the tested drive were determined for the voltage Udc = 53V and a load torque of 7.5 Nm for the CTMC, DTMC(RC), and DTMC(FC) algorithms. The characteristics of the efficiency and the RMS current drawn by the drive from the power source as a function of speed under the torque load TL = 7.5 Nm are shown in Figure 12.
In the speed range between 400 rpm and 800 rpm, the lowest power source RMS current and the highest efficiency occur for the DTMC(RC) and DTMC(FC) control methods. In the case of DTMC(RC), above 800 rpm there is a significant increase in the source RMS current value compared with the currents measured for the other control methods tested. This is a result of the poorer reproduction of the set torque profile, which causes the speed controller to force the set torque to increase, thus increasing the magnitude of the machine’s phase current. This situation is confirmed by the oscillograms shown in Figure 13, recorded at 1200 rpm with a load torque of 7.5 Nm.
5.4. Natural Vibration of the Tested Machine
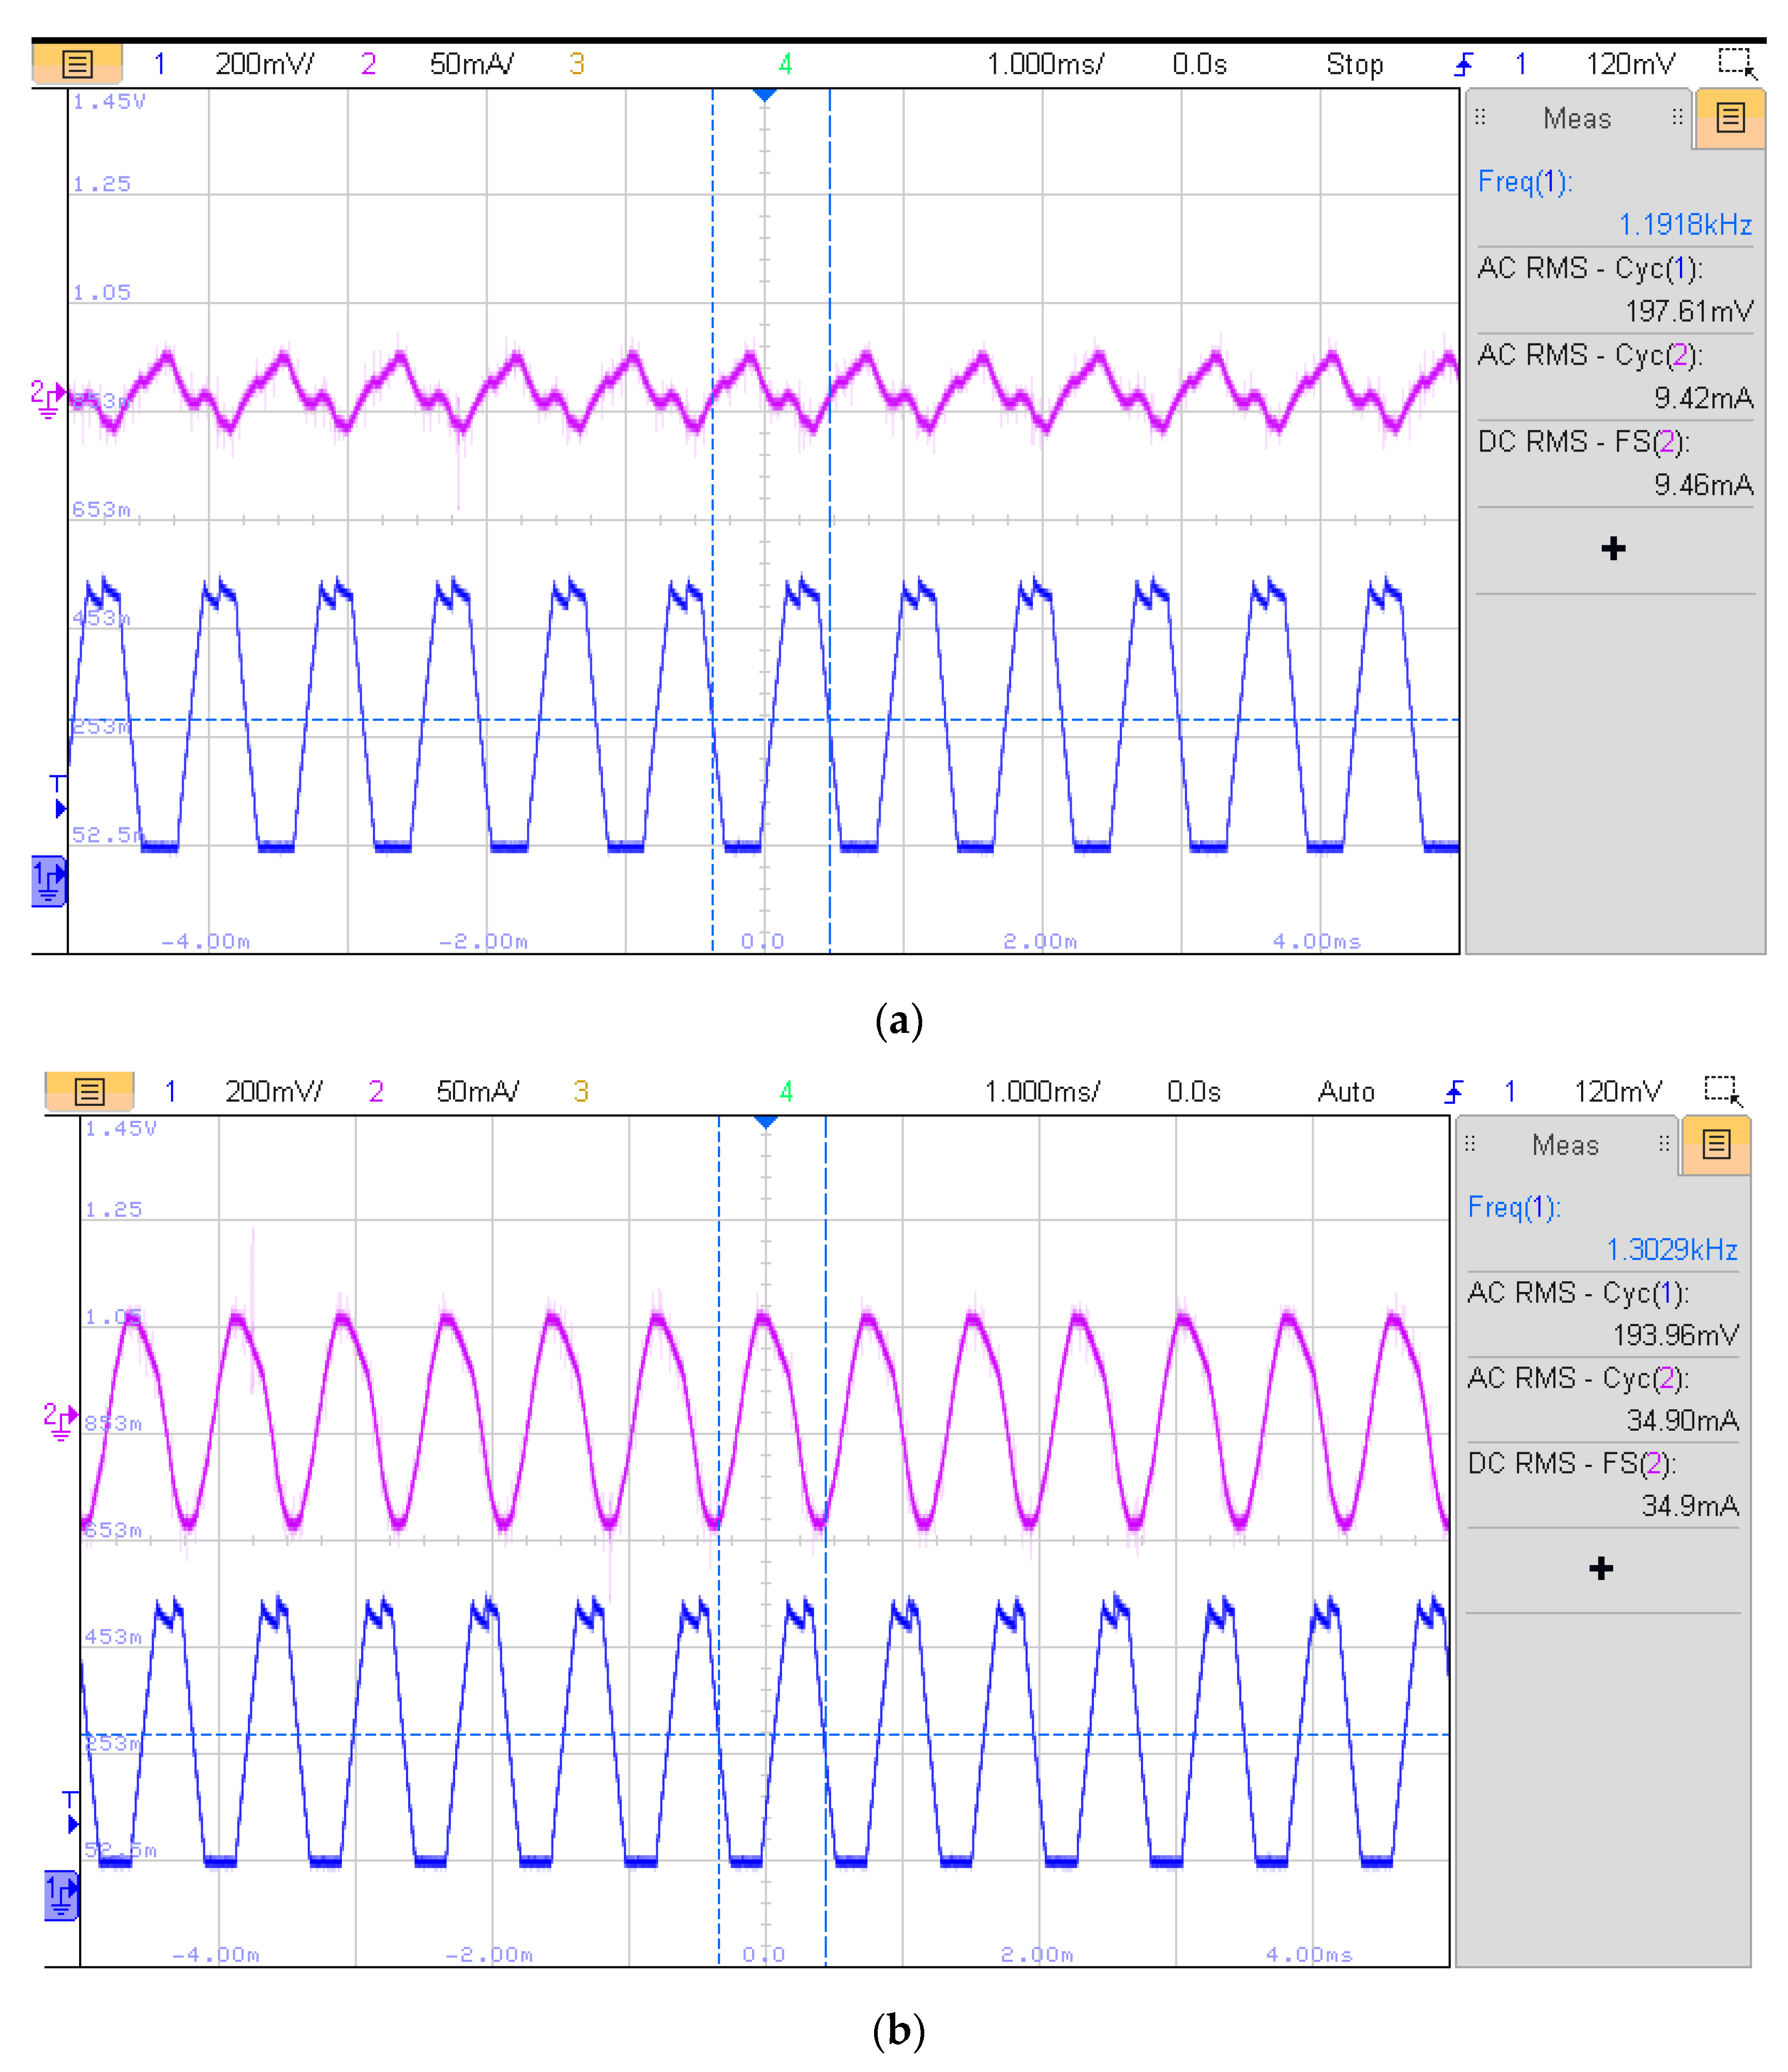
During SRM testing, it was observed, for the control algorithms considered in this study, that the level of vibrations generated changes depending on the control method. To determine the causes of these vibrations, in addition to the results of the simulations (Section 4.2), experimental tests were carried out with the rotor stationary and during motor operation. First, the natural vibrations of the machine were determined. To determine the natural vibrations of the machine, a quasi-rectangular current wave generator of an adjustable frequency machine was used. The test current was generated in one phase of the machine, with the rotor being kept stationary. The reference current of the current generator throughout the frequency variation range was 6.5 A. The generator was software-controlled and implemented on a DS1103 card. Oscillograms of the test current and the vibration acceleration signal for the excitation frequencies 1192 Hz and 1303 Hz are shown in Figure 14. Comparing the two oscillograms, it is evident that there is more than a twofold increase in the level of acceleration of the vibrations at 1303 Hz.
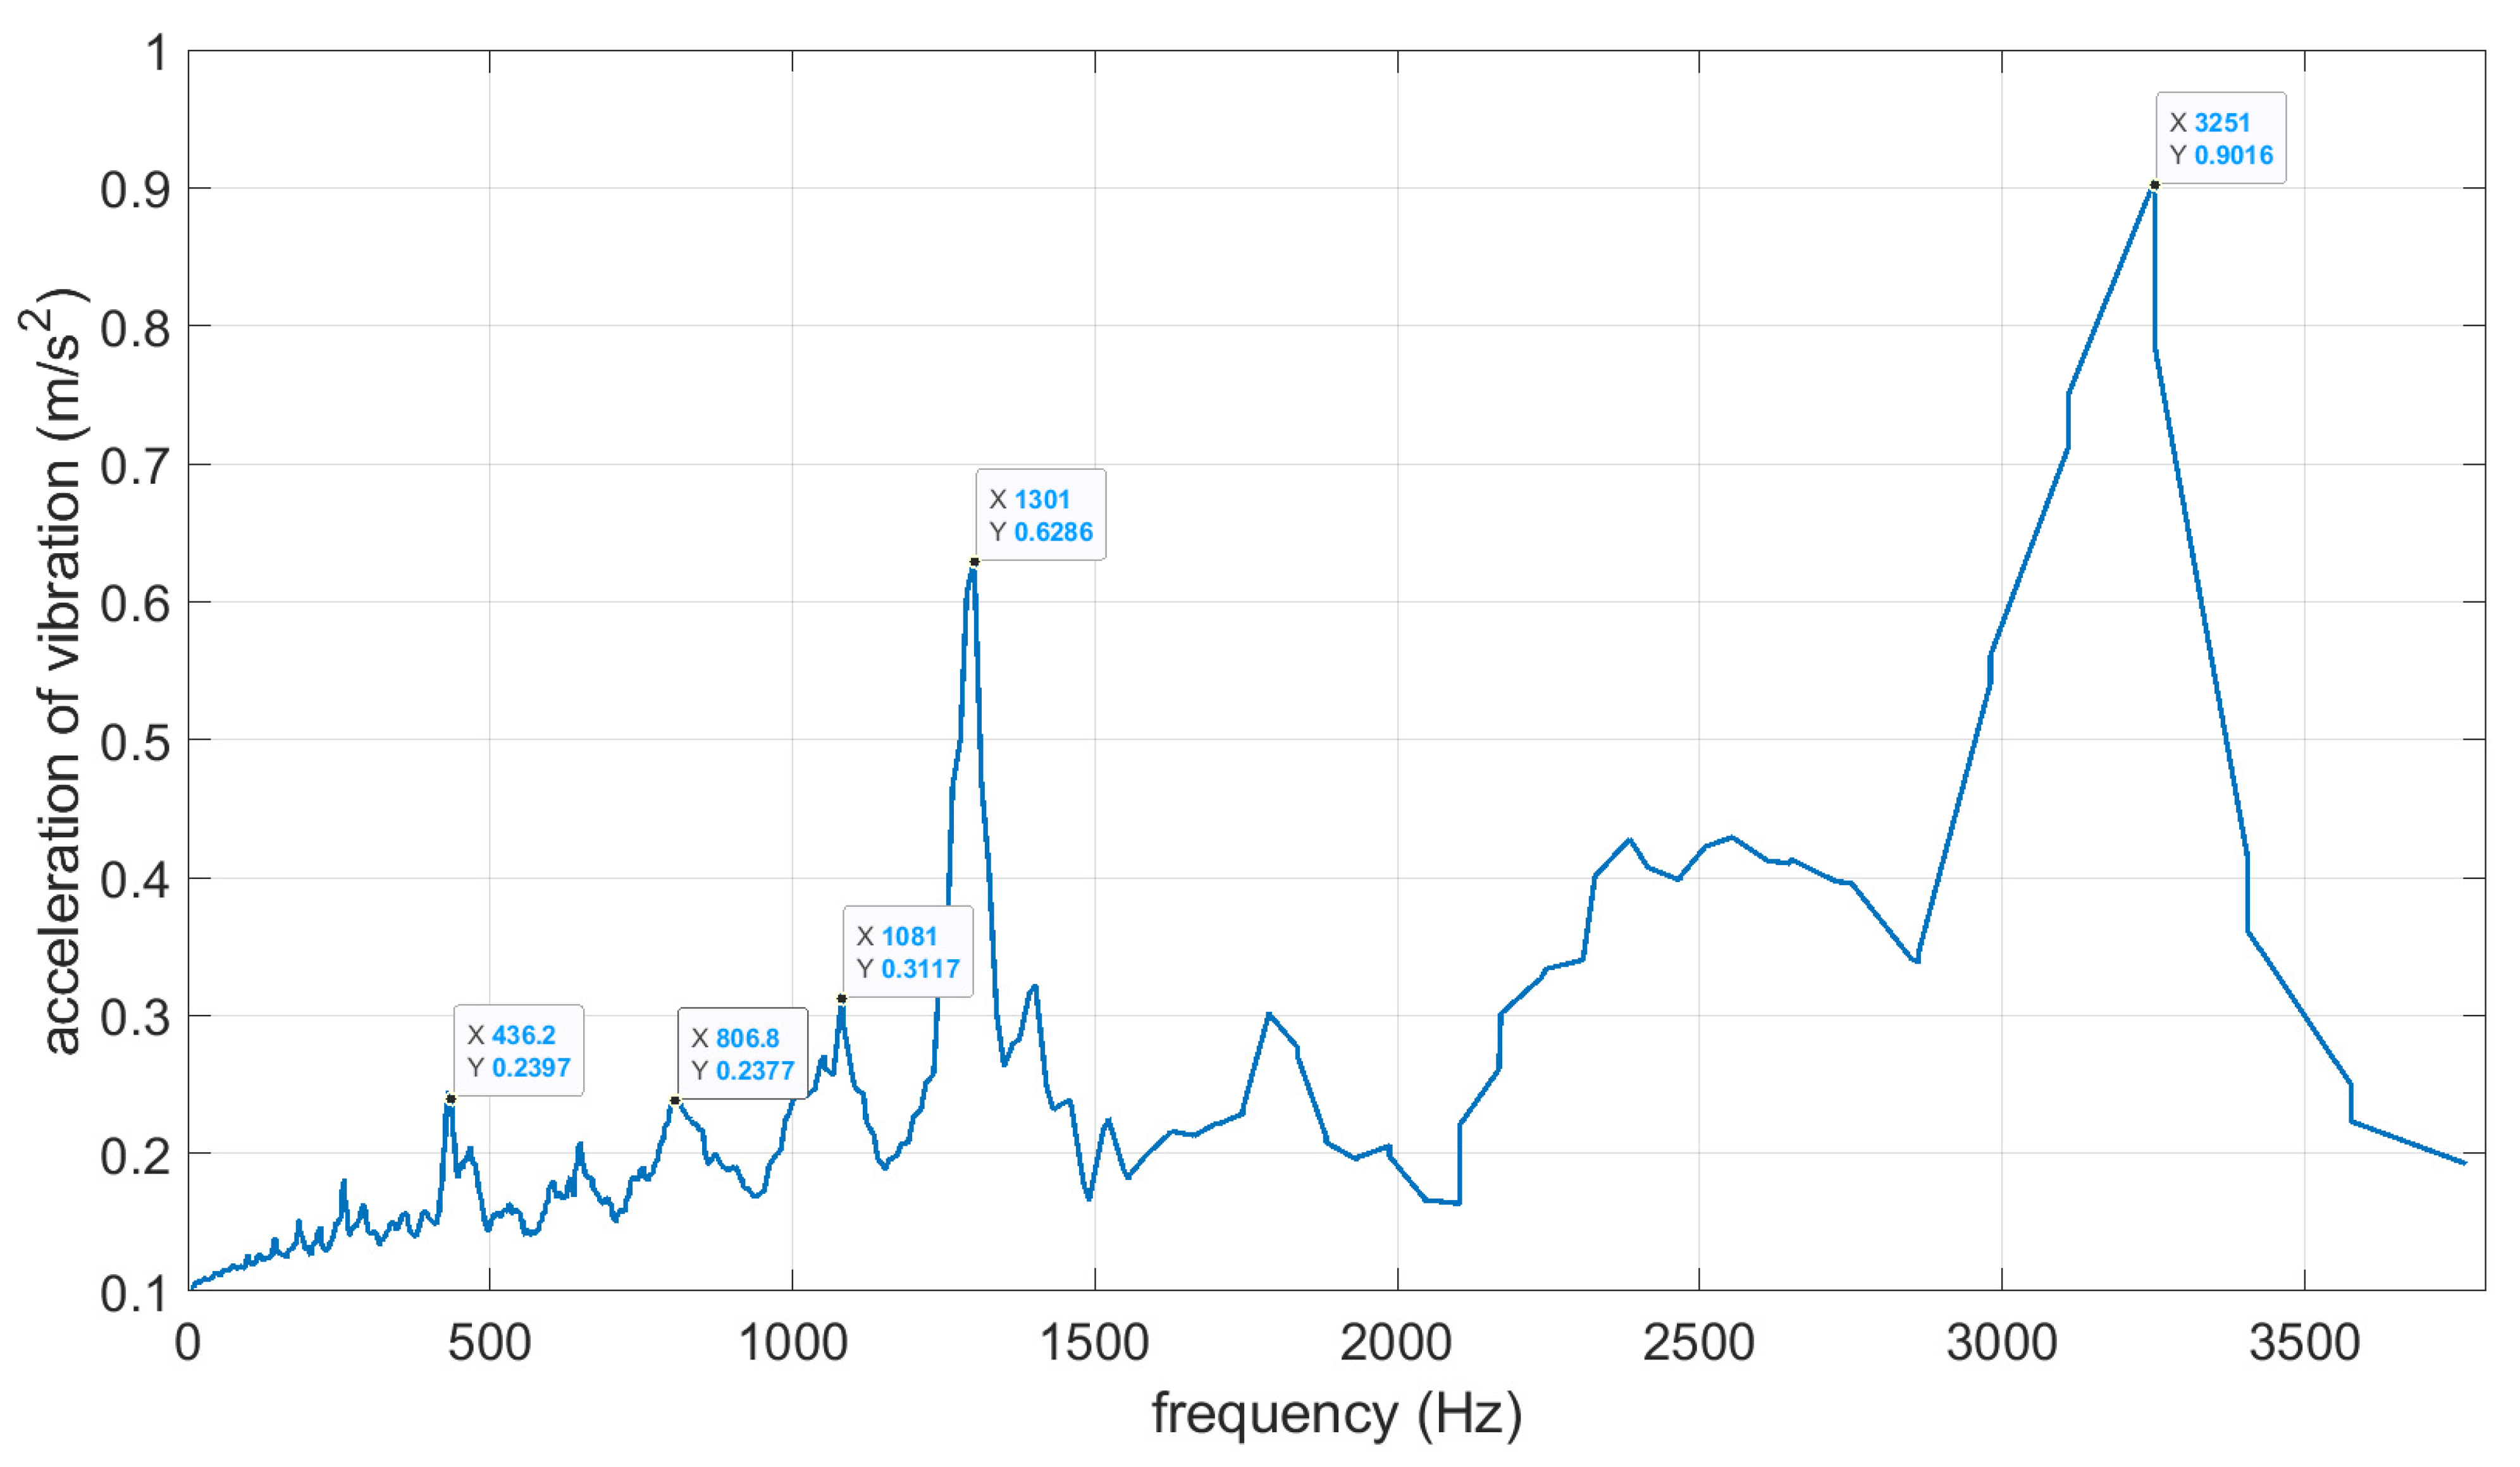
The results recorded on the oscillograms were confirmed by the vibration acceleration values (arms) obtained as a function of the frequency of the excitation current (fi) (Figure 15) (determined with the rotor stationary), the magnitude of which was 6.5 A. This graph shows points at which there is a significant increase in the level of vibration acceleration. The highest levels of vibration acceleration occur at 1301 Hz and 3251 Hz. This shows that these are the resonant frequencies for the machine. When comparing the results for the resonant frequencies of the tested machine obtained experimentally and from calculations (Section 4.2), it is observed that the results are similar.
5.5. Test of SRM Vibrations in Steady State
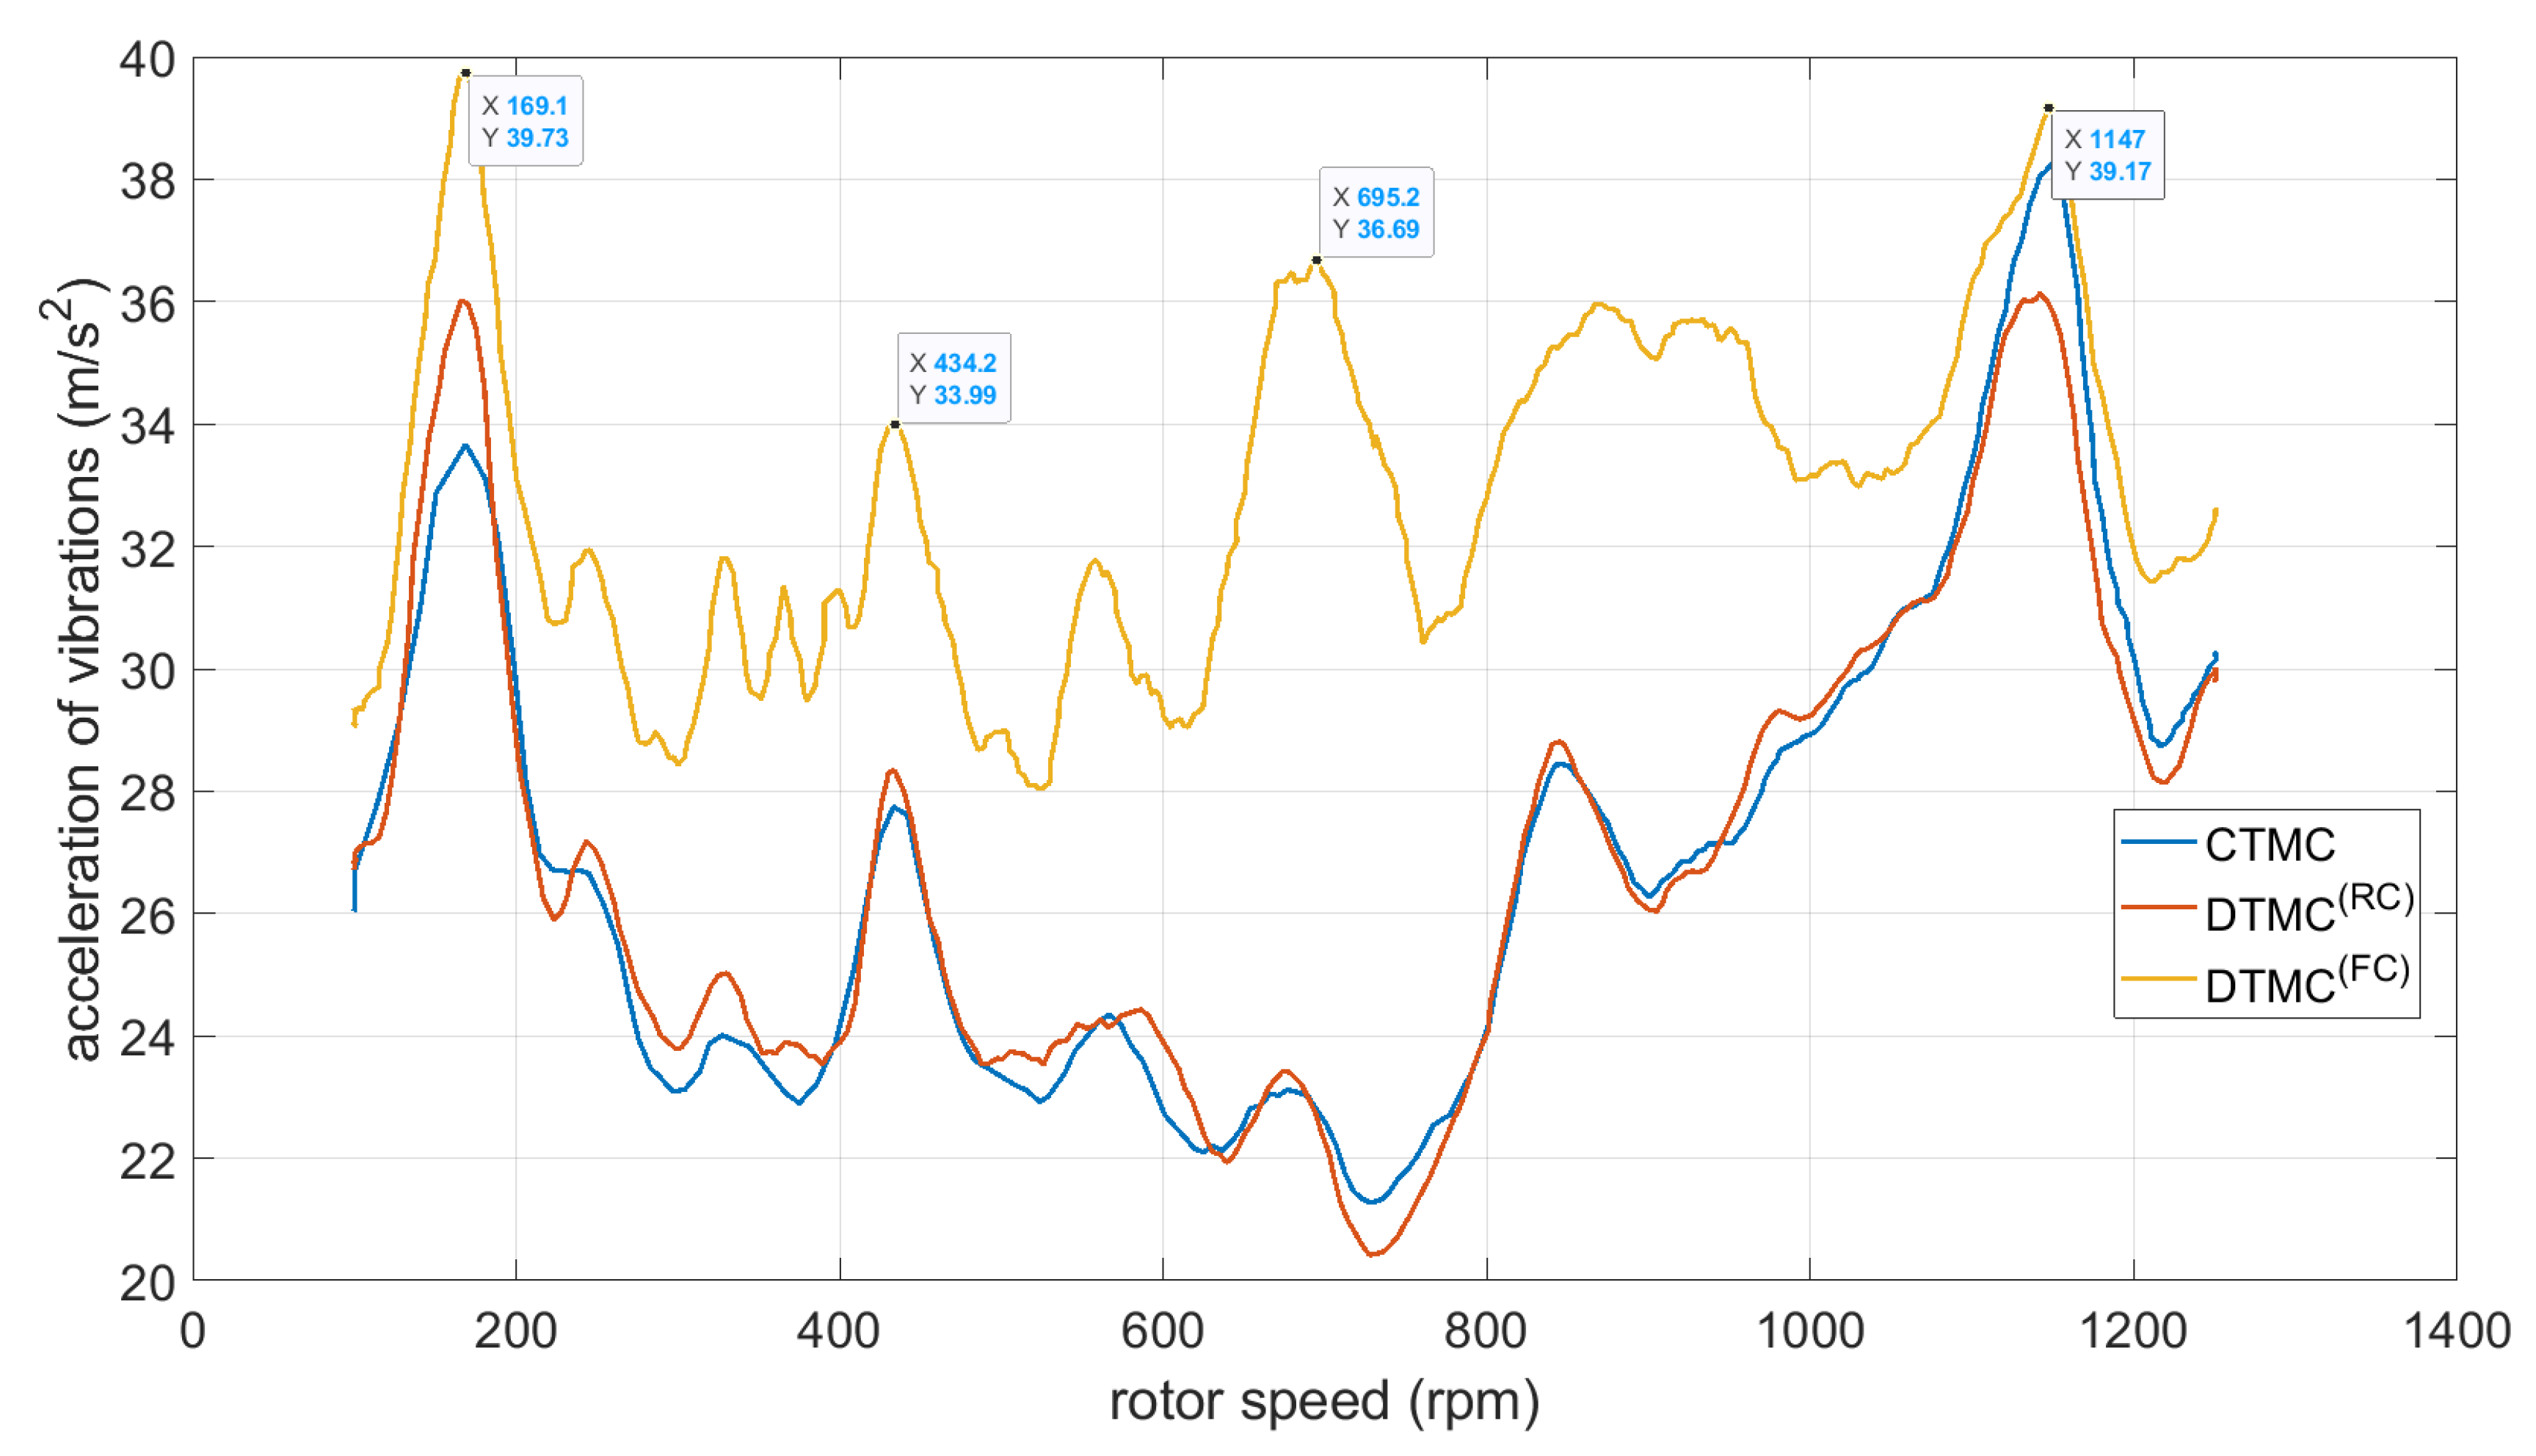
To obtain the characteristics of the drive, in terms of the level of vibrations generated when controlled using the CTMC, DTMC(RC) and DTMC(FC) methods, the RMS vibration acceleration was determined as a function of the rotor speed (Figure 16). This was performed at a constant load torque of 7.5 Nm with the rotor speed varying from 100 to 1250 rpm. The graph shows a noticeable increase in the RMS value of vibration acceleration at certain rotational speeds. Figure 16 shows that the level of vibration generated depends on the control method used. The highest level of vibration occurred for the DTMC(FC) control method.
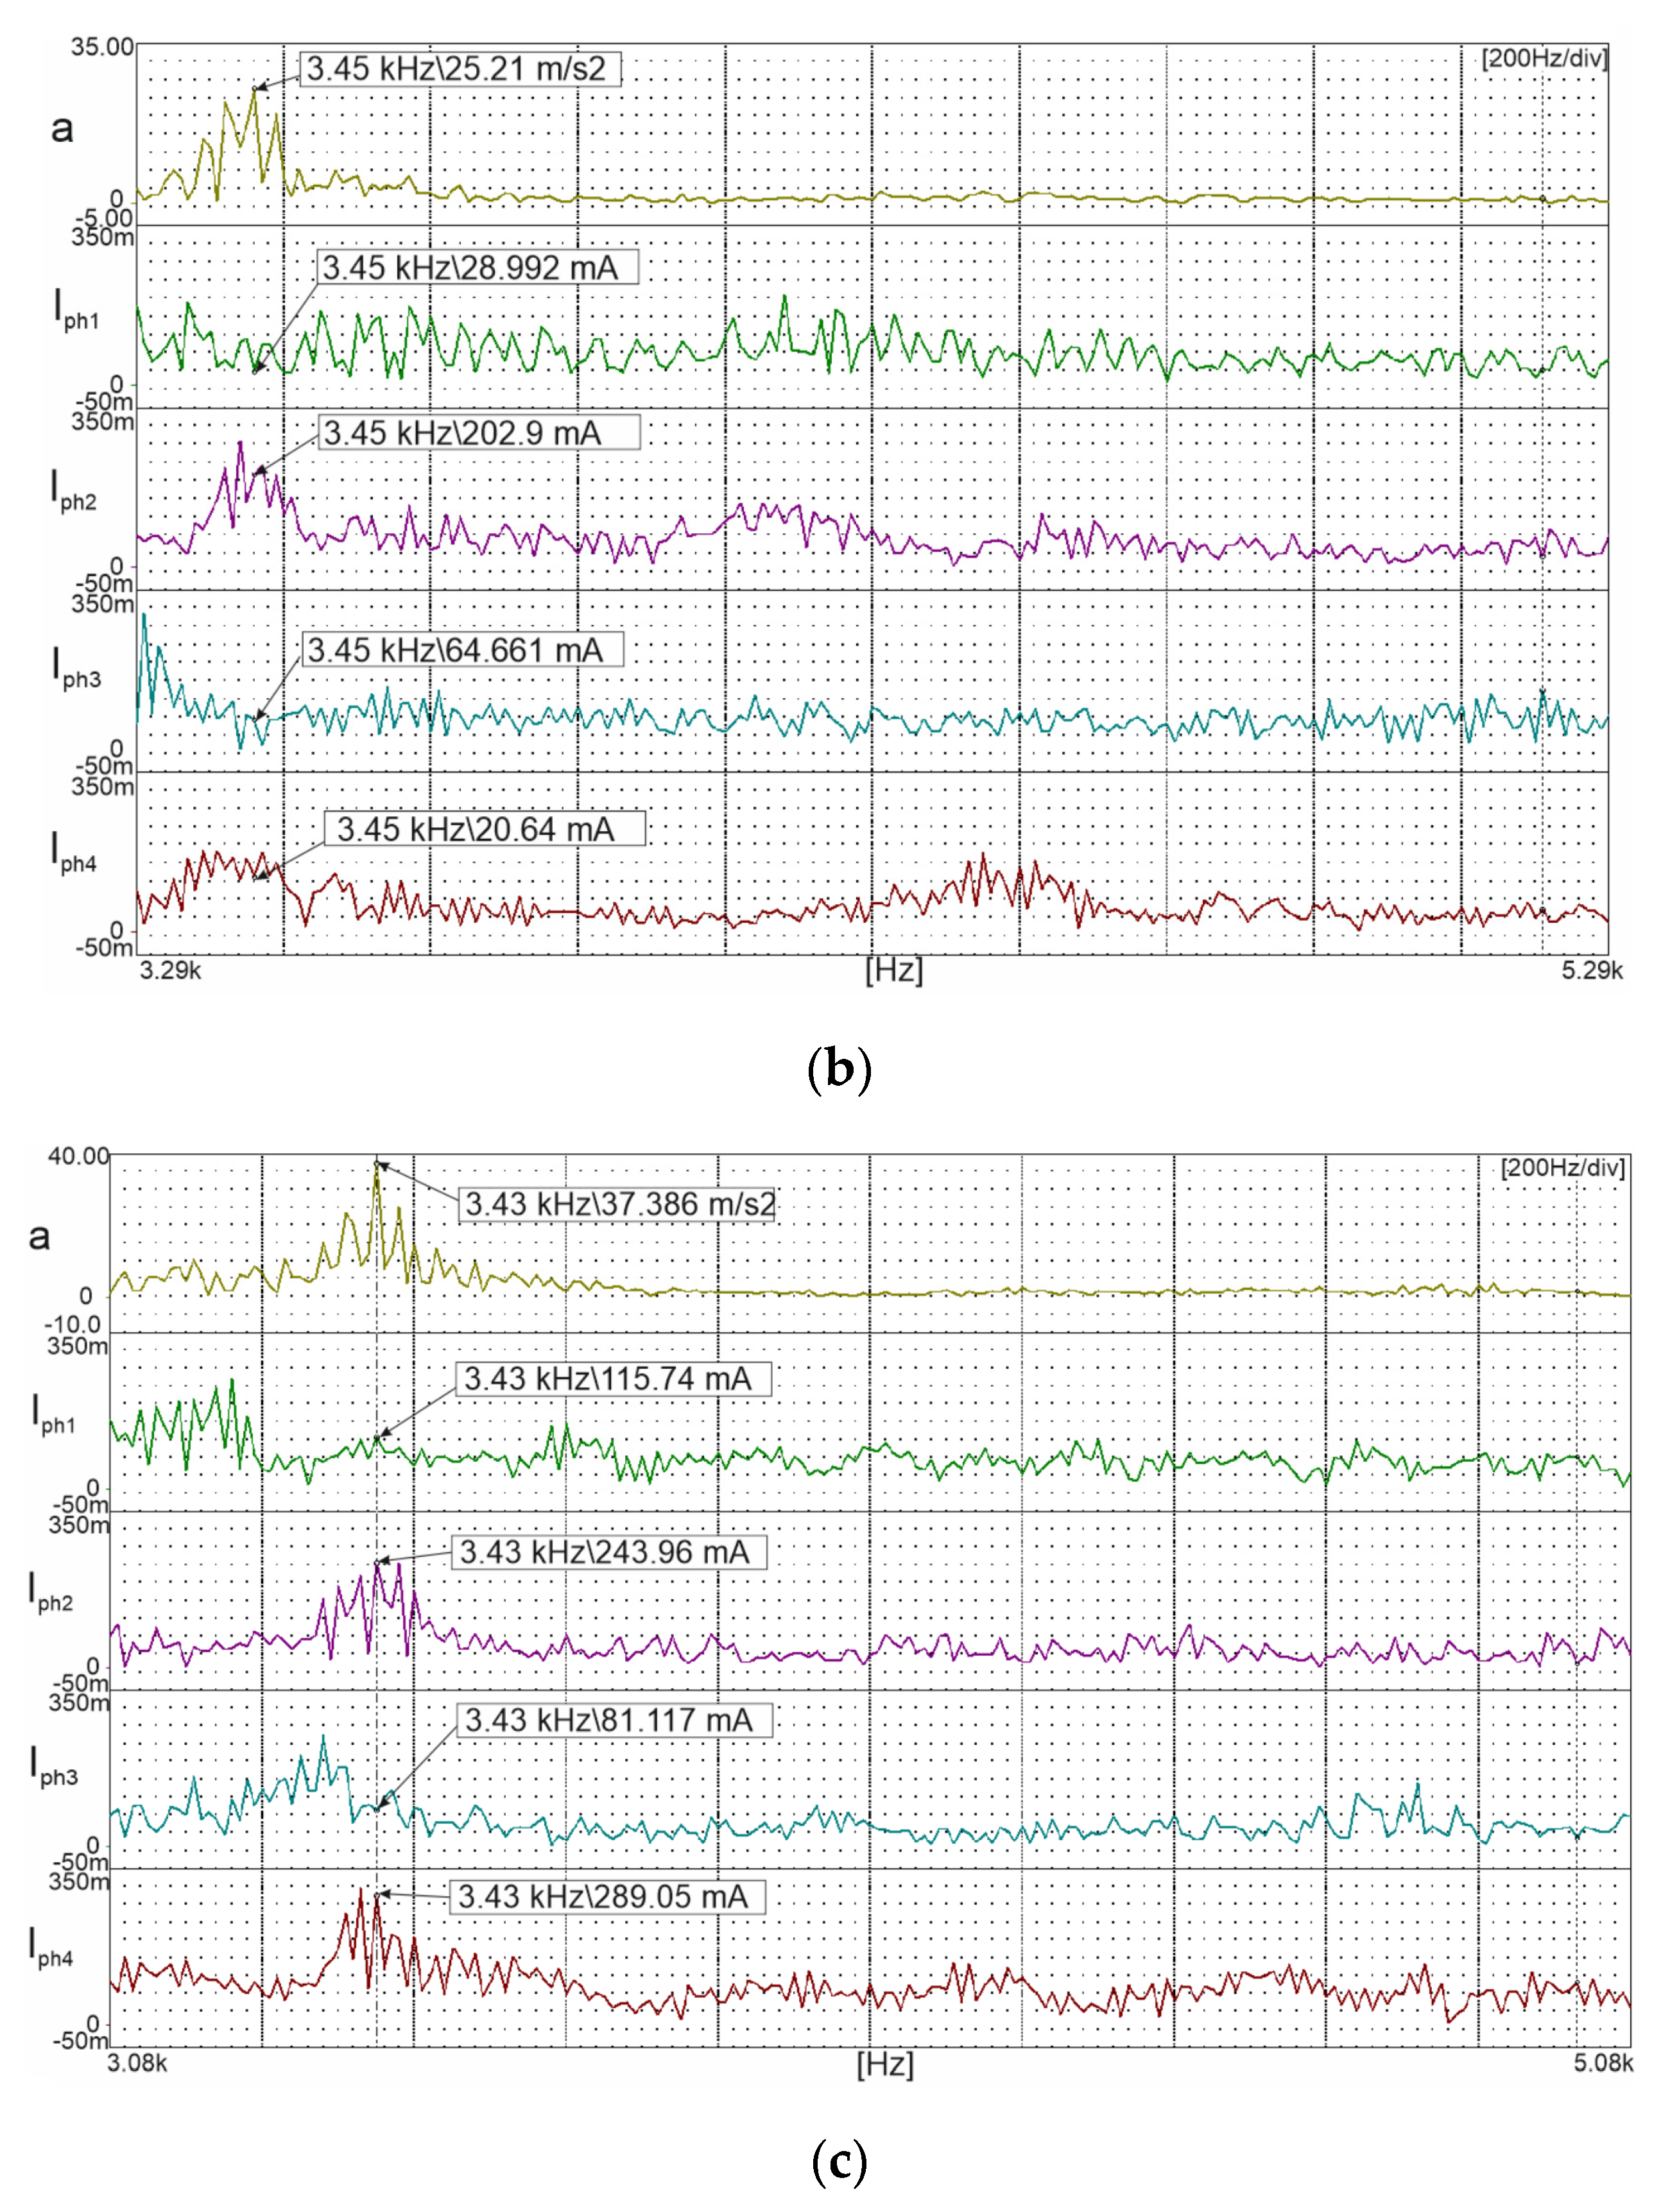
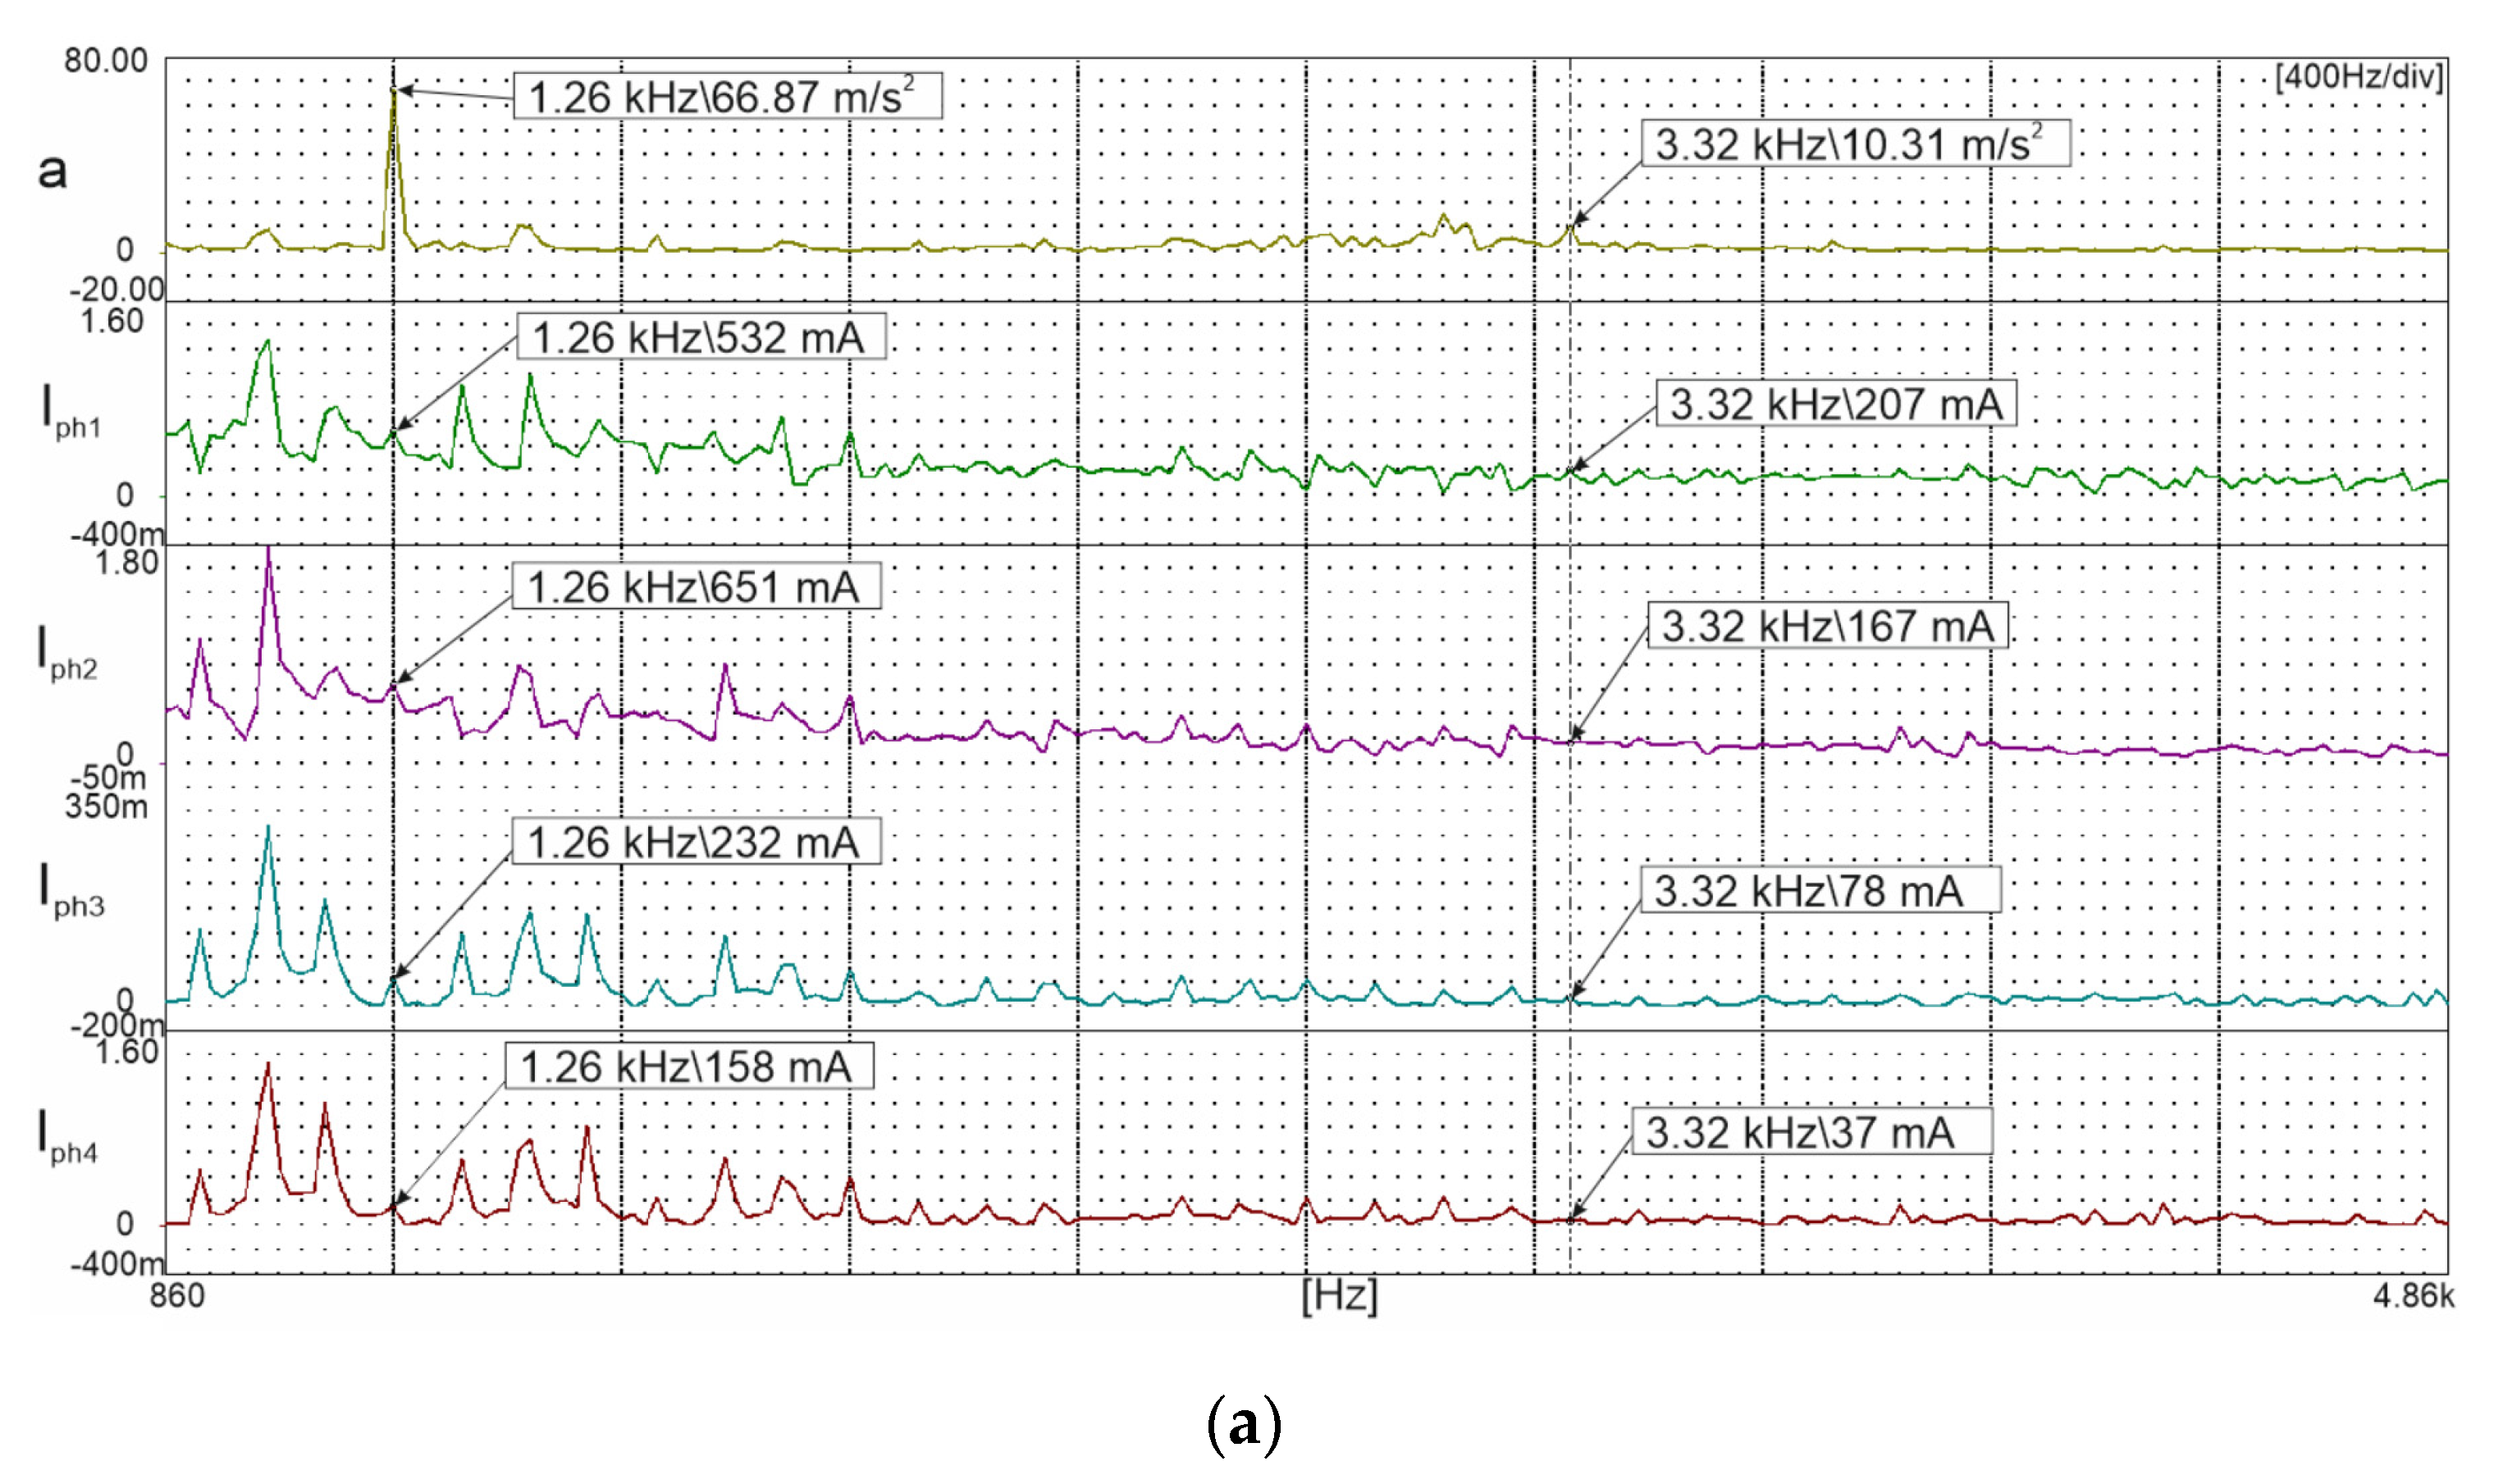
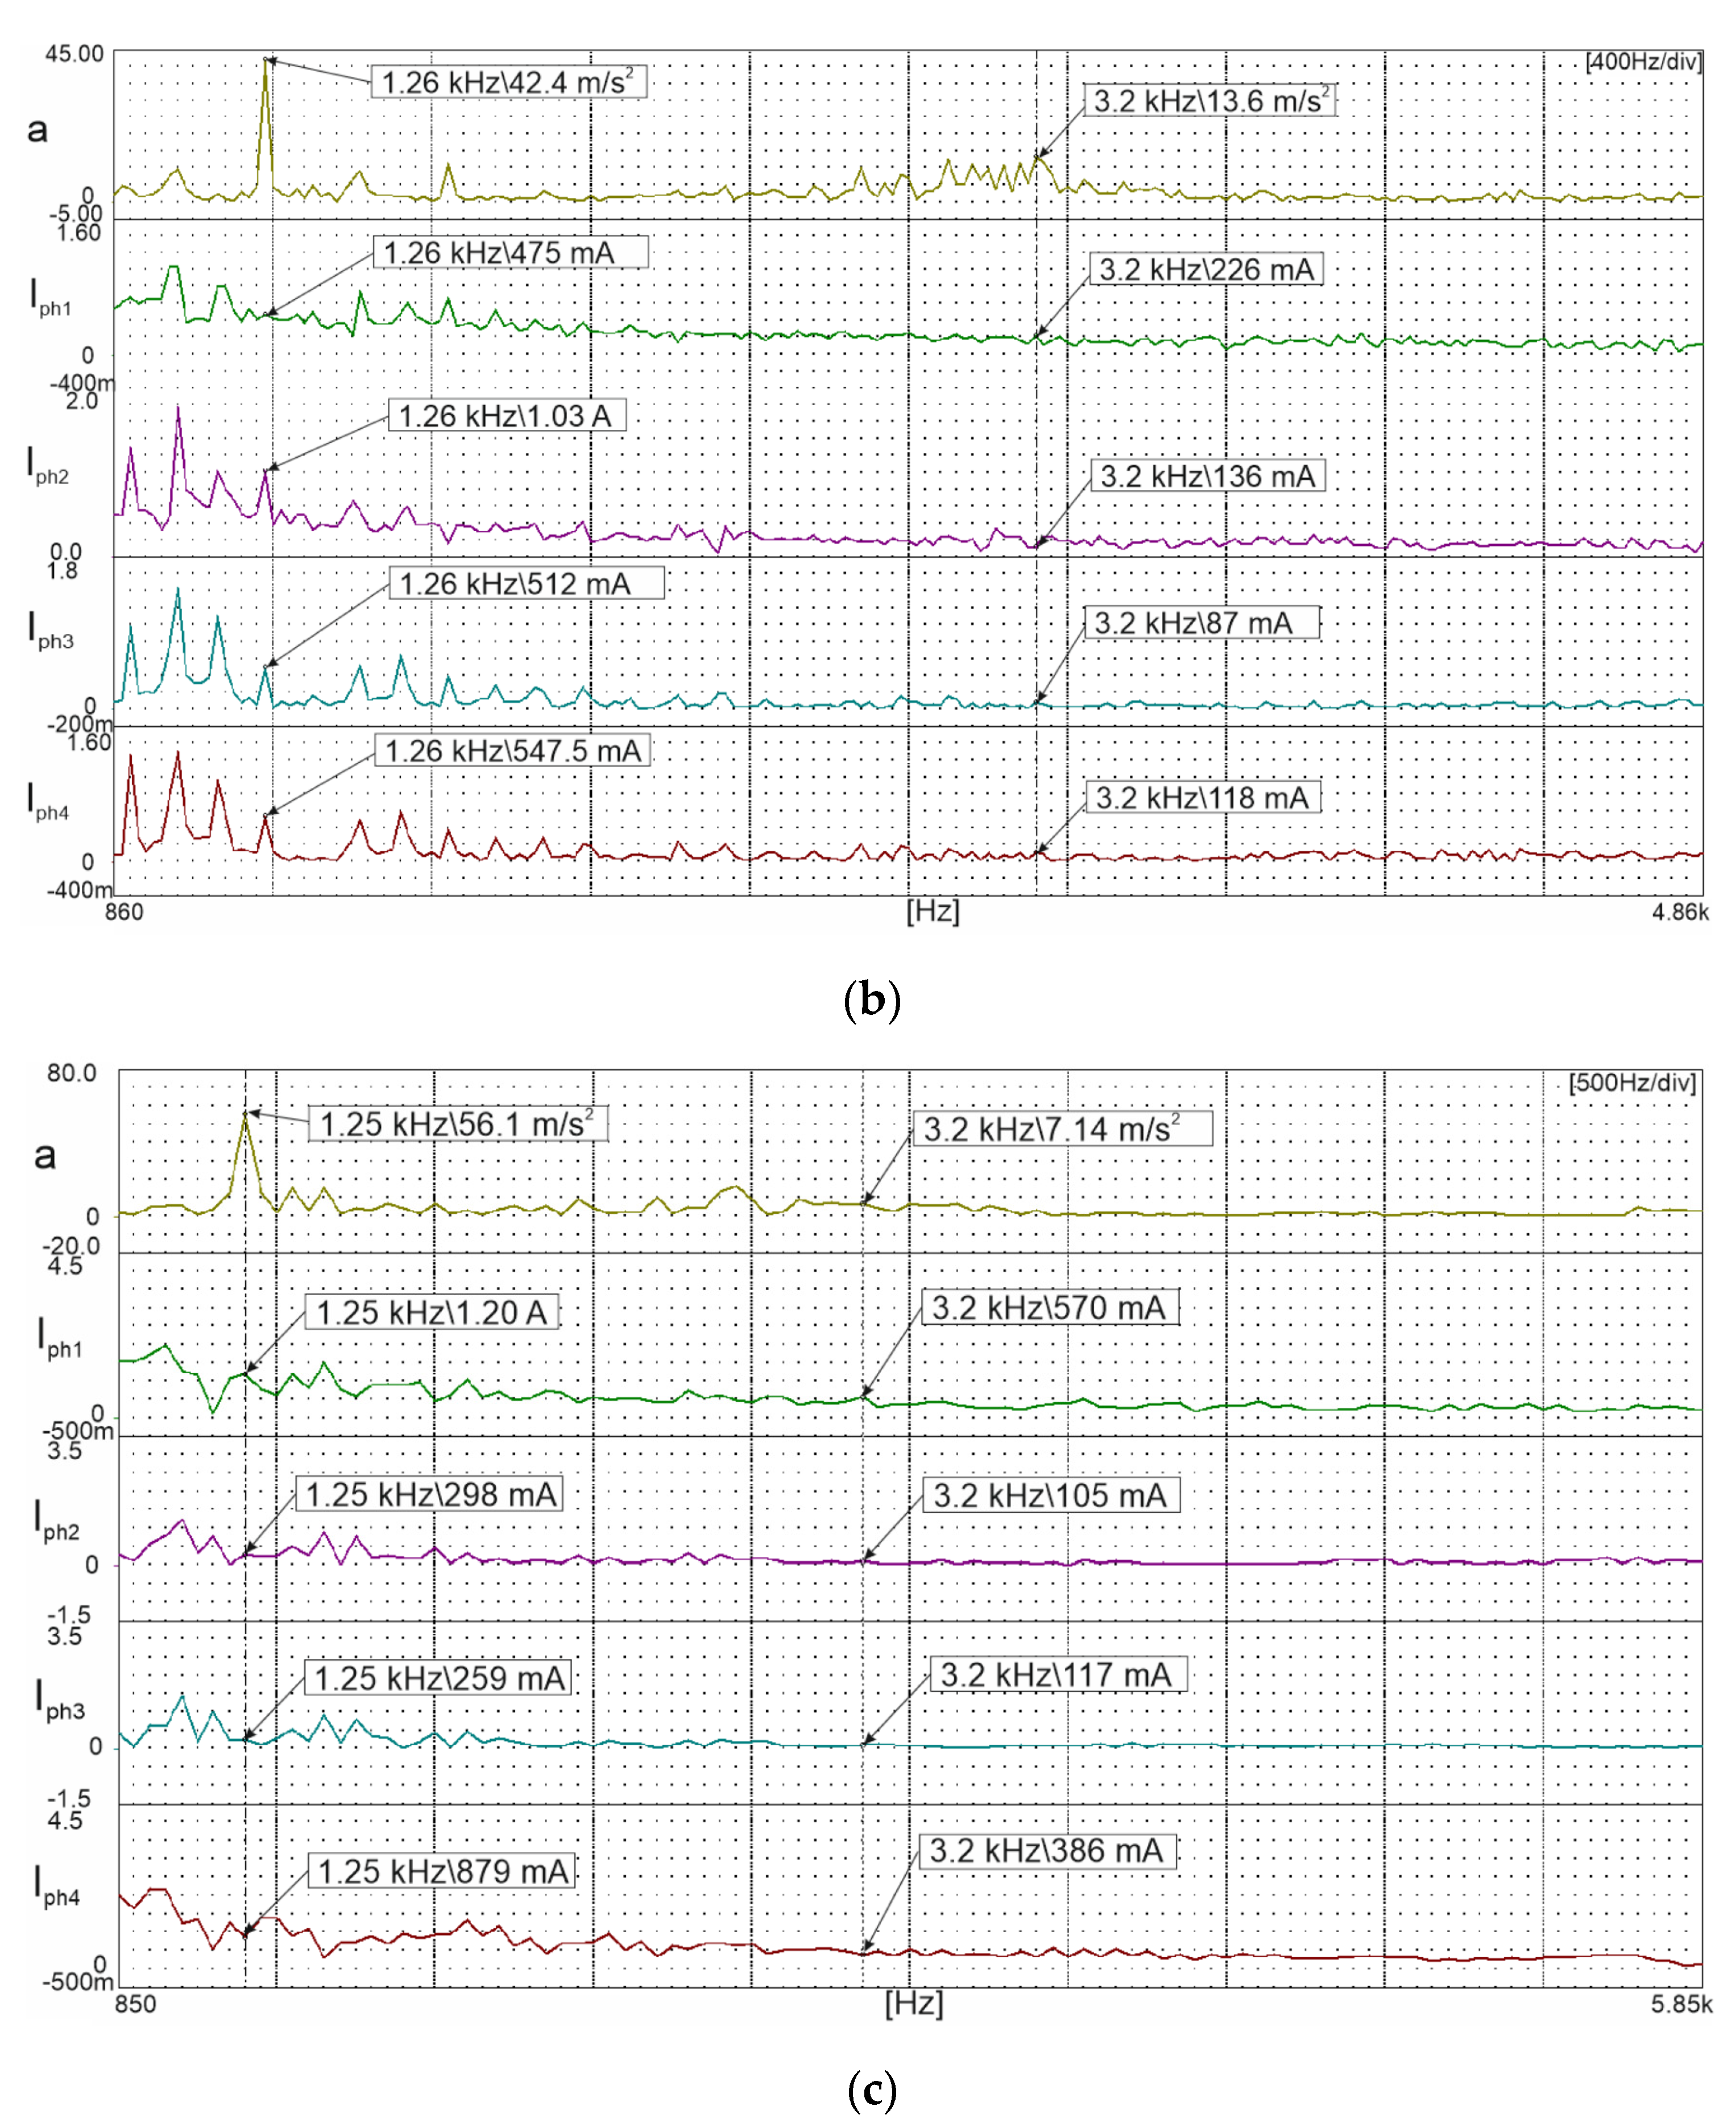
The main source of these vibrations is the frequencies of the harmonics contained in the phase currents. This is evidenced by the harmonic distributions for the waveforms of the individual phase currents and the vibration acceleration. These distributions are shown in Figure 17 (at n = 170 rpm) and Figure 18 (n = 1150 rpm). Depending on the control method used, the distribution of the current harmonics and the vibration acceleration changes. The largest differences occur with the DTMC(FC) control method, where the RMS value of acceleration is the highest.
The graphs shown in Figure 15 and Figure 16 and the FFT analysis of the vibration acceleration and phase currents (Figure 17 and Figure 18) show that the SRM’s resonant frequencies amplify the level of vibrations generated very strongly. In the tested machine, these are mainly frequencies in the ranges of 1.2–1.4 kHz and 3.2–3.4 kHz. The resonant frequencies of the stator determined by simulation (Table 2) fall within these two ranges. Small levels of current harmonics at frequencies close to the resonant frequency of the SRM amplify the generated level of vibration acceleration very strongly. The level of these harmonics is tens of times lower than the fundamental harmonic dependent on the rotor speed. For comparison, Table 3 gives the vibration acceleration and phase currents for harmonics at 20 Hz and 3.41 kHz (3.43 kHz for DTMC(FC)). The comparison shows that the value of the harmonic at 20 Hz is more than 100 times higher than the harmonic at 3.41 kHz, yet it does not significantly affect the level of vibrations generated. The waveforms of the vibration acceleration and phase currents used for the FFT analysis were recorded at a rotor speed of 170 rpm and a load torque of 7.5 Nm. Table 4 shows the values of the vibration acceleration and phase currents for harmonics at 120 Hz and 1.26 kHz. The waveforms of the vibration acceleration and phase currents used for the FFT analysis were recorded at a rotor speed of 1150 rpm and a load torque of 7.5 Nm.
6. SRM Control Variants Using the CTMC and DTMC Methods
By analyzing the laboratory test results presented in Section 5.3 and Section 5.5, it is possible to identify the speed ranges in which the drive has the best properties depending on a specified criterion. If the criterion is minimum losses in the power source—i.e., operation at minimum current IsourceRMS—the control of the drive as a function of speed should use the speed ranges listed in Table 5.
If the drive is to operate at maximum efficiency, it should be controlled as shown in Table 6.
To ensure that the SRM drive generates as little noise as possible, it should be controlled using the CTMC or DTMC(RC) method.
7. Conclusions
This paper has presented a description and the results of simulations and laboratory tests of proposed methods for dependent torque control in a Switched Reluctance Motor, denoted DTCM(RC) and DTMC(FC). The results of these tests were compared with those obtained for the Classical Torque Motor Control (CTMC) method. The following conclusions were drawn from the study:
- −
- The advantage of the proposed control methods is that they do not require equipment modifications of the power system to improve the performance of the drive.
- −
- The use of DTMC(RC) and DTMC(FC) improves the drive efficiency compared with the CTMC method, but the improvement is not greater than 1%.
- −
- With DTMC(RC) control above 800 rpm, the drive efficiency decreases and the RMS of the source current increases.
- −
- Comparing the levels of vibration acceleration generated by the SRM for the considered control methods, the highest level of vibrations occurred with DTMC(FC). This is due to the control algorithm, which causes an increase in the amplitudes of phase current harmonics at the resonant frequencies of the machine.
These results were used to identify the speed ranges in which a particular type of control ensures the minimum losses in the power source or the maximum efficiency of the drive.
Author Contributions
Conceptualization, P.B. and J.P.; methodology, P.B.; software, P.B. and M.K.; validation, P.B., M.K., J.P. and M.D.; investigation, P.B.; writing—original draft preparation, P.B., M.K., J.P., M.D.; writing—review and editing, P.B., M.K., J.P., M.D. All authors have read and agreed to the published version of the manuscript.
Funding
This work is founded in part by the statutory funds (UPB) of the Department of Electrodynamics and Electrical Machine Systems, Rzeszow University of Technology and in the part by the Minister of Education and Science of the Republic of Poland within the “Regional Initiative of Excellence” program for years 2019–2022. Project number 027/RID/2018/19, amount granted 11 999 900 PLN. The article was presented during 16th International Conference Selected Issues of Electrical Engineering and Electronics WZEE 2021 (Rzeszow September 2021).
Conflicts of Interest
The authors declare no conflict of interest.
References
- Hu, Y.; Gan, C.; Cao, W.; Zhang, J.; Li, W.; Finney, S.J. Flexible fault-tolerant topology for switched reluctance motor drives. IEEE Trans. Power Electron. 2016, 31, 4654–4668. [Google Scholar] [CrossRef] [Green Version]
- Ro, H.-S.; Kim, D.-H.; Jeong, H.-G.; Lee, K.-B. Tolerant Control for Power Transistor Faults in Switched Reluctance Motor Drives. IEEE Trans. Ind. Appl. 2015, 51, 3187–3197. [Google Scholar] [CrossRef]
- Chen, H.; Chen, H.; Han, G.; Guan, G. Power Transistors’ Fault Diagnosis Method of SR S/G for More Electric Aircraft With Cross-Leg Current Analysis. IEEE Trans. Transp. Electrif. 2020, 6, 1528–1536. [Google Scholar] [CrossRef]
- Ullah, S.; McDonald, S.P.; Martin, R.; Benarous, M.; Atkinson, G.J. A Permanent Magnet Assist, Segmented Rotor, Switched Reluctance Drive for Fault Tolerant Aerospace Applications. IEEE Trans. Ind. Appl. 2018, 55, 298–305. [Google Scholar] [CrossRef] [Green Version]
- Tursini, M.; Villani, M.A.; Fabri, G.; Di Leonardo, L. A switched-reluctance motor for aerospace application: Design, analysis and results. Electr. Power Syst. Res. 2017, 142, 74–83. [Google Scholar] [CrossRef]
- Kabir, M.A.; Husain, I. Design of mutually coupled switched reluctance motors (MCSRMs) for extended speed applications using 3-phase standard inverters. IEEE Trans. Energy Conver. 2015, 31, 436–445. [Google Scholar] [CrossRef]
- Kiyota, K.; Kakishima, T.; Chiba, A. Comparison of Test Result and Design Stage Prediction of Switched Reluctance Motor Competitive With 60-kW Rare-Earth PM Motor. IEEE Trans. Ind. Electron. 2014, 61, 5712–5721. [Google Scholar] [CrossRef]
- Zhu, J.; Cheng, K.W.E.; Xue, X.; Zou, Y. Design of a New Enhanced Torque In-Wheel Switched Reluctance Motor with Divided Teeth for Electric Vehicles. IEEE Trans. Magn. 2017, 53, 1–4. [Google Scholar] [CrossRef]
- Zhu, Y.; Wu, H.; Zhang, J. Regenerative braking control strategy for electric vehicles based on optimization of switched reluctance generator drive system. IEEE Access 2020, 8, 76671–76682. [Google Scholar] [CrossRef]
- Cheng, H.; Wang, L.; Xu, L.; Ge, X.; Yang, S. An integrated electrified powertrain topology with SRG and SRM for plug-in hybrid electrical vehicle. IEEE Trans. Ind. Electron. 2019, 67, 8231–8241. [Google Scholar] [CrossRef]
- Choi, Y.K.; Yoon, H.S.; Koh, C.S. Pole-Shape Optimization of a Switched-Reluctance Motor for Torque Ripple Reduction. IEEE Trans. Magn. 2007, 43, 1797–1800. [Google Scholar] [CrossRef]
- Sheth, N.; Rajagopal, K. Optimum pole arcs for a switched reluctance motor for higher torque with reduced ripple. IEEE Trans. Magn. 2003, 39, 3214–3216. [Google Scholar] [CrossRef]
- Kermanipour, M.J.; Ganji, B. Modification in Geometric Structure of Double-Sided Axial Flux Switched Reluctance Motor for Mitigating Torque Ripple. Can. J. Electr. Comput. Eng. 2015, 38, 318–322. [Google Scholar] [CrossRef]
- Kusumi, T.; Hara, T.; Umetani, K.; Hiraki, E. Phase-current waveform for switched reluctance motors to eliminate input-current ripple and torque ripple in low-power propulsion below magnetic saturation. IET Power Electron. 2020, 13, 3351–3359. [Google Scholar] [CrossRef]
- Husain, M.E. Torque ripple minimization in switched reluctance motor drives by pwm current control. IEEE Trans. Power Electron. 1996, 11, 83–88. [Google Scholar] [CrossRef]
- Vujičić, V.P. Minimization of Torque Ripple and Copper Losses in Switched Reluctance Drive. IEEE Trans. Power Electron. 2012, 27, 388–399. [Google Scholar] [CrossRef]
- Li, H.; Bilgin, B.; Emadi, A. An Improved Torque Sharing Function for Torque Ripple Reduction in Switched Reluctance Machines. IEEE Trans. Power Electron. 2019, 34, 1635–1644. [Google Scholar] [CrossRef]
- Weiss, C.P.; Schoeler, S.; De Doncker, R.W. Direct instantaneous torque control for switched reluctance machines considering mutual coupling. J. Eng. 2019, 2019, 3701–3704. [Google Scholar] [CrossRef]
- Yan, N.; Cao, X.; Deng, Z. Direct Torque Control for Switched Reluctance Motor to Obtain High Torque–Ampere Ratio. IEEE Trans. Ind. Electron. 2019, 66, 5144–5152. [Google Scholar] [CrossRef]
- Brauer, H.J.; Hennen, M.D.; De Doncker, R.W. Control for Polyphase Switched Reluctance Machines to Minimize Torque Ripple and Decrease Ohmic Machine Losses. IEEE Trans. Power Electron. 2012, 27, 370–378. [Google Scholar] [CrossRef]
- Song, S.; Fang, G.; Hei, R.; Jiang, J.; Ma, R.; Liu, W. Torque Ripple and Efficiency Online Optimization of Switched Reluctance Machine Based on Torque per Ampere Characteristics. IEEE Trans. Power Electron. 2020, 35, 9608–9616. [Google Scholar] [CrossRef]
- Neuhaus, C.R.; Fuengwarodsakul, N.H.; De Doncker, R.W. Control Scheme for Switched Reluctance Drives with Minimized DC-Link Capacitance. IEEE Trans. Power Electron. 2008, 23, 2557–2564. [Google Scholar] [CrossRef]
- Yi, F.; Cai, W. Modeling, Control and Seamless Transition of Bi-directional Battery-Driven Switched Reluctance Motor/Generator Drive based on Integrated Multiport Power Converter for Electric Vehicle Applications. IEEE Trans. Power Electron. 2015, 31, 7099–7111. [Google Scholar] [CrossRef]
- Mohamadi, M.; Rashidi, A.; Nejad, S.M.S.; Ebrahimi, M. A Switched Reluctance Motor Drive Based on Quasi Z-Source Converter with Voltage Regulation and Power Factor Correction. IEEE Trans. Ind. Electron. 2017, 65, 8330–8339. [Google Scholar] [CrossRef]
- Bogusz, P. A switched reluctance motor control method limiting the maximum dc source current in the low-speed range. Bull. Pol. Acad. Sci. Tech. Sci. 2016, 64, 197–206. [Google Scholar] [CrossRef] [Green Version]
Figure 1.
Schematic diagram of an SRM power supply.

Figure 2.
(a) Phase currents, (b) phase torques (set), and (c) derivatives of phase torques.

Figure 3.
A block diagram of the torque control system.

Figure 4.
Waveforms of (a) phase currents, (b) phase torques, (c) main torque, and (d) source current for the CTMC method.
Figure 4.
Waveforms of (a) phase currents, (b) phase torques, (c) main torque, and (d) source current for the CTMC method.

Figure 5.
Waveforms of (a) phase currents, (b) phase torques, (c) main torque, and (d) source current for the DTMC(RC) method.
Figure 5.
Waveforms of (a) phase currents, (b) phase torques, (c) main torque, and (d) source current for the DTMC(RC) method.

Figure 6.
Waveforms of (a) phase currents, (b) phase torques, (c) main torque, and (d) source current for the DTMC(FC) method.
Figure 6.
Waveforms of (a) phase currents, (b) phase torques, (c) main torque, and (d) source current for the DTMC(FC) method.

Figure 7.
Stator deformation image at resonant frequencies of (a) 1265 Hz and (b) 3361 Hz.

Figure 8.
The block diagram of the laboratory test stand.

Figure 9.
View of the laboratory test stand.

Figure 10.
The block diagram of the speed control SRM drive.

Figure 11.
Oscillograms of phase (upper) and source (lower) currents: (a) CTMC, (b) DTMC(RC), and (c) DTMC(FC).
Figure 11.
Oscillograms of phase (upper) and source (lower) currents: (a) CTMC, (b) DTMC(RC), and (c) DTMC(FC).

Figure 12.
(a) RMS of source current and (b) total efficiency drive for CTMC, DTMC(RC), and DTMC(FC).
Figure 12.
(a) RMS of source current and (b) total efficiency drive for CTMC, DTMC(RC), and DTMC(FC).

Figure 13.
Oscillograms of phase currents for the control methods (a) CTMC, (b) DTMC(FC), and (c) DTMC(RC) determined at n = 1200 rpm and TL = 7.5 Nm.
Figure 13.
Oscillograms of phase currents for the control methods (a) CTMC, (b) DTMC(FC), and (c) DTMC(RC) determined at n = 1200 rpm and TL = 7.5 Nm.

Figure 14.
Oscillogram of test current (lower) and vibration acceleration (upper) recorded at (a) 1191.8 Hz and (b) 1302.9 Hz.
Figure 14.
Oscillogram of test current (lower) and vibration acceleration (upper) recorded at (a) 1191.8 Hz and (b) 1302.9 Hz.

Figure 15.
Dependence of the RMS value of acceleration aRMS on the frequency of current in the windings fi.
Figure 15.
Dependence of the RMS value of acceleration aRMS on the frequency of current in the windings fi.

Figure 16.
Vibration acceleration as a function of rotor speed under the torque load TL = 7.5 Nm.

Figure 17.
Distribution of the vibration acceleration harmonics (a) and phase currents (Iph1, Iph2, Iph3, Iph4) recorded for control methods (a) CTMC, (b) DTMC(RC), and (c) DTMC(FC) at 170 rpm with a load torque of 7.5 Nm.
Figure 17.
Distribution of the vibration acceleration harmonics (a) and phase currents (Iph1, Iph2, Iph3, Iph4) recorded for control methods (a) CTMC, (b) DTMC(RC), and (c) DTMC(FC) at 170 rpm with a load torque of 7.5 Nm.


Figure 18.
Distribution of the vibration acceleration harmonics (a) and phase currents (Iph1, Iph2, Iph3, Iph4) recorded for control methods (a) CTMC, (b) DTMC(RC), and (c) DTMC(FC) at 1150 rpm with a load torque of 7.5 Nm.
Figure 18.
Distribution of the vibration acceleration harmonics (a) and phase currents (Iph1, Iph2, Iph3, Iph4) recorded for control methods (a) CTMC, (b) DTMC(RC), and (c) DTMC(FC) at 1150 rpm with a load torque of 7.5 Nm.


Table 1.
Basic parameters of SRM.
| Switched Reluctance Motor | |
|---|---|
| Phase number | 4 |
| Poles stator/rotor number | 8/6 |
| Rated voltage | 48 V |
| Max. mechanical power | 3.3 kW |
| Rated speed | 4500 rpm |
| Stator pole width | 20° |
| Rotor pole width | 20.5° |
| Phase winding resistance | 14 mΩ |
Table 2.
Resonant frequencies of the SRM stator.
| Mod Number | Frequency (Hz)—Numerical |
|---|---|
| 1 | 1265 |
| 2 | 3361 |
| 3 | 5503 |
| 4 | 6650 |
| 5 | 8293 |
| 6 | 8964 |
Table 3.
Harmonics of the vibration acceleration and phase currents for n = 170 rpm.
| n = 170 rpm | CTMC | DTMC(RC) | DTMC(FC) |
|---|---|---|---|
| Parameter/f | 20 Hz/3.41 kHz | 20 Hz/3.41 kHz | 20 Hz/3.43 kHz |
| a (m/s2) | 0.046/24.44 | 0.057/22.2 | 0.052/37.4 |
| Iph1 (A) | 32.7/0.071 | 36.4/0.055 | 31.4/0.116 |
| Iph2 (A) | 36.3/0.227 | 36.7/0.221 | 35.9/0.235 |
| Iph3 (A) | 36.3/0.053 | 36.2/0.083 | 36.1/0.081 |
| Iph4 (A) | 27.4/0.243 | 22.6/0.136 | 29.0/0.289 |
Table 4.
Harmonics of the vibration acceleration and phase currents for n = 1150 rpm.
| n = 1150 rpm | CTMC | DTMC(RC) | DTMC(FC) |
|---|---|---|---|
| Parameter/f | 20 Hz/1.26 kHz | 20 Hz/1.26 kHz | 20 Hz/1.26 kHz |
| a (m/s2) | 1.88/56.9 | 2.18/47.4 | 1.88/54.8 |
| Iph1 (A) | 37.4/0.032 | 38.0/0.475 | 37.0/0.664 |
| Iph2 (A) | 37.3/0.051 | 37.9/1.03 | 37.1/0.922 |
| Iph3 (A) | 39.0/0.033 | 39.2/0.512 | 38.4/0.307 |
| Iph4 (A) | 39.5/0.058 | 40.3/0.548 | 39.3/0.366 |
Table 5.
Assignment of the control methods to speed ranges to achieve minimum losses in the power source.
Table 5.
Assignment of the control methods to speed ranges to achieve minimum losses in the power source.
| IsourceRMS Is Minimum | |
|---|---|
| Speed Range | Control Method |
| n < 300 rpm | DTMC(RC) |
| 300 ≤ n < 700 rpm | DTMC(RC) |
| 700 ≤ n < 950 rpm | DTMC(FC) |
| n ≤ 950 rpm | CTMC |
Table 6.
Assignment of the control methods to speed ranges to achieve maximum drive efficiency.
| Total Efficiency Is Minimum | |
|---|---|
| Speed Range | Control Method |
| n < 800 rpm | DTMC(RC) |
| n ≥ 800 rpm | DTMC(FC) |
Publisher’s Note: MDPI stays neutral with regard to jurisdictional claims in published maps and institutional affiliations. |
© 2021 by the authors. Licensee MDPI, Basel, Switzerland. This article is an open access article distributed under the terms and conditions of the Creative Commons Attribution (CC BY) license (https://creativecommons.org/licenses/by/4.0/).
Share and Cite
MDPI and ACS Style
Bogusz, P.; Korkosz, M.; Prokop, J.; Daraż, M. Analysis Performance of SRM Based on the Novel Dependent Torque Control Method. Energies 2021, 14, 8203. https://0-doi-org.brum.beds.ac.uk/10.3390/en14248203
AMA Style
Bogusz P, Korkosz M, Prokop J, Daraż M. Analysis Performance of SRM Based on the Novel Dependent Torque Control Method. Energies. 2021; 14(24):8203. https://0-doi-org.brum.beds.ac.uk/10.3390/en14248203
Chicago/Turabian StyleBogusz, Piotr, Mariusz Korkosz, Jan Prokop, and Mateusz Daraż. 2021. "Analysis Performance of SRM Based on the Novel Dependent Torque Control Method" Energies 14, no. 24: 8203. https://0-doi-org.brum.beds.ac.uk/10.3390/en14248203
Note that from the first issue of 2016, this journal uses article numbers instead of page numbers. See further details here.