
Performance Evaluation of an Evacuated Tube Collector with a Low-Cost Diffuse Reflector


Institute for Solar Energy Research Hamelin (ISFH), Am Ohrberg 1, 31860 Emmerthal, Germany
*
Author to whom correspondence should be addressed.
Energies 2021, 14(24), 8209; https://0-doi-org.brum.beds.ac.uk/10.3390/en14248209
Submission received: 18 October 2021
/
Revised: 25 November 2021
/
Accepted: 1 December 2021
/
Published: 7 December 2021
(This article belongs to the Special Issue Solar Thermal Collector)
Abstract
:In order to increase the overall solar energy gain of evacuated tube collectors, rear-side reflectors are used. In this way, the otherwise unused incident radiation between the tubes can be reflected back to the absorber, and the performance of the collector can be improved. In this paper, the use of a low-cost, diffusely reflecting, trapezoidal roof covering made from a galvanized metal sheet is investigated and compared to a high-quality, specularly reflecting plane reflector made of aluminum. For this purpose, ray-tracing analysis and TRNSYS simulations were carried out. In the ray-tracing analysis, the experimentally determined zero-loss collector efficiency η0 as well as the incident angle modifiers for each reflector can be reproduced with an error lower than 7.5%. Thermal system simulations show that the performance of both reflectors is comparable. The use of the low-cost reflector leads to an increase in annual collector output of around 30% compared to an increase with the specular reflector of around 33%. Considering a typical domestic hot water system, both reflectors enable an increase in the solar annual yield of approx. 11%.
1. Introduction
Rear-side reflectors are a commonly used way to increase the performance of evacuated tube collectors (ETC) by reflecting the otherwise non-usable incident solar energy between the evacuated tubes back to the absorber. Furthermore, the use of reflectors can lead to a reduction in the number of evacuated tubes while maintaining the same collector power output, which will result in a lower collector cost overall, since the reflector material is significantly cheaper than the evacuated tubes.
The disadvantage of using reflectors is the increased investment cost, a higher maintenance requirement as well as a higher wind and snow load [1]. In recent years, reflectors have been mainly designed to improve their performance, e.g., by improving the geometry or the material properties, but not to decrease their cost. With the reduction of the reflector cost, the investment cost for the solar thermal collector and thus the levelized cost of heat (LCoH) [2] can be reduced. This can be achieved through several methods, like the use of cheaper reflective material, a more manufacturable geometry or by the use of alternative elements that were not actually intended for use as reflectors.
This paper presents ray-tracing simulations using both a low-cost, diffusely reflecting reflector, which is commonly used as a roof covering, as well as a high-quality, directly reflecting reflector. The diffuse reflector is eight times cheaper than the directly reflecting reflector. Due to its trapezoidal geometry, the diffuse reflector does not need additional mounting support to keep the reflector in shape (as is the case with, e.g., CPC reflectors). Furthermore, if the roof for the solar thermal installation is already equipped with the same or a similar roof covering, there is no need for an additional reflector.
The results were validated experimentally using thermal performance measurements on selected collectors in accordance with ISO EN 9806:2017 [3]. The influence of the rear reflectors on collector yield (annual collector output) as well as on annual yield in a typical solar thermal domestic hot water system (SDHW) was investigated by means of simulations based on the measured collector parameters.
The use of reflectors in commercially available ETCs represents today’s state of the art. In 1976, NASA started a project to increase the performance of an ETC working with air made by Owens-Illinois [4]. They used two different types of diffuse reflectors (DR). The first one was made of a white-painted aluminum, while the second one was made of white vinyl sidings. They investigated the effect of the tube spacing both theoretically and experimentally, resulting in a maximum daily collector efficiency at a tube spacing of 1.5–2 times of the tube diameter [5]. In 1980, O’Gallagher et al. [6] investigated different types of rear-side reflectors for ETCs with cylindrical absorbers, but largely focused on concentrating reflectors. Window et al. released a study in 1981 in which both diffuse and specular reflectors (SR) were used and evaluated [7,8]. For the DR, they used a flat, white- painted reflector and for the SR, they used a compound parabolic collector (CPC) made of aluminum. The maximum collector efficiency occurred at a tube spacing of around 1.5 for both reflector types. Under these geometrical conditions, the SR led to a higher efficiency (in comparison with the DR) of around 6.5%. Geometric variations were also carried out for the diffuse reflector in respect to the distance between the tubes and the reflector. For a given tube spacing of 2 times the tube diameter, the maximum collector efficiency was found at 1.3 times the tube diameter, with a small influence on increasing reflector distances. Chow et al. [9,10] found similar results, but with a closer look at the optical properties of the components used. In more recent times, Milani and Abbas [11] gave a good overview of the scientific work conducted in recent decades regarding rear-side reflectors. They investigated flat diffuse-reflecting rear-side reflectors and provided recommendations about the best tube spacing (3.0) and reflector distance (1.5) for a given tube diameter. Depending on different locations in Australia, the use of a reflector, as well as the adjustment of tube distances, led to an increase in solar energy gain of a domestic hot water system of up to 28% compared to a collector without a reflector. Kalogirou [12] predicted, without giving any more detailed information, an increase in the absorbed energy of each tube of more than 25% for normal irradiance by using rear-side reflectors. Furthermore, the resultant increase in the solar energy yield for one day with the given configuration is about 10%. Dubey and Arora [13] used a diffusely reflecting flat plate on the rear-side of an ETC for a solar still system. The enhancement in daily condensate yield was found to be approx. 15% compared with the system without a reflector.
The literature review has shown, that in most cases, specular reflectors in different variations or flat diffuse reflectors were investigated, but for the reduction of the collector cost, the use of a cost-efficient reflector is necessary. The diffuse reflector we propose consists of a sheet of metal commonly used as a roof covering. It is therefore manufactured for the mass market and is characterized by its low production cost. Therefore, the influence of this reflector on the thermal performance of an evacuated tube collector has to be investigated in order to evaluate potential cost savings for the solar thermal market.
In Section 2, we simulated the collector in a ray-tracing program and investigated the performance as well as its angular dependence for different reflector geometries and materials. Based on this investigation, we were able to perform thermal system simulations with TRNSYS in Section 3 and to evaluate the influence of the different reflectors when used in a typical domestic hot water system.
2. Ray-Tracing Analysis
2.1. Simulation Model
In order to evaluate the performance of an evacuated tube collector using different rear-side reflectors, a ray-tracing model was first created with the program Zemax OpticStudio [14]. For the radiation source, a black body spectrum from 400–2000 nm with a simulated wavelength step of 10 nm was used. The maximum interactions per ray was 1000 with a maximum number of segments of each ray of 5000.
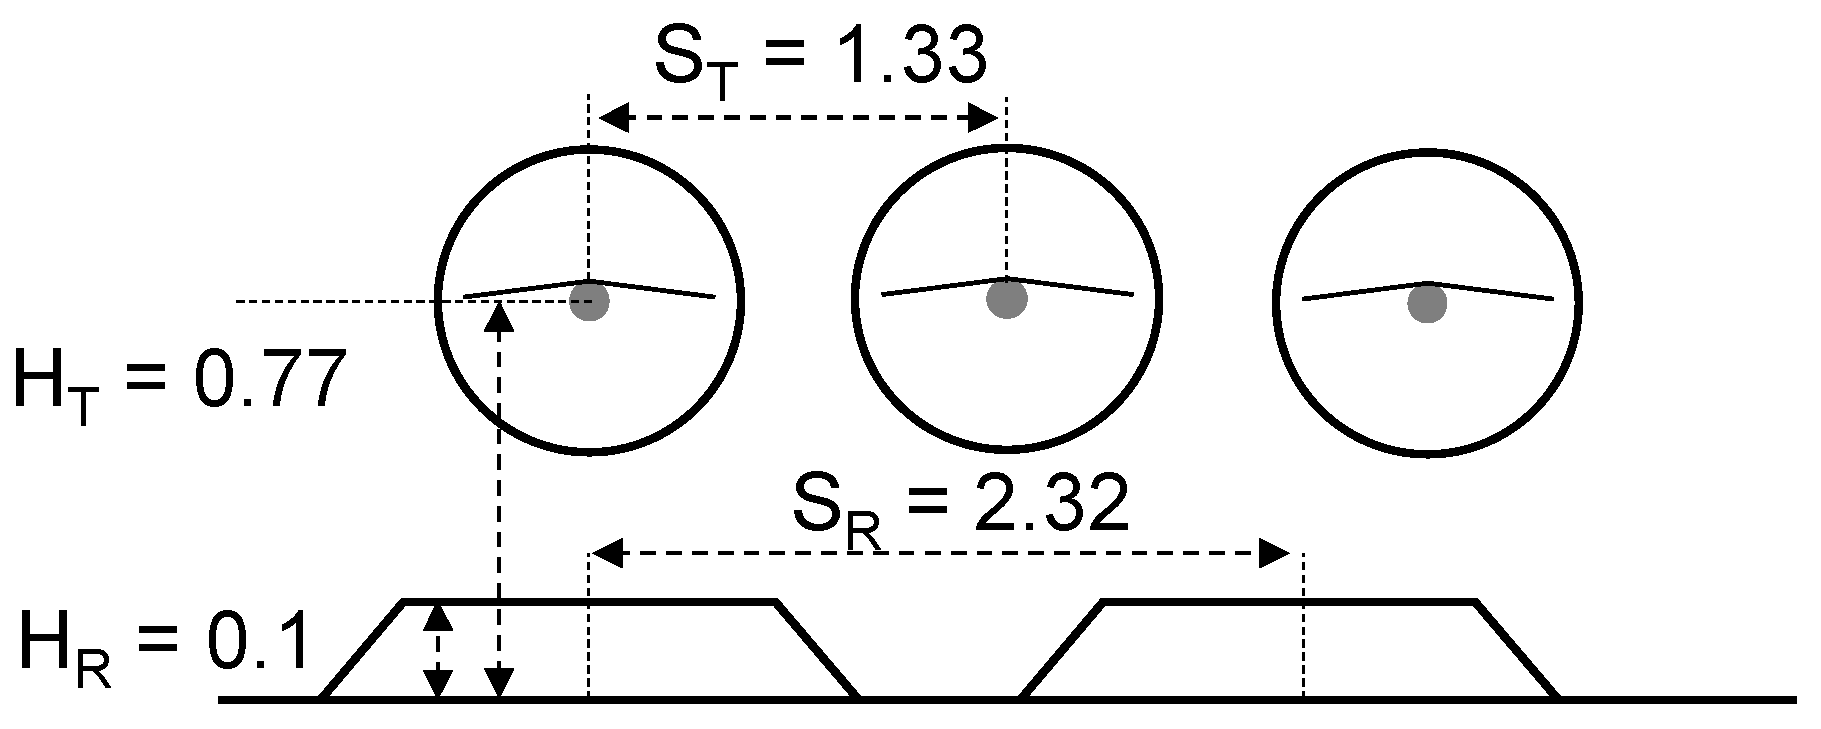
The geometric specifications in respect to the outer tube diameter of 56.5 mm are shown in Figure 1. The wall thickness is 1.8 mm, and the length of the evacuated tube is 1930 mm.
The main reflector properties are shown in Table 1 and were measured with an Ulbricht sphere. The trapezoidal geometry is a galvanized, low-cost, diffusely reflecting sheet metal which is usually used as a roof covering. Therefore, the spacing of the trapezoidal valleys does not match the distances of the vacuum tubes. Planar geometry is used for the simulation of a smooth, specular-reflecting reflector made of aluminum, as well as for the simulation of a black polymeric rear-side as a reference.
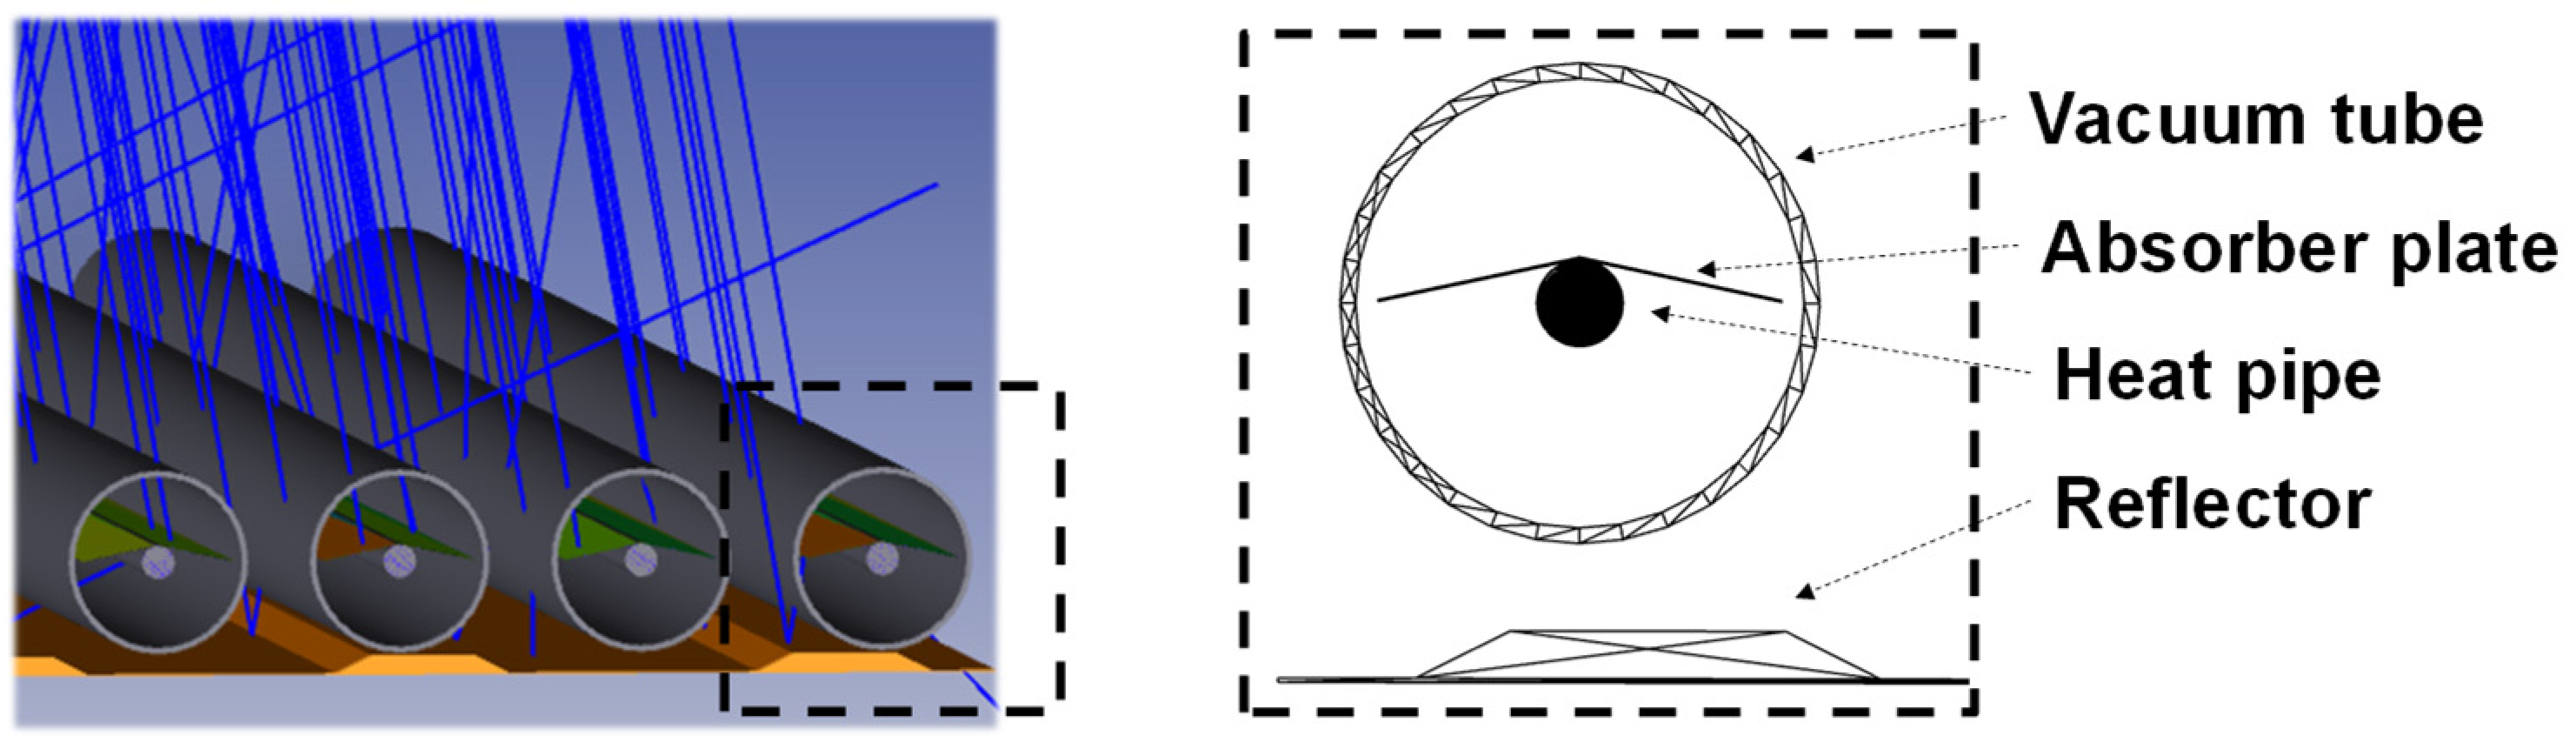
In the ray-tracing model (Figure 2), the components, including the glass cylinder (evacuated tube), absorber plate, heat pipe and the corresponding reflector geometry with the associated optical properties, are mapped.
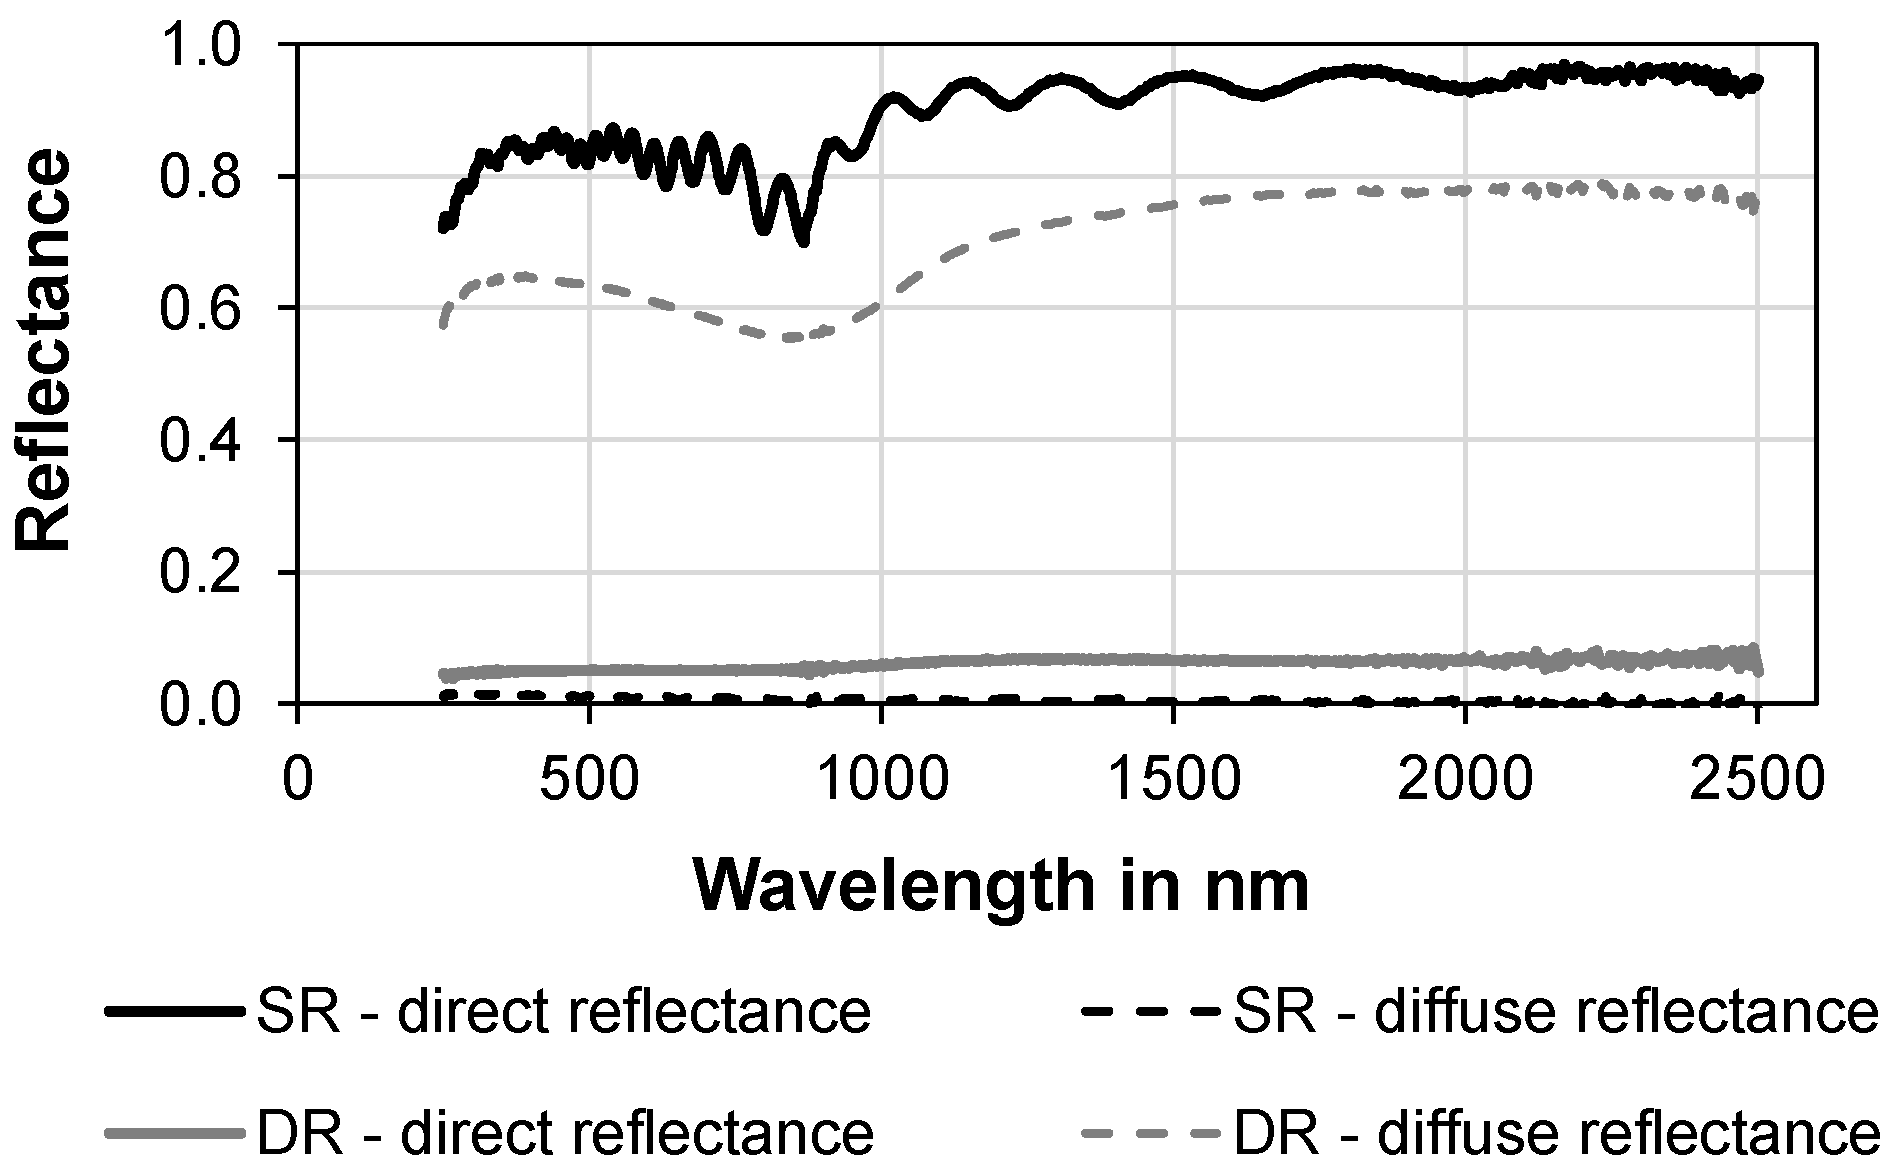
The reflectance properties of the reflectors were experimentally determined in advance of the simulation and are spectrally resolved for all samples (Figure 3). An angle-dependent reflectance measurement of the reflectors was not performed, so the behavior could not be implemented in the ray-tracing model. Therefore, the specular and diffuse reflectance values in the model remain constant for all the irradiation angles considered.
The scattering of the reflected radiation is modeled by Lambertian distribution. For the other components (Table 2), either simple approaches of absorptance, transmittance and reflectance without dependence on the spectral distribution or the angle of incidence are used (absorber plate + heat pipe) or the material information provided by the simulation program was used (glass cylinder). In this last case, the spectral and angle-dependent behavior of the optical properties are calculated by using the refractive index.
2.2. Validation of the Simulation Model
Two factors serve as evaluation criteria for the ray-tracing simulation: the zero-loss collector efficiency η0 for the performance under normal irradiation and the transverse IAM factor (incidence angle modifier) for the evaluation of collector behavior for different irradiation angles.
The efficiency curve η of an ETC is described by the ratio of the power discharged by the collector and the product of the gross collector area and the irradiance , as well as with the collector efficiency factor F’, the collector loss coefficient and the difference of the fluid inlet and outlet temperatures ΔT (Equation (1)).
In accordance with Duffie and Beckmann [19] (p. 294), can also be described by the product of F′ and the transmittance-absorptance product (τα) (Equation (2)).
The ray-tracing simulation does not consider any thermal behavior (F’ is not considered). Thus, for the simulation with the power absorbed at the absorber plate and, therefore, for all the following, the following results apply:
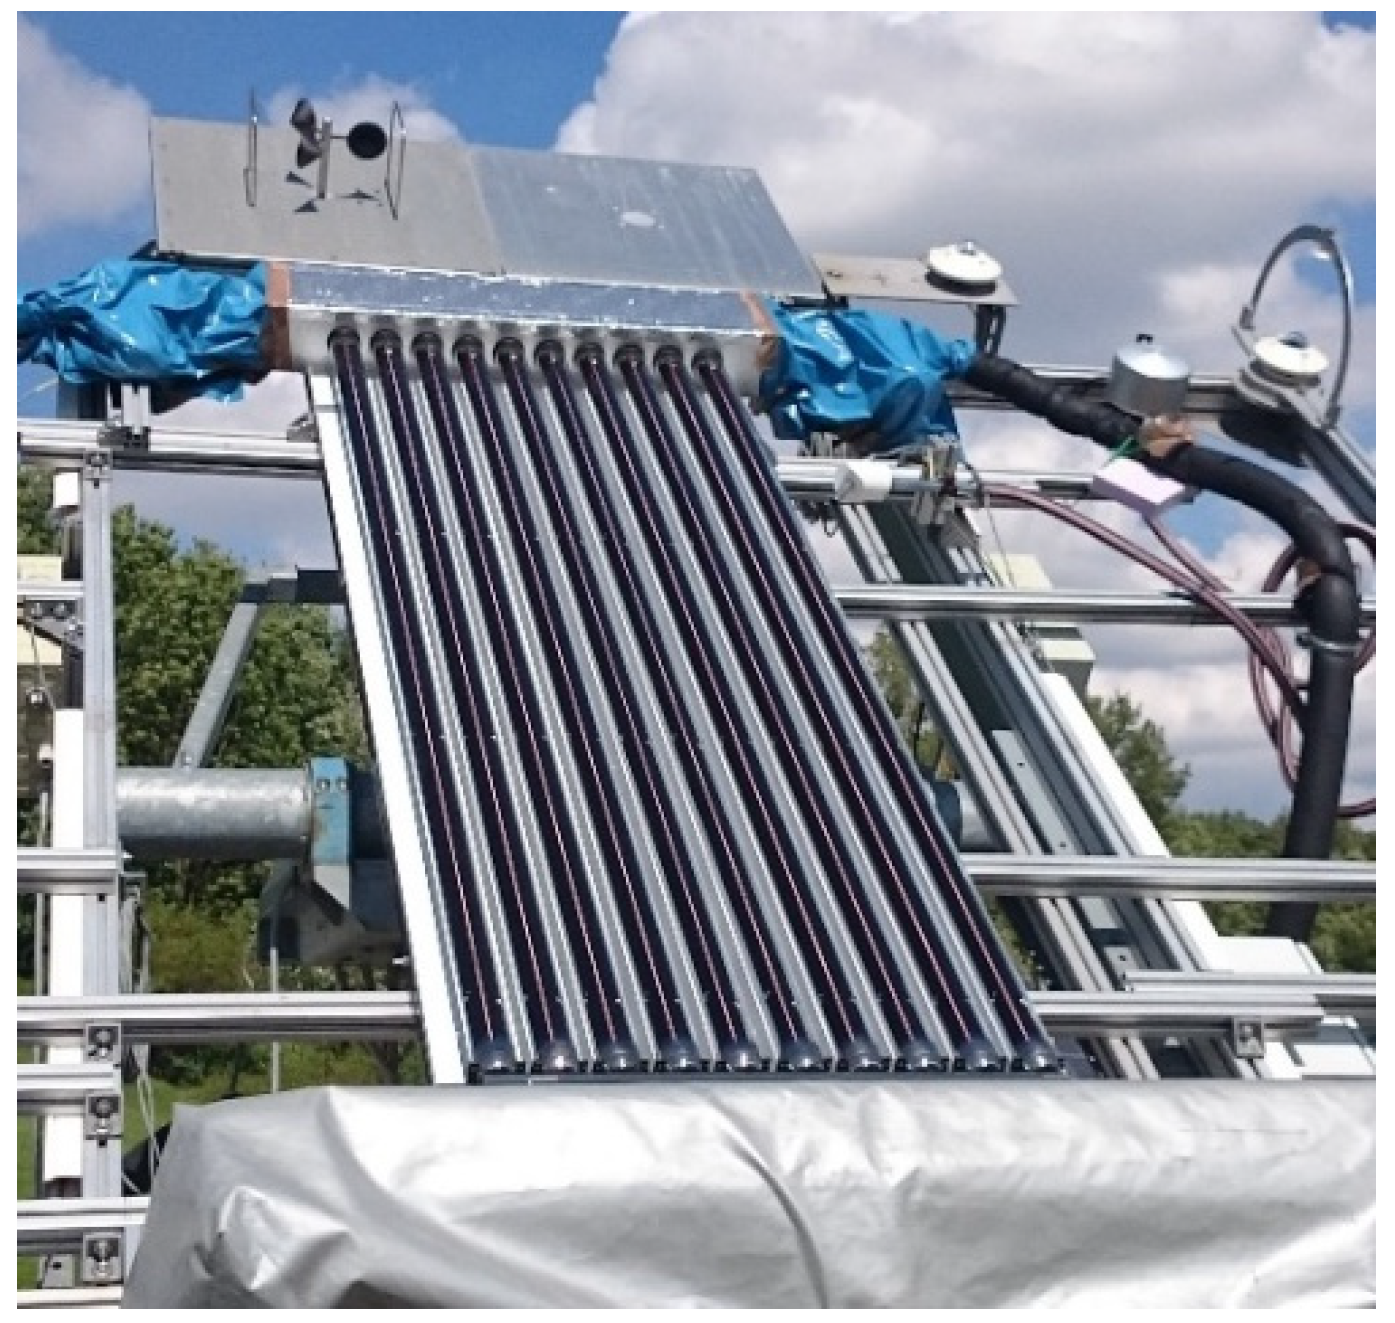
For the validation of the ray-tracing simulation, measurements of the zero-loss coefficient and the IAM behavior of the different reflectors were carried out experimentally in accordance with DIN EN ISO 9806:2018-04 [3] (Figure 4). Thus, real measurement data are available for the evaluation of the simulation to provide a basis for comparison (cf. Table A1 in Appendix A).
The evaluation of the ray-tracing simulation was script-based and covered transverse irradiation angles from 0° (normal irradiation) up to 60°, as measurement data are available for this irradiation range. With a corresponding increase in the irradiance power of the radiation source it was ensured that at each irradiation angle, the same irradiance power of 1000 W/m2 reached the surface of the collector. In this way, we were able to investigate the influence of the reflectors on optical collector behavior.
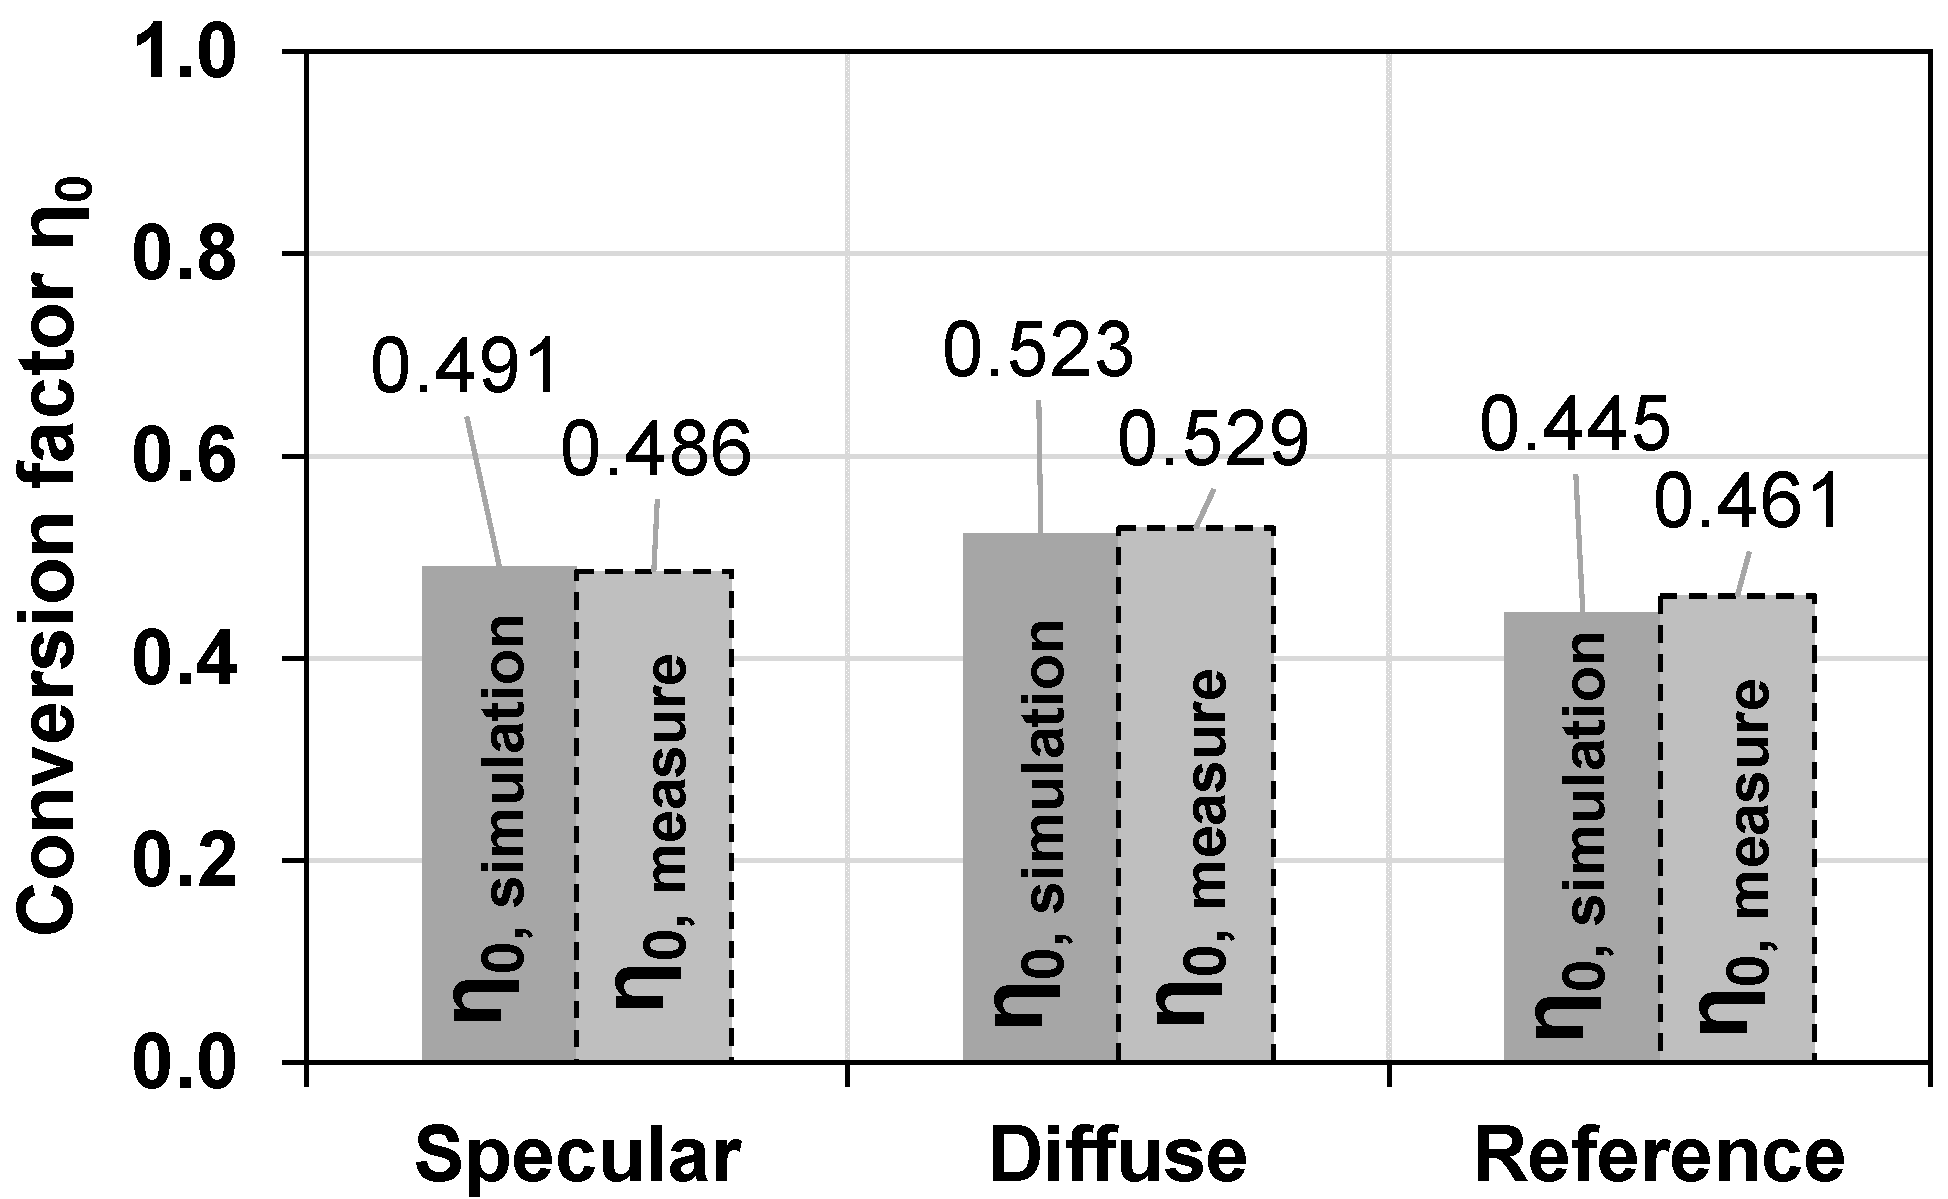
The values obtained in the simulation for (τα) are related to the values measured for η0 in accordance with Equation (2) via F’. This usually has values greater than 0.9 [19,20]. For the results presented here, F’ values of 0.95 were assumed, regardless of the reflector geometry. As shown in Figure 5, the simulated zero-loss coefficient values for normal incidence coincide well with the measurement data.
Even if the specular reflector shows a lower conversion factor in comparison with the diffuse one, the specular reflector exhibits its improved performance at higher incidence angles, as shown in the next section focusing on the IAM factor. The IAM factor is determined in accordance with Equation (4) as the ratio of the irradiated absorbed power at a certain angle and the irradiated absorbed power in the normal case . This is also calculated without thermal influences and only based on the optical collector simulation.
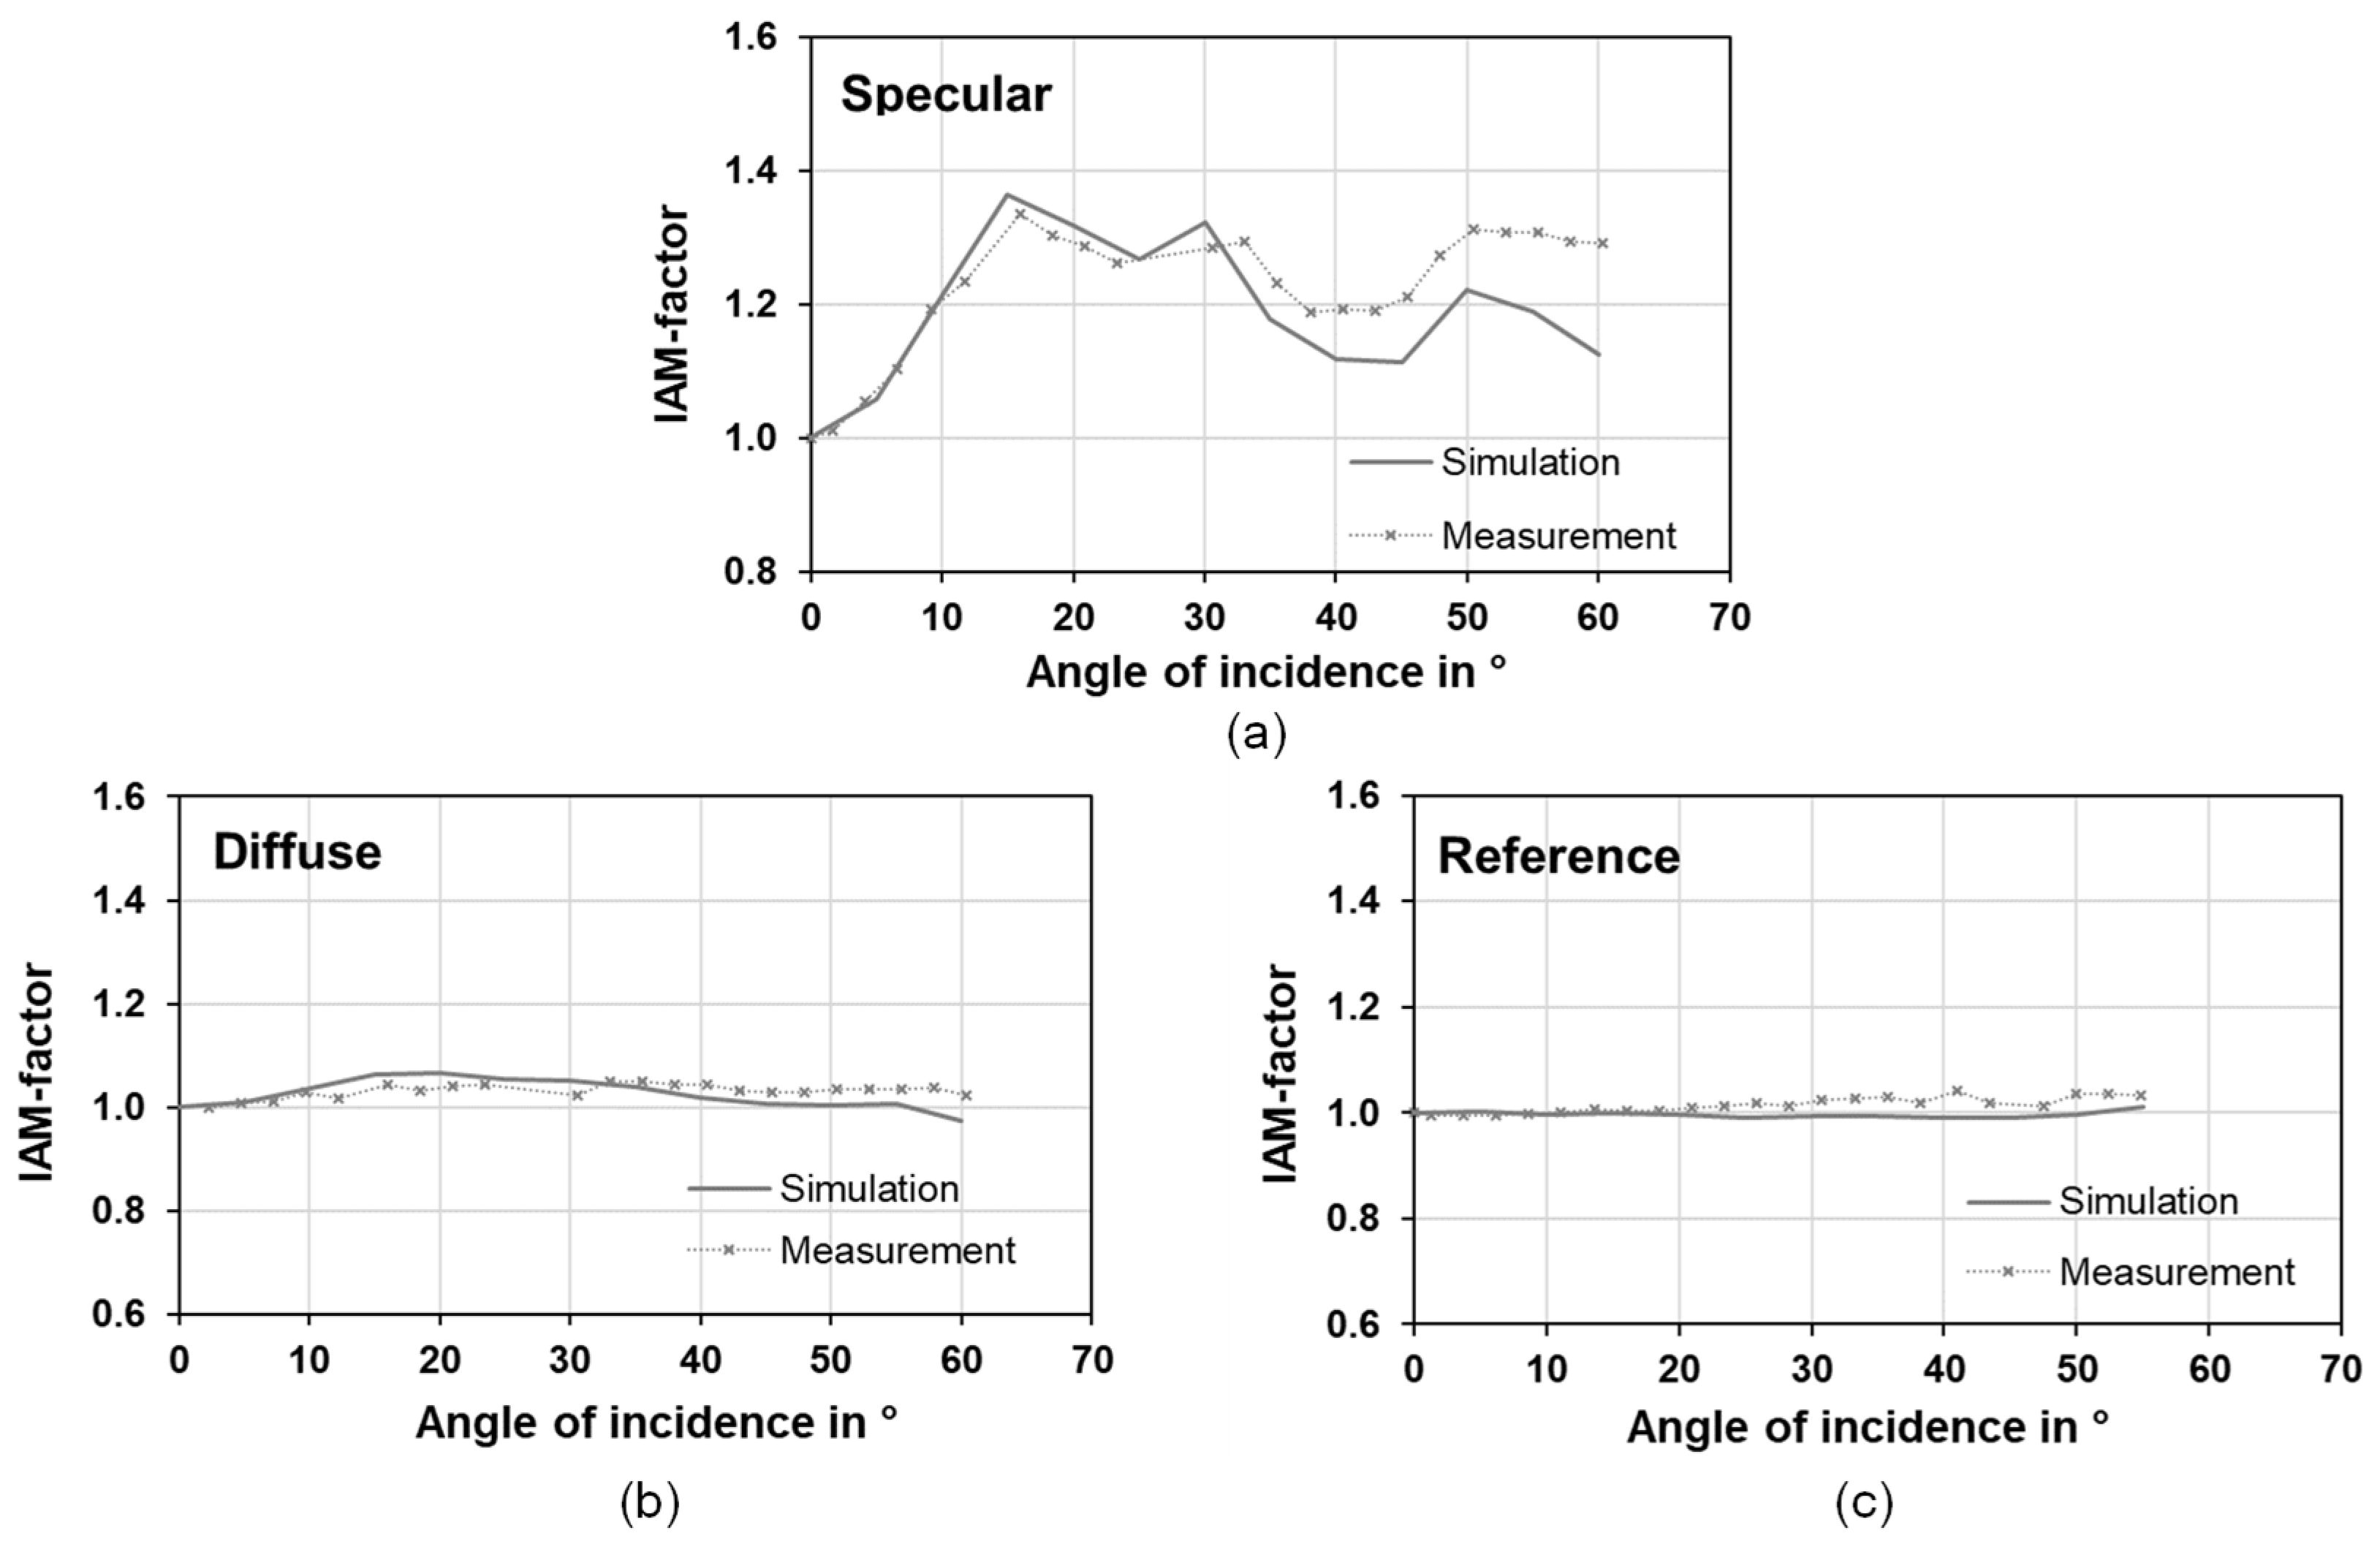
When considering the IAM values for inclined irradiation on the collector plane, the simulation results for all the reflectors show a good coincidence with the measured values up to an incidence angle of approx. 30° (c.f. Figure 6 and Table 3).
At larger irradiation angles, the simulations show higher deviations, but still represent the profile of the measured IAM factor. The calculated deviations result from the uncertainties in the model parameters used. The only spectrally resolved reflectance data used are those for the reflectors and the glass cylinder.
The glass cylinder is the only component that shows a dependence on the angle of incidence, so that variations in the absorptance or reflectance behavior are not represented for the other components. Ignoring the thermal behavior of the components (radiation absorption in glass, absorber, heat pipe and reflector) also leads to uncertainties. In addition, the recorded collector measurement data contain uncertainties which, in accordance with Weißmüller et al. [21], can account for up to 4.5%.
2.3. Variation of Collector Geometry
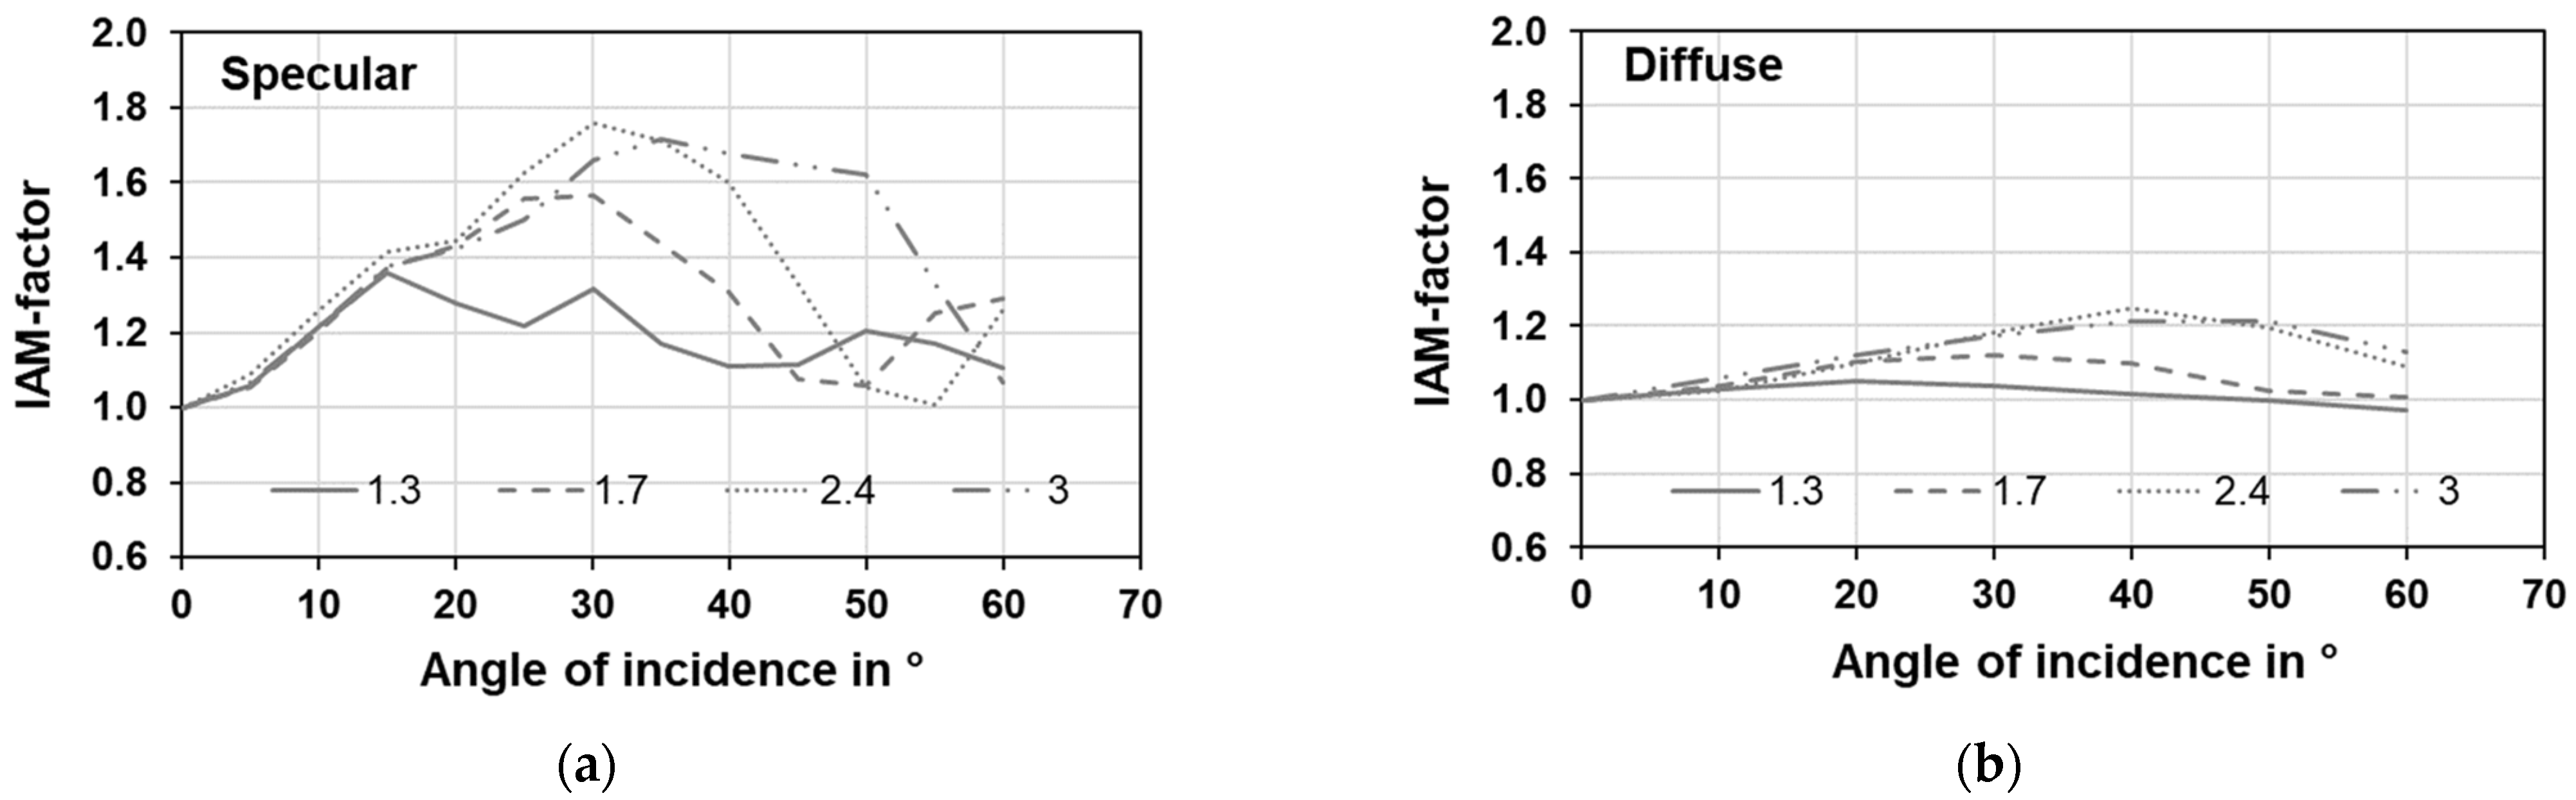
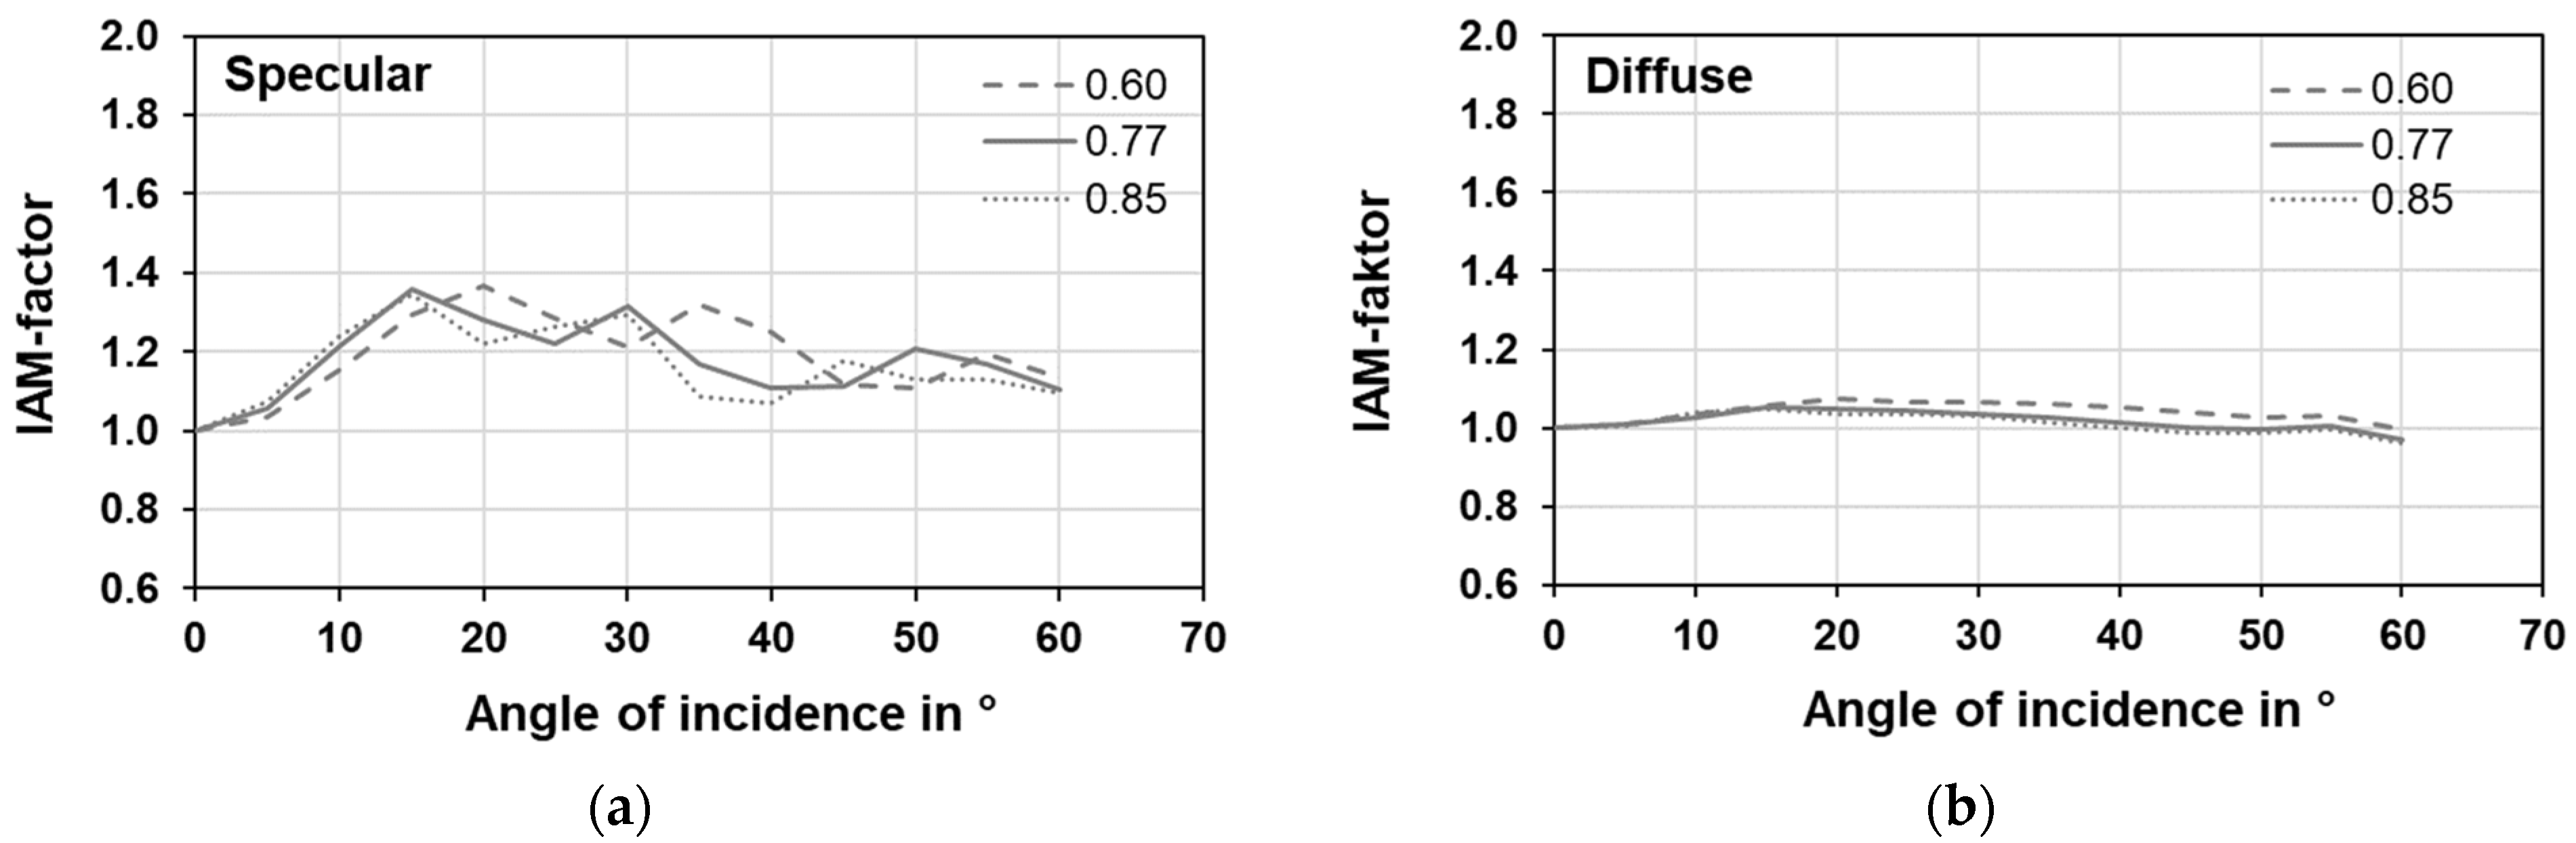
In further simulations, geometry variations were carried out to investigate the influence of the distance between the tubes and the distance from the tubes to the reflector (see Figure 1 for the original geometry). The tube distance was increased by reducing the number of vacuum tubes while maintaining the same collector gross area (and therefore also the reflector area). Figure 7 shows the results of geometry variation when using the specular and the diffuse reflector. Tube spacing is given with respect to the outer tube diameter. As expected, the IAM factor increases for both reflectors when using a greater tube spacing, since a larger portion of the radiation can be reflected by the reflector onto the absorber [1]. Only for large angles of incidence this effect does not occur due to the self-shading effect of the tubes. The diffuse reflector also shows an overall increase in the IAM factor with decreasing tube numbers, but to a much lesser extent. Up to an incidence angle of approx. 15°, the IAM factors correspond well when the number of tubes is varied; at larger incidence angles, the results are visibly different.
The variation of the reflector tube distance has a small influence and shifts the IAM factors only slightly. This corresponds well with the statement of Theunissen and Beckmann [22] and Milani and Abbas [11] that a diffuse rear-side reflector has a slightly low influence on the collector’s performance if and . This also corresponds well with the results of Chow et al. [9] that the collector’s performance increases slightly with a lower collector-reflector distance. Figure 8 shows the curve of the IAM factor for the specular and the diffuse reflector with variation of the distance.
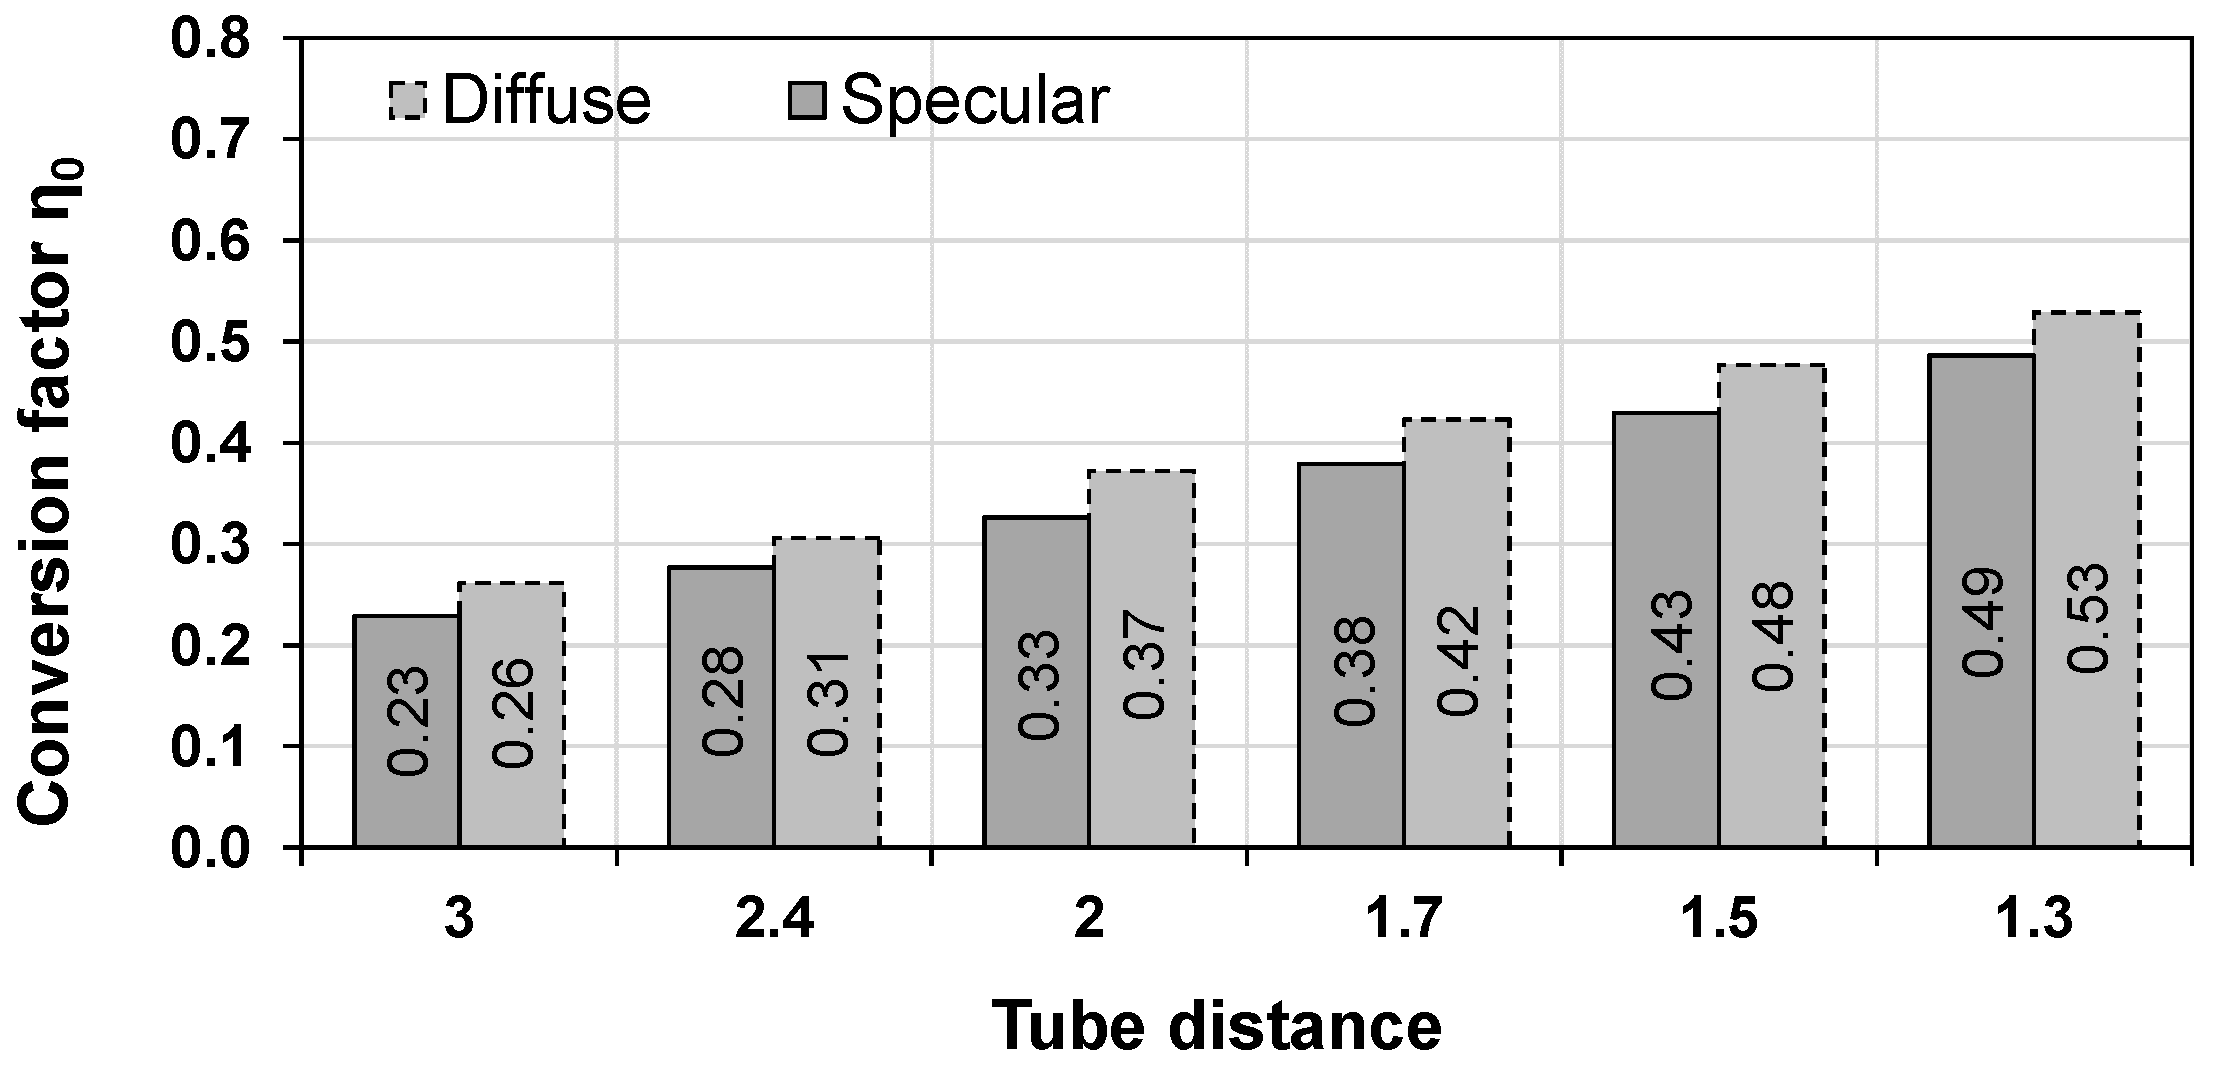
In order to additionally analyze the impact of the geometry variations in the system simulation, the influence of the tube distance (=number of tubes) on η0 has to be investigated. We checked if η0 is proportional to the specific aperture area, even by using reflectors. Figure 9 shows the almost linear dependency of the simulated η0 values for the specular and diffuse reflector on the tube distance. Thus, based on the ray-tracing results, a proportional relationship between the simulated η0 values and the aperture area is assumed for the following TRNSYS simulations.
3. TRNSYS Simulation: Annual Collector Output and System Simulation
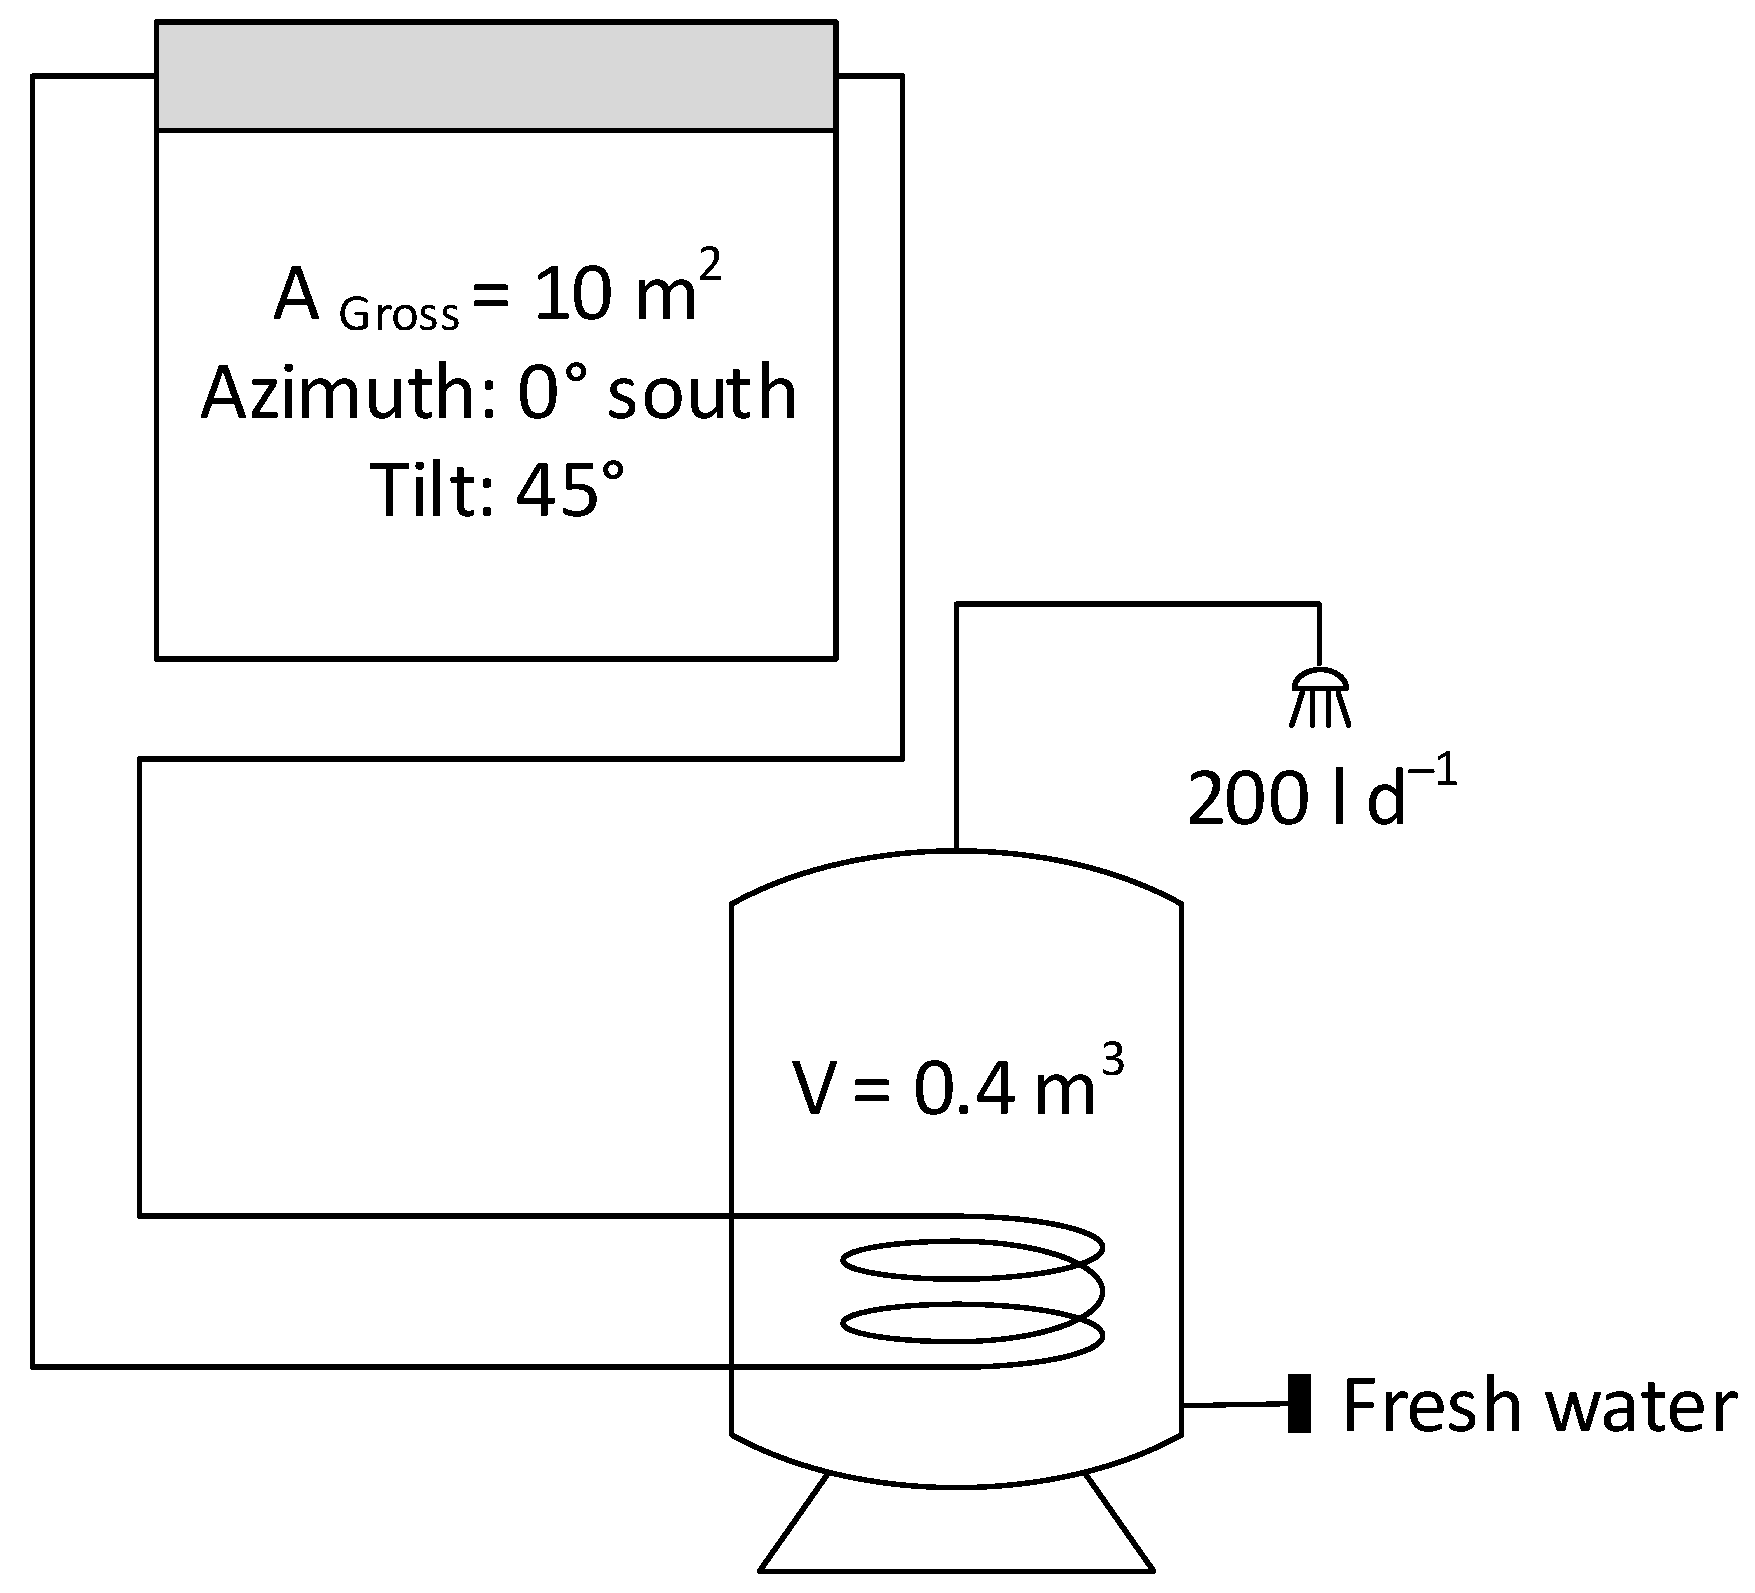
The simulations for the annual collector output and the system yield were both carried out with the TRNSYS simulation tool for the location of Würzburg (Germany). The non-standard TRNSYS types as well as the weather data used in the simulations are shown in Table A2 in Appendix A. The simulated domestic hot water system (Figure 10) is characterized by the boundary conditions listed in Table A3 in Appendix A.
The collector simulated is a heat-pipe collector with a temperature limitation of 125 °C. All collector characteristic values used for the simulation were derived from a real test system and can be found in Table 4. The used collector type 832 was intentionally developed by Perers and Bales [23] and was further developed by Schiebler et al. [24] to represent the heat pipe dry-out effect and thus the temperature limitation of the collector. The IAM factors used correspond to the results of the previous investigations (Section 2), which showed that the IAM factors of the different reflectors can be simulated with maximum deviations of approx. 4.5%.
The IAM-factors can be simulated with greater accuracy at small irradiation angles than at large irradiation angles (cf. Figure 6 in Section 2). In order to consider this effect, the influence of the deviating IAM factors on the simulation results is examined. For this purpose, a further data set with scaled IAM factors was created in addition to the previous simulated IAM-factors. This represents the deviations shown in Table 3 between measurement and simulation data for the whole angular range. Figure 11 shows this procedure exemplarily for the specular reflector.
The value assumed for the deviation is based on the average occurring deviations between measured data and simulation results (cf. Table 3), and thus, it also considers the investigation conducted by Weißmüller et al. [21]. This comprehensive comparison between European test institutes already shows a maximum deviation of 4.5% between the participating institutes in the determination of the IAM factors.
3.1. Annual Collector Output
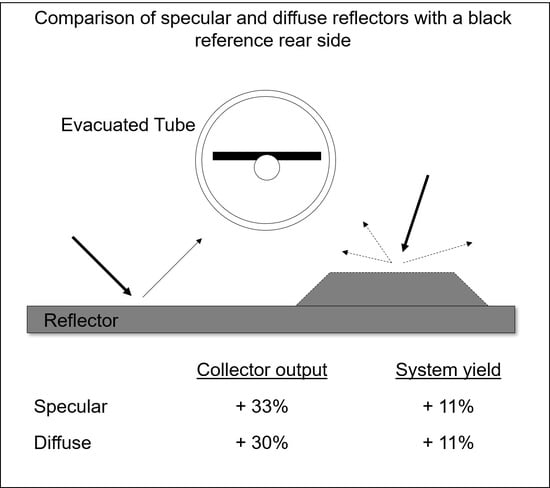
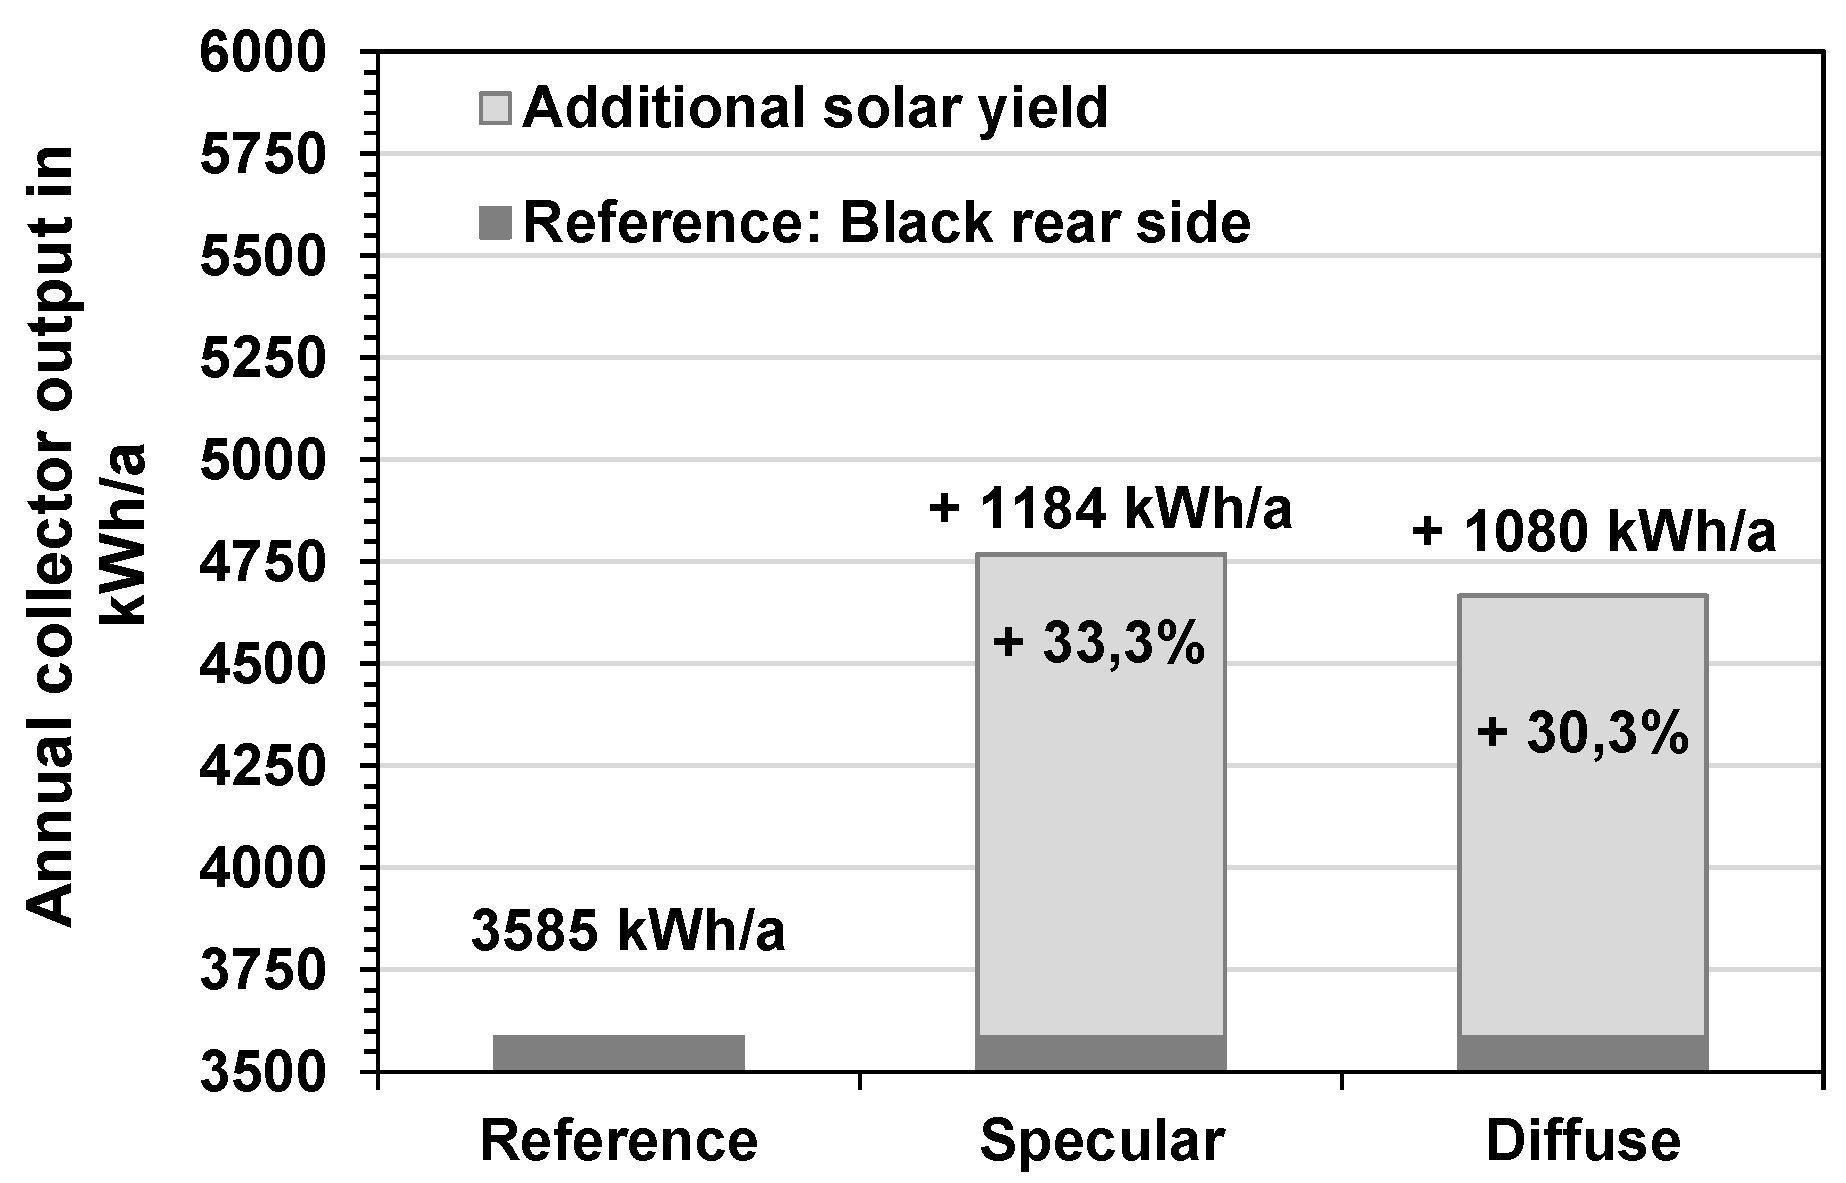
The annual collector energy output allows a first, simplified estimate of the efficiency of the collectors. This is primarily used by testing institutes and certification bodies in order to enable the comparison of different types of collectors under different weather conditions. The calculation assumes a constant load and a constant operating temperature over the course of the year. The corresponding simulations were carried out for the location Würzburg (Germany) with an operating temperature of 50 °C and an aperture area of about 6 m2. Through the use of the reflectors, a significant increase in the annual solar yield could be achieved (Figure 12). Compared to the black reference rear-side, the specular reflector leads to an increase of approximately 33%, while the diffuse reflector leads to an increase of approximately 30%. Under consideration of the different boundary conditions used, this result corresponds well to the investigations of diffuse reflectors by Milani and Abbas [11] (+28%) and Kalogirou [12] (+25%).
Simulations with scaled IAM factors (Table 5) show changes in yield of approximately ±2.5% for the specular reflector and ±1.4% for the diffuse reflector result. Thus, the influence of the simulated IAM factor deviations on the annual collector output is small.
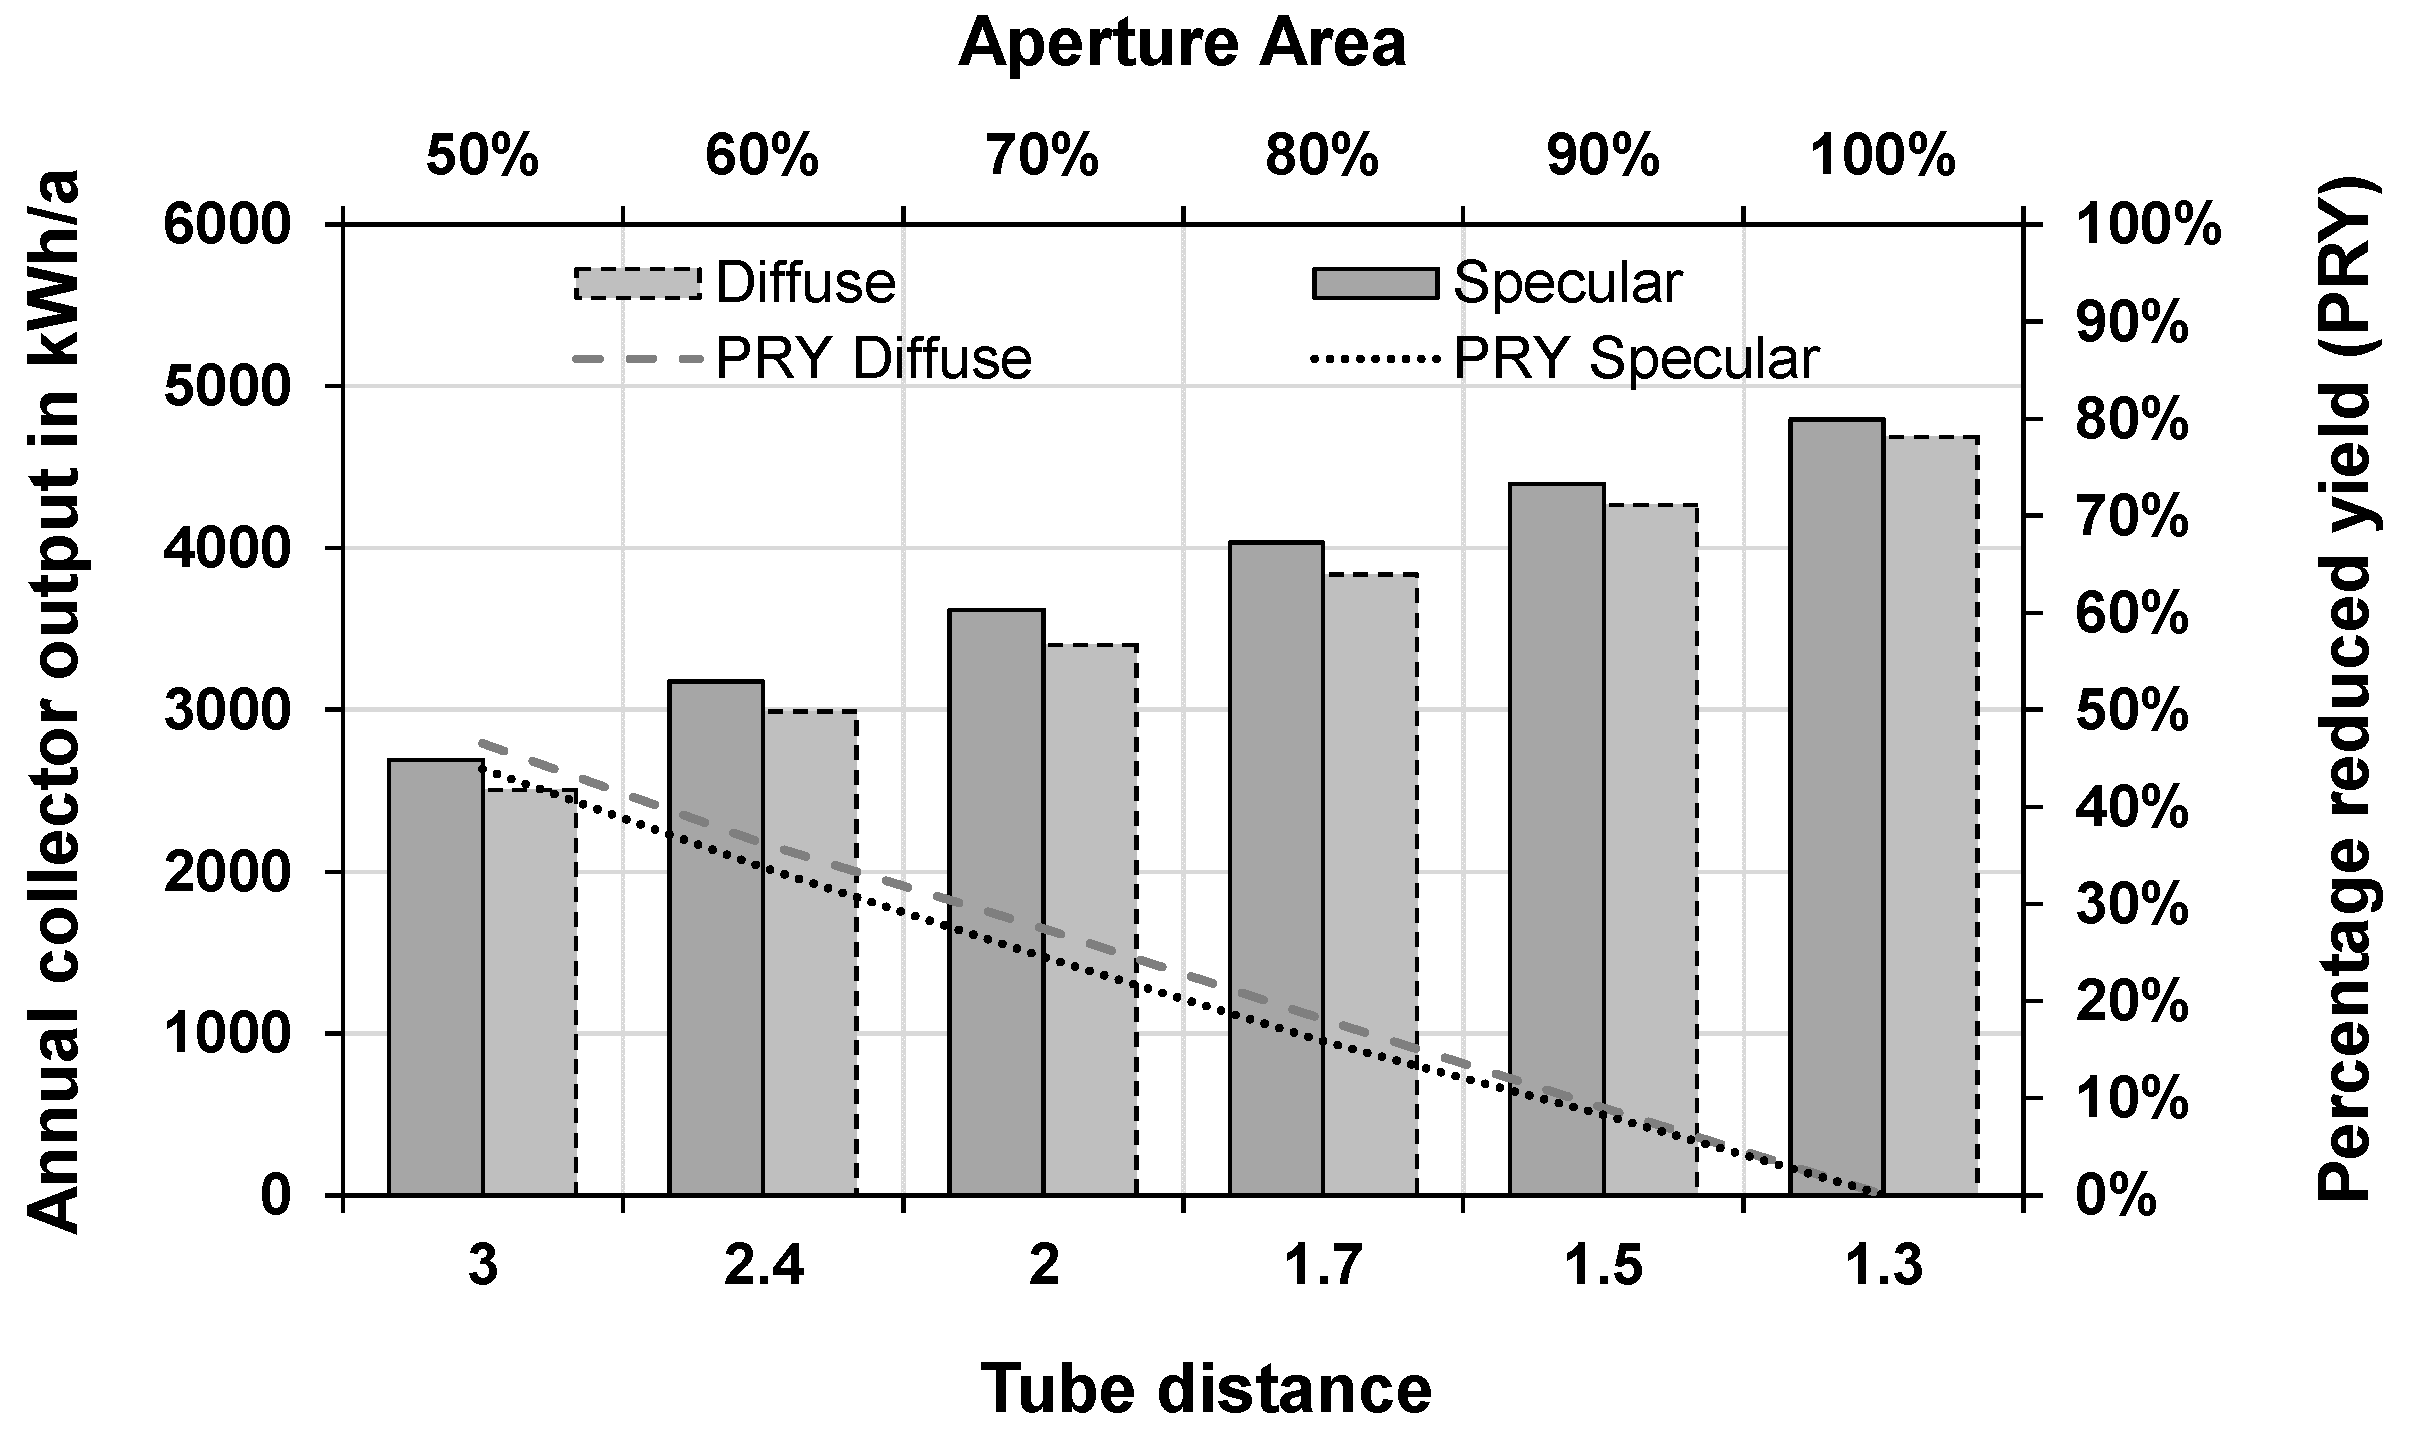
Regarding the geometry variations (cf. Section 2.3), the tube distance was scaled between 1.3 and 3 times the outer tube diameter (which corresponds to the original configuration of 60 tubes (100%) and a reduced amount of 30 tubes (50%)) for both reflector configurations. Due to the increased reflectance, when the tube distance is increased, the loss in solar annual yield does not increase proportionally to the decrease in surface area (Figure 13). For a 10% reduction in the aperture area, the loss in yield is approximately 8% for the specular and 9% for the diffuse reflector. The yield loss with a 50% reduction in area is 44% for the specular reflector and 46.5% for the diffuse reflector.
The simulation shows that the use of a rear-side reflector increases the annual collector energy output significantly, which particularly affects large-scale solar systems (e.g., solar district heating). Furthermore, the reflectors can, in comparison with the original configuration (3585 kWh), be used to maintain the same annual collector output while reducing the number of tubes. A collector with a number of tubes reduced by 30% will lead to an annual collector output of approximately 3600 kWh (specular) or 3400 kWh (diffuse).
3.2. System Simulation of a Solar DHW System
Especially in solar small-scale systems, the solar yield is reduced by so-called “system-related effects”. These include, for example, stagnation, the state of thermal storage, control behavior or other unpredictable events. In order to evaluate the different reflectors in a solar small-scale system with the limitation of system-related effects, the annual system yield of a standard domestic hot water system for the location of Würzburg and with the aforementioned collector characteristics was simulated with TRNSYS. All the necessary simulation parameters can be taken from Table A3 in Appendix A.
Figure 14 shows the comparison between the system yields using the different reflector geometries. First of all, it should be pointed out that the difference in system yield between the specular and the diffuse reflectors is extremely small, at approximately 2% (6 kWh), although the specular reflector has a significantly better reflectivity and also achieves a higher annual collector output.
Due to the system-related effects, the advantage of the specular reflector over the diffuse reflector in the system is limited. For the diffuse reflector configuration, the overall operation time of the solar pump is about 3% (around 50 h) longer in comparison with the specular reflector configuration, but both systems will reach the same solar yield at the end of the day. Therefore, it can be concluded that, on the one hand, the specular configuration reaches stagnation faster than the diffuse configuration. On the other hand, the specular configuration will start its solar operation later, since the storage temperature is higher.
Table 6 shows the results of both the original system simulation and the simulation with scaled IAM factors. The influence of the simulated IAM factor deviations on the system simulation are at ±0.7% (specular) and ±0.4% (diffuse), even smaller than for the annual collector output.
The aperture area (number of tubes) of the collectors was also reduced for the DHW system. Figure 15 shows the annual solar system yield, analogous to the collector yield, for the DHW system with a decreasing aperture area. The difference between the specular and diffuse reflectors in annual solar yield increases steadily with a reduction in the aperture area. In contrast to annual collector yield, the percentage yield reduction is not proportional to the reduction in area. For a reduction in aperture area of 10%, specular and diffuse reflectors only show a reduced yield of about 3%. The reduced yield with a 50% reduction in area is 25% (specular) and 27.5% (diffuse).
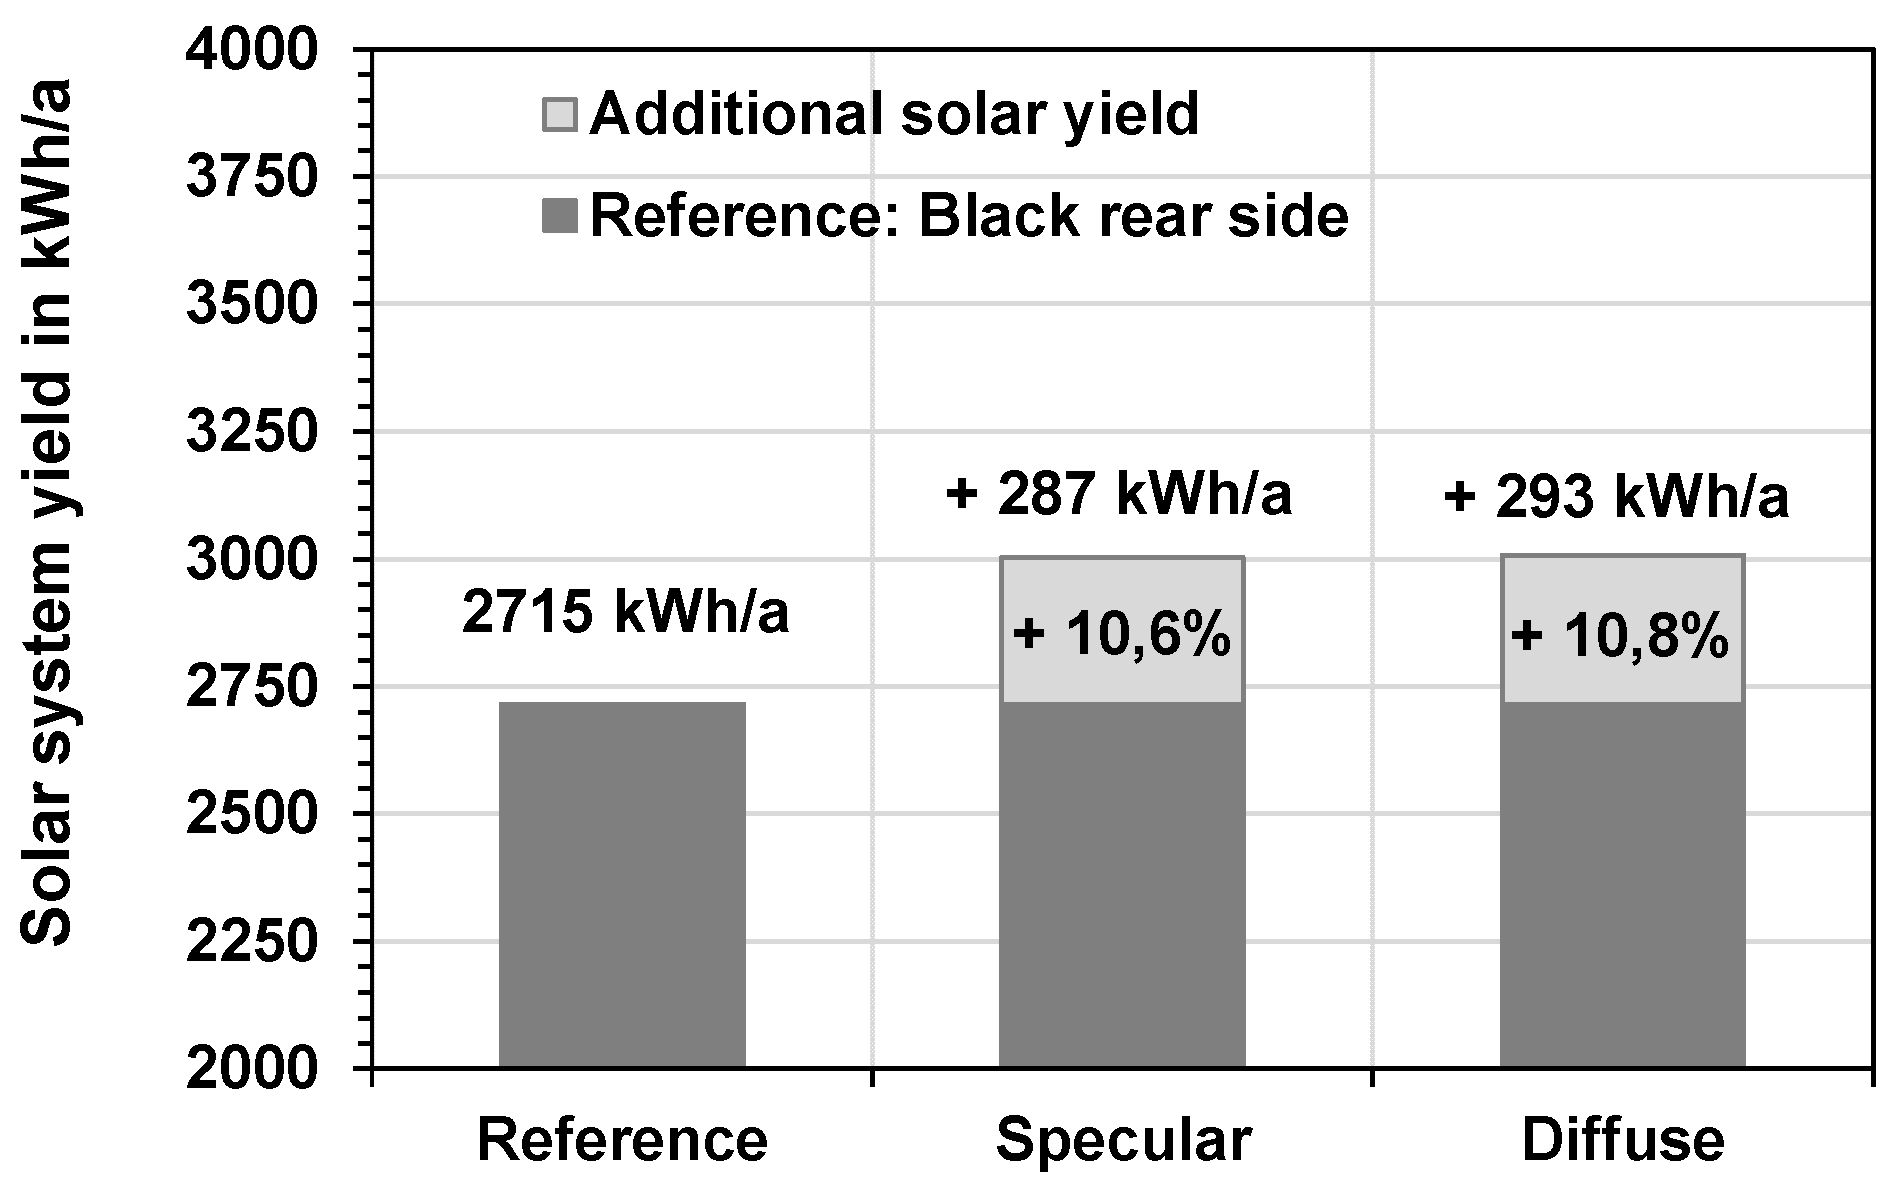
Similar to the annual collector output, the system yield of the investigated DHW system is also increased by the use of the proposed reflectors. To maintain the same system yield of the reference rear-side configuration (2715 kWh), the tubes can be reduced by 20%, which will lead to a system yield of approximately 2825 kWh (specular) or 2802 kWh (diffuse); this can be reduced further by 30%, which will lead to a system yield of approximately 2686 kWh (specular) or 2647 kWh (diffuse).
4. Discussion
Reducing the cost of solar thermal systems is an essential factor in promoting their use and thus reducing CO2 emissions. One approach to reduce these costs is to either increase the performance of evacuated tube collectors by using rear-side reflectors or to reduce the number of tubes used while maintaining the same collector performance.
In this paper, the performance of an evacuated tube collector with different rear-side reflectors was analyzed by means of ray-tracing simulations as well as annual collector output and system simulations. Specifically, a diffusely reflecting, low-cost, galvanized trapezoidal sheet metal which is usually used as a roof covering and a high-quality, planar mirror sheet made of aluminum (speculary reflecting) were compared.
By means of ray-tracing analysis, the η0 values of the configurations were determined and plausibility could be checked with the help of real collector measurement data. Furthermore, the IAM factors of the different configurations were determined up to a solar incidence angle of 60°. The IAM factors can be well simulated in the range of 0–30° with a deviation of 1.5% for the diffuse and 1.6% for the specular reflector and with an increasing deviation in the range of 30–60° (2.7% diffuse/7.3% specular). Based on these results, geometrical adjustments were made to the tube spacing (number of tubes) and the distance between the tubes and the reflector.
The annual yield simulations performed show, in comparison to a black reference rear-side, an additional yield of 30% (collector yield) and 11% (system yield) for the use of the diffuse reflector and 33% (collector yield) and 11% (system yield) for the use of the specular reflector. The differences between the diffuse and the specular reflectors are therefore unexpectedly small. Thus, the low-cost diffuse reflector offers an attractive alternative to the high-quality specular reflectors currently established on the market.
The geometrical variation of the aperture area (number of tubes) shows an almost proportional correlation between the collector yield and the area reduction. Minor deviations of this proportionality result from better IAM factors due to the increased tube spacing. In the simulation of a specific DHW system, the influence of the area reduction with the selected boundary conditions is significantly lower. A reduction in the aperture area of 50% leads to a 25% (specular) and 27.5% (diffuse) lower solar yield.
The results show that the efficiency of the evacuated tube collectors considered can be significantly increased by using rear-side reflectors. The reflectors can be used to achieve higher solar yields as well as to reduce the collector area or the number of tubes while maintaining the same solar yields. Regarding the annual collector output, the number of tubes can be reduced by 30% while maintaining the same yield as the black reference rear-side. In terms of the DHW system yield, the number of tubes can be reduced by 20–30%.
Based on the performance evaluation carried out within the scope of this work, an economic assessment and optimization can be made assuming the cost for vacuum tubes and reflector materials. In particular, the diffuse reflector can be regarded as extremely attractive for use in future collector configurations.
Author Contributions
Conceptualization, J.S.; methodology, J.S.; software, J.S.; validation, J.S. and B.S.; formal analysis, J.S.; investigation, J.S.; writing—original draft preparation, J.S.; writing—review and editing, B.S. and F.G.; visualization, J.S.; supervision, F.G.; project administration, B.S.; funding acquisition, B.S. and F.G. All authors have read and agreed to the published version of the manuscript.
Funding
This research was funded by the German State of Lower Saxony and the Federal Ministry of Economics and Energy, grant number FKZ 03ETW005 on the basis of a resolution of the German Bundestag. The work was carried out in cooperation with AKOTEC Produktionsgesellschaft mbH.
Data Availability Statement
The data presented in this study are available on request from the corresponding author.
Conflicts of Interest
The authors declare no conflict of interest. The funders had no role in the design of the study; in the collection, analyses, or interpretation of data; in the writing of the manuscript, or in the decision to publish the results.
Appendix A

Table A1.
Simulation and measurement data for the validation of the IAM behavior.
| Diffuse Reflector | Specular Reflector | Reference | |||||||||
|---|---|---|---|---|---|---|---|---|---|---|---|
| Simulation | Measurement | Simulation | Measurement | Simulation | Measurement | ||||||
| Angle | Value | Angle | Value | Angle | Value | Angle | Value | Angle | Value | Angle | Value |
| 0 | 1.00 | 2.32 | 1.00 | 0 | 1.00 | 0.00 | 1.00 | 0 | 1.00 | 0.00 | 1.00 |
| 5 | 1.01 | 4.81 | 1.01 | 5 | 1.00 | 1.30 | 0.99 | 5 | 1.06 | 1.62 | 1.01 |
| 10 | 1.04 | 7.30 | 1.01 | 10 | 1.00 | 3.76 | 0.99 | 10 | 1.21 | 4.10 | 1.05 |
| 15 | 1.06 | 9.78 | 1.03 | 15 | 1.00 | 6.22 | 1.00 | 15 | 1.36 | 6.59 | 1.10 |
| 20 | 1.07 | 12.27 | 1.02 | 20 | 1.00 | 8.68 | 1.00 | 20 | 1.32 | 9.20 | 1.19 |
| 25 | 1.05 | 16.00 | 1.04 | 25 | 0.99 | 11.14 | 1.00 | 25 | 1.27 | 11.69 | 1.23 |
| 30 | 1.05 | 18.48 | 1.03 | 30 | 0.99 | 13.60 | 1.01 | 30 | 1.32 | 15.91 | 1.33 |
| 35 | 1.04 | 20.97 | 1.04 | 35 | 0.99 | 16.06 | 1.00 | 35 | 1.18 | 18.40 | 1.30 |
| 40 | 1.02 | 23.45 | 1.04 | 40 | 0.99 | 18.52 | 1.00 | 40 | 1.12 | 20.89 | 1.29 |
| 45 | 1.01 | 30.53 | 1.02 | 45 | 0.99 | 20.98 | 1.01 | 45 | 1.11 | 23.37 | 1.26 |
| 50 | 1.00 | 33.02 | 1.05 | 50 | 1.00 | 23.44 | 1.01 | 50 | 1.22 | 30.58 | 1.28 |
| 55 | 1.01 | 35.50 | 1.05 | 55 | 1.01 | 25.90 | 1.02 | 55 | 1.19 | 33.06 | 1.29 |
| 60 | 0.97 | 37.98 | 1.04 | 60 | 0.97 | 28.35 | 1.01 | 60 | 1.13 | 35.54 | 1.23 |
| 40.47 | 1.04 | 30.81 | 1.02 | 38.03 | 1.19 | ||||||
| 42.95 | 1.03 | 33.26 | 1.03 | 40.51 | 1.19 | ||||||
| 45.43 | 1.03 | 35.72 | 1.03 | 42.99 | 1.19 | ||||||
| 47.91 | 1.03 | 38.17 | 1.02 | 45.47 | 1.21 | ||||||
| 50.39 | 1.04 | 40.99 | 1.04 | 47.95 | 1.27 | ||||||
| 52.88 | 1.04 | 43.44 | 1.02 | 50.44 | 1.31 | ||||||
| 55.36 | 1.03 | 47.48 | 1.01 | 52.92 | 1.31 | ||||||
| 57.84 | 1.04 | 49.93 | 1.04 | 55.40 | 1.31 | ||||||
| 60.32 | 1.02 | 52.38 | 1.03 | 57.88 | 1.29 | ||||||
| 54.83 | 1.03 | 60.36 | 1.29 | ||||||||
Table A2.
Used TRNSYS types for the simulations.
| TRNSYS Implementation | Source | |
|---|---|---|
| Weather Data | Data from Meteonorm | [25] |
| Solar Collector | Based on type 832 | [26] |
| Thermal Storage | Type 340 | [27] |
Table A3.
Boundary conditions for the TRNSYS system simulation.
| Component | Value | Unit |
|---|---|---|
| Thermal Storage (Vaillant VIH S 400) | ||
| Storage height | 1.3 | m |
| Storage volume | 400 | l |
| Thermal conductivity in the storage | 5.7 | kJ h−1 m−1 K−1 |
| Heat loss coefficient top | 1.34 | kJ h−1 K−1 |
| Heat loss coefficient side | 6.57 | kJ h−1 K−1 |
| Heat loss coefficient bottom | 1.78 | kJ h−1 K−1 |
| Relative height of double port inlet/outlet | 0/1 | - |
| Power of auxiliary heater | 6 | kW |
| Position of auxiliary heater | 0.6 | - |
| Position of auxiliary heater temperature sensor | 0.75 | - |
| Auxiliary heater setpoint | 60 | °C |
| Auxiliary heater deadband temperature difference | 1 | K |
| Heat exchanger inlet | 0.52 | - |
| Heat exchanger outlet | 0.08 | - |
| Heat exchanger volume | 10 | l |
| Heat exchanger heat transfer rate to storage | 276 | kJ h−1 K−1 |
| Heat exchanger UA 1. parameter | 0.141 | - |
| Heat exchanger UA 2. parameter | 0 | - |
| Heat exchanger UA 3. parameter | 0.592 | - |
| Number of calculation nodes | 150 | - |
| Domestic hot water demand | ||
| Tapping temperature | 45 | °C |
| Tapping profile | 200 | l d−1 |
| Solar Control | ||
| Deadband | 7/3 | K |
| Maximal storage temperature | 90 | °C |
| Maximal collector temperature | 95 | °C |
| Volume flow rate solar circuit | 240 (const.) | l h−1 |
| Solar circuit | ||
| Pipe length | 30 | m |
| Inner pipe diameter | 0.016 | m |
| Pipe heat loss rate per meter length | 3.9 | W m−1 K−1 |
Appendix B
Table A4.
Symbols and indices.
| Symbol | Unit | |
|---|---|---|
| Acol | m2 | Collector area |
| a1 | W m−2 K−1 | Linear heat loss coefficient |
| a2 | W m−2 K−1 | Quadratic heat loss coefficient |
| c | J kg−2 K−1 | Heat capacity |
| DR | Diffuse reflector | |
| F´ | - | Collector efficiency factor |
| Gsol | W m−2 | Irradiance |
| W | Power discharged by the collector | |
| W | Power discharged by the collector at certain irradiation angle | |
| W | Power discharged by the collector at normal irradiation angle | |
| SR | Specular reflector | |
| SR | - | Spacing of reflector trapezoids |
| ST | - | Spacing between tubes |
| (τα) | - | Transmittance-absorptance product |
| HR | - | Height of reflector trapezoids |
| HT | - | Reflector tube distance |
| T | °C | Temperature |
| ΔT | K | Temperature difference |
| Uloss | W m−2 K−1 | Collector loss coefficient |
| η | - | Collector efficiency |
| η0 | - | Zero-loss collector efficiency |
| ρhem | - | Solar reflectance |
| ρhem,dir | - | Direct reflective part of solar reflectance |
| ρhem,diff | - | Diffuse reflective part of solar reflectance |
References
- Tang, R.; Gao, W.; Yu, Y.; Chen, H. Optimal tilt-angles of all-glass evacuated tube solar collectors. Energy 2009, 34, 1387–1395. [Google Scholar] [CrossRef]
- IEA SHC Task 54. Guideline for Levelized Cost of Heat (LCoH) Calculations for Solar Thermal Applications. Available online: https://task54.iea-shc.org/Data/Sites/1/publications/A01-Info-Sheet--LCOH-for-Solar-Thermal-Applications.pdf (accessed on 7 September 2021).
- DIN EN ISO 9806:2018-04. Solar Energy—Solar Thermal Collectors—Test Methods; Beuth: Berlin, Germany, 2018. [Google Scholar]
- Parker, J.C. Development, Testing and Certification of Owens-Illinois Model SEC-601 Solar Energy Collector System—Final Report; NASA: Huntsville, AL, USA, 1979. [Google Scholar]
- Beekley, D.C.; Mather, G.R., Jr. Analysis and Experimental Tests of a High-Performance Evacuated Tubular Collector; NASA: Huntsville, AL, USA, 1978. [Google Scholar]
- O’Gallagher, J.; Rabl, A.; Winston, R.; McIntire, W. Absorption enhancement in solar collectors by multiple reflections. Sol. Energy 1980, 24, 323–326. [Google Scholar] [CrossRef]
- Window, B.; Basset, I.M. Optical collection efficiencies of tubular solar collectors with specular reflectors. Sol. Energy 1981, 26, 341–346. [Google Scholar] [CrossRef]
- Window, B.; Zybert, J. Optical collection efficiencies of arrays of tubular solar collectors with diffuse reflectors. Sol. Energy 1981, 26, 325–331. [Google Scholar] [CrossRef]
- Chow, S.P.; Harding, G.L.; Window, B.; Cathro, K.J. Effect of collector components on the collection efficiency of tubular evacuated collectors with diffuse reflectors. Sol. Energy 1984, 32, 251–262. [Google Scholar] [CrossRef]
- Chow, S.P.; Harding, G.L.; Zhiqiang, Y.; Morrison, G.L. Optimisation of evacuated tubular solar collector arrays with diffuse reflectors. Sol. Energy 1984, 33, 277–282. [Google Scholar] [CrossRef]
- Milani, D.; Abbas, A. Multiscale modeling and performance analysis of evacuated tube collector for solar water heaters using diffuse flat reflector. Renew. Energy 2016, 86, 360–374. [Google Scholar] [CrossRef]
- Kalogirou, S.A. Nontracking solar collection technologies for solar heating and cooling systems. In Advances in Solar Heating and Cooling; Wang, R.Z., Ge, T.S., Eds.; Elsevier: Amsterdam, The Netherlands, 2016; pp. 63–80. [Google Scholar]
- Dubey, A.; Arora, A. High-temperature distillation using n-parallel evacuated tube collector integrated with double slope solar still in force mode. J. Therm. Sci. Eng. Appl. 2021, 13, 031002. [Google Scholar] [CrossRef]
- Zemax OpticStudio. Available online: https://www.zemax.com/products/opticstudio (accessed on 7 September 2021).
- ISO 9050:2003-08. Glass in Building—Determination of Light Transmittance, Solar Direct Transmittance, Total Solar Energy Transmittance, Ultraviolet Transmittance and Related Glazing Factors; Beuth: Berlin, Germany, 2003. [Google Scholar]
- SCHOTT AG. N-BK7 Data Sheet, Version 2 January 2014. Available online: https://www.us.schott.com/d/advanced_optics/31255521-bf27-46f1-ab3b-f35290482499/schott-datasheet-nbk7-english.pdf (accessed on 7 September 2021).
- Almeco Group. TINOX Data Sheet. Available online: https://www.almecogroup.com/uploads/generic_file/9472-spezifikation_tinox_energy_de_rd-v4-300616.pdf (accessed on 7 September 2021).
- Baehr, H.-D.; Stephan, K. Heat and Mass Transfer, 3rd ed.; Springer: Berlin/Heidelberg, Germany, 2011; p. 612. [Google Scholar]
- Duffie, J.A.; Beckman, W.A. Solar Engineering of Thermal Processes, 4th ed.; Wiley: Hoboken, NJ, USA, 2013. [Google Scholar]
- Frey, R.; Frei, U.; Brunold, S. Bestimmung des Kollektorwirkungsgradfaktors F an Flüssigkeitsführenden Solarabsorbern. Available online: https://docplayer.org/110367957-Bestimmung-des-kollektorwirkungsgradfaktors-f-an-fluessigkeitsfuehrenden-solarabsorbern.html (accessed on 7 September 2021).
- Weißmüller, C.; Frenz, H.; Krämer, E. Proficiency Test—QAiST Testing of Solar Collectors and Solar Systems 2010–2011, Final Report, Marl, Germany. 2012. Available online: http://task43.iea-shc.org/data/sites/1/publications/Final%20QAiST%20Report%205-29-131.pdf (accessed on 7 September 2021).
- Theunissen, P.-H.; Beckmann, W.A. Solar transmittance characteristics of evacuated tubular collectors with diffuse back reflectors. Sol. Energy 1985, 34, 311–320. [Google Scholar] [CrossRef]
- Perers, B.; Bales, C. A Solar Collector Model for TRNSYS Simulation and System Testing, IEA SHC Task 26, Subtask B Report, Solar Energy Research Center SERC, Börlange, Sweden. 2002. Available online: https://www.aee-intec.at/0uploads/dateien55.pdf (accessed on 7 September 2021).
- Schiebler, B.; Weiland, F.; Giovannetti, F. Experimental evaluation of evacuated tube collectors with heat pipes to avoid stagnation loads in a domestic hot water system. In Proceedings of the ISES Solar World Conference and the IEA SHC Solar Heating and Cooling Conferencce for Buildings and Industry, Abu Dhabi, United Arab Emirates, 29 October–3 November 2017; Romero, M., Mugnier, D., Eds.; International Solar Energy Society: Freiburg, Germany. [Google Scholar]
- Remund, J.; Müller, S. Solar radiation and uncertainty information of Meteonorm 7. In Proceedings of the ISES Solar World Congress, Kassel, Germany, 28 August–2 September 2011; Vajen, K., Ed.; International Solar Energy Society: Freiburg, Germany, 2011. [Google Scholar]
- Schiebler, B.; Weiland, F.; Giovannetti, F.; Kastner, O.; Jack, S. Improved flat plate collector with heat pipes for overheating prevention in solar thermal systems. In Proceedings of the ISES Solar World Congress, Santiago, Chile, 4–7 November 2019; International Solar Energy Society: Freiburg, Germany, 2019. [Google Scholar]
- Drück, H. Multiport Store—Model for TRNSYS Type 340, University of Stuttgart, Stuttgart, Germany. 2006. Available online: https://www.trnsys.de/static/788c19e80e1b4e690b35e44b05c8b164/ts_type_340_de.pdf (accessed on 7 September 2021).
Figure 1.
Geometric specifications of the ETC investigated with respect to the outer tube diameter.

Figure 2.
Implementation of the ETC with a diffuse reflector in the ray-tracing simulation as 3D (left) and 2D representations (right).
Figure 2.
Implementation of the ETC with a diffuse reflector in the ray-tracing simulation as 3D (left) and 2D representations (right).

Figure 3.
Experimentally measured direct and diffuse reflectance of the specular (SR) and the diffuse reflector (DR), measured with a spectrometer in the wavelength range of 250 nm up to 2500 nm.
Figure 3.
Experimentally measured direct and diffuse reflectance of the specular (SR) and the diffuse reflector (DR), measured with a spectrometer in the wavelength range of 250 nm up to 2500 nm.

Figure 4.
Measurement of the zero-loss coefficient and the IAM behavior on a solar tracker.

Figure 5.
Comparison between simulated and measured η0 values in accordance with Equation (2) for different reflector geometries with F’ = 0.95.
Figure 5.
Comparison between simulated and measured η0 values in accordance with Equation (2) for different reflector geometries with F’ = 0.95.

Figure 6.
Simulated and measured IAM factors for all investigated reflector geometries with: (a) a speculary reflecting reflector; (b) a diffusely reflecting reflector; (c) a black reference rear side.
Figure 6.
Simulated and measured IAM factors for all investigated reflector geometries with: (a) a speculary reflecting reflector; (b) a diffusely reflecting reflector; (c) a black reference rear side.

Figure 7.
Simulated IAM factors as a result of the ray-tracing simulation with variation of the tube spacing (number of tubes) in respect to the outer tube diameter between 1.3 (original) and 3 for: (a) a specularly reflecting reflector; (b) a diffusely reflecting reflector.
Figure 7.
Simulated IAM factors as a result of the ray-tracing simulation with variation of the tube spacing (number of tubes) in respect to the outer tube diameter between 1.3 (original) and 3 for: (a) a specularly reflecting reflector; (b) a diffusely reflecting reflector.

Figure 8.
Simulated IAM factors as a result of the ray-tracing simulation with variation of the tube reflector distance in respect to the outer tube diameter between 0.6 and 0.85 for: (a) a specularly reflecting reflector; (b) a diffusely reflecting reflector.
Figure 8.
Simulated IAM factors as a result of the ray-tracing simulation with variation of the tube reflector distance in respect to the outer tube diameter between 0.6 and 0.85 for: (a) a specularly reflecting reflector; (b) a diffusely reflecting reflector.

Figure 9.
Simulated zero-loss coefficients for different tube distances (=number of tubes) with specular and diffuse reflectors.
Figure 9.
Simulated zero-loss coefficients for different tube distances (=number of tubes) with specular and diffuse reflectors.

Figure 10.
Hydraulic scheme of the simulated DHW system.

Figure 11.
Creation of the scaled IAM data sets for the specular reflector by considering the deviation of the IAM simulation.
Figure 11.
Creation of the scaled IAM data sets for the specular reflector by considering the deviation of the IAM simulation.

Figure 12.
Annual collector output with different reflectors in respect to a black reference rear-side.
Figure 12.
Annual collector output with different reflectors in respect to a black reference rear-side.

Figure 13.
Annual collector output of the simulated collectors with specular or diffuse reflectors with variation of the tube distance (number of tubes) and indication of the percentage reduced yield (PRY) in relation to the original configuration.
Figure 13.
Annual collector output of the simulated collectors with specular or diffuse reflectors with variation of the tube distance (number of tubes) and indication of the percentage reduced yield (PRY) in relation to the original configuration.

Figure 14.
Comparison of the solar annual yields of the system simulation for all the reflector geometries investigated both in absolute terms and in relation to the black reference rear-side.
Figure 14.
Comparison of the solar annual yields of the system simulation for all the reflector geometries investigated both in absolute terms and in relation to the black reference rear-side.

Figure 15.
Solar system yield of the simulated DHW system with specular and diffuse reflectors with variation of the number of tubes with indication of the percentage reduced yield (PYR) in relation to the original configuration (100% number of tubes).
Figure 15.
Solar system yield of the simulated DHW system with specular and diffuse reflectors with variation of the number of tubes with indication of the percentage reduced yield (PYR) in relation to the original configuration (100% number of tubes).

Table 1.
Reflector geometries examined with indication of the corresponding reflector materials and the solar reflectance data determined in accordance with ISO 9050:2003-08 [15] (ρhem—hemispherical reflectance and its direct and diffuse components, ρhem,dir and ρhem,diff).
Table 1.
Reflector geometries examined with indication of the corresponding reflector materials and the solar reflectance data determined in accordance with ISO 9050:2003-08 [15] (ρhem—hemispherical reflectance and its direct and diffuse components, ρhem,dir and ρhem,diff).
| Reflector | Material | ρhem | ρhem,dir | ρhem,diff |
|---|---|---|---|---|
| Diffuse (DR) | Galvanized steel, diffusely reflective | 0.72 | 0.06 | 0.66 |
| Specular (SR) | Aluminum, specularly reflective | 0.87 | 0.86 | 0.01 |
| Reference | Polymer, slightly diffusely reflective | 0.06 | 0.006 1 | 0.054 1 |
1 Assumption.
Table 2.
Materials used for the ray-tracing simulation with specification of solar absorptance and reflectance.
Table 2.
Materials used for the ray-tracing simulation with specification of solar absorptance and reflectance.
| Name | Material | Absorptance | Reflectance |
|---|---|---|---|
| Glass cylinder | SCHOTT: N-BK7 | [16] | |
| Absorber plate | TiNOX titanium nitrite oxide-based coating on both sides of copper | 95% [17] | 5% [17] |
| Heat pipe | Blank copper | 18% [18] | 82% [18] |
Table 3.
Average deviations of the ray-tracing simulation in respect to the measured data.
| Reflector | 0–30° | 30–60° |
|---|---|---|
| Diffuse | 1.5% | 2.7% |
| Specular | 1.6% | 7.3% |
| Reference | 1.0% | 3.3% |
Table 4.
Gross area-related simulation parameters of the collector with different reflectors.
| Parameter | Unit | Diffuse | Specular | Reference |
|---|---|---|---|---|
| Aperture area | m2 | 6.1 | 6.1 | 6.1 |
| Gross area | m2 | 10 | 10 | 10 |
| Zero-loss coefficient | - | 0.523 | 0.491 | 0.445 |
| Linear loss coefficient | W m−2 K−1 | 1.25 | 1.25 | 1.25 |
| Quadratic loss coefficient | W m−2 K−2 | 0.0043 | 0.0043 | 0.0043 |
| Effective heat capacity | kJ m−2 K−1 | 2.936 | 2.936 | 2.936 |
| Kdiffuse | - | 0.951 | 0.934 | 0.92 |
| Maximum temperature | °C | 125 | 125 | 125 |
| Gradient of heat pipe cut off 1 | W m−2 K−1 | −11.5 | −11.5 | −11.5 |
1 This value determines the gradient between the start of the heat transfer limitation and the actual stop of heat transfer in the heat pipe.
Table 5.
Annual collector output with different reflectors and with scaling of the IAM factors.
| Unit | Diffuse | Specular | Reference | |
|---|---|---|---|---|
| original | kWh a−1 | 4666 | 4769 | 3585 |
| negative IAM scaling | kWh a−1 | 4601 | 4647 | - |
| positive IAM scaling | kWh a−1 | 4735 | 4891 | - |
Table 6.
Solar system yields of the annual system simulation with different reflectors and with scaling of the IAM factors.
Table 6.
Solar system yields of the annual system simulation with different reflectors and with scaling of the IAM factors.
| Unit | Diffuse | Specular | Reference | |
|---|---|---|---|---|
| Original | kWh a−1 | 3008 | 3003 | 2715 |
| Negative IAM scaling | kWh a−1 | 2998 | 2982 | - |
| Positive IAM scaling | kWh a−1 | 3020 | 3023 | - |
Publisher’s Note: MDPI stays neutral with regard to jurisdictional claims in published maps and institutional affiliations. |
© 2021 by the authors. Licensee MDPI, Basel, Switzerland. This article is an open access article distributed under the terms and conditions of the Creative Commons Attribution (CC BY) license (https://creativecommons.org/licenses/by/4.0/).
Share and Cite
MDPI and ACS Style
Schumann, J.; Schiebler, B.; Giovannetti, F. Performance Evaluation of an Evacuated Tube Collector with a Low-Cost Diffuse Reflector. Energies 2021, 14, 8209. https://0-doi-org.brum.beds.ac.uk/10.3390/en14248209
AMA Style
Schumann J, Schiebler B, Giovannetti F. Performance Evaluation of an Evacuated Tube Collector with a Low-Cost Diffuse Reflector. Energies. 2021; 14(24):8209. https://0-doi-org.brum.beds.ac.uk/10.3390/en14248209
Chicago/Turabian StyleSchumann, Julian, Bert Schiebler, and Federico Giovannetti. 2021. "Performance Evaluation of an Evacuated Tube Collector with a Low-Cost Diffuse Reflector" Energies 14, no. 24: 8209. https://0-doi-org.brum.beds.ac.uk/10.3390/en14248209
Note that from the first issue of 2016, this journal uses article numbers instead of page numbers. See further details here.