
CO2 Liquefaction Close to the Triple Point Pressure
by
 , ,
, ,
Stian Trædal
* ,
,
Jacob Hans Georg Stang
,
Ingrid Snustad
,
Martin Viktor Johansson
and
David Berstad
SINTEF Energy Research, 7034 Trondheim, Norway
*
Author to whom correspondence should be addressed.
Energies 2021, 14(24), 8220; https://0-doi-org.brum.beds.ac.uk/10.3390/en14248220
Submission received: 22 October 2021
/
Revised: 29 November 2021
/
Accepted: 3 December 2021
/
Published: 7 December 2021
(This article belongs to the Special Issue Advances in Carbon Capture and Storage (CCS) Deployment)
Abstract
:For vessel-based transport of liquid CO2 in carbon capture and storage chains, transport at 8 bar(a) enable significant cost reductions compared to transport at higher pressures for most transport distances and volumes. Transport at even lower pressures could further reduce the costs. There are, however, concerns related to dry ice formation and potential clogging in parts of the chain that could lead to operational issues when operating close to the triple point pressure of CO2. In this paper, results from an experimental campaign to de-risk and gain operational experience from the low-pressure CO2 liquefaction process are described. Six experiments using pure CO2 or CO2/N2 mixtures are presented. In four of the experiments, the liquid product pressure was continuously lowered until dry ice was detected and eventually clogged the system. In the final two experiments, the liquefaction process was run in steady-state at low liquefaction pressures for five hours to ensure that there is no undetected dry ice in the process that could lead to accumulation and operational issues over time. These experiments demonstrate that pure CO2 can be safely liquefied at 5.8 bar(a) and a CO2/N2 mixture can be liquefied at 6.5 bar(a) without issues related to dry ice formation.
1. Introduction
With the IPCC report published in August 2021, there is no longer any doubt that the anthropogenetic CO2 emissions are on a scale that calls for a “red alert”. A part of the solution is Carbon Capture, Transport and Storage (CCS), and up to 15% of the reduction in CO2 emissions from industry and the power sector will come from such technologies [1]. As a part of the initiation strategy for large scale deployment of CCS, ship transportation has, for certain conditions, been pointed to as the most cost-effective solution. However, the pressure at which the liquid CO2 will be transported for industrial-scale CCS is likely lower than the pressure at which liquid CO2 is transported today. The common pressure level of liquid CO2 ship transport is currently 15–19 bar, which is a standard condition for which the industry has extensive experience [2]. For transport of substantially larger cargo of CO2, which is necessary for industrial-scale CCS, it can be attractive, perhaps necessary, to lower the transport pressure for allowing larger tank designs and higher liquid density to lower the specific transport cost [3].
For CO2 liquefaction, stand-alone, Deng et al. [4] showed that a pressure of 8 bar(a) results in a higher liquefaction cost than higher pressure levels. However, when including both CO2 liquefaction and the shipping supply chain Roussanaly and Deng [5] found that the 8 bar(a) transport option can enable significant cost reductions compared to transport at 16 bar(a), for the vast majority of transport distances and annual volumes considered. The cost reductions increase with increasing transport distance.
Hence, large-scale CCS chains will likely benefit from standardizing low-pressure liquid CO2 ship transport. This standardization will require technology development and qualification for sub-processes in the whole chain, such as low-pressure CO2 liquefaction, storage, loading, ship transport and off-loading. As a part of this effort, the work presented in this paper contributes by experimentally investigating the production of low-pressure liquid CO2. The focus is on the final liquefaction stage where the lowest temperature and pressure levels occur.
Very low-pressure levels are a general concern for liquid CO2 since there is a lower margin to the triple point, and therefore increased risk of dry ice formation in the case of depressurization. By conducting the experiments in this work, we seek to gain operational insights and operationally investigate pressure and temperature margins to the CO2 triple point or the point of dry ice formation. This is done by running systematic experimental series where the pressure of produced liquid CO2 is gradually lowered until it eventually approaches, and passes, the point of dry ice formation. For pure CO2 the freezing point is predictable, but fractions of N2 are expected to lower the freezing point temperature.
Six experiments have been performed in this campaign: two using high purity CO2 (4.2 quality), which creates a baseline for the further experiments and four using mixtures of CO2 and nitrogen which represents simplified and synthesized CO2 mixtures relevant for post-combustion capture. The three selected mixtures contain 94.2%, 86.5% and 76.7% CO2, which are relevant for example in hybrid processes where liquefaction and phase-separation are used as a purification step following a first bulk separation process (e.g., membrane or pressure swing adsorption) or in oxy-combustion applications [6]. The 94.2% CO2 composition is also close to that of typical CO2 specifications for pipeline transport [7].
In the initial experiments, the final separation pressure was continuously lowered until dry ice was observed and finally clogged the product liquid CO2 line. This was done to establish at which temperature and pressure the dry ice formation would occur and investigate the robustness of the process towards clogging. Subsequently, two experiments were conducted, one with high purity CO2 and one with a CO2/N2 mixture, where the liquefaction process was continuously run at a pressure slightly above where dry ice was observed in the first experiments, for five hours straight. This was to ensure that there is no undetected formation and accumulation of dry ice in parts of the system which can cause issues over time. The scale of experiments is in the range of 3.6–4.8 ton CO2 per day or approximately 150–200 kg per hour.
2. Materials and Methods
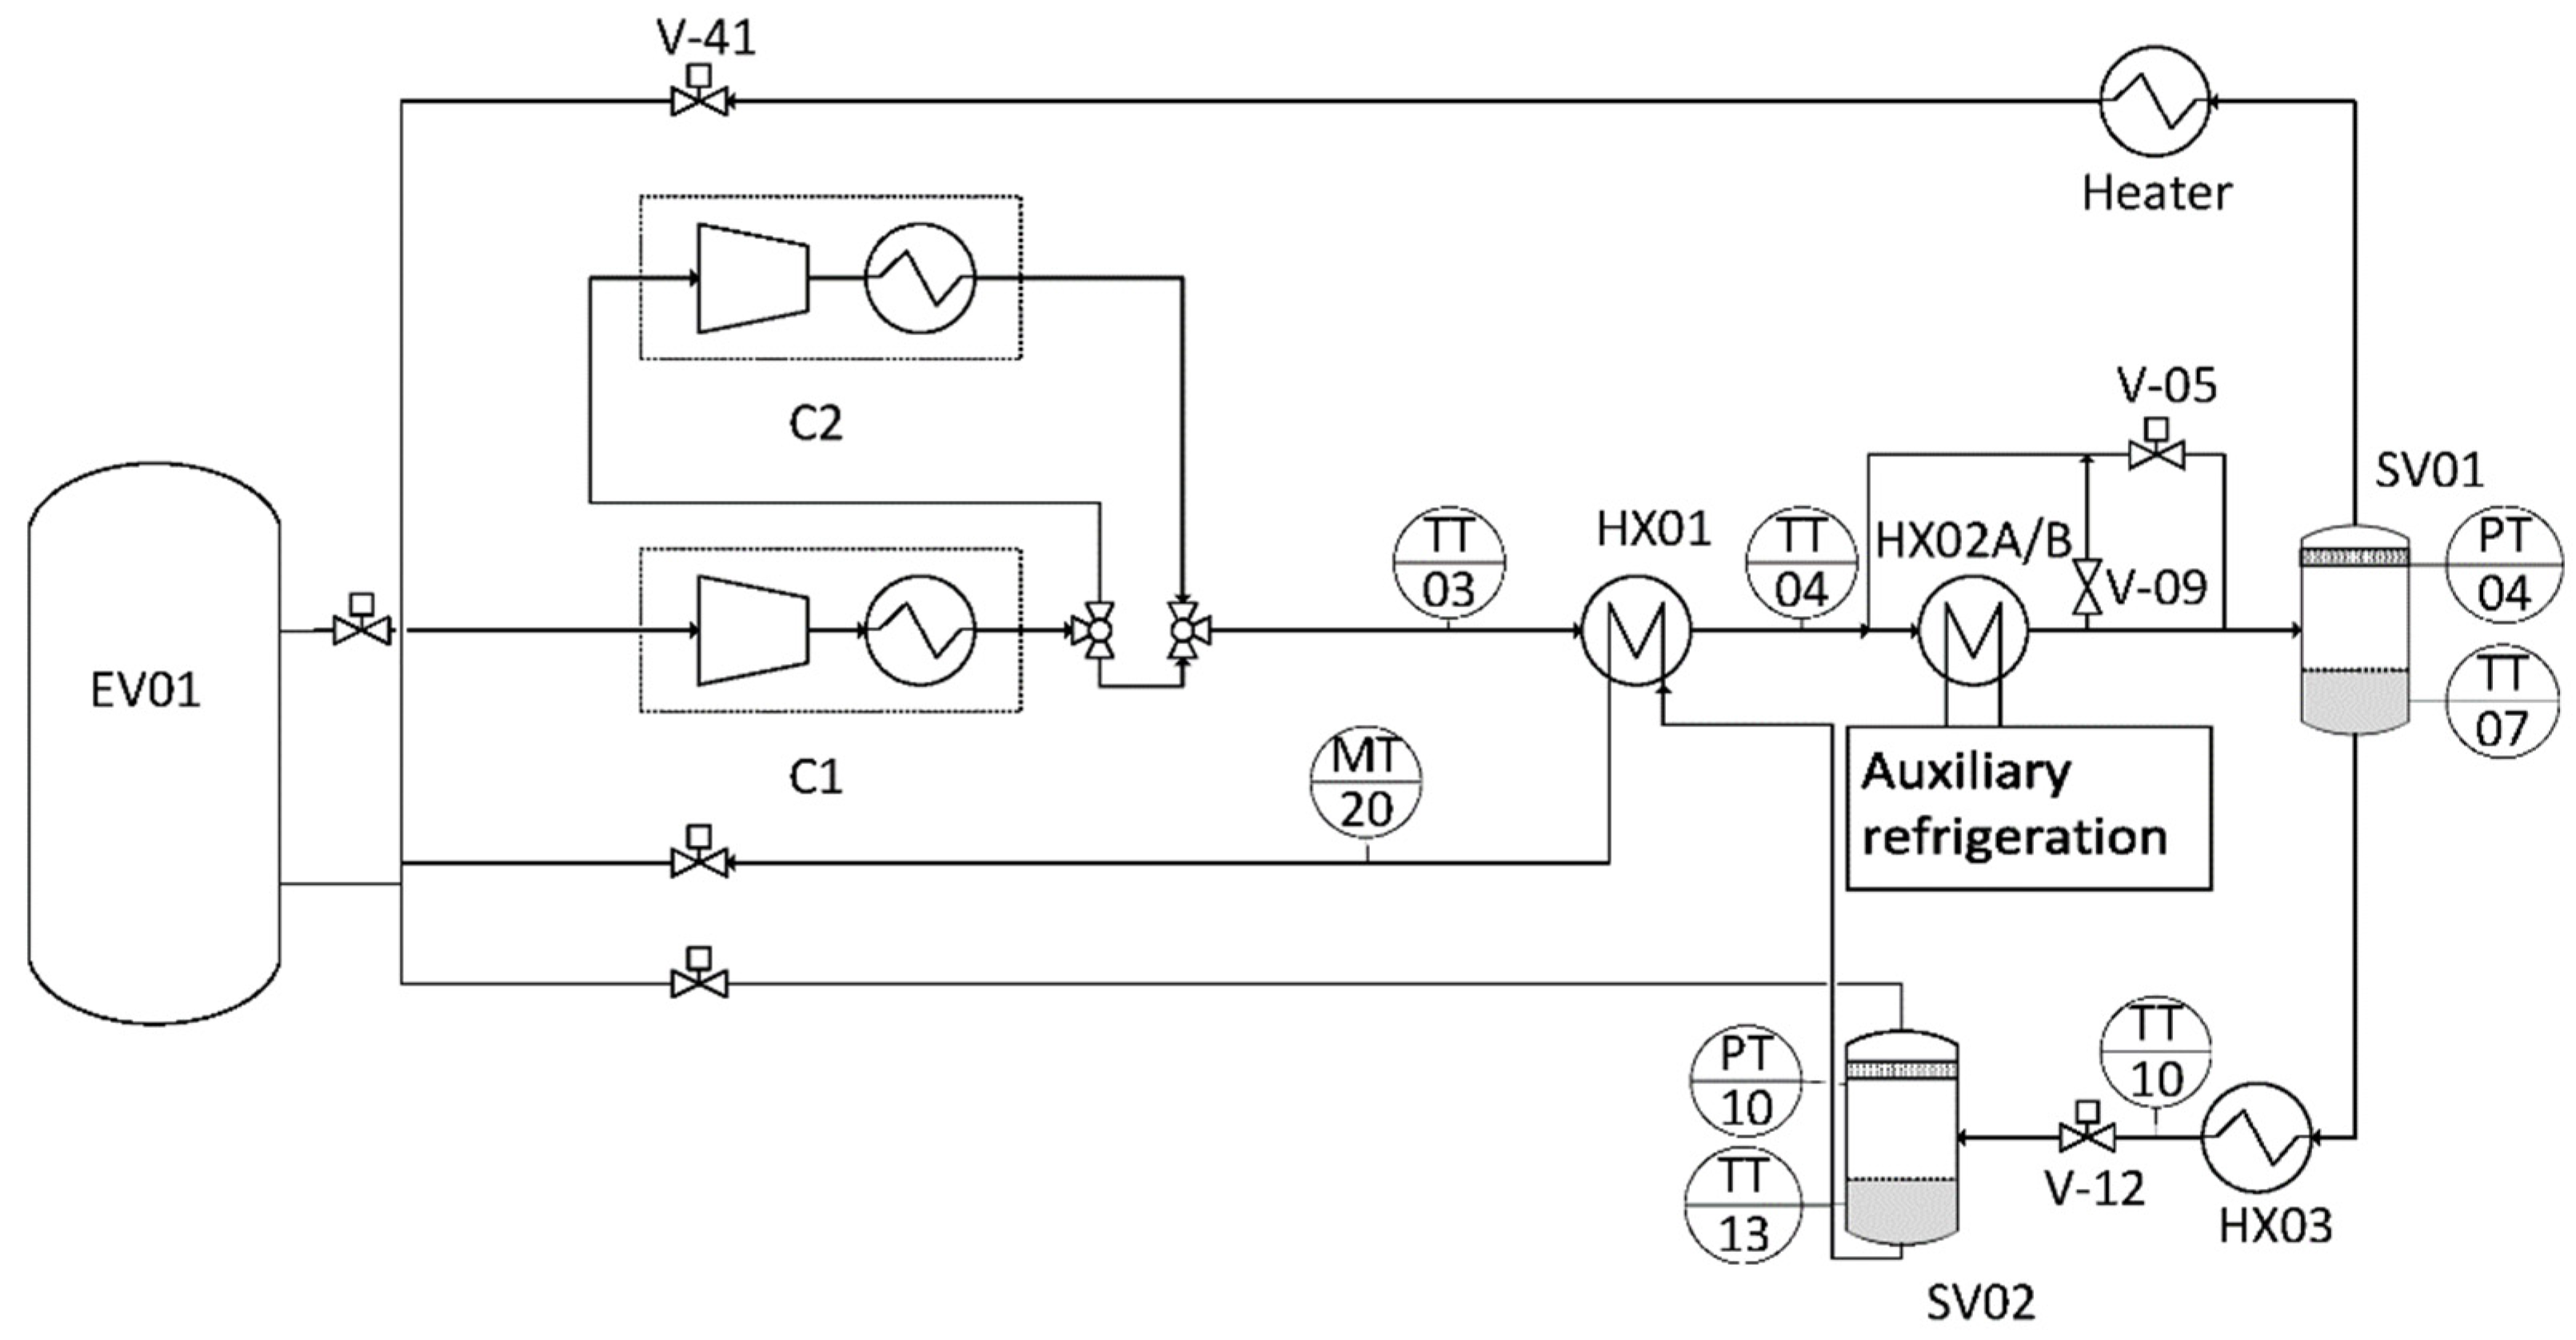
The principal layout of the experimental setup is shown in Figure 1. All references to components’ names are shown in the principal sketch. The system is a closed loop due to the otherwise unacceptably high gas consumption that would be demanded. The largest volume in the facility is the mixing and expansion vessel (EV01), to which CO2, N2 and other gases can be supplied from central gas storage using mass flow controllers. Two intercooled oil-free piston compressors (C1 and C2), with a total of three compression stages, can compress the gas mixture to any pressure upwards constrained by 120 bar(g). The last, high-pressure compressor stage can be bypassed if desired, provided that the required pressure level is 45 bar(g) or lower. Each inter- and aftercooler stage consists of a water-cooled shell-and-tube heat exchanger. The coolers can reduce the gas temperature to around 20 °C, depending on the flowrate and temperature of the cooling water. After compression, the gas is cooled against the liquid CO2 product stream in a recuperator (HX01). There are three options for further cooling of the stream down to the desired separation temperature. One option is to over-compress the gas mixture in the compressors and induce temperature drops by Joule-Thomson throttling in a control valve (V-05). The second option is to use an auxiliary refrigeration cycle to cool the stream at nearly constant pressure in heat exchangers (HX02A and HX02B). The third option is a combination of the first two options. When cooled to the desired separation temperature, the two-phase stream is separated in the main separator (SV01). Flashed gas can be superheated by an electrical heater before it returns to EV01 through a control valve (V-41). The CO2 rich liquid stream can be heated in an immersion heater (HX03) before it is throttled down to the desired final separation pressure in a control valve (V-12) and enters the purification separator (SV02). From SV02, the flashed gas returns to the expansion vessel, while the liquid CO2 product stream is evaporated in the recuperator before returning to the expansion vessel. The separators are identical except for the internals. They have an inner diameter and height of 10 cm and 140 cm, respectively. SV01 has an 80 mm diameter and 100 mm high demister, while SV02 has a 65 mm diameter and 50 mm high demister. The rig is well instrumented with mass flow meters, liquid level meters, and temperature and pressure sensors. There are sample lines to a gas chromatograph (GC) at the inlet to the separators and at the gas and liquid outlet of each separator. Characteristics for a selection of the components in the system are given in Table 1, more details on the components in the rig can be found in [8]. Stated uncertainties for the most important instruments are given in Table 2.
Two experimental procedures are followed when conducting the experiments in this work. In both procedures, the experiments are started by filling the rig with the desired compounds with predetermined composition, either pure CO2 or CO2-rich mixtures. The composition is controlled with the injection mass flow rate into the mixing tank (EV01) and confirmed with a GC sampling at the inlet of the first separator (SV01) when the process is running. When the desired composition, temperature, pressure, and liquid levels are achieved the experiment is started. For the first experimental procedure, the pressure in the second separator (SV02) is gradually reduced to get closer to, and eventually pass the pressure where the formation of dry ice is expected, while the rest of the rig is kept as stable as possible. During the reduction in pressure, we observe the response in temperature at several points in the setup, most importantly within the liquid and gas phases of the separators, as well as the response in mass flows and other parameters in the process. Freeze out of dry ice cannot be observed directly but can be detected by observing flattening of the liquid temperature (TT13) in SV02, despite changing pressure, and decreasing liquid mass flow (MT20) out of this separator. After the phase change initiation is observed, the pressure is further decreased until the system is plugged with dry ice. The point of plugging coincides with the reduction and eventually cancellation of liquid mass flow in MT20. Details regarding pressures, temperatures and observed behavior of the process are described in the Results section. The pressure at which dry ice is formed makes the basis for the SV02 pressure levels in the experiments conducted with the second procedure. For these experiments, the rig is operated in steady state for over 5 h with a constant pressure in SV02 that is kept constant at a pressure slightly above the dry ice formation pressure observed.
Modelling of Composition with TREND
For comparing with the experimental results, the thermodynamic library TREND [9] has been used to model the operational conditions. TREND is developed specifically for modelling properties and processes relevant for CCS and is based on the Equation of State EoS-CG [10]. The TREND calculations were performed by using average pressure, temperature, and measured composition during the relevant parts of the experiments. These conditions are kept as stable as possible during the experiments, but average values are used as there are always some instabilities in the process. Since there are some small fluctuations in the pressure, temperature, and compositions during the experiments it is expected that there will be slight deviations between calculated and measured results.
3. Results
In this work, we have conducted experiments with pure CO2 and with mixtures of CO2 and N2. The main settings for the experiments are listed in Table 3. The goal of the experiments with pure CO2 was to gain operational experience on the low-pressure process and to serve as a reference for the experiments with mixtures. The experiments started with pure CO2 (Experiments 1 and 2) or mixtures of CO2 and N2 (Experiments 3–6) being filled into a mixing tank. Thereafter, the experiments followed the procedures outlined in the Section 2.
3.1. Pure CO2
Two experiments were conducted with pure CO2 (99.992 mol%). Experiments 1 followed the first procedure for which the pressure was reduced stepwise and kept for one hour each. The pressure was reduced until dry ice was observed and, eventually, plugging occurred. In experiment 6, the pressure was kept at 6.5 bar for 5 h. Details of the results of the experiments with mixtures are given in the next sections.
3.1.1. Experiment 1
The main purpose of Experiment 1 was to gain insight into the low-pressure liquefaction process with pure CO2 and establish at what pressure level in SV02 dry ice will form and plugging occur. When starting the experiment, the rig was cooled down and in stable operation with 60% liquid level in both separators, 17 bar pressure in SV01 and 6.5 bar pressure in SV02. Starting from room temperature, cooling and stabilization of the setup take about 4–5 h depending on the complexity of the experiment. For experiments with pure CO2, the electric heater (HX03) between the two separators must be used for control purposes, as changes in temperature will also cause changes in pressure. HX03 is therefore used to form more gas in the expansion into SV02 if the temperature out of the recuperator (TT04) gets too cold, resulting in too little or no gas forming in SV01. This reduces the flowrate of liquid CO2 on the cold side of the recuperator, thereby increasing TT04. During the experiment, the pressure in SV02 is decreased stepwise from 6.5 bar down to 5.9 bar.
The pressure and liquid temperature in SV02 during the controlled reduction of pressure in Experiment 1 are shown in Figure 2 and Figure 3. The pressure is reduced in steps and each of the following pressure levels is kept for 1 h; 6.5, 6.2, 6.1, 6.0 and 5.9 bar. The process operates steadily, and it can be observed that the temperature curve follows the pressure curve, which indicates that there is no detectable presence of dry ice. There was an unintended compressor stop due to too low suction pressure on the compressor inlet when the pressure was reduced from 5.9 bar(a). The process, therefore, needed to be brought back to steady-state conditions before the experiment could proceed, which takes between 30 min and 1 h at this point, meaning when the rig is already cooled. After the process was returned to a steady state, a pressure of 5.6 bar(a) and 5.4 bar(a) was kept for 30 min each, shown in Figure 3. The liquid outlet of SV02 was eventually plugged when the pressure in SV02 was at 5.35 bar(a), due to a fluctuation in the pressure when the control system was set to 5.4 bar(a).
3.1.2. Experiment 2
To ensure that there is no undetected formation and accumulation of dry ice in parts of the system that can disturb or clog the process over time, we conducted an experiment with pure CO2 where the pressure in SV02 was kept constant at 5.8 bar for 5 h. This is only 0.6 bar above the triple point pressure, but the process was stable and controllable for the duration of the experiment. Figure 4 shows the pressure and the liquid temperature in SV02. As seen in the figure, the fluctuations in the pressure are small and there are no indications of dry ice formation. This is verified by stable valve positions and mass flows throughout the five-hour run.
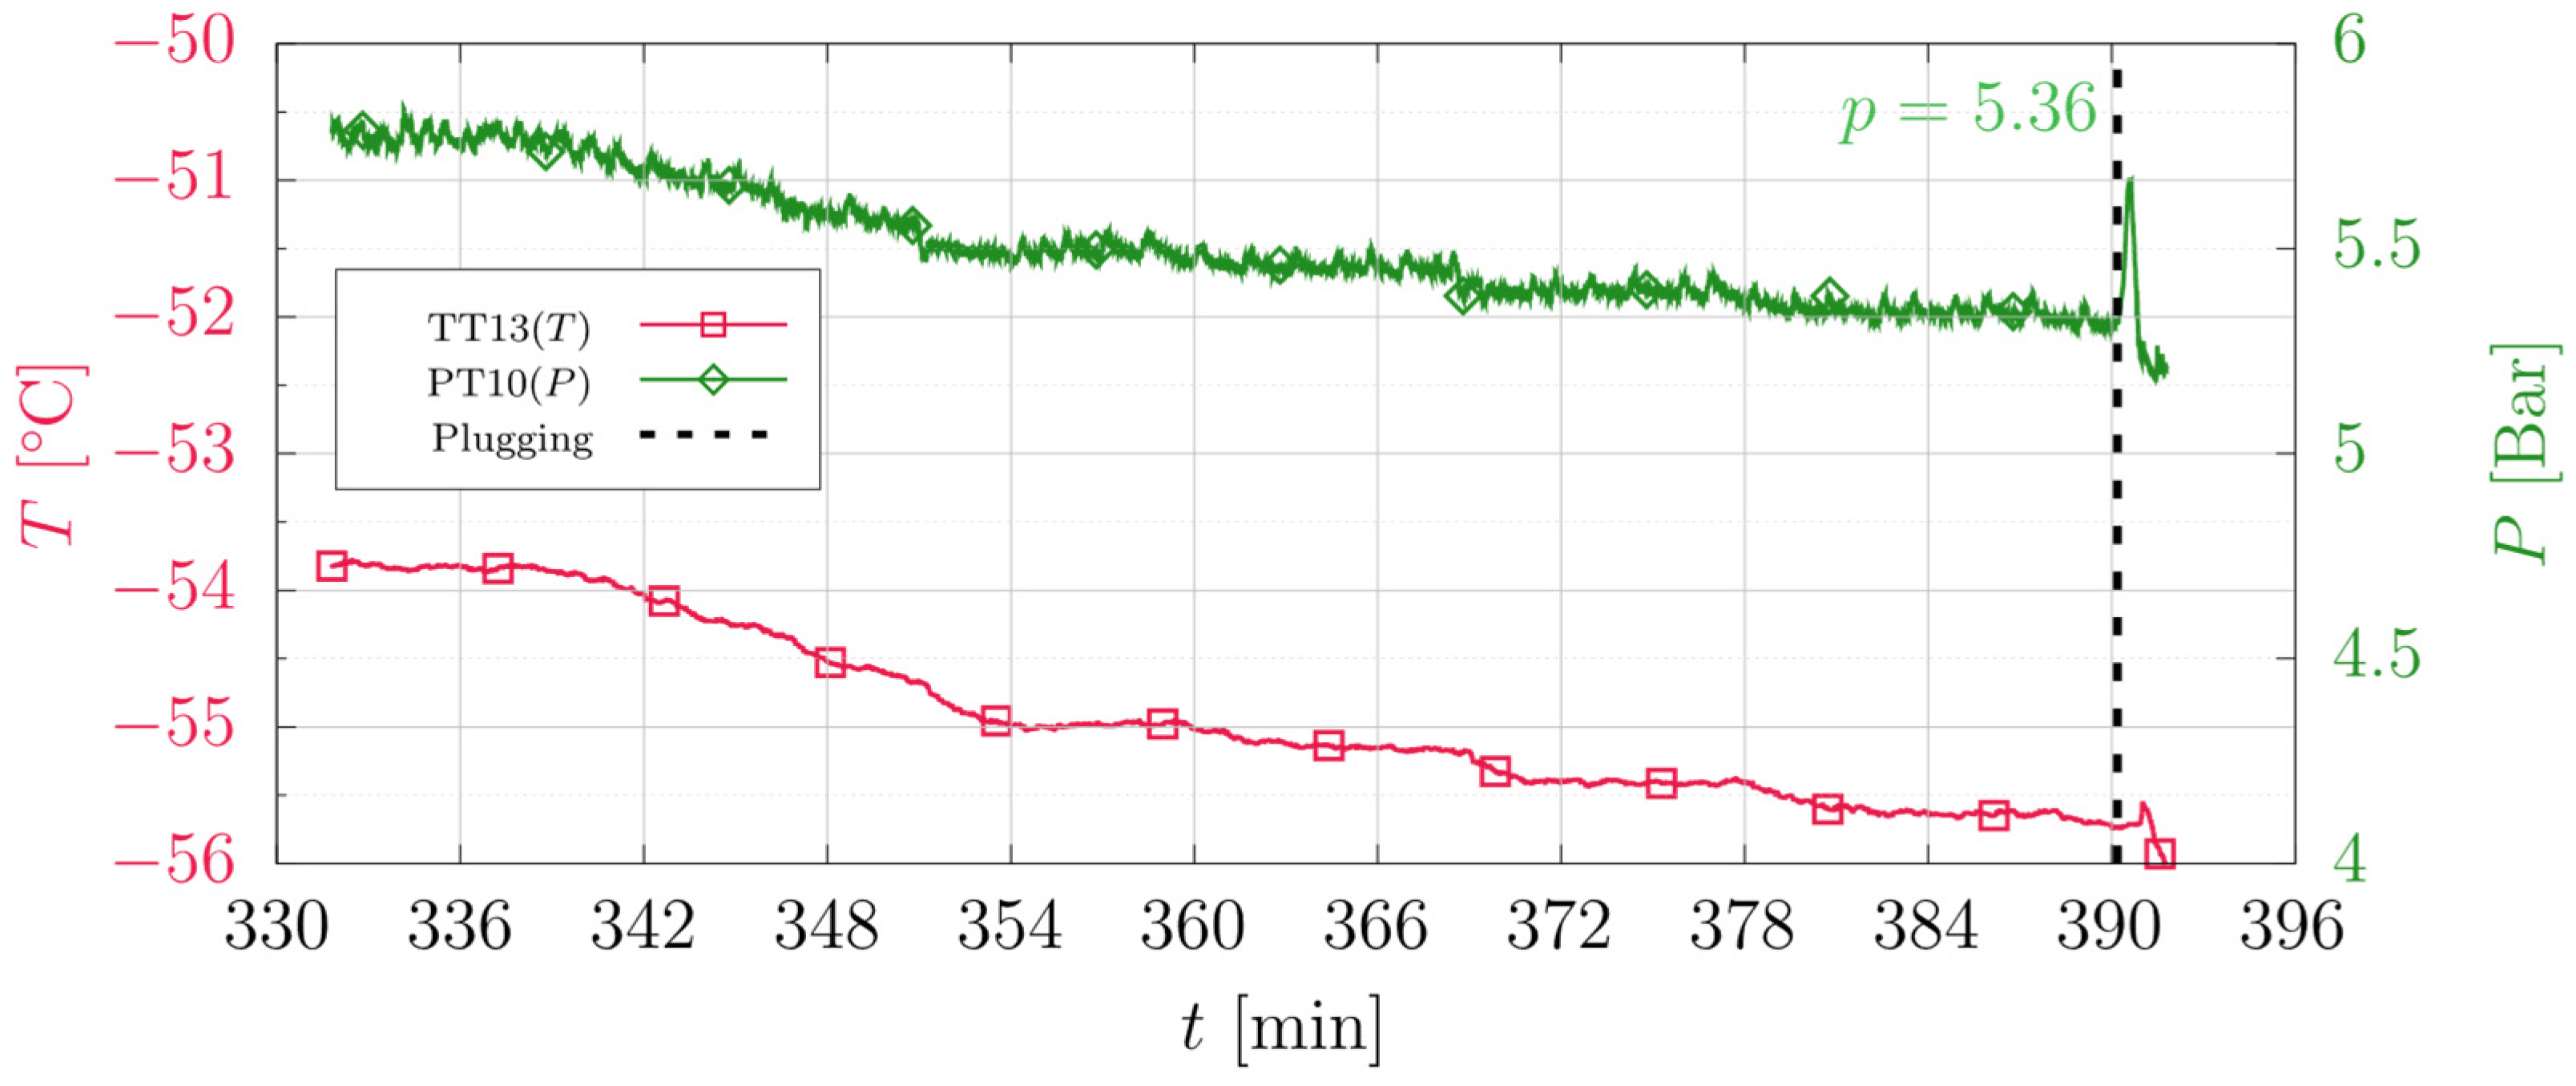
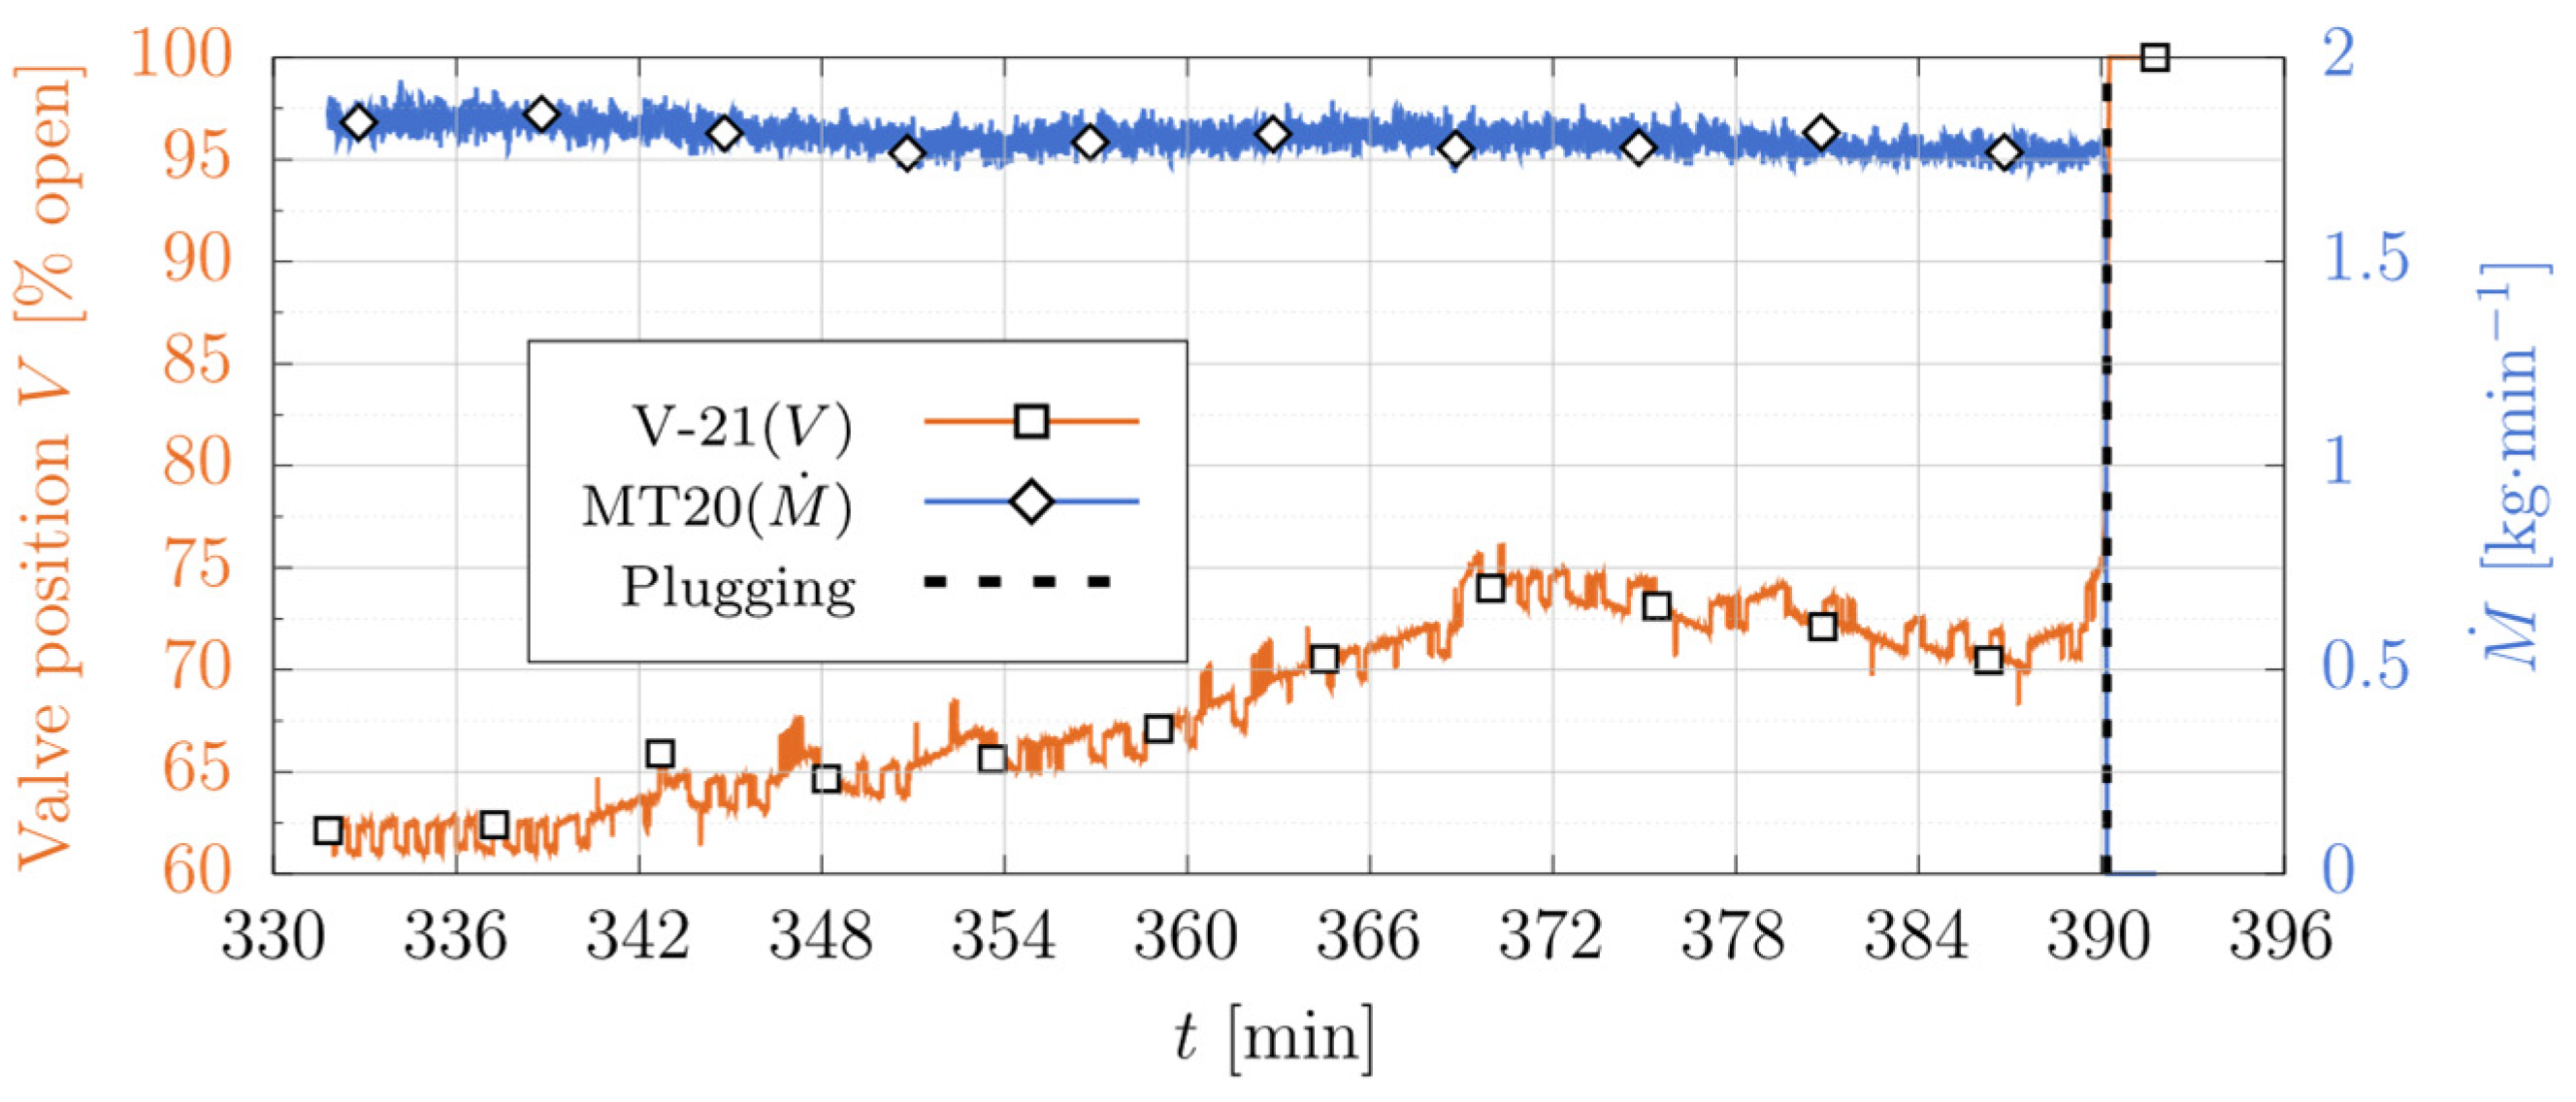
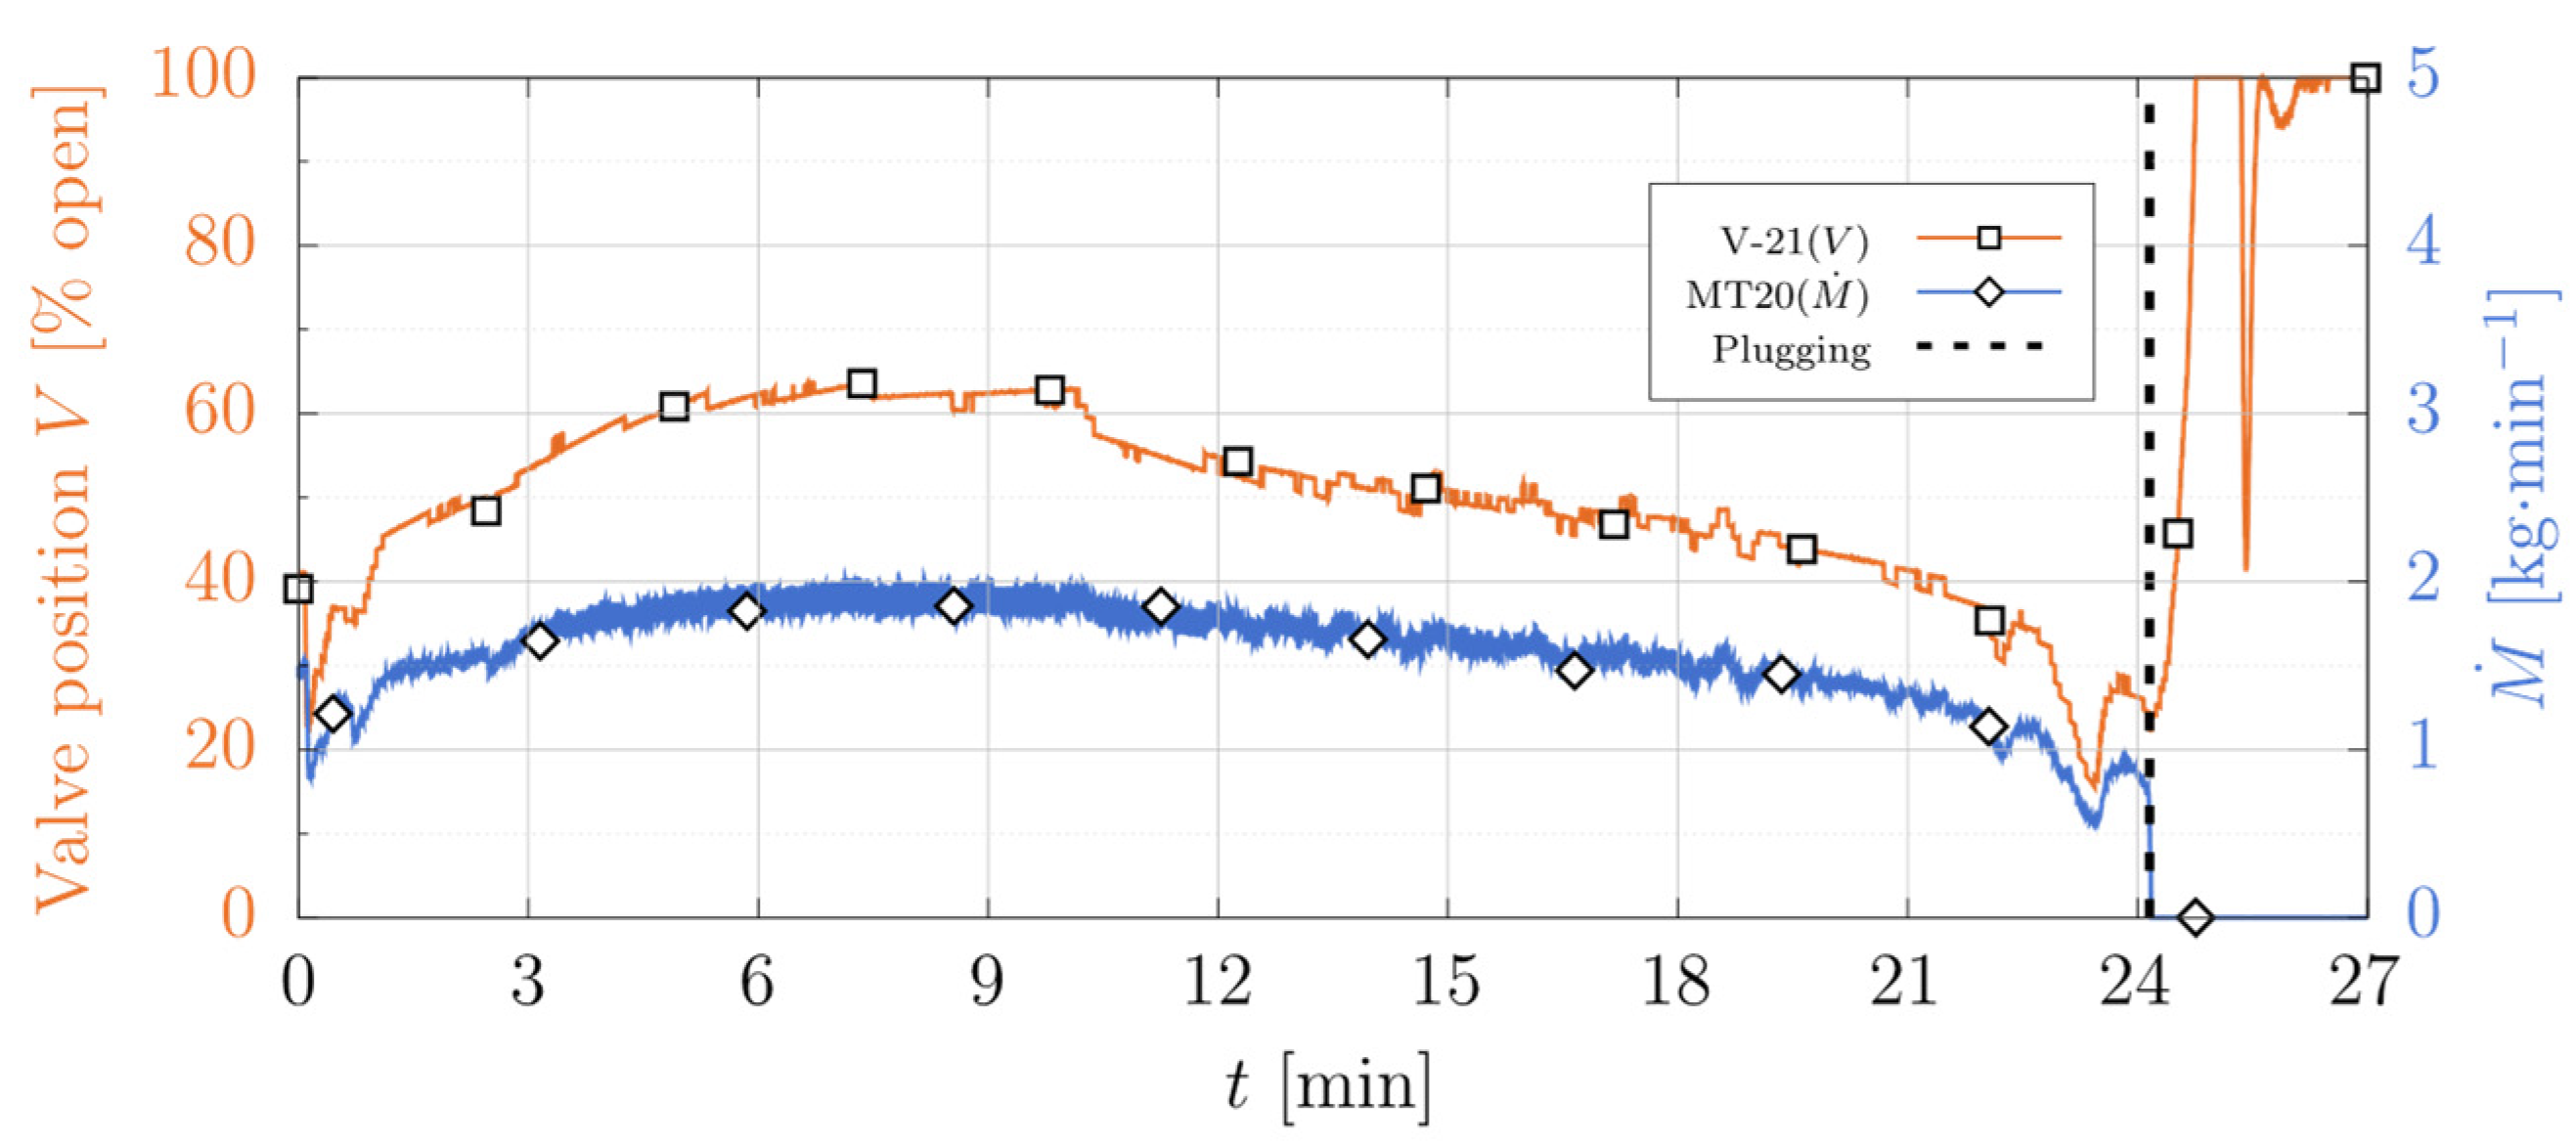
At the end of the experiment, the pressure was reduced continuously until plugging occurred at 5.36 bar(a). This is shown in Figure 5, for which the liquid temperature and pressure in SV02 are shown during the pressure reduction. Figure 6 shows the mass flow rate (MT20) and the valve position in V-21 during the same period. Here, it is clear that the mass flow rate goes to zero and the valve fully opens at the time of plugging.
3.2. CO2/N2 Mixtures
Four experiments were conducted with mixtures of CO2 and N2 with various compositions. Experiments 3–5 followed the first procedure for which the pressure was gradually reduced in SV02. The pressure was reduced until dry ice was observed and, eventually, plugging occurred. In experiment 6, the pressure was kept at 6.5 bar(a) for 5 h. Details for the results of the experiments with mixtures are given in the next sections.
3.2.1. Experiment 3
The main features of Experiment 3 are the 50% liquid level, corresponding to approximately 3.3 L of liquid, in both separators, the pressure of 30 bar in the first separator, and the temperature of −25 °C before the throttling valve into the second separator. Before the gradual reduction of pressure in the second separator was started, GC measurements were performed in sequence on the feed stream and the gas and liquid outlet streams from each separator. At this point the pressure was 9 bar in SV02. A few samples were taken from each of these sampling points before the sampling point was set to the liquid outlet of the first separator, where it was kept fixed during the remainder of the experiment. Average values of the measured compositions are given in Table 4.
The theoretical composition of the mixture at the various sampling points has been calculated with the thermodynamic library TREND with Helmholtz mixing rule. Generally, we found that the measured composition in the liquid phase of the first separator is richer in CO2 than predicted by TREND, while the composition in the liquid phase of the second separator is slightly leaner in CO2 than predicted by TREND. The deviation between predicted and measured composition in the liquid phase is less than 0.6% for SV01 and 0.15% for SV02.
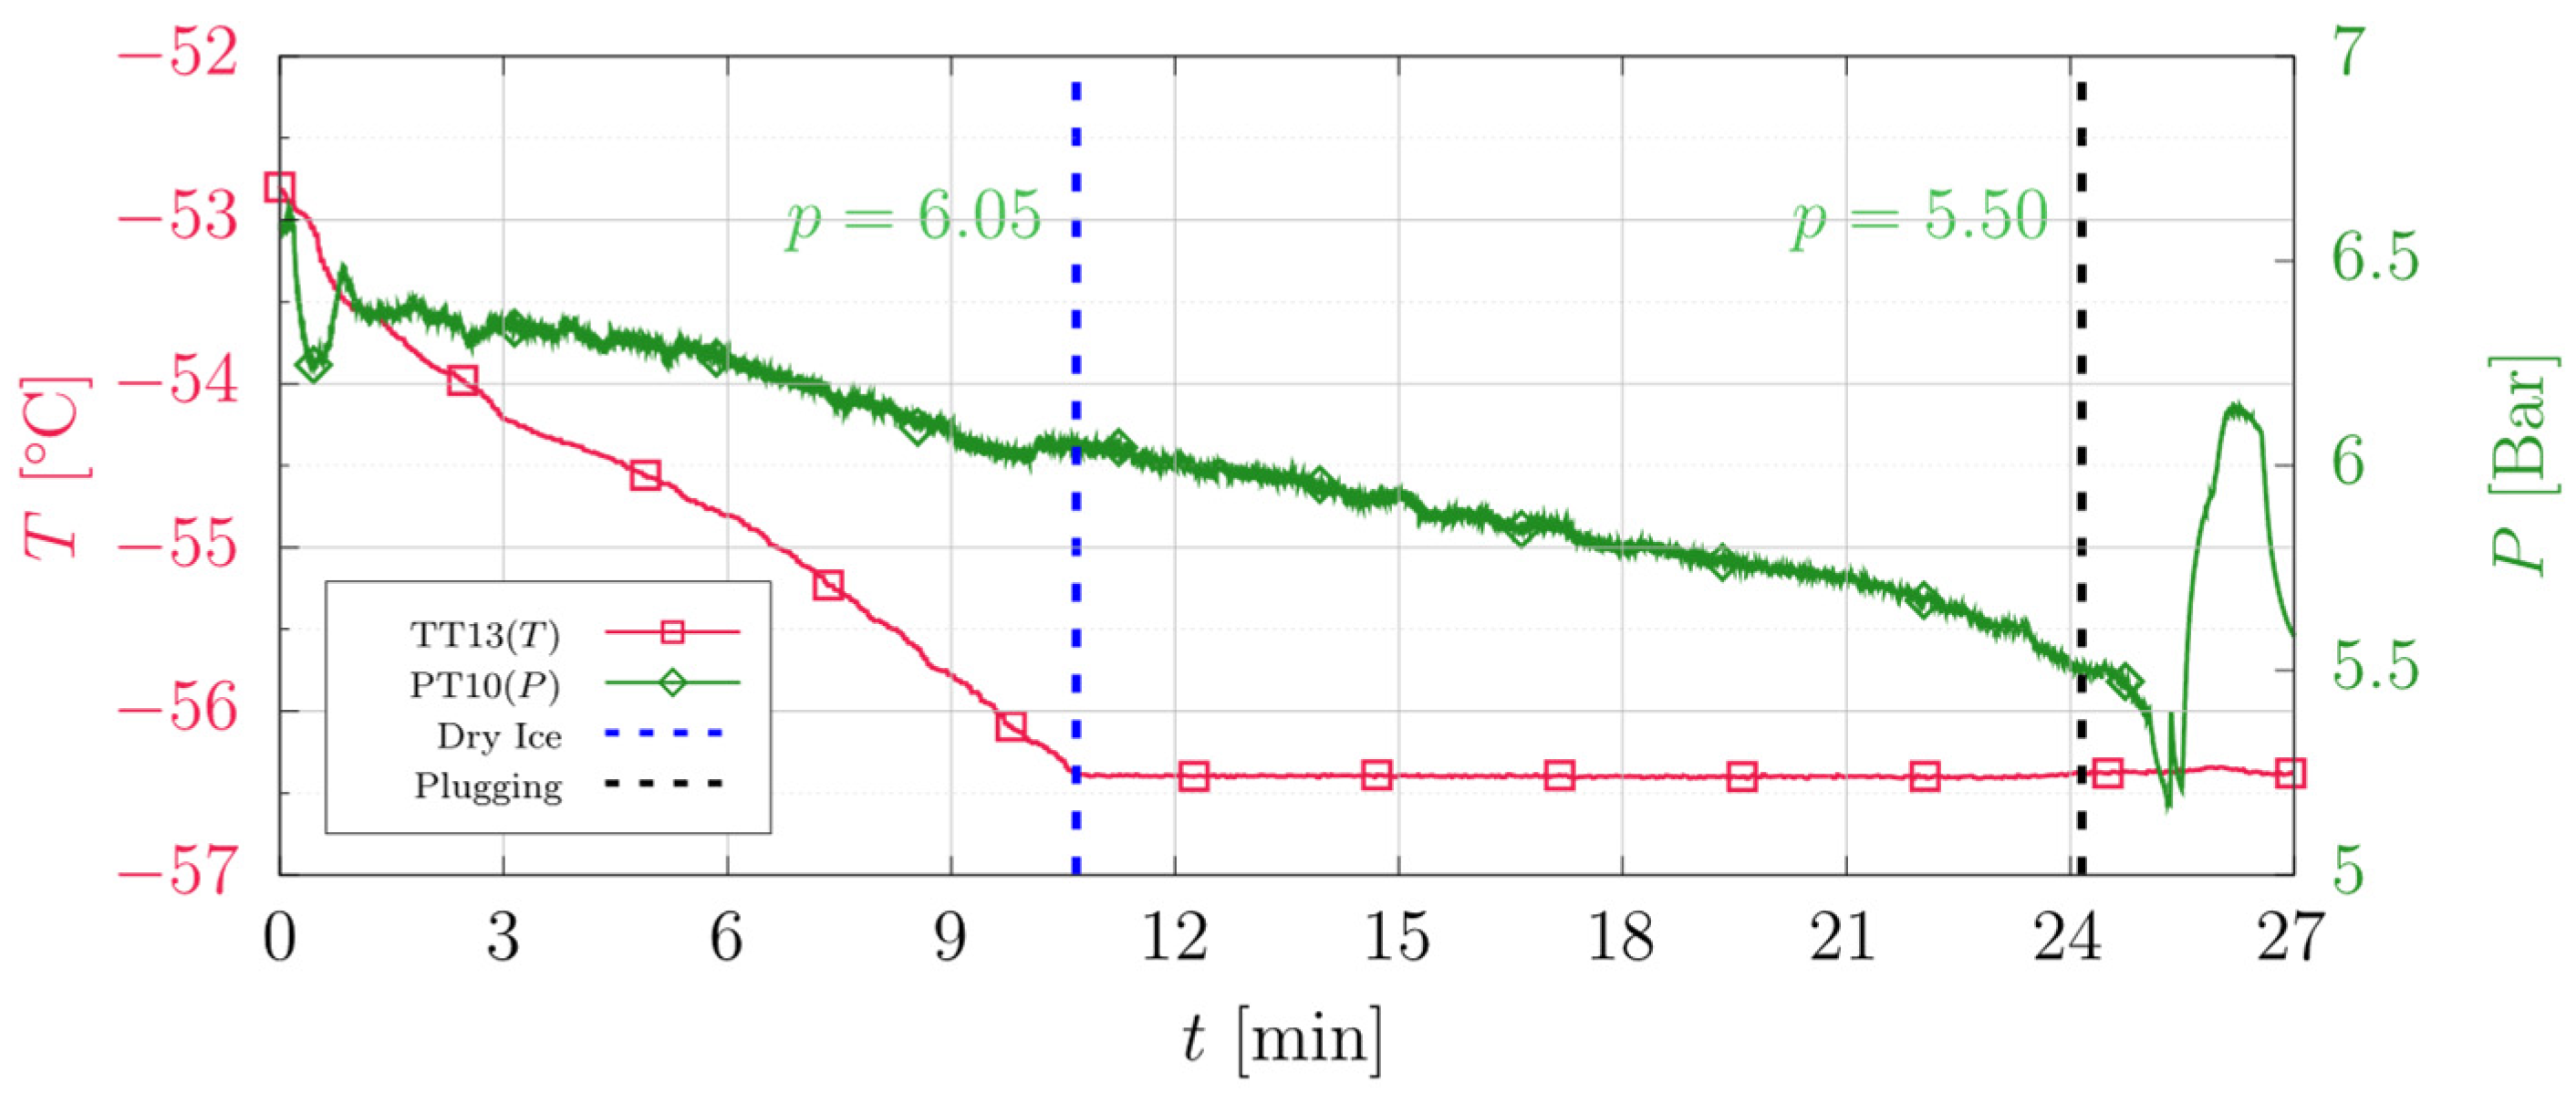
When the pressure in SV02 reaches 6.05 bar, we observe that the liquid temperature stabilizes at −56.3 °C despite the continued lowering of the pressure. This indicates that dry ice is present in the liquid. Figure 7 shows the pressure (PT10) and the liquid temperature (TT13) in SV02 during the final stages of Experiment 3. The stabilization in temperature after the pressure has reached 6.05 bar is clear from the figure. The pressure level at which dry ice is first observed is accurately predicted in TREND.
When the pressure reaches 5.50 bar, the mass flow out of the separator rapidly goes to zero, and the valve controlling the mass flow fully opens in a futile attempt to compensate for the diminished flow, see Figure 8. This marks the point of plugging of the system. Calculations in TREND show that theoretically, only vapor and solid will be produced in the expansion into SV02 at this pressure level. The reason that both the mass flow and valve position continuously decrease in the minutes before plugging is twofold. One reason is that the total system mass is reduced by shutting off make-up to the system. This is done to be able to reach the low-pressure levels in SV02. The other reason is that the liquid fraction formed in the expansion into SV02 decreases while the gas and solid fractions increase with decreasing pressure.
3.2.2. Experiment 4
For the fourth experiment the rig was configured in the same way as in Experiment 3, except for the composition in the feed stream. The GC measurements at the initiation of the experiment are shown in Table 5. The feed stream is approximately 10 mol% leaner in CO2 compared to the first experiment. The stream entering SV02 is however similar in composition, but 0.3 mol% leaner in CO2.
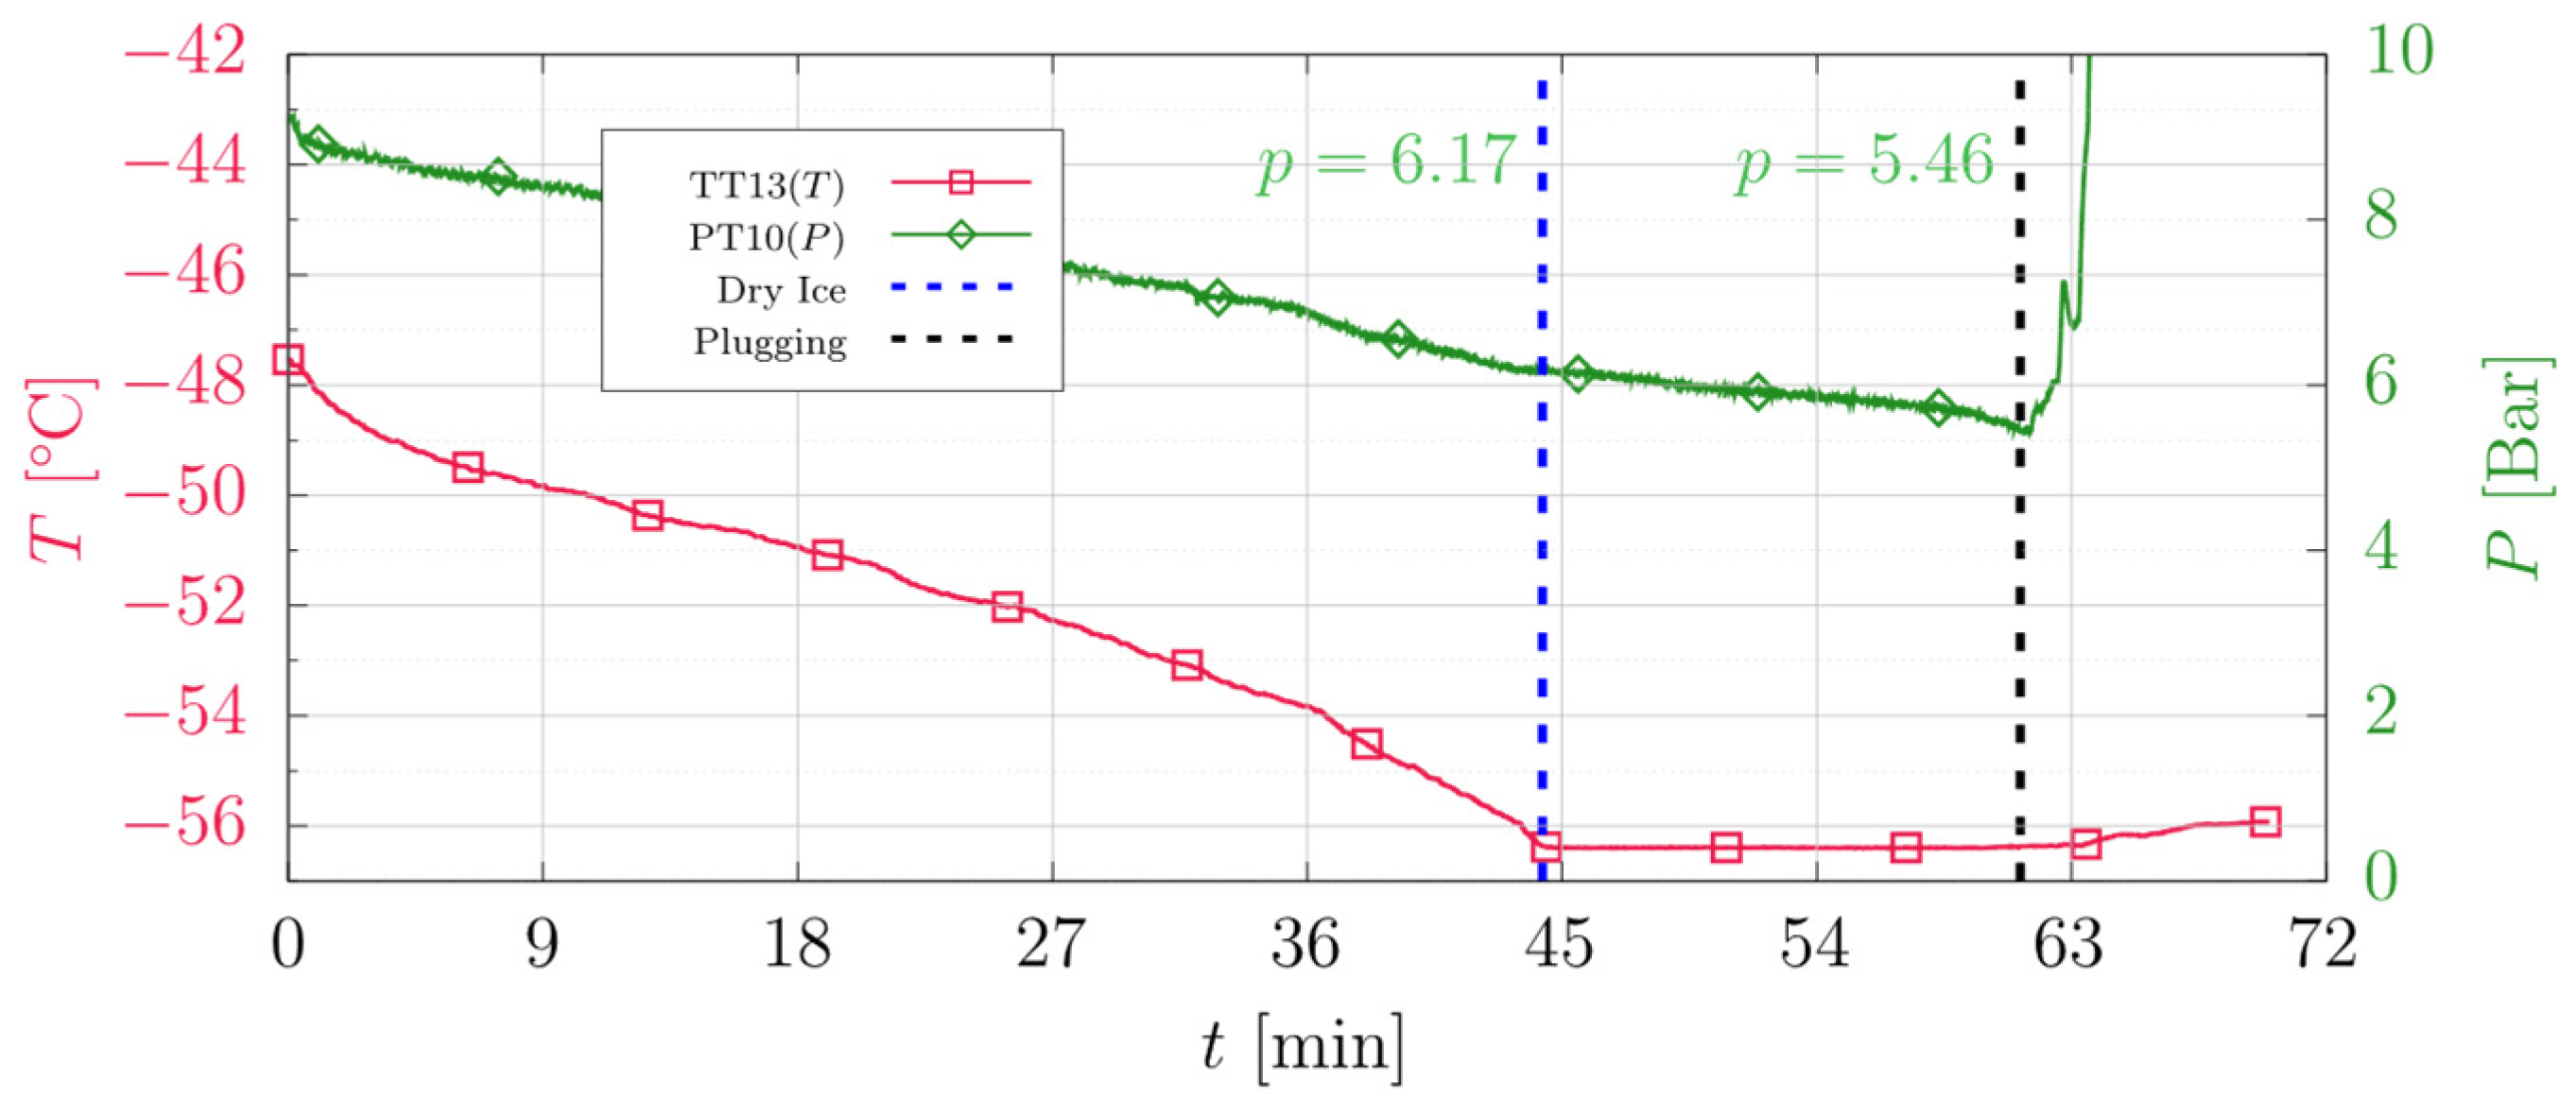
Figure 9 shows the pressure and liquid temperature in SV02 during the experiment. The pressure is continuously decreased from slightly above 9 bar down to 5.46 bar, where the system is clogged. The liquid temperature decreases with falling pressure until a pressure of about 6.17 bar is reached. At this point the liquid temperature flattens out at a temperature of −56.3 °C, indicating a phase change is taking place. Around 17 min later the system is plugged by dry ice, at a pressure of 5.46 bar. Solid CO2 formation occurs at a pressure of 0.12 bar and a temperature 0.3 °C higher than what is predicted by TREND. The liquid temperature when dry ice formed is nearly identical for Experiments 3 and 4. Plugging of the system occurs at 5.46 bar, 0.04 bar lower than what was observed in Experiment 3.
The calculated and experimentally measured vapor, liquid, and solid phase fractions after expansion to the separation pressure in SV02 are given in Table 6. The experimental phase fractions (mol/mol) are based on mass flow and GC measurements. The TREND calculations are in relatively good agreement with the measured values, particularly at the lowest pressure levels.
3.2.3. Experiment 5
In the fifth experiment, the rig was configured as in Experiments 3 and 4, except that the temperature setpoint of TT10 after HX03 was reduced to −35 °C. At steady conditions, GC measurements of the composition of the gas and liquid outlet from the two separators were performed. The results are given in Table 7.
Figure 10 shows the pressure and liquid temperature in SV02 during the experiment. The pressure is continuously decreased from slightly below 7.5 bar down to 5.43 bar, where the system became plugged. The liquid temperature falls with decreasing pressure until a pressure of about 6.46 bar is reached. At this point the liquid temperature flattens out at a temperature of −56.3 °C, indicating a phase change is taking place. Around 20 min later the system is plugged by dry ice, at a pressure of 5.47 bar. Directly before plugging occurs, the pressure rapidly drops to 5.20 bar, and then rises sharply to 5.47 bar. Solid CO2 formation occurs at a pressure 0.13 bar higher, and a temperature 0.3 °C higher than predicted in TREND.
The calculated and experimentally measured vapor, liquid and solid phase fractions after expansion to the separation pressure in SV02 are given in Table 8. The experimental phase fractions (mol/mol) are based on mass flow and GC measurements. The TREND calculations predict lower vapor fractions than measured at all pressure levels.
3.2.4. Experiment 6
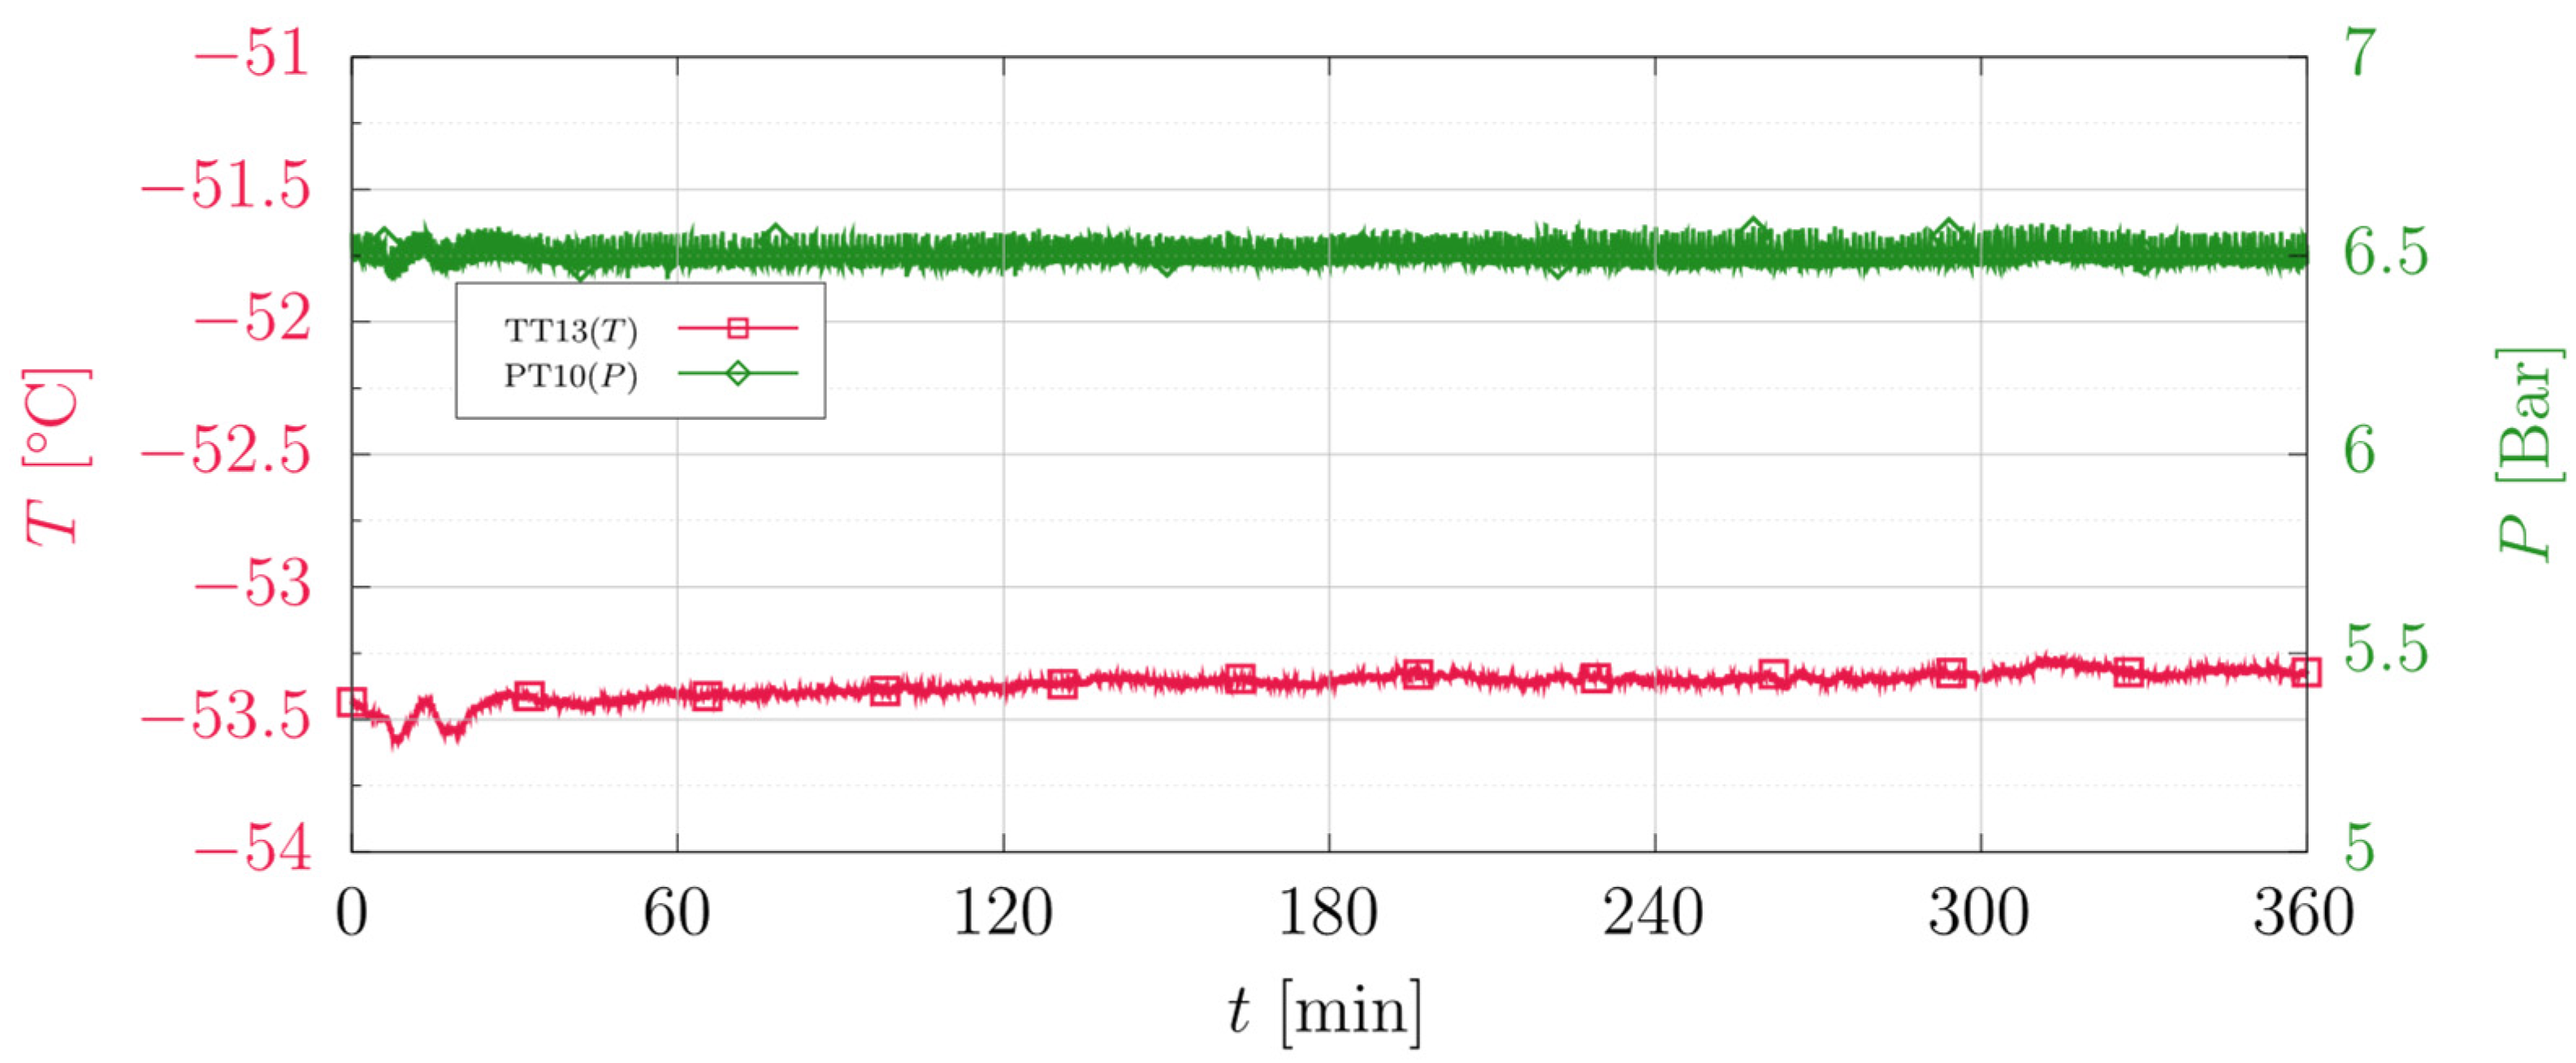
Through Experiments 3–5 we learned that dry ice formation is initiated at a pressure around 6–6.5 bar, depending on composition and process settings. To observe stable operation close to the freeze out pressure and ensure there is no undetected dry ice formation and accumulation over time, the pressure in SV02 in Experiment 6 is kept at 6.5 bar(a) for 5 h. During those 5 h, very stable pressures and temperatures were kept, as shown in Figure 11. The figure shows the liquid temperature (TT13) and the pressure (PT10) in SV02.
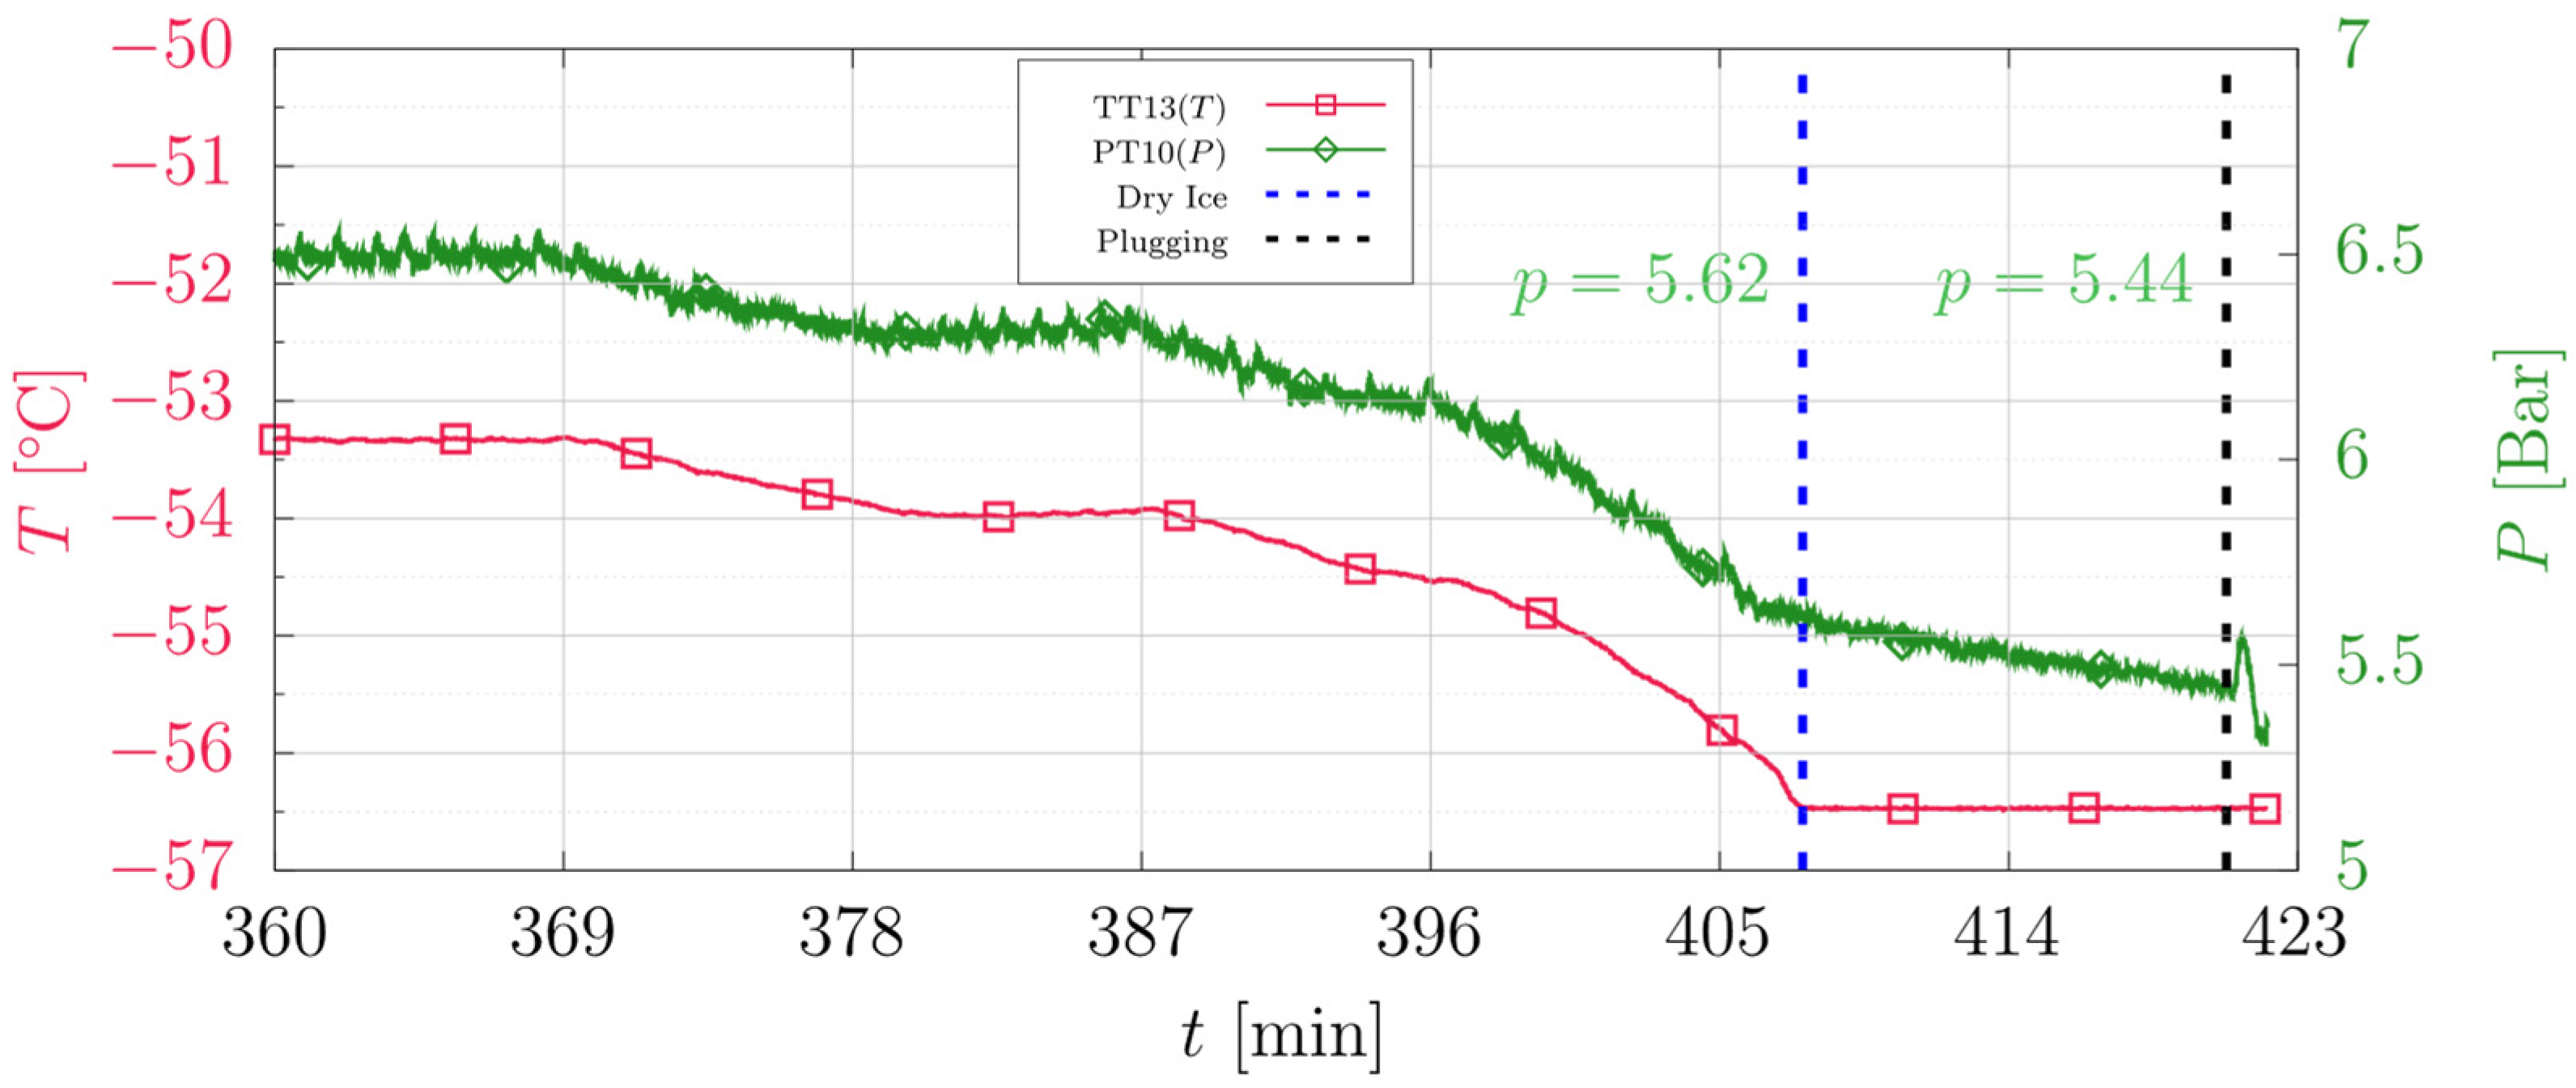
After 5 h of stable operation, the pressure was gradually reduced to observe the point of freeze out and plugging. The liquid temperature and pressure in SV02 during the reduction are shown in Figure 12. Dry ice formation is initiated at a pressure of 5.62 bar, which is the point where the temperature stabilizes while the pressure is further decreased. Plugging of the system occurs at 5.45 bar, which is verified by cessation of mass flow MT20 (not shown, but the behavior is similar to that shown in Figure 8).
The composition in the feed and the gas and liquid outlets of the separators were measured three times using a high accuracy gas chromatograph (GC) during the five hours of stable operation. A micro-GC was used to monitor the stability of the composition, and samples were taken every 5 min. The average concentrations are given in Table 9. The variation in the compositions during the 5 h of operation was less than 0.7% for all streams. For Experiment 6, a different GC was used than for the previous experiments, for which Argon was used as the carrier gas. The uncertainty in the GC measurements for mixtures with very high CO2 concentration (above 98%) is higher than for lower CO2 concentrations.
4. Discussion
Throughout this work, six experiments have been conducted in our unique experimental facility. The pilot scale liquefaction rig has been shown to operate steadily both with pure CO2 and with mixtures of CO2 and N2, for which we have good control of the composition. The process and composition have been shown to be steady throughout the experiments. The scale of experiments is in the range of 150–200 kg per hour, with a liquid holdup time in the magnitude of 2 min in each of the separators.
Two experiments with pure CO2 (99.992%) were conducted. In Experiment 1, the pressure was reduced stepwise from 6.5 to 5.4 bar (a). For this experiment, the liquid outlet of SV02 was plugged when the pressure in SV02 was at 5.35 bar(a), due to a fluctuation in the pressure when the control system was set to 5.4 bar (a). In Experiment 2, the rig was kept in a steady-state with a pressure of 5.8 bar(a) in SV02 for 5 h continuously. Thereafter, the pressure was gradually reduced until the liquid outlet was clogged by dry ice. This occurred at 5.36 bar(a), virtually the same pressure as clogging occurred in Experiment 1. That is about 0.17 bar above the triple point pressure of CO2. For both experiments, there are no indications of dry ice until clogging occurs. These experiments demonstrate that pure CO2 can safely be liquefied at pressures down to 5.8 bar(a) and provide a reference for the experiments using mixtures. The liquid temperature is measured to −53.63 °C which is 0.30 °C above the saturated liquid temperature for CO2. The separator is insulated with 50 mm Armaflex insulation, but some heat inleak is expected.
Keeping the rig in stable steady-state conditions with pure CO2 is much more challenging than when using mixtures, since the temperature and pressure are fully interconnected. The temperature before the throttling valve into SV02, TT10, must therefore be used as a control parameter for these experiments and is not kept constant as in the experiments using mixtures. It should be noted that these control challenges are caused by the rig being a closed loop with heat integration between the liquid CO2 product and the incoming feed stream. This will not be the case for an open, full-scale liquefaction plant. Other feedbacks, however, may be present, such as recycling of vapor streams from multiple flash stages.
Four experiments using mixtures of CO2 and N2 have been conducted. A binary feed gas mixture containing 76.7–86.5 mol% CO2 and N2 at the inlet to SV01 was used in these experiments. The composition of the main interest is however the SV01 liquid stream entering SV02. This composition is mainly dependent on the conditions in SV01 and is kept between 97.0 and 97.4 mol% CO2 for Experiment 3, 4, and 5.
Experiments 3 and 4 are almost identical. A pressure of 30 bar is kept in SV01, and the temperature is heated to −25 °C at the inlet to the second separator. Dry ice is detected when the pressure in SV02 reaches 6.05 bar(a) and 6.17 bar(a) in Experiment 3 and 4, respectively. This is 0.01 bar lower than predicted in TREND for Experiment 3 and 0.12 bar higher for Experiment 4. The temperature stabilizes at −56.3 °C for both experiments, which is approximately 0.30 °C higher than predicted. Clogging occurs when the pressure reaches 5.50 bar(a) and 5.46 bar(a), for Experiments 3 and 4. At this point, TREND predicts only vapor and solid to form in the expansion into SV02.
In Experiment 5, the rig was configured as in Experiments 3 and 4, except that the temperature setpoint of TT10 after HX03 was reduced to −35 °C. Dry ice is here detected at 6.46 bar(a). That is 0.29 and 0.41 bar higher than in Experiments 3 and 4. This shows how the heating of the liquid stream prior to the throttling into SV02 affects the pressure at which dry ice is formed. Clogging does, however, not occur until the pressure reaches 5.43 bar(a), slightly lower than in the two preceding experiments.
In Experiment 6, a binary CO2-N2 mixture with a feed composition of 94.66 mol% CO2 was used. The rig was kept in a steady-state for more than 5 h continuously with a liquid CO2 product pressure of 6.5 bar(a). No indication of dry ice formation was observed throughout this part of the experiment. The pressure was then gradually lowered. At 5.62 bar(a), dry ice was first observed. At 5.44 bar(a), the liquid outlet of SV02 was clogged by dry ice.
The product CO2 pressure level at which dry ice is first formed is dependent on several process parameters, and dry ice can be formed at higher or lower pressure levels than we have shown in our experiments for other configurations. The pressure level at which dry ice forms can be changed for instance by changing the conditions before the throttling into the final separator. Measures such as reducing the pressure, increasing the temperature, and increasing the purity of the CO2 rich stream before throttling can be used to reduce the final liquefaction pressure even further.
In further work, it is planned to perform experiments with mixtures containing additional impurities found in CO2 capture in hydrogen production from natural gas with CCS. That is H2, CH4, N2, and CO.
In the performed experiments, it is assumed that the CO2 stream is dehydrated before the liquefaction process. This is a reasonable assumption considering the stringent CO2 specifications given in for example the Northern Lights project, where a maximum H2O content of 30 ppm is stated [11]. There is, however, no consensus on what the maximum water content should be, and several less conservative specifications have been suggested [12]. As it is possible to form hydrates at low water content (<50 ppm [13,14]) when the temperature is low, it would be useful to conduct similar experiments where the limits for maximum water content and hydrate formation are tested. Less stringent CO2 specifications could reduce the cost of the CCS chain.
5. Conclusions
In this work we have performed low-pressure CO2 liquefaction experiments for pure CO2 and CO2-N2 mixtures relevant for ship transport of liquid CO2 in a CCS chain. The goal is to contribute to de-risking the liquefaction part of a low-pressure liquid CO2 transportation chain, which has been shown to be economically superior to higher pressure alternatives. The scale of experiments is in the range of 150–200 kg per hour. Through the experiments with mixtures of CO2 and N2 we have challenged the view on how low one can securely go in pressure in the liquefaction process without issues with freeze out of dry-ice and clogging of process equipment. As shown, the pressure in the second separator can be held steadily at 6.5 bar for 5 h without any operational problems regarding dry ice formation for the CO2/N2 mixture. A pressure of 5.8 bar(a) is kept for five hours for the experiment with pure CO2. The liquefaction process shows robustness towards dry ice formation in the CO2/N2 experiments. The process continues to operate after dry ice is first detected while the pressure is continuously lowered. Clogging does not occur until the final separation pressure has reached a level of between 5.50–5–43 bar(a) for the CO2-N2 mixtures, where only vapor and solid CO2 is predicted to form in the expansion into SV02. For the pure CO2 experiments there is no observation of the dry ice formation before the system is clogged at 5.36 bar(a).
Author Contributions
Conceptualization, S.T., J.H.G.S. and D.B.; Data curation, S.T., J.H.G.S., I.S., M.V.J. and D.B.; Formal analysis, S.T., J.H.G.S., I.S., M.V.J. and D.B.; Investigation, S.T., J.H.G.S., I.S. and D.B.; Methodology, S.T., J.H.G.S. and D.B.; Project administration, S.T.; Software, S.T. and D.B.; Validation, S.T., J.H.G.S., I.S. and D.B.; Visualization, M.V.J.; Writing—original draft, S.T., J.H.G.S., I.S., M.V.J. and D.B.; Writing—review and editing, S.T., J.H.G.S., I.S. and D.B. All authors have read and agreed to the published version of the manuscript.
Funding
This publication has been produced with support from the NCCS Research Centre, performed under the Norwegian research program Centers for Environment-friendly Energy Research (FME). The authors acknowledge the following partners for their contributions: Aker Solutions, Ansaldo Energia, Baker Hughes, CoorsTek Membrane Sciences, EMGS, Equinor, Gassco, Krohne, Larvik Shipping, Lundin, Norcem, Norwegian Oil and Gas, Quad Geometrics, Total, Vår Energi, and the Research Council of Norway (257579/E20).
Conflicts of Interest
The authors declare no conflict of interest. The funders had no role in the design of the study; in the collection, analyses, or interpretation of data; in the writing of the manuscript, or in the decision to publish the results.
References
- International Energy Agency (IEA). Energy Technology Perspectives 2020; International Energy Agency: Paris, France, 2020. [Google Scholar]
- IEAGHG. 2017-TR1 Feasibility Study for Ship Based Transport of Ethane to Europe and Back Hauling of CO2 to the USA; IEAGHG Technical Review; IEAGHG: Cheltenham, UK, 2017. [Google Scholar]
- Aspelund, A.; Mølnvik, M.; De Koeijer, G. Ship Transport of CO2. Chem. Eng. Res. Des. 2006, 84, 847–855. [Google Scholar] [CrossRef]
- Deng, H.; Roussanaly, S.; Skaugen, G. Techno-economic analyses of CO2 liquefaction: Impact of product pressure and impurities. Int. J. Refrig. 2019, 103, 301–315. [Google Scholar] [CrossRef]
- Roussanaly, S.; Deng, H.; Skaugen, G.; Gundersen, T. At what Pressure Shall CO2 Be Transported by Ship? An in-Depth Cost Comparison of 7 and 15 Barg Shipping. Energies 2021, 14, 5635. [Google Scholar] [CrossRef]
- Berstad, D.; Anantharaman, R.; Nekså, P. Low-temperature CO2 capture technologies—Applications and potential. Int. J. Refrig. 2013, 36, 1403–1416. [Google Scholar] [CrossRef]
- de Visser, E.; Hendriks, C.; Barrio, M.; Mølnvik, M.J.; de Koeijer, G.; Liljemark, S.; Le Gallo, Y. Dynamis CO2 quality recommendations. Int. J. Greenh. Gas Control. 2008, 2, 478–484. [Google Scholar] [CrossRef]
- Trædal, S.; Berstad, D. Experimental Investigation of CO2 Liquefaction for CO2 Capture from Cement Plants; Horizon 2020: H2020-LCE-2014-2015/H2020-LCE-2014-1: CEMCAP Deliverables; SINTEF Energy Research: Trondheim, Norway, 2018. [Google Scholar]
- Span, R.; Eckermann, T.; Herrig, S.; Hielscher, S.; Jäger, A.; Thol, M. TREND: Thermodynamic Reference and Engineering Data 2.0: Lehrstuhl für Thermodynamik; Ruhr-Universität Bochum: Bochum, Germany, 2015. [Google Scholar]
- Gernert, J.; Span, R. EOS–CG: A Helmholtz energy mixture model for humid gases and CCS mixtures. J. Chem. Thermodyn. 2016, 93, 274–293. [Google Scholar] [CrossRef]
- Environmental Risk Analysis and STRATEGY for Environmental Monitoring (EQUINOR). EL001 Northern Lights–Mottak og Permanent Lagring av CO2; Technical Report; EQUINOR ASA: Stavanger, Norway, 2021. [Google Scholar]
- Dugstad, A.; Svenningsen, G. Variation in CO2 Composition—Defining Safe Operation Windows: Review of Field Experience and Expreimental Work; ALIGN CCUS: Delft, The Netherlands, 2018. [Google Scholar]
- Li, H.; Jakobsen, J.P.; Stang, J. Hydrate formation during CO2 transport: Predicting water content in the fluid phase in equilibrium with the CO2-hydrate. Int. J. Greenh. Gas Control. 2011, 5, 549–554. [Google Scholar] [CrossRef]
- Jäger, A.; Vinš, V.; Span, R.; Hruby, J. Model for gas hydrates applied to CCS systems part III: Results and implementation in TREND 2.0. Fluid Phase Equilibria 2016, 429, 55–66. [Google Scholar] [CrossRef]
Figure 1.
Process flow diagram of the experimental setup.

Figure 2.
Pressure and liquid temperature in SV02 during the controlled stepwise reduction in pressure in Experiment 1 from 6.5 bar to 5.9 bar.
Figure 2.
Pressure and liquid temperature in SV02 during the controlled stepwise reduction in pressure in Experiment 1 from 6.5 bar to 5.9 bar.

Figure 3.
Pressure and liquid temperature in SV02 during the controlled stepwise reduction in pressure in Experiment 1 from 5.6 bar to 5.4 bar.
Figure 3.
Pressure and liquid temperature in SV02 during the controlled stepwise reduction in pressure in Experiment 1 from 5.6 bar to 5.4 bar.

Figure 4.
Pressure (PT10) and temperature (TT13) measurements in SV02 during Experiment 2.

Figure 5.
Pressure (PT10) and temperature (TT13) measurements in SV02 during the pressure reduction at the end of Experiment 2.
Figure 5.
Pressure (PT10) and temperature (TT13) measurements in SV02 during the pressure reduction at the end of Experiment 2.

Figure 6.
Mass follow rate (MT20) and valve position V-21 during the reduction of pressure at the end of Experiment 2. At the time of the plugging the mass flow rate of MT20 goes to zero and the valve V-21 opens fully to 100%.
Figure 6.
Mass follow rate (MT20) and valve position V-21 during the reduction of pressure at the end of Experiment 2. At the time of the plugging the mass flow rate of MT20 goes to zero and the valve V-21 opens fully to 100%.

Figure 7.
Pressure and liquid temperature in the second separator (SV02) during Experiment 3. The first vertical line shows the onset of freeze out, and the second marks the point of plugging.
Figure 7.
Pressure and liquid temperature in the second separator (SV02) during Experiment 3. The first vertical line shows the onset of freeze out, and the second marks the point of plugging.

Figure 8.
Mass flow rate out of the second separator together with the position of the valve controlling the mass flow in Experiment 3. The vertical line corresponds to the point of plugging of experiment 3.
Figure 8.
Mass flow rate out of the second separator together with the position of the valve controlling the mass flow in Experiment 3. The vertical line corresponds to the point of plugging of experiment 3.

Figure 9.
Pressure and liquid temperature in SV02 during Experiment 4.

Figure 10.
Pressure and liquid temperature in SV021 during Experiment 5.

Figure 11.
The liquid temperature and the pressure in SV02 during 5 h of stable operation in Experiment 6.
Figure 11.
The liquid temperature and the pressure in SV02 during 5 h of stable operation in Experiment 6.

Figure 12.
The liquid temperature and pressure in SV02 during the continuous reduction in pressure at the end of Experiment 6.
Figure 12.
The liquid temperature and pressure in SV02 during the continuous reduction in pressure at the end of Experiment 6.


Table 1.
Relevant characteristics for a selection of the components in the process.
| Power | Dimensions | Operating Temperatures | Operating Pressures | |
|---|---|---|---|---|
| EV01 | 250 L | Maximum 30 bar | ||
| C1 | 37 kW | <7–45 bar | ||
| C2 | 22 kW | 45–120 bar | ||
| Auxiliary refrigeration | 7 kW | −54 °C | ||
| HX03 | 5 kW | Immersion depth: 750 mm | −50 to 20 °C | 120 bar |
| SV01 | Inner diameter: 10 cm, height 140 cm | <−55 °C | 120 bar | |
| SV02 | Inner diameter: 10 cm, height 140 cm | <−55 °C | 30 bar |
Table 2.
Uncertainties for selected components.
| Tag | Type | Stated Accuracy | Calibration |
|---|---|---|---|
| TT-10 | OMEGA M12LCP-TSS-1/8-U-0600 Thermocouple type T | Specially calibrated for −15 to −45 °C (2021) | |
| TT-06 | OMEGA P-M-A-1/8-6-0-T-33 PT100 1/8 PT-100 | Class A | Specially calibrated for −15 to −60 °C (2021) |
| TT-07 | OMEGA P-M-A-1/8-6-0-T-33 PT100 1/8 PT-101 | Class A | Specially calibrated for −15 to −60 °C (2021) |
| TT-12 | OMEGA P-M-A-1/8-6-0-T-33 PT100 1/8 PT-102 | Class A | Specially calibrated for −15 to −60 °C (2021) |
| TT-13 | OMEGA P-M-A-1/8-6-0-T-33 PT100 1/8 PT-103 | Class A | Specially calibrated for −15 to −60 °C (2021) |
| PT-04 | Keller PAA-33XEi | ±0.1% FS (FS: 300 barA) | Calibration −0.034 to 0.038% FS |
| PT-10 | Keller PAA-33XEi | ±0.1% FS (FS: 30 barA) | Calibration −0.007 to 0.008% FS |
| MT-20 | Rheonik RHM08 | ±0.5% | |
| MT-30 | Endress+Hauser 83F08-CCVSBADEAEAT | ±0.35% | Calibration: ±0.25% |
Table 3.
Settings and parameters for experiments 1–6.
| Experiment | 1 | 2 | 3 | 4 | 5 | 6 |
|---|---|---|---|---|---|---|
| Feed composition | 100% CO2 | 100% CO2 | 86.5% CO2 13.5% N2 | 76.7% CO2 23.3% N2 | 76.7% CO2 23.3% N2 | 94.2% CO2 5.8% N2 |
| Liquid level separators | 60% | 60% | 50% | 50% | 50% | 55% |
| Pressure SV01 (PT04) | 17 bar | 17 bar | 30 bar | 30 bar | 30 bar | 22 bar |
| Temperature at inlet to SV02 (TT10) | −22 °C * | −25 °C * | −25 °C | −25 °C | −35 °C | −25 °C |
| Initial pressure SV02 (PT10) | 6.5 bar | 5.8 bar | 8.5 bar | 9.0 bar | 8.5 bar | 6.5 bar |
| End pressure SV02 (PT10) | 5.4 bar | 5.4 bar | 5.5 bar | 5.5 bar | 5.4 bar | 5.4 bar |
* Average values. Had to be adjusted ±5 °C for control purposes.
Table 4.
GC measurements at the initiation of Experiment 3.
| Stream | Composition (Mol%) | |
|---|---|---|
| CO2 | N2 | |
| Feed | 86.5 | 13.5 |
| SV01 gas | 33.6 | 66.4 |
| SV01 liquid | 97.3 | 2.7 |
| SV02 gas | 84.0 | 16.0 |
| SV02 liquid | 99.7 | 0.3 |
Table 5.
Gas chromatograph measurements at the start of Experiment 4.
| Stream | Composition (Mol%) | |
|---|---|---|
| CO2 | N2 | |
| Feed | 76.7 | 23.3 |
| SV01 liquid | 97.0 | 3.0 |
Table 6.
Calculated values in TREND and experimental results for vapor, liquid, and gas phase fractions after expansion to the separation pressure in SV02 in Experiment 4.
Table 6.
Calculated values in TREND and experimental results for vapor, liquid, and gas phase fractions after expansion to the separation pressure in SV02 in Experiment 4.
| TREND | Experimental Results | ||||||
|---|---|---|---|---|---|---|---|
| Pressure (Bar) | Temperature (°C) | Vapor Fraction | Liquid Fraction | Solid Fraction | Temperature (°C) | Vapor Fraction | Liquid and Solid Fraction |
| 6.20 | −56.02 | 0.232 | 0.768 | −55.80 | 0.214 | 0.780 | |
| 6.10 | −56.37 | 0.233 | 0.767 | −56.30 | 0.229 | 0.779 | |
| 6.00 | −56.58 | 0.245 | 0.738 | 0.017 | −56.29 | 0.252 | 0.762 |
| 5.90 | −56.58 | 0.275 | 0.654 | 0.071 | −56.29 | 0.278 | 0.717 |
| 5.80 | −56.58 | 0.321 | 0.530 | 0.149 | −56.30 | 0.320 | 0.677 |
| 5.70 | −56.57 | 0.372 | 0.390 | 0.238 | −56.30 | 0.378 | 0.595 |
| 5.60 | −56.57 | 0.455 | 0.164 | 0.381 | −56.27 | 0.530 | 0.333 |
| 5.50 | −56.70 | 0.515 | 0.485 | −56.27 | 0.549 | 0.413 | |
Table 7.
GC measurements at the initial state of Experiment 5.
| Stream | Composition (Mol%) | |
|---|---|---|
| CO2 | N2 | |
| SV01 gas | 25.1 | 74.9 |
| SV01 liquid | 97.4 | 2.6 |
| SV02 gas | 86.9 | 13.1 |
| SV02 liquid | 99.9 | 0.1 |
Table 8.
Calculated values in TREND and experimental results for vapor, liquid, and solid phase fractions after expansion to the separation pressure in SV02.
Table 8.
Calculated values in TREND and experimental results for vapor, liquid, and solid phase fractions after expansion to the separation pressure in SV02.
| TREND | Experimental Results | ||||||
|---|---|---|---|---|---|---|---|
| Pressure (Bar) | Temperature (°C) | Vapor Fraction | Liquid Fraction | Solid Fraction | Temperature (°C) | Vapor Fraction | Liquid and Solid Fraction |
| 6.50 | −56.09 | 0.153 | 0.847 | −55.39 | 0.158 | 0.845 | |
| 6.20 | −56.59 | 0.174 | 0.794 | 0.032 | −56.29 | 0.212 | 0.788 |
| 6.10 | −56.59 | 0.191 | 0.748 | 0.061 | −56.29 | 0.225 | 0.774 |
| 5.60 | −56.57 | 0.395 | 0.191 | 0.413 | −56.28 | 0.529 | 0.456 |
| 5.50 | −56.66 | 0.495 | 0.535 | −56.27 | 0.532 | 0.453 | |
| 5.40 | −56.92 | 0.466 | 0.534 | −56.26 | 0.522 | 0.463 | |
| 5.30 | −57.47 | 0.466 | 0.534 | −56.26 | 0.482 | 0.504 | |
Table 9.
Composition of the feed and the gas and liquid outlet of SV01 and SV02 as measured with the GC in Experiment 6.
Table 9.
Composition of the feed and the gas and liquid outlet of SV01 and SV02 as measured with the GC in Experiment 6.
| Stream | Composition (Mol%) | |
|---|---|---|
| CO2 | N2 | |
| Feed | 94.66 | 5.34 |
| SV01 gas | 56.54 | 43.46 |
| SV01 liquid | 99.94 | 0.06 |
| SV02 gas | 91.36 | 8.64 |
| SV02 liquid | 99.96 | 0.04 |
Publisher’s Note: MDPI stays neutral with regard to jurisdictional claims in published maps and institutional affiliations. |
© 2021 by the authors. Licensee MDPI, Basel, Switzerland. This article is an open access article distributed under the terms and conditions of the Creative Commons Attribution (CC BY) license (https://creativecommons.org/licenses/by/4.0/).
Share and Cite
MDPI and ACS Style
Trædal, S.; Stang, J.H.G.; Snustad, I.; Johansson, M.V.; Berstad, D. CO2 Liquefaction Close to the Triple Point Pressure. Energies 2021, 14, 8220. https://0-doi-org.brum.beds.ac.uk/10.3390/en14248220
AMA Style
Trædal S, Stang JHG, Snustad I, Johansson MV, Berstad D. CO2 Liquefaction Close to the Triple Point Pressure. Energies. 2021; 14(24):8220. https://0-doi-org.brum.beds.ac.uk/10.3390/en14248220
Chicago/Turabian StyleTrædal, Stian, Jacob Hans Georg Stang, Ingrid Snustad, Martin Viktor Johansson, and David Berstad. 2021. "CO2 Liquefaction Close to the Triple Point Pressure" Energies 14, no. 24: 8220. https://0-doi-org.brum.beds.ac.uk/10.3390/en14248220
Note that from the first issue of 2016, this journal uses article numbers instead of page numbers. See further details here.