
Evaluating the Curtailment Risk of Non-Firm Utility-Scale Solar Photovoltaic Plants under a Novel Last-In First-Out Principle of Access Interconnection Agreement

 ,
,  and
and 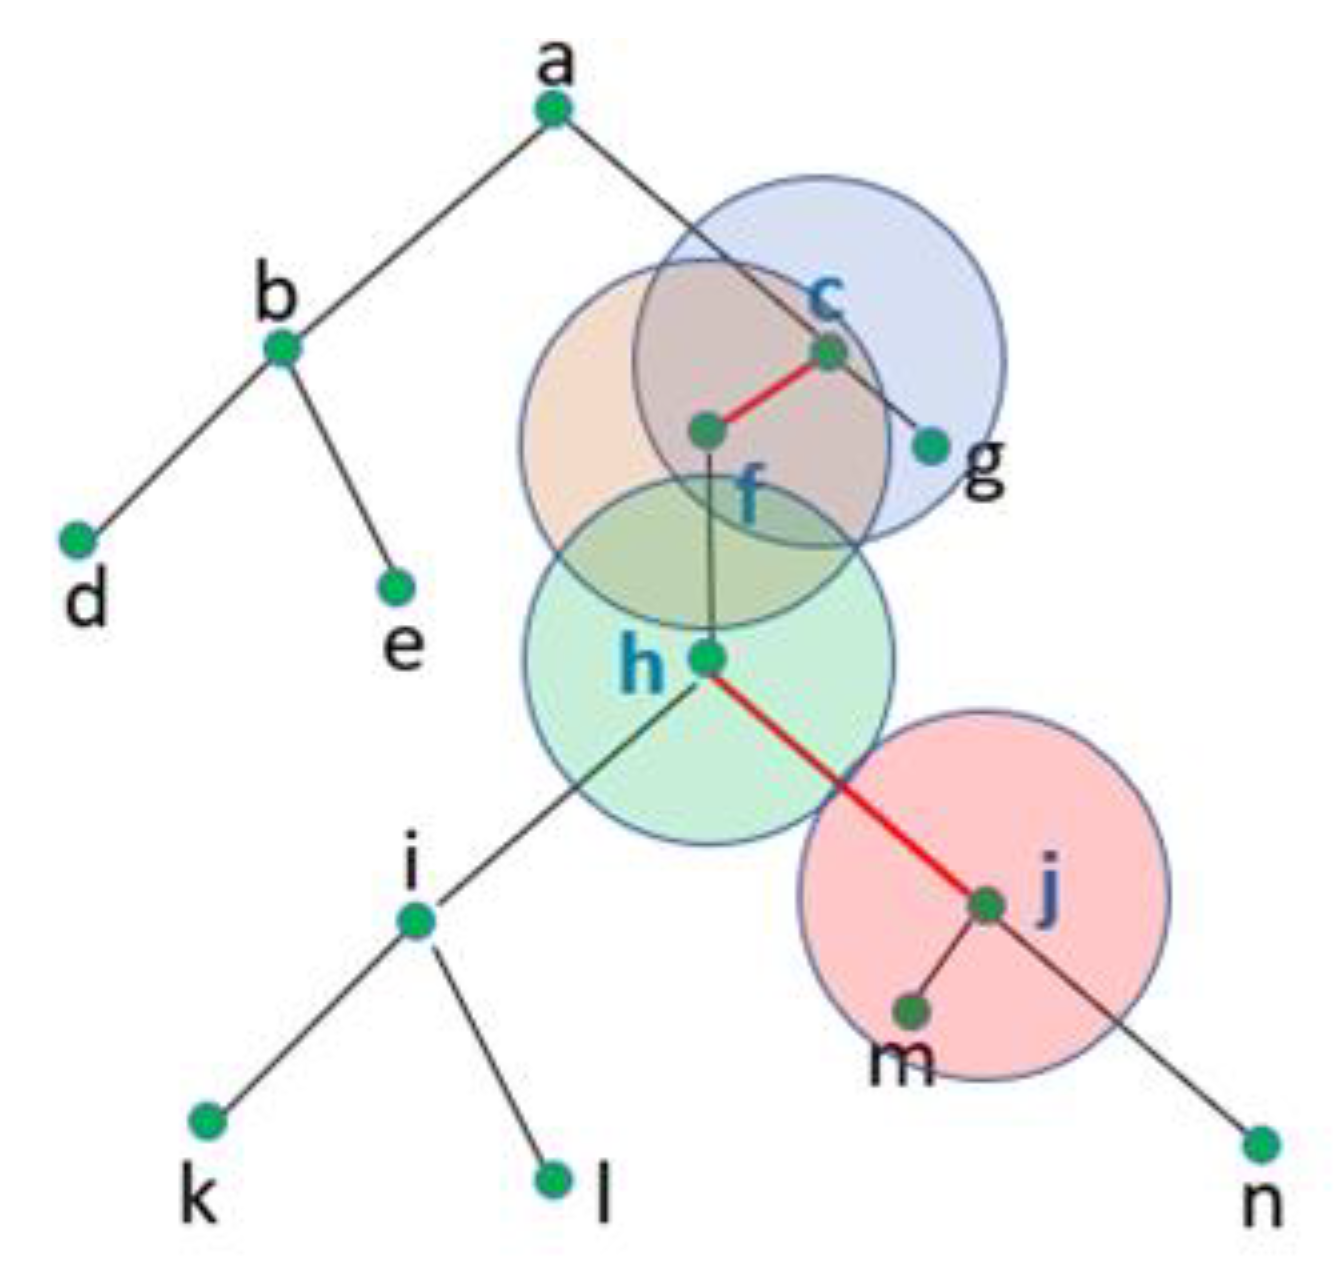
Abstracts
1. Introduction
- Last-in, first-out (LiFo): the last non-firm generator to connect is the first to be curtailed in case a network constraint is violated, and the first to connect is the last to be curtailed if the violation persists.
- Pro rata: the required curtailment volume is equally distributed among all non-firm generators.
- Shedding rota: curtails non-firm generators in a predefined rotational order updated on a regular basis (e.g., every day).
- Technical best: curtailment is assigned to non-firm generators based on their contribution to the network constraint violation.
- Greatest carbon benefit: curtailment is assigned to non-firm generators based on their carbon emission levels with the objective to minimize overall carbon emission.
- Most convenient: generators are curtailed based on the DSO’s preference, i.e., which could be because of convenience and effectiveness.
- Generator size: the first generator to be curtailed is the one with the highest output that is contributing to the violation.
- First, we introduce a novel flexible interconnection scheme based on the LiFo framework with the objective to minimize unnecessary curtailment of non-firm generation resources while considering the access rights of individual flexible generation units.
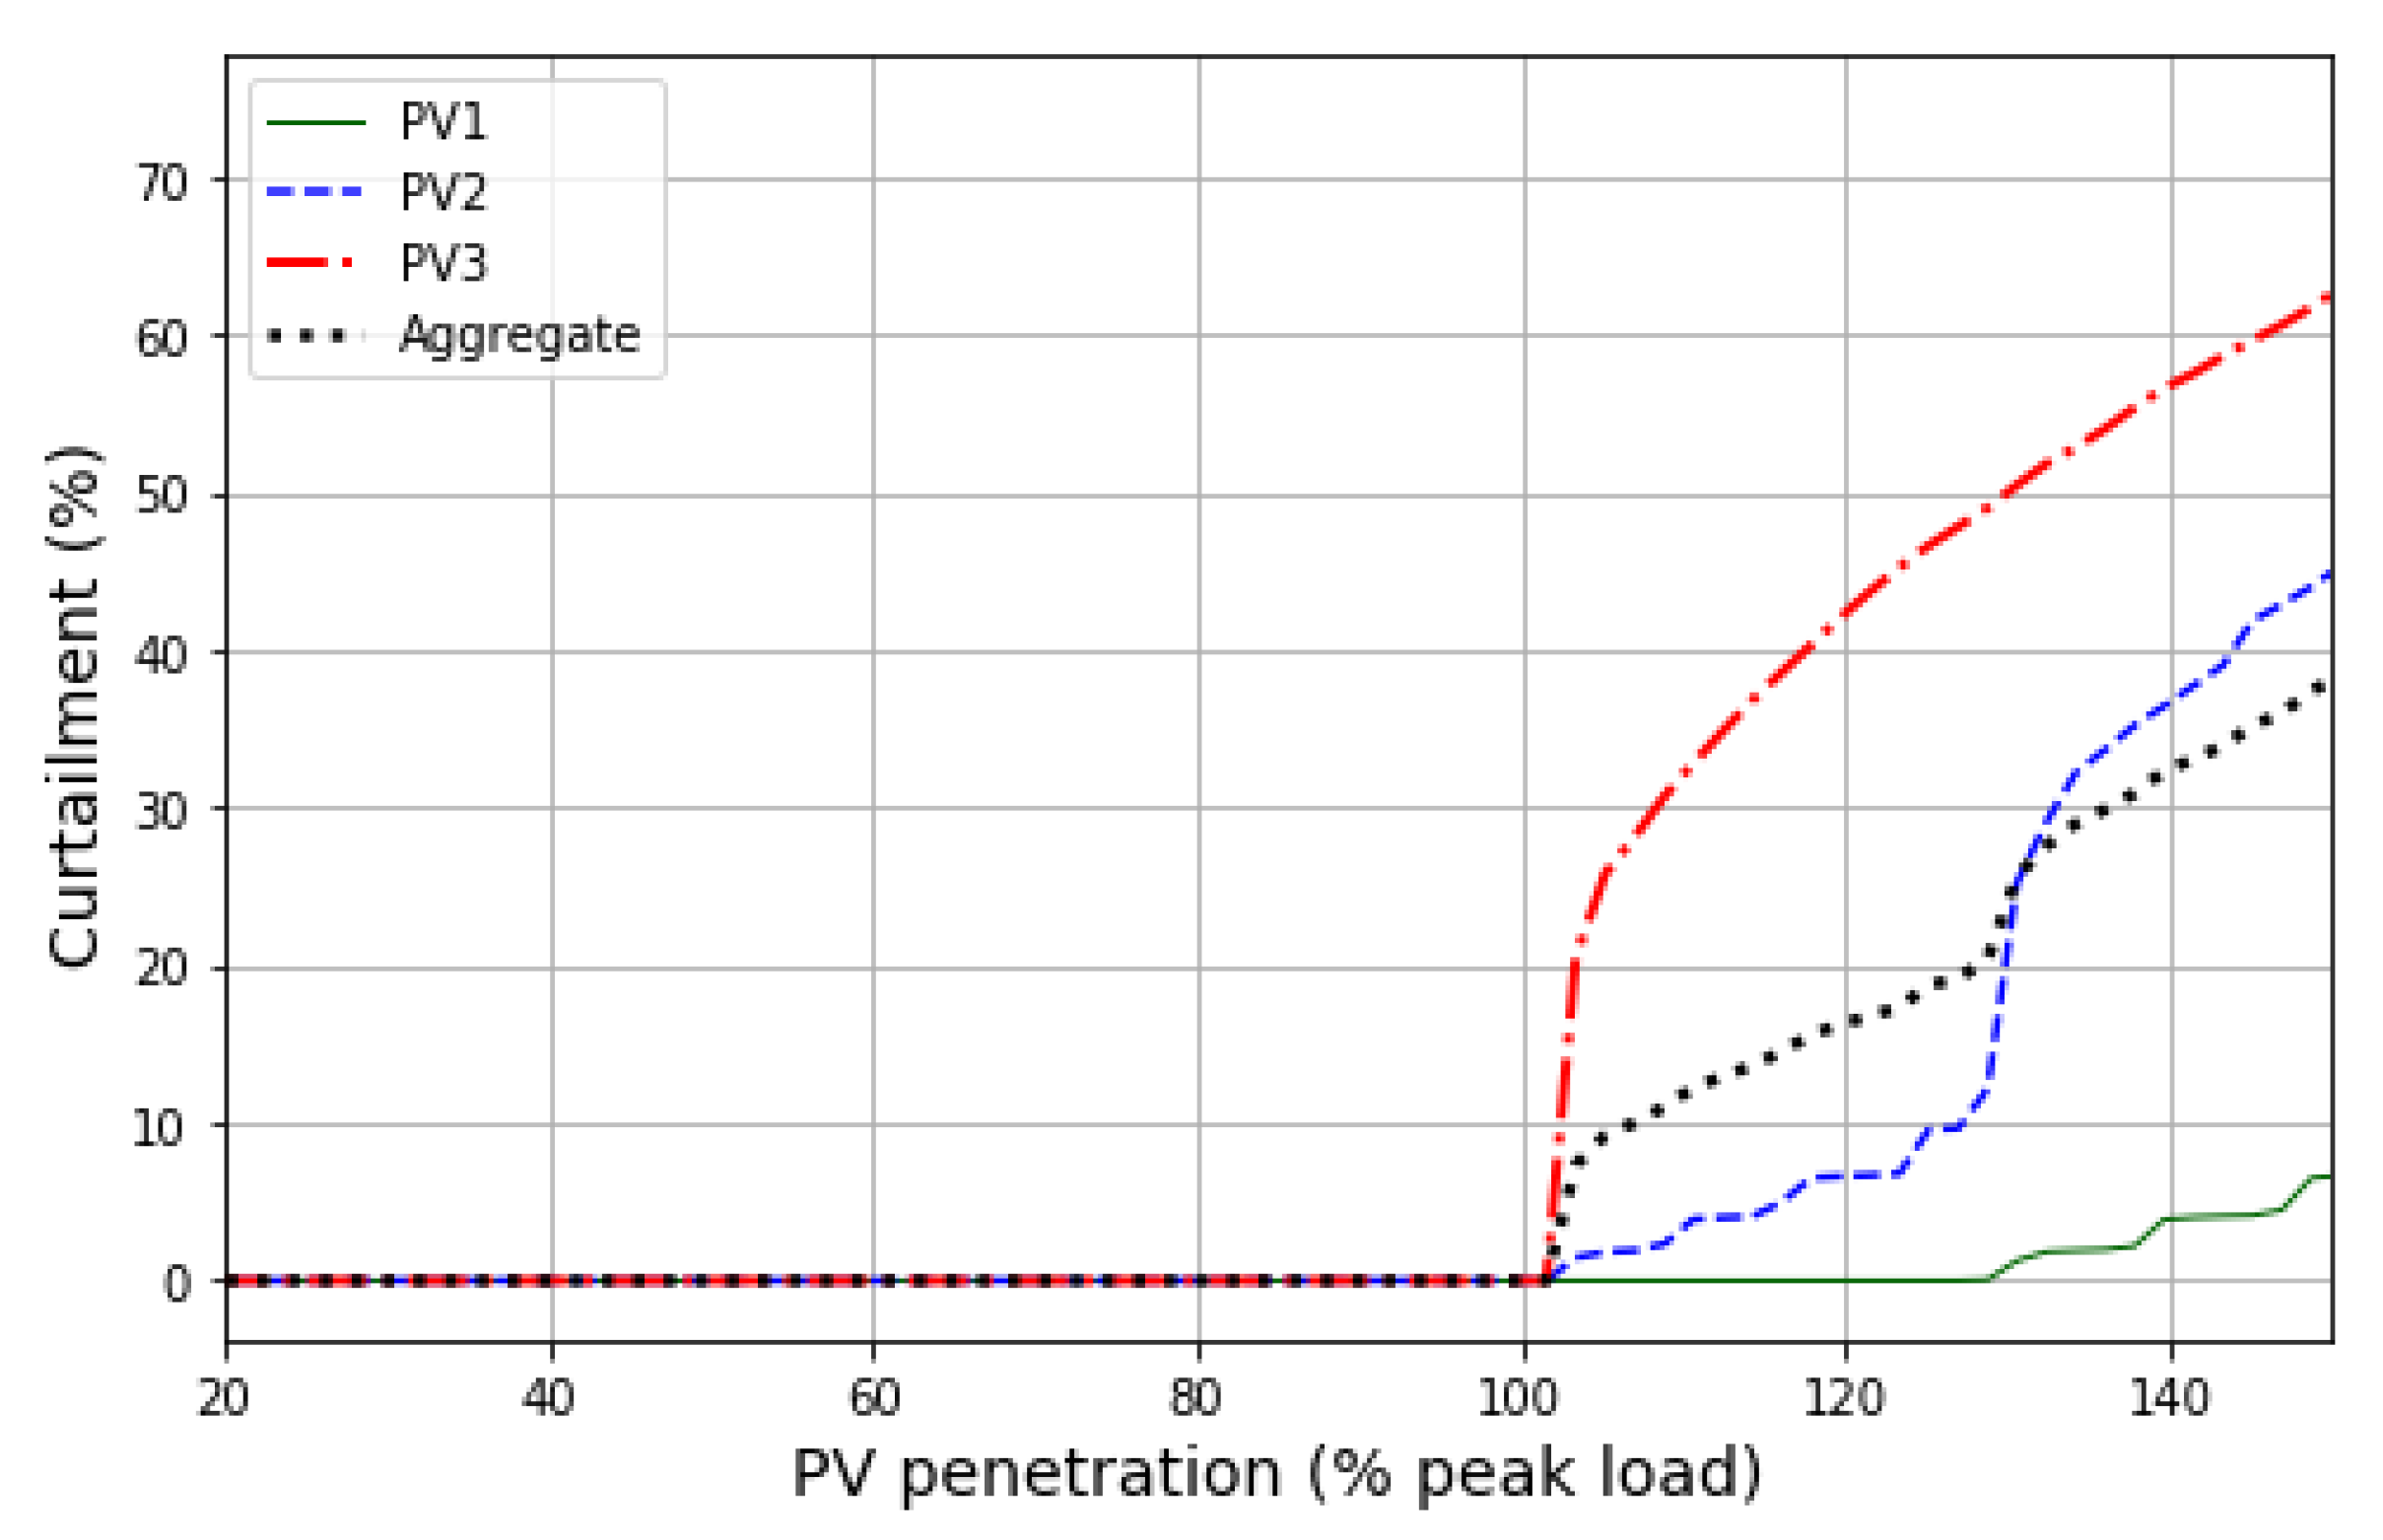
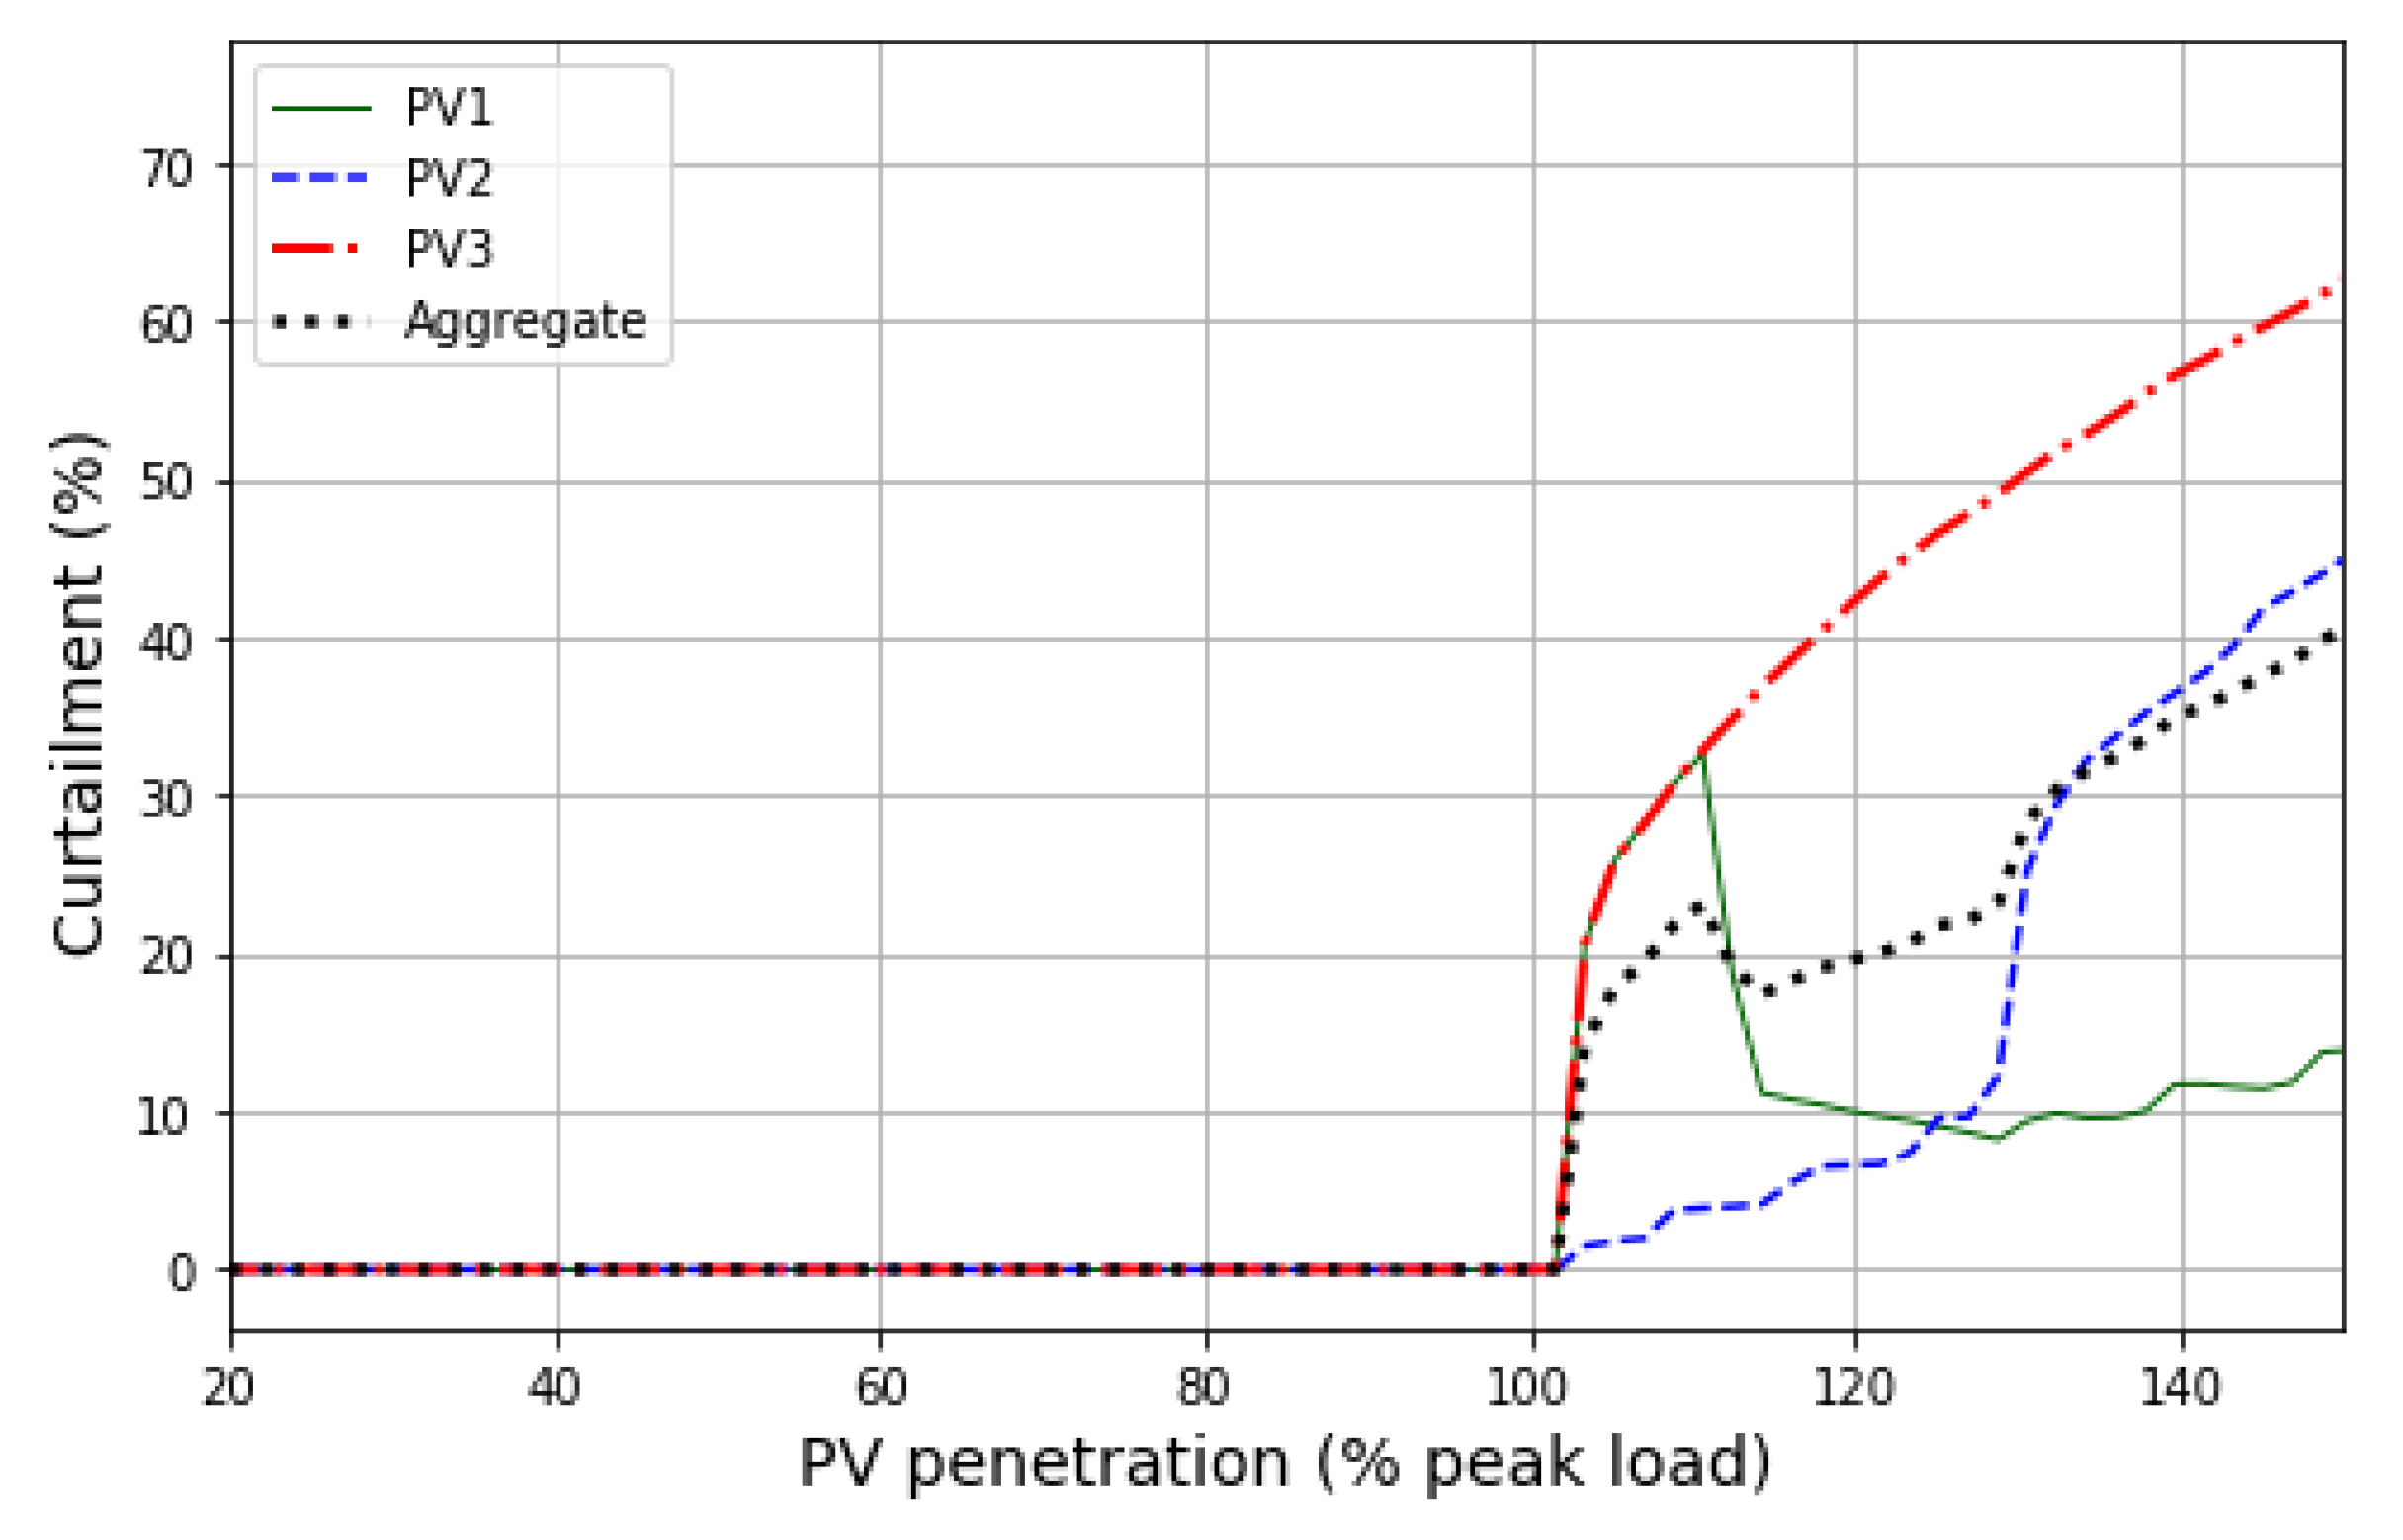
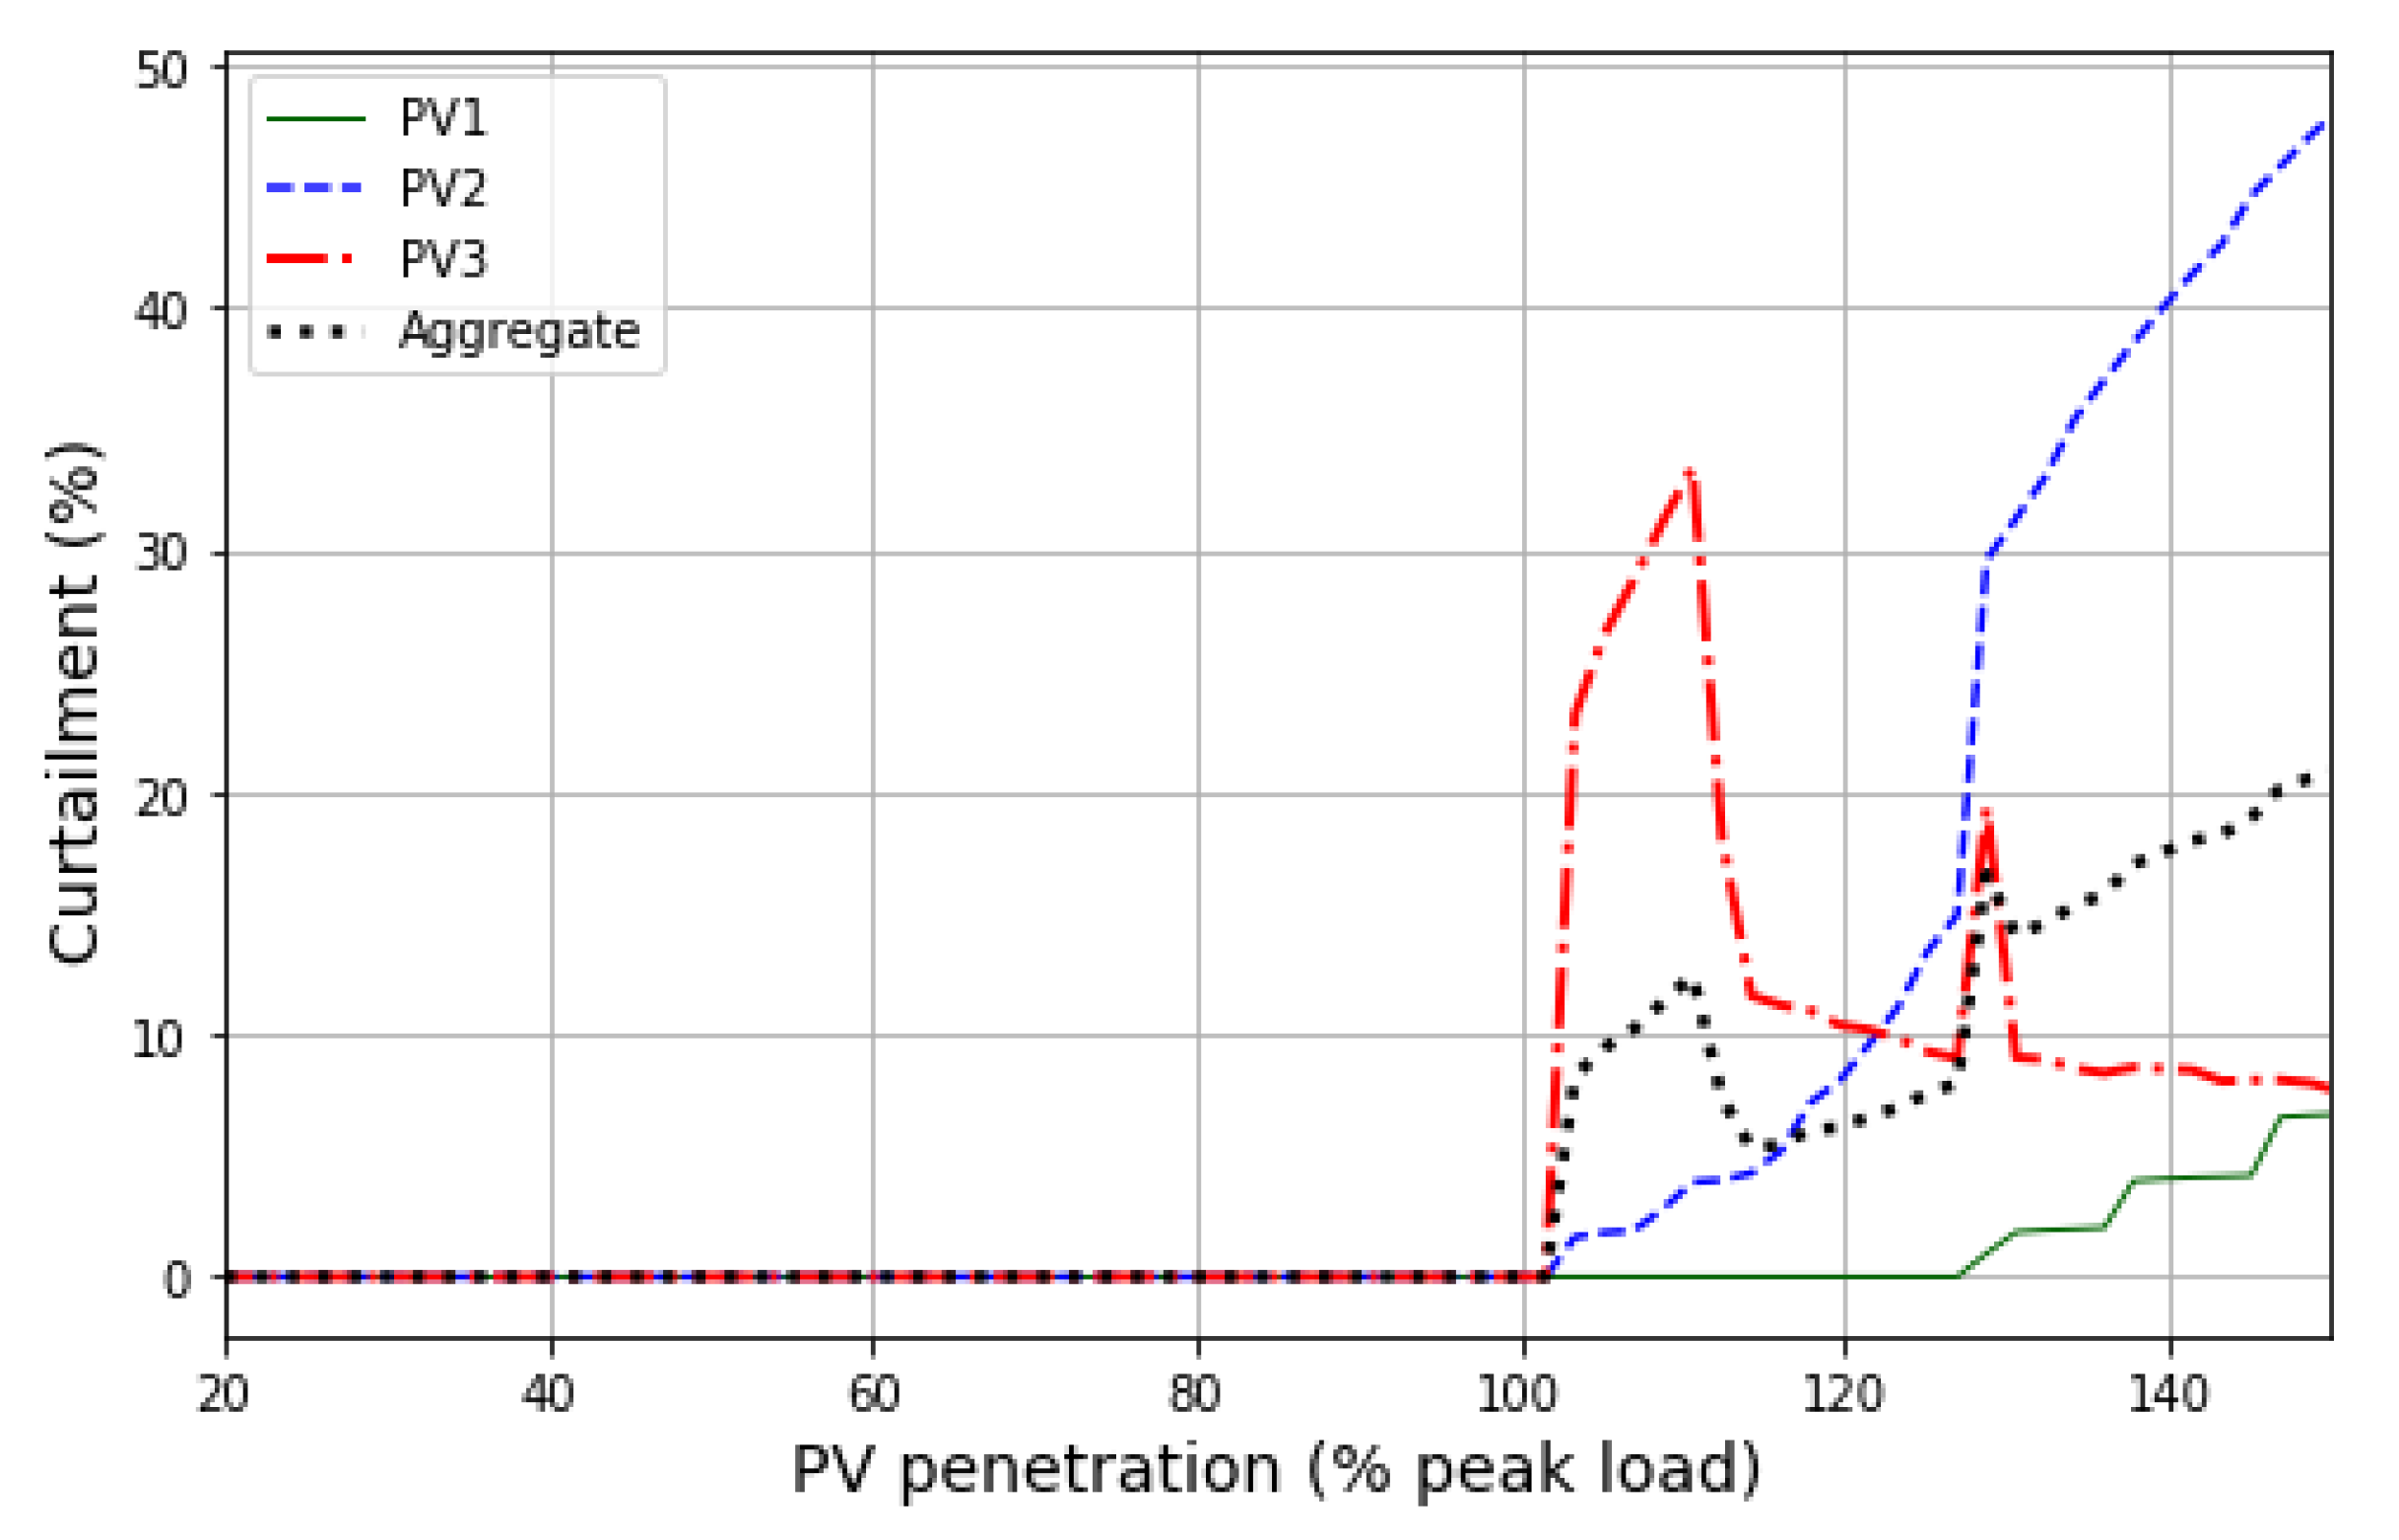
- Second, we evaluate the curtailment risk distribution among flexible units at different PV penetration levels in an annual quasi-static time-series (QSTS) distribution system simulation framework.
2. Methodology
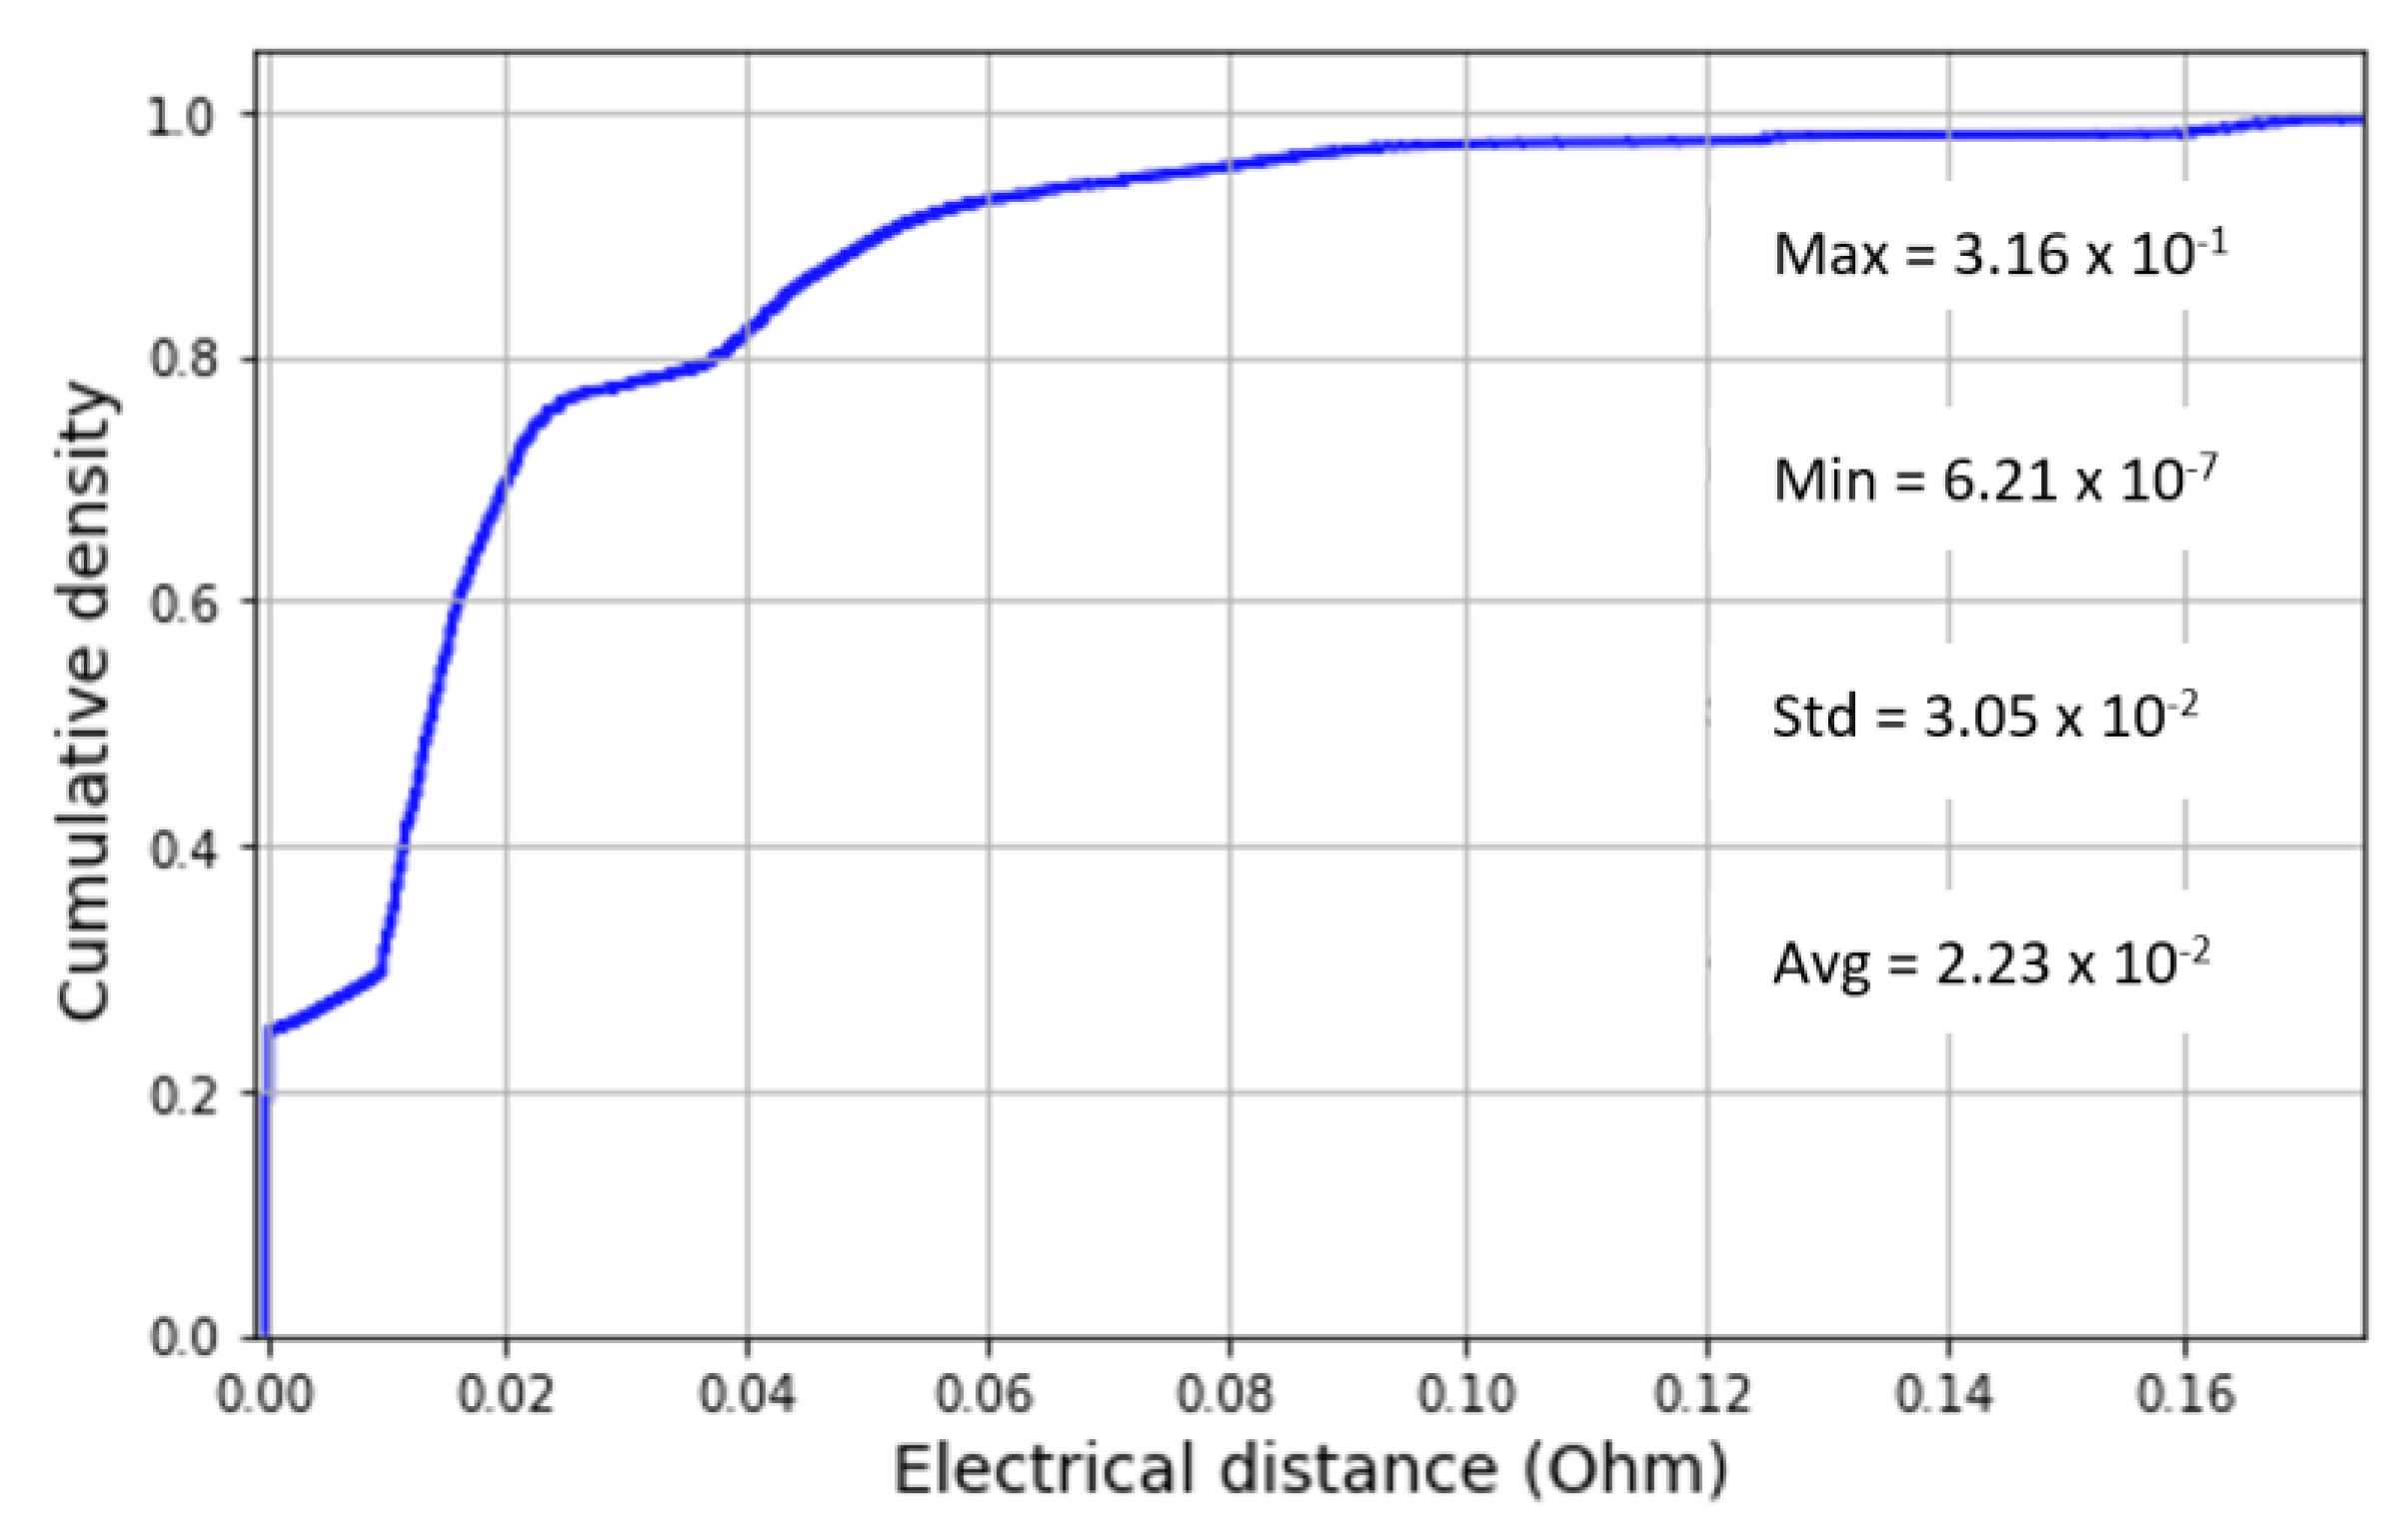
2.1. Electrical Distance
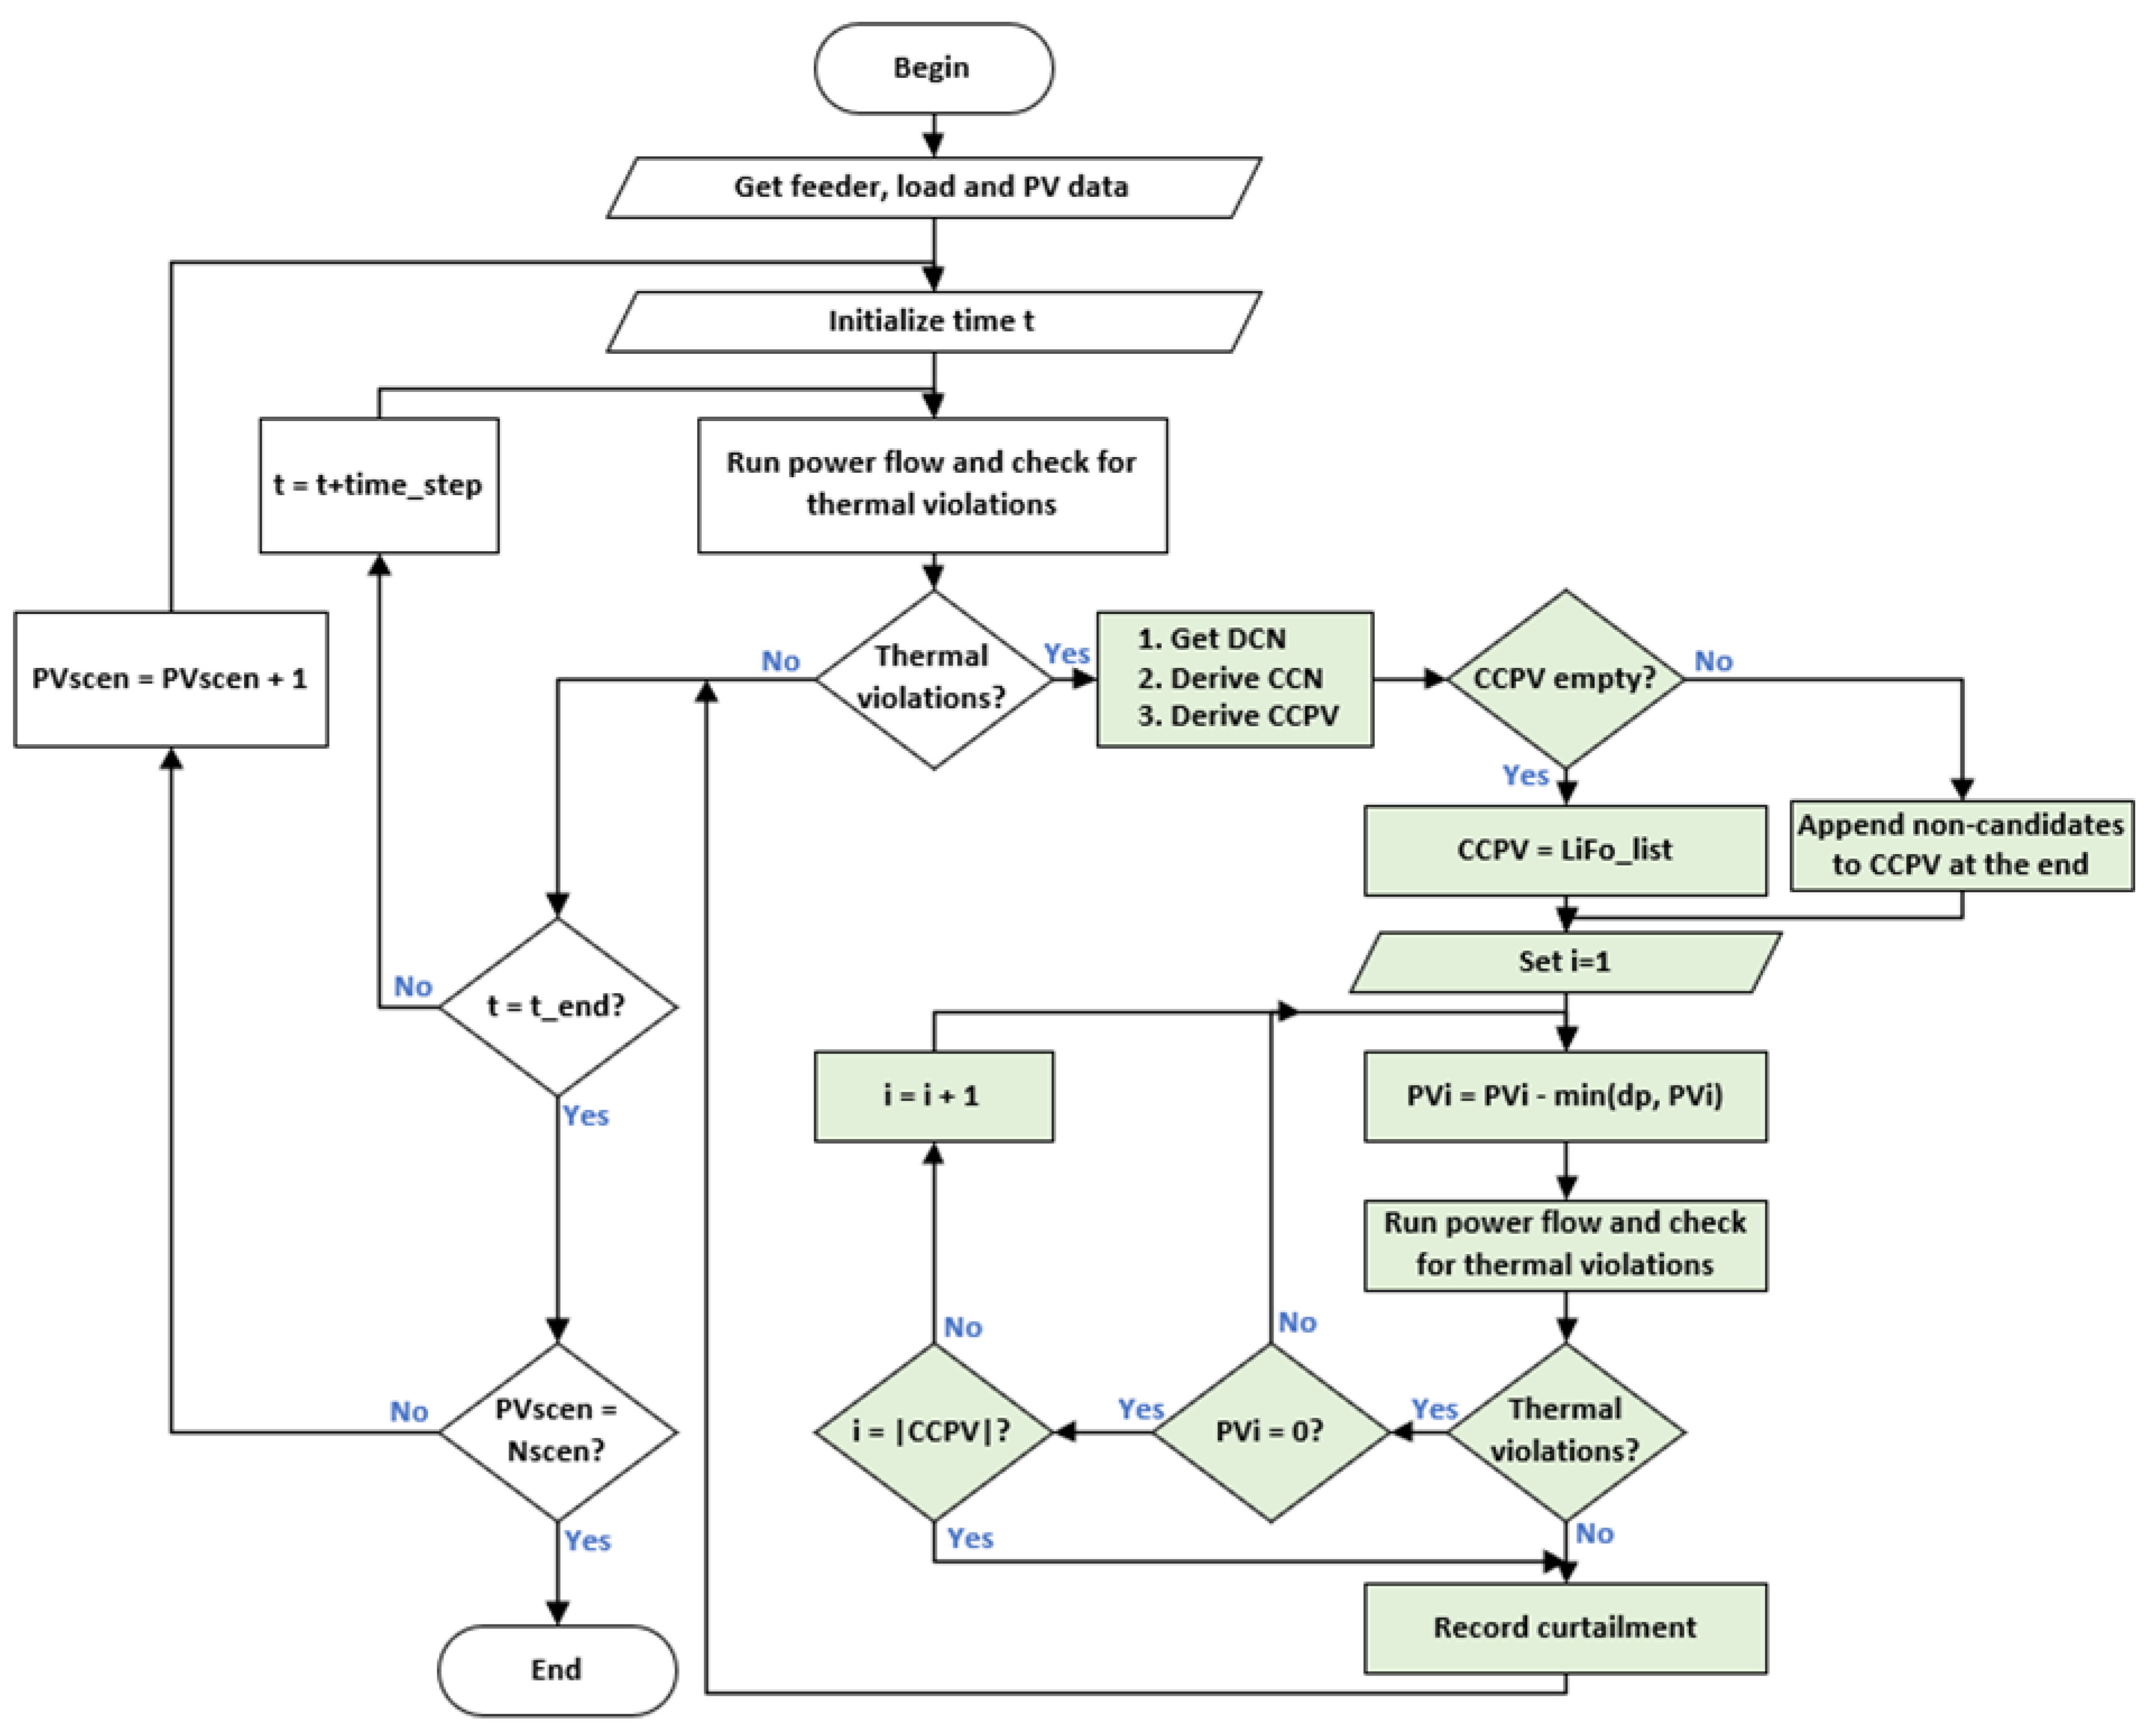
2.2. ed-LiFo PoA
3. Case Study
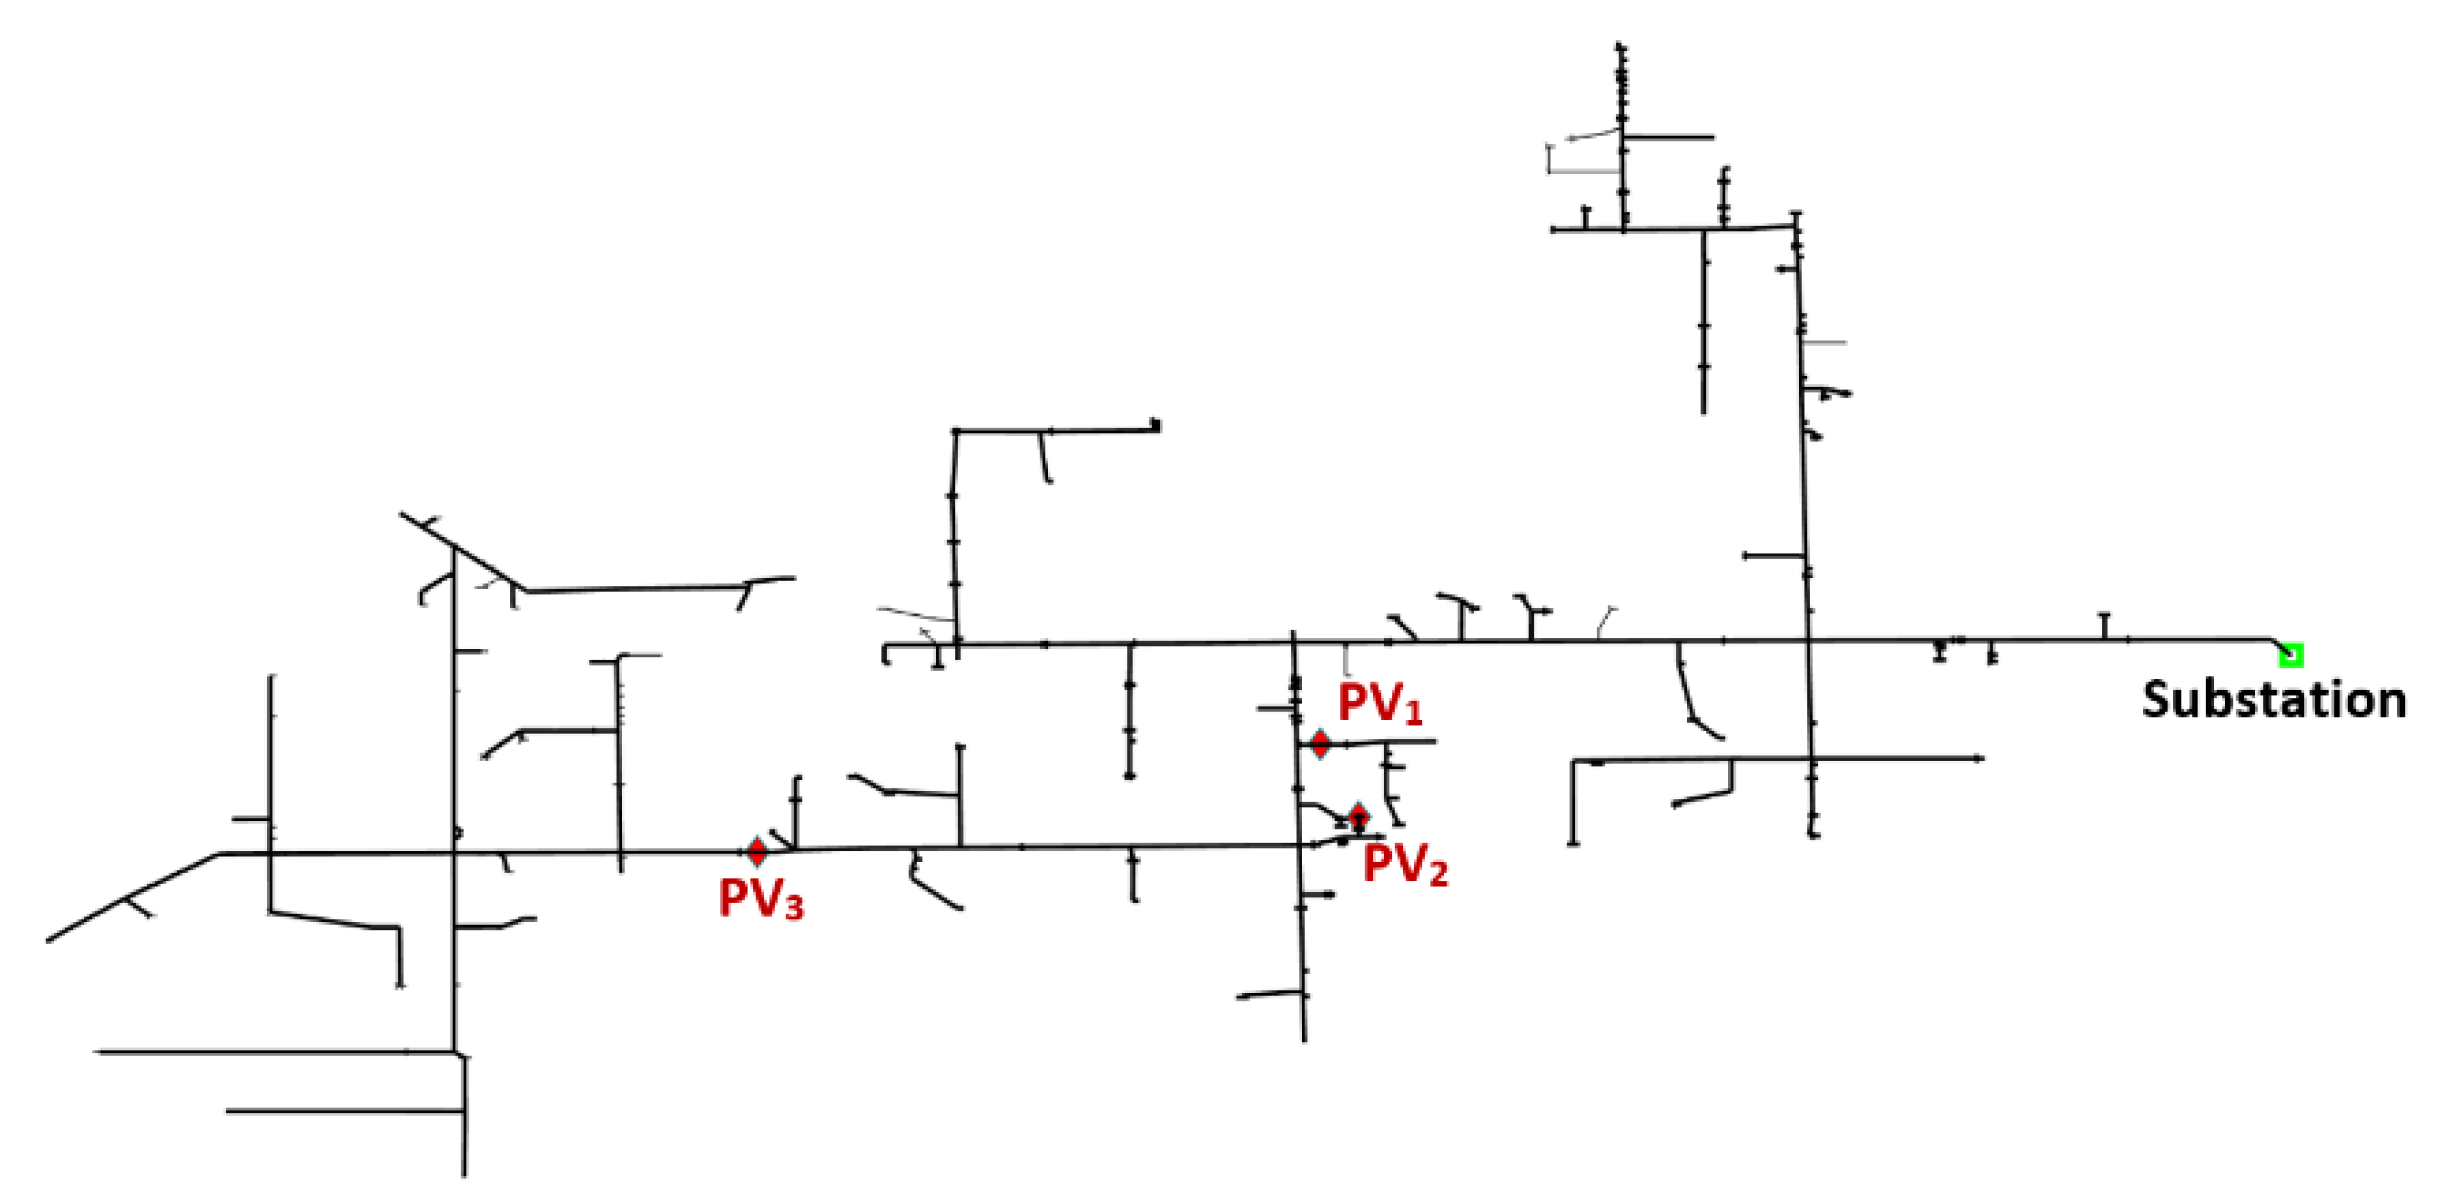
3.1. Distribution Feeder
3.2. PV Scenarios
3.3. ed-LiFo Parameters
4. Results and Discussion
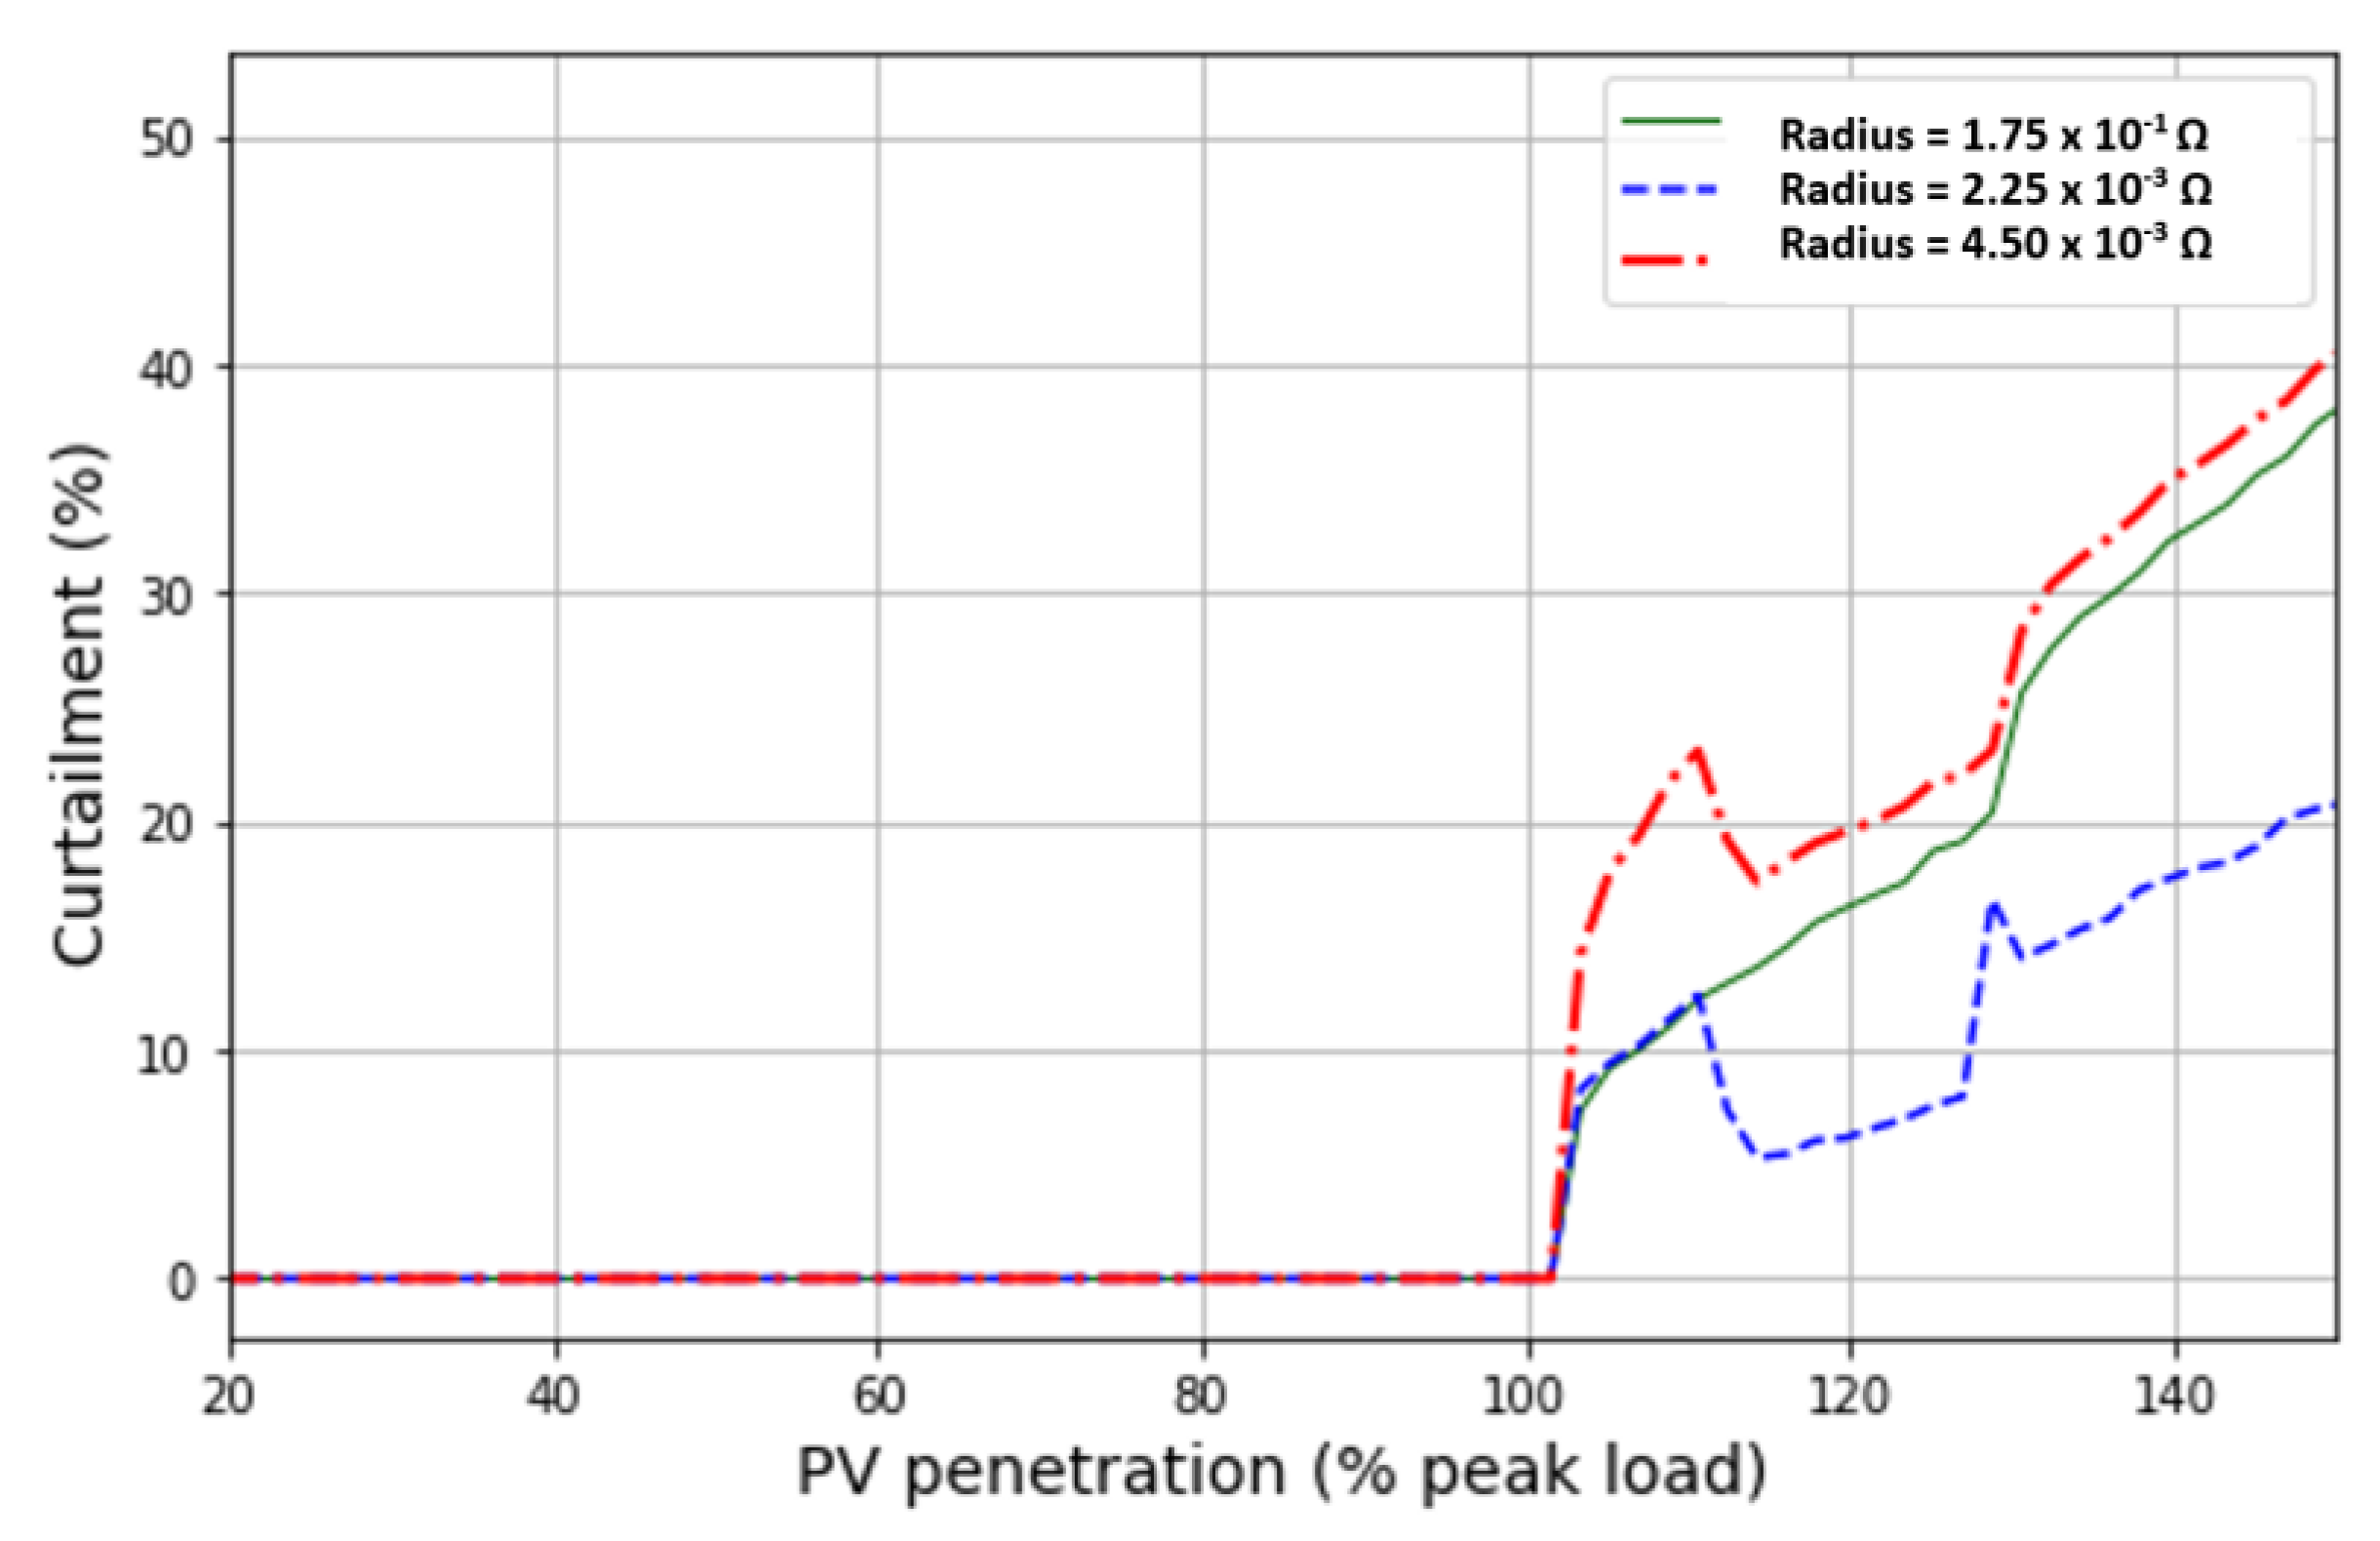
4.1. Sensitivity of Curtailment Risks and System Efficiency to Curtailment Zone Radius
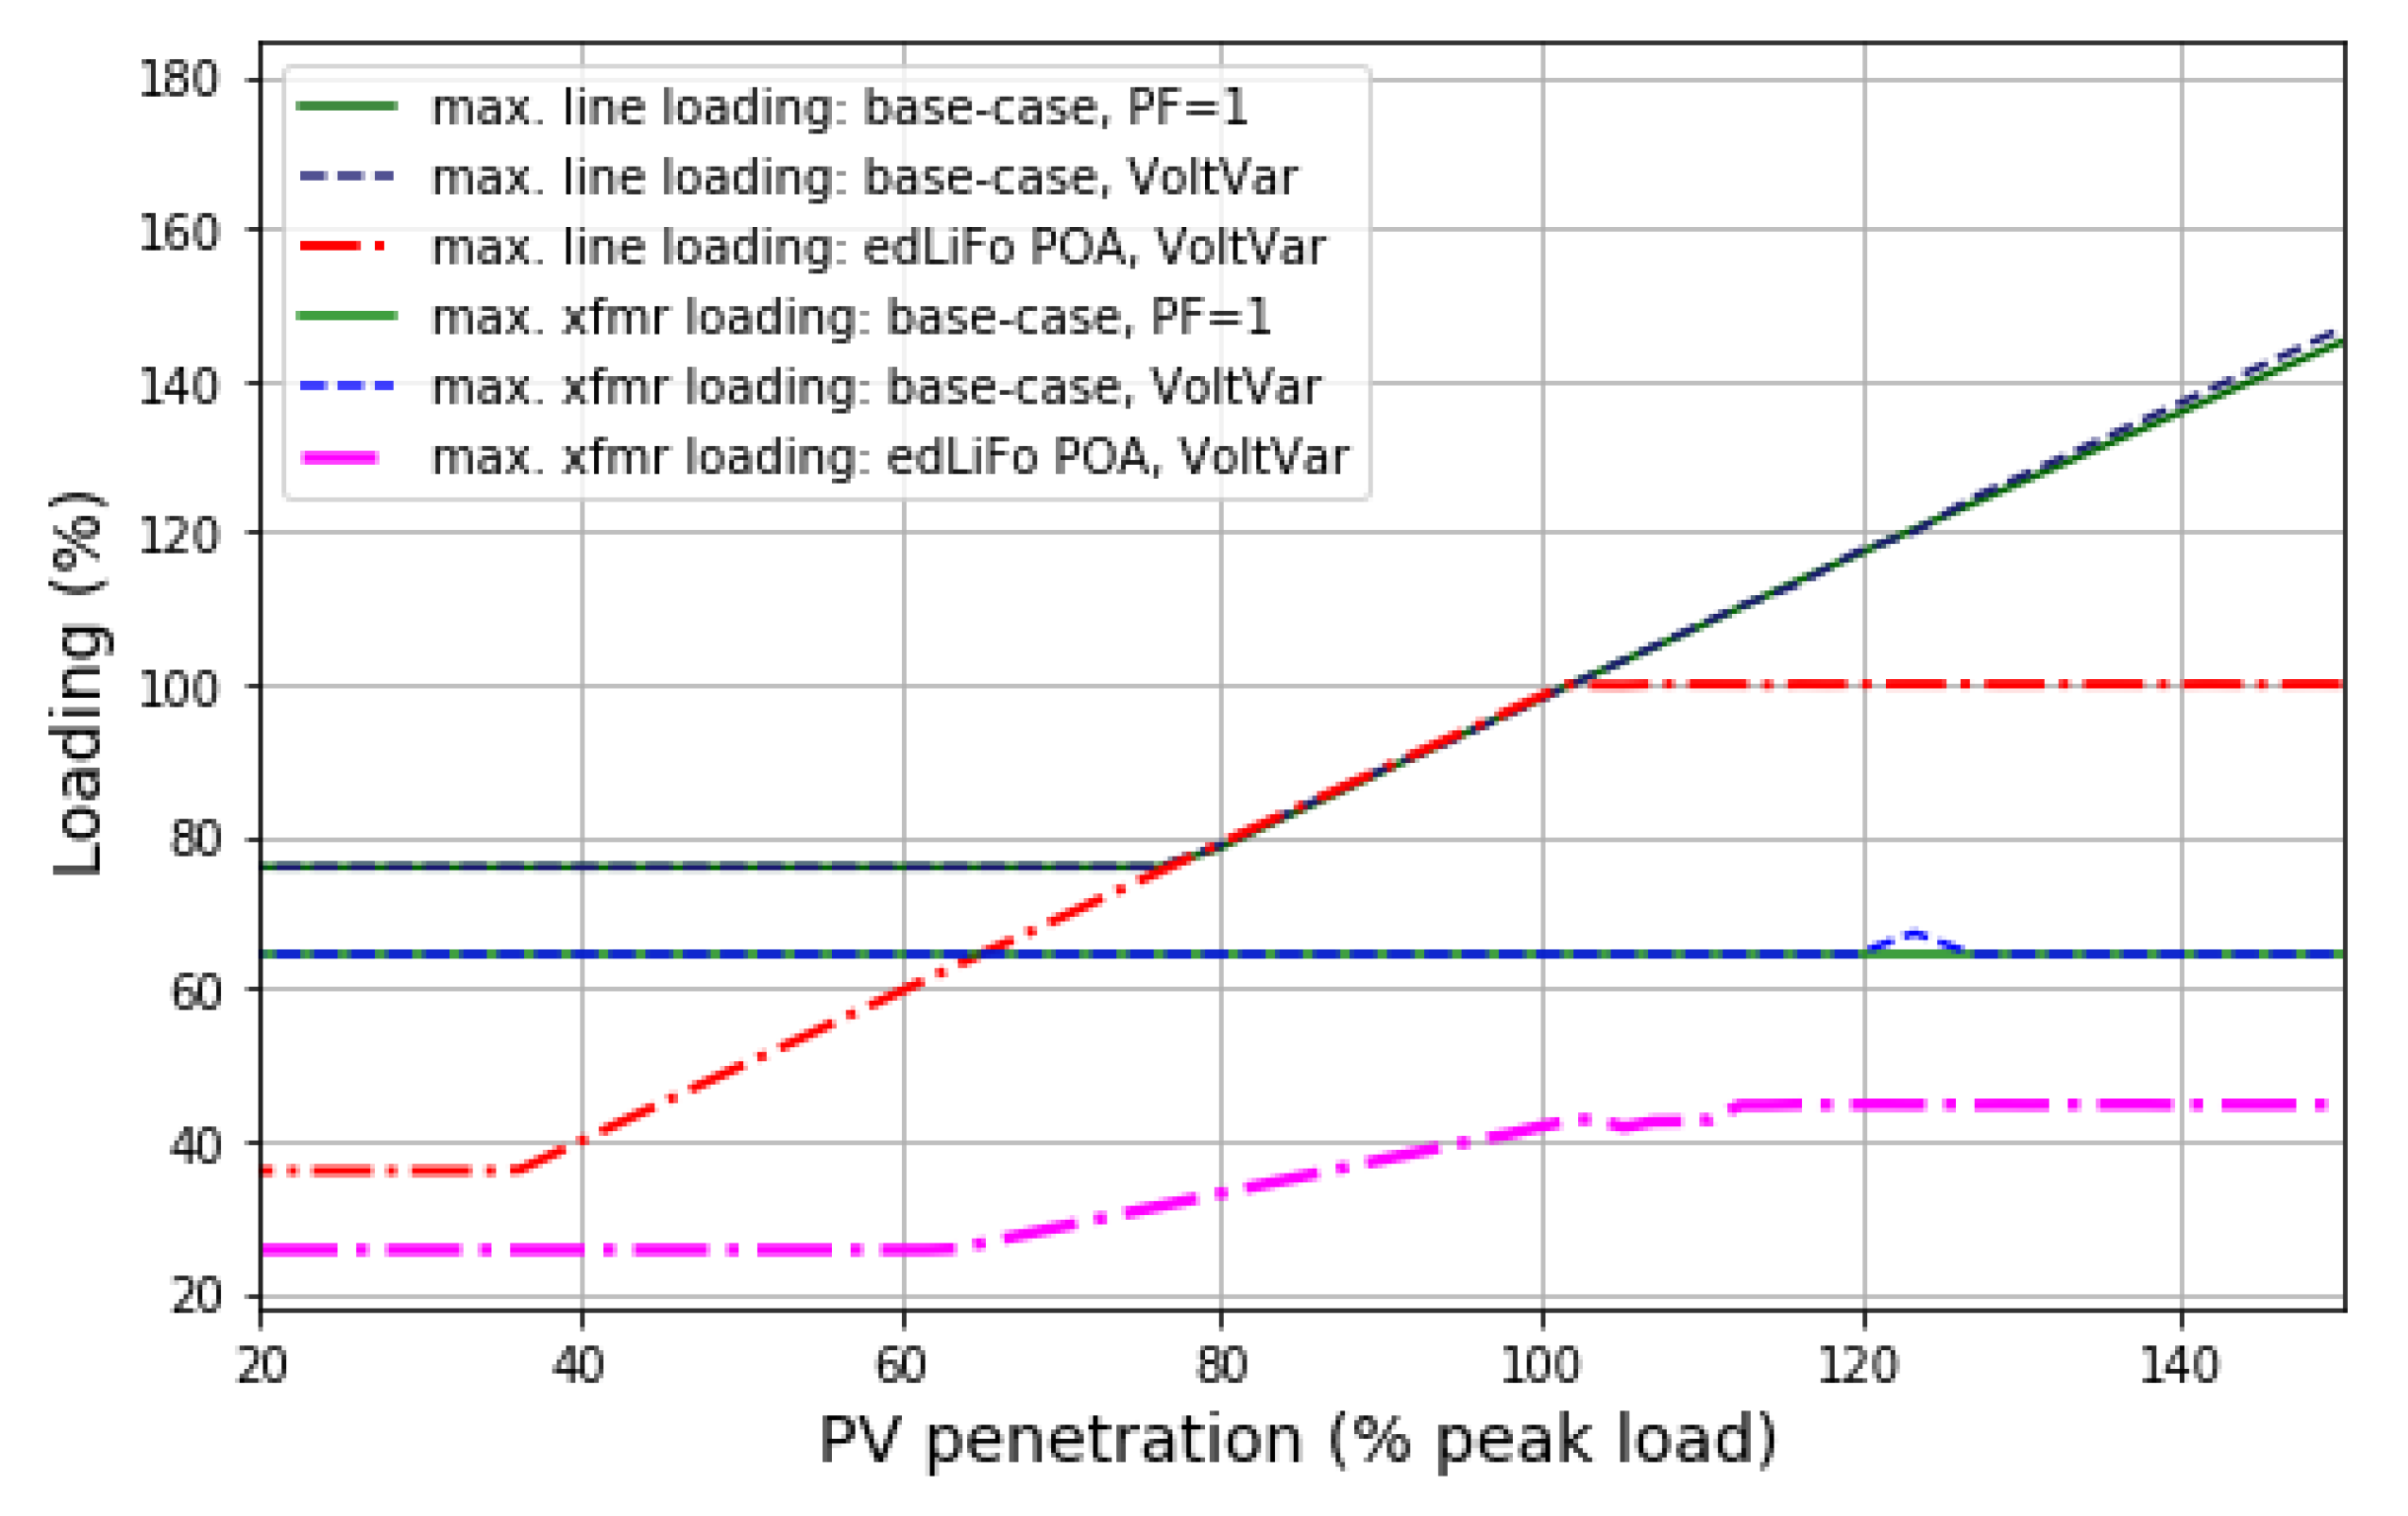
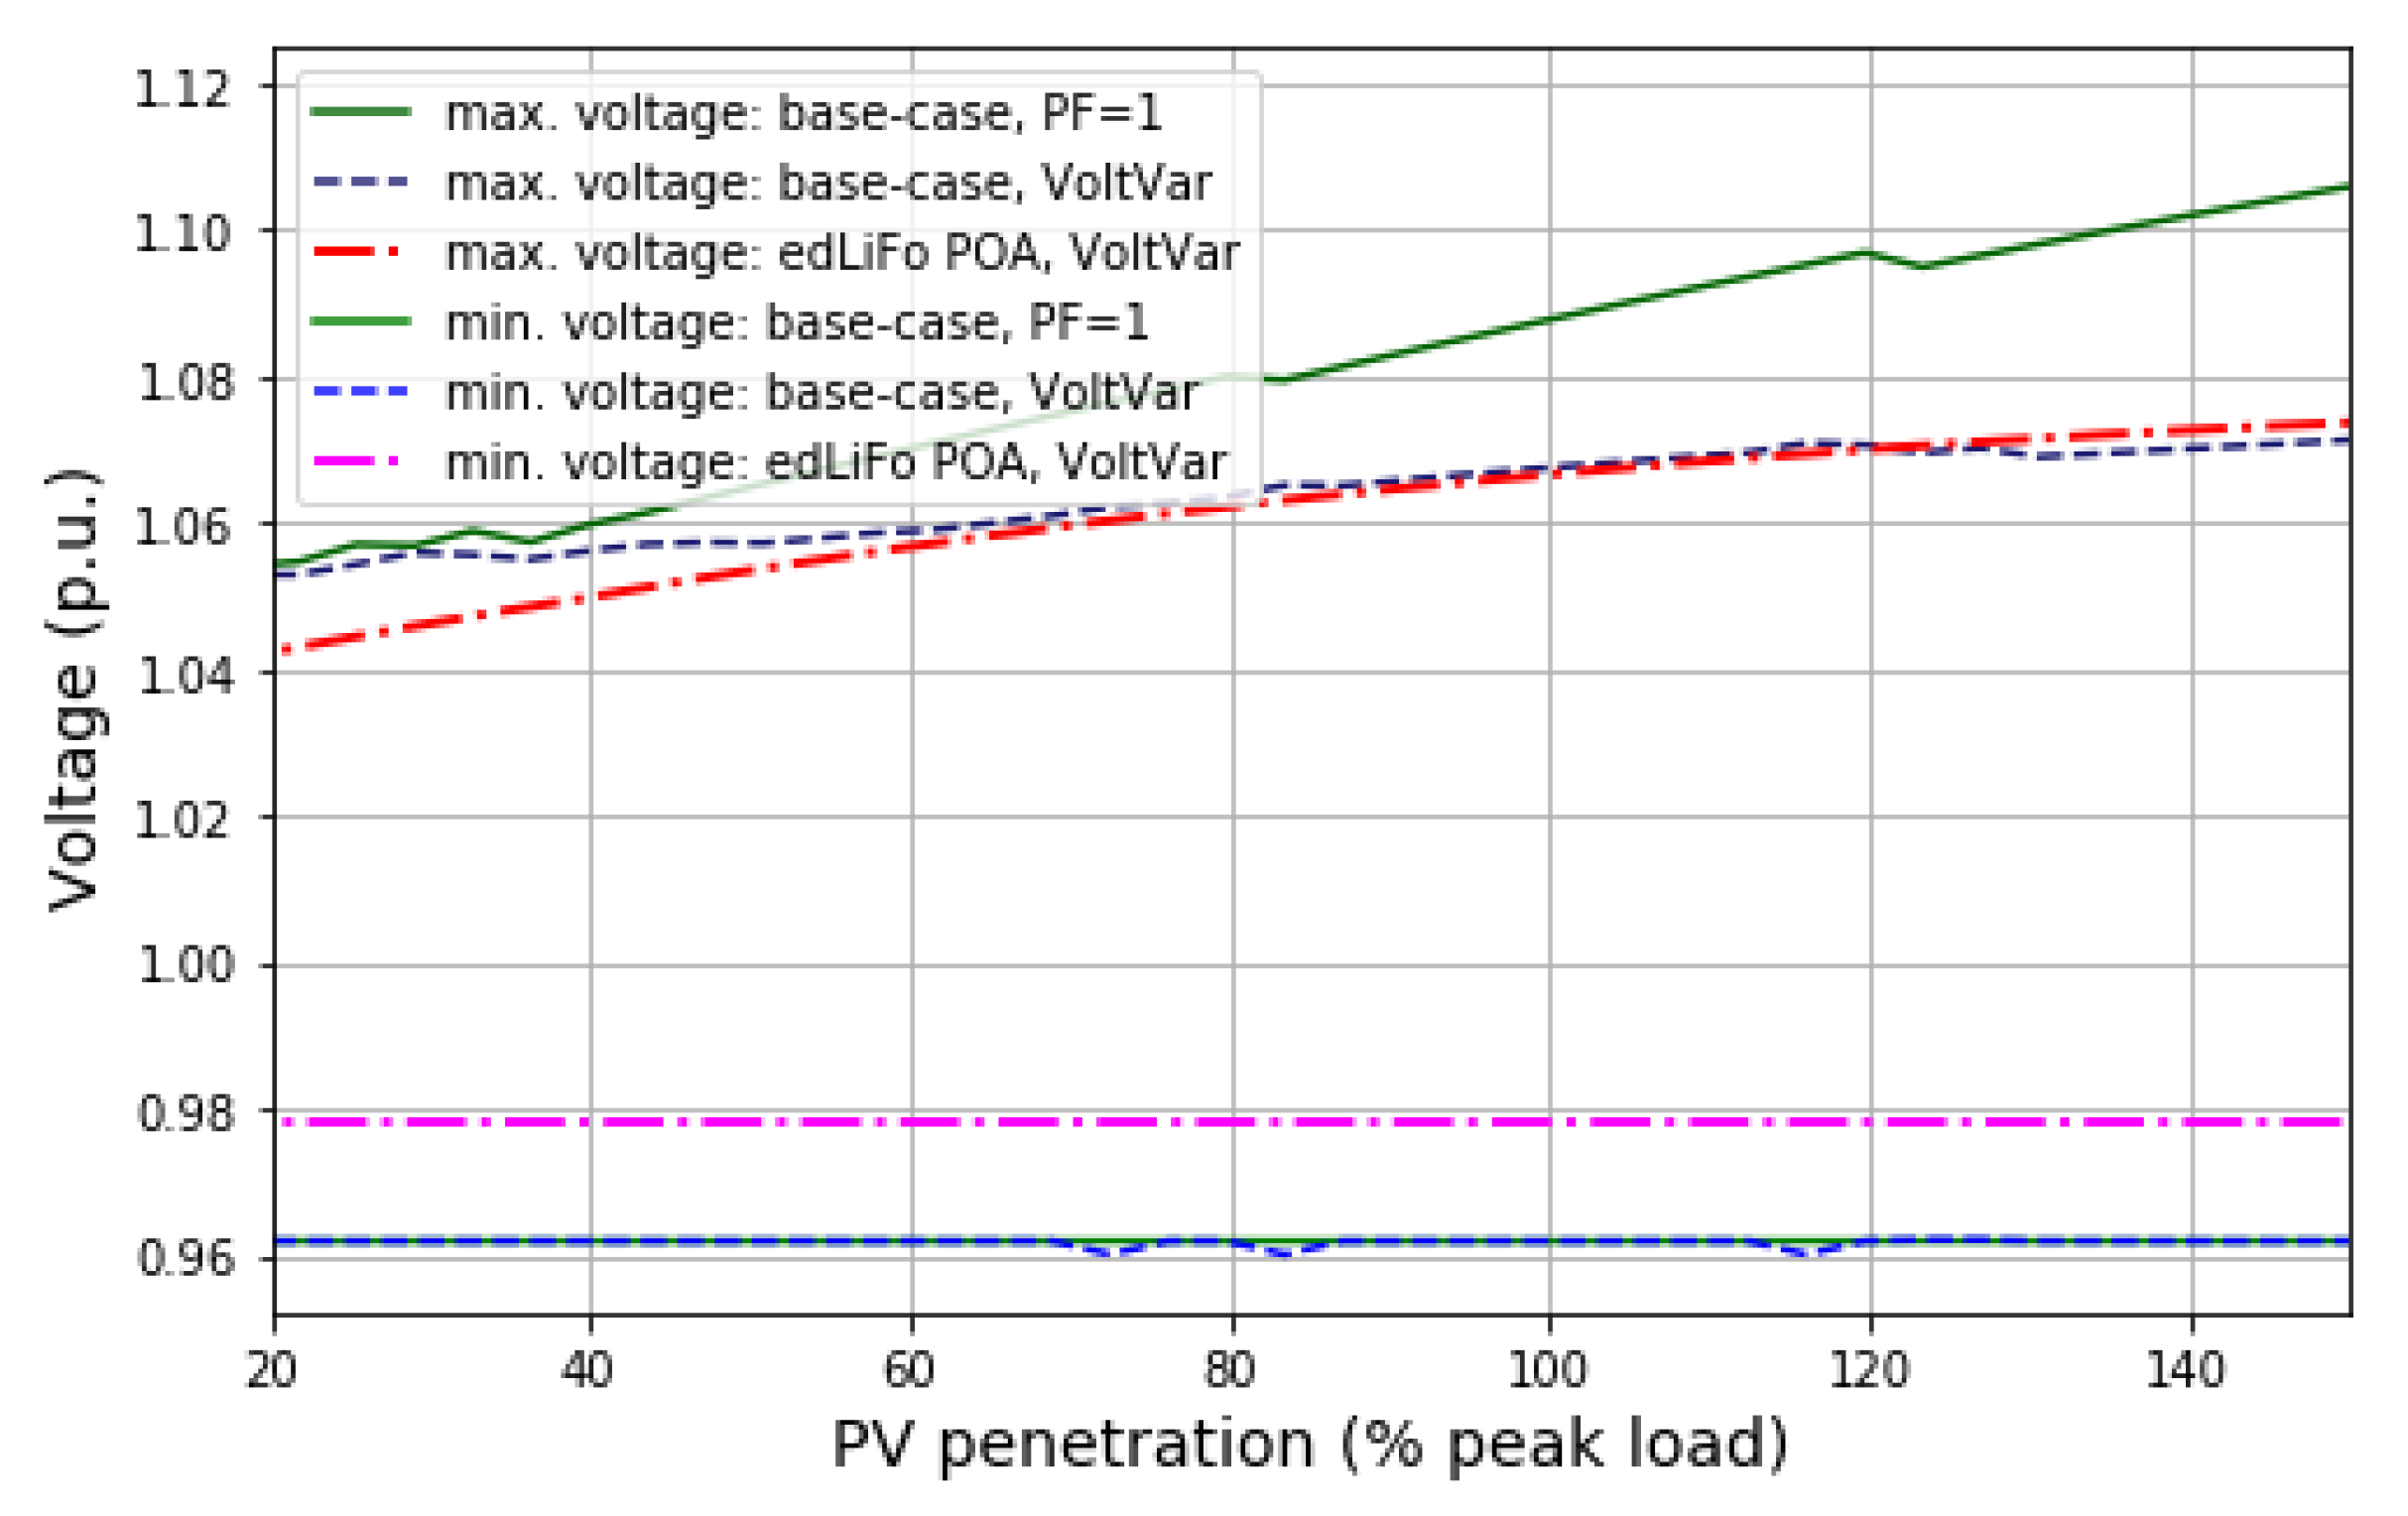
4.2. Effectiveness of ed-LiFo PoA at Resolving Distribution Violations
5. Conclusions and Future Work
Author Contributions
Funding
Institutional Review Board Statement
Informed Consent Statement
Data Availability Statement
Acknowledgments
Conflicts of Interest
Nomenclature
| A | Electrical adjacency matrix made of conductance parameters |
| CCPV | Set of curtailment candidate PV units arranged in their LiFo order |
| CCN | Set of curtailment candidate nodes |
| D | Electrical “degree” matrix, diagonal matrix |
| DCN | Set of nodes that are directly connected to any thermal violation |
| DER | Distributed energy resource |
| DSO | Distribution system operator |
| E | Electrical distance matrix |
| ed-LiFo | Electrical distance-based, last-in, first-out principles of access |
| Conductance that connects vertices and | |
| L | Conductance matrix, a Laplacian matrix |
| LiFo | Last-in first-out |
| Pseudo- or group inverse of the conductance matrix | |
| Average electrical distance between any two nodes of a feeder | |
| PF | Power factor |
| PoA | Principles of access |
| p.u. | Per unit |
| PV | Solar photovoltaic |
| QSTS | Quasi-static time-series simulation |
| Curtailment zone radius | |
| Standard deviation of the electrical distance between any two nodes of a feeder | |
| S | Apparent power |
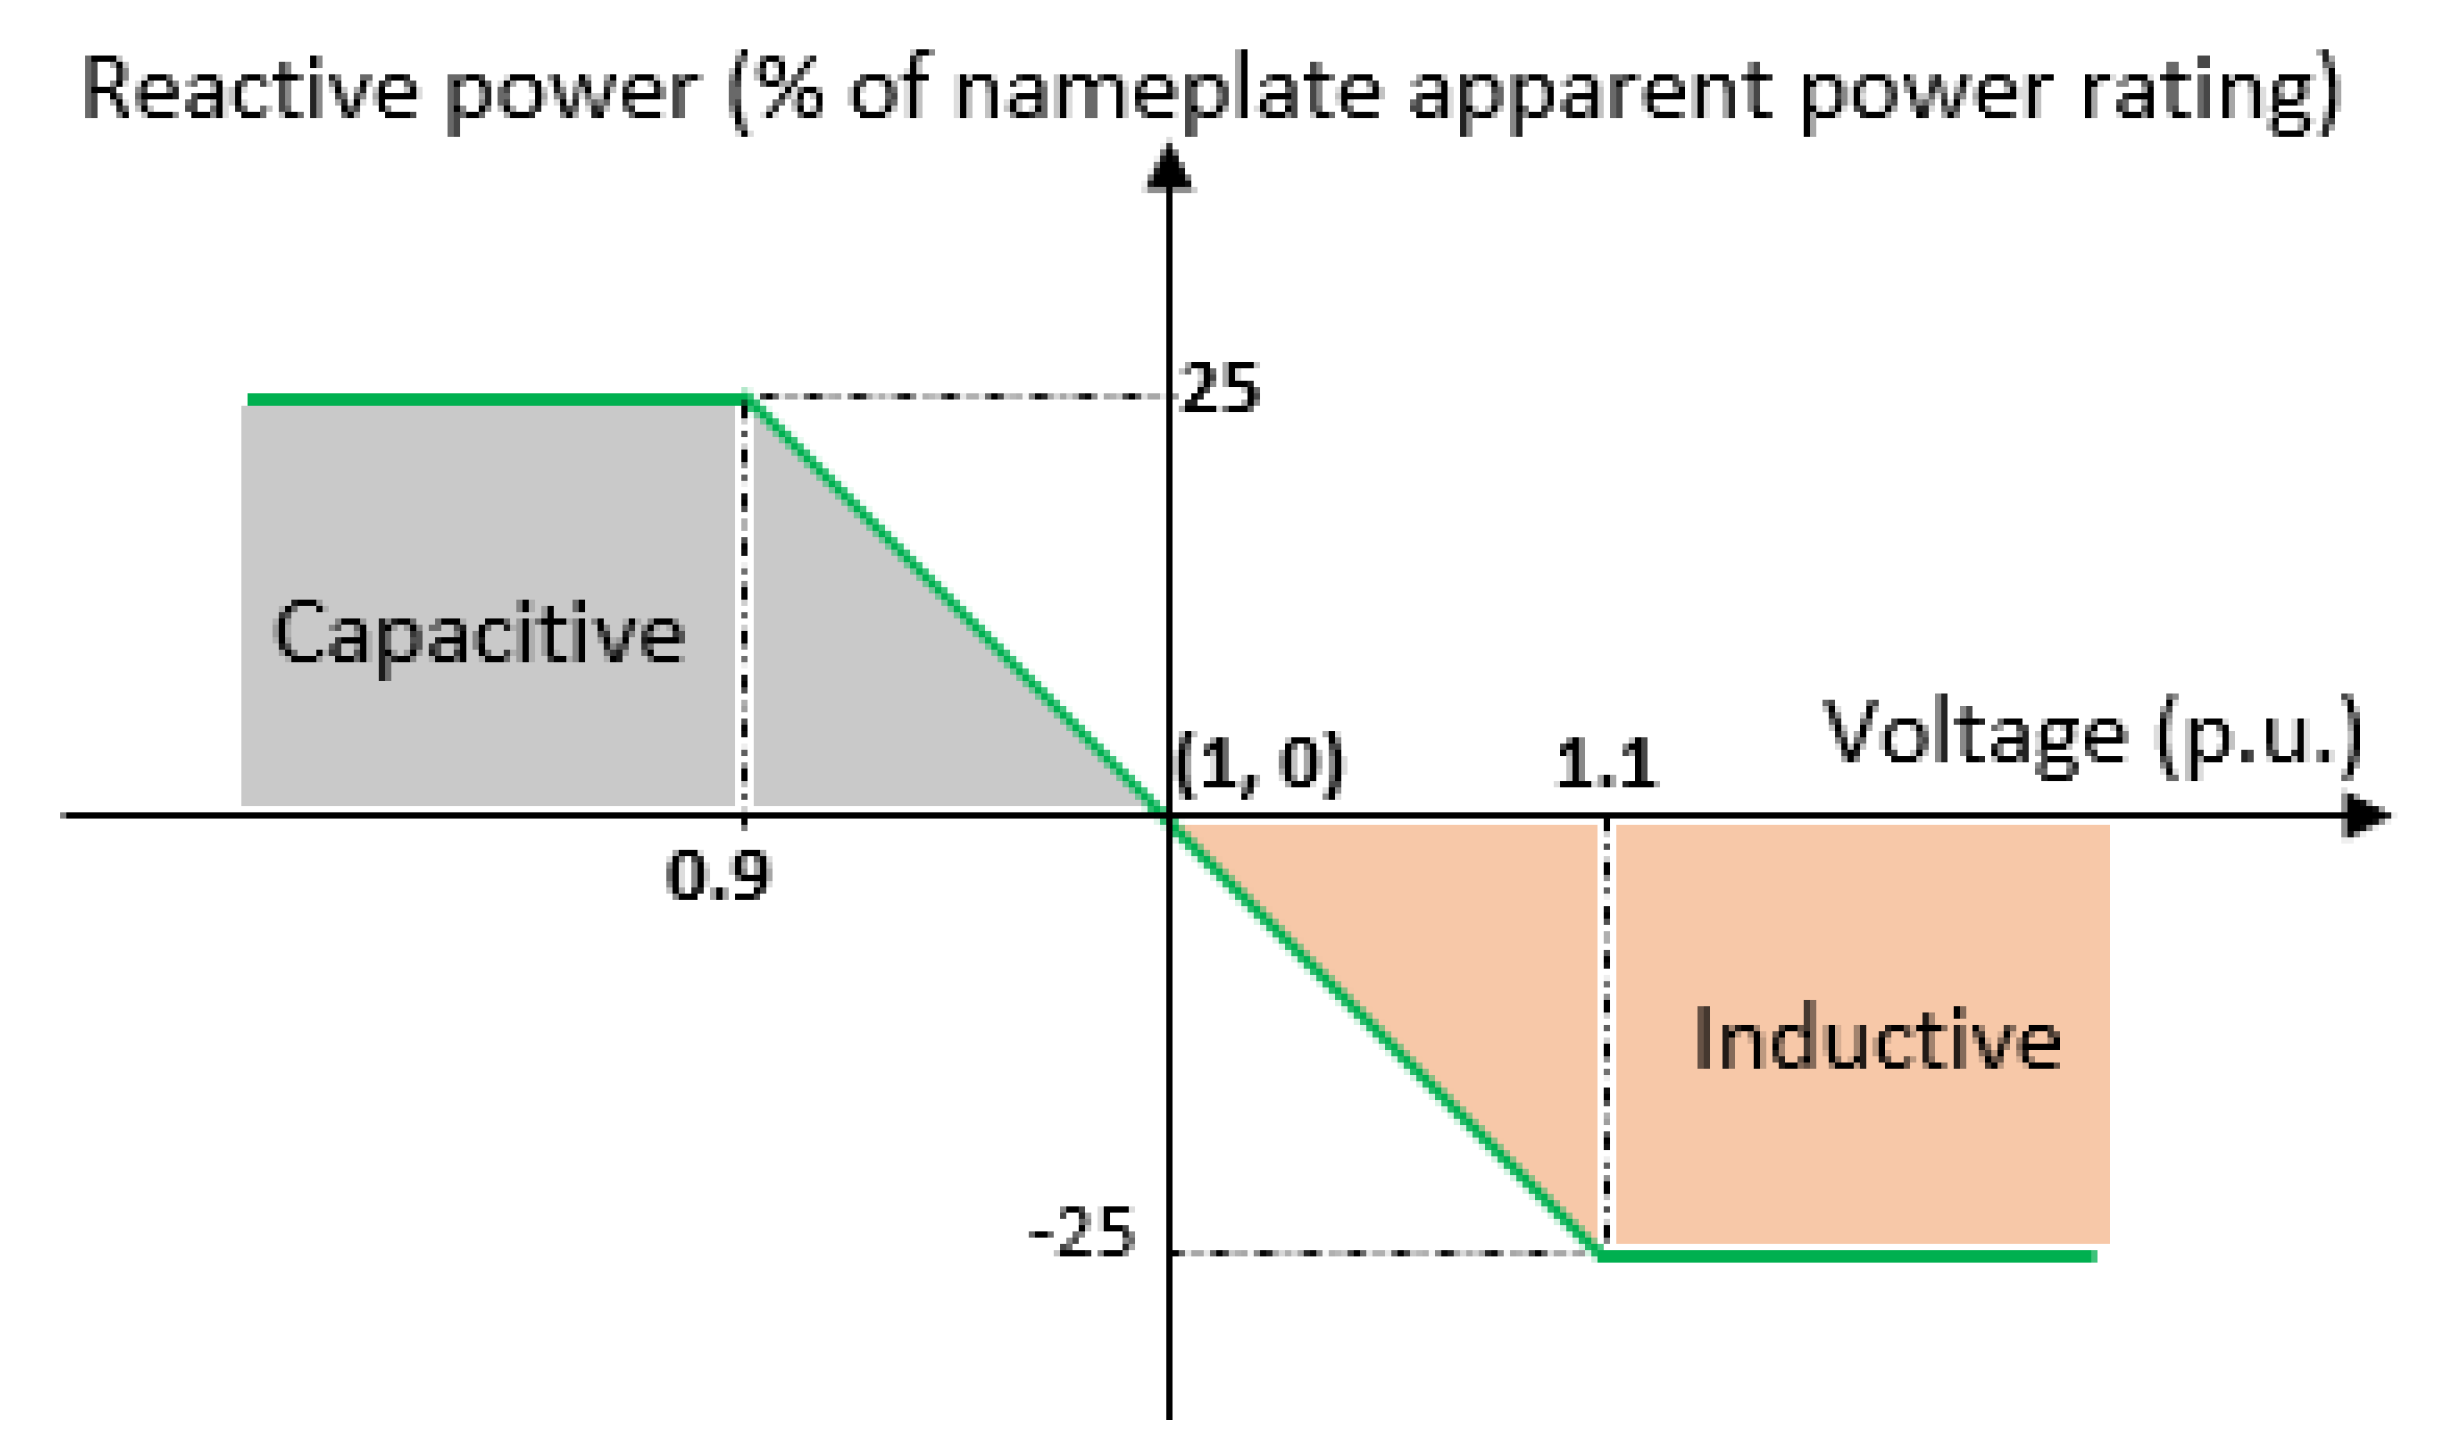
| VoltVar | Volt VAR control function |
| X/R | X (reactance) by R (resistance) ratio |
| Node indices |
References
- Strbac, G.; Jenkins, N.; Hird, M.; Djapic, P.; Nicholson, G. Integration of Operation of Embedded Generation and Distribution Networks; University of Manchester Institute of Science and Technology (UMIST): Manchester, UK, 2002. [Google Scholar]
- Energy Networks Association. Active Network Management Good Practice Guide; Energy Networks Association: London, UK, 2019. [Google Scholar]
- Currie, R.; O’Neill, B.; Foote, C.; Gooding, A.; Ferries, R.; Douglas, J. Commercial arrangements to facilitate active network management. In CIRED 21st International Conference on Electricity Distribution; CIRED: Frankfurt, Germany, 2011; pp. 6–9. [Google Scholar]
- Baringa Partners; UK Power Networks. Flexible Plug and Play Principles of Access Report. December 2012, p. 120. Available online: https://www.ukpowernetworks.co.uk/internet/asset/dac8de6d-1243-4689-b5b5-a8285a2553fe/Principles_of_Access_report_FINAL.pdf (accessed on 2 March 2021).
- Connect, R.E.V. Lessons from REV Demos in New York’s Energy System. 2018. Available online: https://nyrevconnect.com/wp-content/uploads/2018/01/Webinar2_Demo-Principles-v6-01-17-18.pdf (accessed on 17 January 2018).
- Kane, L.; Ault, G. A review and analysis of renewable energy curtailment schemes and principles of access: Transitioning towards business as usual. Energy Policy 2014, 72, 67–77. [Google Scholar] [CrossRef] [Green Version]
- Anaya, K.L.; Pollitt, M.G. Experience with smarter commercial arrangements for distributed wind generation. Energy Policy 2014, 71, 52–62. [Google Scholar] [CrossRef]
- Dolan, M.J.; Davidson, E.M.; Kockar, I.; Ault, G.W.; McArthur, S.D.J. Distribution power flow management utilizing an online optimal power flow technique. IEEE Trans. Power Syst. 2012, 27, 790–799. [Google Scholar] [CrossRef]
- Currie, R.A.F.; Ault, G.W.; Foote, C.E.T.; McNeill, N.M.; Gooding, A.K. Smarter ways to provide grid connections for renewable generators. In Proceedings of the IEEE PES General Meeting, Minneapolis, MN, USA, 25–29 July 2010; pp. 1–6. [Google Scholar]
- Sun, W.; Harrison, G.P. Influence of generator curtailment priority on network hosting capacity. In Proceedings of the CIRED 22nd International Conference on Electricity Distribution, Stockholm, Sweden, 10–13 June 2013; Available online: https://citeseerx.ist.psu.edu/viewdoc/download?doi=10.1.1.1063.6959&rep=rep1&type=pdf (accessed on 2 March 2021).
- Danzerl, D.; Gill, S.; Kockar, I.; Anaya-Lara, O. Assessment of the last-in-first out principle of access for managing the connection of distributed wind generators. IET 2016, 2–6. Available online: https://strathprints.strath.ac.uk/59906/1/Danzerl_etal_RPG2016_Assessment_of_the_last_in_first_out_principle_of_access.pdf (accessed on 2 March 2021).
- Jupe, S.C.E.; Taylor, P.C. Distributed generation output control for network power flow management. IET Renew. Power Gener. 2009, 3, 371–386. [Google Scholar] [CrossRef]
- Masters, C.L. Voltage rise: The big issue when connecting embedded generation to long 11 kV overhead lines. Power Eng. J. 2002, 16, 5–12. [Google Scholar] [CrossRef]
- Klein, D.J.; Randić, M. Resistance distance. J. Math. Chem. 1993, 12, 81–95. [Google Scholar] [CrossRef]
- Bu, C.; Sun, L.; Zhou, J.; Wei, Y. A note on block representations of the group inverse of Laplacian matrices. Electron. J. Linear Algebra 2012, 23, 866–876. [Google Scholar] [CrossRef] [Green Version]
- Zhou, J.; Bu, C.; Wei, Y. Group inverse for block matrices and some related sign analysis. Linear Multilinear Algebra 2012, 60, 669–681. [Google Scholar] [CrossRef]
- Ben-Israel, A.; Greville, T.N. Generalized Inverses: Theory and Applications (Vol. 15); Springer Science & Business Media: New York, NY, USA, 2003; Volume 15. [Google Scholar]
- Zhang, T.; Bu, C. Detecting community structure in complex networks via resistance distance. Phys. A Stat. Mech. Its Appl. 2019, 526, 120782. [Google Scholar] [CrossRef]
- Horowitz, K.A.; Jain, A.; Ding, F.; Mather, B.; Palmintier, B. A techno-economic comparison of traditional upgrades, volt-var controls, and coordinated distributed energy resource management systems for integration of distributed photovoltaic resources. Int. J. Electr. Power Energy Syst. 2020, 123, 106222. [Google Scholar] [CrossRef]
- Photovoltaics, Distributed Generation, and Energy Storage. IEEE standard for interconnection and interoperability of distributed energy resources with associated electric power systems interfaces. IEEE Std. 2018, 1547–2018. [Google Scholar] [CrossRef]


Publisher’s Note: MDPI stays neutral with regard to jurisdictional claims in published maps and institutional affiliations. |
© 2021 by the authors. Licensee MDPI, Basel, Switzerland. This article is an open access article distributed under the terms and conditions of the Creative Commons Attribution (CC BY) license (http://creativecommons.org/licenses/by/4.0/).
Share and Cite
Sedzro, K.S.A.; Horowitz, K.; Jain, A.K.; Ding, F.; Palmintier, B.; Mather, B. Evaluating the Curtailment Risk of Non-Firm Utility-Scale Solar Photovoltaic Plants under a Novel Last-In First-Out Principle of Access Interconnection Agreement. Energies 2021, 14, 1463. https://0-doi-org.brum.beds.ac.uk/10.3390/en14051463
Sedzro KSA, Horowitz K, Jain AK, Ding F, Palmintier B, Mather B. Evaluating the Curtailment Risk of Non-Firm Utility-Scale Solar Photovoltaic Plants under a Novel Last-In First-Out Principle of Access Interconnection Agreement. Energies. 2021; 14(5):1463. https://0-doi-org.brum.beds.ac.uk/10.3390/en14051463
Chicago/Turabian StyleSedzro, Kwami Senam A., Kelsey Horowitz, Akshay K. Jain, Fei Ding, Bryan Palmintier, and Barry Mather. 2021. "Evaluating the Curtailment Risk of Non-Firm Utility-Scale Solar Photovoltaic Plants under a Novel Last-In First-Out Principle of Access Interconnection Agreement" Energies 14, no. 5: 1463. https://0-doi-org.brum.beds.ac.uk/10.3390/en14051463