Article

Fault Sealing Evaluation of a Strike-Slip Fault Based on Normal Stress: A Case Study from Eastern Junggar Basin, NW China

1
School of Geosciences, China University of Petroleum, Qingdao 266580, China
2
Key Laboratory of Deep Oil & Gas, China University of Petroleum (East China), Qingdao 266580, China
3
Research Institute of Exploration and Development, Xinjiang Oilfield Company, PetroChina, Karamay 834000, China
*
Authors to whom correspondence should be addressed.
Submission received: 8 February 2021 / Revised: 1 March 2021 / Accepted: 2 March 2021 / Published: 8 March 2021
(This article belongs to the Special Issue Mining Innovation)

Abstract

:
The sealing of a fault zone has been a focus for geological studies in the past decades. The majority of previous studies have focused on the extensional regimes, where the displacement pressure difference between fault rock and reservoir was used to evaluate the fault-sealing property from the basic principle of fault sealing. When considering the displacement pressure difference, the impact of gravity on the fault rock was considered, whereas the impact of horizontal stress was ignored. In this study, we utilize the displacement pressure difference as an index to evaluate the sealing capacity of strike-slip faults, in which both the impacts of gravity and horizontal stress on the fault rocks are all integrated. By calculating the values of σ H / σ V and σ h / σ V in the vicinity of fault planes, the coefficient K of compaction impacts on fault rocks between normal stress to fault planes and gravity was then determined. By revealing the quantitative relationship between the displacement pressure of rocks, burial depth and clay content, the displacement pressure difference between fault rocks and reservoirs were calculated. The results suggest that the sealing capacity of a strike-slip fault is not only related to the magnitude of normal stress to the fault plane, but also to the stress regime. The clay content is also an important factor controlling the sealing capacity of strike-slip faults.

1. Introduction

In the process of subsurface oil and gas migration and accumulation, faults can be barriers to hydrocarbon accumulation [1,2,3,4,5,6]. As the sealing capacity of faults determines the effectiveness of hydrocarbon traps, the sealing property of fault has been a concern of many studies [7,8,9,10,11,12]. Many qualitative and quantitative approaches have been proposed to evaluate fault seal potential. In the middle of the 20th century, the research on fault sealing mainly focused on mudstone smear and lithology juxtaposition by considering the juxtaposition relationship between reservoir and non-reservoir [13] and the mechanism of capillary sealing [14,15,16]. Englder (1974) studied the formation mode of fault gouge by observing the structural characteristics of clastic materials within fault zones, suggesting that fault gouge is only distributed in the vicinity of shear fractures and large sliding surfaces, whereas fault rocks are distributed throughout the whole fault zone. In recent decades, several algorithms have been proposed to evaluate the fault sealing properties quantitatively, either based on the continuity of clay smears or average clay content within the fault zones, e.g., Clay Smear Potential (CSP) [17,18], Shale Smear Factor (SSF) [19], Shale Gouge Ratio (SGR) [20] and Scaled Shale Gouge Ratio (SSGR) [21]. These algorithms evaluate the fault sealing properties by considering the re-distribution of mudstone/shale beds or the clay/content of the beds in sheared fractures.
However, the continuity of clay smearing is determined by a series of parameters including the sedimentary lithification state, the effective stress, the confining pressure, the strain rate and the mineralogy [22]. This makes the above-mentioned algorithms subject to many limitations in practical applications. In particular, some scholars proposed [23,24,25] calculating the displacement pressure to evaluate the fault-sealing capacity, suggesting that a fault, with displacement pressure no smaller than the reservoir rocks, can seal the oil and gas laterally.
Smith (1966) thought that if the fault has good sealing properties, the fault zone must have high displacement pressure, or there would be a displacement pressure difference between the hanging wall and footwall rocks of the fault. Based on Smith’s research, Lyu (2009) quantitatively analyzed the fault sealing by using the difference between the displacement pressure of fault rock and reservoir and considered that the displacement pressure of fault rock depends on the clay content of fault rock and the normal stress on the fault plane. Fu (2014) improved the algorithm and evaluated the vertical sealing ability of the fault based on the displacement pressure difference between fault rock and reservoir; Lei (2019) evaluated the relationship between the SGR value of fault rock and its sealing capacity based on the displacement pressure difference between fault rock and reservoir.
By considering the displacement pressure difference between fault rocks and reservoir rocks, many studies were conducted to quantitatively evaluate the fault-sealing capacity of extensional basins, e.g., the Bohai Bay basin in eastern China, the Yinggehai basin in south China and the Termit basin in Niger [25,26,27]. However, due to the weak horizontal compressive stress in the extensional basins in these above study areas, these studies considered the impact of gravity on fault zones but without the effect of horizontal lateral compression.
However, in the contractional regimes, horizontal stress plays important control in the fault zone evolution and fault rock development. Therefore, when evaluating the sealing capacity of fault zones using displacement pressure calculation, not only the gravity but also the horizontal stress should be considered. In this study, we selected a contractional basin, the Junggar Basin in NW China, as a template to evaluate fault sealing capacity by integrating both gravity and horizontal stress. A new method is proposed in this study to evaluate the sealing behavior of strike-slip faults developed in the Dongdaohaizi sag in the eastern Junggar basin. Based on the mechanism of fault sealing, the displacement pressure difference between fault rock and reservoir is taken as an index to quantitatively evaluate the sealing strength of the strike-slip fault. The normal stress of vertical stress and horizontal stress on the fault plane is calculated synthetically. The values of σ H / σ V and σ h / σ V near the fault plane are calculated using Formation Micro Image (FMI) logging data and conventional logging data, and the relationship between comprehensive compaction of fault rock and vertical compaction is deduced. The orientation of σ H near the fault is also determined by FMI logging data. Based on mercury intrusion experiment data in the study area, a functional relationship was established; the displacement pressure difference between fault rocks and reservoir was calculated to realize the sealing evaluation of a strike-slip fault. This study provides some new understanding of the evolution of fault sealing in the Dongdaohaizi sag. The evaluation result of fault sealing is confirmed by the actual production situation.

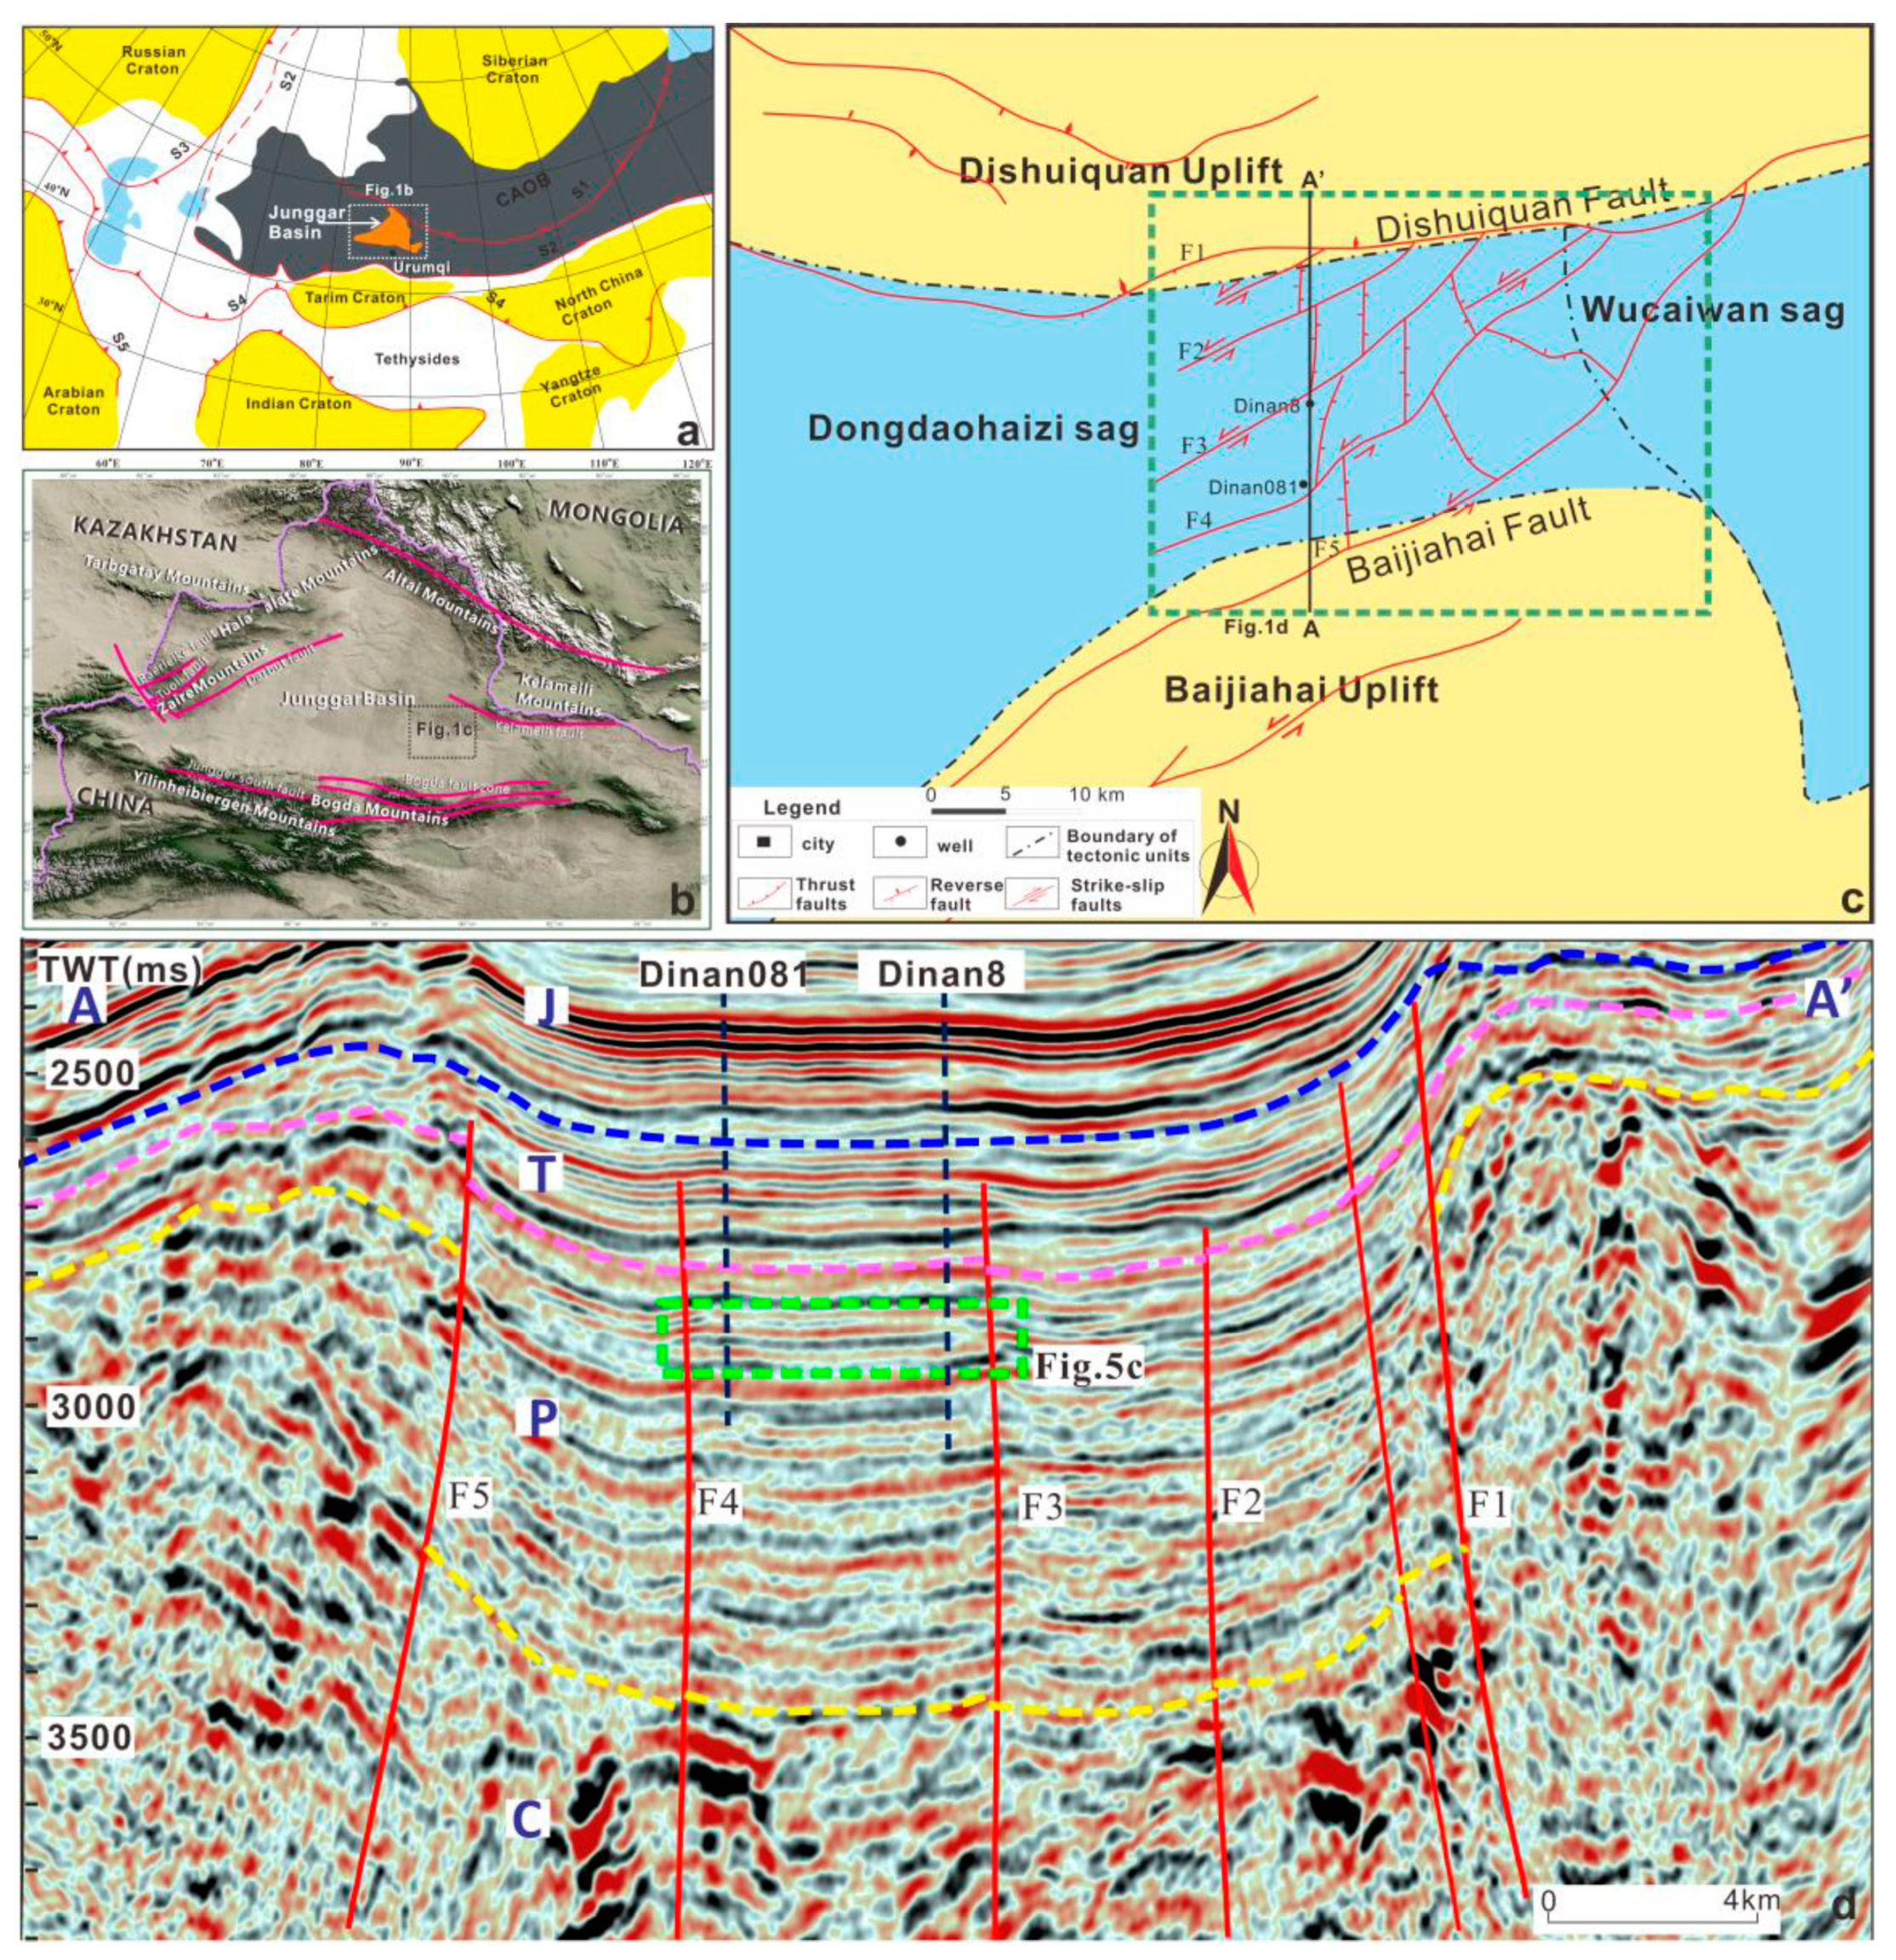
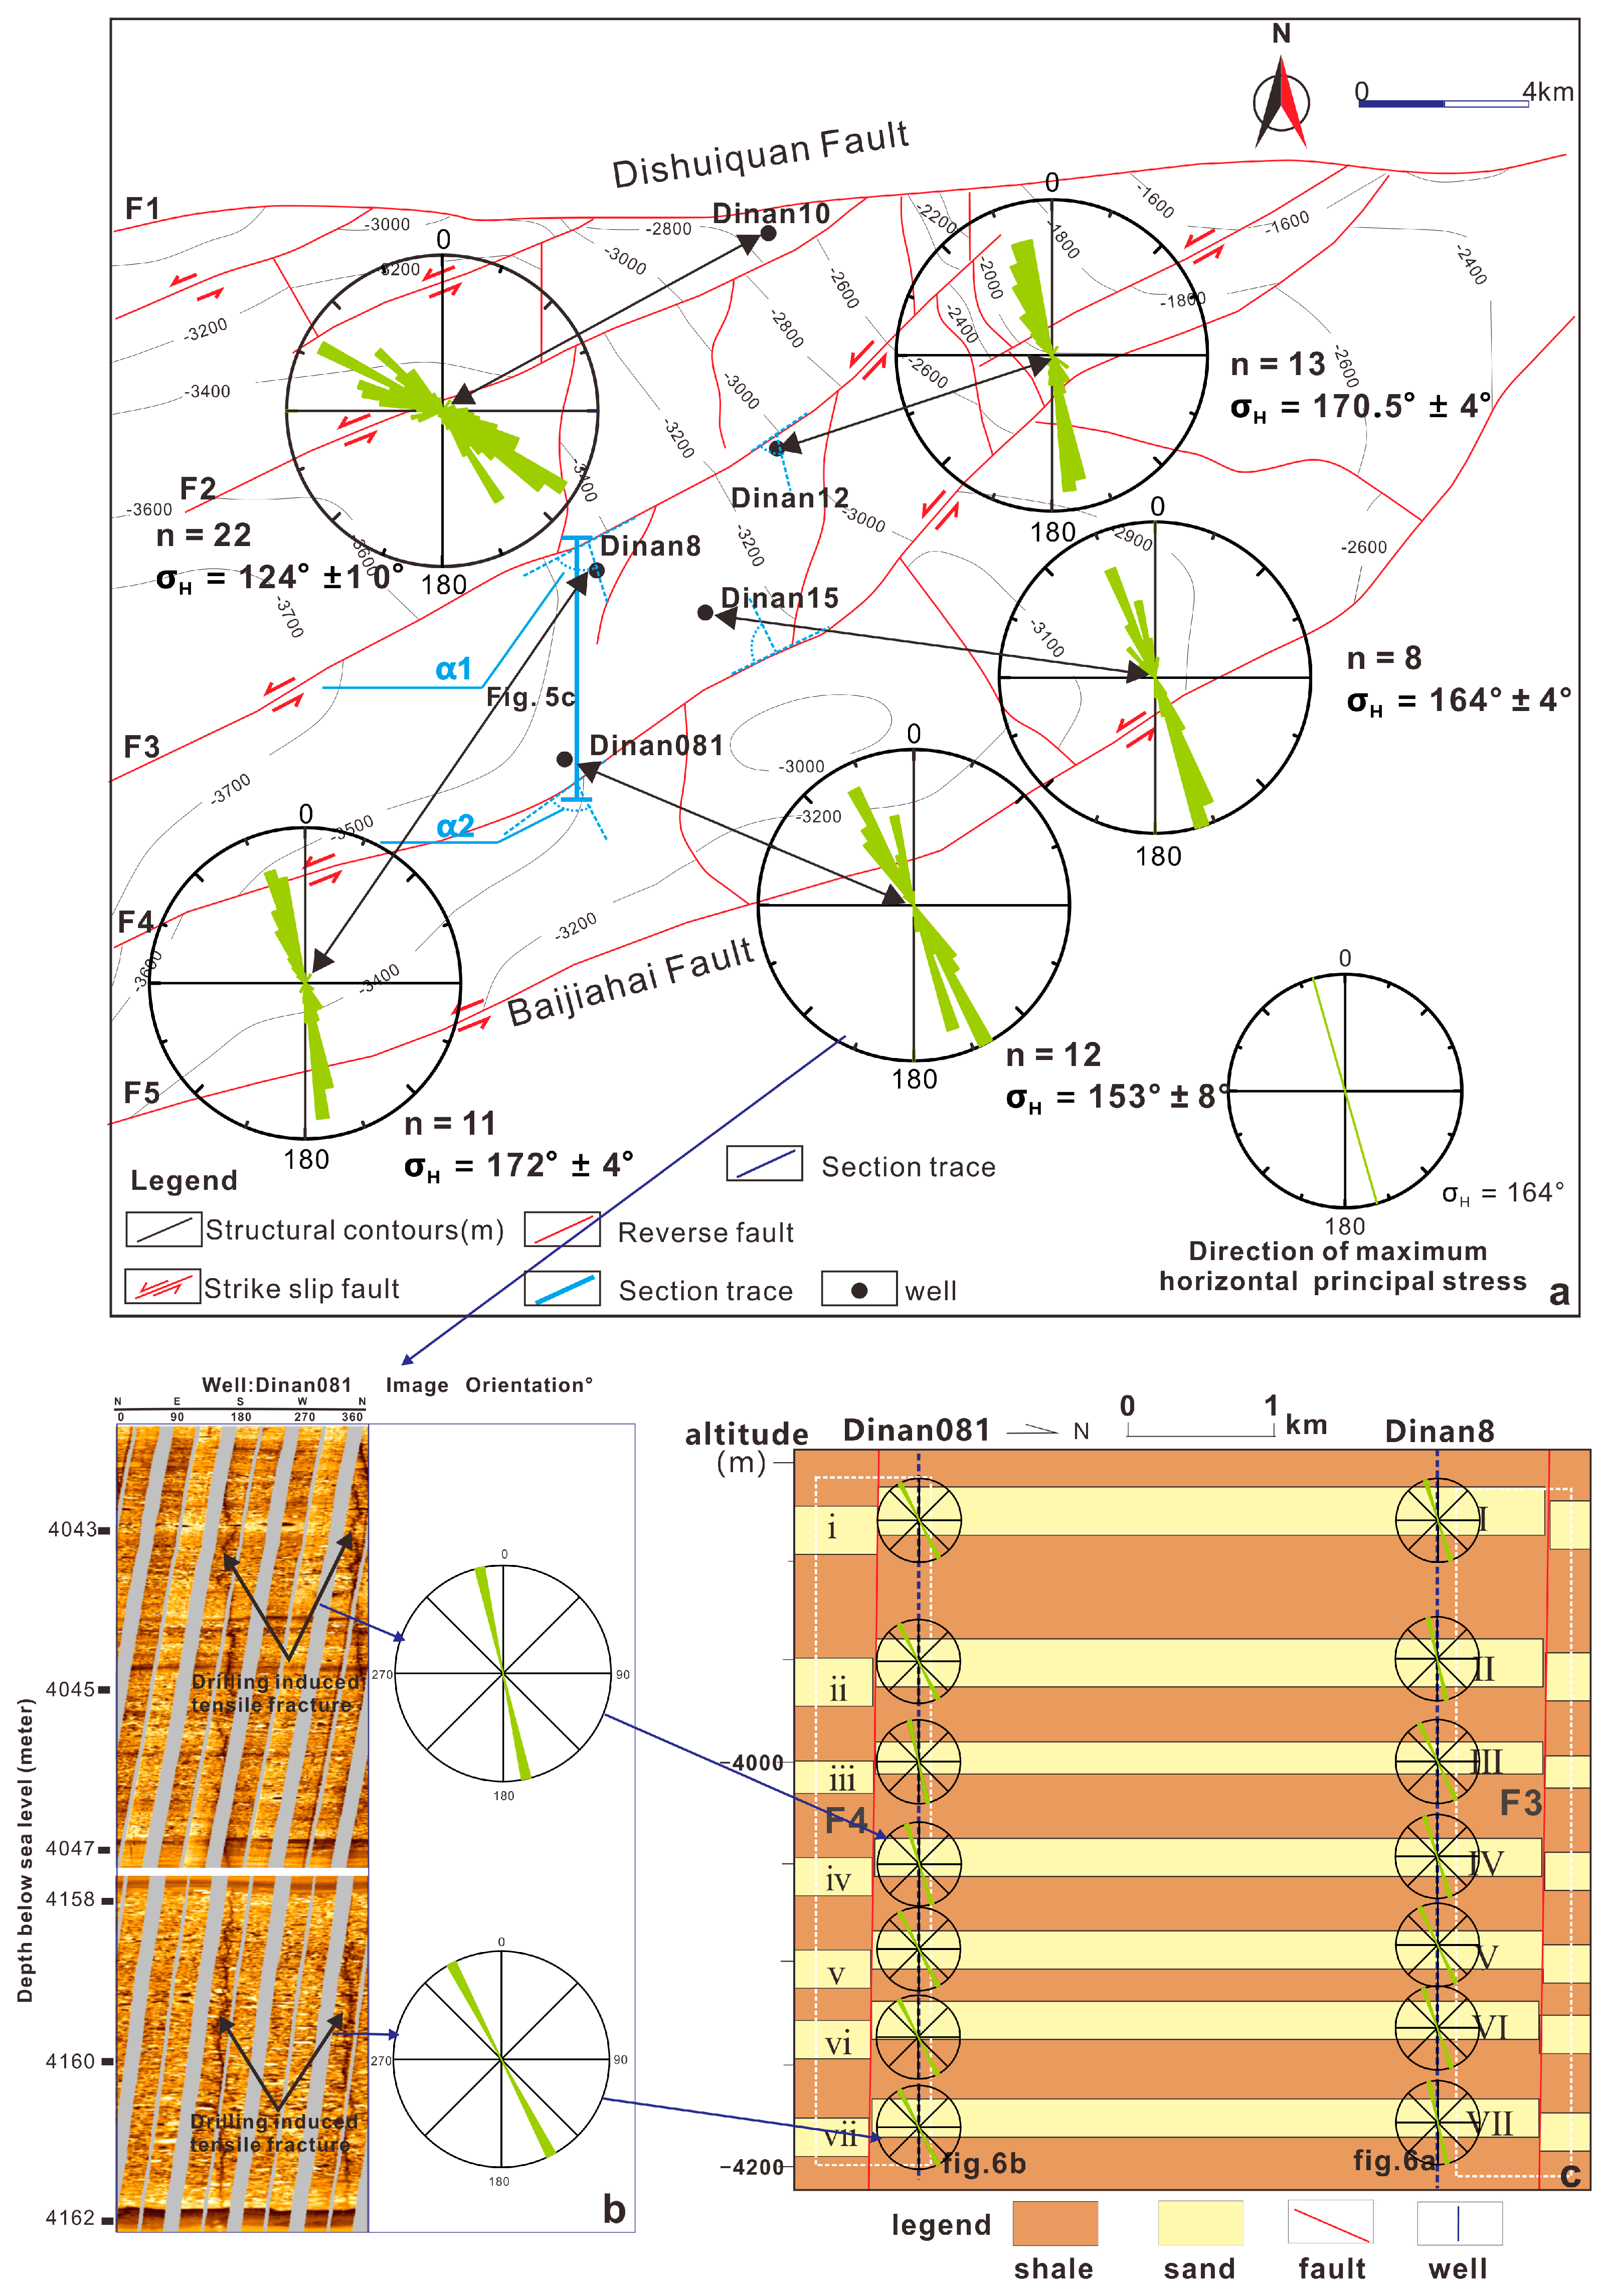
2. Geological Setting

Tectonically, the Junggar Basin, located in the junction area of the Kazakhstan, Siberian and Tarim plates, is an important element within the famous Central Asian Orogenic Belt (CAOB) (Figure 1a) [28,29,30,31,32]. The Junggar Basin is constrained by a number of orogenic belts, including the Altai-kelameili mountains to the northeast, the Zaire-Hala’alate mountains to the northwest, and the Yilinheibergen-Bogda mountains to the South (Figure 1b) [33].
Geophysical data suggest that the Junggar Basin is a complex composite basin that has endured multiple polycyclic tectonic events [34,35,36,37]. Previous studies indicate that the basin formed in the Late Carboniferous due to the collision and amalgamation of the CAOB [38,39]. The Junggar Basin entered into an intracontinental depression stage in the Mesozoic due to contraction from the northwest and northeast [35,40], forming and reactivating the internal structures within the Junggar basin [38,41]. The reverse boundary faults of the Junggar Basin gradually stopped its slip [37,42] from Late Jurassic to Early Neogene. From the Neogene to the Quaternary, being affected by the collision between the Indian and Eurasian plates, a rejuvenated foreland basin was developed in the Junggar area [35,36]. Due to polycyclic tectonic movements that happened in the Junggar basin, a series of strike-slip faults were developed in the northwest, southeast and northeast Junggar Basin [43,44,45,46].
The green rectangle in Figure 1c demonstrates the detailed position of this study, which covers the east portion of the Dongdaohaizi sag, together with the east end of the Wucaiwang sag, the south end of the Dishuiquan uplift and the north end of the Baijiahai uplift. As presented in Figure 1c, complex strike-slip fault systems were developed in our study area, including F1 (the Dishuiquan fault), F2, F3, F4 and F5 (the Baijiahai fault). The fault systems are primarily NE–SW striking, which is sub-perpendicular to the NWW–SEE trending Kelameili strike-slip fault to the northeast. Figure 1d is a north–south trending seismic profile, indicating the development of strike-slip fault systems, including F1, F2, F3, F4 and F5. These faults, with high dip angles, offset the Carboniferous, Permian and Triassic sediments from the deeper to the upper section. The faults F1 (the Dishuiquan fault) and F5 (the Baijiahai fault) present a fault throw of higher than 500 ms, whereas the faults F2, F3 and F4 present very limited fault throw.
The petroleum production data suggest that there are abundant hydrocarbon resources in our study area. In particular, in the vicinity of the faults F3 and F4, there are important petroleum findings in the production wells Dinan8 and Dinan081 (Figure 1c,d). The faults F3 and F4 may play important control on hydrocarbon migration and accumulation here. Therefore, in this study, the fault F3 and F4 were selected to conduct fault sealing evaluation to reveal their sealing capacity and controlling parameters.

3. Methods

3.1. Calculation of Clay Content of Fault Rocks

Fault rocks can be developed in a fault zone between the hanging wall and footwall of the fault during the formation or reactivation of the fault [47,48]. Previous studies suggested that the clay content of fault rocks are important factors controlling the displacement pressure of a fault zone [5,6,49].
As the clay of fault rocks derives from the strata of both the hanging wall and the footwall, the clay content of a fault zone is highly related to both fault throw and clay contents of stratigraphy in two walls. Normally, smaller fault throw and higher clay contents of the stratigraphy may result in higher clay content of fault rocks [24,50].
The clay content of fault rocks can be calculated using Equation (1) proposed by Fristad (1997).
V fr = ( i = 1 n h i × V sh i ) / D
In the above equation, V fr represents shale content of fault rock, h i represents the thickness of stratum i, V sh i represents clay content of stratum i, n represents the number of strata sliding through the study point, D represents fault throw.

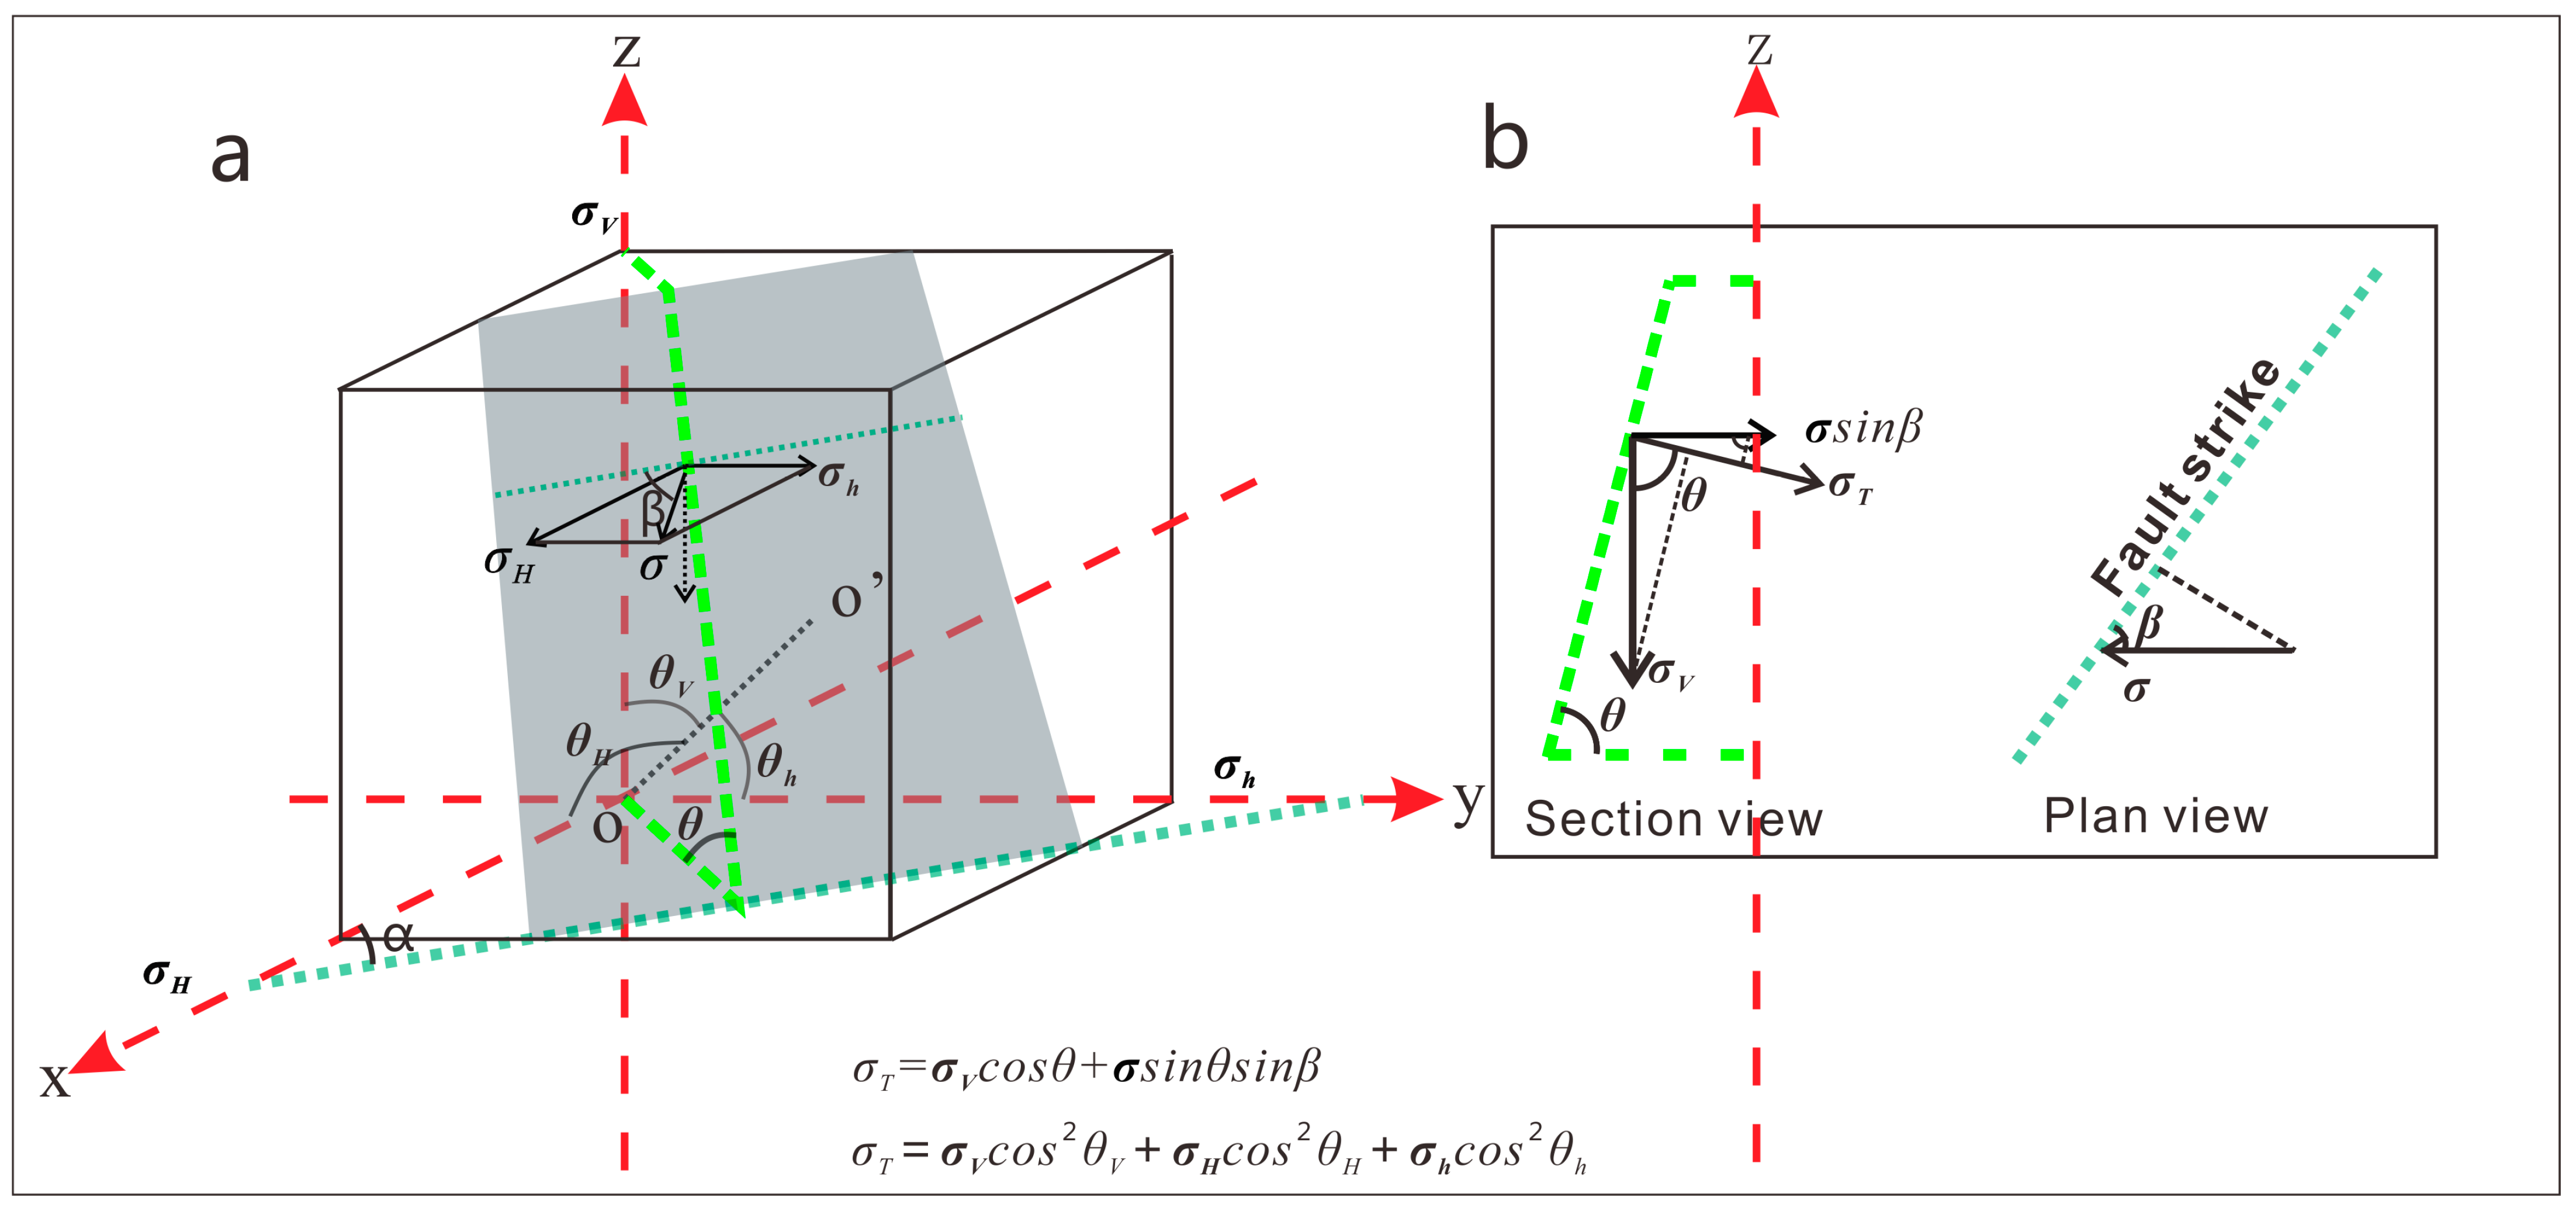
3.2. Calculation of In Situ Stress of a Fault Plane

It is widely accepted that the in situ stress of a fault plane can be calculated using well-logging data [51,52,53]. Specifically, by integrating imaging logging data, conventional logging data and dipole acoustic logging data, the maximum horizontal stress ( σ H ), ( σ h ), ( σ V ) curves can be calculated. According to the numerical relationship between σ H , σ V and σ h , three types of regimes can be classified [54,55], including normal fault regime ( σ V > σ H > σ h , Figure 2a), strike-slip fault regime ( σ H > σ V > σ h , Figure 2b) and reverse fault regime ( σ H > σ h > σ V , Figure 2c). The orientation of induced fractures can be interpreted using the imaging logging data, which then can be used to determine the orientation of maximum horizontal stress of a fault plane [56,57,58].

3.3. Calculation of Equivalent Buried Depth of Fault Rock

Fault rocks are compressed by the component that is perpendicular to the fault plane of both vertical stress and horizontal stress [59,60]. The magnitude of vertical stress can be calculated by integration of density logs, and the horizontal stress can be calculated indirectly by the functional relationship between horizontal stress and vertical stress [58,61,62].
The coordinate system was established (Figure 3a) to calculate normal stress ( σ T ) on a fault plane (in grey) by integrating vertical stress ( σ V ), maximum horizontal stress ( σ H ) and minimum horizontal stress ( σ h ). The x-axis, y-axis and z-axis are parallel to the maximum horizontal stress σ H , the minimum horizontal stress σ h and the vertical stress σ V .
By integrating the components of σ V , σ H and σ h perpendicular to the fault plane, the resultant normal stress ( σ T ) acting on the fault plane can be calculated (Figure 3a) using the following equation:
σ T = σ V × ( cos θ V ) 2 + σ H × ( cos θ H ) 2 + σ V × ( cos θ h ) 2
The ratio between normal stress ( σ T ) and vertical stress ( σ V ) is set as K (i.e., σ T / σ V ) thus,
σ T = K × σ V
in which θ represents fault dip angle, and α represents the sharp angle between the fault strike and the maximum horizontal stress σ H (Figure 3a,b).
According to the principle of equivalent formation lithostatic pressure (e.g., Lyu et al., 2009; Fu et al., 2014; Lyu et al., 2016), the equivalent buried depth of fault rock Z h can be calculated (Equation (4)) as:
Z h = K × Z f × cos θ
in which Z f represents burial depth of fault rock, θ represents fault dip angle.

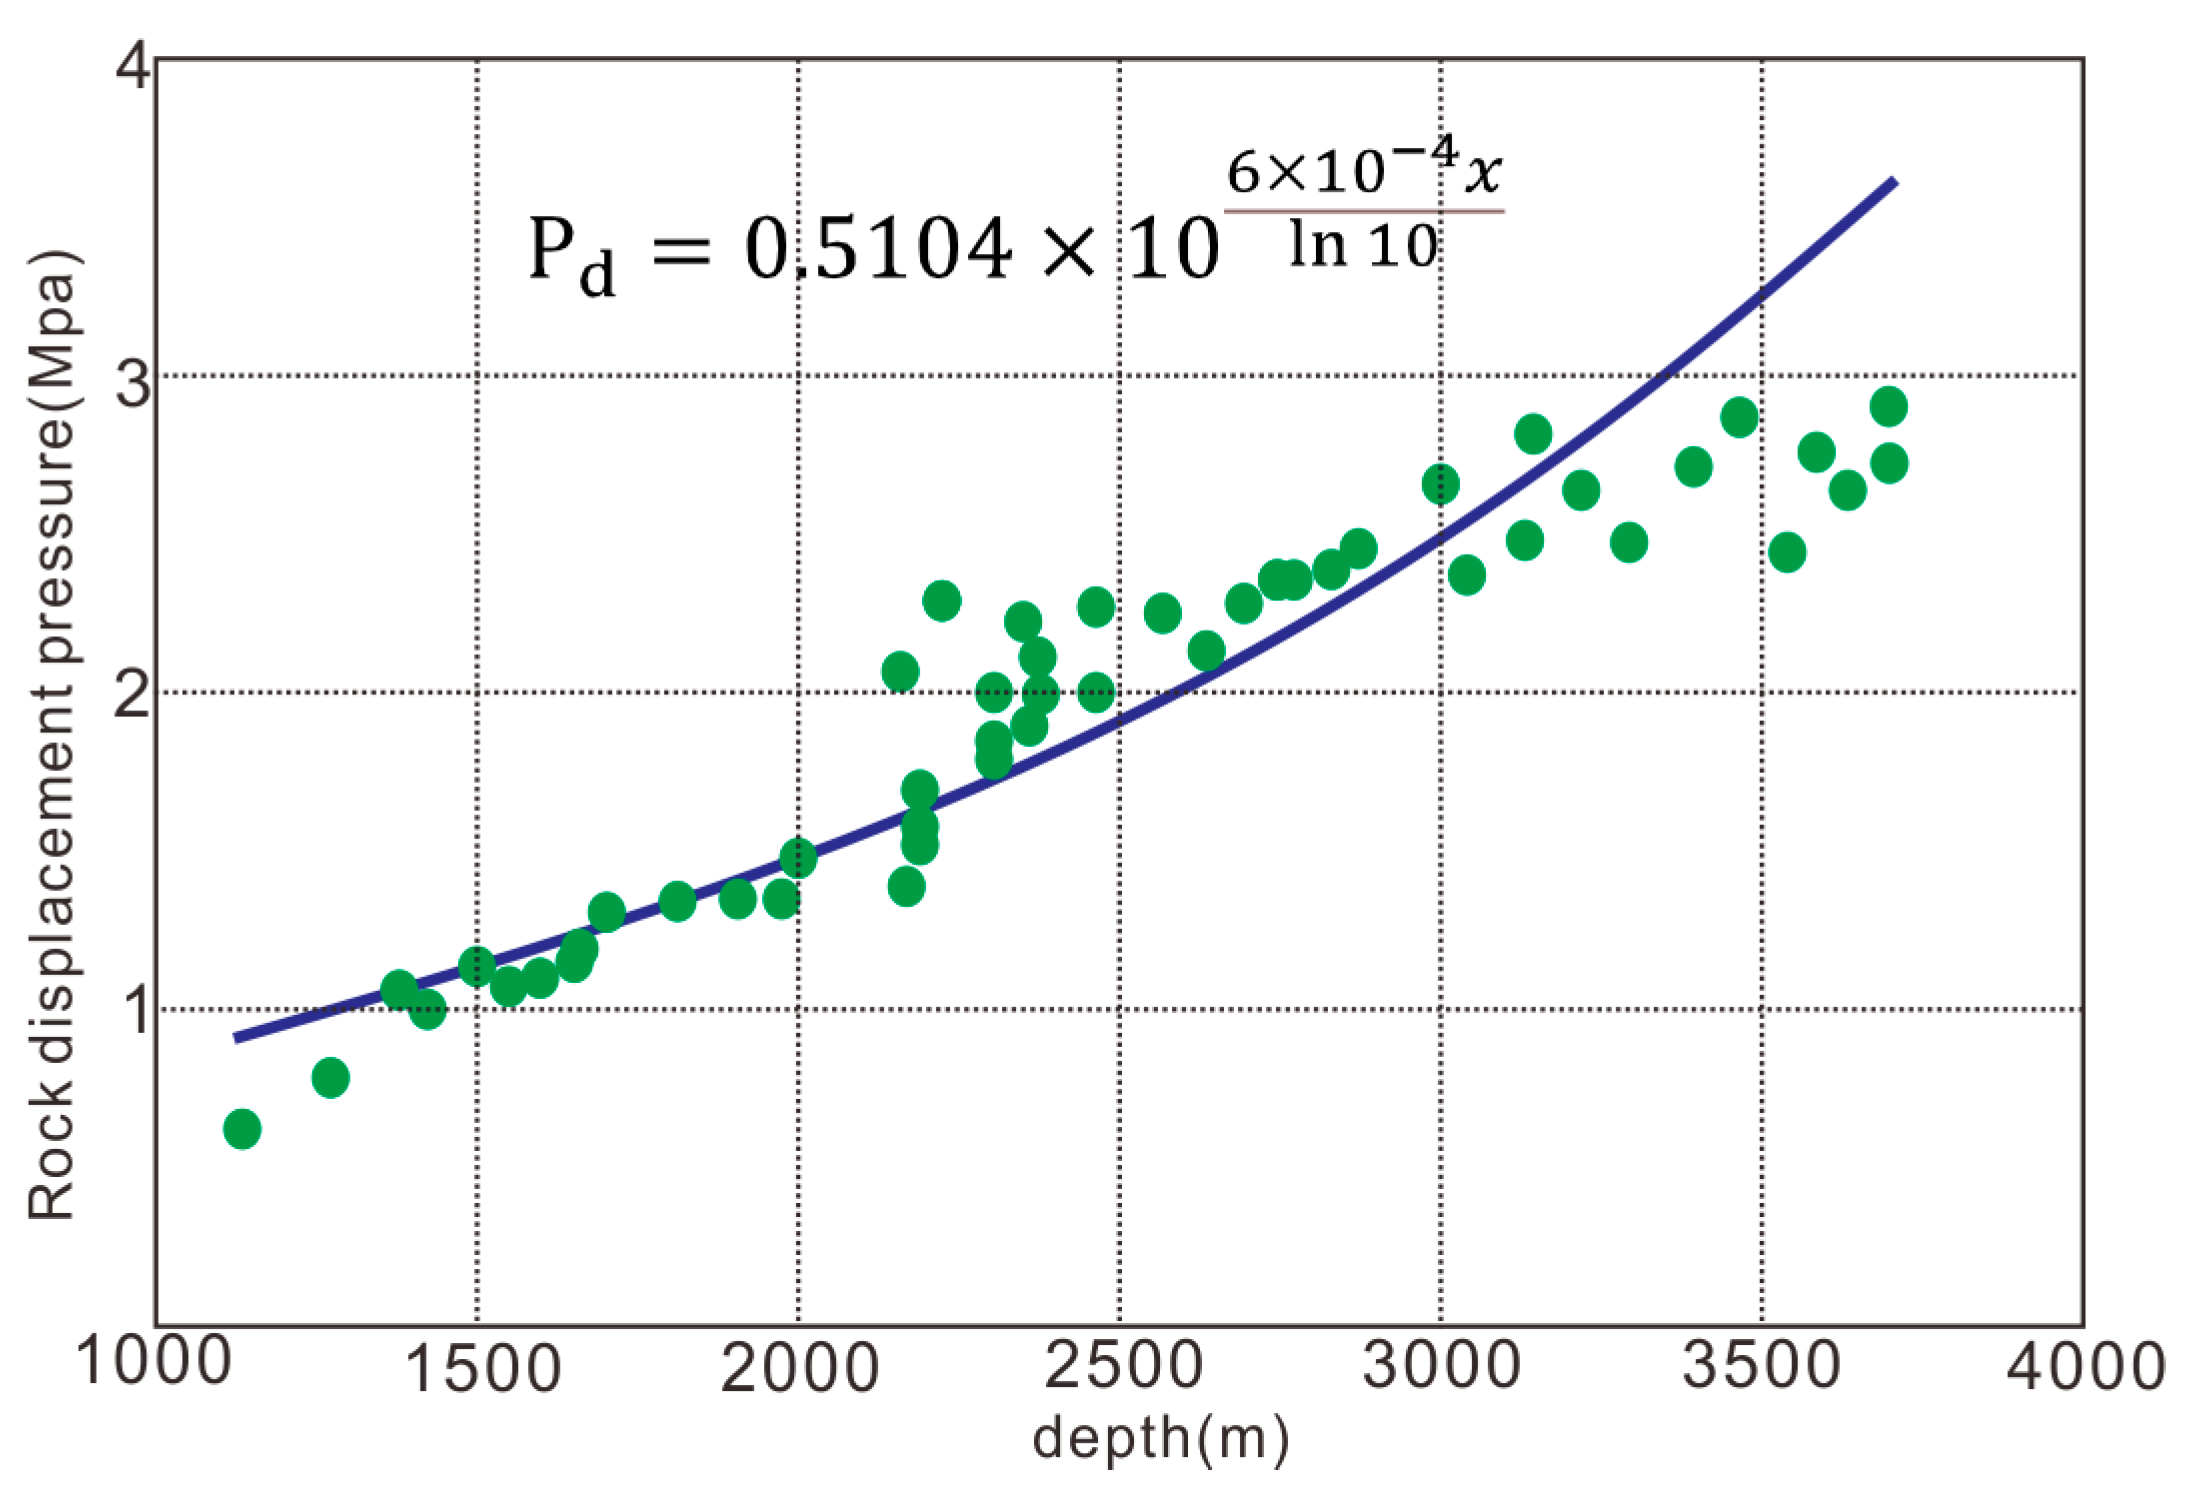
3.4. Calculation of Displacement Pressure

Accurate calculation of the displacement pressure of fault rocks and reservoir rocks is of importance in fault sealing evaluation [63,64]. In this study, 357 rock samples were collected from the Dongdaohaizi sag. Based on petrophysical testing results of these samples, a functional relationship between the rock displacement pressures, depth of burial and clay content was constructed (Equation (5)), indicating a positive correlation between the displacement pressure and the product of the clay content and the burial depth [25,26,27,49].
P d = f ( Z ,   V sh )
in which P d represents the displacement pressure, Z represents the buried depth and V sh represents the clay content.
By mathematical regression of the outer envelope curve for all samples, we obtained Equation (6) to evaluate the largest sealing ability of rock. The equation for the study area is Equation (6).
{ P d = 0.5104 × 10 6 × 10 4 x ln 10 x = Z × V sh
Equation (6) shows that the product of burial depth and shale content of rock has an exponential relationship with the displacement pressure of rock (Figure 4).

3.5. Calculation of Displacement Pressure Difference

By integrating Equations (1)–(5), the displacement pressure difference ( P d ( f r ) ) between fault rock and reservoir rock can be calculated as:
P d ( f r ) = f ( Z h , V fr ) f ( Z r , V r )
in which Z r represents buried depth of fault rock and V r represents the clay content of rock.

4. Results

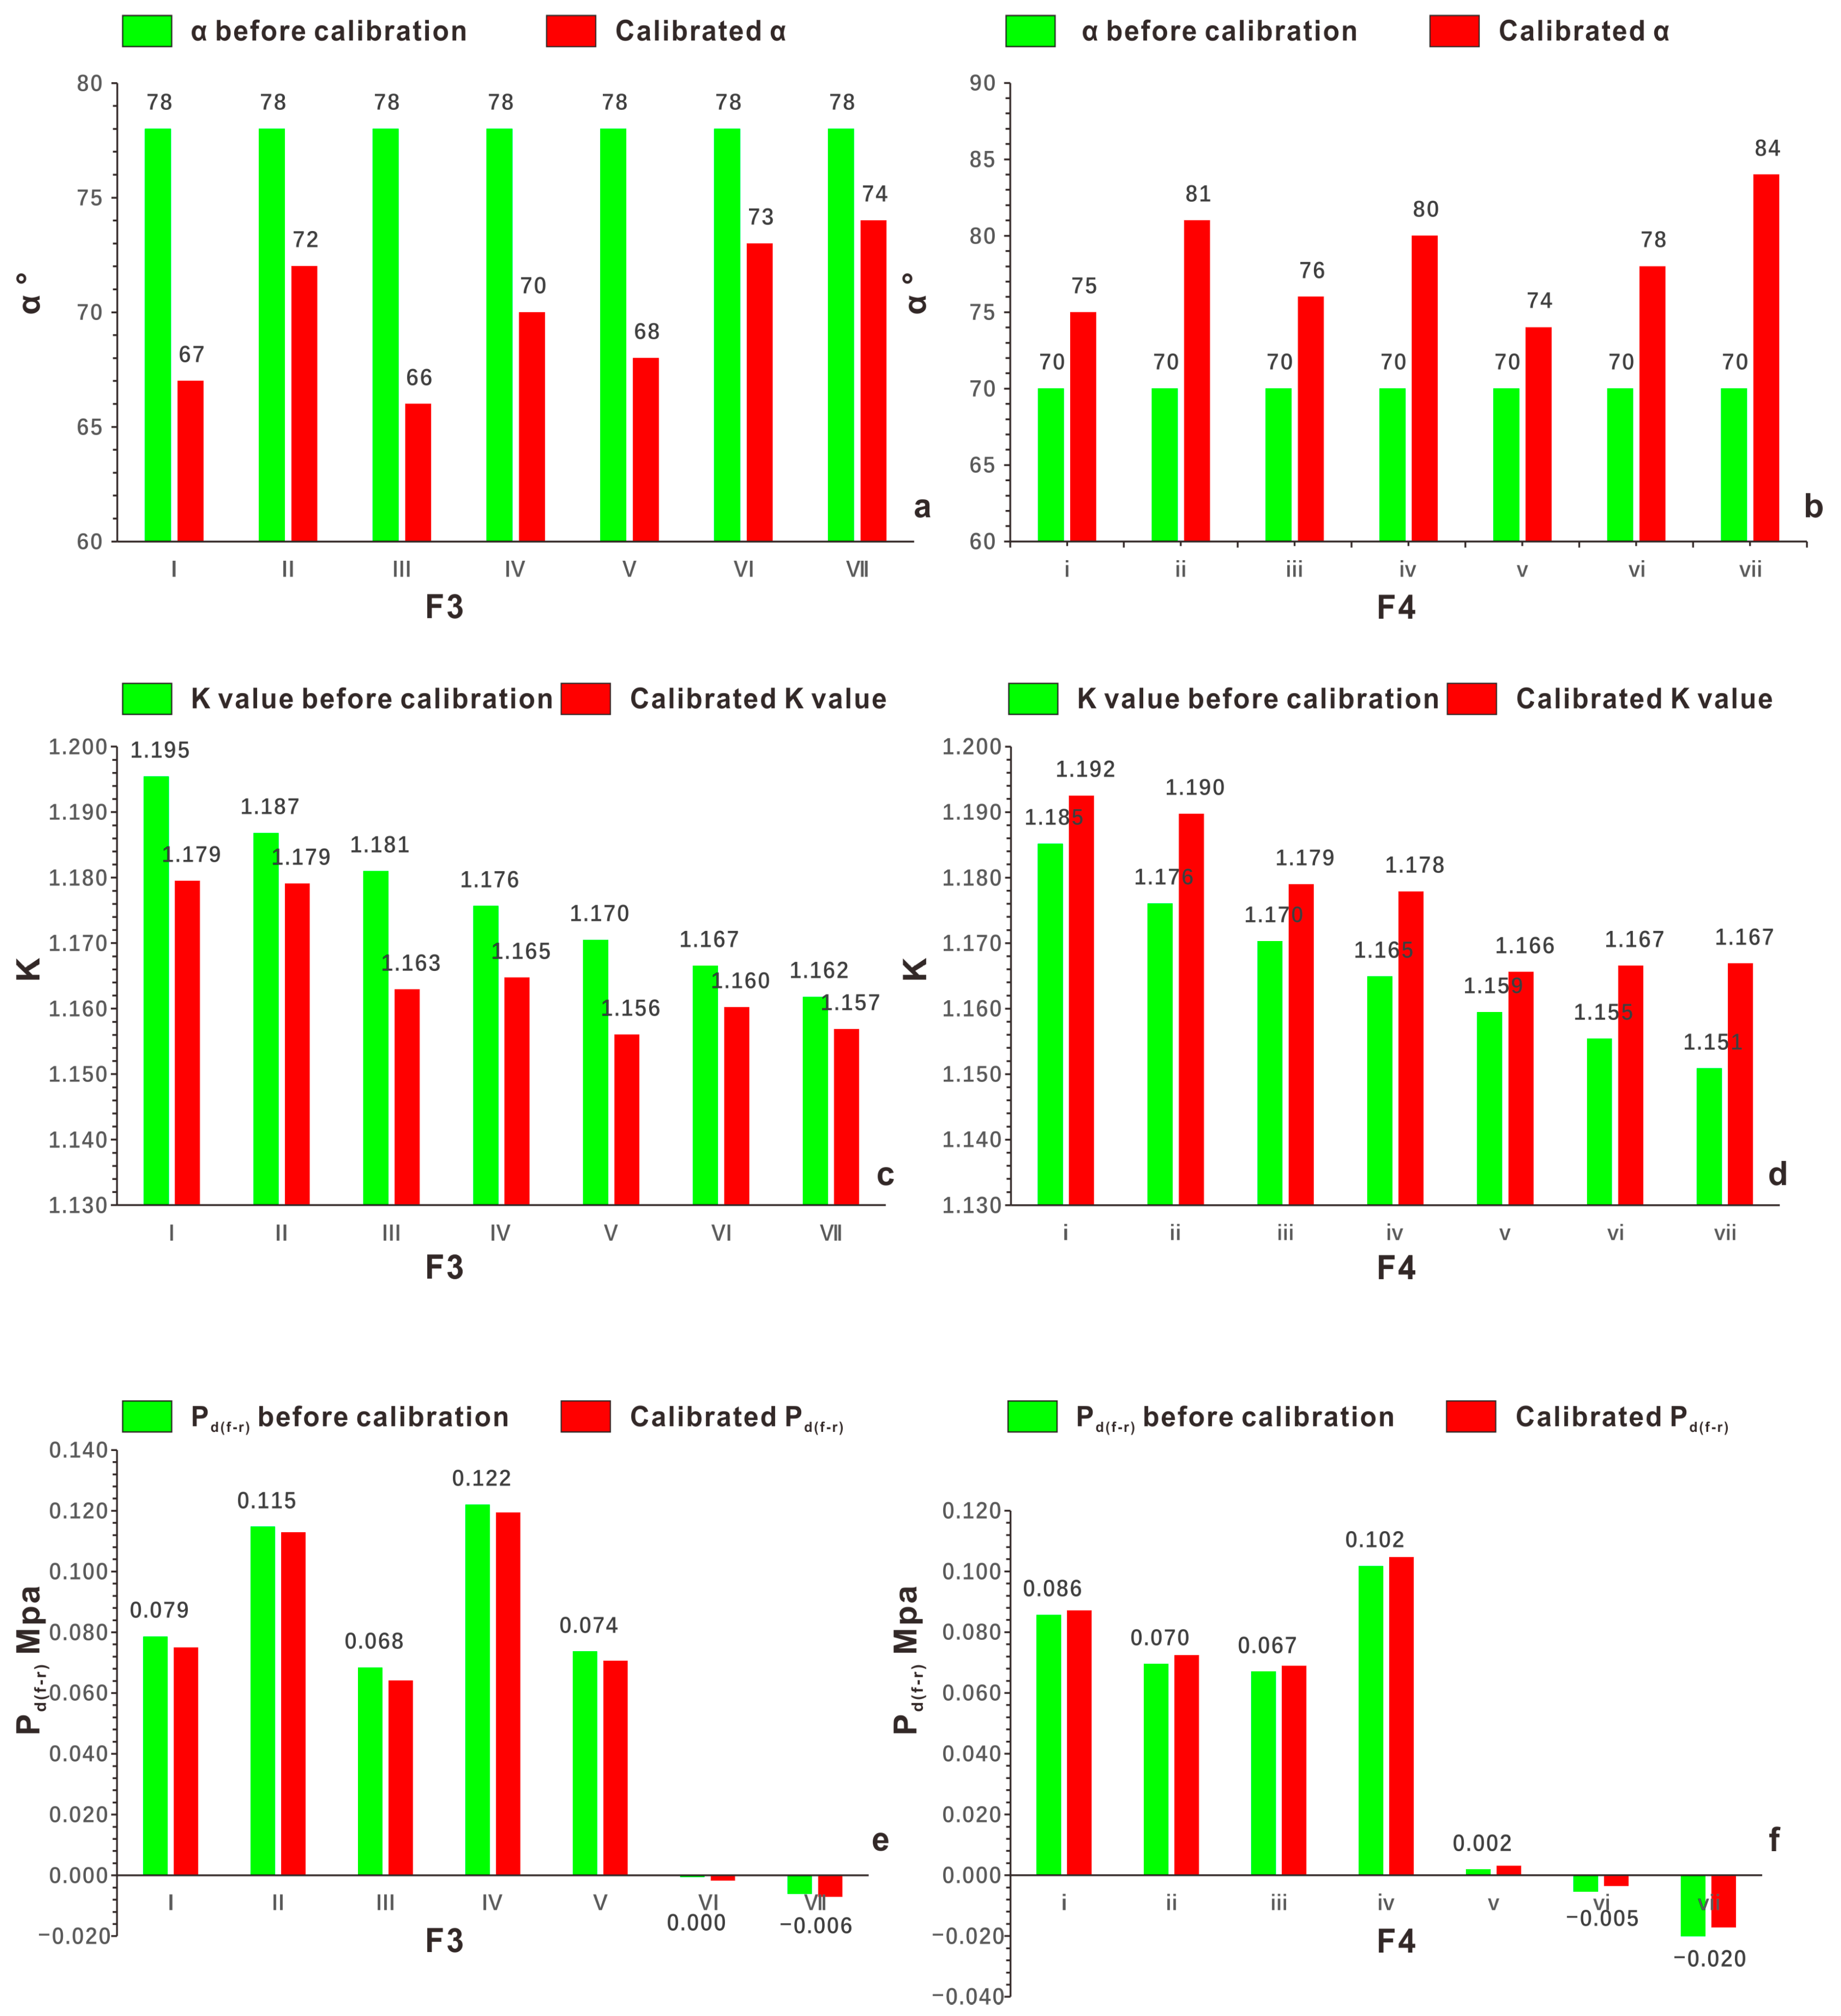
4.1. The Variation of α
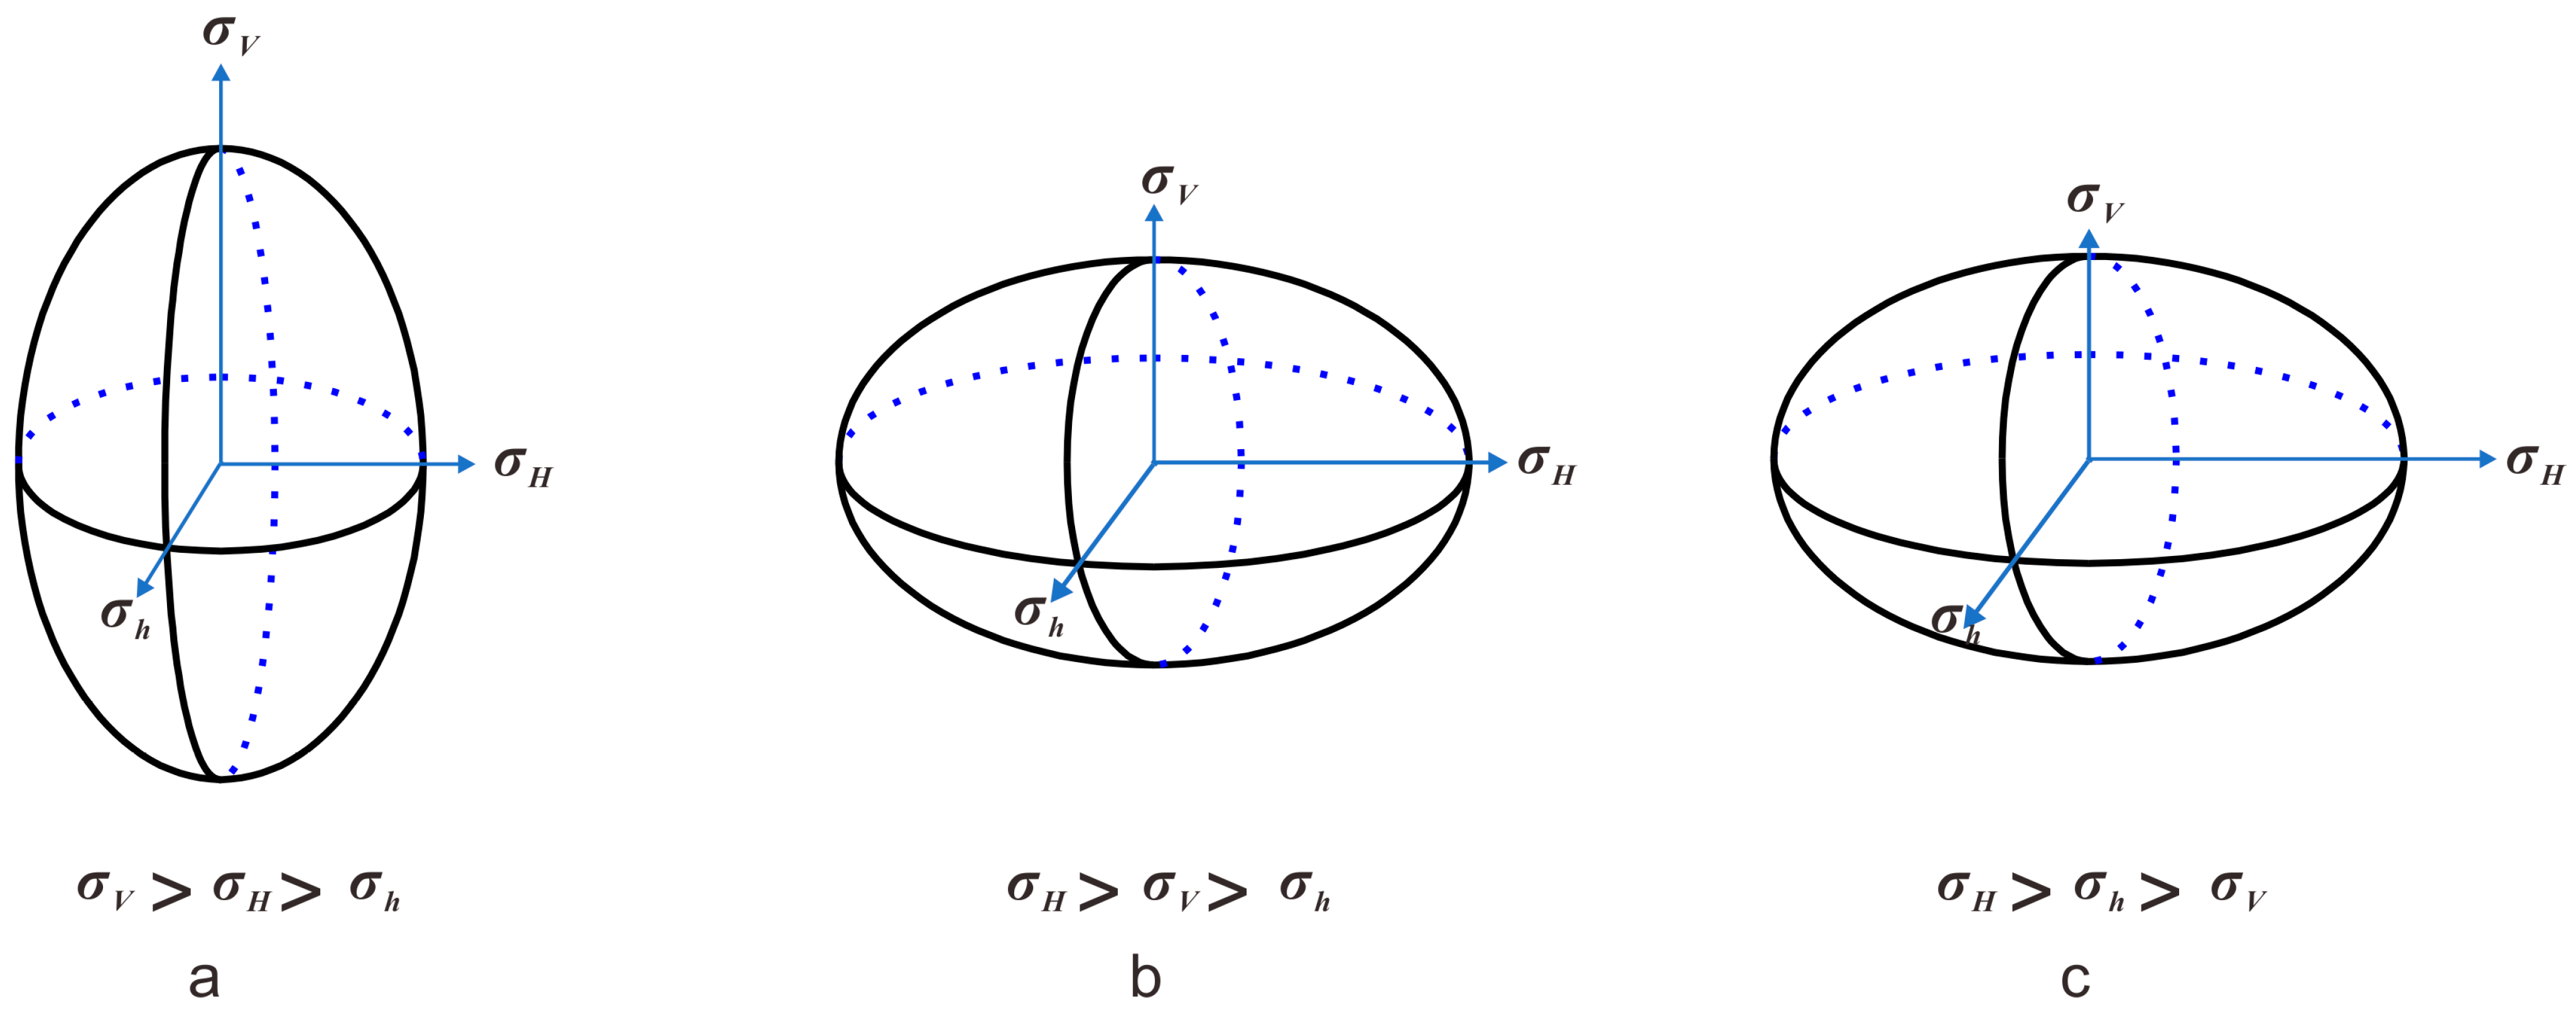
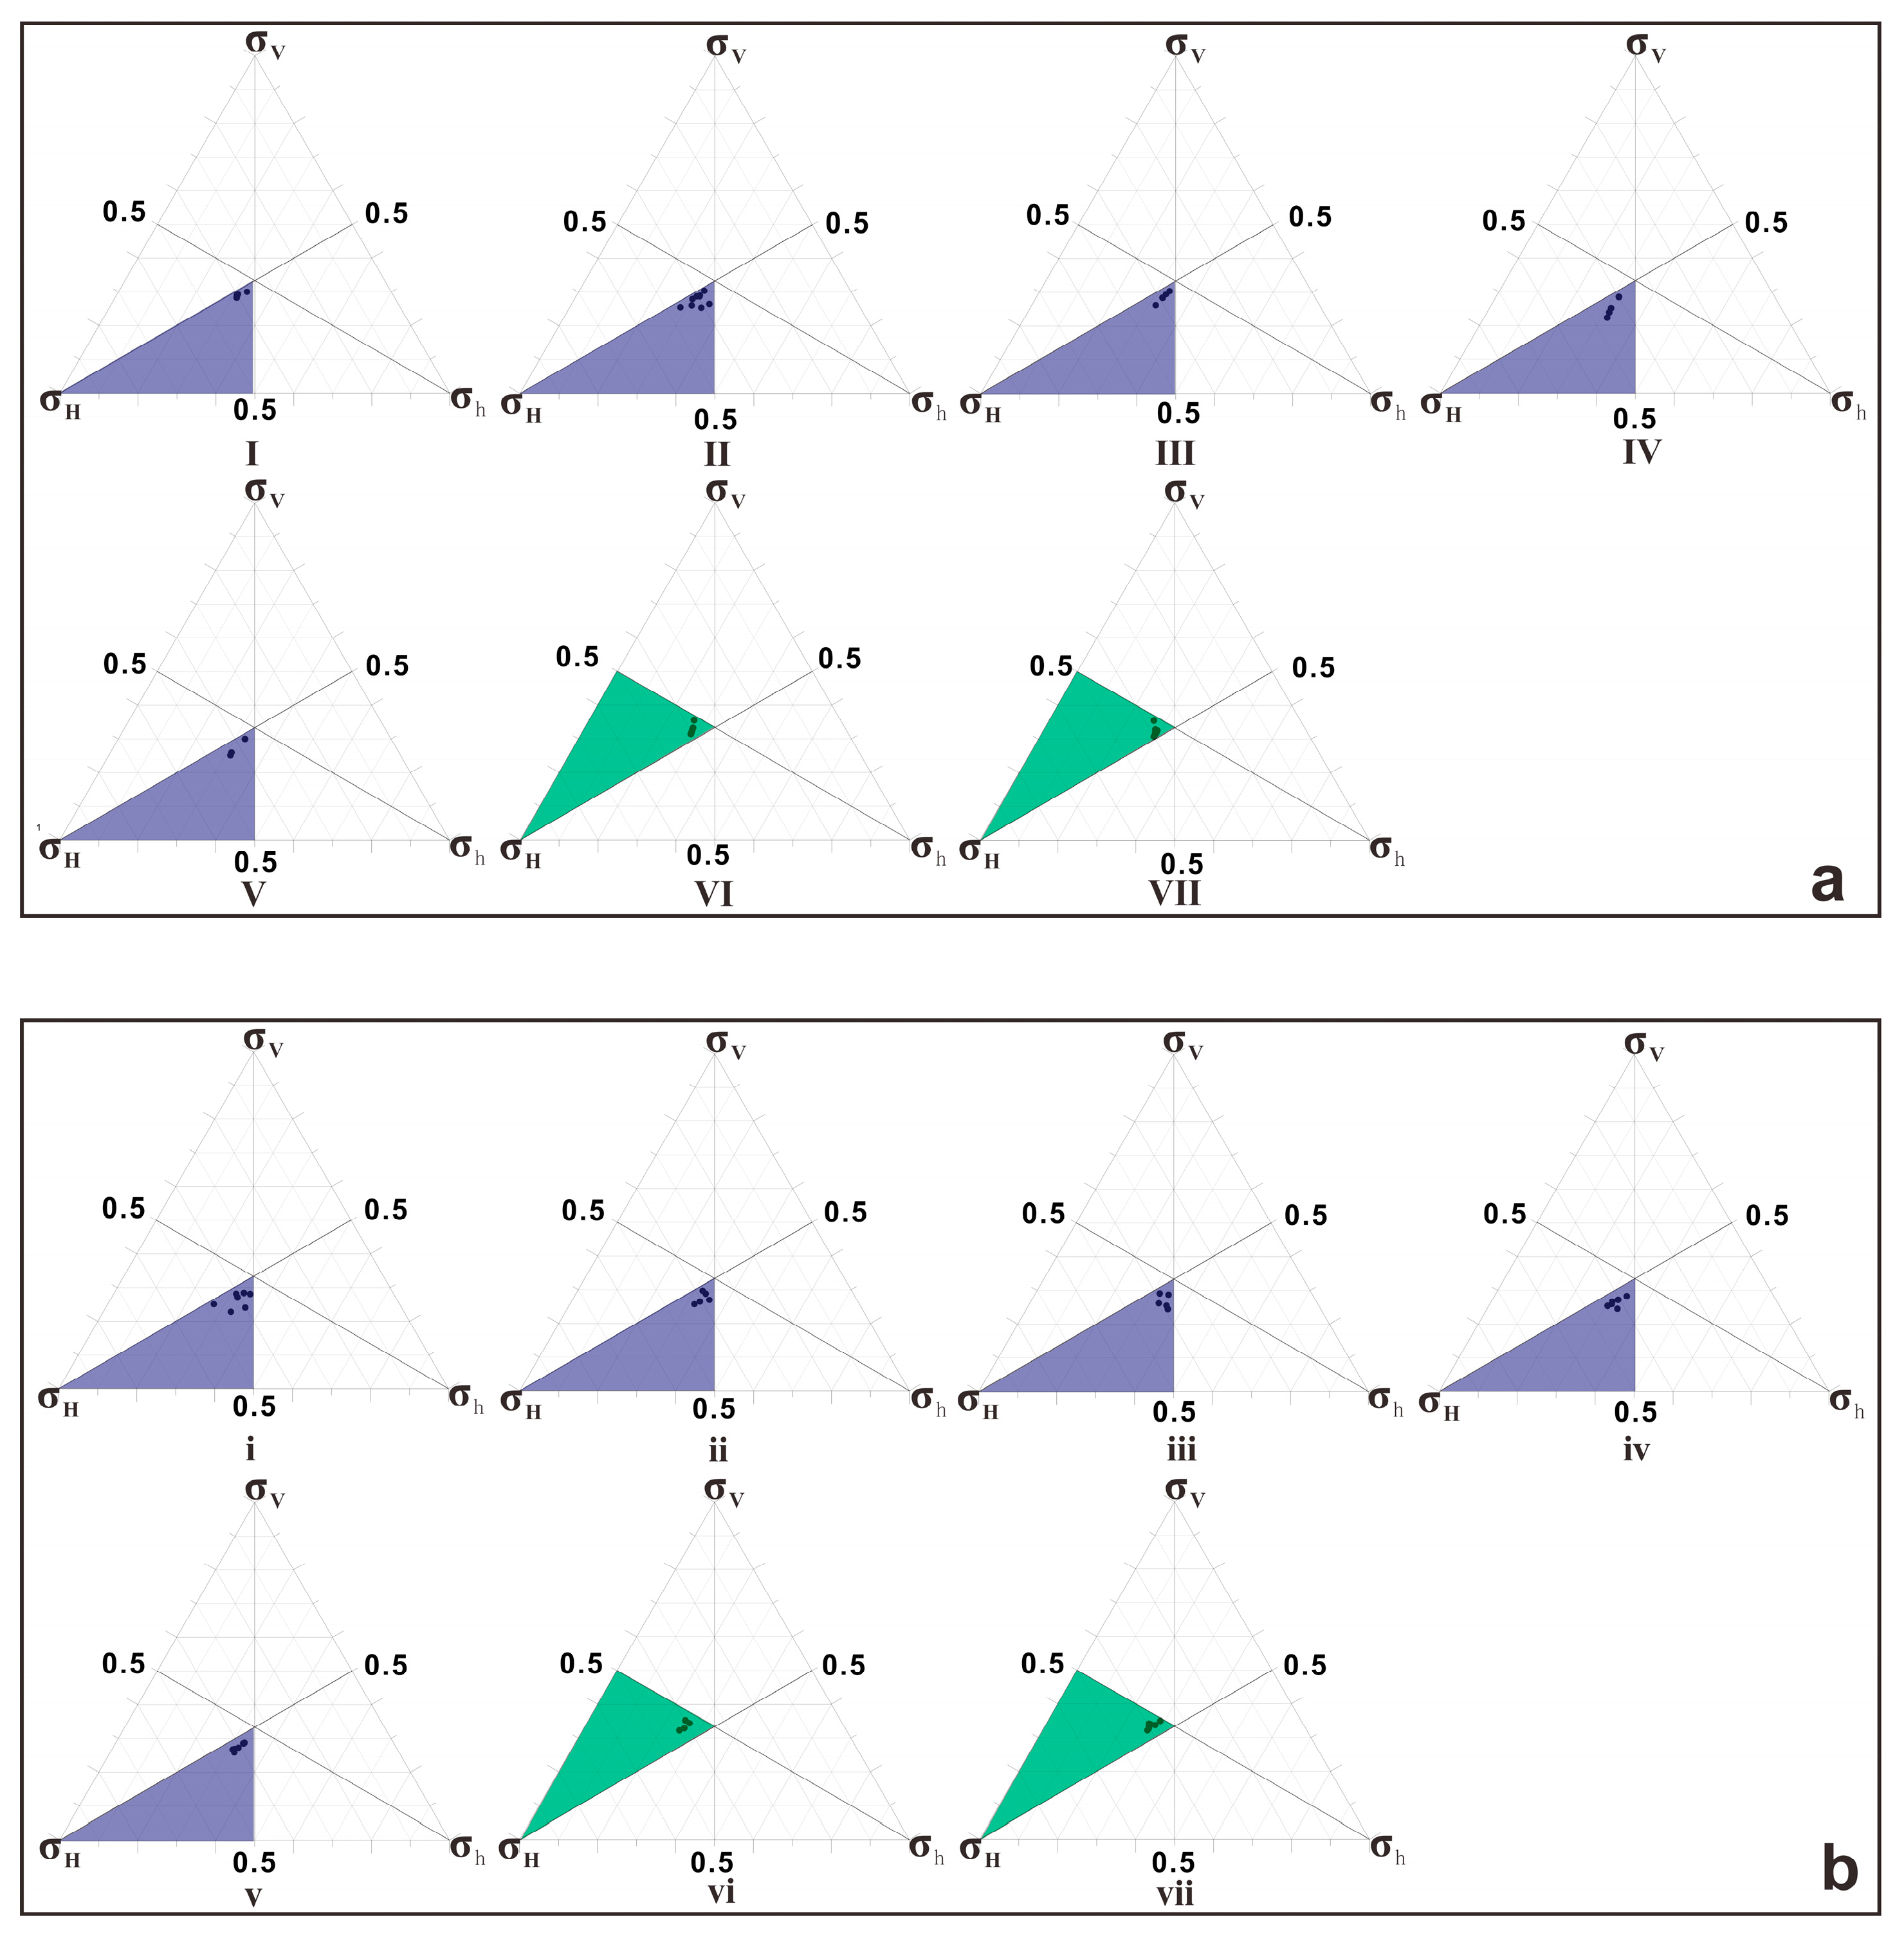
The orientation of the maximum horizontal stress near the present strike-slip fault is anisotropic [65,66,67]. Calibration of the orientation of σ H is an important step in calculating the α, which has an impact on the fault sealing. Based on the logging data of the areas, the σ V ,   σ H and σ h curves were obtained for the different locations (Figure 5). The orientation of the σ H was determined at each location. On the cross-section, the orientation of the σ H at points 2–7 km apart is not the same, and it is important to highlight that the orientation of the σ H of these five positions is different from that of the region. The angle between the σ H orientation of the northernmost point and the σ H orientation of the region can reach 40 degrees (Figure 5a). The orientation difference of the σ H between the closer points is small, while the orientation difference of the σ H between the farther points is large. On the longitudinal section, the orientation of the σ H is different in different depths at the same location (Figure 5b,c). The orientation of the σ H of adjacent wells Dinan 8 and Dinan 081 are different in plane and section (Figure 5c). The orientation of σ H at Dinan 8 and Dinan 081 is selected as the orientation of σ H on the fault plane F3 and F4 in (Figure 5c and Table 1), respectively.
The angle between the maximum horizontal stress and fault F3 strike is 78 degrees (αF3), and the angle between the maximum horizontal stress and fault F4 strike is 70 degrees (αF4). The change in α angle at F3 has no correlation with depth, the difference between the maximum and minimum value of α angle is 12 degrees, and α angle is less than αF3 (Table 1 and Figure 6a). The decrease in α angle relative to αF3 results in the decrease of K (Figure 6c), and Pd (f − r) decreased correspondingly (Figure 6e). There was no correlation between the change in α at F4 and the depth. The difference between the maximum value and the minimum value of α was 14 degrees, and α was greater than αF4 (Table 1 and Figure 6b). The increase of α relative to αF4 results in the increase of K (Figure 6d) and Pd(f − r) correspondingly (Figure 6f).
The Pd(f − r) calculated using αF3 is larger than the value using α, but the magnitude of the increase varies from layer to layer (Figure 6e). The Pd(f − r) calculated using αF4 is lower than the value using α, and the decrease in each layer is not the same (Figure 7f). α was positively correlated with K and Pd(f − r) (Figure 7). The accuracy of α angle calculation is positively related to the error.

4.2. Stress Regime

The reservoir system and fault system of the fault section are shown in (Figure 5c). The stress values σ V , σ H and σ h of the reservoir are normalized, and ternary diagrams are drawn to reveal the relationship between the σ V , σ H and σ h . The magnitude of σ h , σ H and σ V increases as the burial depth increases.
The dispersion of data points indicates that the ratios of ( σ H / σ V ) and ( σ h / σ V ) are different at different depths. The stress regime of the fault plane corresponding to each reservoir is shown in (Figure 7a,b). The stress regime of the fault plane shows that the upper part (i, ii, iii, iv, v, I, II, III, IV, V) of fault plane F3 and F4 is reverse fault regime, and the lower part (vi, vii, VI, VII) is the strike-slip fault regime. In these ternary diagrams, there is little difference in the distribution of stress regime points of reservoirs under the same stress regime, which indicates that the overall difference of stress regime of each reservoir under the regime stress mode is not too large.

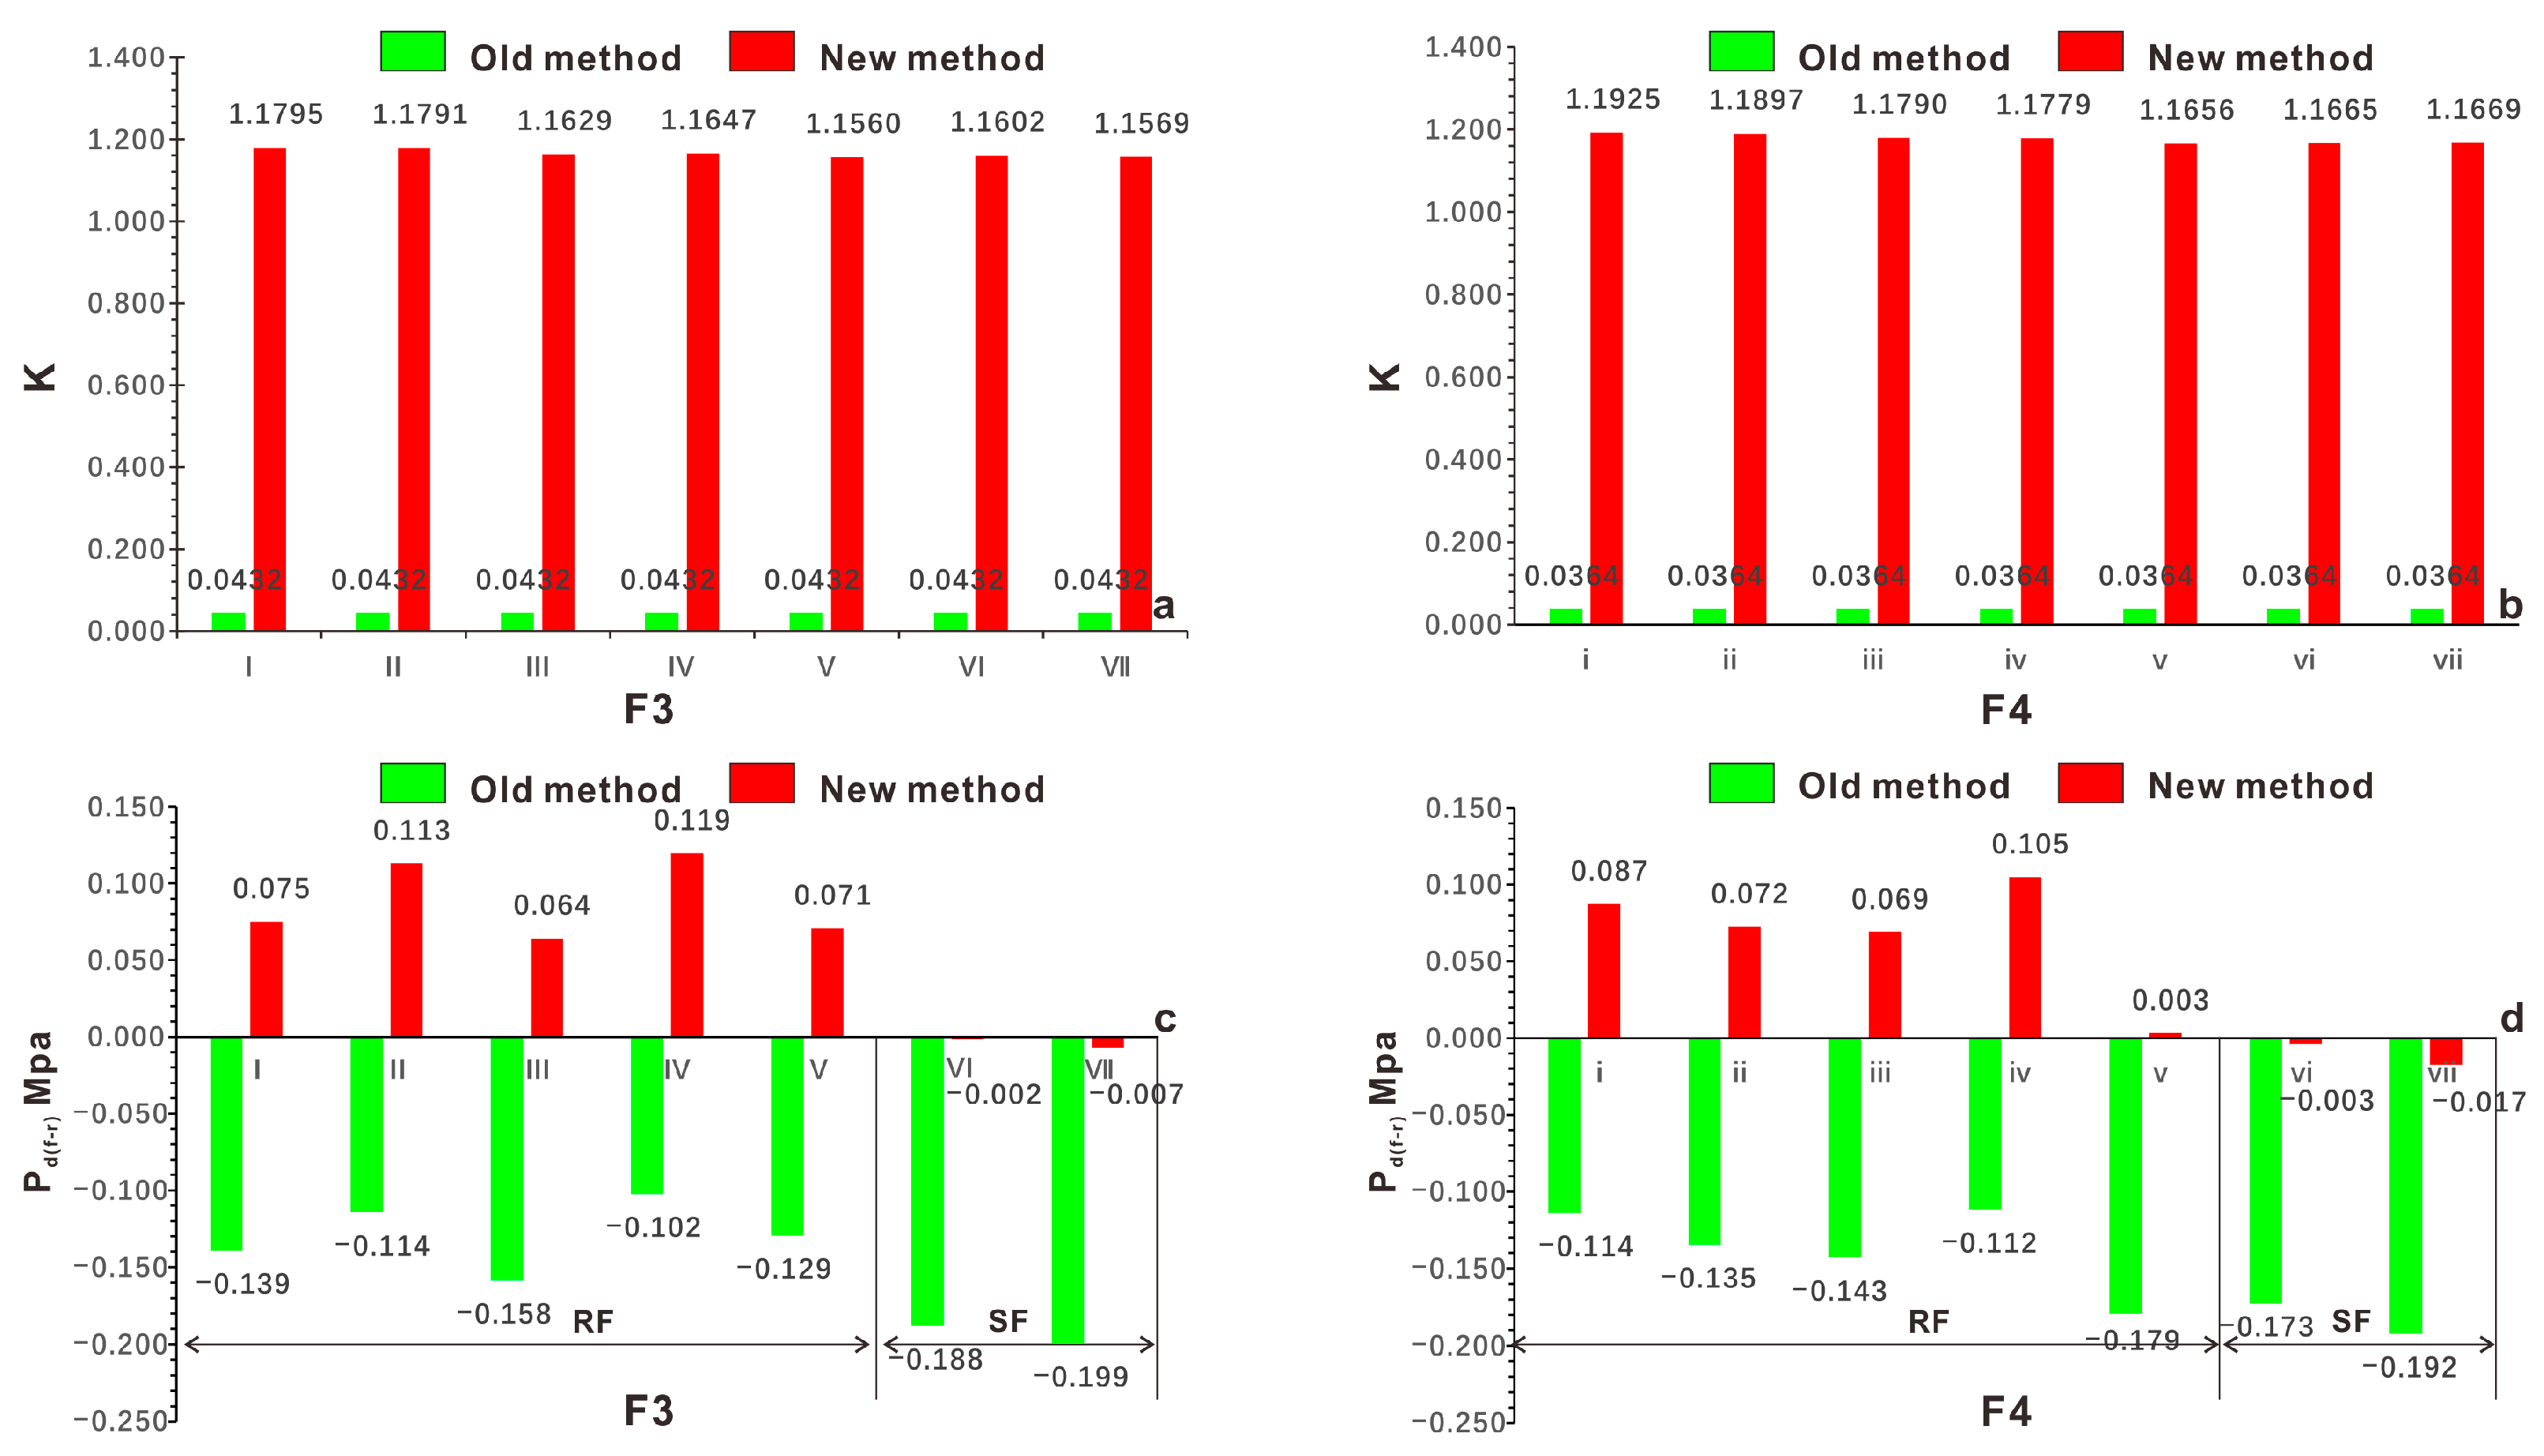
4.3. The Variation of K

If the horizontal stress is not taken into account, and the rock compaction is completely provided by the gravity of the overlying strata; according to (Equation (2)), it can be concluded that the K is equal to ( c o s θ )2. Therefore, K is 0.0432 near fault F3 and 0.0364 near fault F4 (Table 1); the corresponding Pd(f − r) is shown in (Figure 8c,d). The value of K calculated by combining the normal stress components of superimposed horizontal stress and vertical stress is shown in Table 1 and Figure 8,b. It can be seen that the range of K value increase near F3 fault is 1.1128–1.1363, and the range of K value increase near F4 fault is 1.1292–1.1561.
The (I–VII) reservoir near the F3 fault corresponds to an increase in Pd(f − r) in the range of 0.186–0.227 Mpa (Figure 8c); the (i–vii) reservoir near the F4 fault corresponds to an increase in Pd(f − r) in the range of 0.170–0.212 Mpa (Figure 8d).
The results show that the increases in K value and Pd(f − r) affected by faults F3 and F4 are different; the increase in K value of the reverse fault stress regime is greater than that of the strike-slip fault (Figure 8a,b); the increase in Pd(f − r) value within the depth range of reverse fault stress regime is greater than that of Pd(f − r) within the depth range of strike-slip fault stress regime (Figure 8c,d).
There is a positive correlation between K and Pd(f − r). Considering the compaction effect of horizontal stress on fault rock, the sealing ability of (F3, F4) fault is obviously increased compared with that without considering horizontal compression. However, the increasing degree of Pd(f − r) between fault rock and reservoir is different in different depths (Figure 8c,d).

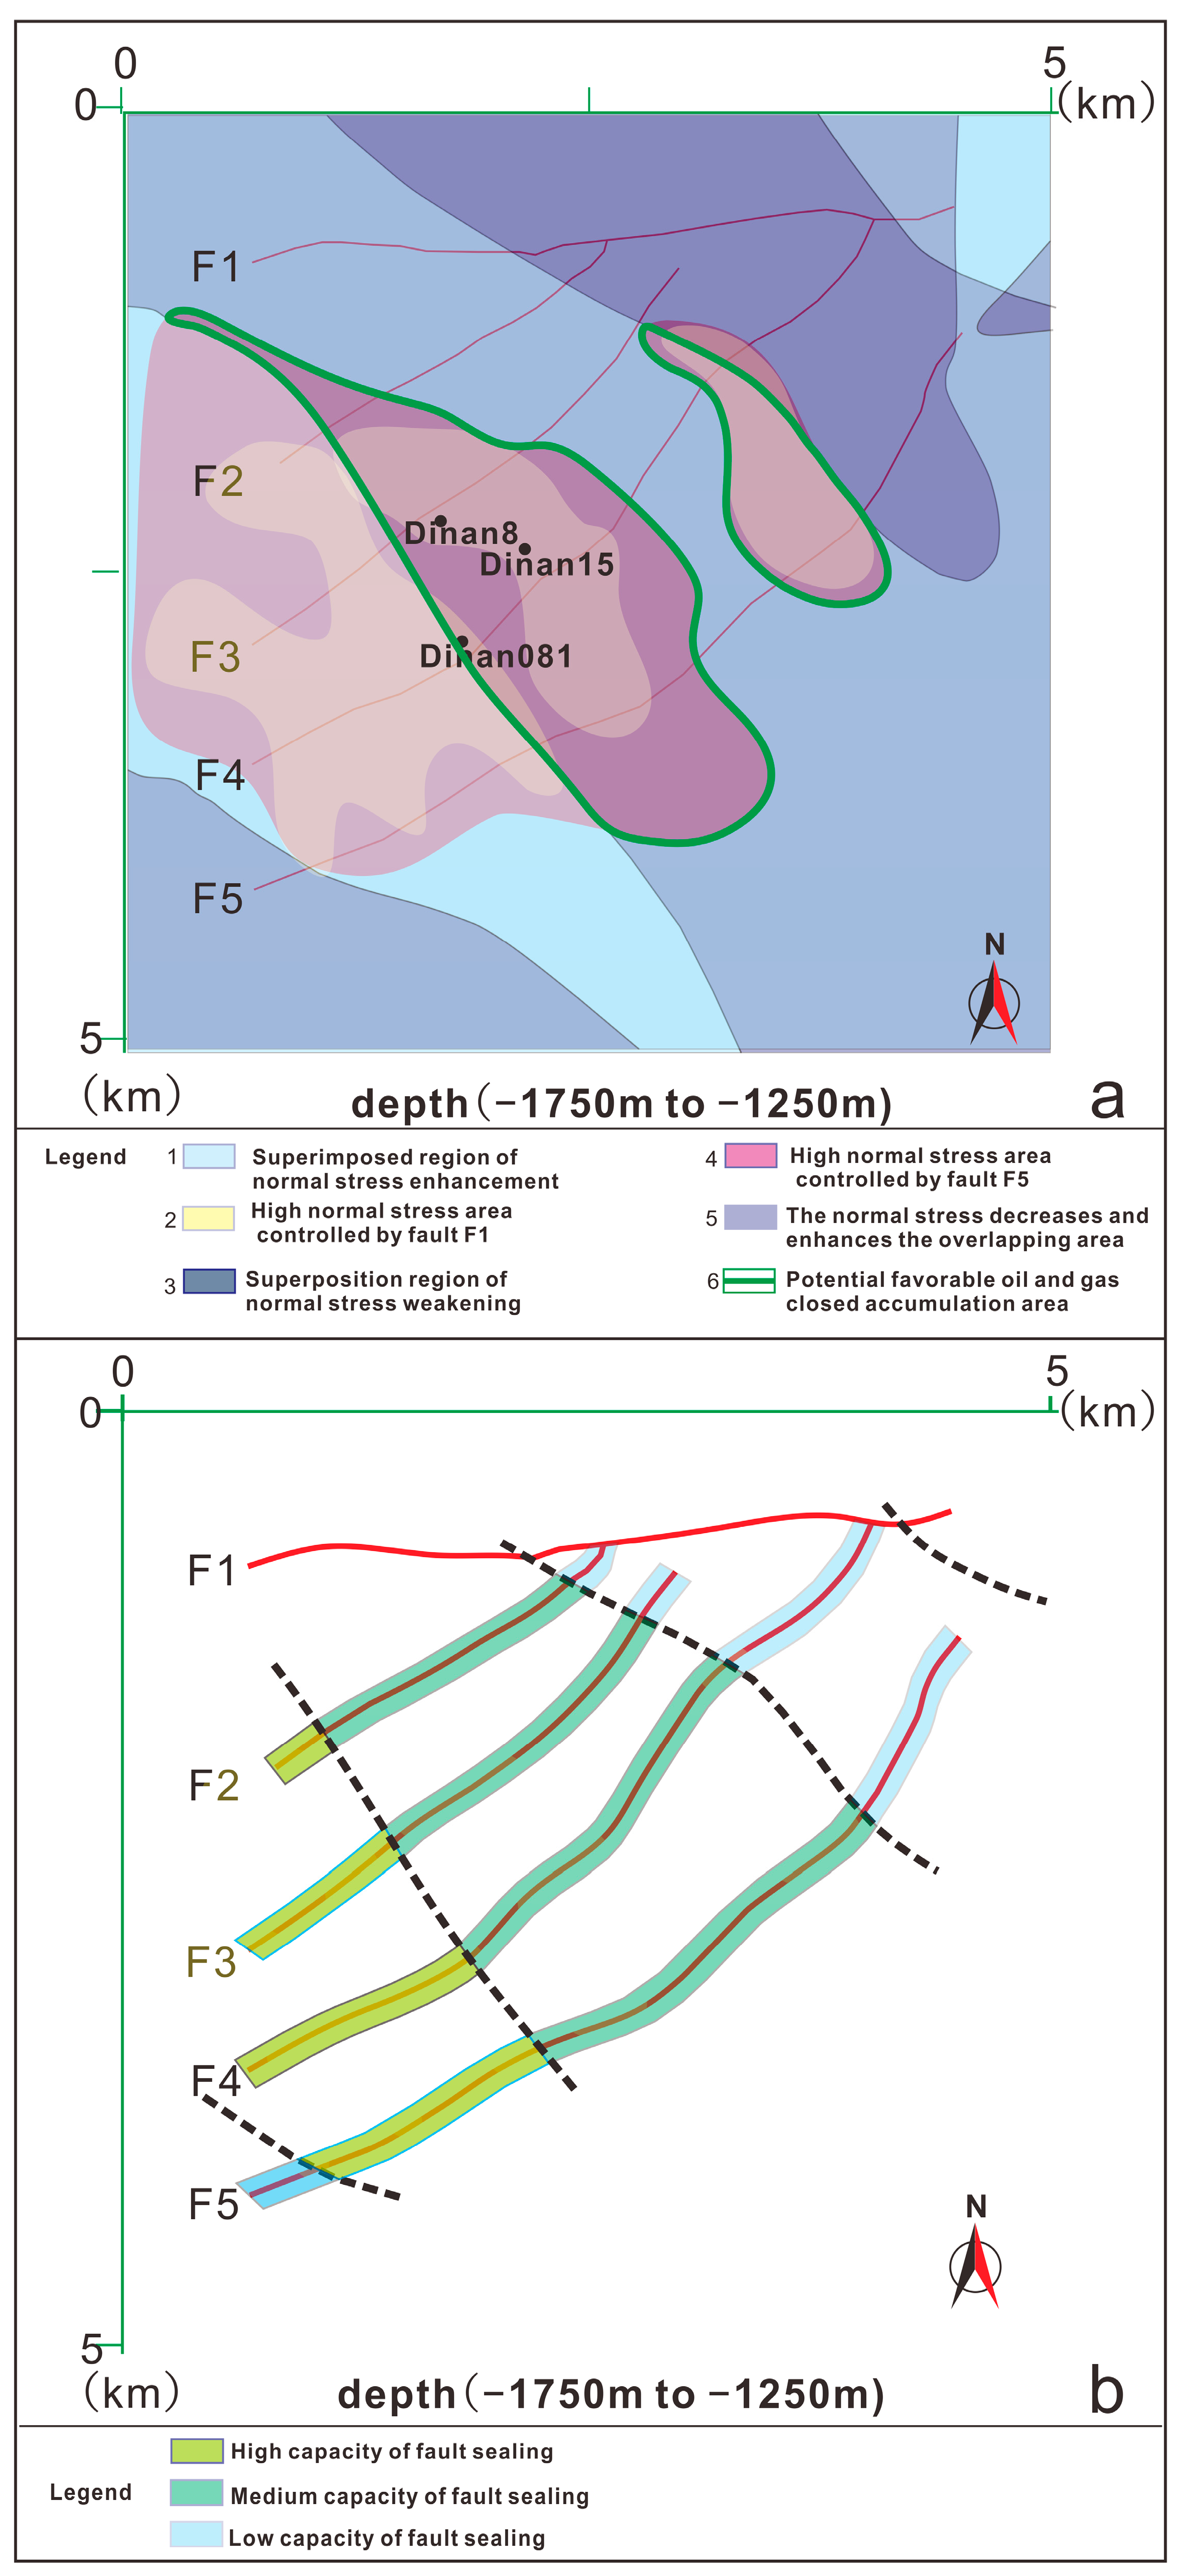
4.4. Fault Sealing Capacity

As described in Section 3, the displacement pressure difference between fault rocks and reservoir rocks can be calculated using Equation (6). In this research, a fault is not sealed when Pd(f − r) < 0, whereas a fault is sealed when Pd(f − r) > 0; the higher the Pd(f − r), the better the sealing capacity.
It can be seen from Table 2 that the displacement pressures of reservoir rock in different layers of well Dinan8 are 0.646–0.704 MPa, and the displacement pressures of fault rock calculated by the above method are 0.682–0.706 MPa; the displacement pressures of reservoir rock in different layers of well Dinan081 are 0.630–0.699 MPa, and the displacement pressures of fault rock calculated by the above method are 0.669–0.687 MPa. By comparing the displacement pressures of fault rock and reservoir rock, we found that the displacement pressures of fault rocks in VI,VII, vi, v, vii are all less than that of reservoir rock, so the fault cannot seal hydrocarbons in these formations. Well testing results have proved that these reservoir beds are dry layers or water layers, while the displacement pressures of fault rocks in i, ii, iii, iv, vii, I, II, III, IV, V are all greater than that of reservoir rock; thus the fault can seal hydrocarbons in these reservoir beds. However, the displacement pressure difference between fault rock and reservoir rock is different in different layers, which reflects different sealing capacity. Well testing results have proved that these reservoir beds are all gas layers or oil layers.
It can be seen from Figure 8c,d that the displacement pressure difference between fault rock and reservoir of F3 fault calculated by this method and previous methods ranges from 0.186 to 0.227 MPa, and that of F4 fault ranges from 0.17 to 0.212 MPa. Because this method considers the influence of horizontal stress comprehensively, the sealing ability of fault calculated by this method is greater than that calculated by previous methods, which indicates that if the influence of horizontal stress on the sealing ability of fault is ignored, the evaluation result will be lower than the actual value. If the old method is adopted, the Pd(f − r) of I–VII and i–vii reservoirs are less than zero, which indicates that the oil and gas of I–VII and i-vii reservoirs cannot be sealed, which is seriously inconsistent with the actual situation (Figure 8c,d). In this case, the evaluation result of the new method is consistent with the actual oil and water distribution, which can prove that this method is scientific and feasible.

5. Discussion

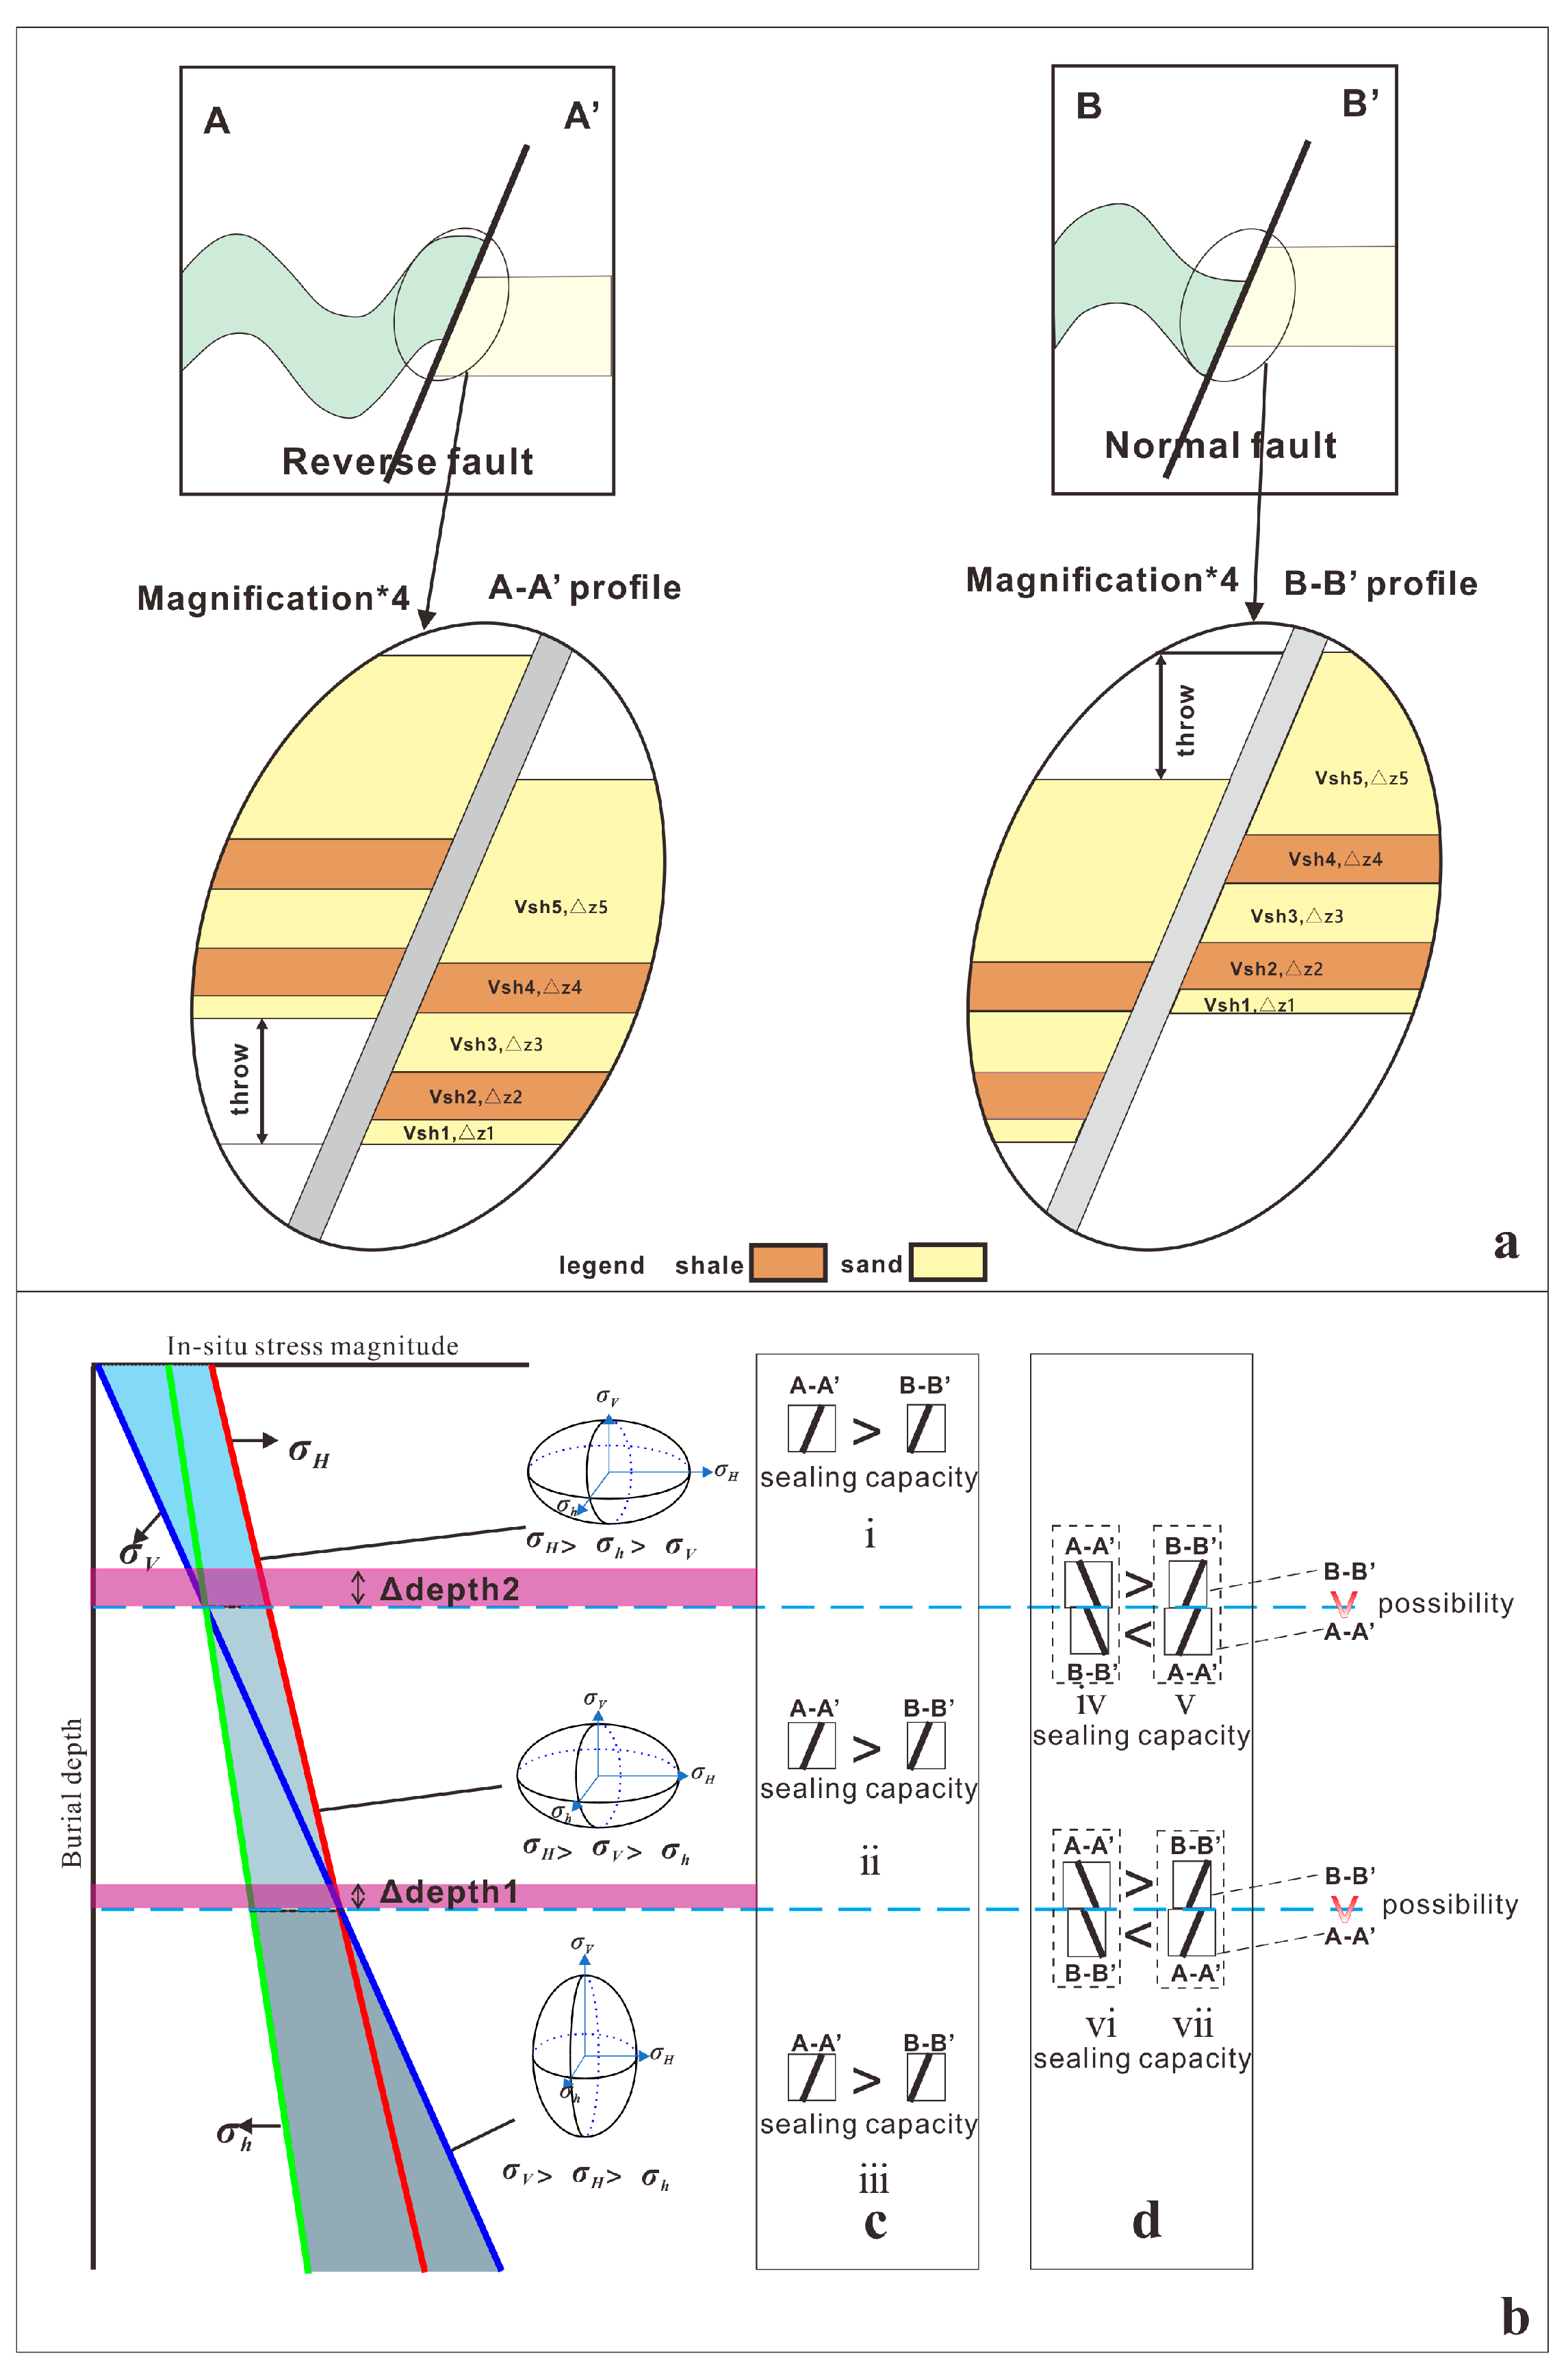
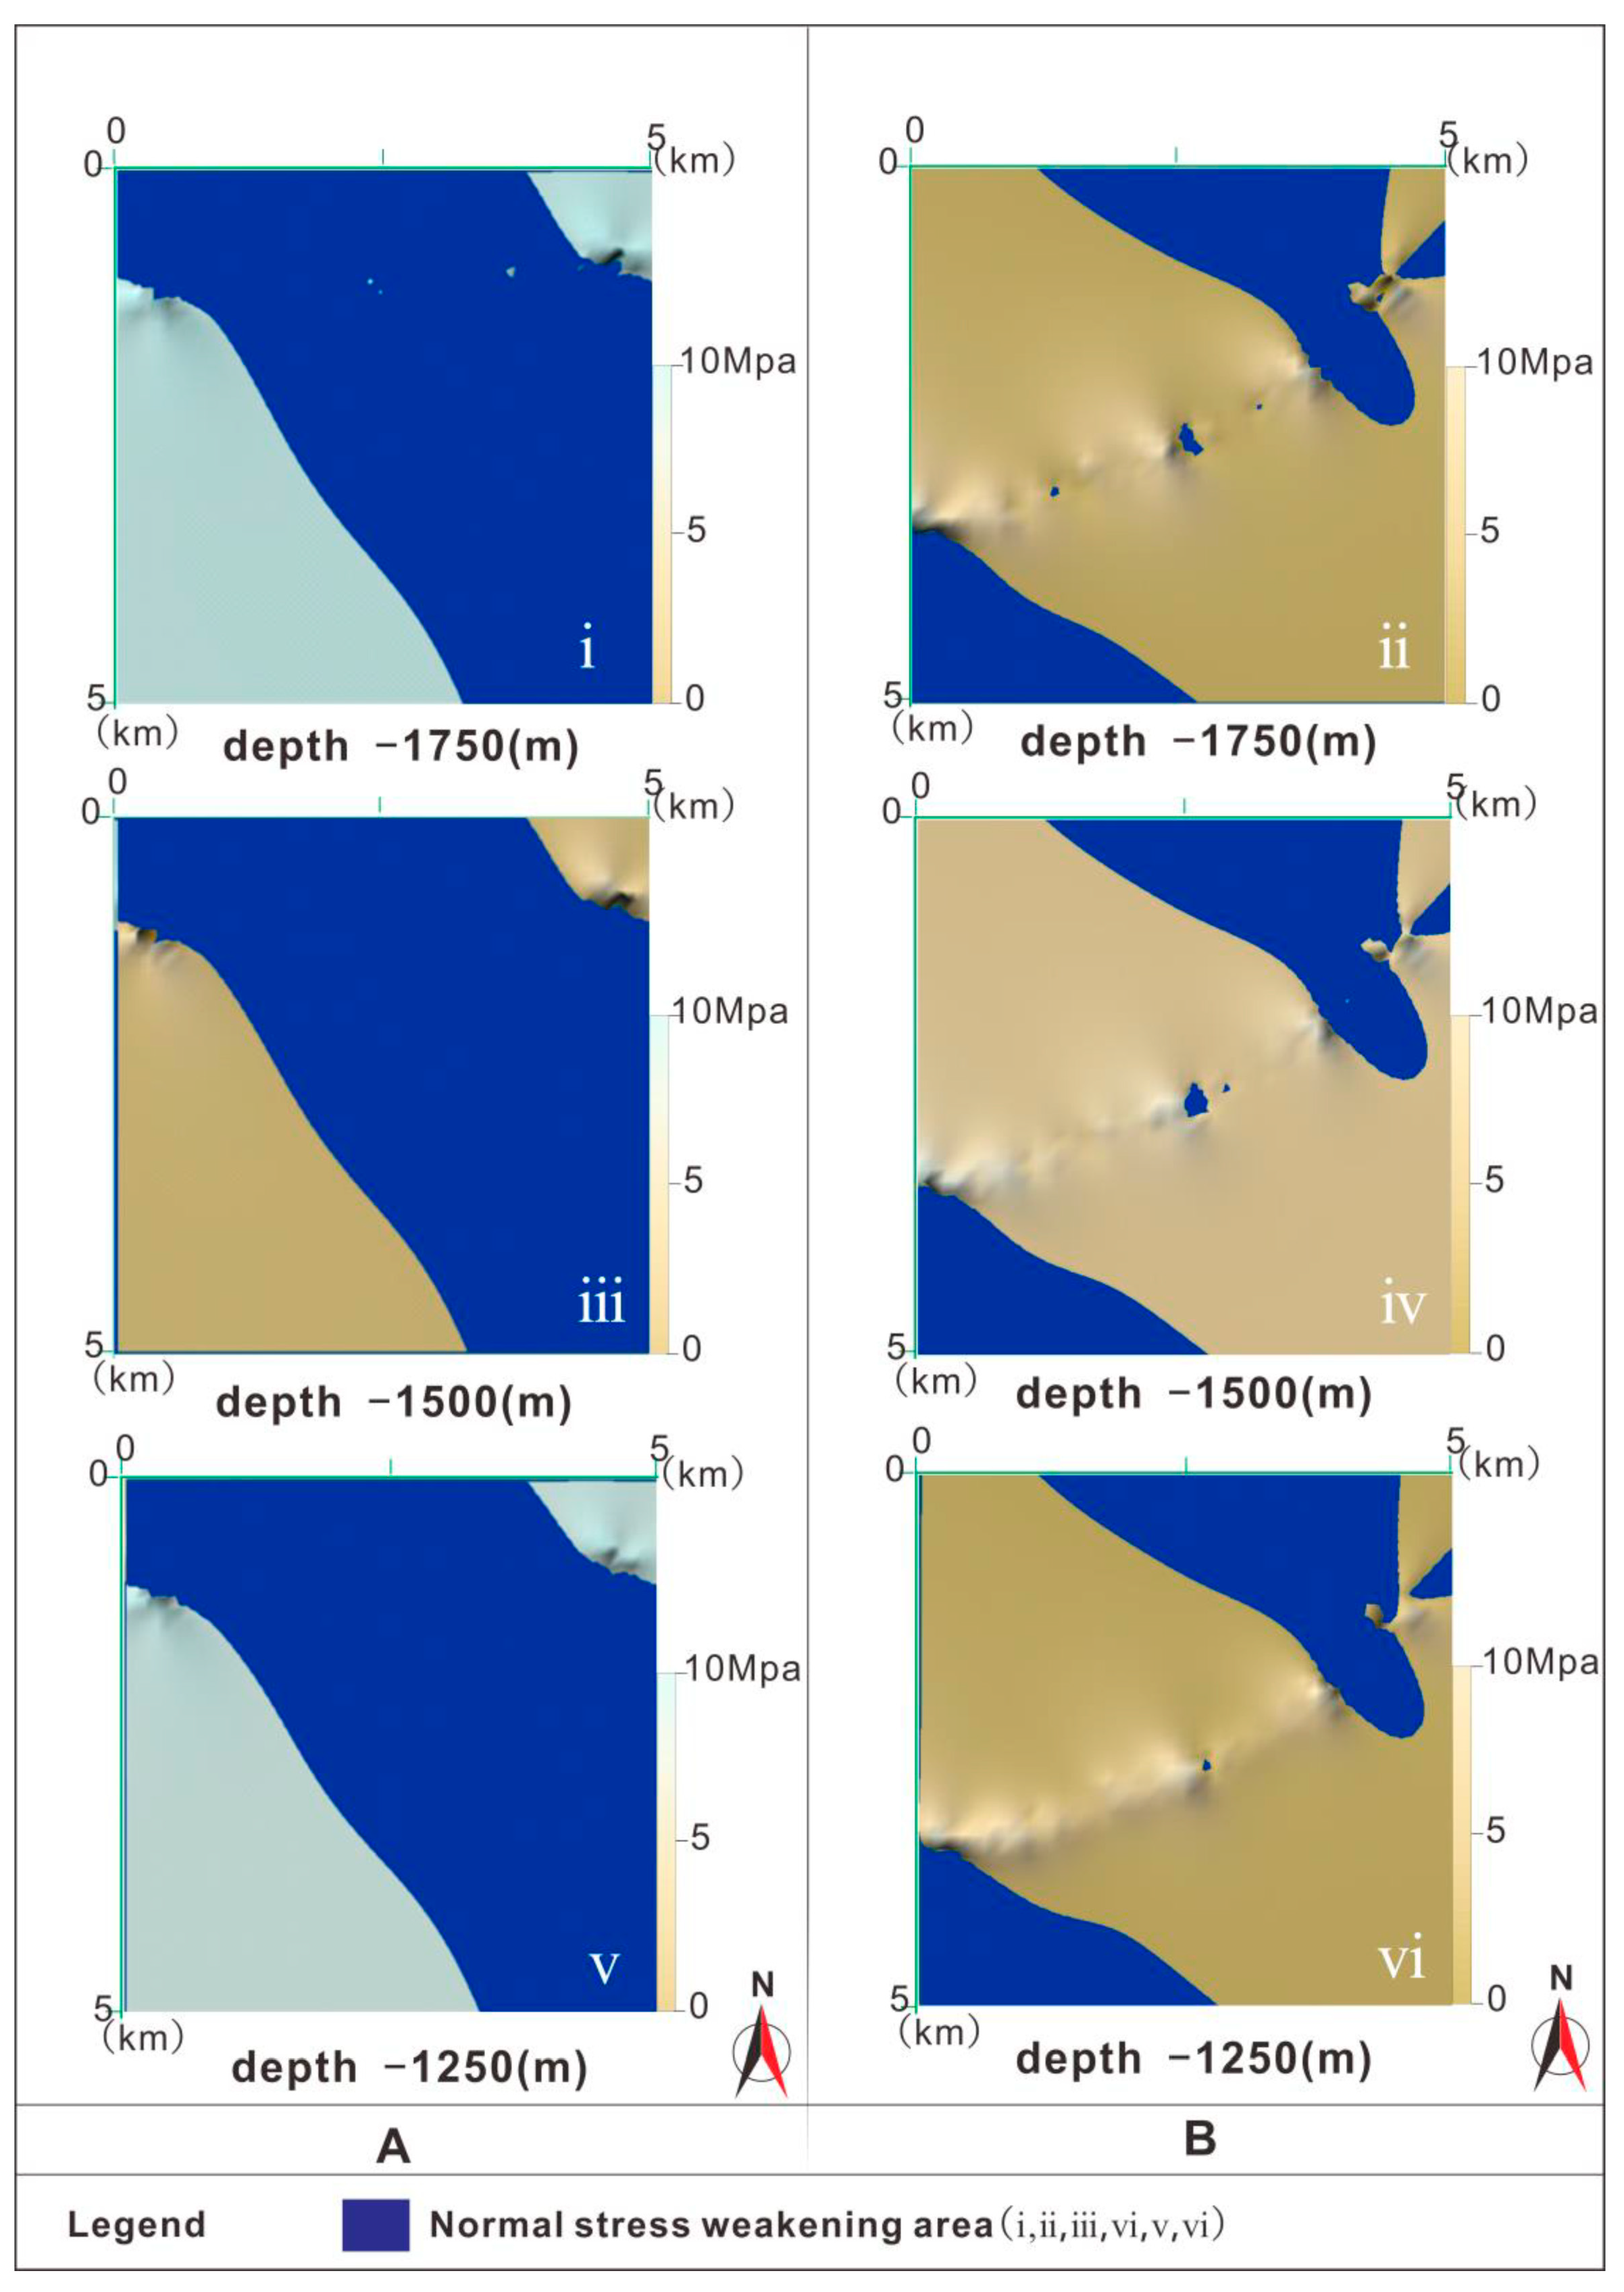
5.1. Influence of Different Stress Regime

The σ h , σ V and σ H varies with the depth of the fault plane [68,69], and the σ h , σ V and σ H stress curves near the fault plane will change correspondingly with the change of geometry and kinematics characteristics of faults [53,70]. The ratios of σ H / σ V and σ h / σ V will change according to the change of stress regime. According to (Equation (3)), it is obvious that with the change in depth, the stress regime determines the magnitude of normal stress σ T on the fault plane.
It is assumed that the plane is smooth and that the dip and the dip angle are constant (Figure 9a,b); the reverse fault stress regime (RF), ( σ H / σ V ) > 1, ( σ h / σ V ) > 1; the stress regime of the strike-slip fault (SF), ( σ H / σ V ) > 1, ( σ h / σ V ) < 1; normal fault stress regime (NF), ( σ H / σ V ) < 1, ( σ h / σ V ) < 1. The calculations show that K RF   > K SF >   K NF   ( Equation   ( 2 ) ) .
Therefore, although the sealing capacity of AA′ is better than that of BB′ under the same stress regime (Figure 9b,c), the sealing capacity of AA′ and BB′ are different under different stress regimes. When the depth is fixed, the value of K determines the magnitude of normal stress σ T (Equation (3)). The difference i sealing capacity can be shown by the following equations:
P d ( RF ) = f ( K RF × cos θ × Z h , V fr ) f ( Z r , V r )
P d ( SF ) = f ( K SF × cos θ × Z h , V fr ) f ( Z r , V r )
P d ( NF ) = f ( K NF × cos θ × Z h , V fr ) f ( Z r , V r )
From the results presented, it is clear that the stress regime has a large impact on the fault sealing capacity. Due to the change in stress regime, the sealing capacity of the BB’ plane may be greater than that of the AA′, which is deeper than it (Figure 9b,d).
According to the equations in this paper, for different values of ( σ H / σ V ) and ( σ h / σ V ) and the same remaining parameters, the sealing capacity of the shallow faults will be greater than that of the deep ones due to the variation of the stress regimes, within the range of variation of the depths of ∆depth1 and ∆depth2. The ranges of ∆depth1 and ∆depth2 are shown in Figure 9b, and their expressions are as follows:
depth 1   =   ( K SF K NF ) × Z f × cos θ
depth 2   =   ( K RF K SF ) × Z f × cos θ
It can be inferred that the values of ∆depth1 and ∆depth2 are positively correlated with the value of ( K SF K NF ). Therefore, we can also draw the conclusion that under the condition of different stress mechanisms and shale content, the sealing property of shallow fault may be better than that of deep fault; the sealing property of strike slip fault has no positive correlation with depth. The stress regime at the depth of fault plane plays an important role in fault sealing.

5.2. Influence of the Orientation of the σ H

The orientations of the σ H are different near the fault plane [71], the maximum variation range of the direction can reach 90 degrees [55,58,72] and the angle α between the orientation of the σ H and the fault strike vary greatly in different sections. This will result in large differences in the normal stresses on the fault plane of the strike-slip fault [73,74], changing the values of K and affecting the fault sealing.
In Equation (2), the interval of variation of α is 0–90. The range of K value affected by this variation is [ cos 2 θ + sin 2 θ × σ h σ V ,   cos 2 θ + sin 2 θ × σ H σ V ] . Assuming that the angle of α is fixed, the greater the θ , the greater the effect on sealing capacity. Because the θ of the strike-slip fault is usually big, the change in sealing capacity caused by the change in angle is much greater than that of fault with small dip angle. Assuming that the fault dip angle θ is constant and the ( σ H / σ V ), ( σ h / σ V ) is fixed, α angle is an important factor to determine the sealing ability of fault and the sealing ability of fault is positively correlated with α angle.
Accurate calculation of the α angle is helpful to improve the accuracy of fault sealing evaluation. It is more accurate to use the angle between the orientation of the σ H near the fault plane and the strike of the fault, compared with the angle between the orientation of the σ H in the region and the strike of the fault. However, due to the limitation of the number of imaging logging data near the fault, the calculation of the σ h direction near the fault is restricted. Because the accuracy of α angle calculation is positively related to the error of fault sealing evaluation results, using abundant imaging logging data or using software to calculate α angle can improve the accuracy of evaluation results.

5.3. Influence of Different Fault Activity Periods

Many oil and gas reservoirs are not controlled by single faults but by two or more faults [49,75]; the evolution of a strike-slip fault system is the overall response of a series of fault activities under the same stress field environment. The change in the fault characteristics affects the change in the normal stress on the other fault planes in the region, and the change in normal stress on the fault planes caused by different faults is different [76]. Comprehensive analysis of the change in normal stress on the fault plane and its causes is of great significance to the study of oil and gas migration.
In this study, the influence of fault activity periodicity on normal stress of fault plane was simulated by 3D move software, and then the influence on fault sealing was indirectly analyzed. When the activity of the F1 fault in the Indochinese phase was enhanced, the normal stress in the blue region of (Figure 10 i, iii, v) decreased, and the normal stress in other areas increased. When the activity of the F5 fault in Yanshanian period increased, the normal stress of fault in the blue region in (Figure 10 ii, iv, vi) decreased; in other areas, the normal stress increases.
The sealing capacity of the fault in the normal stress weakening area is weakened, and the sealing capacity of the fault in the normal stress strengthening area is enhanced.
The simulation results show that the activity of faults F1 and F5 and the periods of their activities cause a great difference in the change of normal stress in the region; in Figure 11a, the normal stress in the No. 3 color area is weak and continues to weaken, and the production of the explored oil wells in the area is very low. The normal stress of the fault plane in No.1 color is always strong, where the superimposed areas of No. 2 and No. 4 color regions are also located in this area; the production of oil wells explored in the area is also very low.
Although the success of individual prospects is a function of numerous factors, such as reservoir quality, charge and structure, it is interesting to note that all major fields are located in the No. 5 color area, and the oil well production in the No. 6 green line area is the highest in the study area. The No. 6 green line area is the overlapping area of No. 4 and No. 5 colors, in which the fault transportability is good in the early stage, the fault normal stress is the strongest in the late stage and the sealing is the best, which is most favorable for the preservation of oil and gas reservoirs.
Through the simulation results, we can deduce the conclusion that the intensity and sequence of boundary fault activity control the change in regional normal stress and affect the change of fault sealing capacity; the change law of normal stress on the fault plane in the region caused by it is different, which has an important impact on the migration and accumulation of oil and gas.
According to the variation and superposition of normal stress in the study area simulated by the model, the sealing capacity of faults F2, F3, F4 and F5 can be divided based on the variation in normal stress on the fault plane. The fault sealing in the study area can be divided into three types: high capacity of fault sealing (the normal stress of fault plane is continuously strong), media capacity of fault sealing (the normal stress of fault plane change from weak to strong) and low capacity of fault sealing (the normal stress of fault plane is continuously weak) (Figure 11b).
Therefore, the systematic analysis of fault sealing is helpful to understand the migration and accumulation of oil and gas. It is of great significance for oil and gas exploration and analysis to determine favorable places for prospecting.

5.4. Influence of Uncertain Factors

This method improves the accuracy of the sealing capacity evaluation of slip fault, but there are still many shortcomings. The fault surface is assumed to be smooth, dip and unchanged in tendency, which helps to simplify the calculation but deviates from the actual situation [77]. In this study, the displacement pressure difference between fault rock and reservoir is calculated indirectly by fitting the displacement pressure relationship. However, the accuracy of the fitting equation is limited by the quality and quantity of samples. The uniformity of the distribution of the mass and quantity of samples in different depth ranges will also have a certain impact on the fitting equation. During fault evolution, the relationship between the magnitude of lateral tectonic stresses and the strength of the lateral compaction effect on the faulted rocks is not completely proportional, and a proportionally equivalent treatment method will inevitably lead to errors. Since fault rocks are not conventional sedimentary rocks, the clay content in fault rocks must not be evenly distributed. The current clay content calculation method cannot accurately calculate the clay content of fault rock. Exploring a more practical algorithm and equation, calculating the clay content of fault rock more accurately, increasing the quantity and quality of fitting rock samples and describing the displacement pressure difference between fault rock and reservoir more directly and quantitatively can further improve the accuracy of fault sealing evaluation.

6. Conclusions

The stress analysis of logging data was applied to the sealing evaluation of a strike slip fault, which has good applicability and practicability. The research results show that the stress regime corresponding to different depths of fault planes has an important influence on fault sealing. Under the condition of similar buried depth and clay content of fault rock, the fault in reverse fault stress regime has the best sealing performance, followed by strike-slip fault stress regime, and the lowest sealing performance under normal fault stress regime. Comprehensive use of logging stress analysis to evaluate the sealing property of the strike-slip fault can improve the accuracy of fault sealing evaluation and is applied to the evaluation of fault sealing of normal fault and reverse fault.
The normal stress of a fault plane is an important factor to determine the sealing capacity of the fault. In order to accurately calculate the normal stress on the fault plane, it is necessary to comprehensively calculate the normal stress components of the vertical stress and horizontal stress on the fault plane, which is of great significance to the evaluation of fault sealing ability. Neglecting the compaction effect of horizontal stress on fault rock mass will lead to the low evaluation value of fault-sealing performance. The larger the fault dip angle is, the larger the deviation is. For strike-slip faults with large dip angles, this error is not acceptable.
The orientation of the maximum horizontal stress near the fault plane is also a factor affecting the sealing capacity of the fault. Because the orientation of the horizontal stress near the fault is anisotropic, it is not easy to determine its orientation in the case of fewer data. As a result, it is not easy to determine the degree of its influence on fault sealing. Therefore, it brings potential errors for accurate evaluation of fault sealing, and the errors of different positions are not easy to determine.

Author Contributions

Conceptualization, J.J. and K.W.; methodology, J.J. and Y.P.; software, J.J. and Y.P.; validation, W.G.; formal analysis, Y.L.; investigation, T.L.; writing—original draft preparation, J.J. and Y.P.; writing—review and editing, J.J. and K.W. All authors have read and agreed to the published version of the manuscript.

Funding

This research was supported by the “Strategic Priority Research Program of the Chinese Academy of Sciences” (NO: XDA14010301) and “the National Natural Science Foundation of China” (NO: 41872143). The APC was funded by the “Strategic Priority Research Program of the Chinese Academy of Sciences” (NO: XDA14010301).

Acknowledgments

The authors want to thank the Xinjiang Oilfield Company (PetroChina) for providing the original data.

Conflicts of Interest

The authors declare no conflict of interest. The funders had no role in the design of the study; in the collection, analyses, or interpretation of data; in the writing of the manuscript, or in the decision to publish the results.

References

  1. Harding, T.P.; Tuminas, A.C. Structural interpretation of hydrocarbon traps sealed by basement normal block faults at stable flank of foredeep basins and at rift basins. AAPG Bull. 1989, 73, 812–840. [Google Scholar] [CrossRef]
  2. Berg, R.R.; Avery, A.H. Sealing properties of tertiary growth faults, Texas Gulf Coast. AAPG Bull. 1995, 79, 375–392. [Google Scholar] [CrossRef]
  3. Knipe, R.J. Juxtaposition and seal diagrams to help analyze fault seals in hydrocarbon reservoirs. AAPG Bull. 1997, 81, 187–195. [Google Scholar] [CrossRef]
  4. Huang, L.; Liu, C.-Y. Evolutionary characteristics of the sags to the east of Tan–Lu Fault Zone, Bohai Bay Basin (China): Implications for hydrocarbon exploration and regional tectonic evolution. J. Asian Earth Sci. 2014, 79, 275–287. [Google Scholar] [CrossRef]
  5. Pei, Y.W.; Paton, D.A.; Knipe, R.J.; Wu, K.Y. A review of fault sealing behaviour and its evaluation in siliciclastic rocks. Earth-Sci. Rev. 2015, 150, 121–138. [Google Scholar] [CrossRef]
  6. Xie, L.; Pei, Y.; Li, A.; Wu, K. Implications of meso- to micro-scale deformation for fault sealing capacity: Insights from the Lenghu5 fold-and-thrust belt, Qaidam Basin, NE Tibetan Plateau. J. Asian Earth Sci. 2018, 158, 336–351. [Google Scholar] [CrossRef]
  7. Allan, U.S. Model for hydrocarbon migration and entrapment within faulted structures. AAPG Bull. 1989, 73, 803–811. [Google Scholar] [CrossRef]
  8. Gibson, R.G. Fault-zone seals in siliciclastic strata of the Columbus Basin, offshore Trinidad. AAPG Bull. 1994, 78, 1372–1385. [Google Scholar] [CrossRef]
  9. Yielding, B.F.G. Quantitative fault seal prediction. AAPG Bull. 1997, 81, 897–917. [Google Scholar] [CrossRef]
  10. Chatterjee, R. Effect of normal faulting on in-situ stress: A case study from Mandapeta Field, Krishna-Godavari basin, India. Earth Planet. Sci. Lett. 2008, 269, 458–467. [Google Scholar] [CrossRef]
  11. Yielding, G. Using probabilistic shale smear modelling to relate SGR predictions of column height to fault-zone heterogeneity. Pet. Geosci. 2012, 18, 33–42. [Google Scholar] [CrossRef]
  12. Nicol, A.; Childs, C. Cataclasis and silt smear on normal faults in weakly lithified turbidites. J. Struct. Geol. 2018, 117, 44–57. [Google Scholar] [CrossRef]
  13. Perkins, H. Fault-closure type fields, Southeast Louisiana. Gulf Coast Assoc. Geol. Soc. Trans 1961, 11, 177–196. [Google Scholar]
  14. Smith, D.A. Theoretical considerations of sealing and non-sealing faults. AAPG Bull. 1966, 50, 363–374. [Google Scholar] [CrossRef]
  15. Weber, K.J.; Mandl, G.J.; Pilaar, W.F.; Lehner, B.V.F.; Precious, R.G. The role of faults in hydrocarbon migration and trapping in Nigerian growth fault structures. In Proceedings of the Offshore Technology Conference, Houston, TX, USA, 3–8 January 1978; pp. 2643–2653. [Google Scholar]
  16. Smith, D.A. Sealing and nonsealing faults in Louisiana Gulf Coast salt basin. AAPG Bull. 1980, 64, 145–172. [Google Scholar] [CrossRef]
  17. Bouvier, J.D.; Sijpesteijn, C.H.; Kluesner, D.F. Three-dimensional seismic interpretation and fault sealing investigations, Nun River Field, Nigeria. AAPG Bull. 1989, 739, 1397–1414. [Google Scholar]
  18. Fulljames, J.; Zijerveld, L.; Franssen, R. Fault seal processes: Systematic analysis of fault seals over geological and production time scales. Nor. Petrol. Soc. Spec. Publ. 1997, 7, 51–59. [Google Scholar] [CrossRef]
  19. Lindsay, N.G.; Murphy, F.C.; Walsh, J.J.; Watterson, J.; Flint, S.; Bryant, I. Outcrop studies of shale smears on fault surface. Int. Assoc. Sedimentol. Spec. Publ. 1993, 15, 113–123. [Google Scholar]
  20. Yielding, G. Shale gouge ratio-calibration by geohistory. Nor. Petrol. Soc. Spec. Publ. 2002, 11, 1–15. [Google Scholar] [CrossRef]
  21. Çiftçi, N.B.; Giger, S.B.; Clennell, M.B. Three-dimensional structure of experimentally produced clay smears: Implications for fault seal analysis. AAPG Bull. 2013, 97, 733–757. [Google Scholar] [CrossRef]
  22. Knipe, R.J.; Jones, G.; Fisher, Q.J. Faulting, fault sealing and fluid flow in hydrocarbon reservoirs: An introduction. Geol. Soc. Lond. Spéc. Publ. 1998, 147. [Google Scholar] [CrossRef]
  23. Lyu, Y.F.; Huang, J.S.; Fu, G. Quantitative study on fault sealing ability in sandstone and mudstone thin interbed. Acta Petrol. Sin. 2009, 30, 824–829. [Google Scholar] [CrossRef]
  24. Fu, G.; Shi, J.J. Study of ancient displacement pressure of fault rock recovery and its sealing characteristics. J. China Univ. Min. Technol. 2013, 42, 996–1001. [Google Scholar] [CrossRef]
  25. Lei, C.; Yuan, X.T. Quantitative characterization of fault lateral sealing capacity based on 3-D SGR model-A case from M field, Niger. Oil Gas Geol. 2019, 40, 1317–1323. [Google Scholar]
  26. Fu, G.; Wang, H.R.; Hu, X.L. Modification and application of fault-reservoir displacement pressure differential method for vertical sealing of faults. Acta Petrol. Sin. 2014, 35, 687–691. [Google Scholar]
  27. Lyu, Y.; Wang, W.; Hu, X.; Fu, G.; Shi, J.; Wang, C.; Liu, Z.; Jiang, W. Quantitative evaluation method of fault lateral sealing. Pet. Explor. Dev. 2016, 43, 340–347. [Google Scholar] [CrossRef]
  28. Şengör, A.M.C.; Natal’In, B.A.; Burtman, V.S. Evolution of the altaid tectonic collage and palaeozoic crustal growth in Eurasia. Nat. Cell Biol. 1993, 364, 299–307. [Google Scholar] [CrossRef]
  29. Windley, B.F.; Alexeiev, D.; Xiao, W.; Kröner, A.; Badarch, G. Tectonic models for accretion of the Central Asian orogenic belt. J. Geol. Soc. 2007, 164, 31–47. [Google Scholar] [CrossRef] [Green Version]
  30. Chen, S.; Guo, Z.; Pe-Piper, G.; Zhu, B. Late Paleozoic peperites in West Junggar, China, and how they constrain regional tectonic and palaeoenvironmental setting. Gondwana Res. 2013, 23, 666–681. [Google Scholar] [CrossRef]
  31. Xu, X.; Jiang, N.; Li, X.H.; Wu, C.; Qu, X.; Zhou, G.; Dong, L.H. Spatial-temporal framework for the closure of the Junggar Ocean in central Asia: New SIMS zircon U-Pb ages of the ophiolitic mélange and collisional igneous rocks in the Zhifang area, East Junggar. J. Asian Earth Sci. 2015, 111, 470–491. [Google Scholar] [CrossRef]
  32. He, D.F.; Zhang, L.; Wu, S.T. Tectonic evolution stages and features of the Junggar Basin. Oil Gas Geol. 2018, 39, 845–861. [Google Scholar]
  33. Allen, M.B.; Vincent, S.J. Fault reactivation in the Junggar region, northwest China: The role of basement structures during mesozoic-cenozoic compression. J. Geol. Soc. 1997, 154, 151–155. [Google Scholar] [CrossRef]
  34. Carroll, A.R.; Liang, Y.H.; Graham, S.A.; Xiao, X.C.; Hendrix, M.S.; Chu, J.C.; McKnight, C.L. Tectonics of Eastern Asia and Western Pacific continental margin Junggar Basin, Northwest China: Trapped late paleozoic ocean. Tectonophysics 1990, 181, 1–14. [Google Scholar] [CrossRef]
  35. Cao, J.; Jin, Z.; Hu, W.; Zhang, Y.; Yao, S.; Wang, X.; Zhang, Y.; Tang, Y. Improved understanding of petroleum migration history in the Hongche fault zone, Northwestern Junggar Basin (northwest China): Constrained by vein-calcite fluid inclusions and trace elements. Mar. Pet. Geol. 2010, 27, 61–68. [Google Scholar] [CrossRef]
  36. Yang, D.S.; Chen, S.J.; Li, L. Hydrocarbon origins and their pooling characteristics of the Kelameili gas field. Nat. Gas Ind. 2012, 32, 27–31. [Google Scholar] [CrossRef]
  37. Xiao, W.; Windley, B.F.; Han, C.; Liu, W.; Wan, B.; Zhang, J.; Ao, S.; Zhang, Z.; Song, D. Late Paleozoic to early Triassic multiple roll-back and oroclinal bending of the Mongolia collage in Central Asia. Earth-Sci. Rev. 2018, 186, 94–128. [Google Scholar] [CrossRef]
  38. Yu, Y.; Wang, X.; Rao, G.; Wang, R. Mesozoic reactivated transpressional structures and multi-stage tectonic deformation along the Hong-Che fault zone in the northwestern Junggar Basin, NW China. Tectonophysics 2016, 679, 156–168. [Google Scholar] [CrossRef]
  39. Wang, Q.; Shu, L.; Charvet, J.; Faure, M.; Ma, H.; Natal’In, B.; Gao, J.; Kroner, A.; Xiao, W.; Li, J.; et al. Understanding and study perspectives on tectonic evolution and crustal structure of the Paleozoic Chinese Tianshan. Episodes 2010, 33, 242–266. [Google Scholar] [CrossRef]
  40. Wilhem, C.; Windley, B.F.; Stampfli, G.M. The Altaids of Central Asia: A tectonic and evolutionary innovative review. Earth-Science Rev. 2012, 113, 303–341. [Google Scholar] [CrossRef] [Green Version]
  41. Wu, K.; Paton, D.; Zha, M. Unconformity structures controlling stratigraphic reservoirs in the north-west margin of Junggar basin, North-west China. Front. Earth Sci. 2012, 7, 55–64. [Google Scholar] [CrossRef]
  42. Wu, K.Y.; Zha, M.; Wang, X.L.; Qu, J.X.; Chen, X. Further researches on the tectonic evolution and dynamic setting of the Junggar Basin. Acta Geosci. Sin. 2005, 26, 217–222. [Google Scholar] [CrossRef]
  43. Charvet, J.; Shu, L.; Charvet, L.S. Paleozoic structural and geodynamic evolution of eastern Tianshan, NW China: Welding of the Tarim and Junggar plates. Episodes 2007, 30, 162–186. [Google Scholar]
  44. Ding, W.L.; Jin, Z.J.; Zhang, Y.J.; Zeng, J.H.; Wang, H.Y. Experimental simulation of faults controlling oil migration and accumulation in the central part of Junggar Basin and its significance for petroleum geology. Earth Sci. 2011, 31, 73–82. [Google Scholar] [CrossRef]
  45. Zheng, M.; Tian, A.; Yang, T. Structural evolution and hydrocarbon accumulation in the eastern Junggar Basin. Oil Gas Geol. 2018, 39, 907–916. [Google Scholar] [CrossRef]
  46. Liang, Y.; Zhang, Y.; Chen, S.; Guo, Z.; Tang, W. Controls of a strike-slip fault system on the tectonic inversion of the Mahu depression at the northwestern margin of the Junggar Basin, NW China. J. Asian Earth Sci. 2020, 198, 104229. [Google Scholar] [CrossRef]
  47. Sibson, R.H. Fault rocks and fault mechanisms. J. Geol. Soc. 1977, 133, 191–213. [Google Scholar] [CrossRef]
  48. Childs, C.; Manzocchi, T.; Walsh, J.J.; Bonson, C.G.; Nicol, A.; Schöpfer, M.P. A geometric model of fault zone and fault rock thickness variations. J. Struct. Geol. 2009, 31, 117–127. [Google Scholar] [CrossRef]
  49. Shi, L.; Chu, W.; Deng, S. Catalytic properties of Cu-Co catalysts supported on HNO3-pretreated CNTs for higher-alcohol synthesis. J. Nat. Gas Chem. 2011, 20, 48–52. [Google Scholar] [CrossRef]
  50. Vrolijk, P.J.; Urai, J.L.; Kettermann, M. Clay smear: Review of mechanisms and applications. J. Struct. Geol. 2016, 86, 95–152. [Google Scholar] [CrossRef] [Green Version]
  51. Zhou, X.G. The study of fault closure by use of entry pressure and its application in North Tarim. J. Geomech. 1997, 3, 47–53. [Google Scholar]
  52. Ma, J.H.; Sun, J.M. Calculation of formation stress using logging data. Well Logging Technol. 2002, 26, 347–351. [Google Scholar]
  53. Liu, G.-L. A novel limiting strain energy strength theory. Trans. Nonferrous Met. Soc. China 2009, 19, 1651–1662. [Google Scholar] [CrossRef]
  54. Rajabi, M.; Tingay, M.; King, R.; Heidbach, O. Present-day stress orientation in the Clarence-Moreton Basin of New South Wales, Australia: A new high density dataset reveals local stress rotations. Basin Res. 2016, 29, 622–640. [Google Scholar] [CrossRef]
  55. Ziegler, M.; Rajabi, M.; Heidbach, O.; Hersir, G.P.; Ágústsson, K.; Árnadóttir, S.; Zang, A. The stress pattern of Iceland. Tectonophysics 2016, 674, 101–113. [Google Scholar] [CrossRef]
  56. Vernik, L.; Zoback, M.D. Estimation of maximum horizontal principal stress magnitude from stress-induced well bore breakouts in the Cajon Pass scientific research borehole. J. Geophys. Res. 1993, 30. [Google Scholar] [CrossRef]
  57. Yan, S.; Qiao, W. Discussions about In-situ stress calculation of sand shale formations using cross-dipole acoustic logs. Well Logging Technol. 2003, 27, 122–124. [Google Scholar] [CrossRef]
  58. Rajabi, M.; Tingay, M.; Heidbach, O. The present-day state of tectonic stress in the Darling Basin, Australia: Implications for exploration and production. Mar. Pet. Geol. 2016, 77, 776–790. [Google Scholar] [CrossRef]
  59. Gao, Z.Y.; Cui, J.G.; Feng, J.R. Modification mechanism of physical properties of deeply-buried sandstone reservoir due to the burial compaction and lateral extrusion in Kuqa Depression. Geoscience 2017, 31, 302–314. [Google Scholar]
  60. Xia, L.; Liu, Z.; Li, W.; Yu, C.; Zhang, W. Initial porosity and compaction of consolidated sandstone in Hangjin Qi, North Ordos Basin. J. Pet. Sci. Eng. 2018, 166, 324–336. [Google Scholar] [CrossRef]
  61. Tingay, M.; Hillis, R.; Morley, C.; Swarbrick, R.; Okpere, E. Variation in vertical stress in the Baram Basin, Brunei: Tectonic and geomechanical implications. Mar. Pet. Geol. 2003, 20, 1201–1212. [Google Scholar] [CrossRef] [Green Version]
  62. Xie, G.A. New method to calculate the maximum and minimum horizontal stress using log data. Well Logging Technol. 2005, 29, 82–90. [Google Scholar] [CrossRef]
  63. Bretan, P.; Yielding, G. Using buoyancy pressure profiles to assess uncertainty in fault seal calibration. AAPG Hedberg Ser. Tulsa 2005, 2, 151–162. [Google Scholar]
  64. Yielding, G.; Bretan, P.; Freeman, B. Fault seal calibration: A brief review. Geol. Soc. Lond. Spéc. Publ. 2010, 347, 243–255. [Google Scholar] [CrossRef]
  65. Mount, V.S.; Suppe, J. Present-day stress orientations adjacent to active strike-slip faults: California and Sumatra. J. Geophys. Res. Space Phys. 1992, 97, 11995. [Google Scholar] [CrossRef]
  66. Tingay, M.; Bentham, P.; De Feyter, A.; Kellner, A. Present-day stress-field rotations associated with evaporites in the offshore Nile Delta. GSA Bull. 2010, 123, 1171–1180. [Google Scholar] [CrossRef]
  67. Kingdon, A.; Fellgett, M.W.; Williams, J.D. Use of borehole imaging to improve understanding of the in-situ stress orientation of Central and Northern England and its implications for unconventional hydrocarbon resources. Mar. Pet. Geol. 2016, 73, 1–20. [Google Scholar] [CrossRef] [Green Version]
  68. Martin, C.; Chandler, N. Stress heterogeneity and geological structures. Int. J. Rock Mech. Min. Sci. Géoméch. Abstr. 1993, 30, 993–999. [Google Scholar] [CrossRef]
  69. Tang, X.M.; Cheng, N.Y.; Cheng, C.H. Identifying and estimating formation stress from borehole monopole and cross-dipole acoustic measurements. In Proceedings of the SPWLA 40th Annual Logging Symposium, Oslo, Norway, 30 May–3 June 1999. [Google Scholar]
  70. Gudmundsson, A. Effects of Young’s modulus on fault displacement. C. R. Geosci. 2004, 336, 85–92. [Google Scholar] [CrossRef]
  71. Zoback, M.; Barton, C.; Brudy, M.; Castillo, D.; Finkbeiner, T.; Grollimund, B.; Moos, D.; Peska, P.; Ward, C.; Wiprut, D. Determination of stress orientation and magnitude in deep wells. Int. J. Rock Mech. Min. Sci. 2003, 40, 1049–1076. [Google Scholar] [CrossRef]
  72. Su, S.; Stephansson, O. Effect of a fault on in situ stresses studied by the distinct element method. Int. J. Rock Mech. Min. Sci. 1999, 36, 1051–1056. [Google Scholar] [CrossRef]
  73. Zoback, M.D.; Mount, V.S.; Suppe, J.; Eaton, J.P.; Healy, J.H.; Oppenheimer, D.; Reasenberg, P.; Jones, L.; Raleigh, C.B.; Wong, I.G.; et al. New evidence on the state of stress of the San Andreas fault system. Science 1987, 238, 1105–1111. [Google Scholar] [CrossRef] [PubMed]
  74. Müller, B.; Zoback, M.L.; Fuchs, K.; Mastin, L.; Gregersen, S.; Pavoni, N.; Stephansson, O.; Ljunggren, C. Regional patterns of tectonic stress in Europe. J. Geophys. Res. Space Phys. 1992, 97, 11783–11803. [Google Scholar] [CrossRef]
  75. Wu, K.Y.; Wang, X.L.; Cui, D. Structural characteristics and fluid effects of Nanbaijiantan fault zone. Coal Geol. Explor. 2012, 40, 5–11. [Google Scholar]
  76. Chen, Y.Q.; Zhou, X.G. Sealing factors of faults and their sealing effects. Petrol. Explor. Dev. 2003, 30, 38–40. [Google Scholar] [CrossRef]
  77. Antonellini, A.A.M. Effect of Faulting on Fluid Flow in Porous Sandstones: Geometry and Spatial Distribution. AAPG Bull. 1995, 79, 642–670. [Google Scholar] [CrossRef]
Figure 1. Maps showing the tectonics and geological settings. (a) Inset map of the Junggar Basin (modified from Xu et al., 2015); (b) Satellite image of the Junggar Basin, with study area marked in the black rectangle; (c) Structural subdivision together with fault systems; (d) The north–south seismic section A-A’, showing the distribution of the strata and the major faults.
Energies 14 01468 g001
Figure 2. Present in situ stress state of the fault plane; (a) Normal fault stress regime (NF); (b) Strike-slip fault regime (SS); (c) Reverse fault stress regime (RF).
Energies 14 01468 g002
Figure 3. Schematic diagram of depth conversion of fault zone and stress state regime of cross-section. (oo′ is the normal of the fault plane; θ V , θ H and θ h are the angles between σ V , σ H , σ h and the normal out of the fault plane, respectively). (a) A description of the stress on the fault plane from a space view. (b) A description of the stress on the fault plane from a sectional view.
Energies 14 01468 g003
Figure 4. The diagram showing the relationship between displacement pressure of rock with burial depth and clay content of Dongdaohaizi Sag.
Energies 14 01468 g004
Figure 5. (a) The map shows the orientations of the maximum horizontal stress at different sites in our study area. The angle between the orientations of σ H and the strike of fault F3 is α1; the angle between the orientations of σ H and the strike of fault F4 is α2. The orientation of the regional σ H is located in the lower right corner (provided by Rock Mechanics Research Center, Xinjiang Oilfield Company, PetroChina, Karamay, China). (b) An example of the high-resolution full-bore Formation Micro Image (FMI) from the Borehole Dinan081, showing drilling-induced tensile fractures (ESE–WNW striking) observed at depth of 4042–4047 m and 4158–4162 m (below sea level). (c) S–N section showing the maximum horizontal stress orientation of each individual layer.
Energies 14 01468 g005
Figure 6. The bar chart showing the change in K value and displacement pressure caused by the change in α. (a) Variation in α near fault F3 (αF3). (b) Variation in α near fault F4 (αF4). (c) Variation in K caused by αF3 (KαF3). (d) Variation of K caused by αF4 (KαF4). (e) The change in displacement pressure difference caused by KαF3. (f)The change in displacement pressure difference caused by KαF4.
Energies 14 01468 g006
Figure 7. Ternary diagrams showing the stress state near the fault plane of F3 (a) and F4 (b) (see Figure 5c for detailed settings). The blue shade represents the reverse fault regime, whereas the green shade represents the strike slip regime.
Energies 14 01468 g007
Figure 8. The bar chart showing the change of K value, the old method without considering the horizontal stress, the new method integrating both gravity and horizontal stress. The variation in K value considering the influence of horizontal stress and its influence on the displacement pressure difference. (a) Different K values of new and old methods near the F3 fault. (b) Different K values of new and old methods near the F3 fault. (c) Pd(f − r) value of new and old methods near the F3 fault. (d) Pd(f − r) value of new and old methods near the F4 fault.
Energies 14 01468 g008
Figure 9. (a). The Shale Gouge Ratio (SGR) value of AA′ section is equal to that of BB’ section. In AA′ and BB′ sections, the dip angle and strike of faults are the same, and the stratigraphic characteristics are also the same. (b) The AA′ and BB′ sections are under different stress regimes. (c) The depth and stress regimes of AA′ and BB′ are the same. (d) The depths of AA′ and BB′ are different, and the stress regimes are also different.
Energies 14 01468 g009
Figure 10. Diagram of normal stress change caused by fault activity sequence. Numerical simulation comparison of plane normal stress distribution caused by activity difference of F1 and F5 faults in different periods. (A) are diagrams of normal stress variation at different depths when fault F1 is strongly active. (B) are diagrams of normal stress variation at different depths when fault F5 is strongly active. (i), (iii) and (v) are the change diagram of normal stress of −1750 m, −1500 m and −1250 m of the model, respectively when the activity of fault F1 is enhanced. (ii), (iv) and (vi) are the change diagram of normal stress of −1750 m, −1500 m and −1250 m of the model, respectively, when the activity of fault F5 is enhanced. The blue area is the area where the normal stress is relatively weakened. The rest of the area is the area where the normal stress increases relatively.
Energies 14 01468 g010
Figure 11. (a) Superposition analysis chart of numerical simulation based on normal stress change of the fault plane. (b) Schematic diagram of classification and evaluation of fault sealing based on normal stress intensity of fault plane.
Energies 14 01468 g011
Table 1. The known variables (i.e., deep, θ) and calculated results (i.e., σ H , σ h , σ V , α, K) of faults F3 and F4 in the research area.
Fault NumberReservoir NumberReservoir DepthσH(psi)σh(psi)σV(psi)In Situ Stress RegimeαθK
F3I387815,715.114,193.0413,804.24RF67781.1795
II395015,943.814,361.1714,098RF72781.1791
III400016,102.614,477.9214,302RF66781.1629
IV404716,251.914,587.6714,493.76RF70781.1647
V409416,401.214,697.4214,685.52RF68781.1560
VI413116,518.714,783.8214,836.48SF73781.1602
VII417616,661.714,888.915,020.08SF74781.1569
F4i388515,737.414,209.3813,832.8RF75791.1925
ii396015,975.614,384.5214,138.8RF81791.1897
iii400916,131.214,498.9414,338.72RF76791.1790
iv405616,280.514,608.6914,530.48RF80791.1779
v410516,436.214,723.1114,730.4RF74791.1656
vi414216,553.714,809.5114,881.36SF78791.1665
vii418516,690.314,909.9215,056.8SF84791.1669
Table 2. The known variables (i.e., Reservoir depth, Clay content of fault rock (Vfr), Clay content of reservoir (Vr) and calculated results (i.e., Equivalent buried depth of fault rock (Zh), Displacement pressure of reservoir (Pdr), Fault rock pressure and reservoir pressure difference (Pd(f − r)) of faults F3 and F4 in the study area.
Fault NumberReservoir NumberReservoir DepthVfrZhPfrVrPdrPd(f − r)
F3I38780.530482.10.6820.1080.6560.025
II39500.550506.50.6920.1120.6660.026
III40000.530491.80.6860.1170.6760.010
IV40470.560523.80.6990.1220.6860.013
V40940.575541.40.7060.0960.6460.060
VI41310.535506.90.6920.1300.704−0.013
VII41760.545520.70.6980.1250.698−0.001
F4i38850.540452.00.6690.0900.6300.040
ii39600.545461.70.6730.1110.6640.009
iii40090.550470.30.6770.1060.6590.018
iv40560.560482.20.6820.1130.6720.010
v41050.570494.80.6870.1250.694−0.008
vi41420.530462.70.6740.1200.688−0.014
vii41850.540474.50.6790.1250.699−0.020
Publisher’s Note: MDPI stays neutral with regard to jurisdictional claims in published maps and institutional affiliations.

