Article

Pyrolysis of Municipal Sewage Sludge to Investigate Char and Phosphorous Yield together with Heavy-Metal Removal—Experimental and by Thermodynamic Calculations

Swedish Centre for Resource Recovery, University of Borås, 501 90 Borås, Sweden
*
Author to whom correspondence should be addressed.
Submission received: 5 February 2021 / Revised: 1 March 2021 / Accepted: 2 March 2021 / Published: 8 March 2021

Abstract

:
Sewage sludge is regarded as a potential source for soil fertilizer However, the direct utilization of sewage sludge in agricultural land is restricted since it also contains heavy metals, pathogens, and toxic compounds. Pyrolysis of the sewage sludge destroys the organic pollutants and partly volatilizes the heavy metals. In this study, pyrolysis of sewage sludge was carried out in order to determine the optimum residence time and temperature to recover the phosphorous and remove heavy metals from the resultant sewage sludge char (SSC). Pyrolysis was conducted on dried sewage sludge (DSS) by means of thermogravimetric analysis (TGA) and high-temperature oven with an N2-atmosphere. Microwave Plasma-Atomic Emission Spectroscopy (MP-AES) was used to determine the concentration of P and trace elements in the resulting solid char fraction. A combination of chemical fractionation (step-by-step leaching) of the DSS and thermodynamic equilibrium calculations were utilized to estimate the availability of phosphorous and removal of heavy metals in the SSC fraction at different temperatures. The results from the thermodynamics calculation were in line with the measured chemical composition of the SSC. Furthermore, the energy contents of the SSC obtained at different temperatures were measured. The pyrolysis evaluation results indicate that phosphorous was enriched in the char, while lead, zinc, and cadmium were significantly removed.

Graphical Abstract

1. Introduction

Phosphorus (P) is a crucial element for all existing organisms and performs vital functions for nourishment, growth, and plant development. It is one of the fundamental parts of fertilizers and an essential element in all organic life. The shortage of P in the soil severely affects the plant metabolism and, in turn, their productions. However, according to scientific reports [1], the demand for P has increased considerably. Moreover, today, most of the P is obtained from phosphate rock (PR), which is non-renewable and limited [2]. Municipal sewage sludge (MSS), which is the main byproduct of wastewater treatment plants (WWTPs), has been generated in large quantities over the past few decades [3]. Increasing attention has been paid to the safe handling and application of this material. Landfilling, agricultural utilization, and incineration are the main alternatives of MSS utilizations. Considering that MSS contains high concentrations of phosphates, which are at the same levels as apatite minerals, it is regarded as a potential secondary source of phosphorous. Besides the P content, wastewater sludge is also enriched in nitrogen as well as macro and micronutrients. Therefore, the most intense application of MSS is the land applications and agricultural usages in view of its fertilizer capacity. However, MMS is highly contaminated with phytotoxic heavy metals such as chromium (Cr), cadmium (Cd), copper (Cu), nickel (Ni), cobalt (Co), and zinc (Zn) as well as pathogens and toxic organic substances such as polyaromatic hydrocarbons, chlorobenzene, and plasticizers and cannot be directly applied in farmland in food production, according to the EU-legislation directives (EU) 2019/1009 [3,4]. Furthermore, MSS has been known as a severe pollutant for the environment, releasing toxins such as N2O into the air and contaminating soil and water reserves. Hence, there are significant concerns related to MSS management with an appropriate and sustainable treatment [5]. Thermochemical conversion (combustion, gasification, hydrothermal carbonatization, and pyrolysis) of MSS has become promising in recent years. It can be attributed to their effectiveness in reducing waste volume, decomposition of organic contaminants, energy recovery, and may enable a significant separation of heavy metals from the remaining ashes or char [6,7]. However, the choice of thermal treatment method plays a significant role in the P recovery and the concentration of heavy metals remaining in the solid residues, since chemical and physical properties of P speciation vary between different thermal processes. For instance, in combustion, the bioavailability of the recovered P is under debate [8]. Therefore, an optimized thermal process is needed to manage a potential method of sewage sludge. Pyrolysis treatment has shown advantages over other thermal processes due to the low cost of the equipment; thus, it can be widely utilized in the disposal of sewage sludge. Pyrolysis is carried out at a temperature below 1000 °C and in the absence of oxygen, which enriches the phosphorous in the sludge char. Moreover, studies [9,10,11] have shown that the char obtained from thermal processing under reducing atmosphere (meaning low concentration or total absence of oxygen) has higher bioavailability due to phosphate conversion to other compounds. Therefore, char from pyrolysis has a better potential for land applications compared to the ashes from combustion. Thanks to the operational condition of pyrolysis, the gas velocity, and the size of the solid fragments, only a small amount of fly ash is produced during the process, which can be advantageous compared to other thermal treatments. One of the problems with some combustion processes is the handling of large amounts of fly ash containing both P and heavy metal compounds. Therefore, contrary to the MSS combustion process, most of the phosphorous will remain in the resultant char after the pyrolysis process. Another characteristic of the pyrolysis process is the sanitization of the sludge’s pathogens, the destruction of toxic compounds, and the volatilization of trace elements to convert the sludge into high-valued carbonaceous products (SSC). Studies on the municipal solid sludge pyrolysis have indicated that arsenic (As) removal can be enhanced with an increased temperature around 500 °C [12,13]. Moreover, the volatilization behavior of both Pb and Cd is increased between 400 °C and 1000 °C [12,14]. Similarly, the prolonged residence time will boost the trace elements’ emission. On the other hand, an increased heating rate has a preventive effect on the release of trace elements in the vapor phases. The effectiveness of char, for example, availability of the phosphorous for plants, is basically dependent on the composition of the sewage sludge, characteristics, and the physical properties of SSC, as well as reaction condition; moreover, it is mostly affected by the pyrolysis temperature. In this regard, there have been extensive studies on phosphorous recovery and emission behavior of heavy metals from obtained ashes during combustion of MSS in fluidized bed combustors in the presence of oxygen at high temperature [15,16,17]. However, to the best of our knowledge, only a few publications [16,18] can be found on the effect of heating rate and reaction temperature on phosphorous recovery in the absence of oxygen. Therefore, further efforts are needed to obtain more extensive knowledge regarding the crucial factors affecting sewage sludge pyrolysis such as reaction and residence time, reaction temperature, and heating rate.
The objective of this study is to determine the effects of pyrolysis reaction parameters such as heating rate, process temperature, and residence time on the removal of heavy metals from the sewage sludge collected from the Mora wastewater treatment plant. The focus of this study is on the char, meant for soil improvement, and the change in the element concentrations at different end temperatures of pyrolysis, with special attention paid to heavy metals and total remaining phosphorus.

2. Materials and Methods

2.1. Fuel Samples Analysis

Dried, undigested, municipal sewage sludge (DSS), with a moisture content of 10.6%, was collected from Solviken Municipal Wastewater Treatment Plant (MWWTP) in Mora, Sweden. The initial properties of the sludge used are found in Table 1. About 10 kg of sewage sludge was dried at 105 °C for 48 h before it was used in the experiment. The DSS was analyzed by Eurofins (more details can be found in [7]). The properties and the ultimate, ash, and trace elements measurements are listed in Table 1.
Since the particle size of the dried sewage sludge (DSS) was above 2 cm in diameter, all material was crushed and blended before the pyrolysis process.

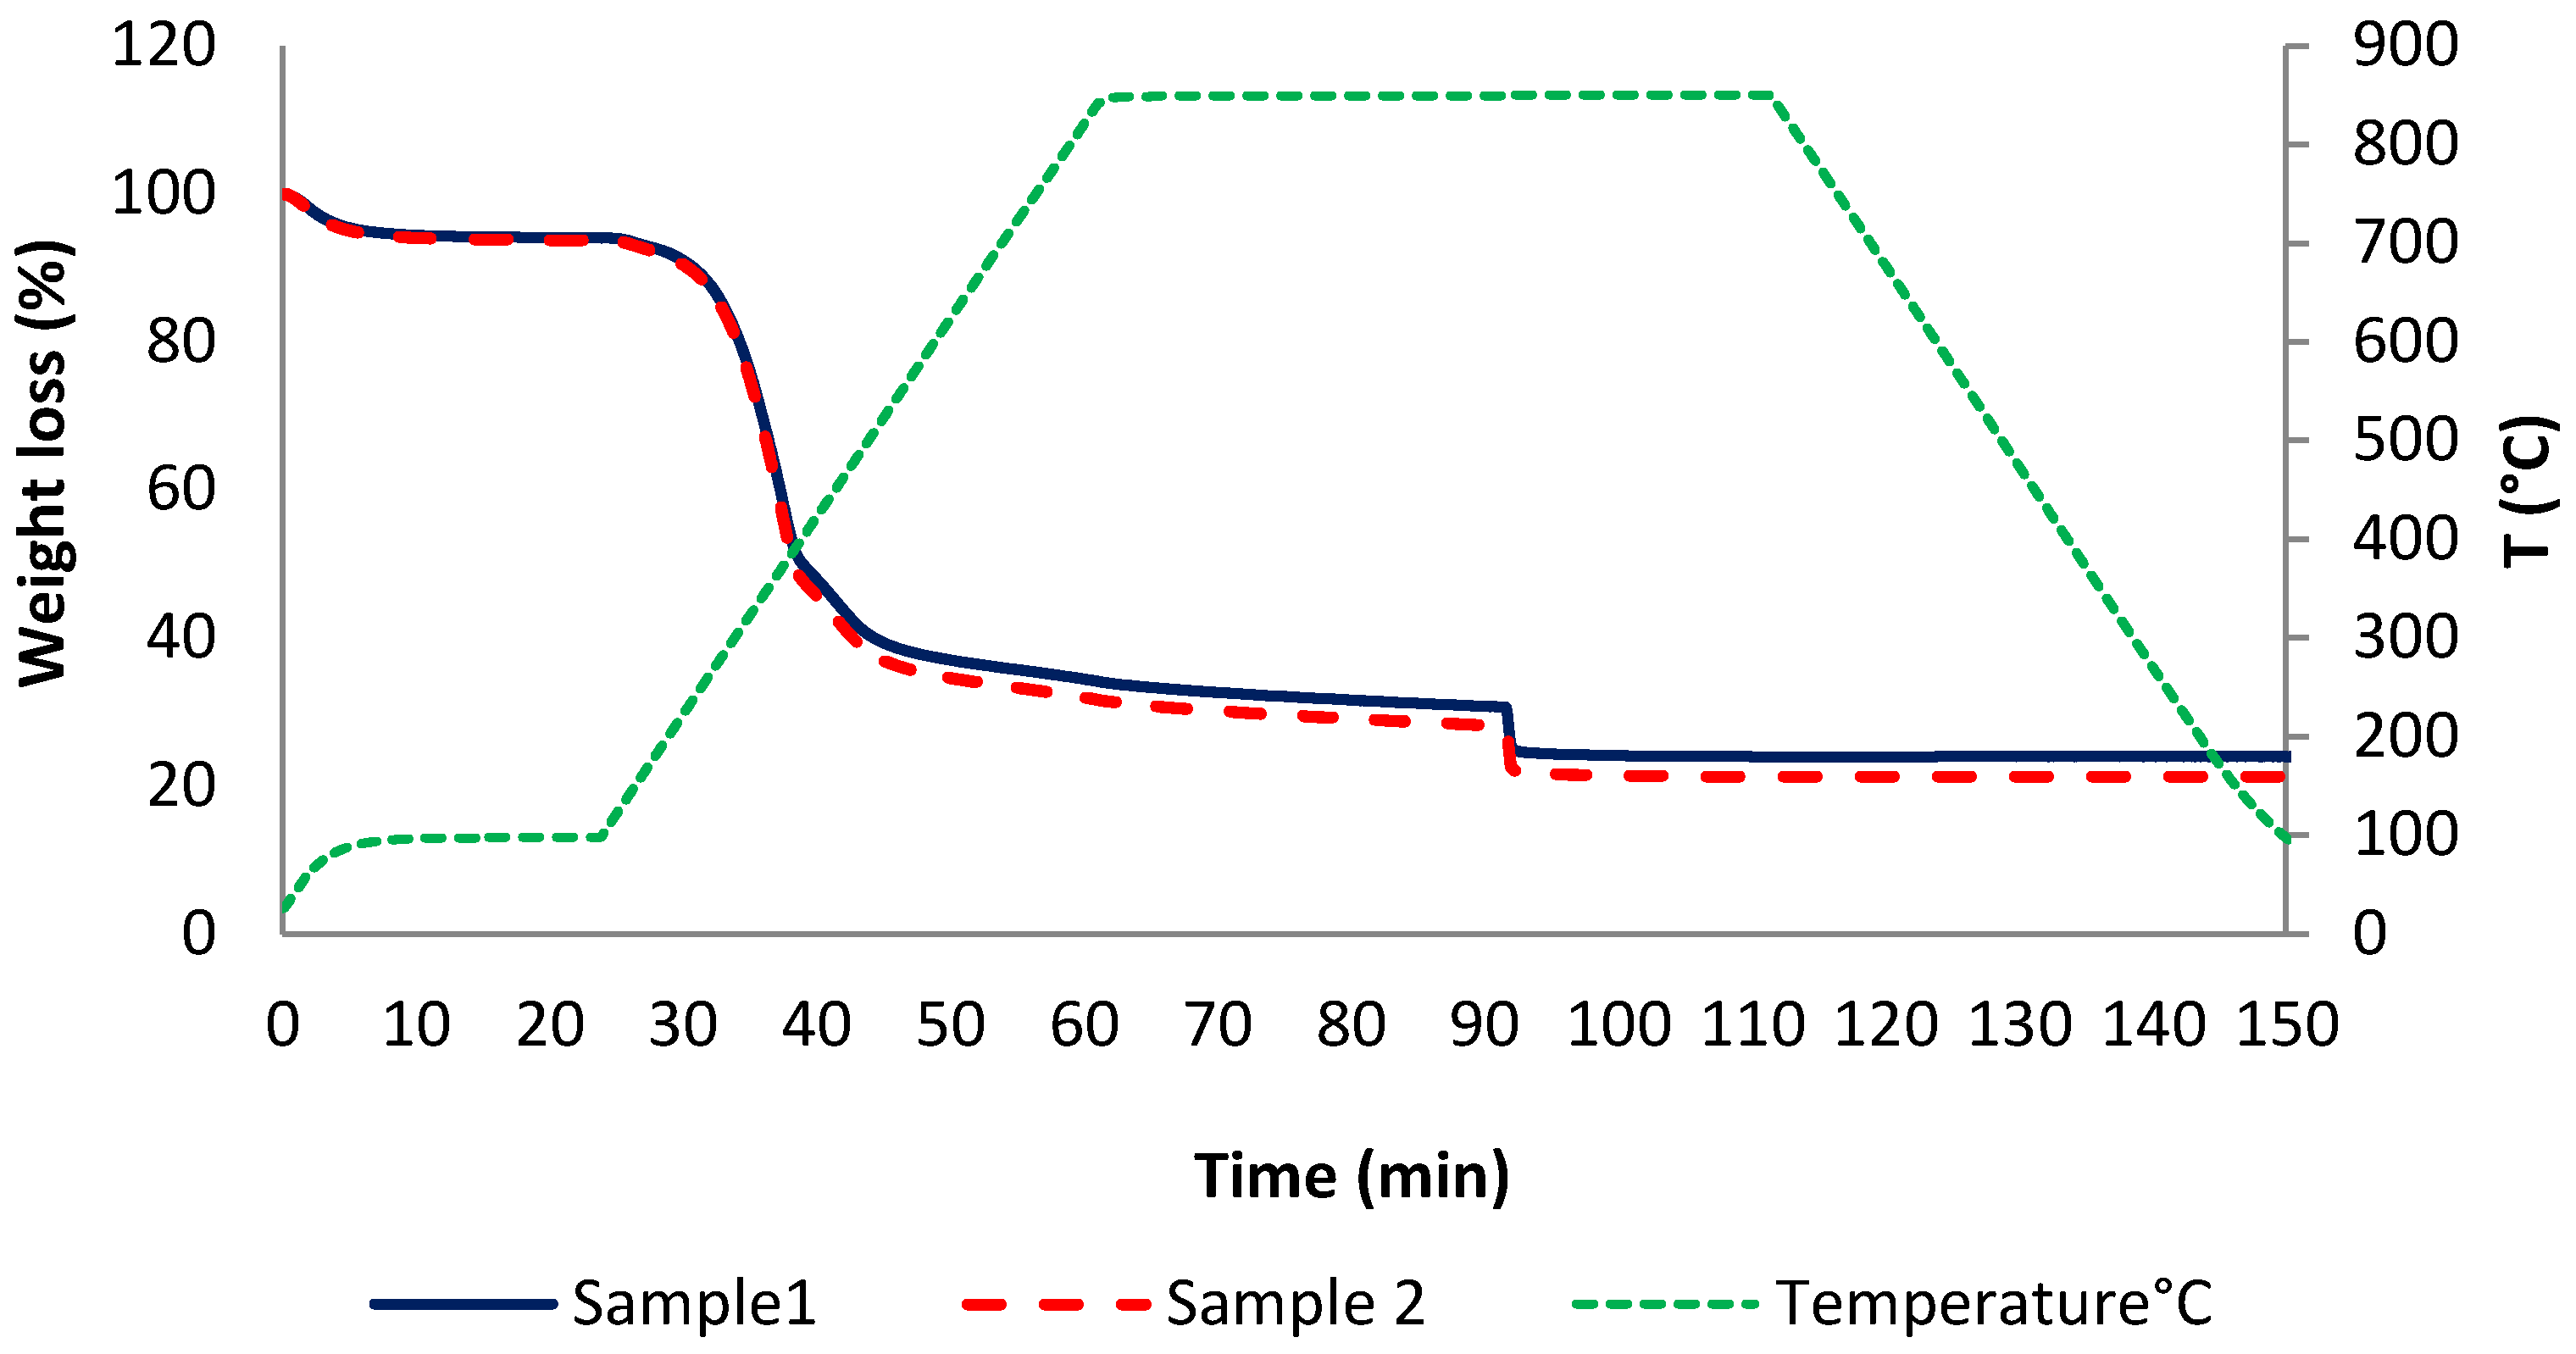
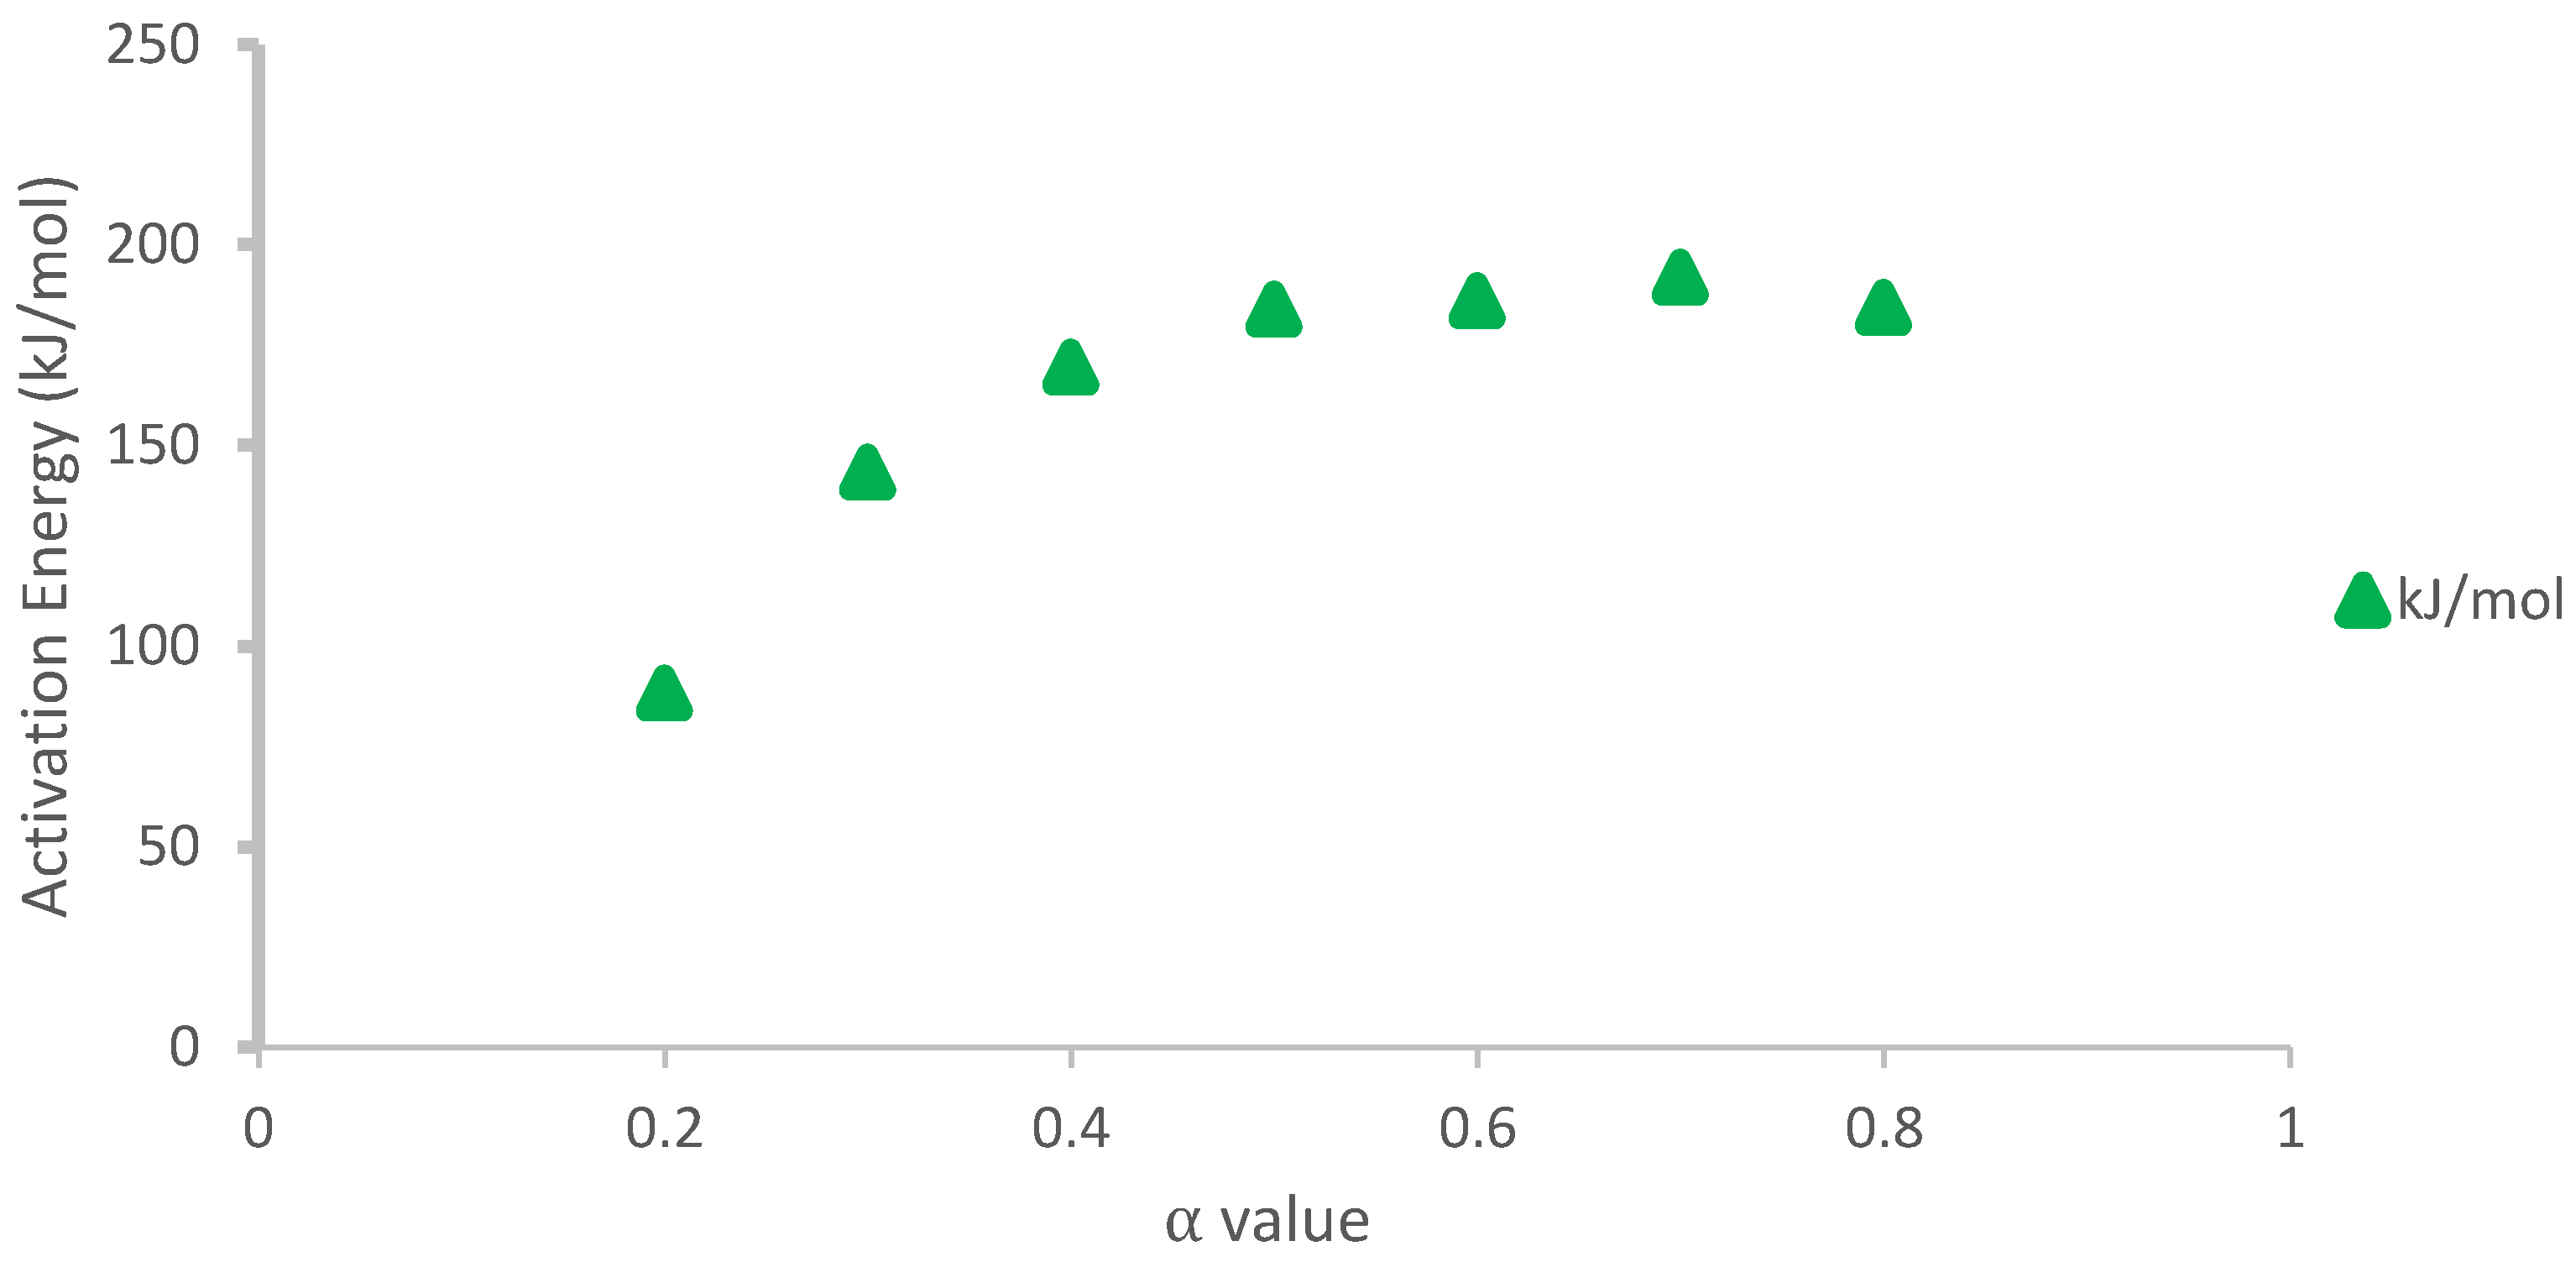
2.2. Pyrolysis Experiments and Kinetic Reaction Analysis

The pyrolysis process was conducted both in a thermogravimetric analyzer (Mettler Toledo TGA/DSC 3+, Greifensee, Schweiz) and in a high-temperature laboratory-scale oven (Nabertherm P330). The thermogravimetric analysis (TGA) experiment was conducted to evaluate the kinetics of the pyrolysis reaction by the activation energy. Five temperature programs with different heating rates 2, 5, 10, 15, and 20 °C/min were used. For each experiment, 3.7 mg of a sample was heated from ambient temperature to 850 °C in N2 atmosphere, after which the N2 was changed to air for 30 min. For each sample, every TGA curve obtained after measurement was evaluated with the horizontal step evaluation method. In this method, a line on the graphs was considered where a function’s derivative is zero to find the changes in the mass and determine the step heights of TGA effects. Moreover, 10 grams of DSS was fed into a high-temperature oven and pyrolyzed at 500, 700, and 900 °C with a heating rate of 10 °C/min in N2 atmosphere. The conversion degree is defined as Equation (1):
α = m 0 m m 0 m
where m is the mass of the sample (mg), m 0 is the initial sample mass (mg), and m is the final sample mass (mg) after full conversion.
The rate of pyrolysis as a solid-state reaction can generally be described by Equation (2) [19]:
d α d t = f ( α ) K ( T )
where K(T) is the rate constant and f(α) the reaction model.
The Arrhenius equation is the most common approach to describe the temperature dependence of the rate constant (Equation (3)) [19].
K ( T ) = k 0 · e E a R T
k 0 stands for the pre-exponential factor, R the gas constant, Ea the activation energy, and T the temperature. The derivation of the Kissinger-Akahira-Sunose (KAS) method has been described in [19] and was used in this work to estimate the activation energy (Equation (4)).
l n β T 2 = l n k 0 R E a   g ( α ) E a R   T .
where g ( α ) =   0 α d α f ( α ) .
At a given conversion, α, Equation (4) is only a function of the temperature. Therefore, Ea can be estimated by the relation between l n β T 2 and 1 T .
The kinetic reaction of pyrolysis is as Equation (5). The reaction model of a homogenous reaction is defined by f ( α ) =   ( 1 α ) n where n is the reaction order and α the fraction converted.
β ( d α d T )   d α d t =   ( 1 α ) n   k 0   e E a R   T
A mathematically calculated degree of conversion α c a l c corresponded to each value of experimental degree of conversion α e x p . Then, the error between these two values ( α e x p α c a l c ) 2 was calculated, and the minimal sum error was found to obtain the most correct value for the pre-exponential factor and the order of the reaction.

2.3. Char Analysis

Since the char contains both the majority of the inorganics together with parts of the organic fractions of the DSS, char analysis was performed to determine the fraction of char and ash at each temperature. In addition, the heating values of the char were evaluated by bomb calorimetry using an IKA C200 (IKA-Werke GmbH & Co. KG, Staufen im Breisgau, Germany). Moreover, the char was dissolved in an acid solution containing 6 mL HNO3, 2 mL HCl, 1 mL HF, and 0.5 mL H2O2 by using microwave digestion (Milestone ETHOS UP microwave oven, Acquisition Corp, Hatfield PA, USA). Finally, the resultant solutions were filtered (0.20 µm) and diluted to 50 mL with Milli-Q water and analyzed using Microwave Plasma-Atomic Emission Spectroscopy (MP-AES, Agilent technologies, Santa Clara CA, USA). All samples tested were analyzed in duplicates for the following elements: Cd, Cl, Co, Cr, Cu, Mg, Ni, Pb, P, and Zn.

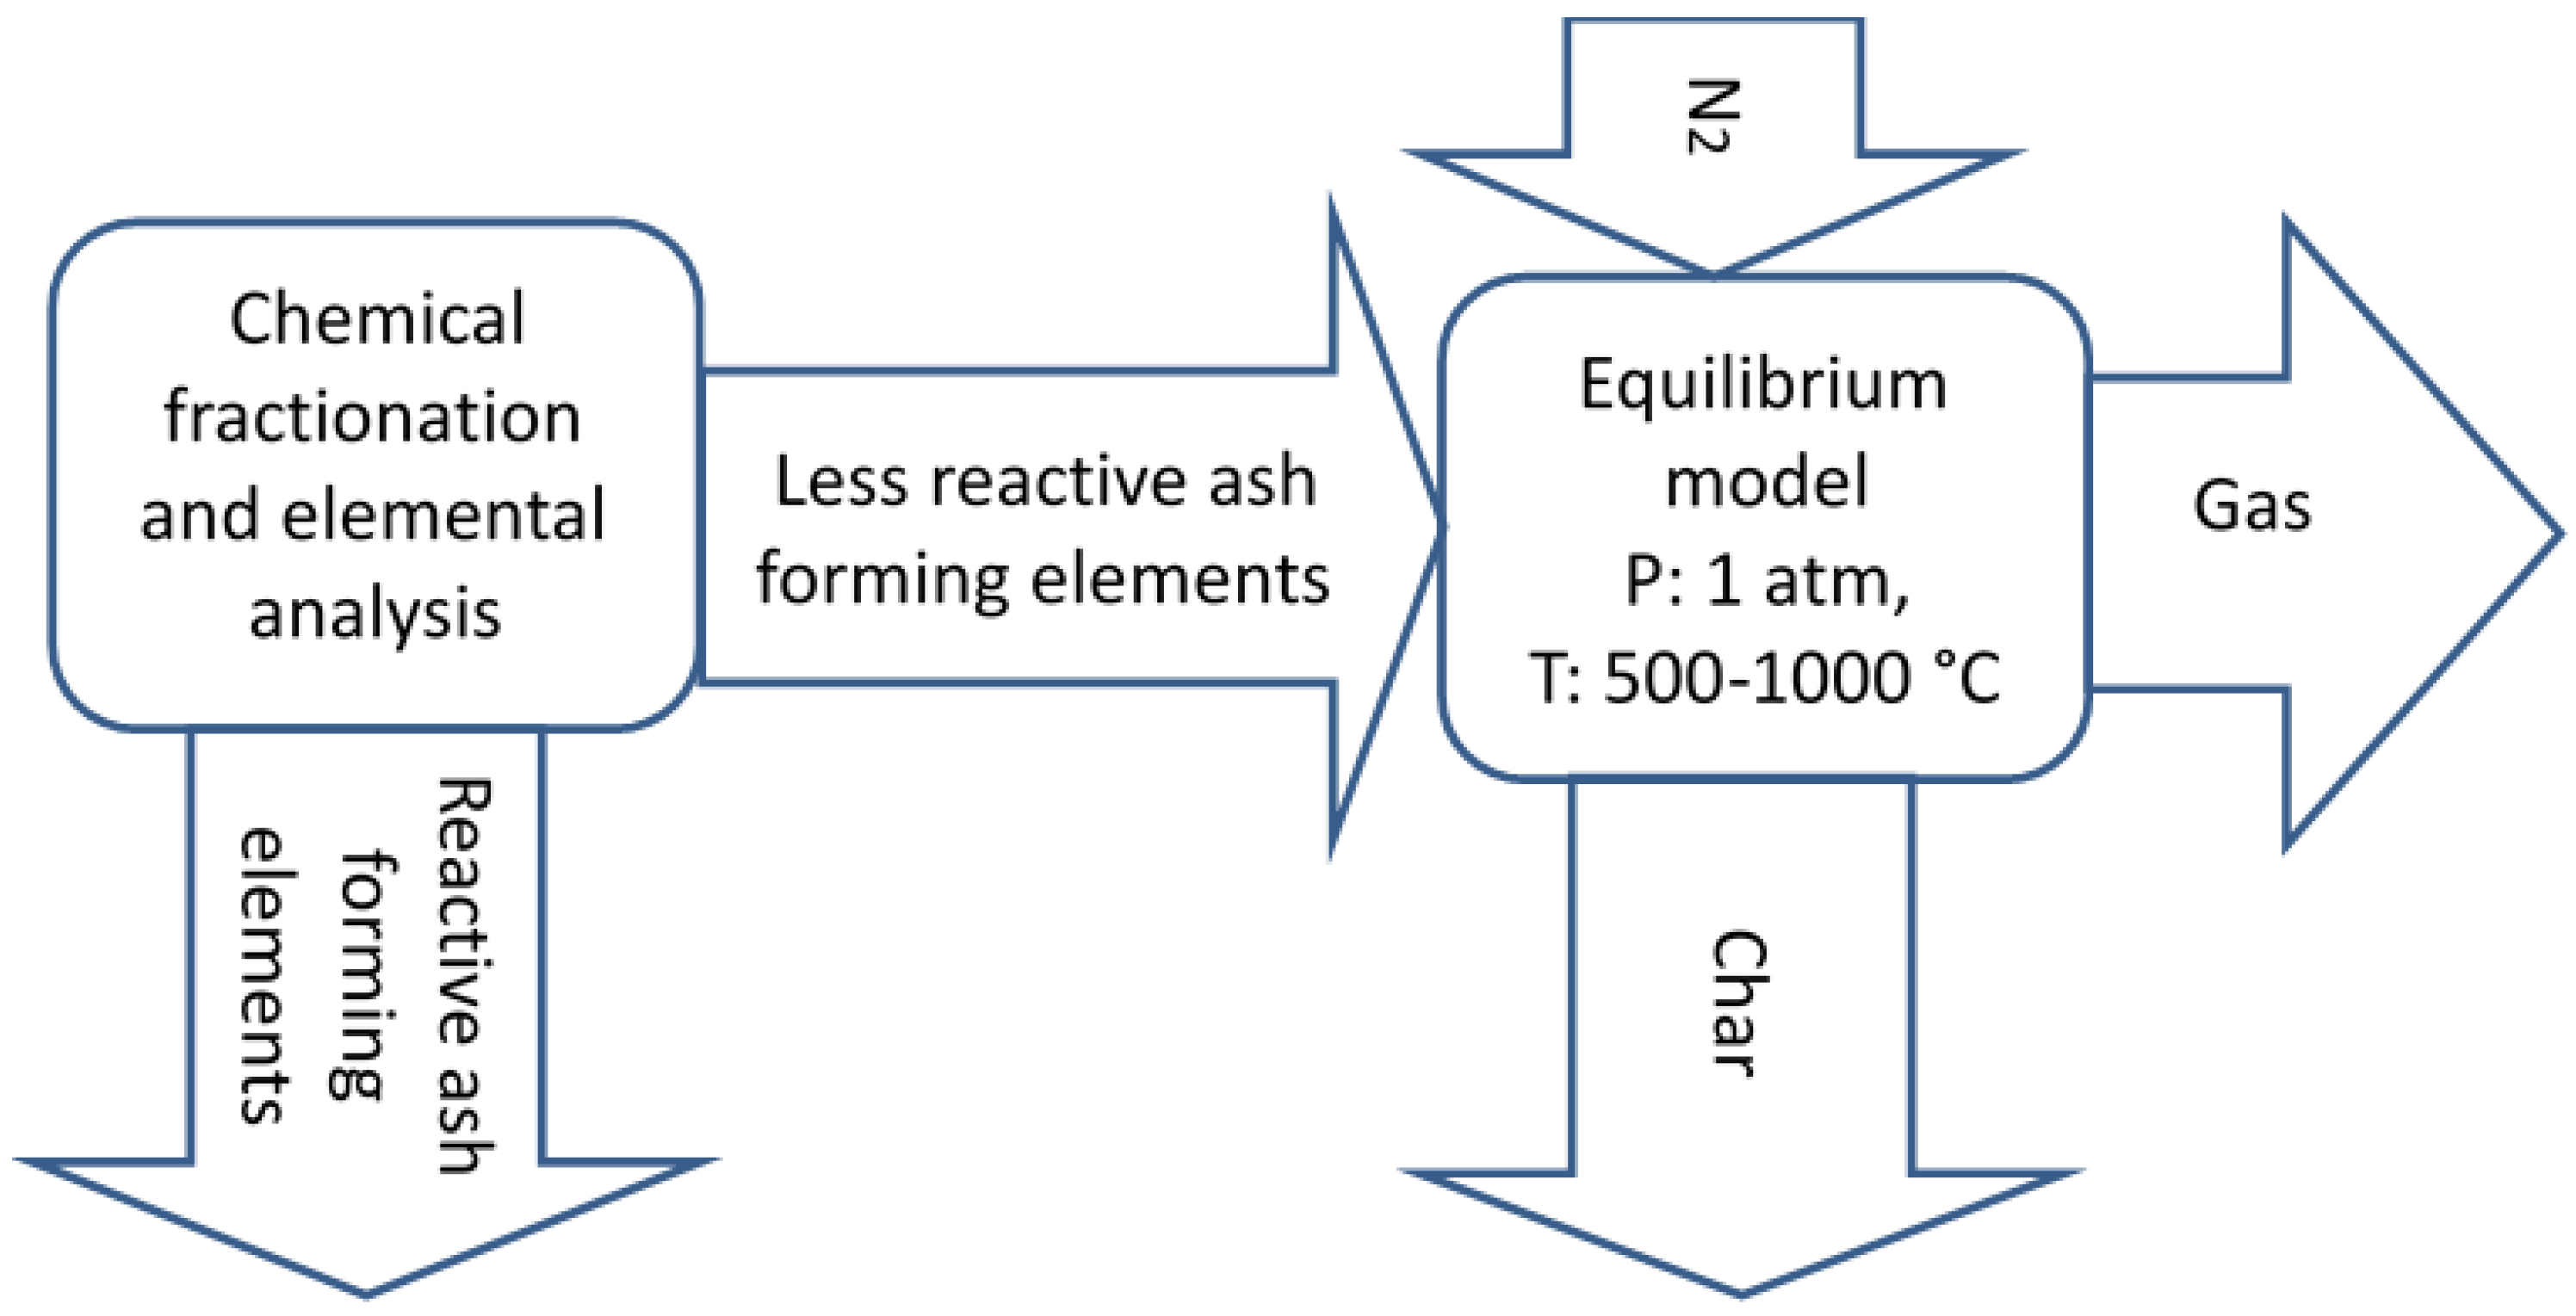
2.4. Predicting Pyrolysis Products

2.4.1. Chemical Fractionation

Chemical fractionation, a step-by-step leaching method, using water (H2O), 1 M ammonium acetate (NH4Ac), and 1 M hydrochloric acid as different solvents, was performed to quantify the association of elements in the DSS to distinguish the reactive fractions from the less reactive matters in the MSS based on their solubility in the solvents [20,21,22,23]. However, in this study, only water and ammonium acetate were used. Since the solid residue contains less-reactive elements after leaching with NH4Ac and indicates the char elemental composition under investigation, leaching with HCl was omitted in this study. Both the leached liquids and the solid fractions were analyzed for ash-forming elements such as Ca, Cl, Fe, K, Mg, Na, S, Si, Al, Ag, As, Cd, Co, Cr, Cu, Mn, Mo, Ni, P, Pb, Zn, and Ti [24]. In general, water and ammonium acetate soluble compounds are typical ash-forming matters such as alkali sulfates, carbonates, phosphates, and chlorides, and ion-exchangeable elements such as magnesium, calcium, potassium, and sodium. According to Zevenhoven et al. [20], the ash-forming matter in sewage sludge is mainly inert and found in the solid residue left after the chemical fractionation. The ash-forming matter in sludge is often dominated by phosphorus precipitating agents such as iron sulfate and aluminum sulfate. It is stated that volatile K can be captured by aluminum silicates. Furthermore, crystalline phases containing potassium and phosphorus have been identified in ash from phosphorous-rich DSS such as sewage sludge, which are mainly in the form of CaK2P2O7, MgKPO4, and CaKPO4 [20,25,26].

2.4.2. Thermodynamic Equilibrium Calculations

Experimental investigations and advanced analyses, along with thermodynamic calculations, have been broadly applied to gain a fundamental understanding of the chemistry of thermal conversion in the process, such as combustion, gasification, and pyrolysis [6,27,28]. It has proven to be useful to estimate the fate of the species, chemical composition, and predict the different effective parameters on the process. Despite the proven capabilities of this technique, there are some limitations attributed to the equilibrium thermodynamic modeling of thermal conversion processes. The limitations relate to lack of kinetics, mass transfer, surface reactions, and other physical phenomena. Moreover, the reliability of the model depends significantly on the chosen databases, the selection of the input data, and the compounds involved in the equilibrium reactions [23,26,29].
All calculations were performed with the software FactSage (GTT-Technologies, Herzogenrath, Germany) 7.3 [30], which is based on minimization of Gibbs free energy. The process model was based on full equilibrium calculations. From the literature and our evaluations for different subsystems, one of the most correct and sufficient databases for P rich material is the GTT oxide Database (GTOX). The database makes it possible to model oxide compounds with more realistic melting points over the full composition range available in the system with high accuracy [29,31]. The purpose of using equilibrium calculations in this study was to estimate the fate of the species in the char, with a special focus on the recovered P, i.e., after the chemical fractionation (less-reactive) part of the fuel was used as an input for the model. A schematic figure represents the modeling strategy, Figure 1.
The thermodynamic data collected from the GTOX make it possible to predict the pure solids, solution species, and oxides available in the char after the pyrolysis process of sewage sludge and the SGTE pure substance database (SGPS) were used to implement the thermodynamic data for gaseous compounds. In case of gases and stoichiometric compounds which are duplicated in both SGPS and the GTOX, the species of SGPS was suppressed and they were selected from the GTOX. Based on the pyrolysis process, the input gas (N2) was assumed to be inert. Solution phases selected from the GTOX are SLAG, ALPM, C3PL, CORU, MEO, MULL, OLIV, and PYRR. The elements and the composition of solution compounds are provided in Table 2.
This work is concerned with the phosphorous compounds which remain in char after pyrolysis at different temperatures. Heavy metal removal would be of interest and has been studied extensively in previous research [32,33]. Nonetheless, in this work, the input data resulting from the chemical fractionation revealed a negligible amount of heavy metals in the char. In addition, considering that the thermodynamic data for P, including heavy metals such as Cu, Pb, Ni, Co, Sb, As, and Cd, are not covered in the GTOX, only Zn was considered in the calculations. The amount of P left in the char and the chemical compounds formed at the setup temperature between 500 and 1000 °C were considered in detail. In future work, the sensitivity calculations with different input compositions will be presented in order to evaluate the influencing parameters and flue gas condition on the heavy metal removal rate.

3. Results and Discussion

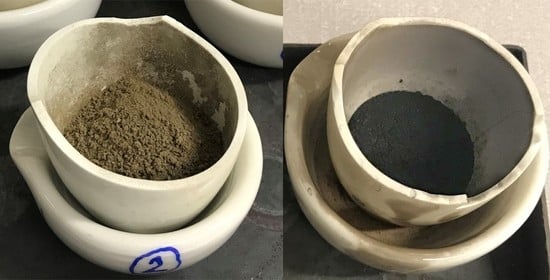
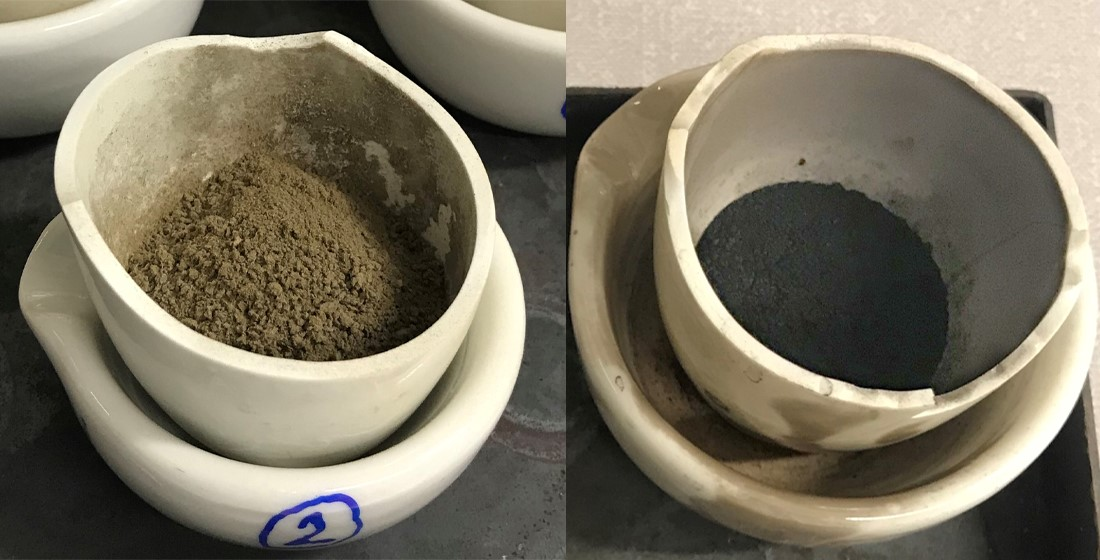
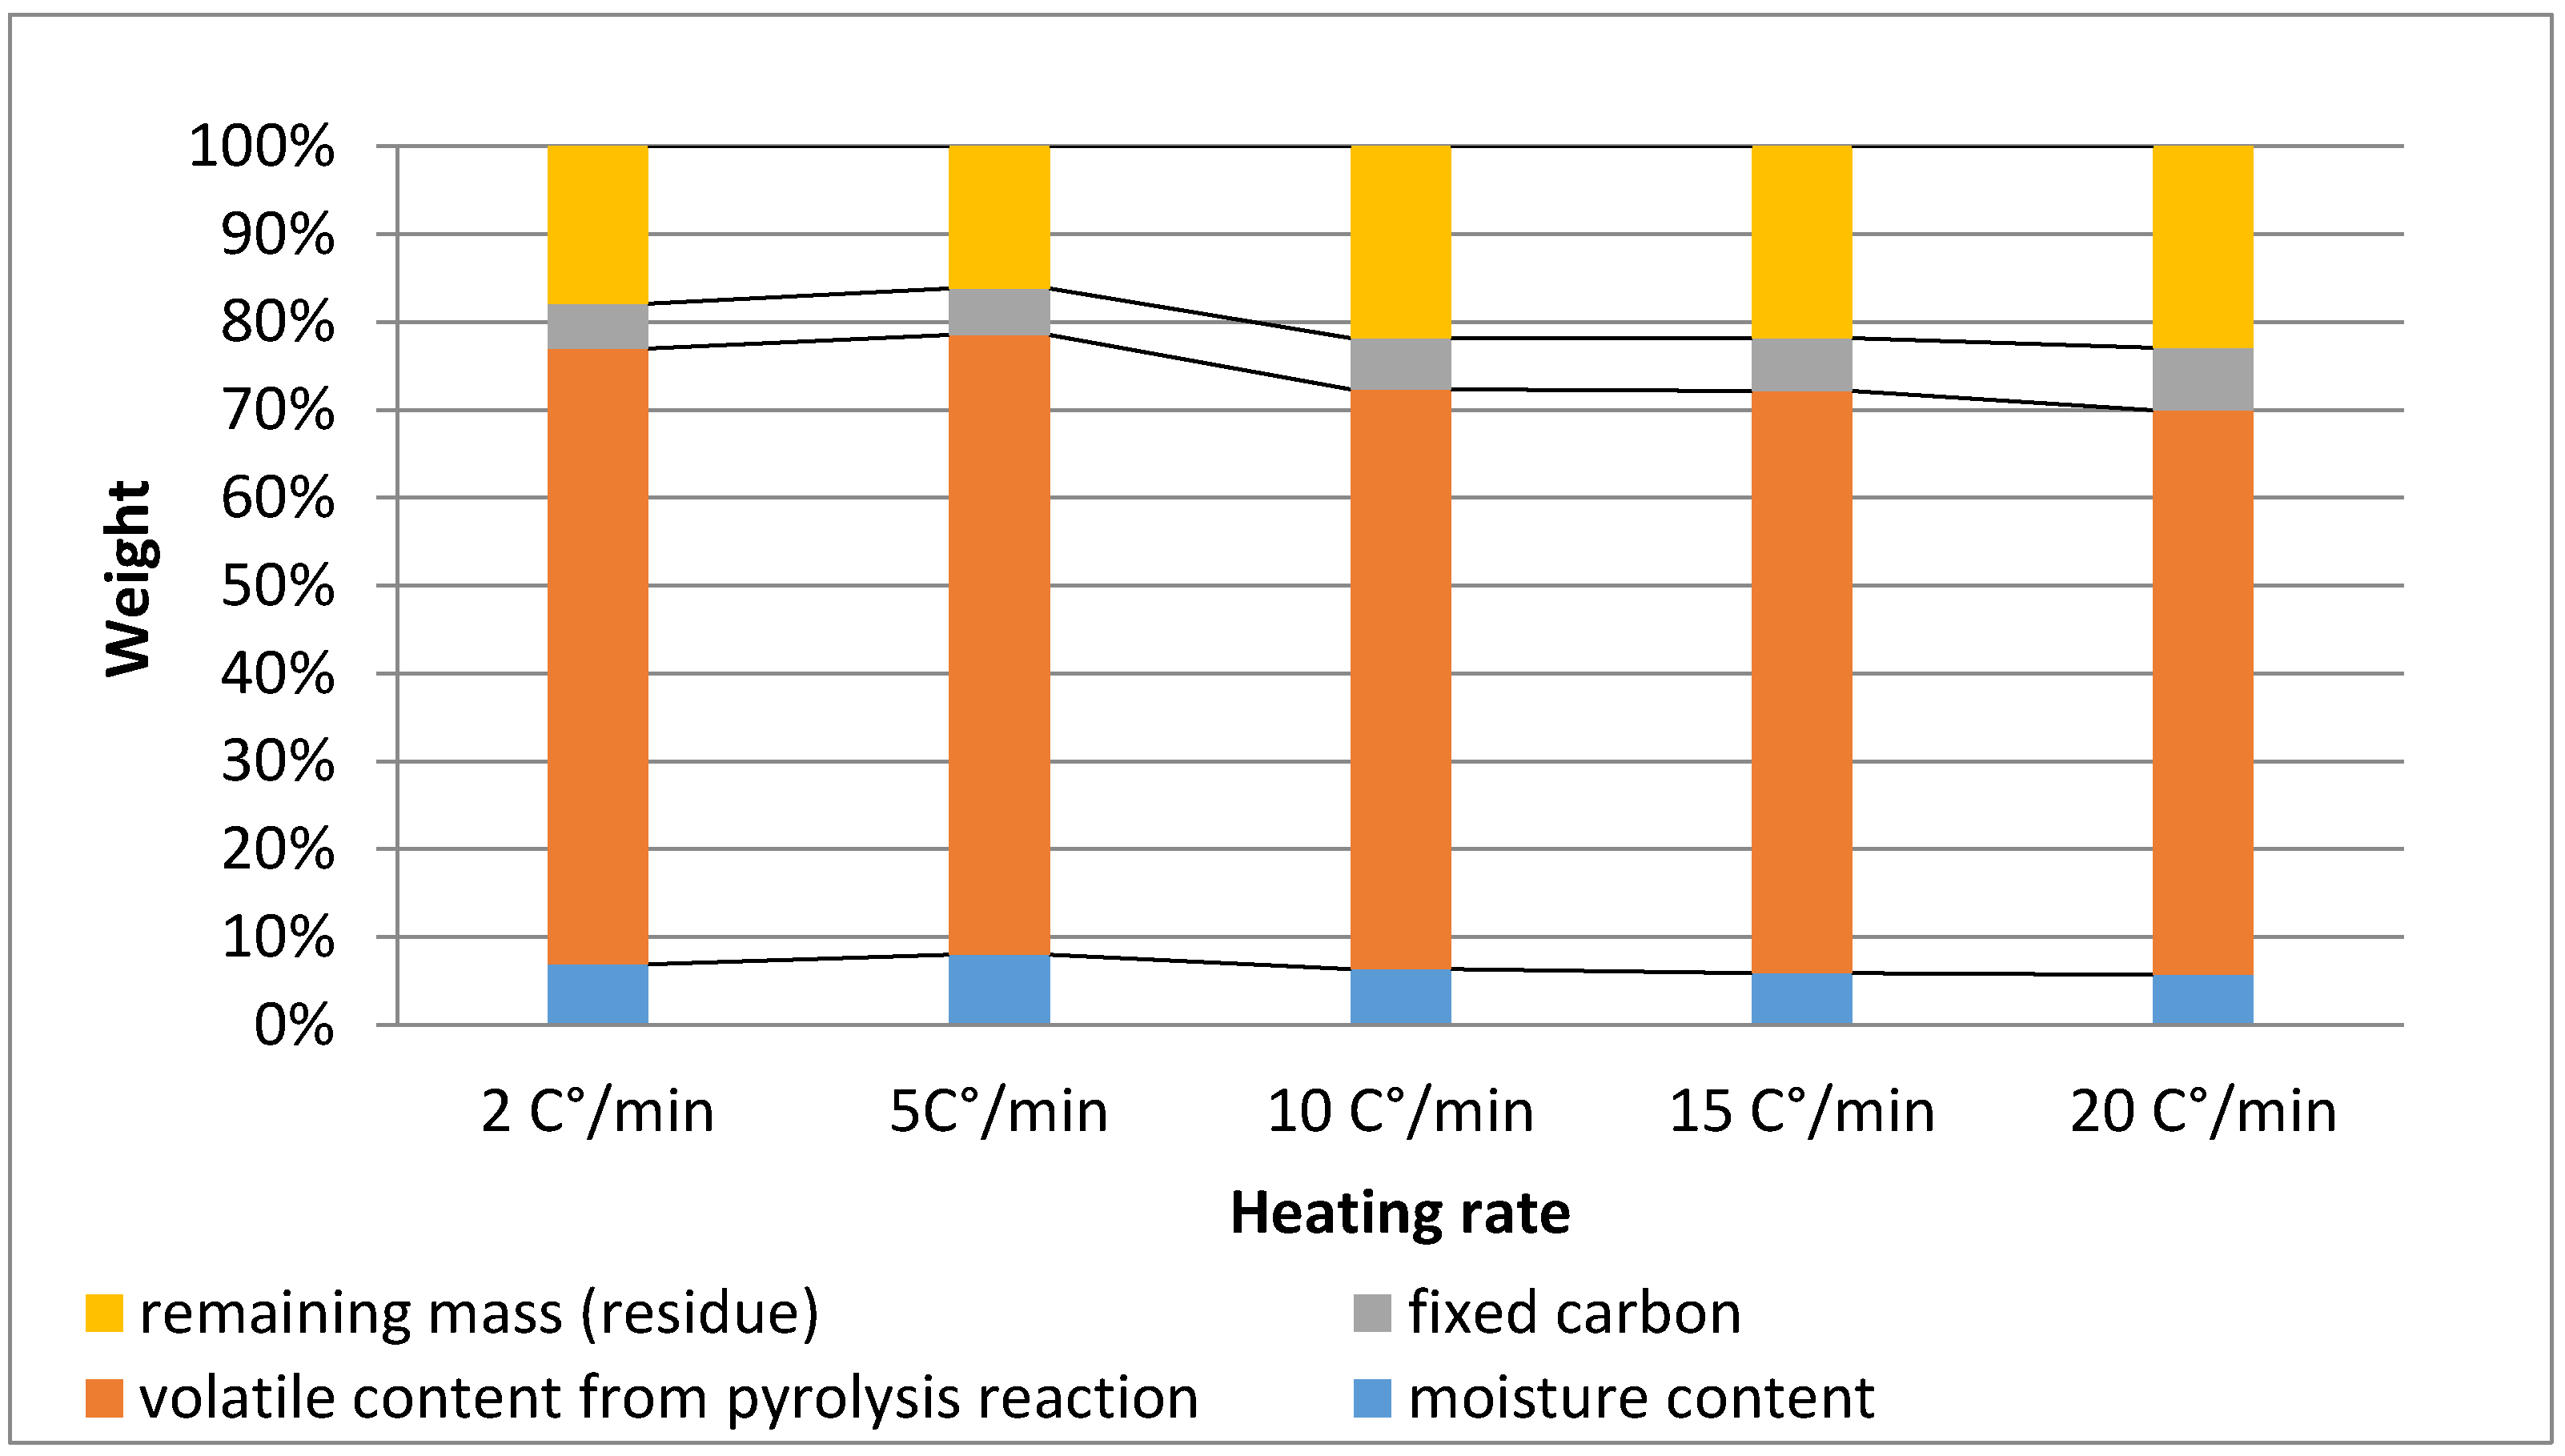
3.1. Pyrolysis Treatments

Thermogravimetric analysis (TGA) was performed to investigate the kinetic parameters of the decomposition reactions of sewage sludge within the temperature range of 25 to 850 °C at different heating rates. An example of the behavior, using a heating rate of 20 °C/min can be seen in Figure 2.
Each and every graph of TGA curves shows three steps of weight loss that can be evaluated using horizontal tangent evaluations. The first stage represents the mass loss in moisture content. The second step corresponds to the pyrolysis reaction, gas emission, and volatilization of volatile material, with a mass loss of around 60%. Finally, the last step, a sudden drop in weight at 95 minutes, is due to the changing atmosphere, which represents the transition from nitrogen to air and combustion of the remaining carbon in the DSS. Additionally, the thermal decomposition under non-isothermal conditions and different constant heating rate can be observed in Figure 3. From the graphs, it is evident that the heating rate has an effective influence on the decomposition of sewage sludge. Figure 3 represents the KAS plots obtained from experiments performed at 2, 5, 10, 15, and 20 °C/min. In Figure 3, it can be seen that the experimental values are approximately lined up for each conversion, and the activation energy can be obtained from the slopes for different α values between 0.1 and 0.9 at various temperatures. The activation energy of 0.9 is 1665 kJ/mol, which is very high and that of 0.1 is very low compared to the other values. This is common and represents the start and ending reactions that are significantly different from the major reactions. Thus, they are not taken into account for calculating the average activation energy, which is found to be about 164 kJ/mol.
Figure 4 shows the change in the activation energy, with respect to the conversion and according to the theoretical expression; the dependence is very low, but it can be seen that this is only valid above a conversion of 0.3. However, it should be noted that the pyrolysis reaction is a combination of many different reactions, and all of them are merged into a single reaction with this method.
Table 3 represents the pre-exponential factor and order of the reaction calculated pyrolysis kinetic reaction, and it demonstrates that the reaction order increases as the heating rate decreases.

3.2. Char Elemental Composition and Energy Content

Using horizontal tangent evaluations on obtained TGA curves as described in 3.1, the content of total ash, fixed carbon, and volatility for different heating rates were measured and shown in Figure 5. An increase in the pyrolysis heating rate from 2 to 20 °C/min at the temperature of 850 °C led to an increase in the content of fixed carbon from 5.6 to 7.2 wt.%. The highest ash content and the lowest volatile content, 23 and 64 wt.% respectively, were found in the char samples from the experiments with the faster heating rate of 20 °C/min; further, in the samples with 2 and 5 °C/min heating rate, the volatilization content was almost similar at about 70 wt.%.
The average energy content and the remaining mass obtained after the thermal treatment in the high temperature oven are summarized in Table 4. It shows that the char yield and the heating value decreased with the increasing pyrolysis temperature from 500 to 700 °C and then increased again at 900 °C. The yield of char dropped slightly from 28.62 to 26.38 and 24.62 wt.% of dry mass when the pyrolysis temperature was increased from 500 to 700 and 900 °C, respectively. This descent could possibly be associated with thermal cracking and volatilization, which was also reported for sludge char treated at different temperatures.

3.2.1. Microwave Plasma-Atomic Emission Spectroscopy

The concentrations of some selected species, heavy metals, and phosphorous were determined for the char from pyrolysis in the high temperature oven Figure 6 and Figure 7. All concentrations are stated on dry weight basis.

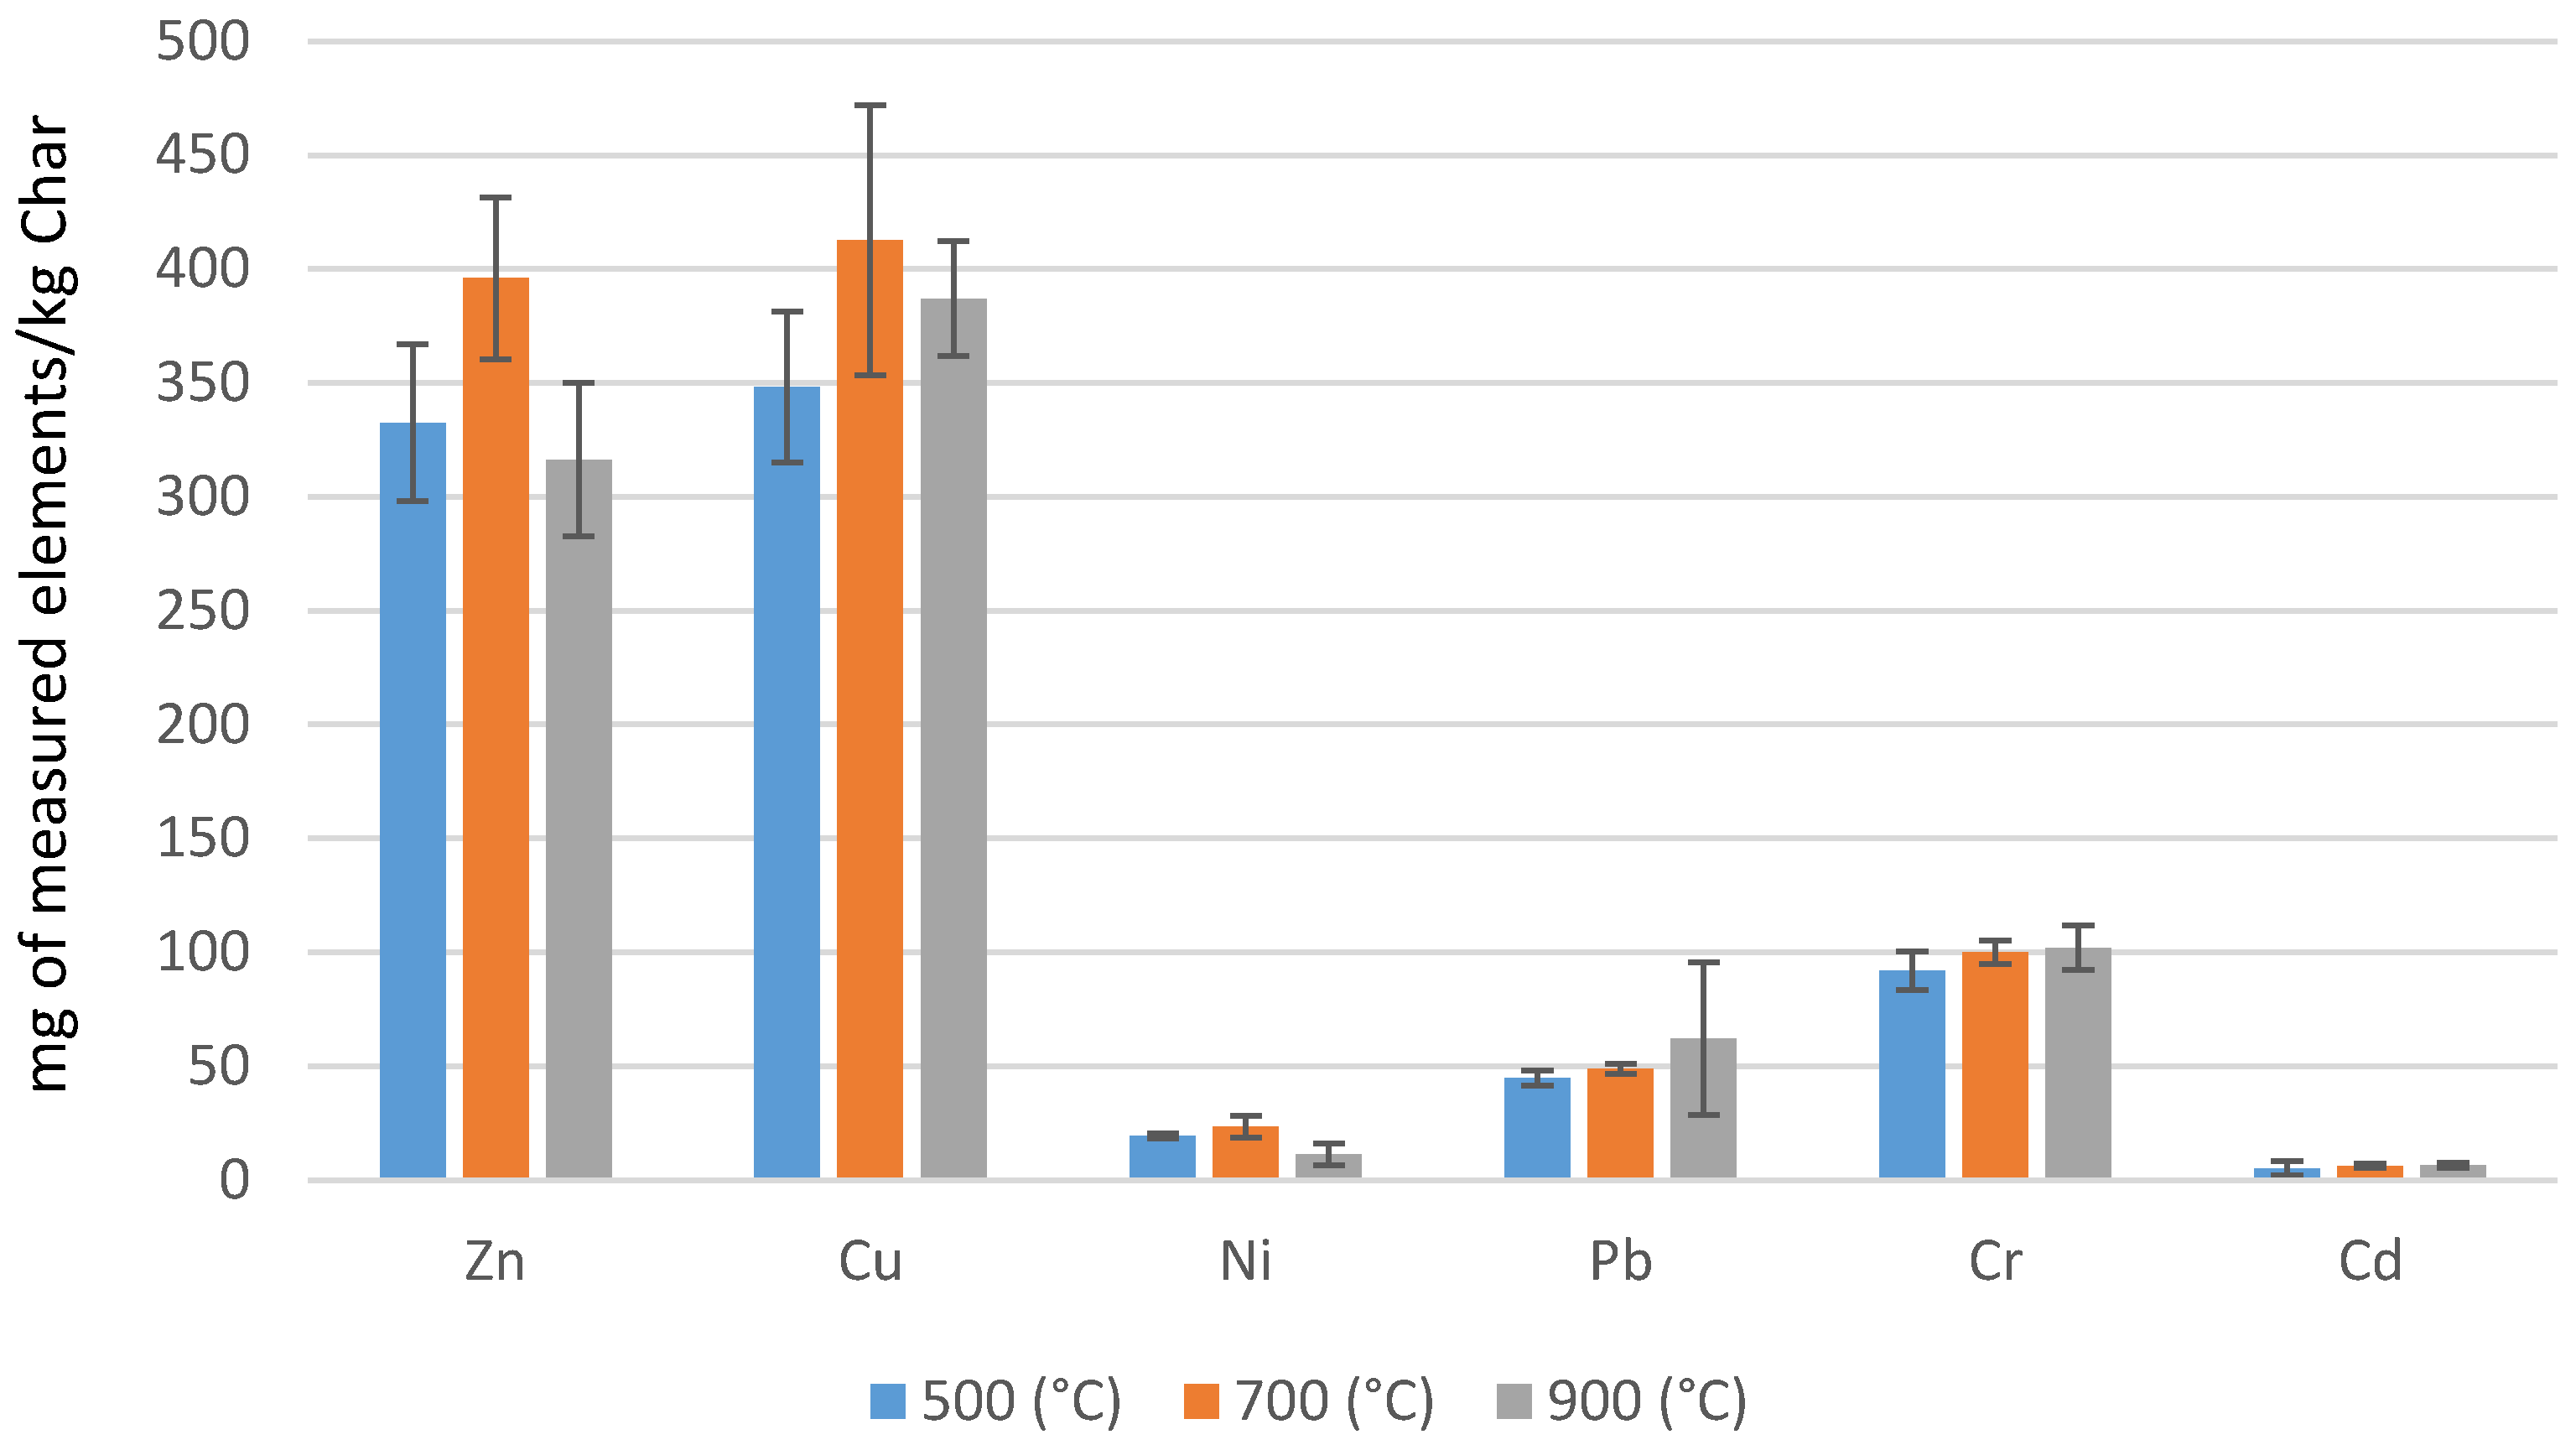
3.2.2. Trace Elements

The trace elements content in the char is shown in Figure 6. The concentration of As and Co was under the detection limit in all char samples. The concentration of Cd declined significantly. Cr, Cu, Ni, and Pb indicate inconclusive results. The concentration of Zn and Ni was higher in the char at the temperatures 500 °C and 700 °C compared to that at at 900 °C. This reduction above 700 °C indicates the de-volatilization of some of these metals at these range of temperatures [7,34].
Table 5 shows the weight percentage of each element that remained in the char after pyrolysis compared to the original DSS. According to Table 5, the highest P recovery at 700 °C is 100 percent, and by increasing the temperature up to 900 °C, the heavy metal removal also increases; therefore, the optimum pyrolysis temperature may be between 700 and 900 °C.
The Cd-content is highly restricted when MSS is applied to the food production system since it is among the most toxic heavy metals [35,36]. From Figure 6, it can be seen that the maximum amount of Cd is less than 8 mg/kg char on a dry basis. This can be attributed to the decreased oxide formation in the reducing atmosphere in the pyrolysis process, thus, facilitating the high Cd vaporization. These results are in line with those from other research in slow pyrolysis atmosphere [8]. The high Cd-release can be mentioned as an advantage of pyrolysis over combustion since more oxides are present in the combustion ashes than the pyrolysis char; therefore, Cd stabilization takes place in the ashes as a result of Al and Si oxide formation at high temperatures [8,37].

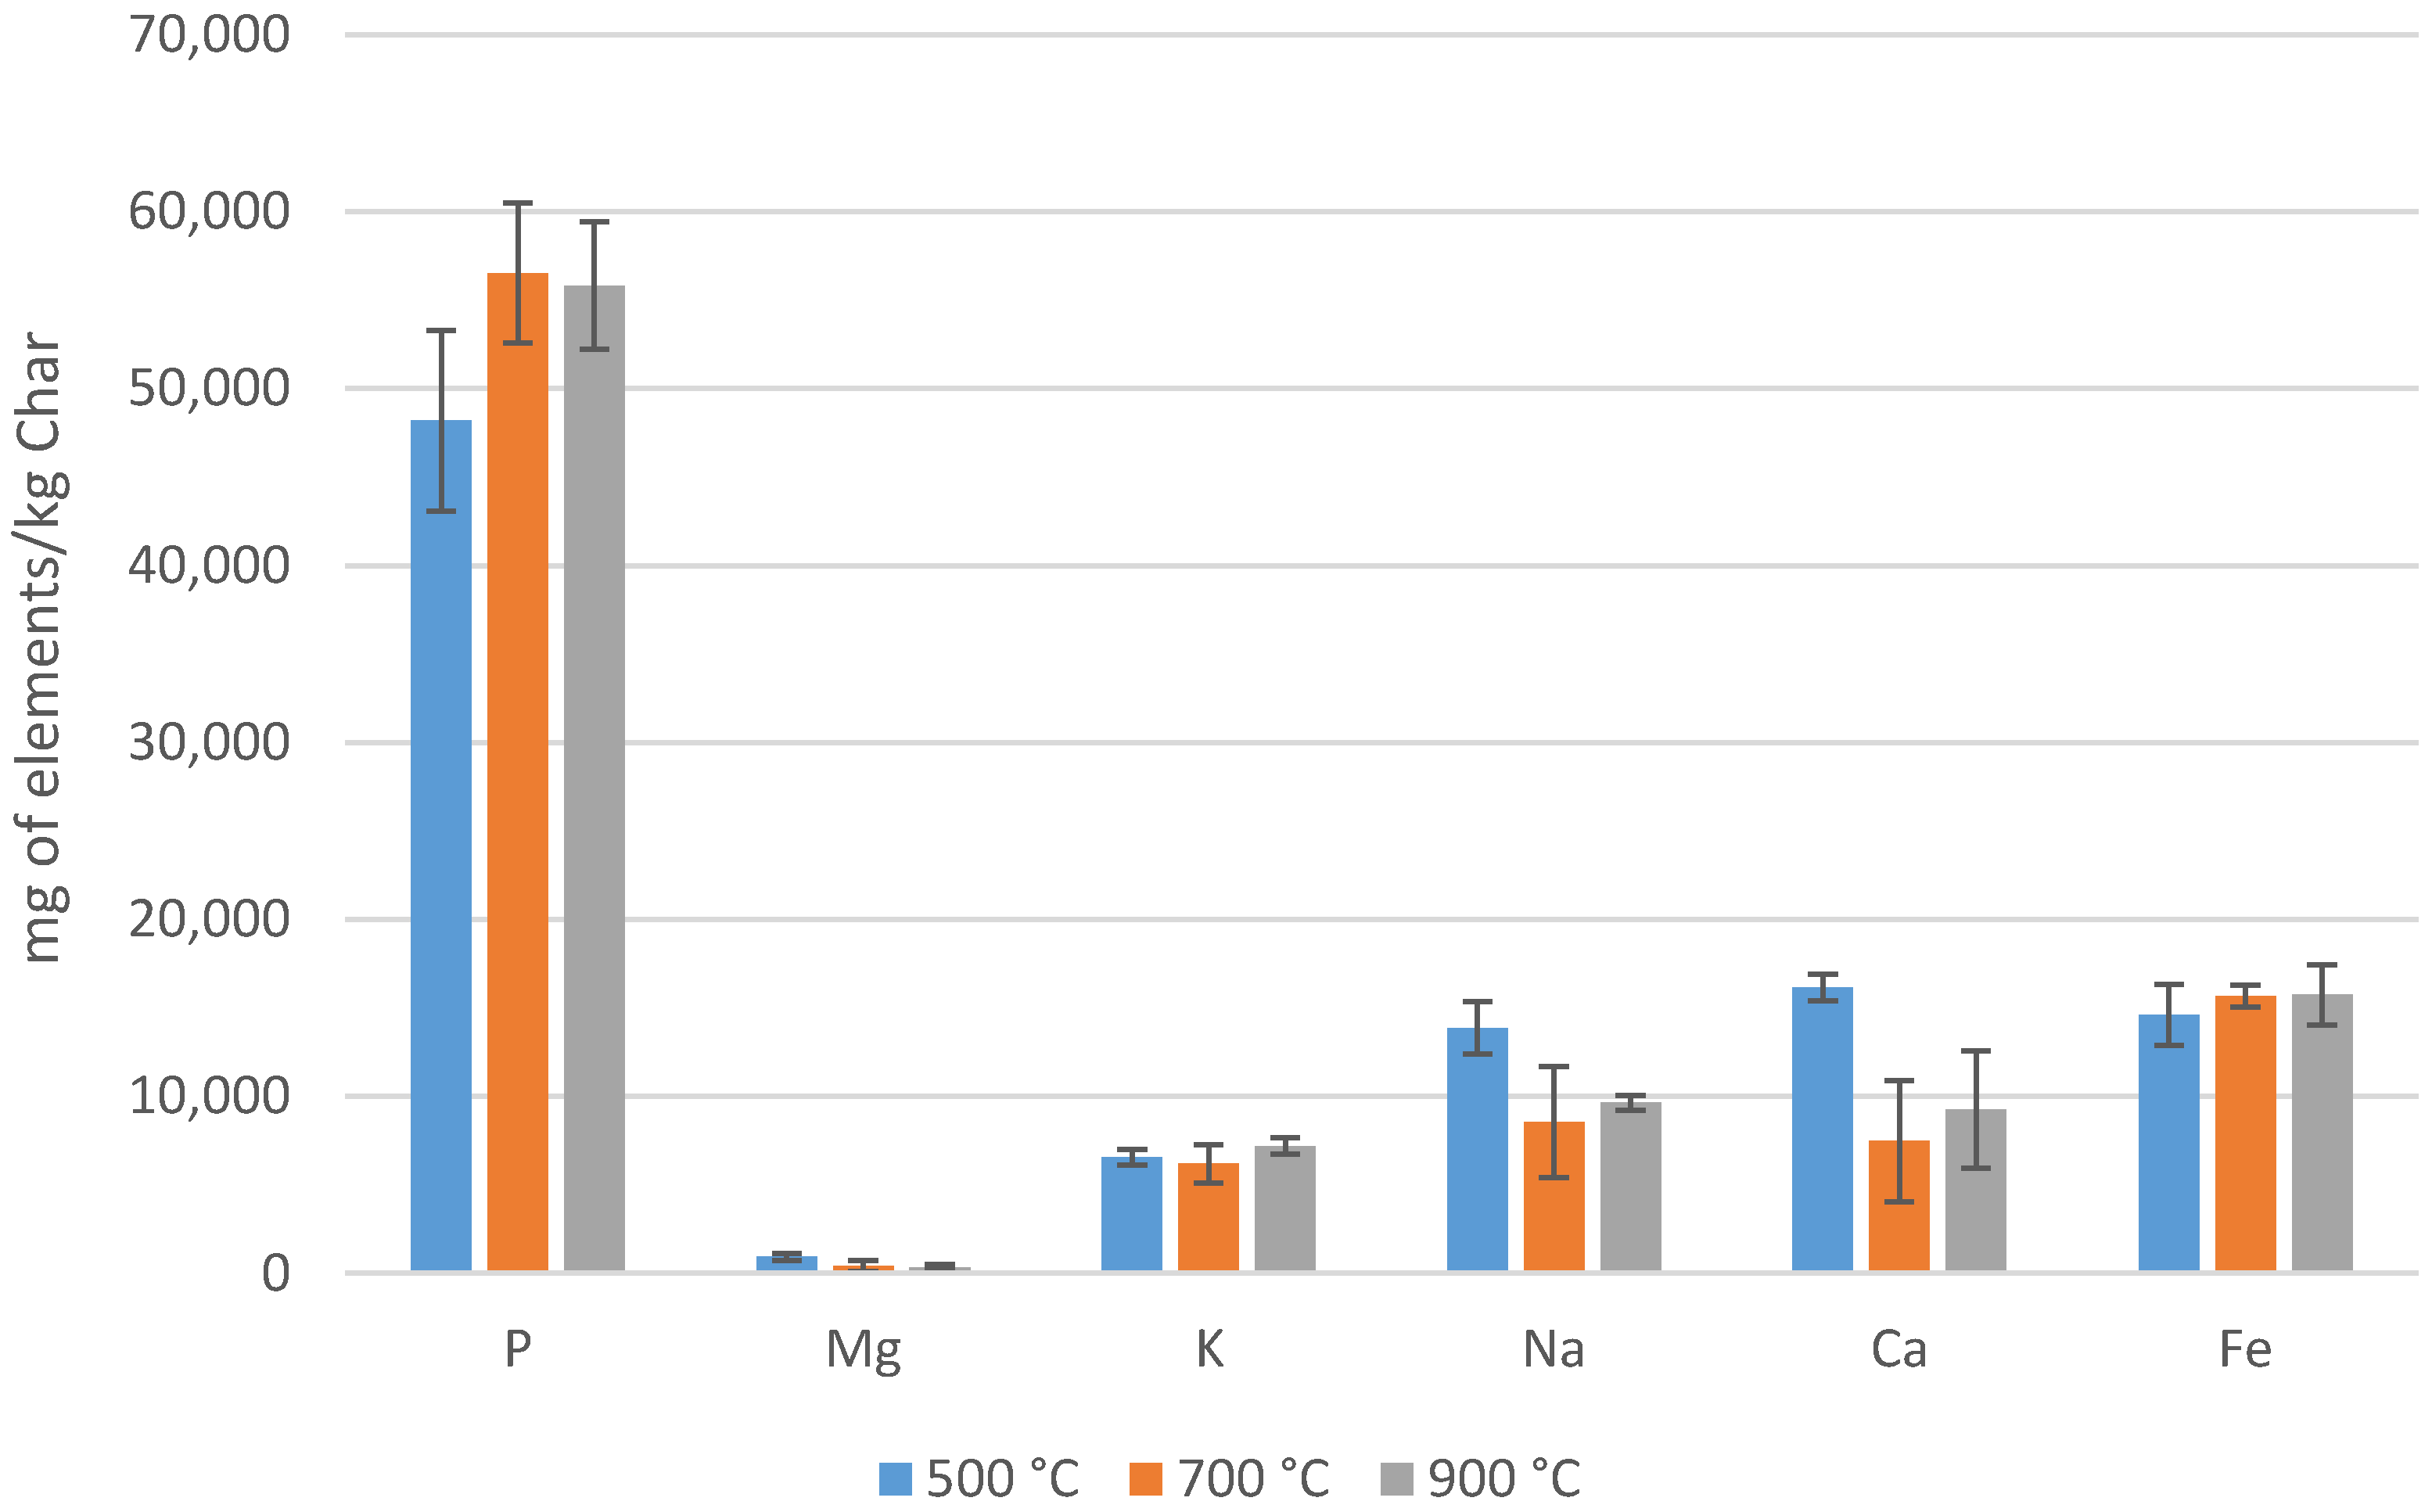
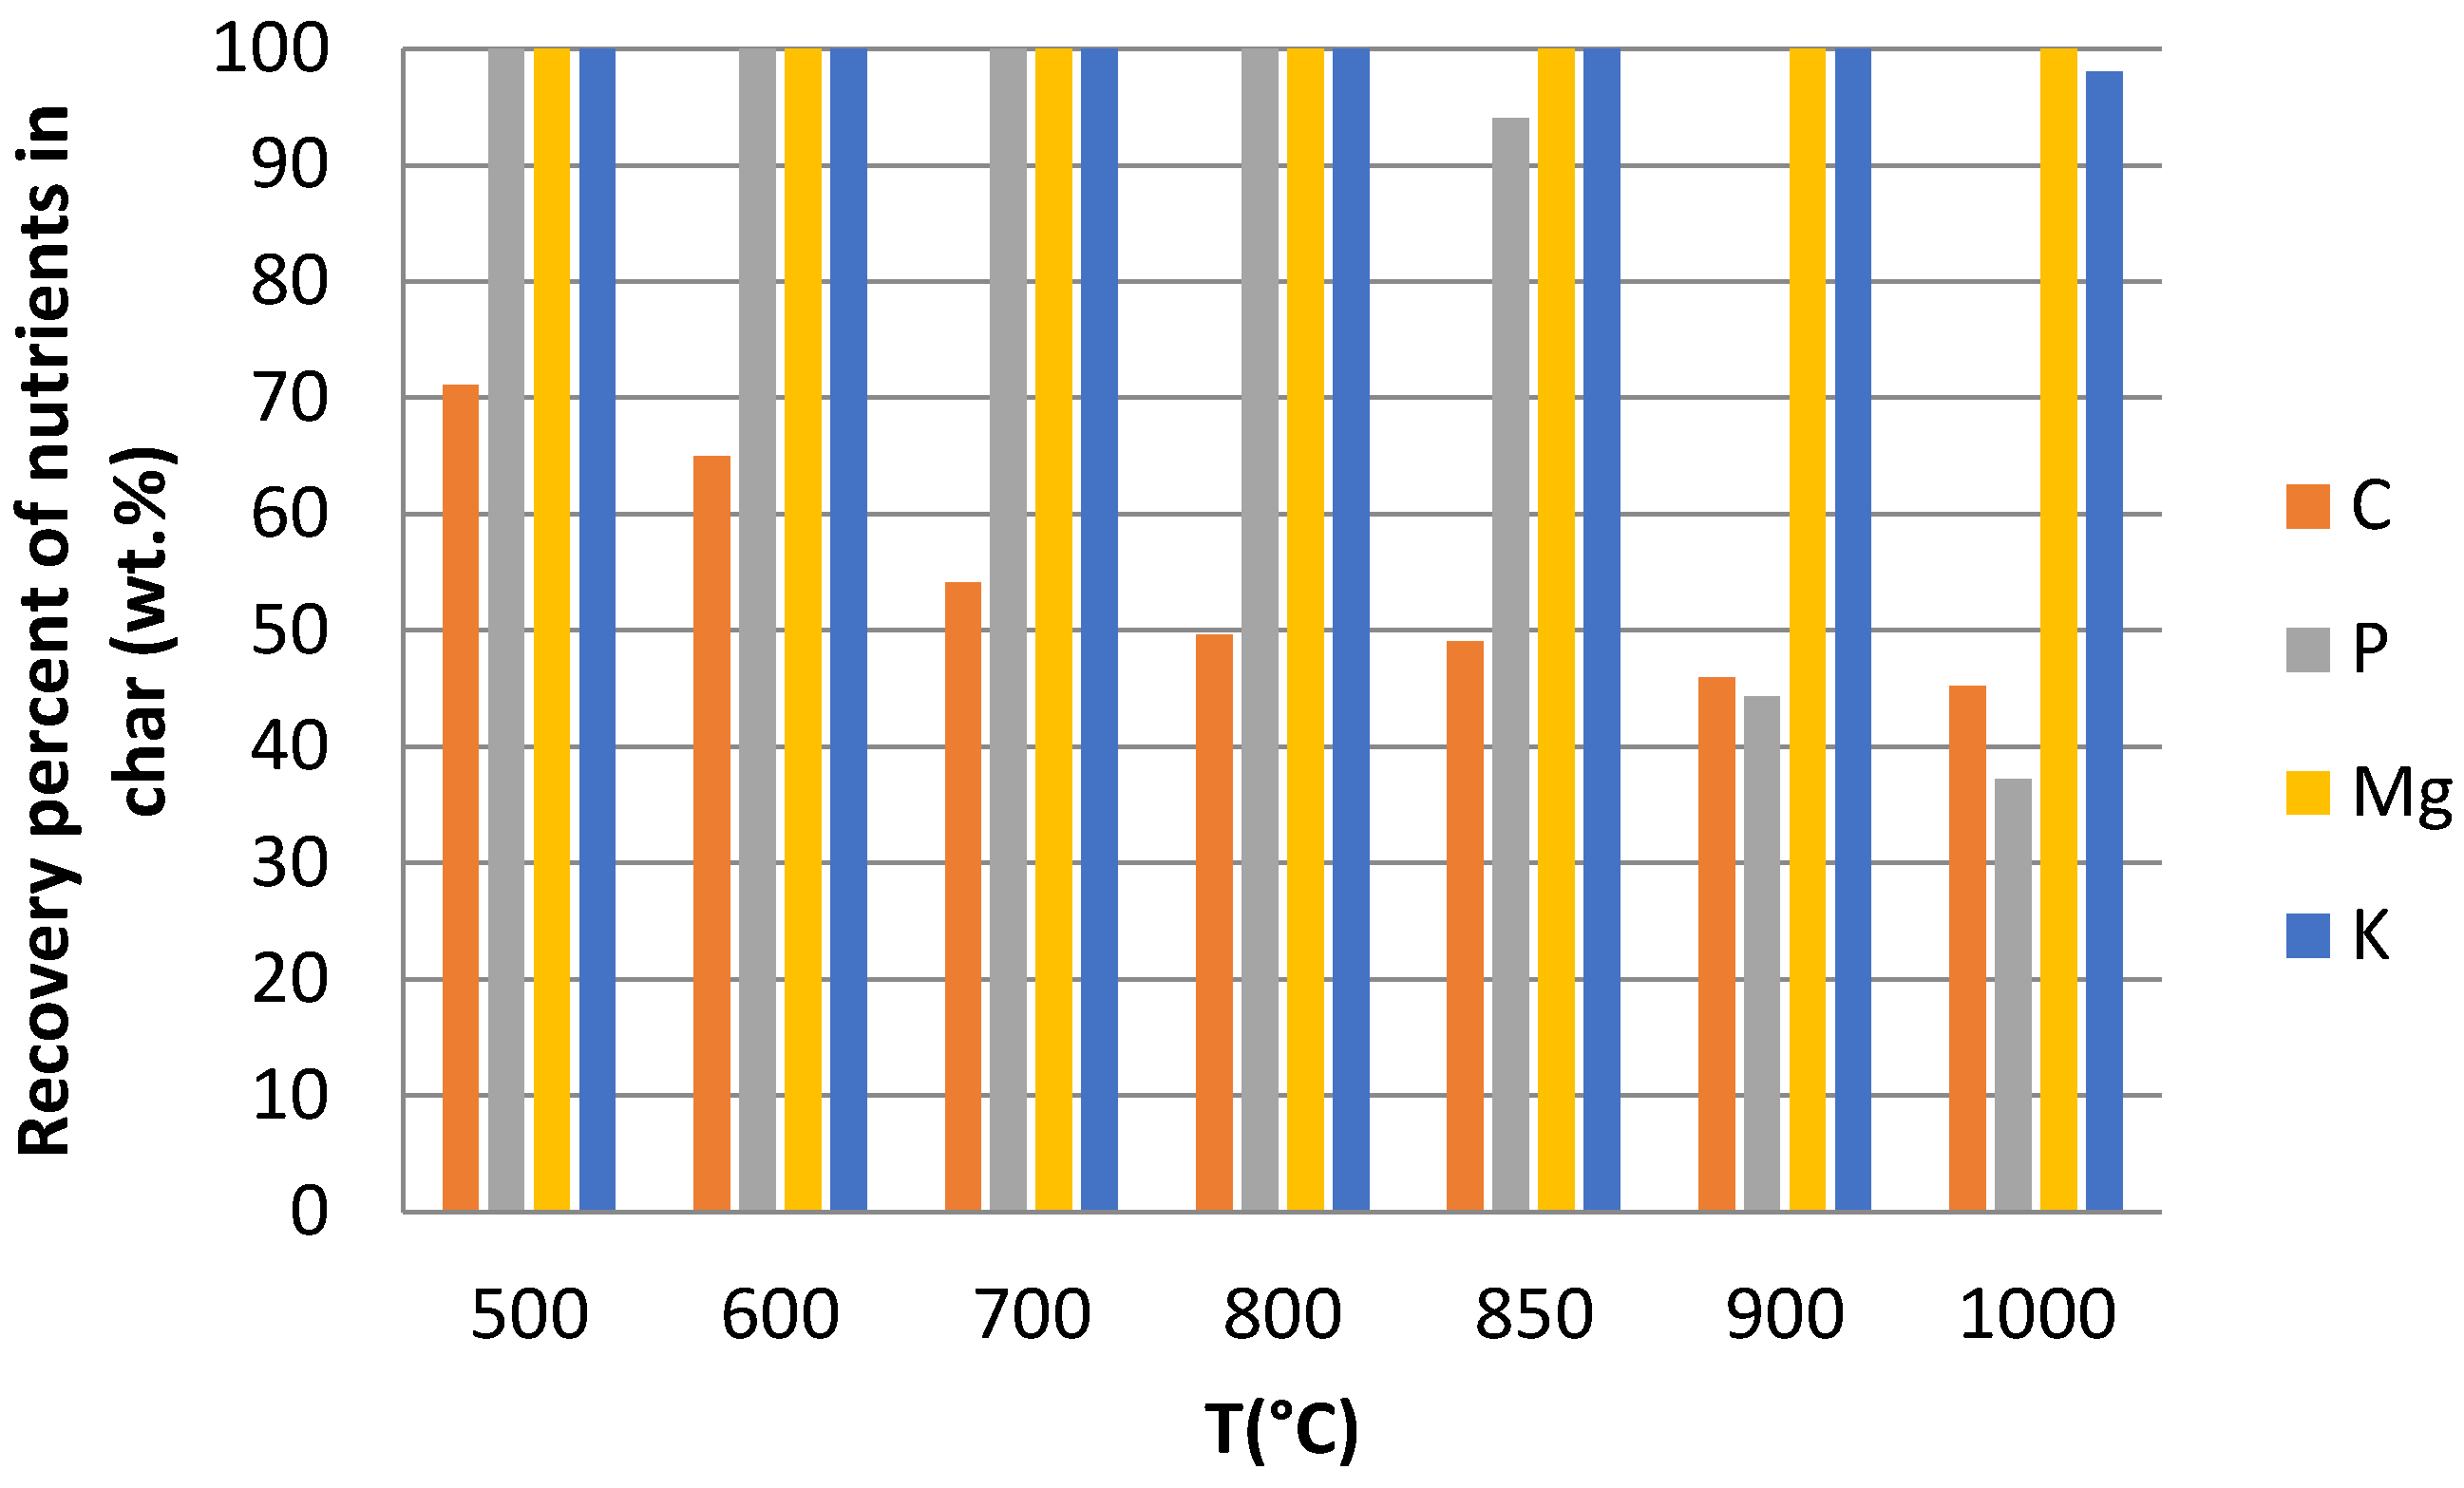
Phosphorous and Other Nutrients

Figure 7 shows the total concentration of elements, which are important nutrients present in the wastewater treatment sludge and the sludge char. The amount of Fe increased in the char created at 500, 700, and 900 °C with respect to the original DSS. For instance, comparing Figure 7 and Table 1, at a temperature of 900 °C, the content of Fe in the char after pyrolysis reaction reaches 15g Fe per kg char compared to 3.8 g per kg DSS, which clearly indicates that Fe remained in the solid state after pyrolysis. In the case of Mg, the concentration dropped significantly, when going from 500 to 700 °C; however, the difference between 700 and 900 °C was much smaller. Ca decreased constantly with increased temperature from 500 to 900 °C. The highest availability of Na and K was found at 500 and 900 °C, respectively. P was the desired element in the char in the current pyrolysis process. Considering Figure 7 and Table 5, it was revealed that retention of P in the char was about 100% at temperature 700 °C, while the concentration of P declined in the char after pyrolysis at 900 °C which was also supported by the thermal equilibrium calculations below.
It has been observed in other studies that pyrolysis generally results in high P availability in plants compared to incineration [38] and the higher temperature from 300 °C to 700 °C increases the P bioavailability [16]; however, the char yield decreases at higher temperatures.

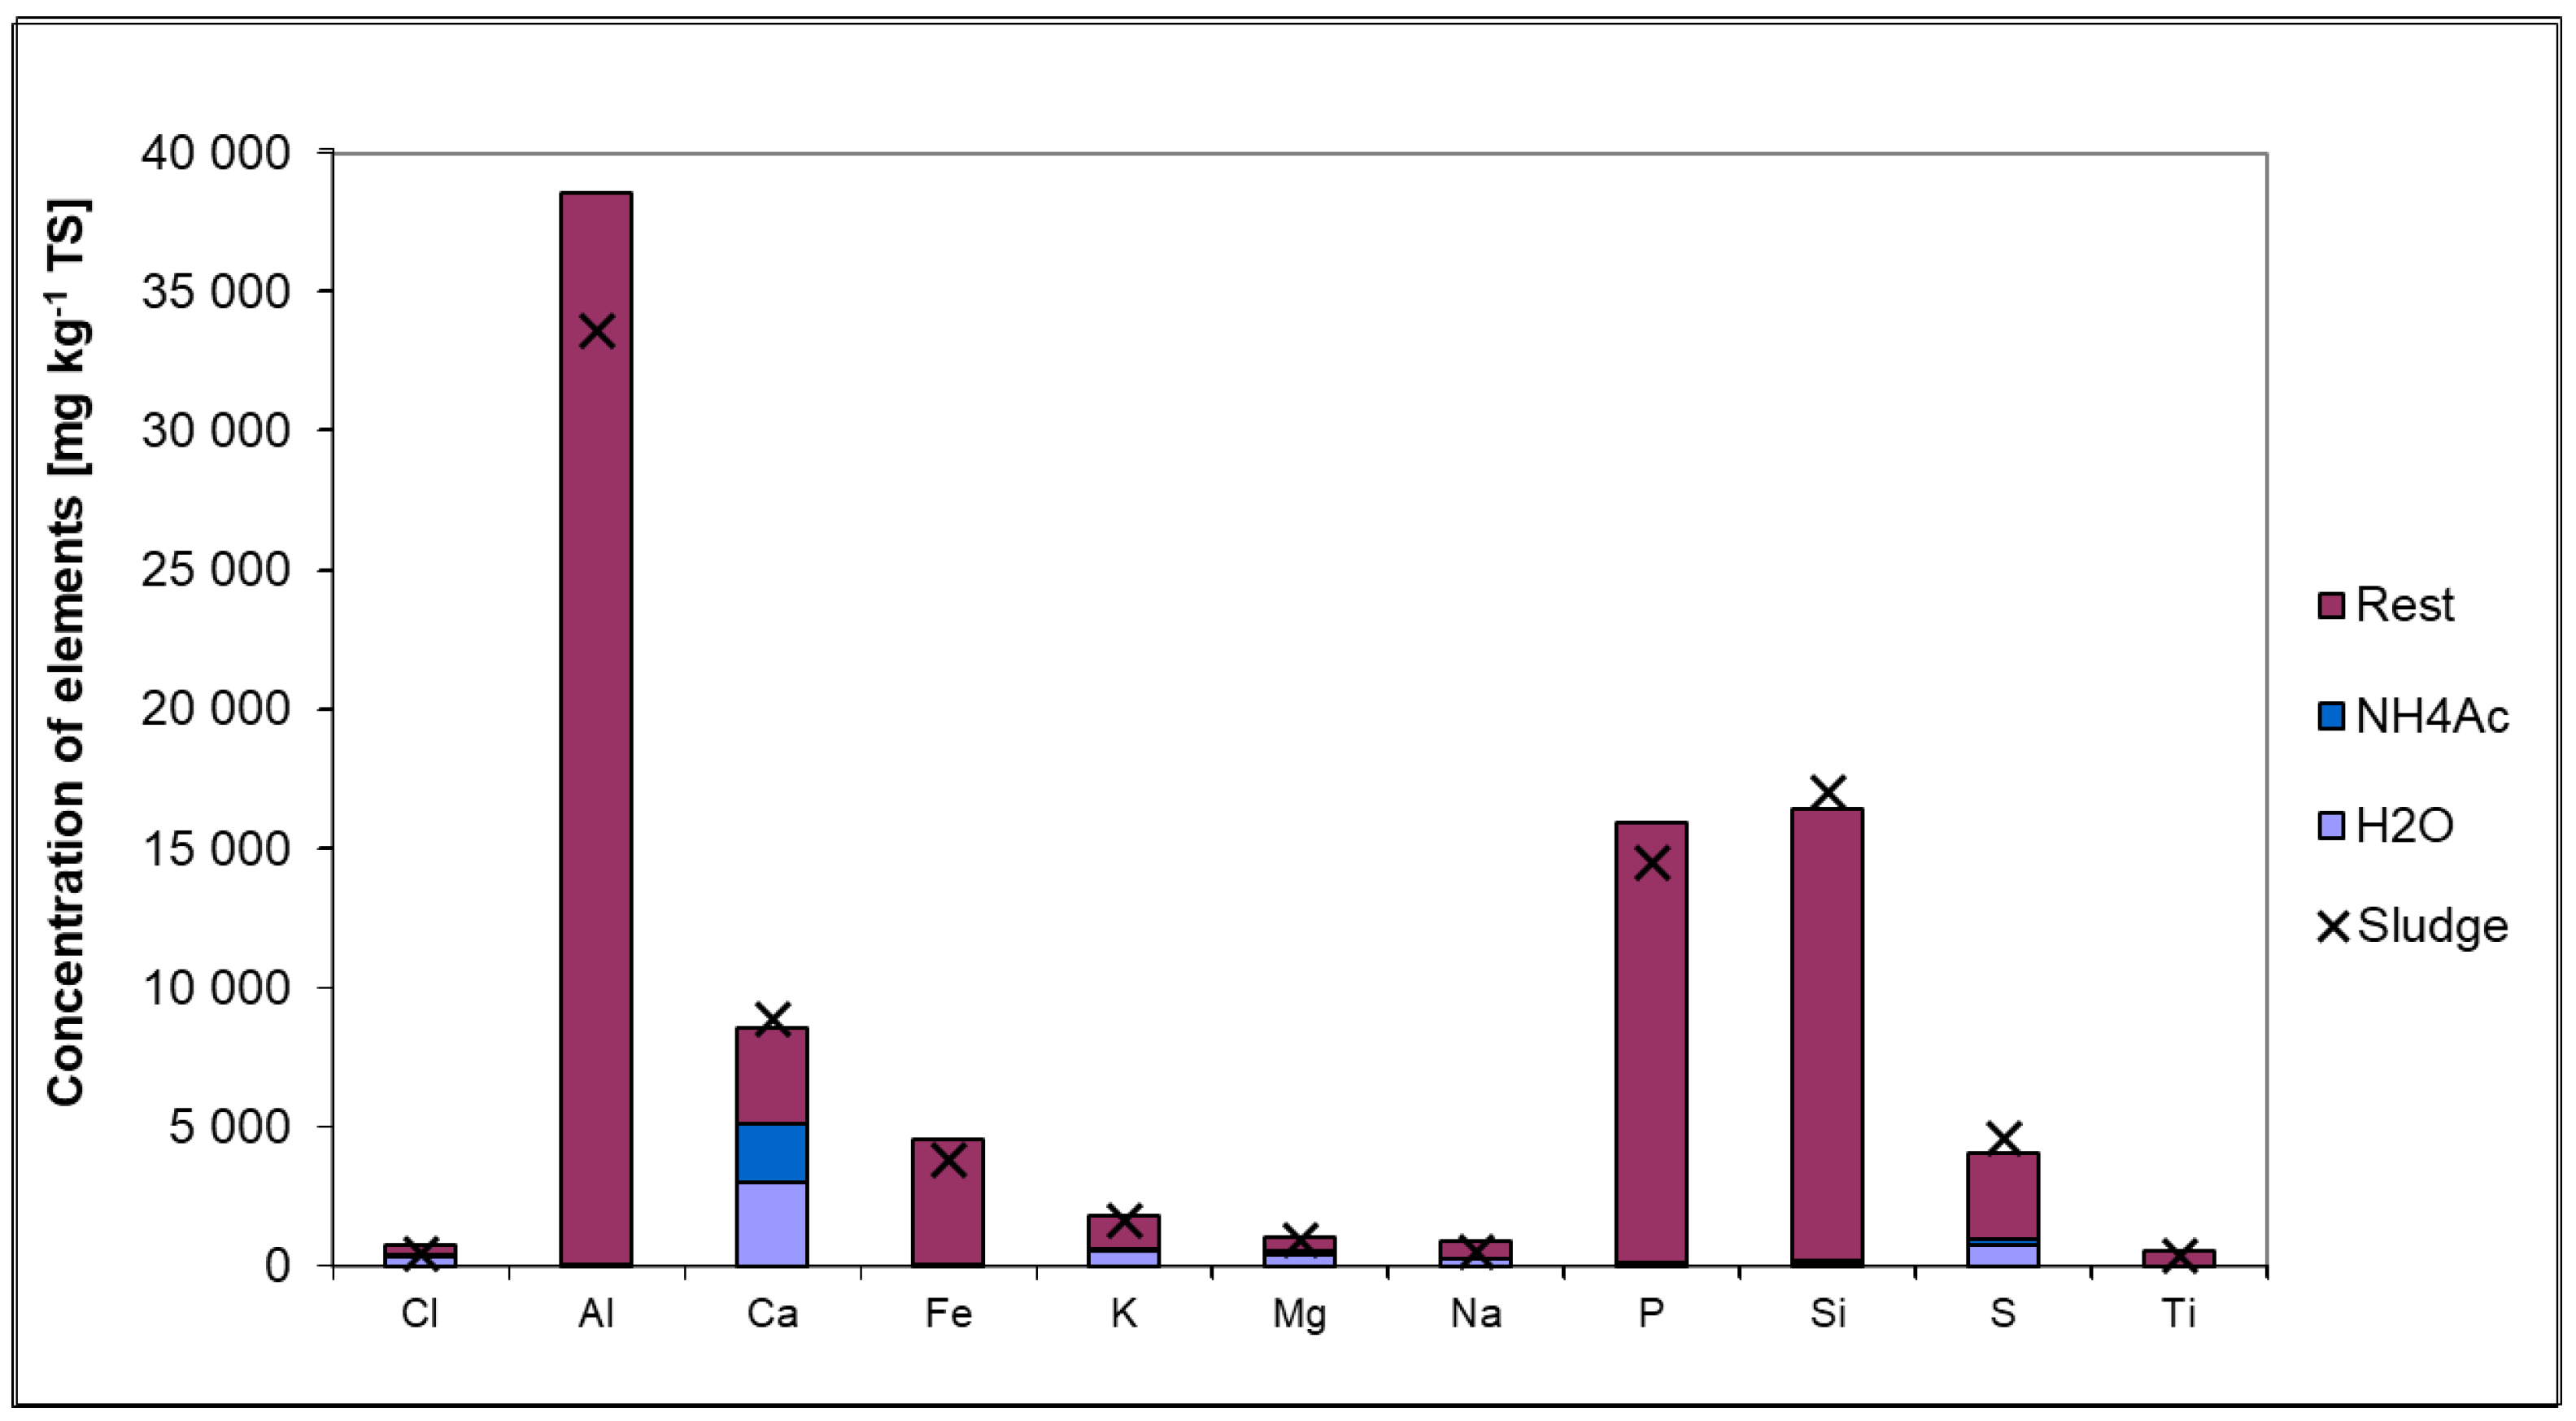
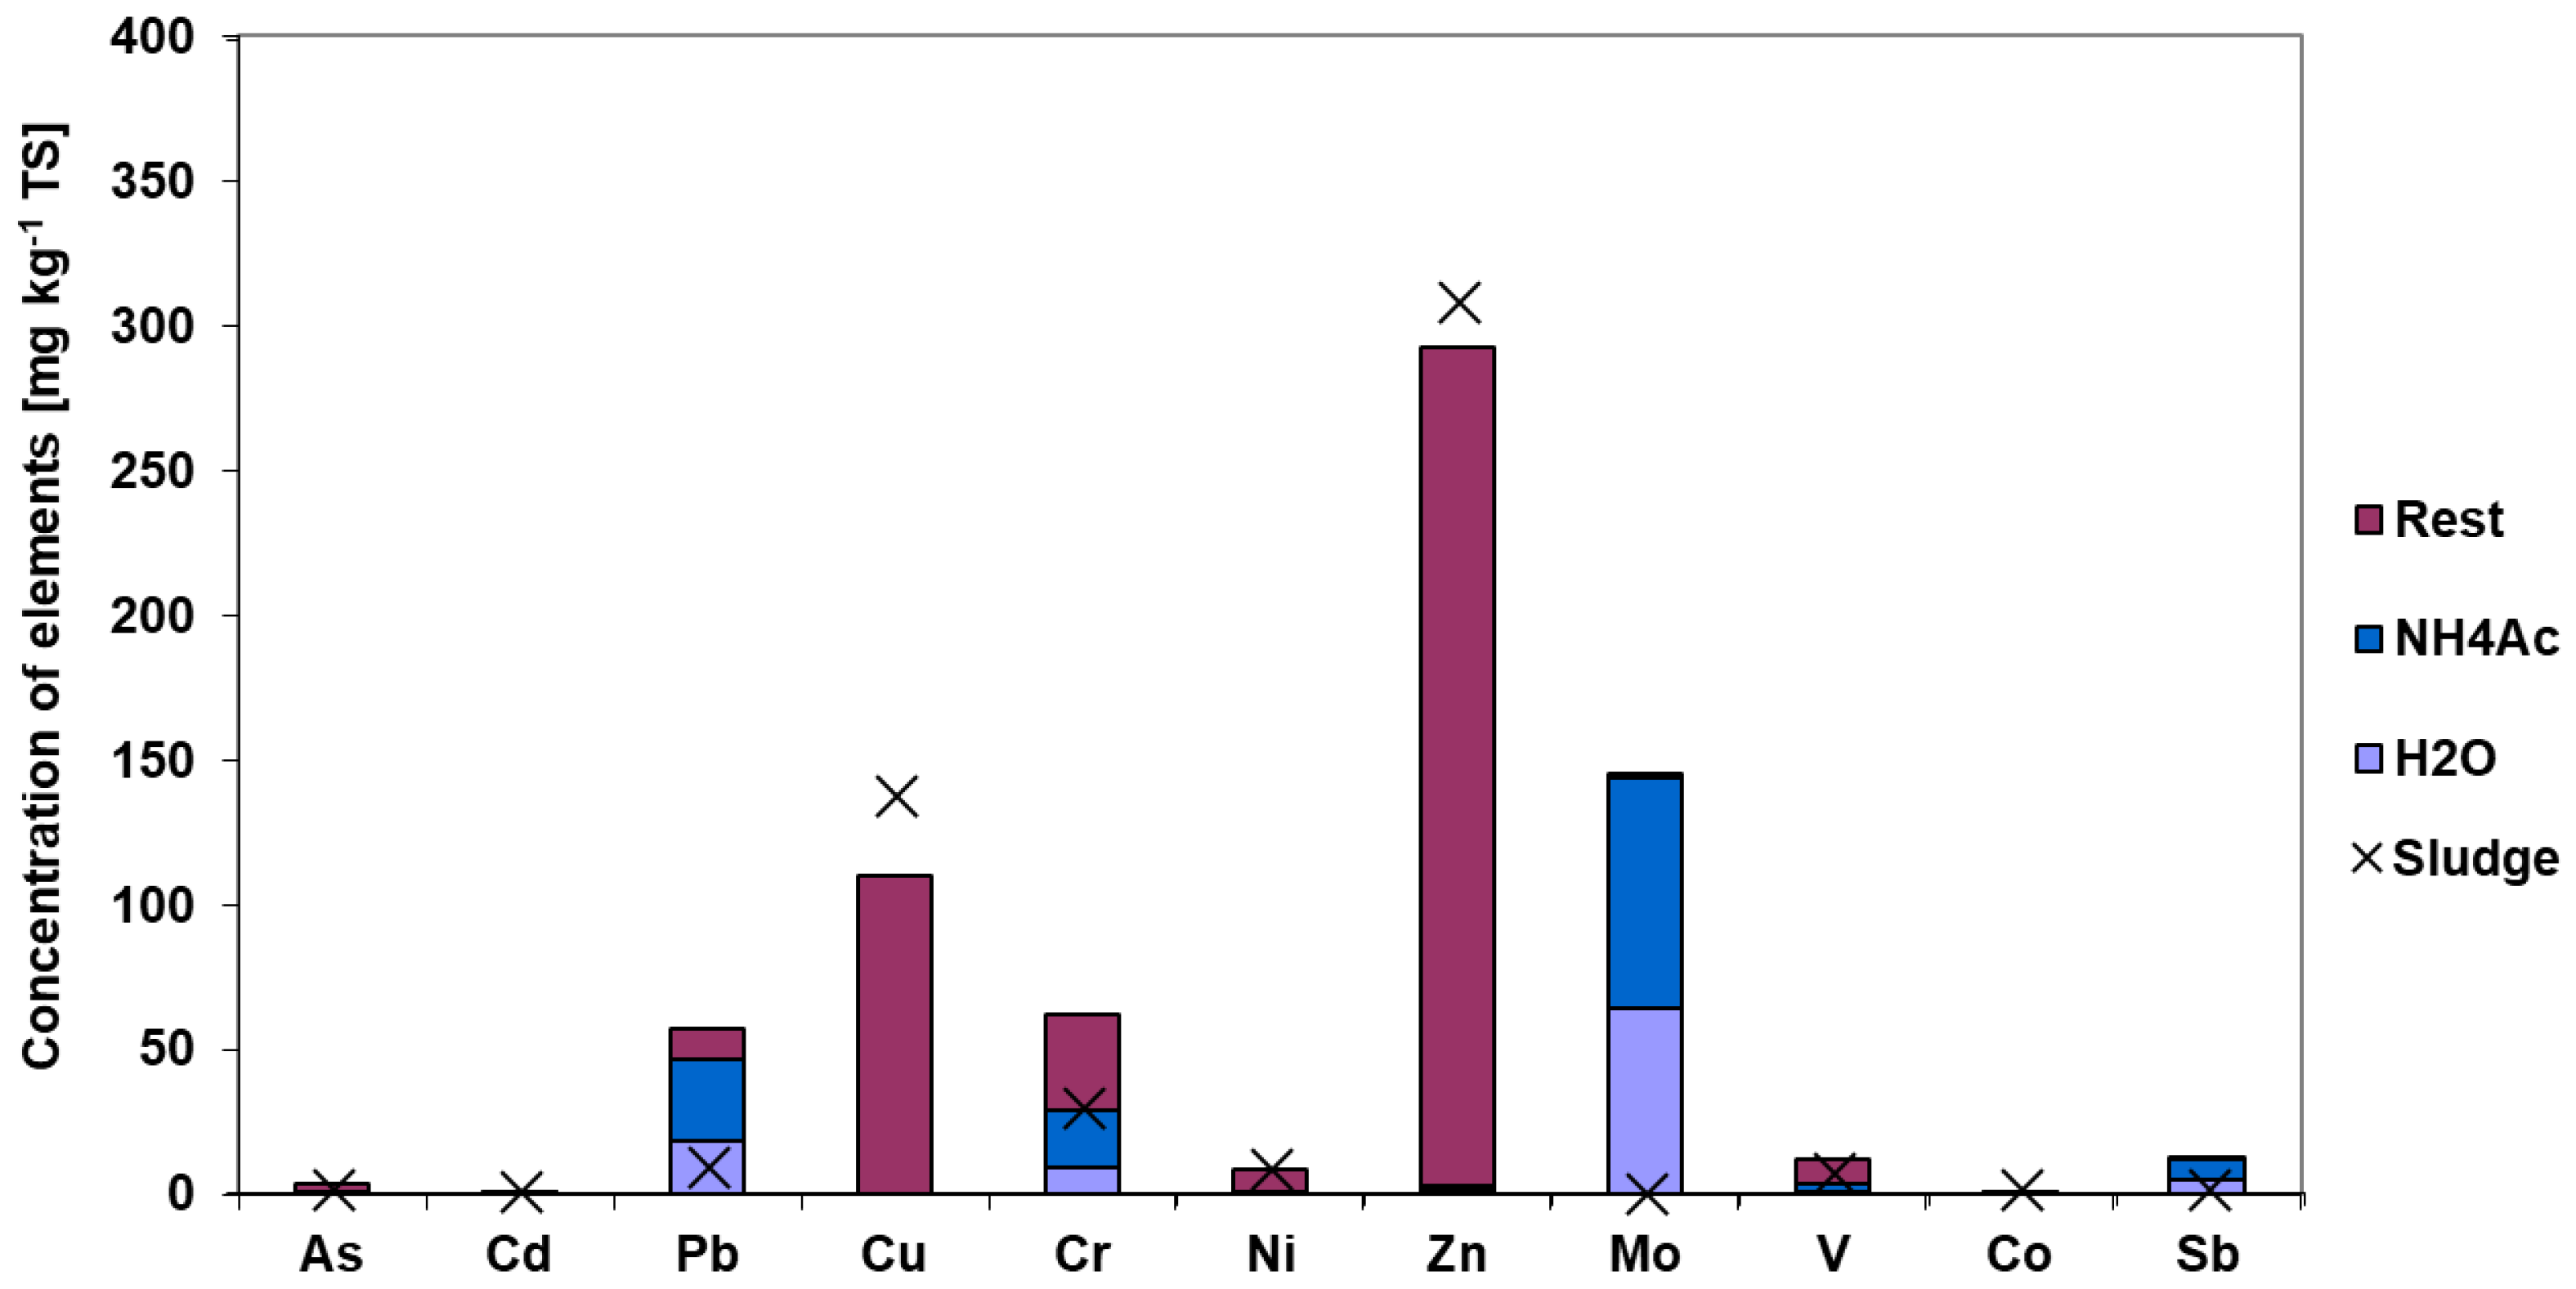
3.3. Chemical Fractionation

The reactive and non-reactive fractions of the ash-forming elements are important in order to understand the char behavior during thermal conversion of biomass such as pyrolysis of sewage sludge [20,23,39]. The soluble and non-soluble fractions of the main elements and the heavy metals following chemical fractionation are represented in Figure 8 and Figure 9. The distribution of P in the applied solvents and the insoluble part shows that most of the P remained in the solid residue. This result is supported by previous findings [22]. The sewage sludge mostly contains an inorganic form of P, due to the primary sedimentation process and by removing the phosphate settling of the insoluble precipitates [16]. As can be seen in Figure 8, most of the P, Al, and Fe remained in the solid residue. It is mainly because P is highly associated with metal/inorganic compounds as a result of the precipitation process with Al-salts, Fe-salts, or lime. The proportion of Na, K, and Mg left in the solid remaining reflects the bonds, which are harder in the char than in the sewage sludge. Another finding was the high solubility of Cl, indicated by the negligible concentration of Cl in the char. This high solubility confirmed the high reactivity during thermal treatment of the sludge, according to Pettersson’s finding that Cl forms HCl and heavy metals-Cl in the gas phase [22].
According to Figure 9, the amount of heavy metals found in the solid residue from the chemical fractionation is very low compared with the amount of other elements represented in Figure 8. This is because most of the heavy metal contribution is found in the reactive part and is ion-exchangeable; therefore, it is more likely to transfer into the gaseous phase during pyrolysis and separated in the gaseous cleaning system. Mo, Cr, Pb, and Sb have high fractions in water and NH4Ac solubility, indicating that these heavy metals are negligible in the char. However, Cu and Zn are mostly found in the solid residue, thus they have a stronger bond to the solids.

3.4. Equilibrium Product

Equilibrium calculations were performed for the sewage sludge on dry basis. The model contained the less reactive part of the elements P, Na, K, Mg, Fe, Ca, Al, Si, Cl, and the total concentration of C, H, N, and O in the sewage sludge, which was assumed to be reactive. Therefore, to focus on the prediction of the chemical compositions of the char using FactSage, all of the heavy metals were excluded as reactants, except for Zn, due to the high concentration in the residue from the chemical fractionation compared to the other heavy metals, Figure 9.

3.4.1. Char Yield by Equilibrium Calculations

According to the equilibrium calculations, the char yields, consisting of solid carbon and ash after pyrolysis, decreased with increasing pyrolysis temperature, Figure 10. However, at a temperature approximately between 550 and 600 °C, the char yield showed a decrease. In addition, by increasing the temperature up to 750 °C, the rate of mass loss declined steadily. There was an almost constant yield approximately between 750 and 850 °C, while the most sudden mass loss occurred approximately around 850 to 900 °C, where it changed by more than 3%, and between 900 °C and 1000 °C it was almost constant again. At the temperatures from 500 °C to 1000 °C, the total char yields decreased by 13%, while it decreased by 8% by pyrolysis from 500 °C to 750 °C.
According to the thermodynamic equilibrium calculations, the pyrolysis temperature affects the fixed carbon and ash in the char as shown in Figure 11. The thermodynamic equilibrium amount of ash is almost constant in the char after pyrolysis process at all temperatures and it is slightly increased at 850 °C, whereas carbon decreased with increasing temperature from 500 °C to 1000 °C. These calculated results are supported by experimental results from other research [5] as well as in the present study.

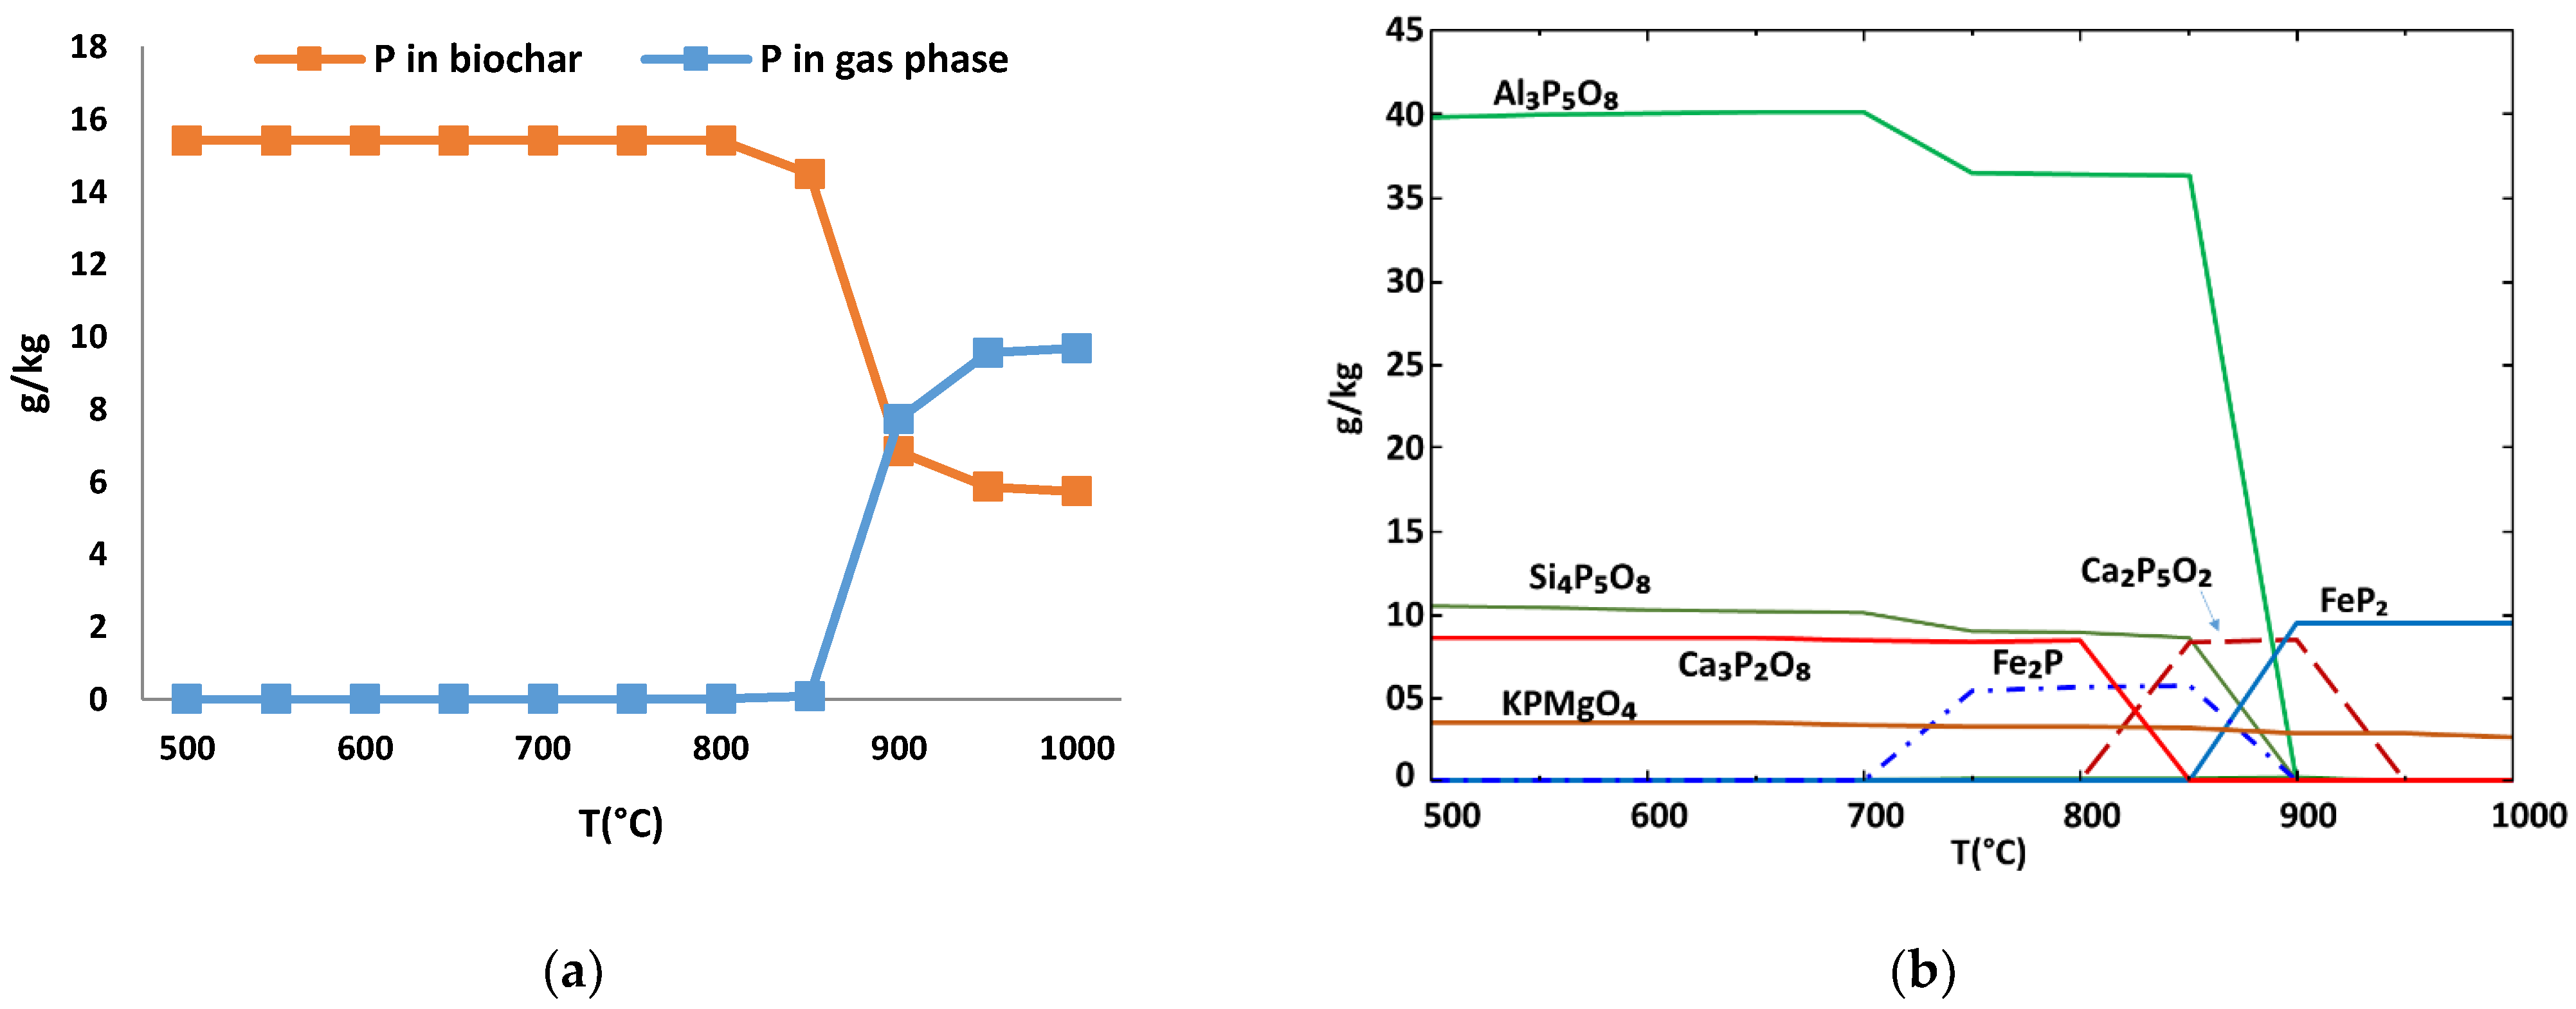
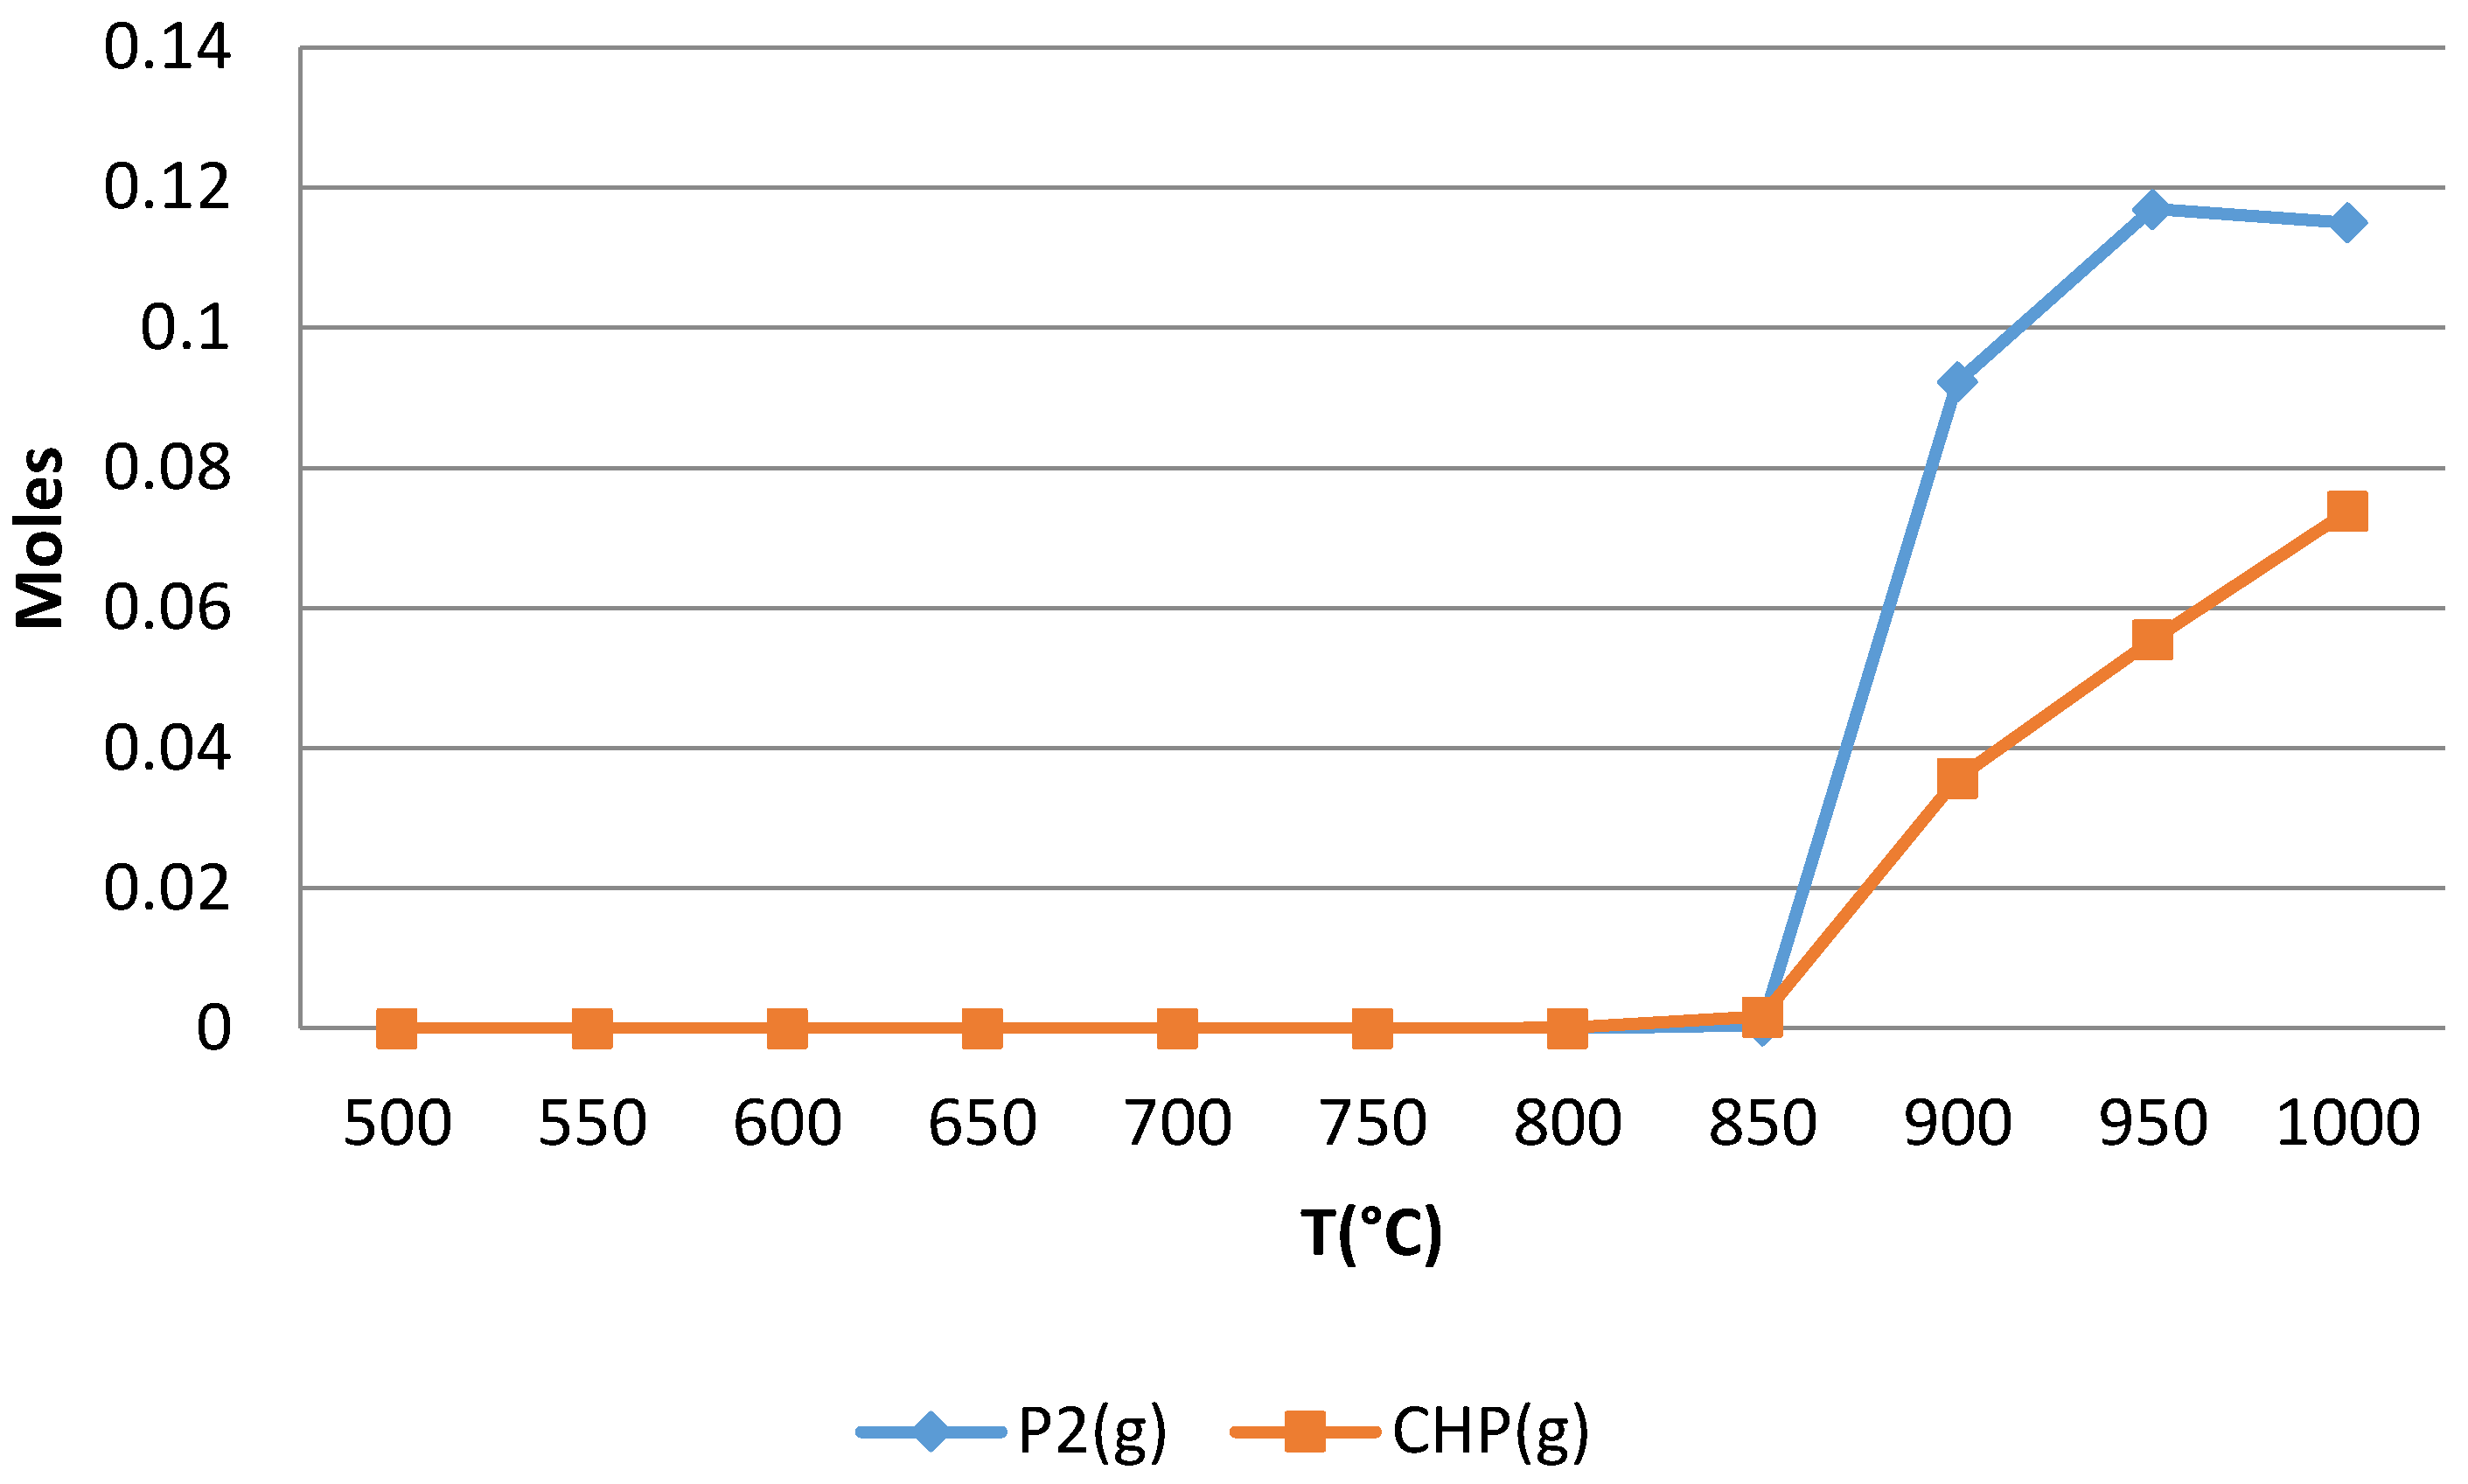
3.4.2. Prediction of the Phase Formation in the Char

The thermodynamic equilibrium calculations indicate that all N in the DSS is transferred from the char to gaseous products from 500 to 1000 °C, mainly because of the volatilization of N compounds at higher pyrolysis temperature. Similarly, previous work conducted by Hossain et al. (2011) found that the available nitrogen in the char can still be conserved below 400 °C in the form of ammonium nitrogen (NH4–N), while nitrate-nitrogen (NO3–N) and other N groups’ volatile matter transferred into the gas at 200 °C during pyrolysis [40]. Figure 12a shows the thermodynamic equilibrium calculation results on the P distribution in the char and the gaseous product. P in the char presents a downward trend above 800 °C. Figure 12b represents the thermodynamically stable P compounds at different pyrolysis temperatures. The calculated P species are in agreement with the experiment results from previous studies [8], showing that all P is associated with Al, K, Ca, Mg, and Fe in the inorganic crystal structure and inorganic solution matter.
The highest mass fraction of P can be found in the Al phosphate compound, Figure 12b. Due to the P precipitation process in the wastewater treatment which was performed with Al-based chemicals, in this case, it was expected to form a certain Al-P compound in the simulated char that was left in the residue; experimental results investigated in the literature support these findings as well [6,8].
KPMgO4 is thermodynamically stable in the entire temperature range from 500 to 1000 °C in the GTOX database. This result supports the chemical fractionation that the K and Mg were left in the residue. The only metal-forming phosphide is Fe, Figure 12b.
The formation of the slag at different temperatures, Figure 13, shows that the P slag starts to form from 650 °C, and P is decreased and released in the form of P2 and CHP gas species at a temperature of 850 °C, Figure 14. Only a few oxides can be found in the slag, which is a result of the reducing atmosphere in the pyrolysis process. This is in line with the results from previous research [8].
The percentage of nutrient recovery can be seen in Figure 15. The recovery of P and C decreases up to 55% and 5%, respectively, with the increasing temperature from 800 °C to 900 °C because of the P and C transferring to the gaseous product, as can be seen in Figure 14. However, due to the slag formation of K-silicate as well as the stability of KPMgO4 in the entire temperature span, the amount of Mg and K in the char is almost constant from 500 °C to 1000 °C and about 100% recovered.
Comparing Table 5 and Figure 15, the experimental results are far from the results obtained from the modeling; this is mainly because of the restrictions of thermodynamics equilibrium calculations, lack of kinetic reactions, and limitations with the databases. In addition, the system is very complicated, with a high number of elements; also, calculations are performed with input data close to the real chemical composition of sewage sludge char. Such calculations with complex input data contribute to uncertain results that could be far from experimental results. Thus, thermodynamic calculations of complex systems, such as sewage sludge, can be used to get an overview of possible reactions and hence predict the direction and explain the ash behavior [6].

4. Conclusions

The present work verified that P remained in the solid char while several heavy metals were released to the gases by the application of the pyrolysis process on dry sewage sludge. A clear result from this investigation was that the pyrolysis temperature was the most important parameter influencing the char’s chemical composition, and the yield of char declines with increasing temperature. No clear dependency of the activation energy on the heating rate was detected, and the activation energy was not increased with increasing heating rate. All the main elements in the original material were found in the char. Additionally, the heating value indicates that there was still a large quantity of C left in the char at the higher temperatures. From the result, it is concluded that in the pyrolysis process, the concentration of As, Cd, and Co decreased significantly in the char. Moreover, as predicted by the chemical fractionation, Cu and Zn were mostly unaffected by the pyrolysis process with respect to the concentration of P in the char. Both experimental and thermodynamic equilibrium calculations confirmed that over 90% of the P remained in the char up to 850 °C. Therefore, a clear understanding from this work was that to achieve a char with a maximum amount of nutrients useful either as a soil improvers or for further refinery in the fertilizer industry, the pyrolysis should be performed below 850 °C since P starts to form gaseous compounds, while K, Na, and Mg are still in a solid-state.

Author Contributions

Conceptualization, methodology, and formal analysis, N.V., L.-E.Å., A.C., T.R. and A.P.; investigation, N.V., L.-E.Å., A.C., T.R. and A.P.; validation, N.V., L.-E.Å., A.C., T.R. and A.P.; writing—original draft preparation, N.V.; writing—review and editing, L.-E.Å., T.R. and A.P.; visualization, N.V.; supervision, L.-E.Å., T.R. and A.P.; project administration A.P. All authors have read and agreed to the published version of the manuscript.

Funding

This research received no external funding.

Data Availability Statement

Not necessary.

Acknowledgments

The authors would also like to acknowledge the research facilities and technical assistance of the Energy lab at University of Borås for the support and equipment regarding the lab scale experiments. The authors would also like to give a special acknowledgement to NODAVA for the supply of municipal sewage sludge.

Conflicts of Interest

The authors declare no conflict of interest.

References

  1. Van Vuuren, D.P.; Bouwman, A.F.; Beusen, A.H.W. Phosphorus demand for the 1970–2100 period: A scenario analysis of resource depletion. Glob. Environ. Chang. 2010, 20, 428–439. [Google Scholar] [CrossRef]
  2. Cordell, D.; Drangert, J.-O.; White, S. The story of phosphorus: Global food security and food for thought. Glob. Environ. Chang. 2009, 19, 292–305. [Google Scholar] [CrossRef]
  3. Kelessidis, A.; Stasinakis, A.S. Comparative study of the methods used for treatment and final disposal of sewage sludge in European countries. Waste Manag. 2012, 32, 1186–1195. [Google Scholar] [CrossRef] [PubMed]
  4. Inglezakis, V.J.; Zorpas, A.A.; Karagiannidis, A.; Samaras, P.; Voukkali, I.; Sklari, S. European union legislation on sewage sludge management. Fresenius Environ. Bull. 2014, 23, 635–639. [Google Scholar]
  5. Song, X.D.; Xue, X.Y.; Chen, D.Z.; He, P.J.; Dai, X.H. Application of biochar from sewage sludge to plant cultivation: Influence of pyrolysis temperature and biochar-to-soil ratio on yield and heavy metal accumulation. Chemosphere 2014, 109, 213–220. [Google Scholar] [CrossRef]
  6. Adam, C.; Peplinski, B.; Michaelis, M.; Kley, G.; Simon, F.G. Thermochemical treatment of sewage sludge ashes for phosphorus recovery. Waste Manag. 2009, 29, 1122–1128. [Google Scholar] [CrossRef]
  7. Nordin, A.; Strandberg, A.; Elbashir, S.; Åmand, L.-E.; Skoglund, N.; Pettersson, A. Co-Combustion of Municipal Sewage Sludge and Biomass in a Grate Fired Boiler for Phosphorus Recovery in Bottom Ash. Energies 2020, 13, 1708. [Google Scholar] [CrossRef] [Green Version]
  8. Thomsen, T.P.; Sárossy, Z.; Ahrenfeldt, J.; Henriksen, U.B.; Frandsen, F.J.; Müller-Stöver, D.S. Changes imposed by pyrolysis, thermal gasification and incineration on composition and phosphorus fertilizer quality of municipal sewage sludge. J. Environ. Manag. 2017, 198, 308–318. [Google Scholar] [CrossRef] [Green Version]
  9. Hossain, M.K.; Strezov, V.; Yin Chan, K.; Nelson, P.F. Agronomic properties of wastewater sludge biochar and bioavailability of metals in production of cherry tomato (Lycopersicon esculentum). Chemosphere 2010, 78, 1167–1171. [Google Scholar] [CrossRef]
  10. Méndez, A.; Gómez, A.; Paz-Ferreiro, J.; Gascó, G. Effects of sewage sludge biochar on plant metal availability after application to a Mediterranean soil. Chemosphere 2012, 89, 1354–1359. [Google Scholar] [CrossRef]
  11. Méndez, A.; Tarquis, A.M.; Saa-Requejo, A.; Guerrero, F.; Gascó, G. Influence of pyrolysis temperature on composted sewage sludge biochar priming effect in a loamy soil. Chemosphere 2013, 93, 668–676. [Google Scholar] [CrossRef]
  12. Han, H.; Hu, S.; Syed-Hassan, S.S.A.; Xiao, Y.; Wang, Y.; Xu, J.; Jiang, L.; Su, S.; Xiang, J. Effects of reaction conditions on the emission behaviors of arsenic, cadmium and lead during sewage sludge pyrolysis. Bioresour. Technol. 2017, 236, 138–145. [Google Scholar] [CrossRef]
  13. Lu, H.; Chen, H.; Li, W.; Li, B. Occurrence and volatilization behavior of Pb, Cd, Cr in Yima coal during fluidized-bed pyrolysis☆. Fuel 2004, 83, 39–45. [Google Scholar] [CrossRef]
  14. Farrell, M.; Jones, D.L. Heavy metal contamination of a mixed waste compost: Metal speciation and fate. Bioresour. Technol. 2009, 100, 4423–4432. [Google Scholar] [CrossRef]
  15. Conesa, J.A.; Font, R.; Fullana, A.; Martín-Gullón, I.; Aracil, I.; Gálvez, A.; Moltó, J.; Gómez-Rico, M.F. Comparison between emissions from the pyrolysis and combustion of different wastes. J. Anal. Appl. Pyrolysis 2009, 84, 95–102. [Google Scholar] [CrossRef] [Green Version]
  16. Hossain, M.K.; Strezov, V.; Chan, K.Y.; Ziolkowski, A.; Nelson, P.F. Influence of pyrolysis temperature on production and nutrient properties of wastewater sludge biochar. J. Environ. Manag. 2011, 92, 223–228. [Google Scholar] [CrossRef]
  17. Zhang, Q.; Liu, H.; Liu, P.; Hu, H.; Yao, H. Pyrolysis characteristics and kinetic analysis of different dewatered sludge. Bioresour. Technol. 2014, 170, 325–330. [Google Scholar] [CrossRef]
  18. Zhu, X.; Zhao, L.; Fu, F.; Yang, Z.; Li, F.; Yuan, W.; Zhou, M.; Fang, W.; Zhen, G.; Lu, X.; et al. Pyrolysis of pre-dried dewatered sewage sludge under different heating rates: Characteristics and kinetics study. Fuel 2019, 255, 115591. [Google Scholar] [CrossRef]
  19. Leroy, V.; Cancellieri, D.; Leoni, E.; Rossi, J.-L. Kinetic study of forest fuels by TGA: Model-free kinetic approach for the prediction of phenomena. Thermochim. Acta 2010, 497, 1–6. [Google Scholar] [CrossRef] [Green Version]
  20. Zevenhoven, M.; Yrjas, P.; Skrifvars, B.-J.; Hupa, M. Characterization of Ash-Forming Matter in Various Solid Fuels by Selective Leaching and Its Implications for Fluidized-Bed Combustion. Energy Fuels 2012, 26, 6366–6386. [Google Scholar] [CrossRef]
  21. Baxter, L.L.; Miles, T.R.; Miles, T.R.; Jenkins, B.M.; Milne, T.; Dayton, D.; Bryers, R.W.; Oden, L.L. The behavior of inorganic material in biomass-fired power boilers: Field and laboratory experiences. Fuel Process. Technol. 1998, 54, 47–78. [Google Scholar] [CrossRef]
  22. Pettersson, A. Characterisation of Fuels and Fly Ashes from Co-Combustion of Biofuels and Waste Fuels in a Fluidised Bed Boiler. A Phosphorus and Alkali Perspective. Ph.D. Thesis, Comprehensive Summary. Chalmers Tekniska Högskola, Göteborg, Sweden, 2008. [Google Scholar]
  23. Moradian, F.; Tchoffor, P.A.; Davidsson, K.O.; Pettersson, A.; Backman, R. Thermodynamic equilibrium prediction of bed agglomeration tendency in dual fluidized-bed gasification of forest residues. Fuel Process. Technol. 2016, 154, 82–90. [Google Scholar] [CrossRef]
  24. Moradian, F. Co-Combustion of Municipal Solid Waste and Animal Waste: Experiment and Simulation Studies. Ph.D. Thesis, University of Borås, School of Engineering, Borås, Sweden, 2013. [Google Scholar]
  25. Falk, J.; Skoglund, N.; Grimm, A.; Öhman, M. Systematic Evaluation of the Fate of Phosphorus in Fluidized Bed Combustion of Biomass and Sewage Sludge. Energy Fuels 2020, 34, 3984–3995. [Google Scholar] [CrossRef]
  26. Elled, A.-L. Co-Combustion of Biomass and Waste Fuels in a Fluidised Bed Boiler: Fuel Synergism. Ph.D. Thesis, Chalmers University of Technology, Göteborg, Sweden, 2008. [Google Scholar]
  27. Liu, J.; Fu, J.; Ning, X.; Sun, S.; Wang, Y.; Xie, W.; Huang, S.; Zhong, S. An experimental and thermodynamic equilibrium investigation of the Pb, Zn, Cr, Cu, Mn and Ni partitioning during sewage sludge incineration. J. Environ. Sci. 2015, 35, 43–54. [Google Scholar] [CrossRef]
  28. Lindberg, D.; Backman, R.; Chartrand, P.; Hupa, M. Towards a comprehensive thermodynamic database for ash-forming elements in biomass and waste combustion—Current situation and future developments. Fuel Process. Technol. 2013, 105, 129–141. [Google Scholar] [CrossRef]
  29. Hannl, T.K.; Sefidari, H.; Kuba, M.; Skoglund, N.; Öhman, M. Thermochemical equilibrium study of ash transformation during combustion and gasification of sewage sludge mixtures with agricultural residues with focus on the phosphorus speciation. Biomass Convers. Biorefinery 2021, 11, 57–68. [Google Scholar] [CrossRef]
  30. Bale, C.W.; Bélisle, E.; Chartrand, P.; Decterov, S.A.; Eriksson, G.; Hack, K.; Jung, I.H.; Kang, Y.B.; Melançon, J.; Pelton, A.D.; et al. FactSage thermochemical software and databases—Recent developments. Calphad 2009, 33, 295–311. [Google Scholar] [CrossRef]
  31. Arnout, S.; Nagels, E. Modelling thermal phosphorus recovery from sewage sludge ash. Calphad 2016, 55, 26–31. [Google Scholar] [CrossRef]
  32. Fraissler, G.; Jöller, M.; Mattenberger, H.; Brunner, T.; Obernberger, I. Thermodynamic equilibrium calculations concerning the removal of heavy metals from sewage sludge ash by chlorination. Chem. Eng. Process. Process Intensif. 2009, 48, 152–164. [Google Scholar] [CrossRef]
  33. Jakob, A.; Stucki, S.; Kuhn, P. Evaporation of Heavy Metals during the Heat Treatment of Municipal Solid Waste Incinerator Fly Ash. Environ. Sci. Technol. 1995, 29, 2429–2436. [Google Scholar] [CrossRef]
  34. Corella, J.; Toledo, J.M. Incineration of doped sludges in fluidized bed. Fate and partitioning of six targeted heavy metals. I. Pilot plant used and results. J. Hazard. Mater. 2000, 80, 81–105. [Google Scholar] [CrossRef]
  35. Roberts, T.L. Cadmium and Phosphorous Fertilizers: The Issues and the Science. Procedia Eng. 2014, 83, 52–59. [Google Scholar] [CrossRef] [Green Version]
  36. Strehlow, C.D.; Barltrop, D. Health studies. Sci. Total Environ. 1988, 75, 101–133. [Google Scholar] [CrossRef]
  37. Frandsen, F.; Dam-Johansen, K.; Rasmussen, P. Trace elements from combustion and gasification of coal—An equilibrium approach. Prog. Energy Combust. Sci. 1994, 20, 115–138. [Google Scholar] [CrossRef]
  38. Jeon, S.; Kim, D.-J. Enhanced phosphorus bioavailability and heavy metal removal from sewage sludge ash through thermochemical treatment with chlorine donors. J. Ind. Eng. Chem. 2018, 58, 216–221. [Google Scholar] [CrossRef]
  39. Piotrowska, P.; Zevenhoven, M.; Davidsson, K.; Hupa, M.; Åmand, L.-E.; Barišić, V.; Coda Zabetta, E. Fate of Alkali Metals and Phosphorus of Rapeseed Cake in Circulating Fluidized Bed Boiler Part 1: Cocombustion with Wood. Energy Fuels 2010, 24, 333–345. [Google Scholar] [CrossRef]
  40. Bagreev, A.; Bashkova, S.; Locke, D.C.; Bandosz, T.J. Sewage Sludge-Derived Materials as Efficient Adsorbents for Removal of Hydrogen Sulfide. Environ. Sci. Technol. 2001, 35, 1537–1543. [Google Scholar] [CrossRef]
Figure 1. Schematic picture showing chemical fractionation combined with the equilibrium calculation for the temperature range of 500–1000 °C.
Energies 14 01477 g001
Figure 2. Material decomposition during sewage sludge pyrolysis at different temperatures between 25 and 850 °C as a function of time.
Energies 14 01477 g002
Figure 3. Kissinger-Akahira-Sunose (KAS) method for various conversions during sewage sludge pyrolysis at different temperatures.
Energies 14 01477 g003
Figure 4. Conversion dependence of the estimated activation energy during sewage sludge pyrolysis.
Energies 14 01477 g004
Figure 5. Wt.% distribution of ash, volatiles, fixed carbon, and moisture at different heating rates using thermogravimetric analysis (TGA). End temperature for all samples was 850 °C.
Energies 14 01477 g005
Figure 6. The measured contents of the selected heavy metals in the char after sewage sludge pyrolysis at different temperatures; error bars represent standard deviation of the results.
Energies 14 01477 g006
Figure 7. Recovery of the main nutrients in the char after sewage sludge pyrolysis at different temperatures; error bars represent the standard deviation.
Energies 14 01477 g007
Figure 8. Results of chemical fractionation of sewage sludge (main elements). Crosses represent the total concentration of the element in the sewage sludge.
Energies 14 01477 g008
Figure 9. Results from the chemical fractionation of the sewage sludge (heavy metals); crosses represent the total concentration of the element in the sewage sludge.
Energies 14 01477 g009
Figure 10. Char yield during pyrolysis of sewage sludge at different temperatures calculated in thermodynamic equilibrium condition.
Energies 14 01477 g010
Figure 11. The calculated equilibrium composition of the char from pyrolysis of sewage sludge at different temperatures.
Energies 14 01477 g011
Figure 12. (a) The calculated equilibrium distribution of P in the gaseous product and the char during pyrolysis of sew-age sludge at different temperatures; (b) the calculated equilibrium composition of P-compound during pyrolysis of sewage sludge at different temperatures.
Energies 14 01477 g012
Figure 13. The calculated equilibrium composition of slag compounds (liquid species) during pyrolysis of sewage sludge at different temperatures.
Energies 14 01477 g013
Figure 14. The calculated equilibrium composition of the gaseous product containing P at different temperatures.
Energies 14 01477 g014
Figure 15. The calculated equilibrium composition of the remaining nutrients from sewage sludge at different pyrolysis temperature.
Energies 14 01477 g015
Table 1. Sewage sludge characteristics.
City of Wastewater Treatment PlantPhosphorus Precipitation TreatmentDry Matter 3
Mora-SwedenP is Chemically Precipitated with Kemiras PAX 215, Which is An Aluminum Polymer.89.4 wt.%
Proximate AnalysisAsh Analysis(g/kg DSS 2)Trace Elements(mg/kg DSS 2)
Moisture 1,210.6Al33As1.11
Ash 1,321.1Ca8.9Cd0.39
Volatiles 1,370.7Fe3.8Co1.3
Fixed carbon 1,38.2K1.6Cr29
Ultimate analysis 1,2Mg0.93Cu130
C55Na0.54Hg22
H8.0P15Mn93
O31Si17Ni8.1
N4.4Ti0.39Pb9.3
S0.7Cl0.47Zn310
1 Wt.%; 2 as received; 3 dry.
Table 2. Elements, compounds, and solution models used for the thermodynamics equilibrium calculations in FactSage.
Elements
H, C, N, O, Na, Mg, Al, Si, P, K, Ca, Fe, Zn, S
Database—GTOX (solution models)
Slag (liquid phase containing oxides, metals, sulfides, sulfates of existing elements)
ALPM (Al, Si)(P, Si)O4C3PL (Ca, Mg, Zn)3(PO4)2
CORU (Al, Fe)2O3
MEO CaO, MgO, K2O, Al2O3, FeO, ZnO
OLIV (Ca, Fe, Mg, Zn)(Ca, Fe, Mg, Zn)SiO4
Gases: CO2, H2O, H2
Database—SGPS (stoichiometric compounds)
Gas compounds
Stoichiometric solid compounds
PYRR (MgS, FeS)
MULL Al2(Al, Fe, Si)O5
Stoichiometric solid compounds
Table 3. Pre-exponential factor and the reaction order for pyrolysis of sewage sludge at different heating rates.
Heating Rate (°C/min)Sample Mass (mg)k0n
23.6874.78 × 10147.18
53.7696.03 × 10146.70
103.6851.77 × 10156.80
153.8973.60 × 10145.87
203.7923.36 × 10145.82
Table 4. The yield and energy content in sewage sludge char obtained after treatment at different temperatures.
Temperature °C% Char YieldAverage Energy (J/g)
50028.76087
70026.44070
90024.66499
Table 5. The percentage of recovered elements in the char after pyrolysis of sewage sludge.
Temperature °CPMgCaZnCuCrNi
50090295331729170
700100122334779076
9009392625698734
Publisher’s Note: MDPI stays neutral with regard to jurisdictional claims in published maps and institutional affiliations.

