
CFD Simulations of Allothermal Steam Gasification Process for Hydrogen Production


Department of Extraction Technologies, Rockburst and Mining Support, Central Mining Institute, Plac Gwarków 1, 40-166 Katowice, Poland
*
Author to whom correspondence should be addressed.
Energies 2021, 14(6), 1532; https://0-doi-org.brum.beds.ac.uk/10.3390/en14061532
Submission received: 7 January 2021
/
Revised: 27 February 2021
/
Accepted: 5 March 2021
/
Published: 10 March 2021
(This article belongs to the Special Issue Computational Fluid Dynamics (CFD) 2021)
Abstract
:The article presents an experimental laboratory setup used for the empirical determination of the gasification of coal samples in the form of solid rock, cut out in the form of a cylinder. An experimental laboratory set enabled a series of experiments carried out at 700 °C with steam as the gasification agent. The samples were prepared from the coal seam, the use of which can be planned in future underground and ground gasification experiments. The result of the conducted coal gasification process, using steam as the gasification agent, was the syngas, including hydrogen (H2) with a concentration between 46% and 58%, carbon dioxide (CO2) with a concentration between 13% and 17%, carbon monoxide (CO) with a concentration between 7% and 11.5%, and methane(CH4) with a concentration between 9.6% and 20.1%.The results from the ex-situ experiments were compared with the results of numerical simulations using computational fluid dynamics (CFD) methods. A three-dimensional numerical model for the coal gasification process was developed using Ansys-Fluent software to simulate an ex-situ allothermal coal gasification experiment using low-moisture content hard coal under atmospheric conditions. In the numerical model, the mass exchange (flow of the gasification agent), the turbulence description model, heat exchange, the method of simulating the chemical reactions, and the method of mapping the porosity medium were included. Using the construction data of an experimental laboratory set, a numerical model was developed and its discretization (development of a numerical grid, based on which calculations are made) was carried out. Tip on the reactor, supply method, and parameters maintained during the gasification process were used to define the numerical model in the Ansys-Fluent code. A part of the data were supplemented on the basis of literature sources. Where necessary, the literature parameters were converted to the conditions corresponding to the experiment, which were carried out. After performing the calculations, the obtained results were compared with the available experimental data. The experimental and the simulated results were in good agreement, showing a similar tendency.
1. Introduction
The development of civilization is undoubtedly associated with the acquisition of mineral resources, including fossil energy resources. Energy resources are the basis for the production of world energy, initially as heat and then in the form of electricity. Due to the scarcity of energy resources and the accompanying release of greenhouse gas emissions to the natural environment, it has become necessary to manage energy economically, which is one of the fundamental problems facing the modern world. In particular, this problem is felt in European Union countries, including Poland. In addition, the situation is complicated by the awareness of the limited supply of natural resources of oil and natural gas, and the uncertain situation regarding changes in prices of these energy resources, which inevitably has an impact on the energy security of countries [1,2,3,4].
The development of clean coal technologies, especially in the case of a country with rich deposits of this raw material, is, in this situation, the only option to counteract these problems. The gasification of coal in a deposit is a promising technology. This technology is attractive in regards to the economy, ecology, and technology [5,6,7,8].
Underground coal gasification (UCG) as a prospective method of exploitation is now increasingly the subject of both experimental and model research [9]. The commercialization of this method will make it possible to use coal resources, which currently the used technologies are not able to extract, because it is not financially viable, or it is simply not possible [1,2,8,9,10,11,12,13,14,15,16,17,18,19,20,21,22].
Coal gasification technology is a very complicated and a multiphase reaction process [23], involving fluid and solid mechanics, kinetics and thermodynamics, and physics and chemistry, which attempts to covert the coal resource in a thermochemical way into high-heating synthetic gas with injected gasification agents, such as oxygen, air, and steam [2,3,9,14,15,16,19]. For example, the coal gasification process, in an ex-situ reactor, with oxygen as the oxidant under the atmospheric condition, was conducted by authors in [3] in order to explore the hydrogen-rich production technology. The coal gasification characteristics in the reductor using steam as the gasification agent were investigated by the authors in [14] to understand the gasification performance in a full-scale two-stage pressurized entrained-flow gasifier for hydrogen production.
An experimental study on the coal gasification process for hydrogen production was conducted by Li et al. in [18] in order to explore the basis of hydrogen-rich gas production technology through a two-step chemical regenerative coal gasification in the reductor of the full-scale two-stage pressurized entrained-flow gasifier using steam as the gasification agent. The coal gasification in a full-scale two-stage pressurized entrained-flow gasifier was also investigated by Li et al. in [14] in order to analyses the effects of gasifying agent concentration, coal input rate, and operation period under the full reductor load on the performance of a hydrogen-rich gas production using a pure steam as the gasification agent.
Many complex physicochemical processes occur during coal gasification, among which, the most important are chemical reactions, mass and energy transport, as well as phase changes [4]. The process itself runs in a coal seam, the properties of which are variable and not always easy to determine for the entire volume of coal. The complexity of these phenomena means that the investigation of the process based on simulation requires the development of a complex model. Such a model, encompassing these phenomena, is a valuable research tool. Its application to the simulation and testing of the coal gasification process would allow for the better understanding of the laws governing this process, and it would enable the planning of future experiments. Moreover, the developed numerical model will facilitate the development and enhancement of the experimental setup to be finally adopted by the industry [12].
Many numerical models have been proposed to study the process of coal gasification. Choi et al. in [5] developed a two-dimensional model of an entrained flow coal gasifier to illustrate the changing of temperature distributions, species concentration, and flow field inside the gasifier using a coal–water slurry. Eri et al. in [10] developed two different numerical models based on the equilibrium constants to predict the influence of process parameters on the syngas composition, tar content, lower heating value, and energy efficiency. Guo et al. in [11] developed a two-fluid numerical model in order to simulate the gas–particle flow of coal particles in a tubular oxygen–coal combustor using an Eulerian treatment of both the gas and particle phases. Gür et al. in [24] developed a two-dimensional computational fluid dynamics (CFD) model to calculate the variations of temperature, cavity formation, reaction zones, reaction rates, and syngas composition during the Turkish lignite gasification process. The CFD model was built based on the laboratory experiment in order to demonstrate the feasibility of Turkish lignite. Hwang et al., in [1], developed a one-dimensional numerical reactor model to illustrate the performance of an entrained coal gasification process with different operating parameters. The numerical model includes reaction kinetics for the solid-phase reactions, together with gas diffusion and equilibrium for the gas-phase reactions. Lee at al. [13] developed a two-dimensional numerical model of the coal gasification process in order to predict product gas yield, syngas composition, and efficiency, calorific value of the syngas, and carbon conversion. Shirazi, in [25], developed a two-dimensional model in COMSOL Multiphysics as well as in Ansys-Fluent to predict the effect of different parameters on the UCG process performance with temperature. Sreedharan in [22] developed a three-dimensional numerical model of the coal gasification and heavy oil in order to predict syngas production using a discrete phase model. Mota et al., in [26], developed a three-dimensional model of a bubbling bed gasifier using CFD method to predict and optimize hydrogen-rich syngas during the thermochemical conversion of a lignite coal using steam and oxygen as oxidants.
The numerical modeling available in the literature concentrates mainly on the aspects of key influential parameters for coal gasification process, value, and composition of product syngas, optimal efficiency, and process factors, in which coal is mostly simulated in form of slurry or particles.
In this paper, the task of developing and constructing an experimental laboratory setup with the intention of conducting a series of coal gasification experiments, occurring in a homogeneous material block, with a given geometry in the form of a cylinder, was undertaken. The obtained experimental data referred to the developed numerical model of the coal gasification process, validating the solution obtained by comparing them to the results obtained from the real system from the gas-flow reactor.
An experimental laboratory setup will lead to the gaining of more knowledge concerning the gasification of coal in the gasification reactor in the phenomenological sense, through the possibility of studying the volume composition of CO2, CO, H2, and CH4 gas, which is the desired end result of the whole process. Moreover, it will offer the possibility of forecasting based on the developed mathematical and numerical model using the computational fluid mechanics (CFD) method.
2. Materials and Methods
The implementation of the work required access to relevant experimental data. Due to the complexity of the work, data from an experiment conducted on a laboratory scale were used. Based on this, the model implemented in the Ansys-Fluent software was prepared and verified. The data from the experiments carried out on a laboratory scale also served to validate the mathematical model developed.
2.1. Physical Model
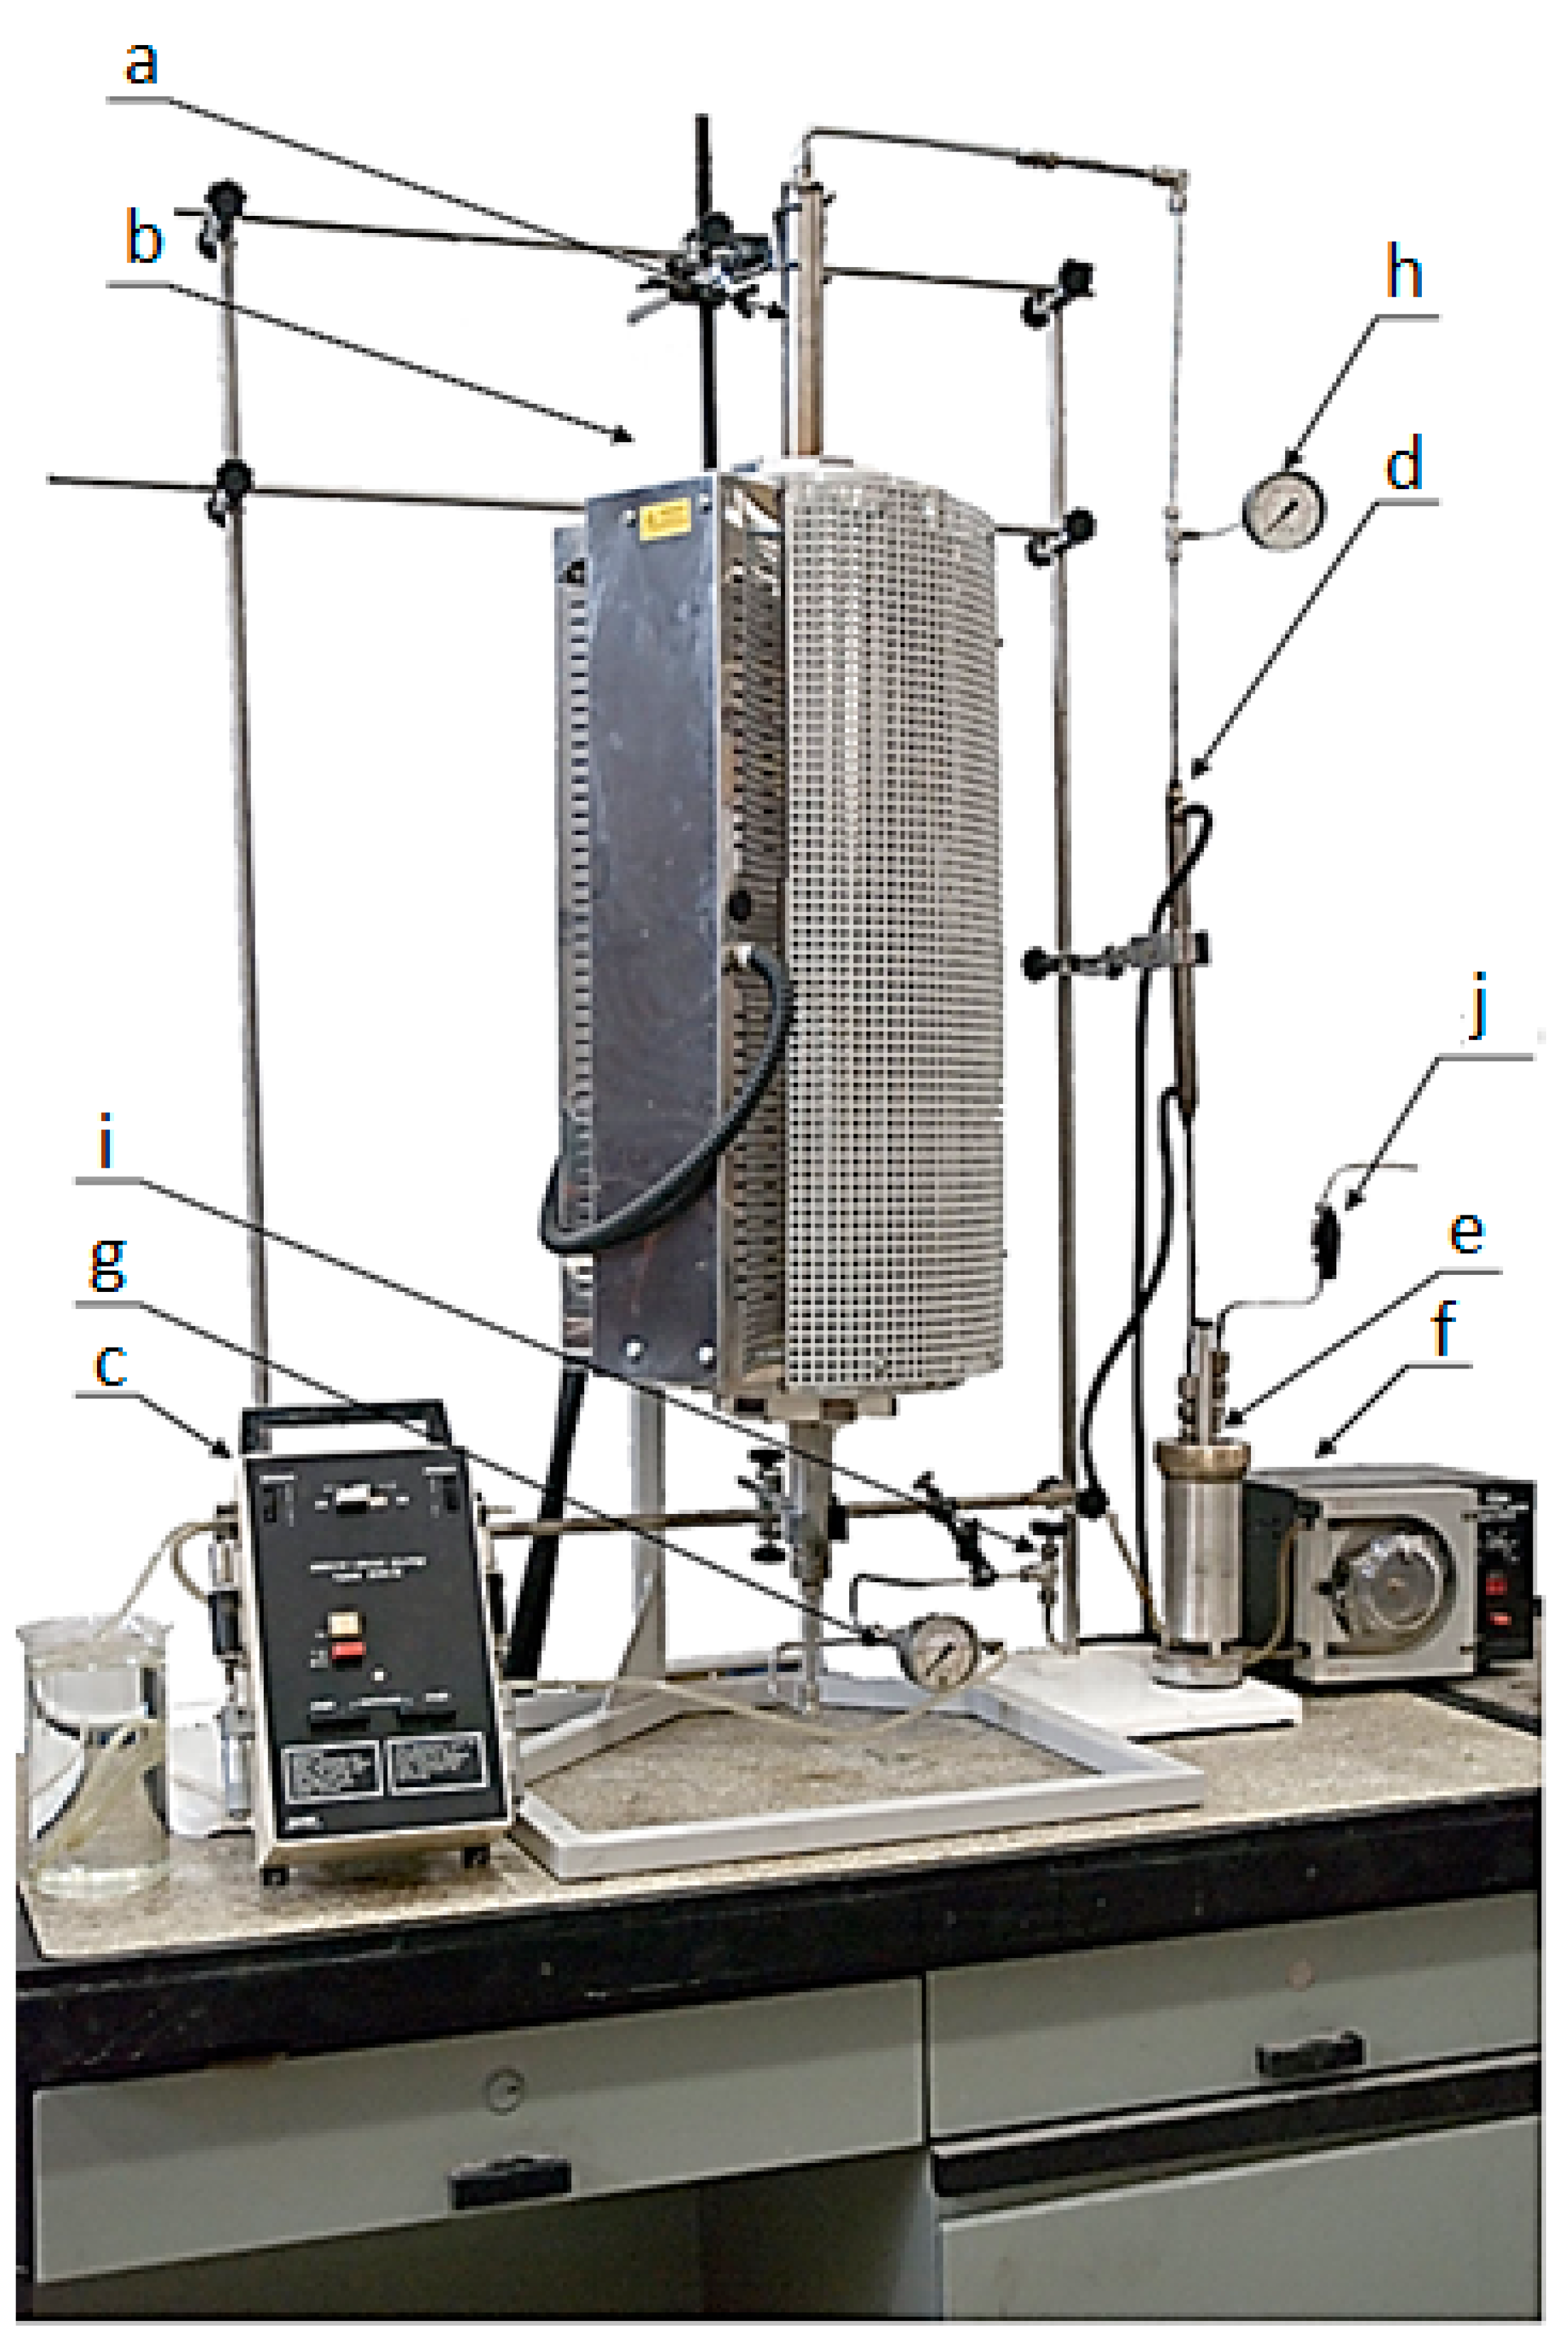
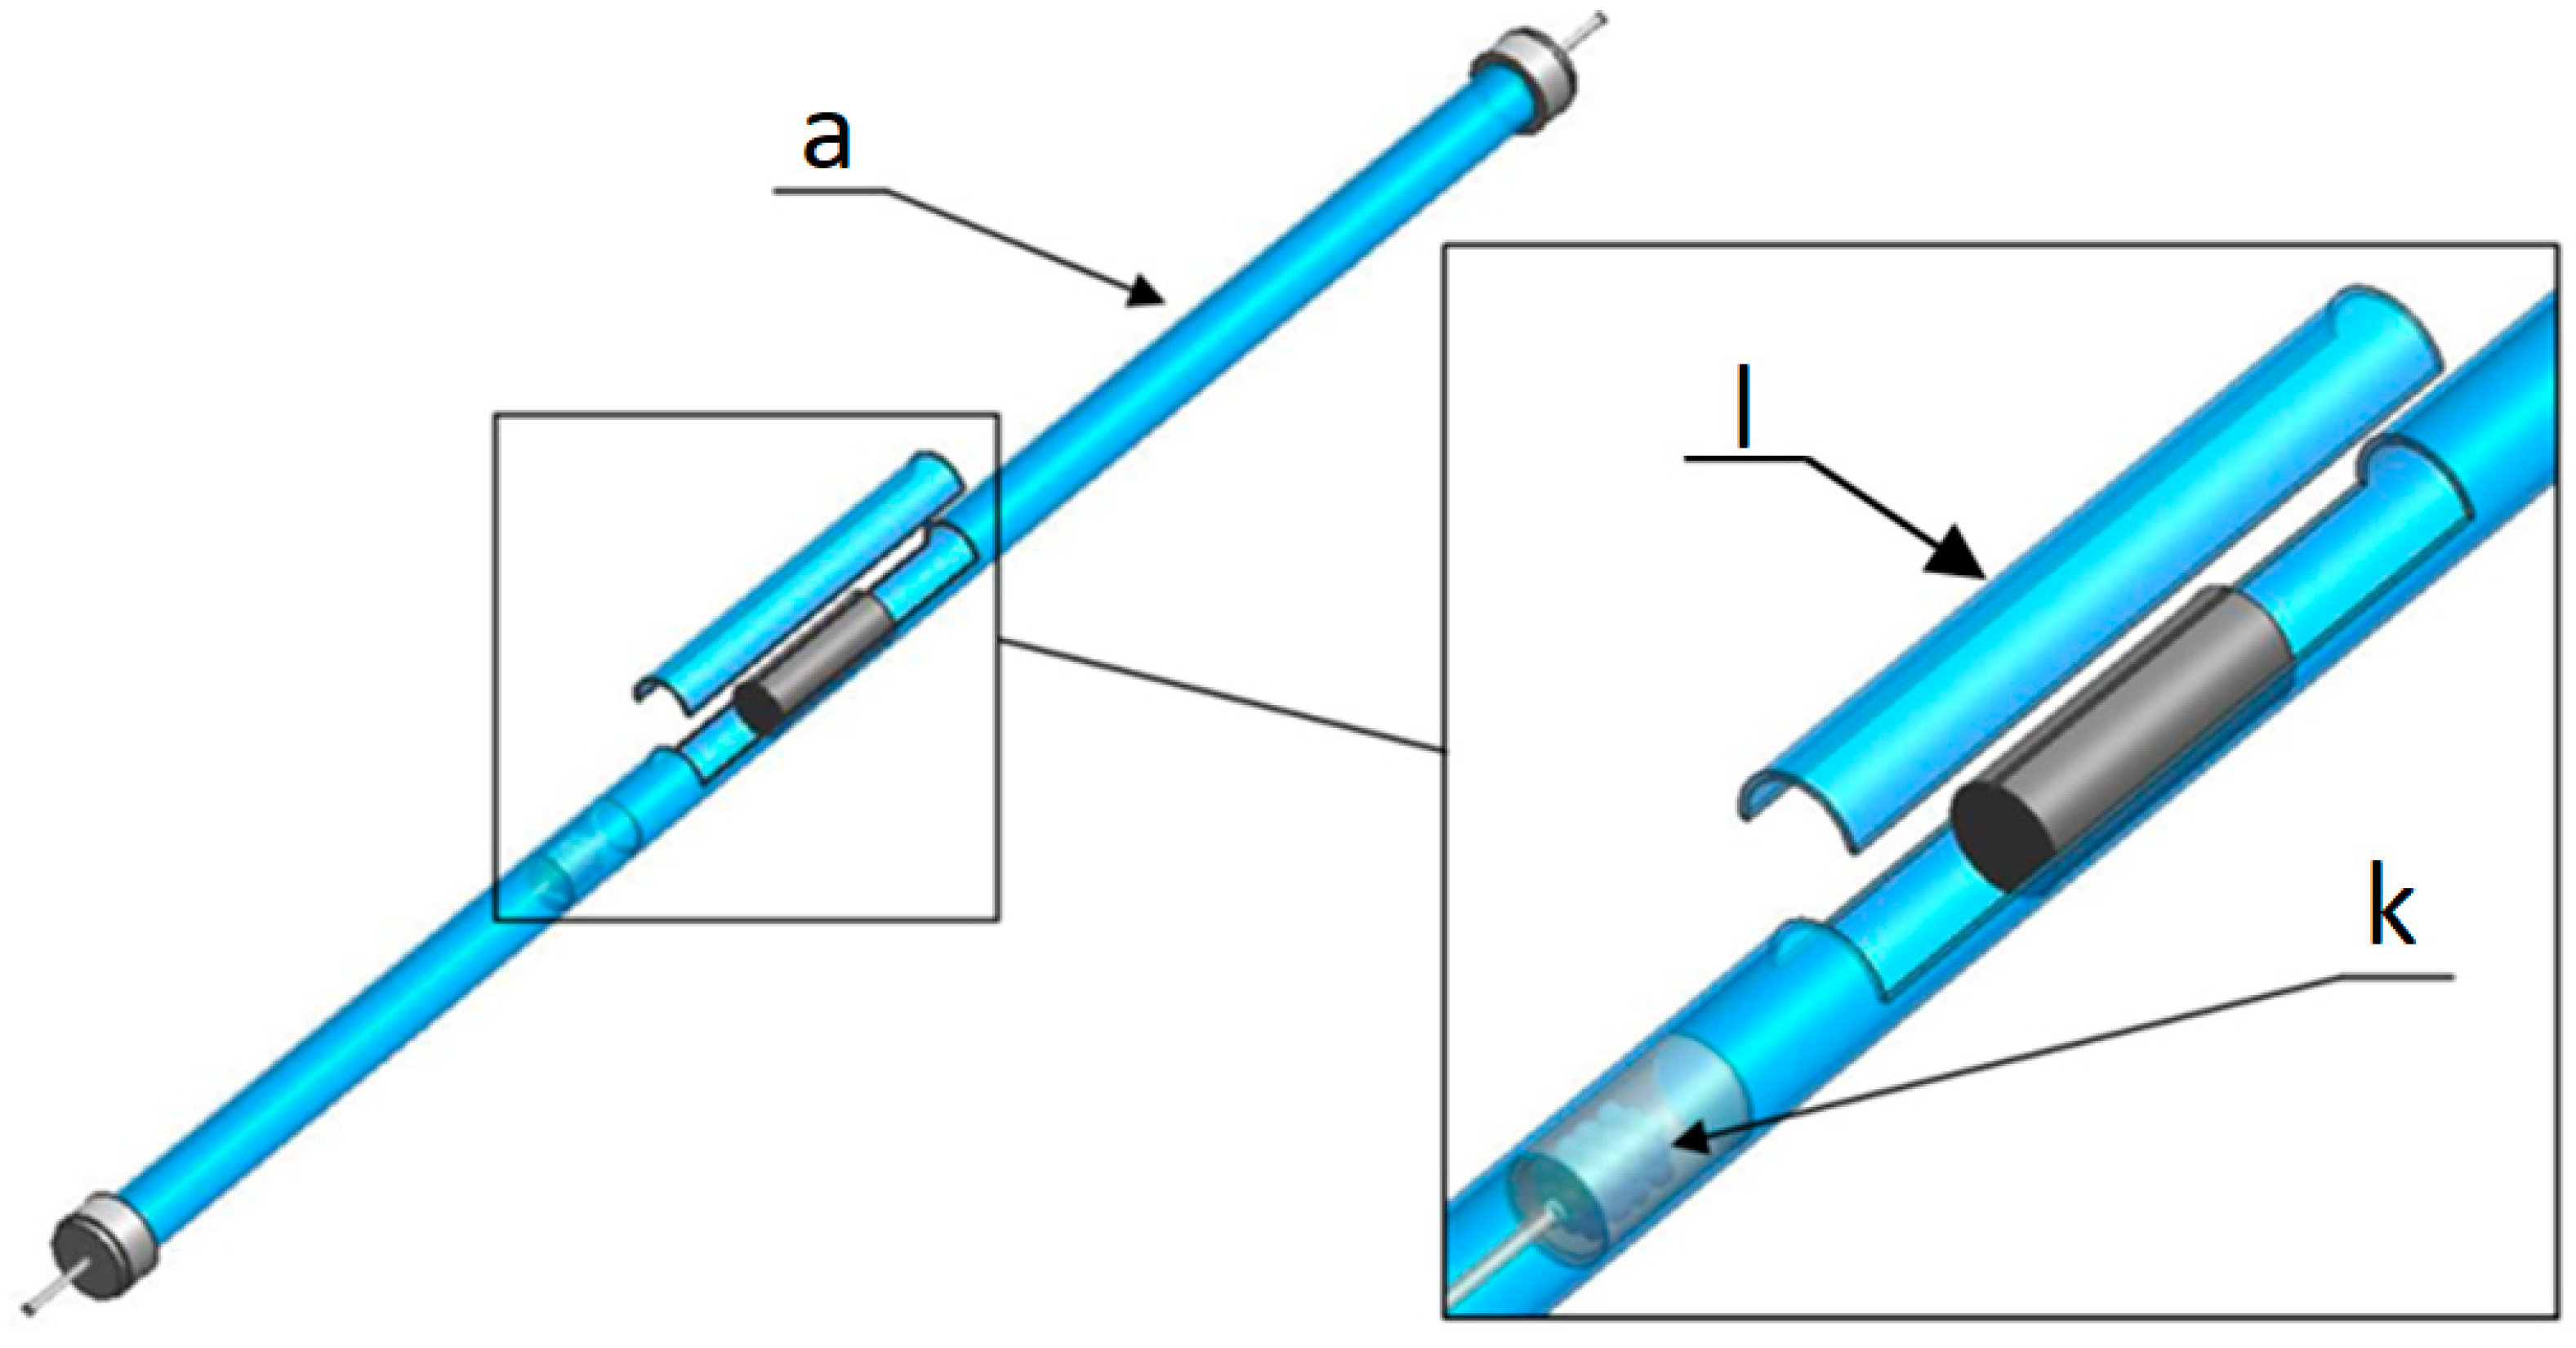
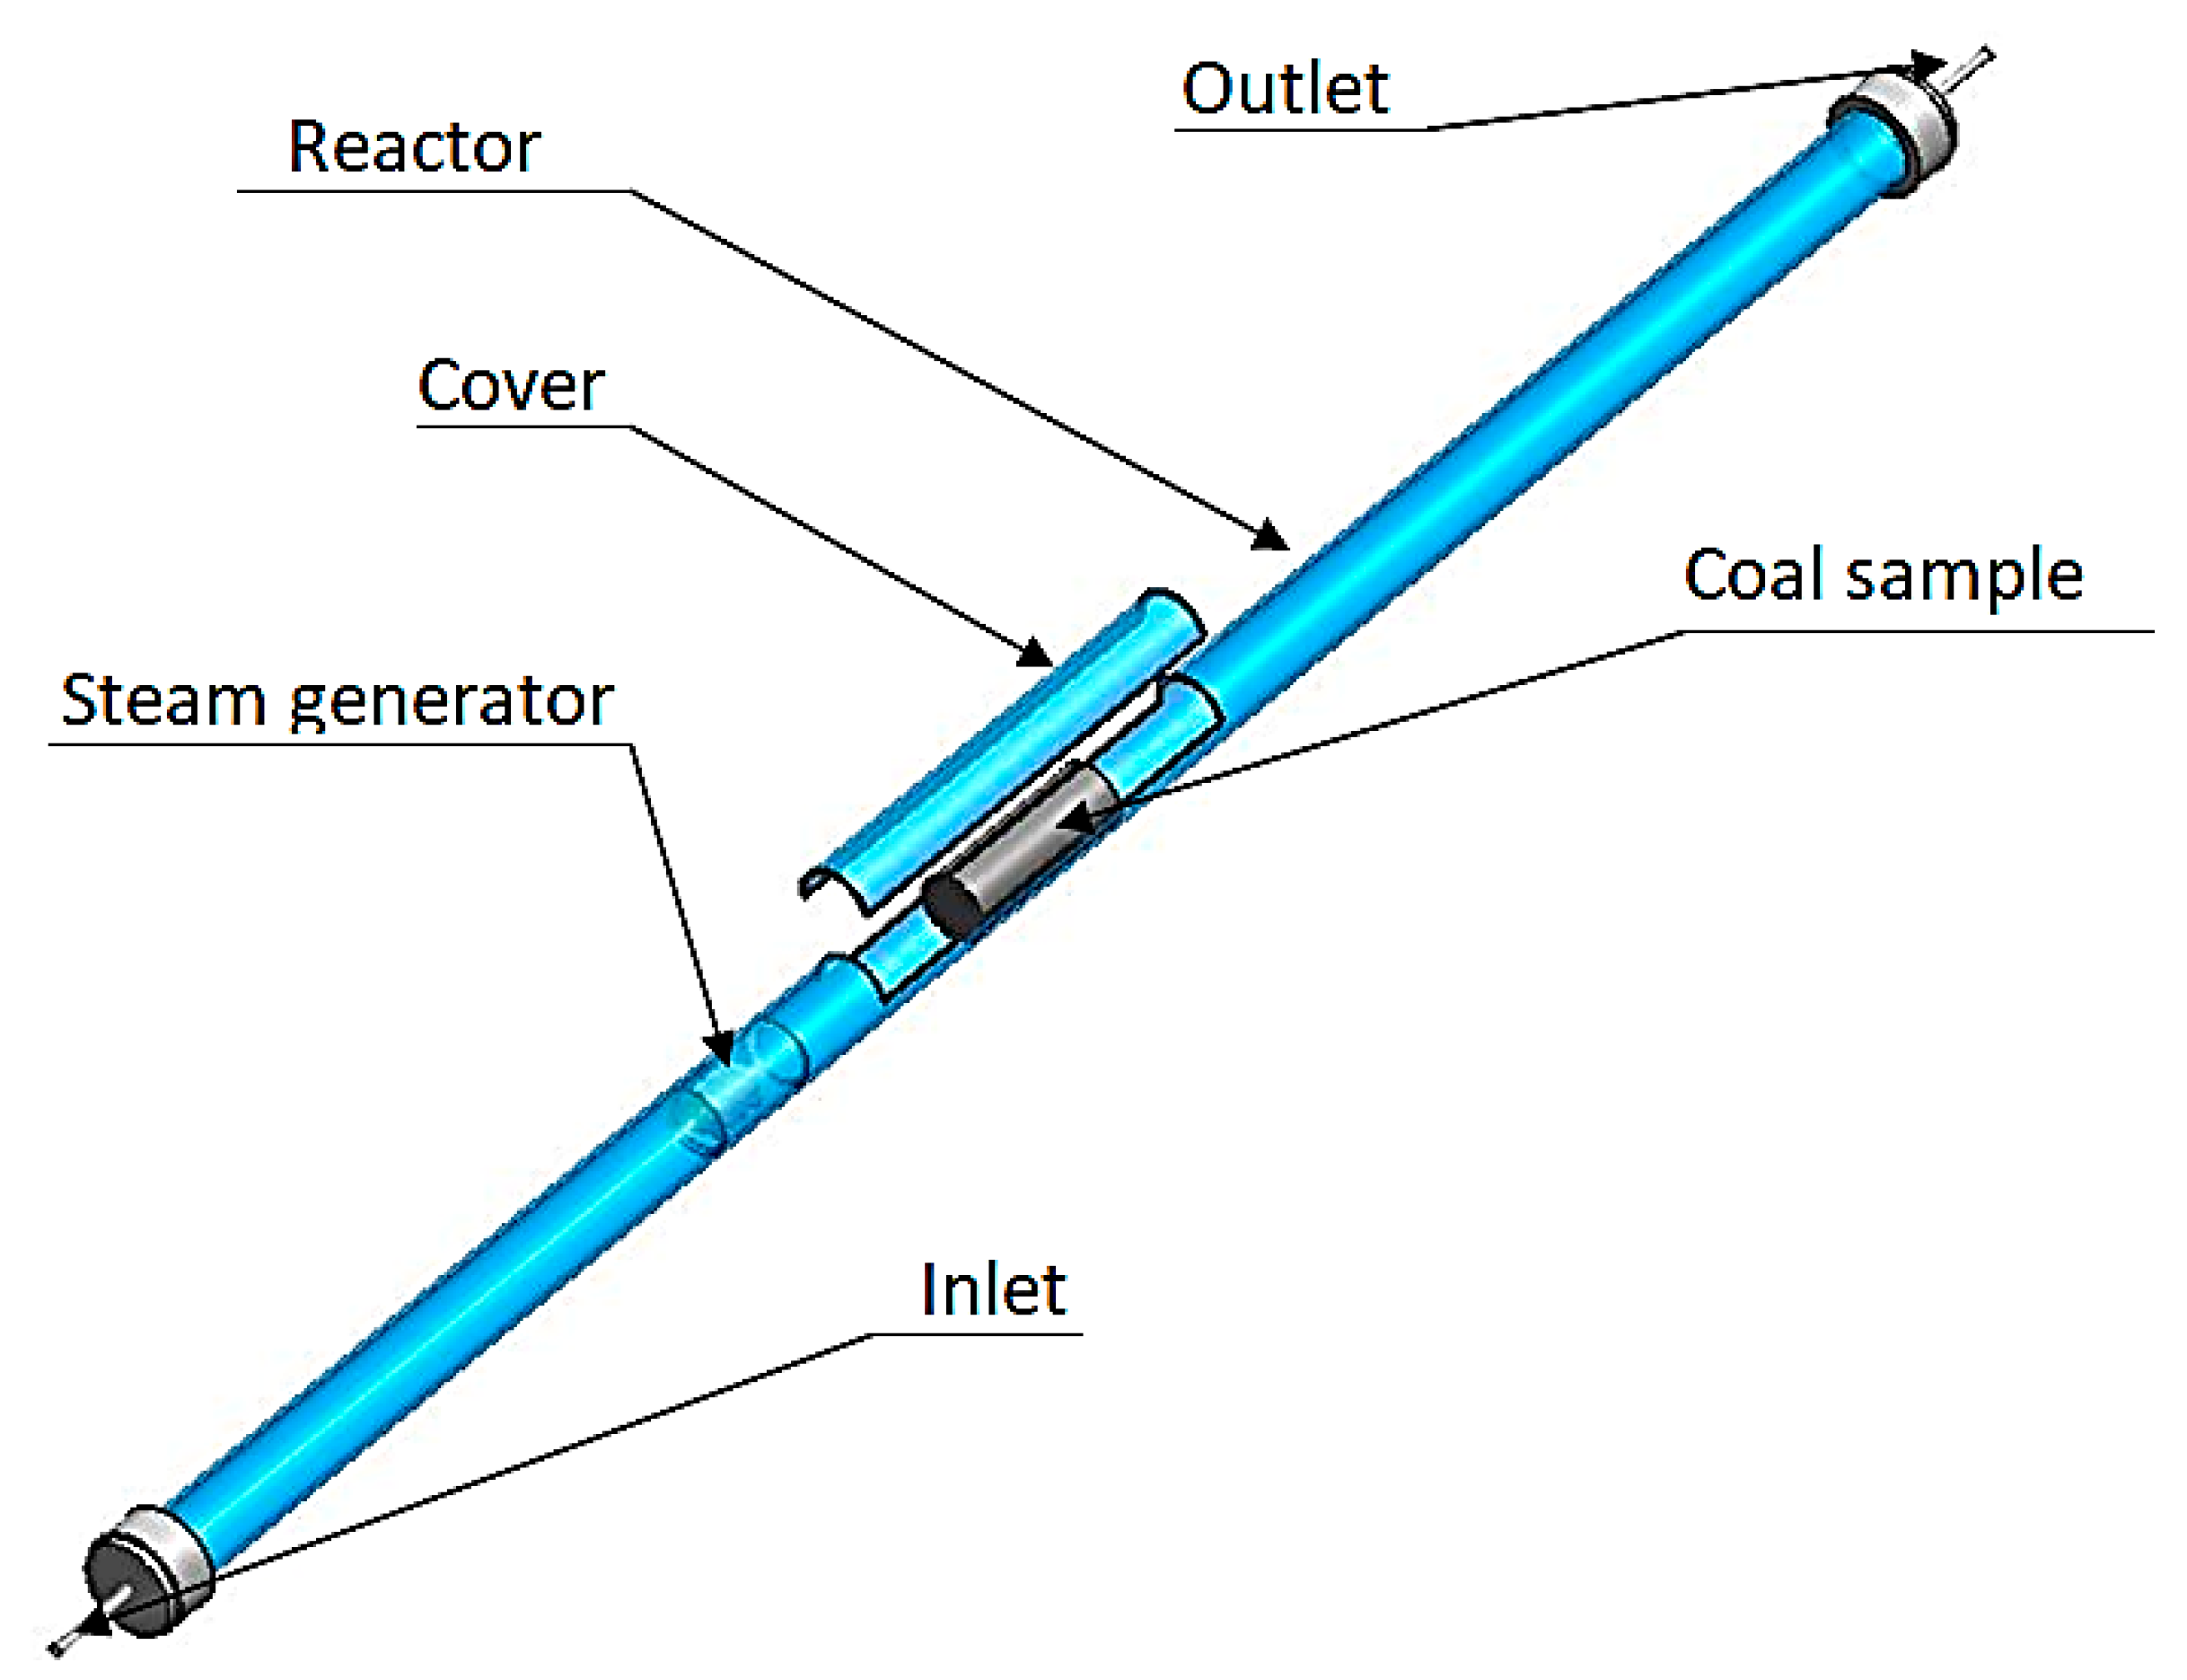
The experiment carried out on a laboratory scale consisted of the gasification of coal samples with steam in the form of a solid rock in the shape of a cylinder. Laboratory tests of the coal gasification process were carried out using an experimental laboratory setup consisting of (Figure 1): a fixed bed reactor (coal mass) (Figure 1a), a furnace (Figure 1b), a water pump piston (Figure 1c), a syngas cooler (heat exchanger) (Figure 1d), a condensate tank (Figure 1e) for condensed steam, a pump supplying the heat exchanger (Figure 1f), an analogue manometer at the inlet (Figure 1g) and outlet (Figure 1h) of the reactor, and inlet (Figure 1i) and outlet (Figure 1j) valves. The gasification reactor was placed inside a furnace (Figure 1b), whose operation was controlled using a digital proportional–integral–derivative (PID) controller. Steam as a gasification agent was obtained as a result of the rapid evaporation of water from the surface of a ceramic bed (aluminum oxide Al2O3), in the shape of spheres with a diameter of 6 mm, filling the cylindrical vessel (Figure 2k), located directly in front of the test coal sample. In order to eliminate the possibility of the uncontrolled movement of the ceramic bed (dialuminium trioxide—Al2O3) in the gasification reactor, the tank (Figure 1e) was closed from the top with a tight steel ring together with a steel mesh with a 0.2 mm diameter. The synthesis gas emerging in the reactor, flowing through a heat exchanger (Figure 1d) fed with liquid pumped into the system by a piston pump (Figure 1f), condensates to the tank (Figure 1e) and then through the outlet valve (Figure 1j) it was directed to high density polyethylene (HDPE) bags with a capacity of 2 dm3. The chemical composition of the stored process gas was measured using a gas chromatograph.
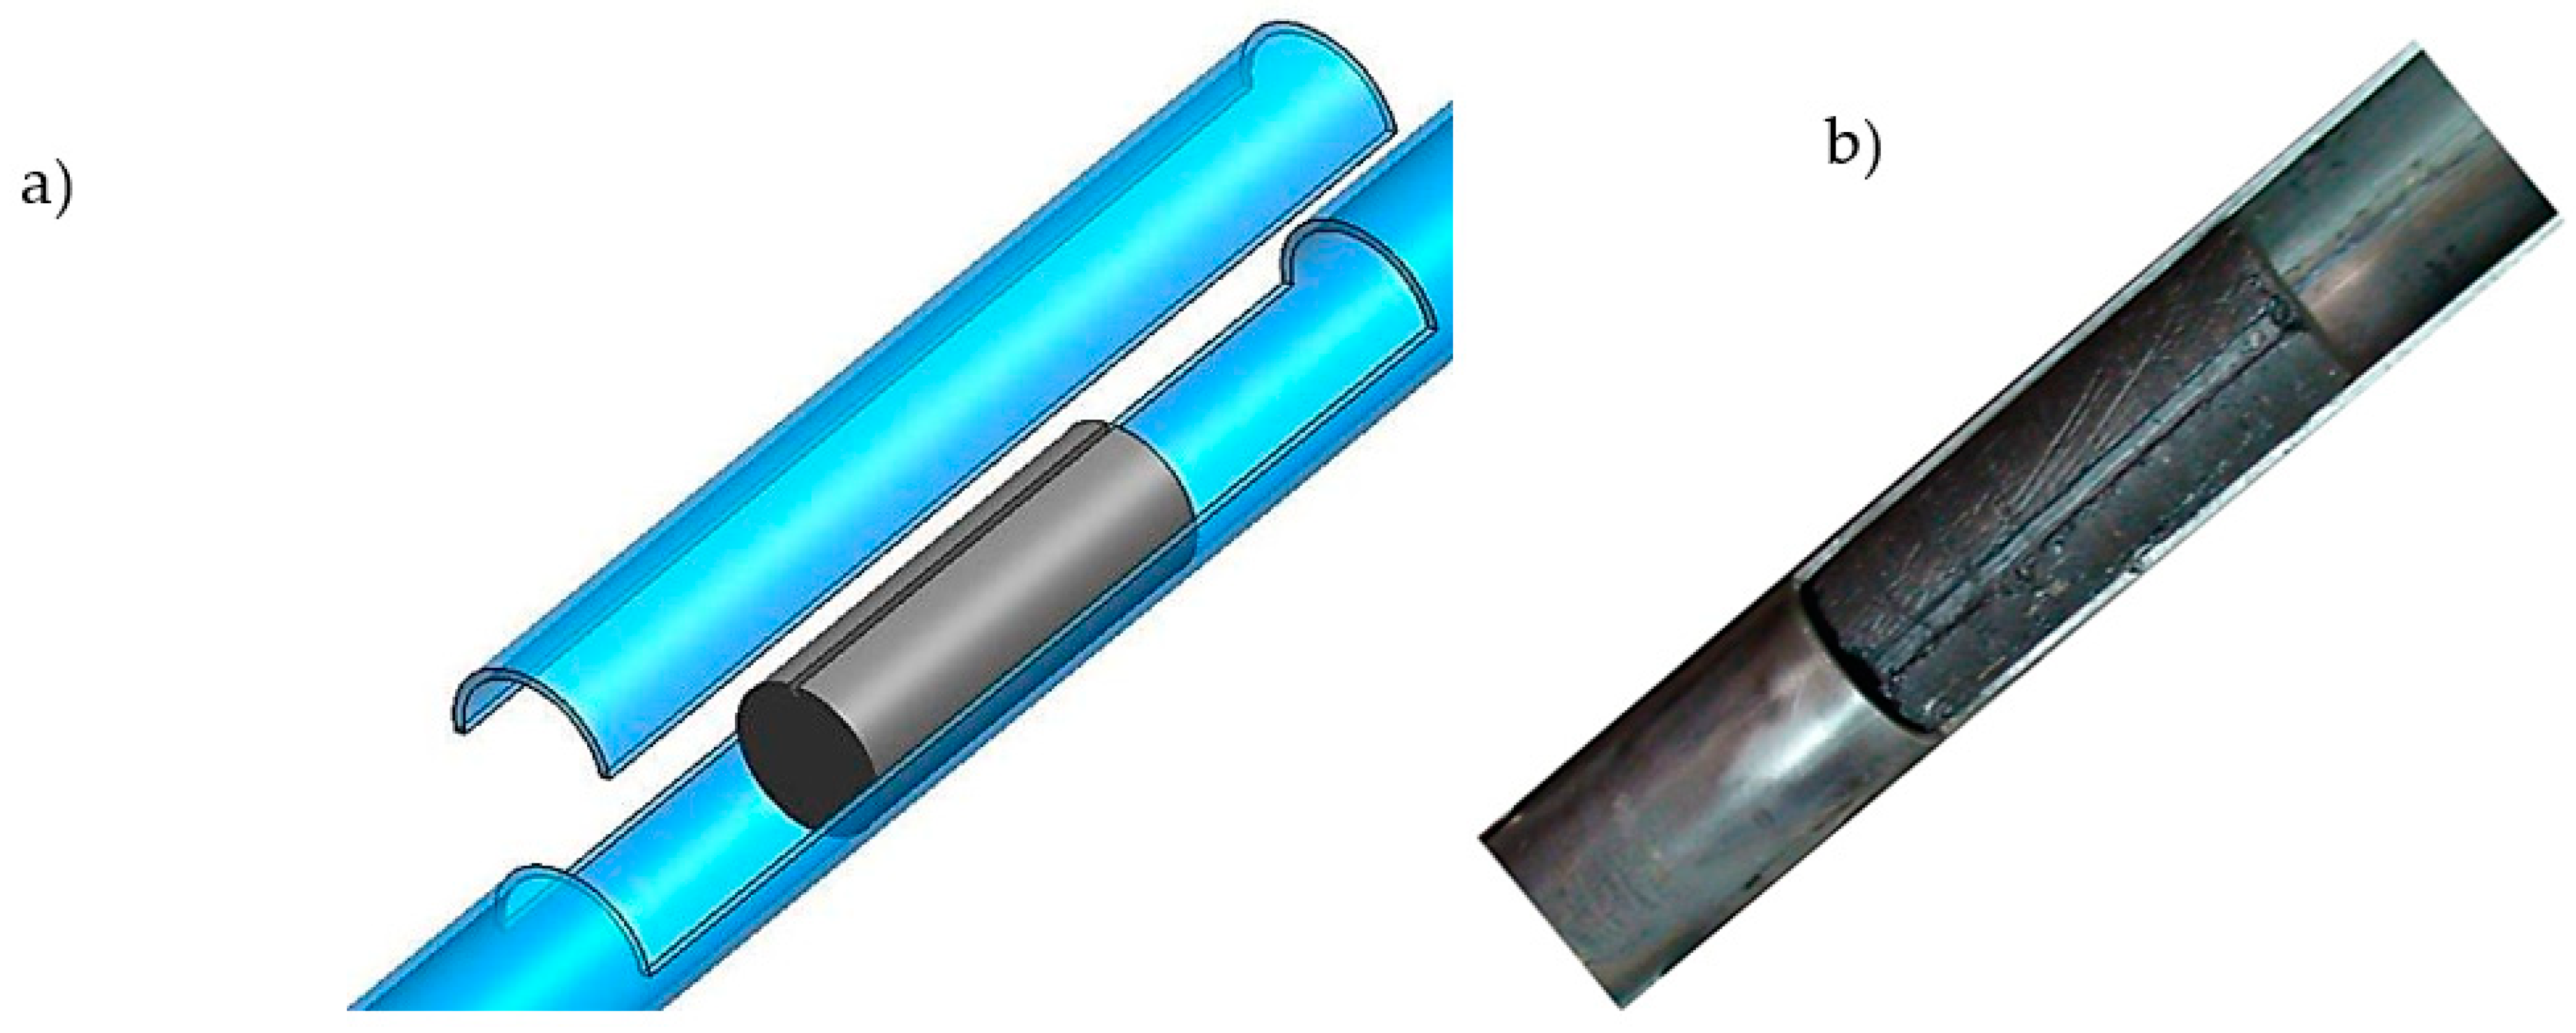
The coal gasification experiments were carried out on an experimental laboratory setup in a gasification reactor (Figure 1a) designed and constructed with the aim of reproducing, in an approximate way, the conditions prevailing in its interior during gasification occurring under conditions of underground coal gasification. The behavior of the coal sample was to be retraced under the conditions of the gasification process. The reactor, designed as a pipe with an inner diameter of 30 mm, length of 1800 mm, and wall thickness of 2 mm, allowed these requirements to be met, and for both samples of coal simulating the bed, and the walls of the pipe as surrounding rocks, to be place in its interior.
Coal was delivered in the form of blocks with dimensions of 400 mm × 400 mm × 250 mm (Figure 3), from which cylindrical coal samples were taken using traditional methods of borehole drilling.
A raw coal sample was placed in the reactor (Figure 2a and Figure 4) and then heated to 700 °C in a nitrogen atmosphere. Nitrogen was supplied from the gasification reactor bottle with an inlet valve (Figure 1i). After the temperature stabilized, the nitrogen flow was turned off, and then water was fed using a piston pump with a mass flow rate of the supplied agent of 0.1 mL per min−1, determined experimentally.
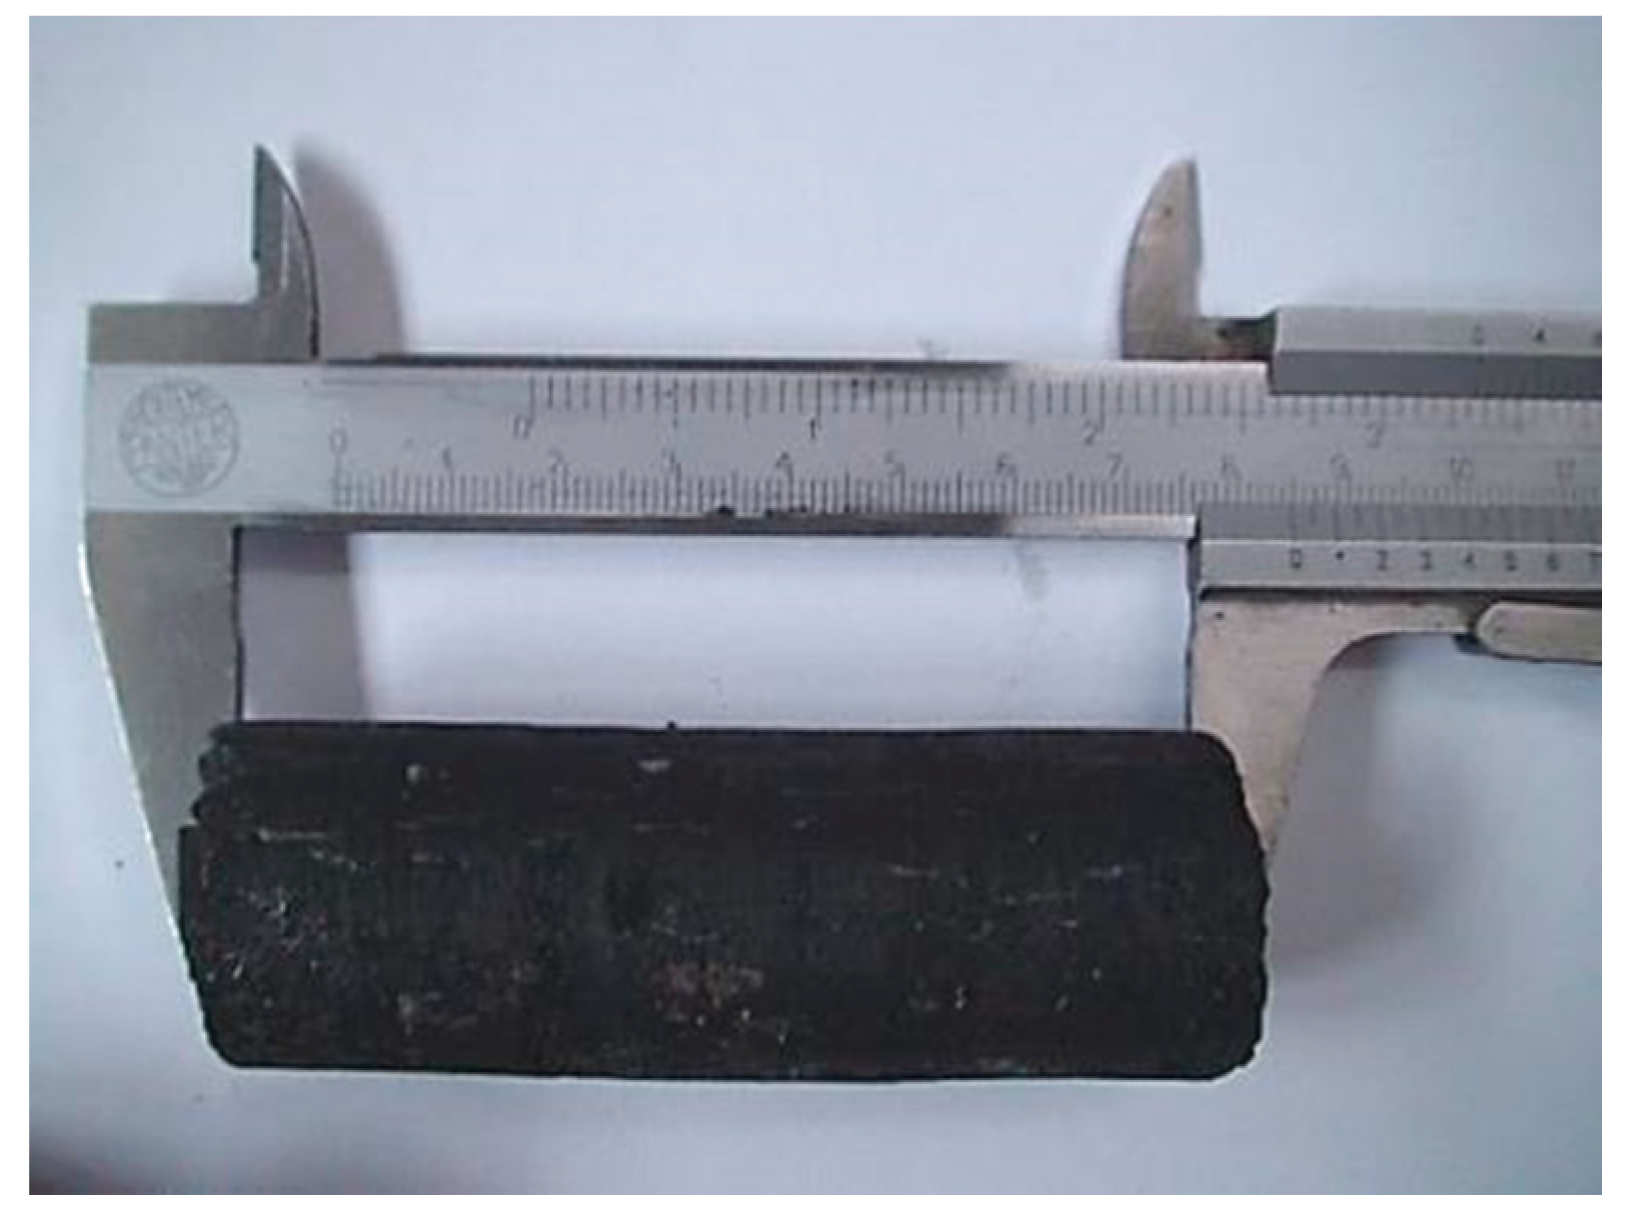
The construction of the reactor enables the monitoring of the pressure, the temperature of the furnace, and the value of the mass flow of the water at the reactor inlet. The reactor allows the coal gasification process to be conducted at a maximum temperature of 1200 °C. The maximum size of the coal sample was determined experimentally as a solid cylinder with a diameter of 30 mm and a length of 85 mm (Figure 5).
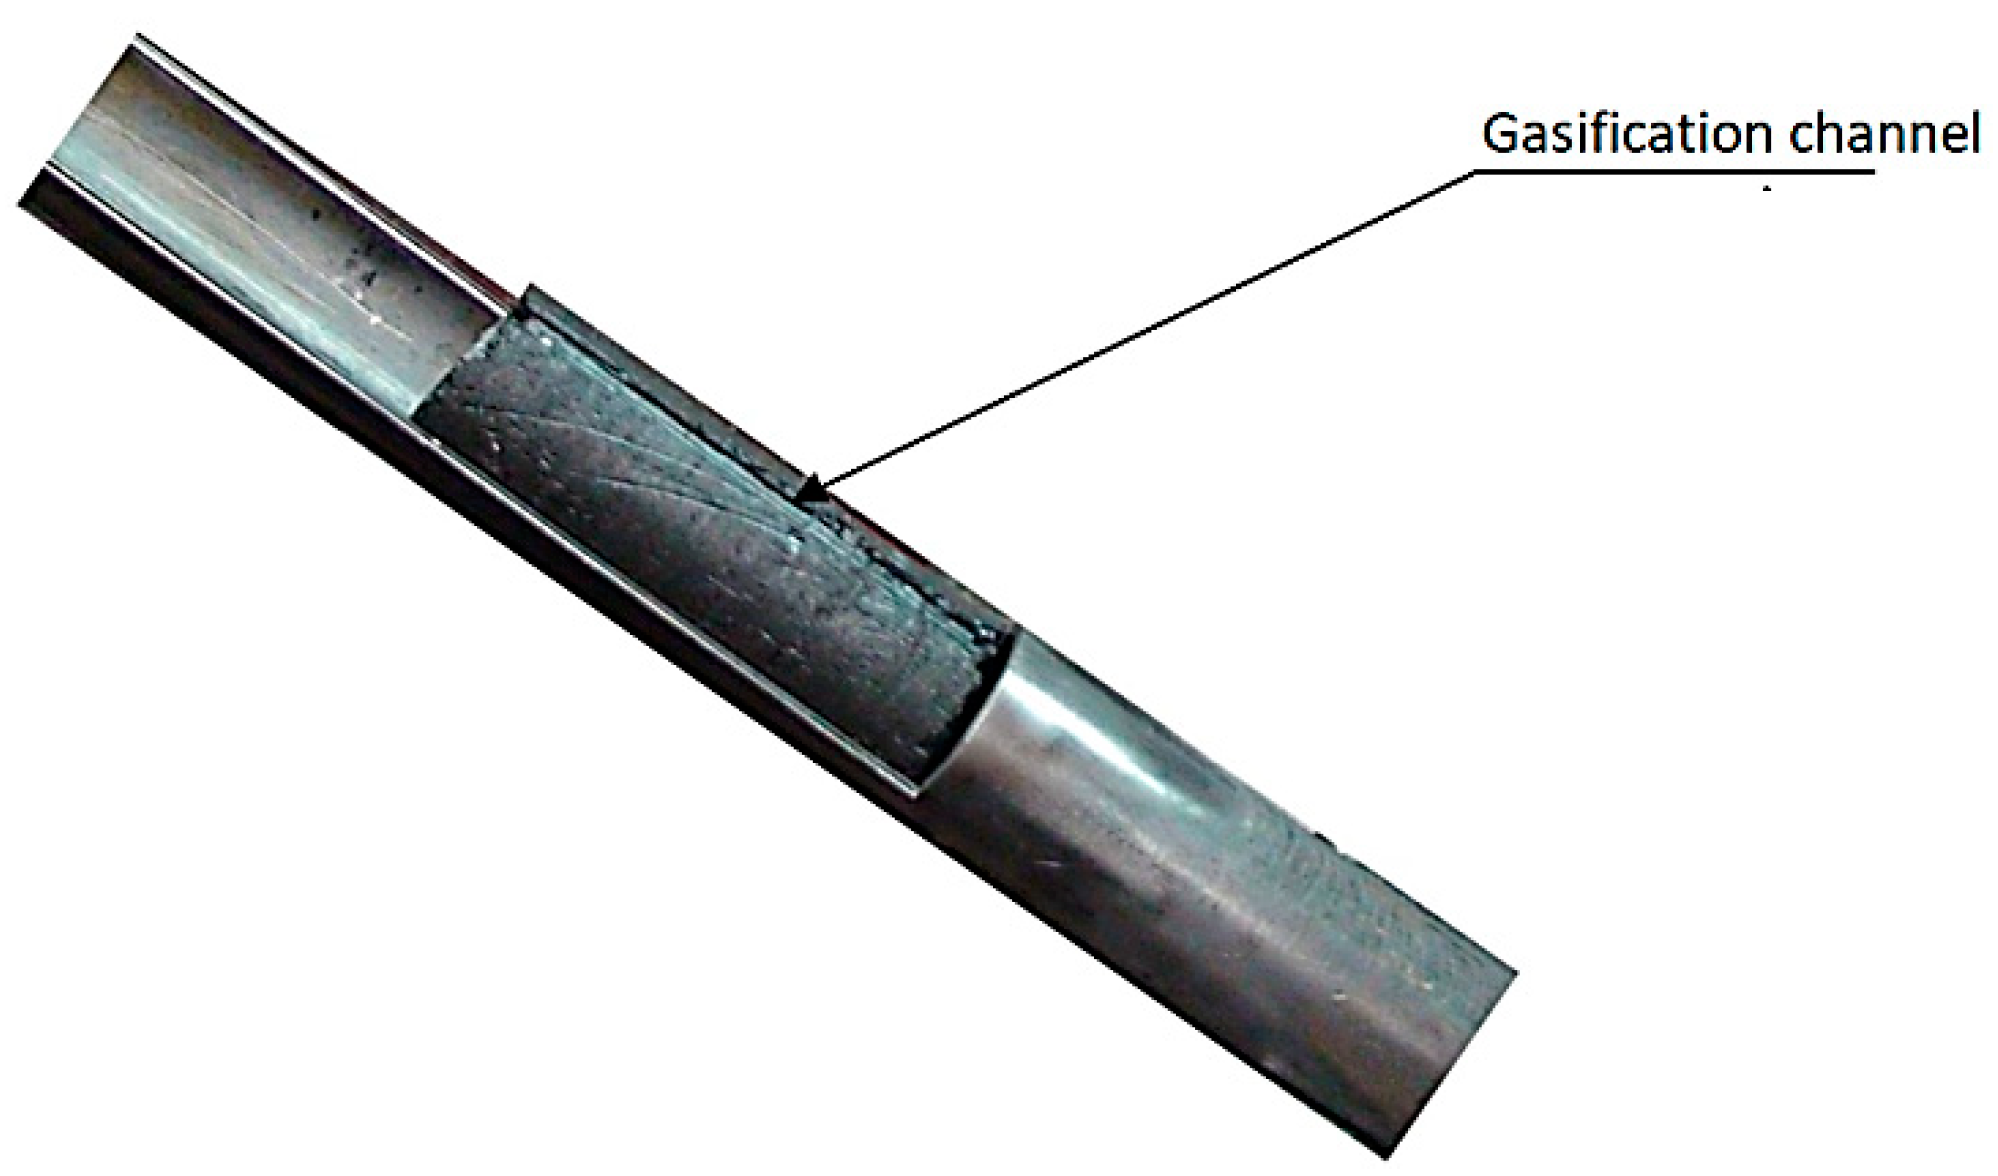
In the coal sample, each time before starting the experiment, two gasification channels measuring 2 mm × 2 mm × 85 mm were made symmetrically to the coal sample axis (Figure 6). Then the mass measurement of the sample was measured using an electronic Precisa scale, allowing mass measurement with an accuracy of ±0.01 g.
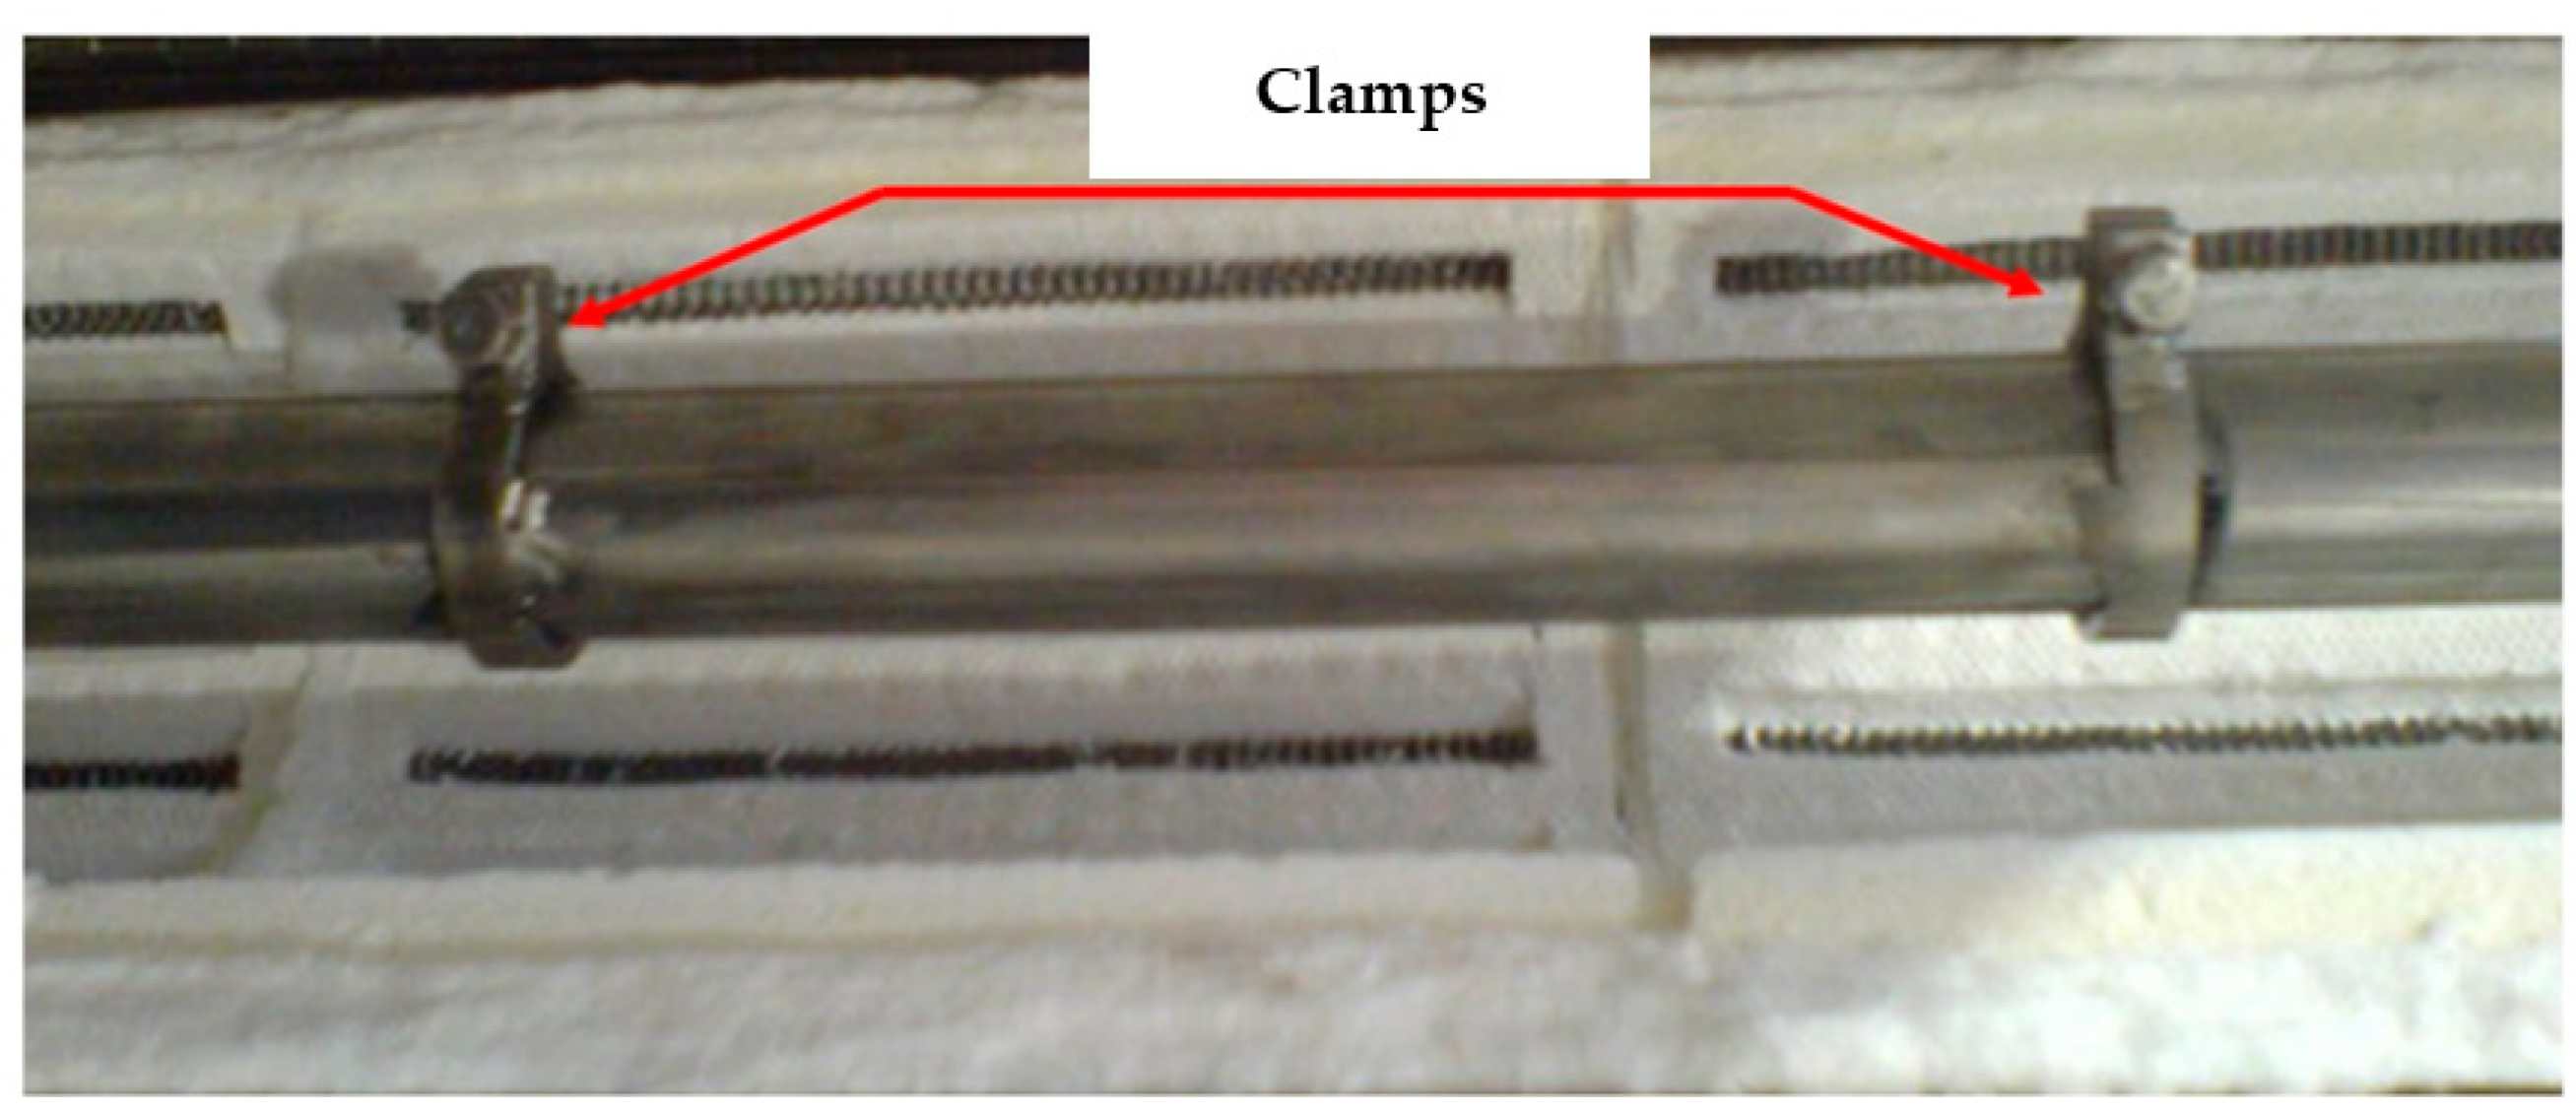
The reactor together with the test coal sample placed inside was sealed with a flange (Figure 2l) and was secured against the opening with clamps, as shown in Figure 7.
Possible gaps at the surface contact of the flange (Figure 2l)-reactor (Figure 2a) were sealed each time using a ready-to-use silicate-based sealant paste, resistant to very high temperatures of up to 1500 °C. The reactor structure was made entirely of acid and heat-resistant chromium-nickel steel, enabling operation in thermal conditions not exceeding 1100 °C.
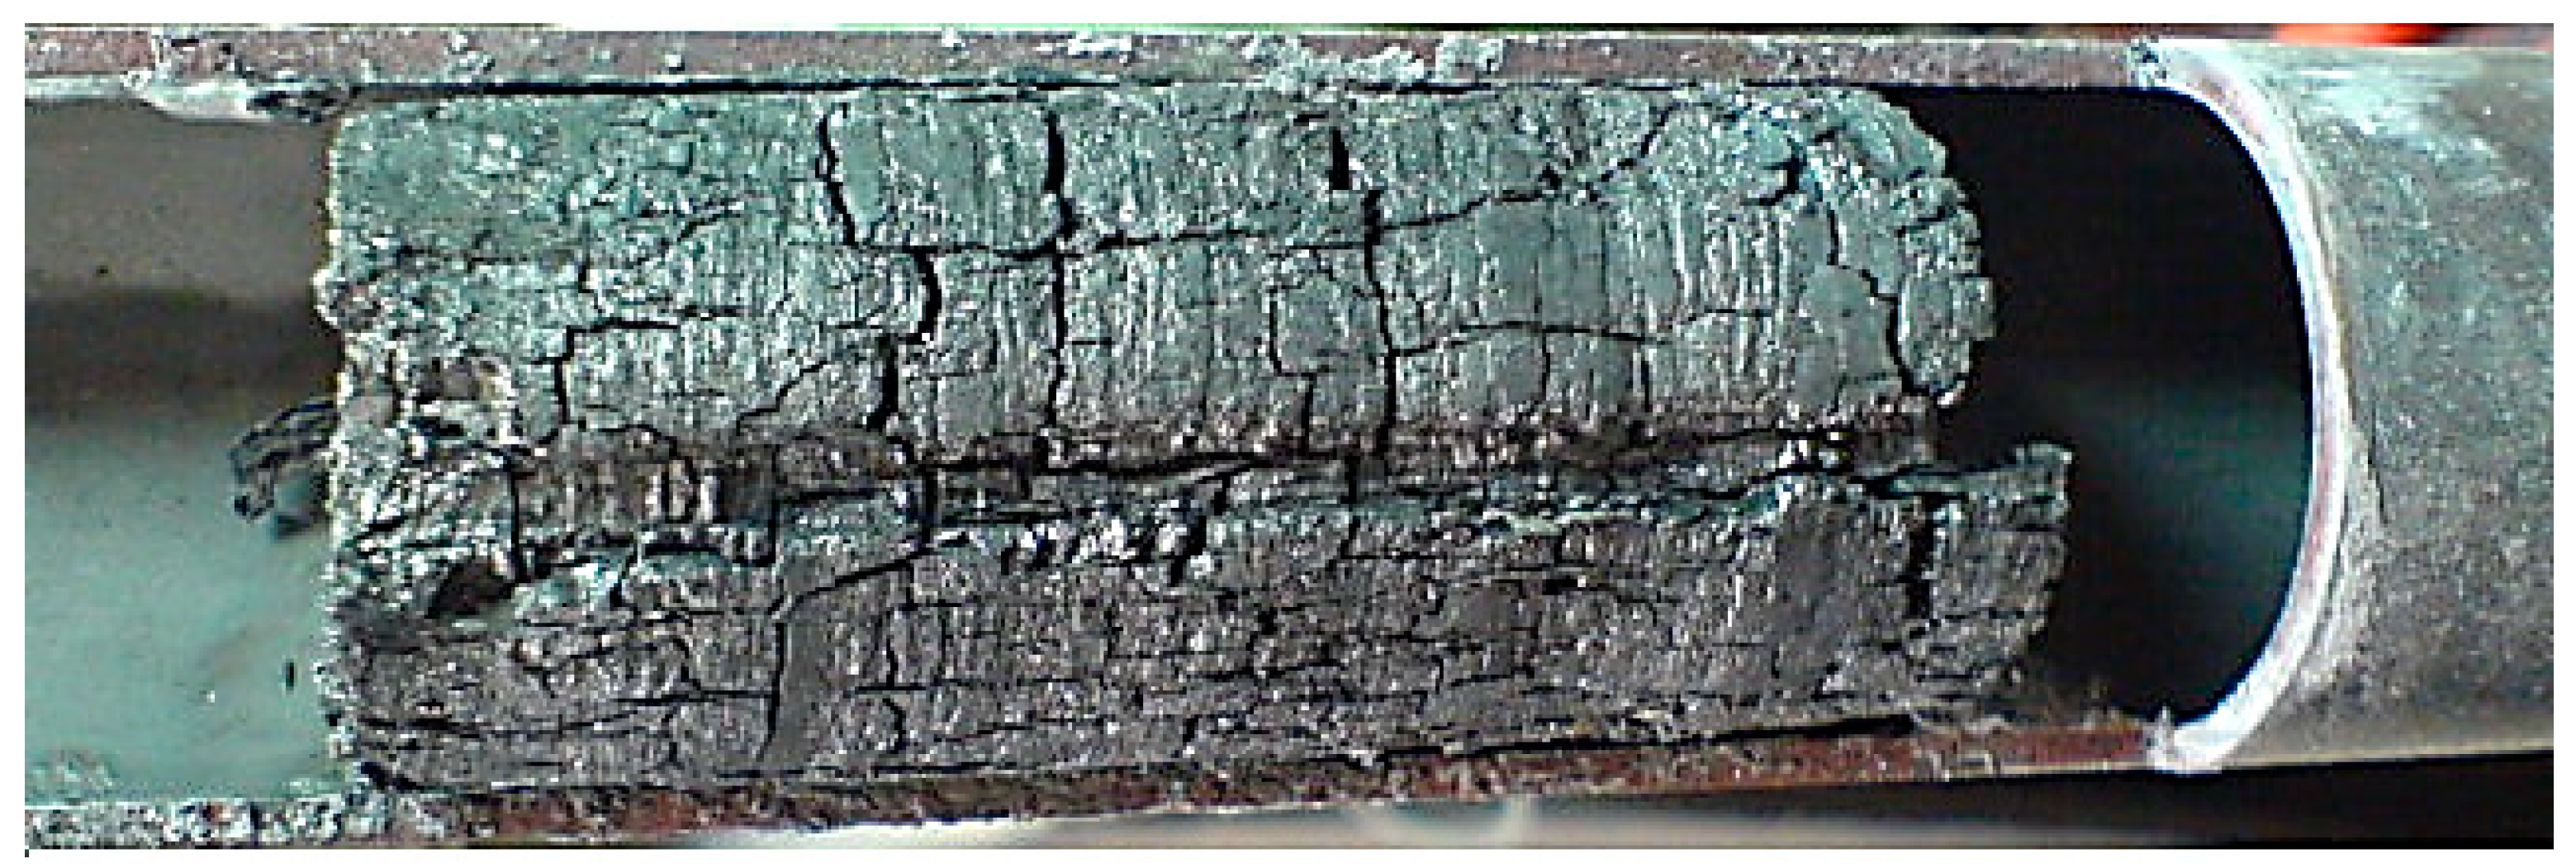
At the end of each of the gasification experiments, the coal sample was obtained in the form of a degassed coal mass, as shown in Figure 8.
2.1.1. Coal Samples
The quality of the solid fuel depends on many factors, but primarily on its chemical composition. Based on the chemical composition of coal, the suitability of the fuel is determined. The content of the carbon and hydrogen in the coal determines the amount of heat evolved during gasification processes. Sulphur is an undesirable component, because its compounds cause the release of harmful odors (including H2S). They adversely affect the natural environment and contribute significantly to the formation of corrosion. Moisture and ash in the coal mass are the passive part, i.e., the so-called ballast, which does not take part in energy processes.
The basic quality parameters of hard coals are:
- -
- Total moisture content;
- -
- Ash content;
- -
- Total sulfur content;
- -
- Heating value.
Three coal samples were taken from hard coal mines operated by the Polish Mining Group (PGG S.A.). The coal samples were characterized by the following parameters (average values) from the ultimate and proximate analysis, as shown in Table 1.
Through analysis of the results of the chemical composition tests, selected samples of coal intended for gasification in a laboratory installation can be classified as typical steam coal due to the volatiles content being above 28%.
2.1.2. Laboratory Tests
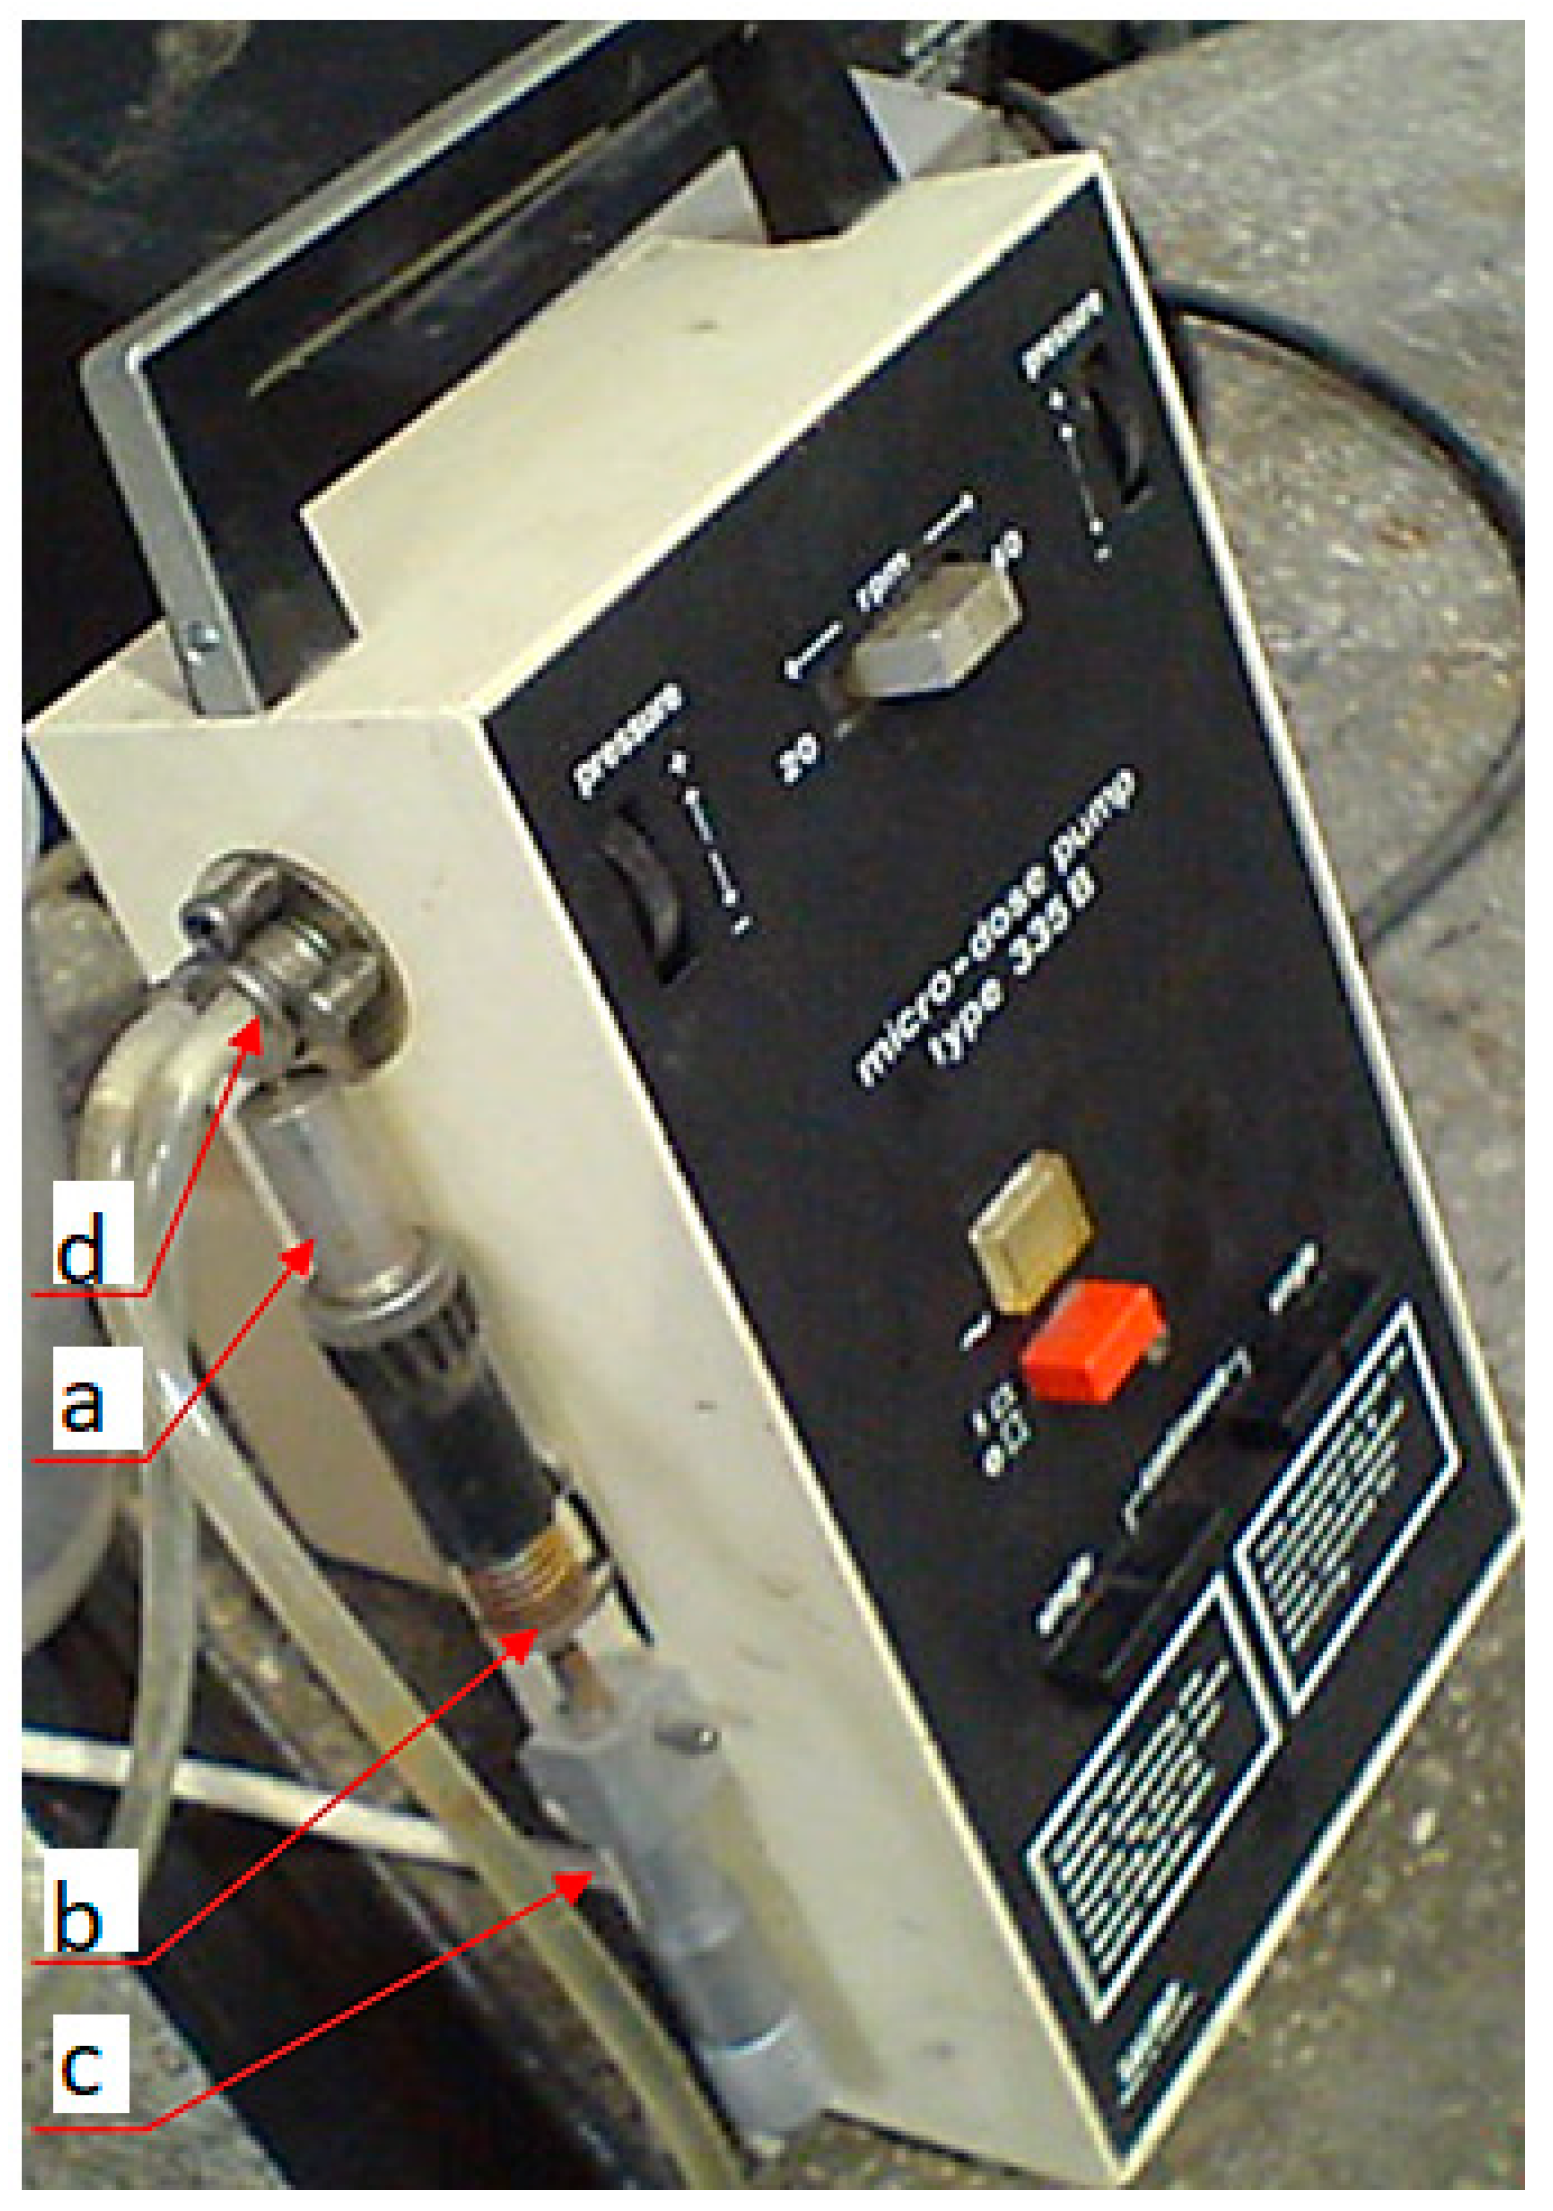
The measurement of the chemical composition of the process gas was carried out using the Agilent 3000A gas chromatograph, allowing measurement with an accuracy of ±0.01%.A typical single-acting piston pump consisting of a chamber (cylinder) (Figure 9a) was used to supply the gasification reactor, in which the eccentrically driven piston moves with the help of a shackle (Figure 9b), where the piston stroke was regulated by a micrometer screw (Figure 9c). The pump chamber is separated from the suction part by a self-acting valve (Figure 9d) enabling the fluid to flow from the suction part to the pump chamber and blocking the flow in the reverse direction. The piston makes a typical reciprocating movement in the cylinder (Figure 9).
The pump’s working range and the value of the supplied mass stream at the inlet of the reactor had an unsettled character and resembled a sine wave (due to the step nature of pump operation every 2.5 s); hence, it was necessary to develop a proper mathematical model that would reflect the cycle of the numerical operation of the reactor in the Ansys-Fluent software.
The approximate conditions prevailing at the inlet to the reactor were expressed in the following form:
Figure 10 shows the effects of the developed mathematical model (1) taking into account the following input data:
- -
- Mass stream value for t = 0 (kg s−1);
- -
- Amplitude of the reactor’s working cycle A = 0.001;
- -
- The period of the reactor’s work cycle ω = 1 (s−1).
The User Defined Function (UDF) programming tool enabled the implementation of the mathematical model (1) in the numerical model as a boundary condition of the supplied gasification agent at the inlet to the gasification reactor [27].
In addition to testing the volume fraction of individual process gas components, the following were also measured: the duration of filling HDPE bags with process gas (texp), the volume of synthesis gas (Vsyngas), the coal sample mass before gasification (mC1) and after gasification (mC2), and determining their difference (mC3), as well as the mass (mH2O(l))and volume (VH2O(l)) of the pure water supplied into the reactor with a piston pump, in order to generate water vapor for the needs of the experiment.
An important aspect during the implementation of each coal gasification process is the well-defined porosity of hard coal, ensuring the correct access of the gasification agent to the layer consisting of micro and submicropores. As experience shows [2,3,20], in the conditions of UCG, low permeability of coal beds is a frequent reason why a reactor may stop working, due to high resistance preventing the normal flow of gasification and the outflow of reaction products. Therefore, an attempt was made to capture the changes in the porosity of the tested coal samples and the impact on the quality of the process gas obtained by examining the value of pressure changes at the inlet to the gasification reactor (the results are given in the tables). The values of pressure change read from the measurements made it possible to estimate the flow resistance parameter in the Ansys-Fluent software.
Each experimental test was repeated three times, and the results are presented in Table 2 and in Figure 11, Figure 12, Figure 13, Figure 14, Figure 15 and Figure 16.
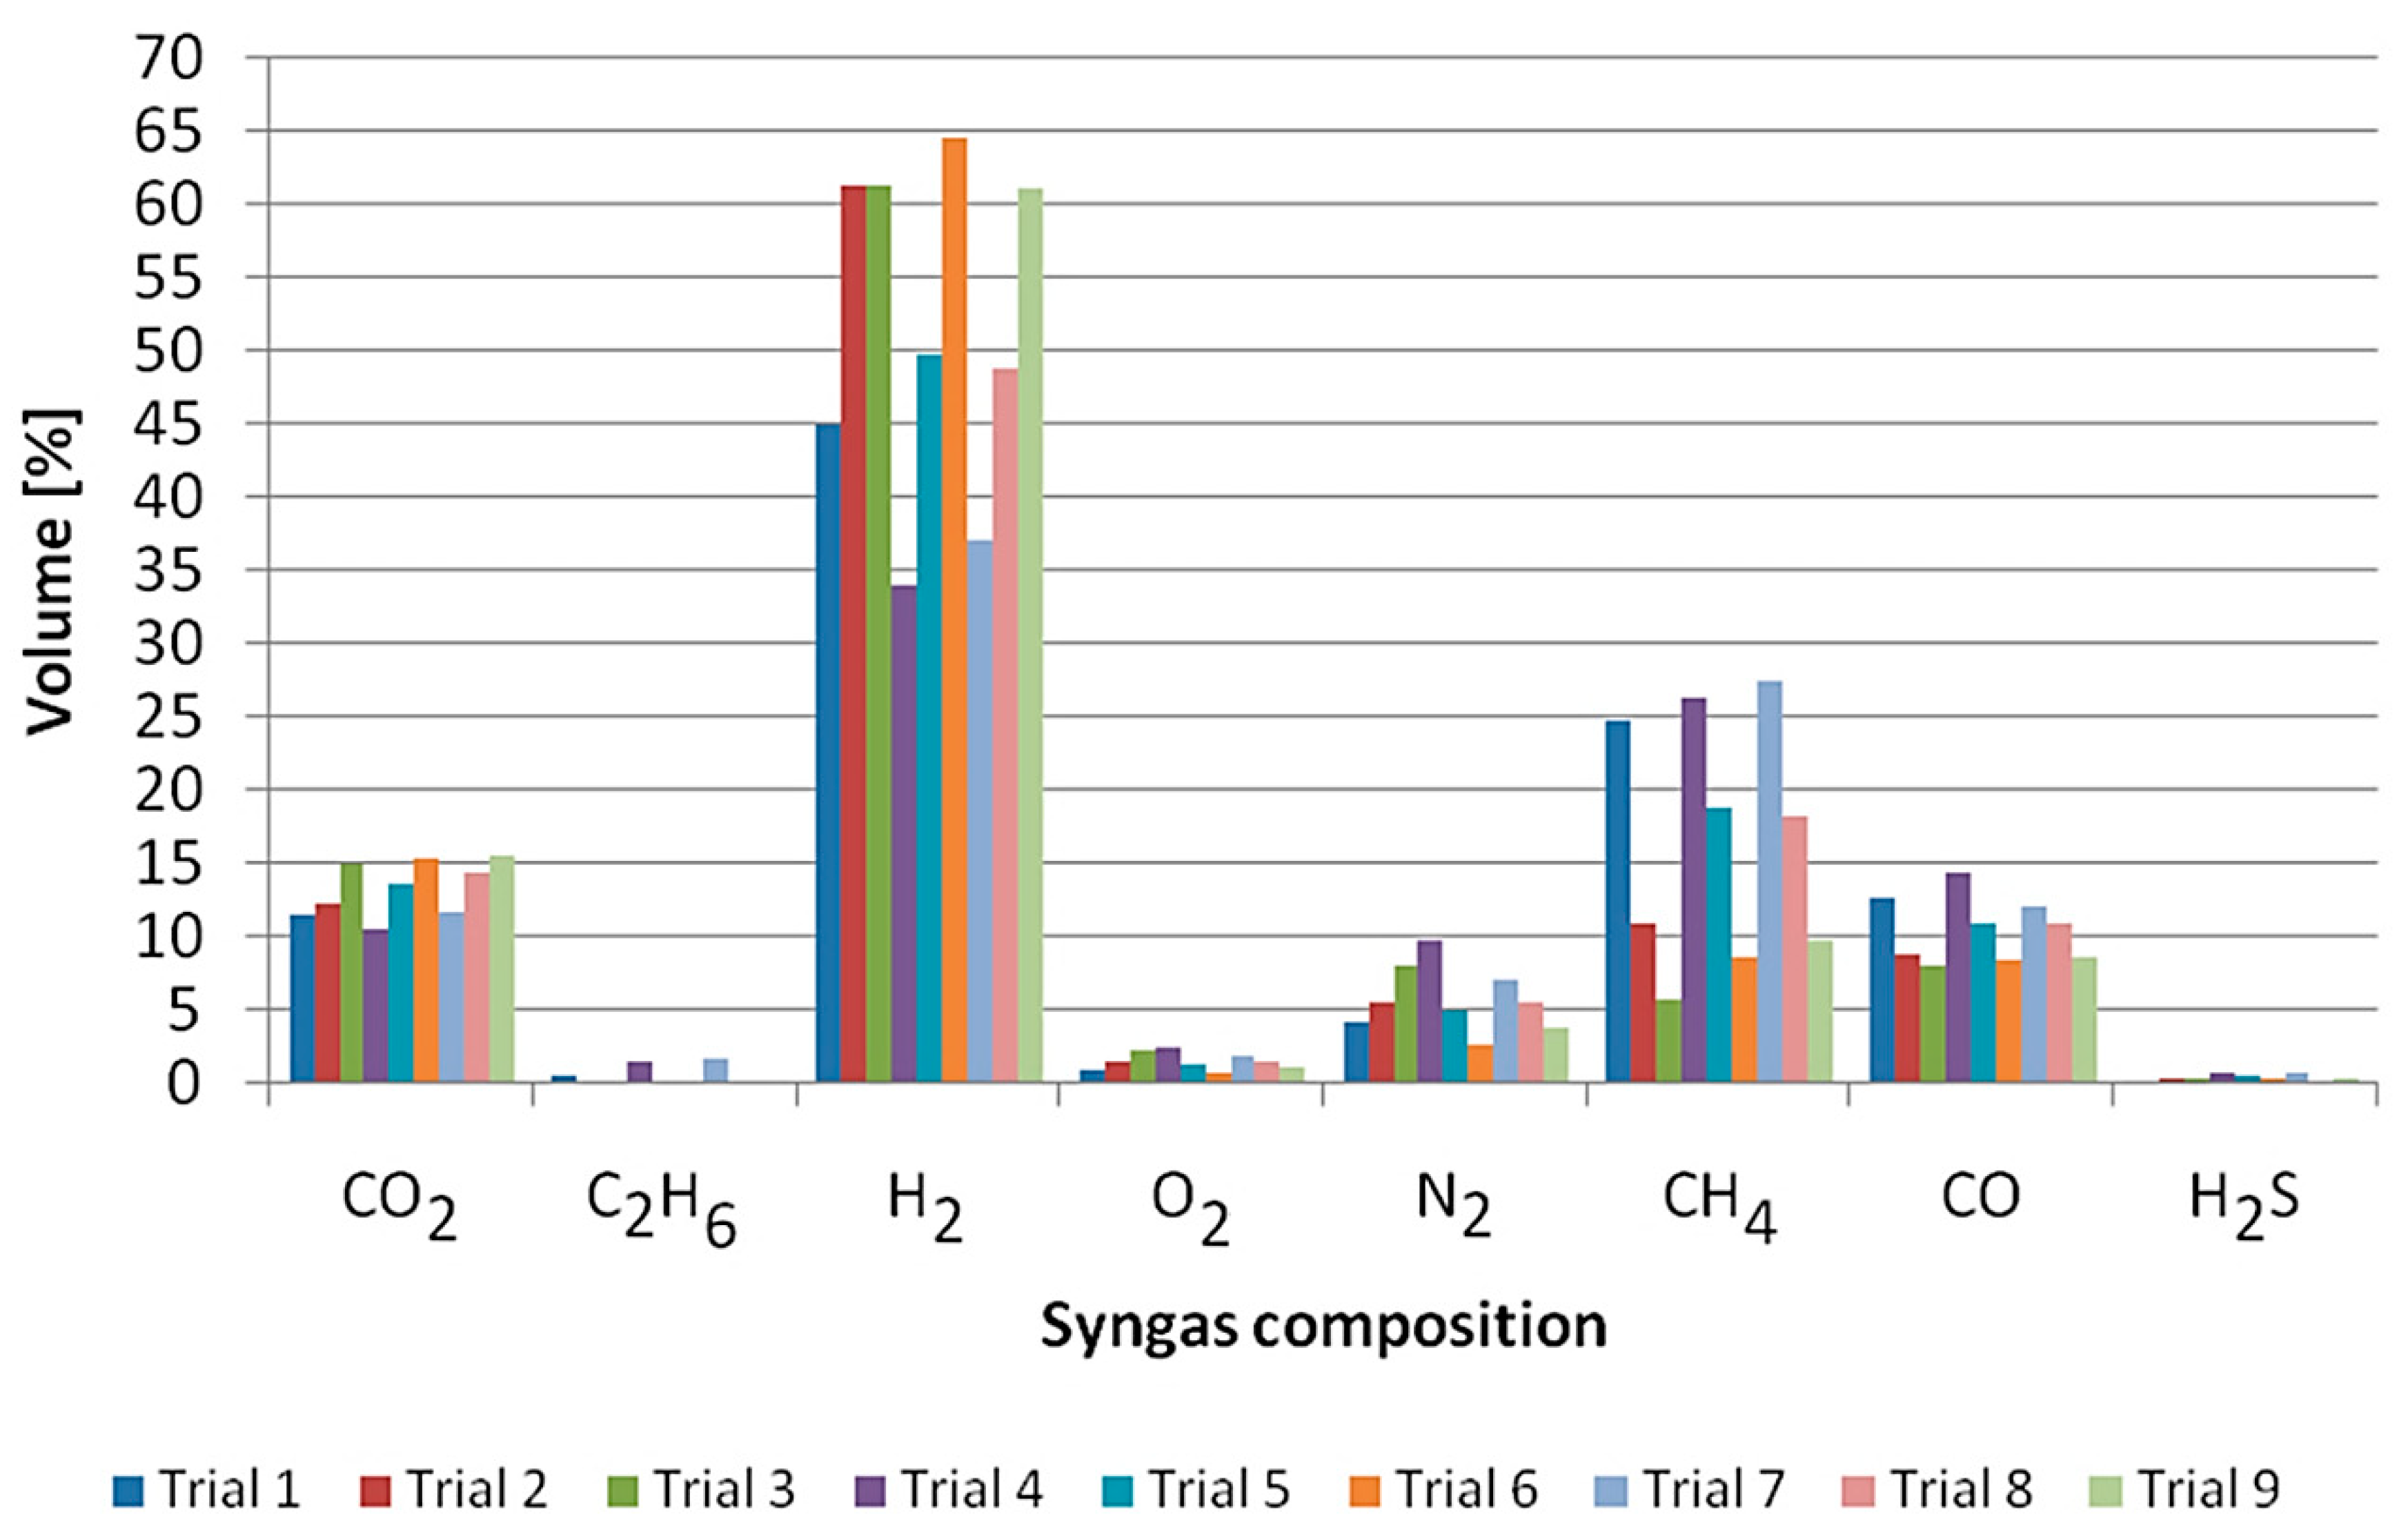
Figure 11 presents the syngas composition obtained during the gasification of the coal sample from the hard coal mine A, where the average concentration of H2 in the syngas was approximately 51.5%, the average concentration of CO2 was approximately 13.3%, the average concentration of CH4 in the syngas was approximately 16.70%, and the average concentration of CO in the syngas was approximately 10.50%. However, the average concentration of the other syngas components, such as O2, C2H6, N2, and H2S, was approximately 8%.
Figure 13 presents the syngas composition obtained during the gasification of cola sample from the hard coal mine B, where the average concentration of H2 in the syngas was approximately 48%, the average concentration of CO2 was approximately 13.70%, the average concentration of CH4 in the syngas was approximately 19.40%, and the average concentration of CO in the syngas was approximately 11.20%. However, the average concentration of the other syngas components, such as O2, C2H6, N2, and H2S, was approximately 7.70%.
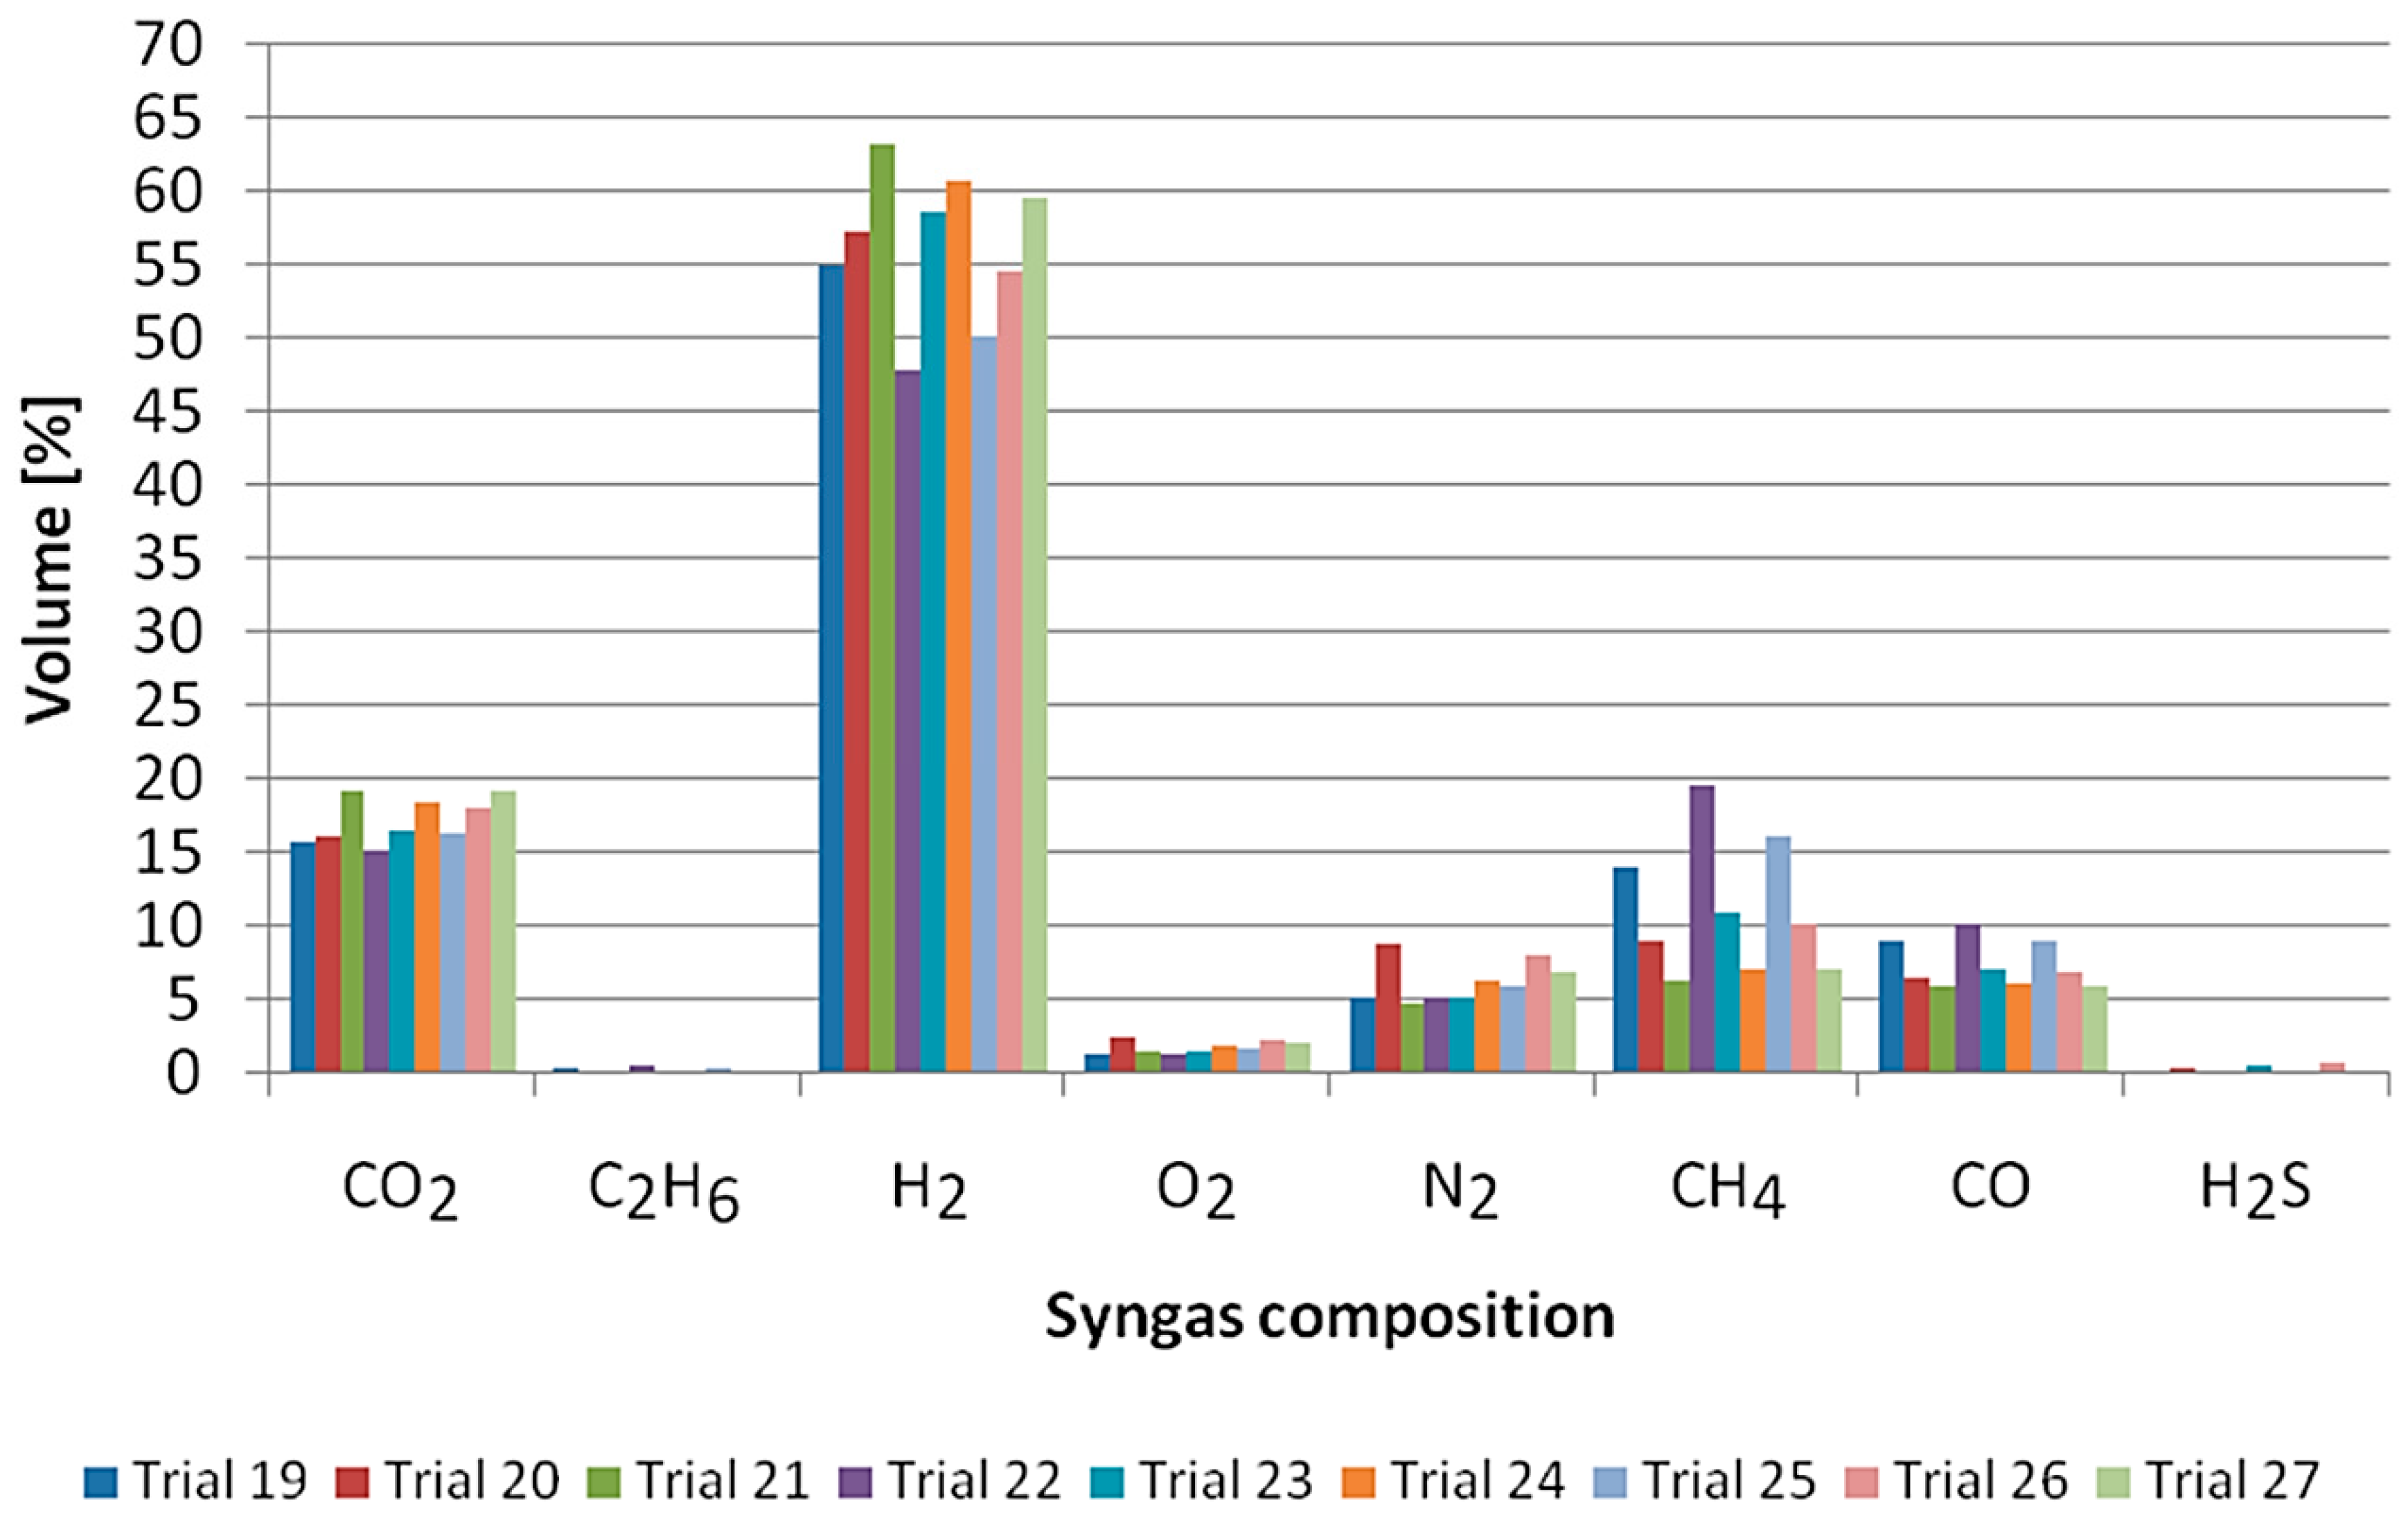
Figure 15 presents the syngas composition obtained during the gasification of the cola sample from the hard coal mine C, where the average concentration of H2 in the syngas was approximately 56.30%, the average concentration of CO2 was approximately 7.30%, the average concentration of CH4 in the syngas was approximately 11.10%, and the average concentration of CO in the syngas was approximately 7.30%. However, the average concentration of the other syngas components, such as O2, C2H6, N2, and H2S, was approximately 18%.
2.2. Numerical Model
2.2.1. Geometry
Figure 17 presents the geometric model of the reactor, which corresponds to the real dimensions of the gasification reactor designed and constructed for the needs of the tests, meeting the requirements in terms of geometric dimensions and flow characteristics. When developing the spatial model of a gasification reactor, the following information was taken into consideration:
- -
- Gas-field geometry;
- -
- Geometry of the gasification channels;
- -
- Geometry of the tested coal sample.
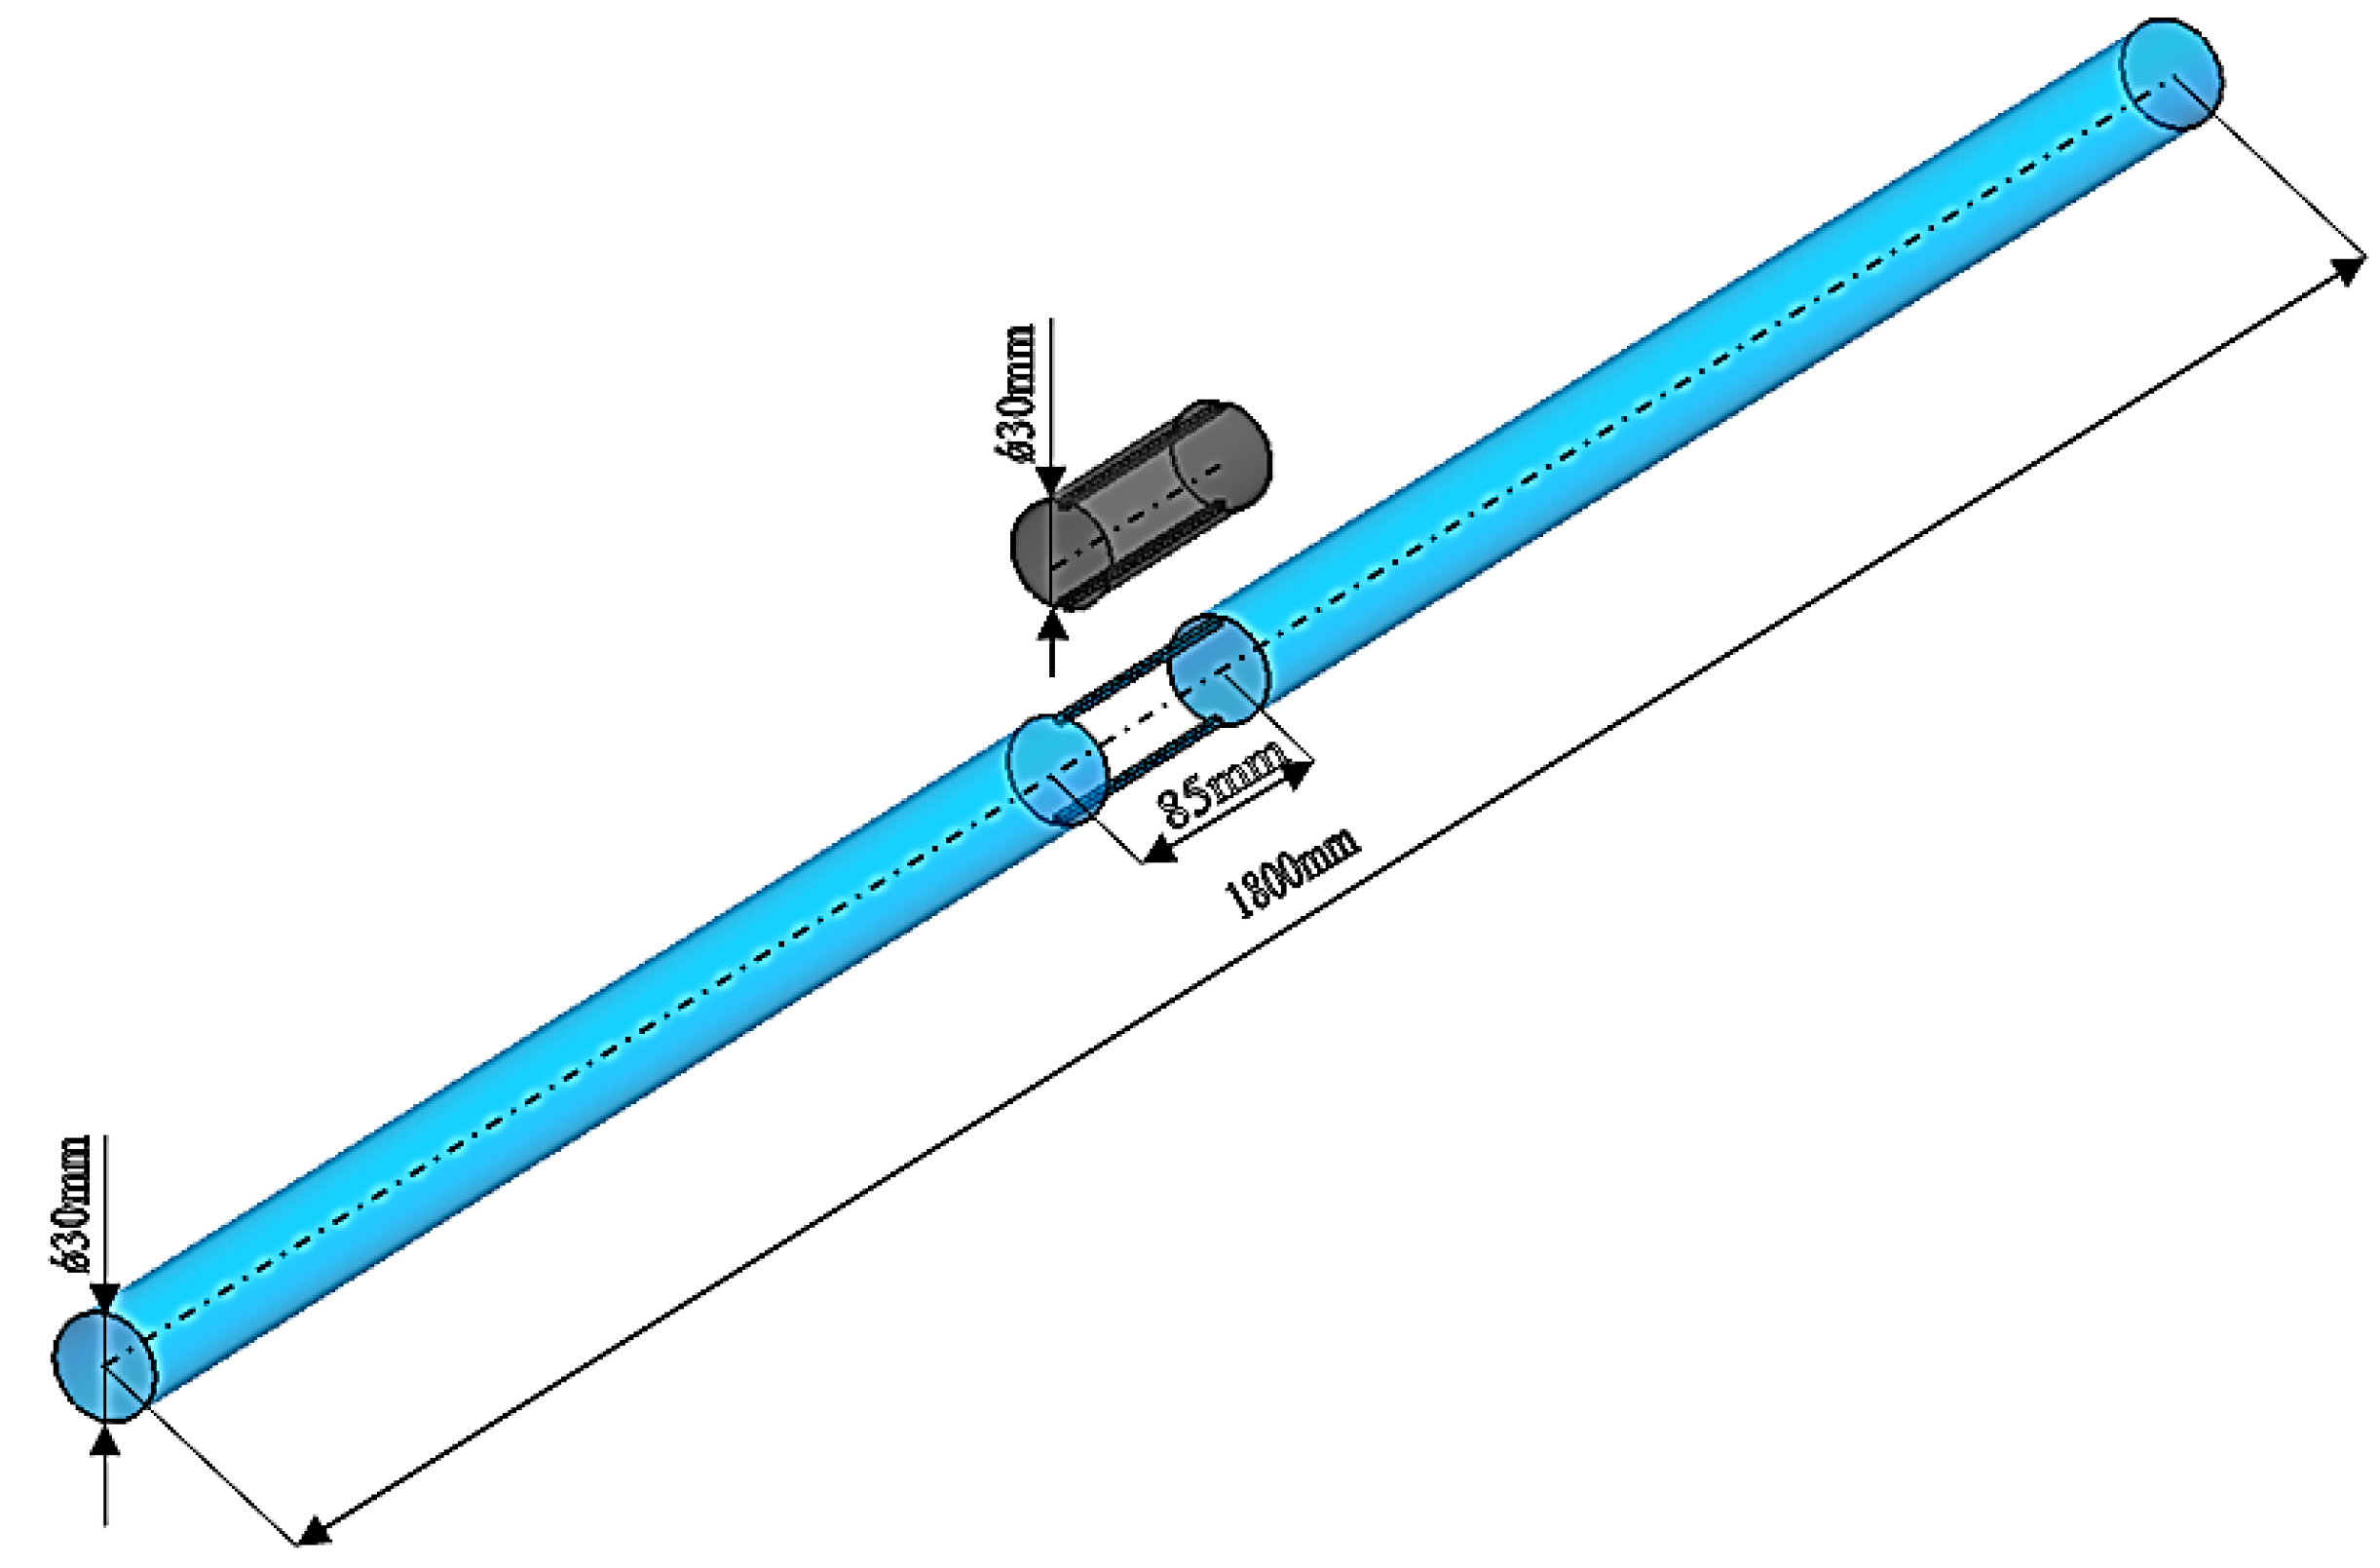
The following solid model has been specified for the purposes of simulation in the Ansys-Fluent software (Figure 18):
- -
- Model of cylindrical coal sample—Ø0.03 m × 0.085 m;
- -
- Model of gasification channels—0.002 m × 0.002 m × 0.085 m;
- -
- Model of the fluid volume filling the gasification reactor—Ø0.03 m × 1.8 m.
Figure 18 shows the solid model, which makes it possible to carry out the numerical calculations presented in this paper, which are aimed at determining the volume composition of CH4, CO, CO2, and H2 in process gas.
2.2.2. Numerical Grid
Figure 19 shows the results of the developed numerical grid of the entire area of the medium flow in the gas and coal sample.
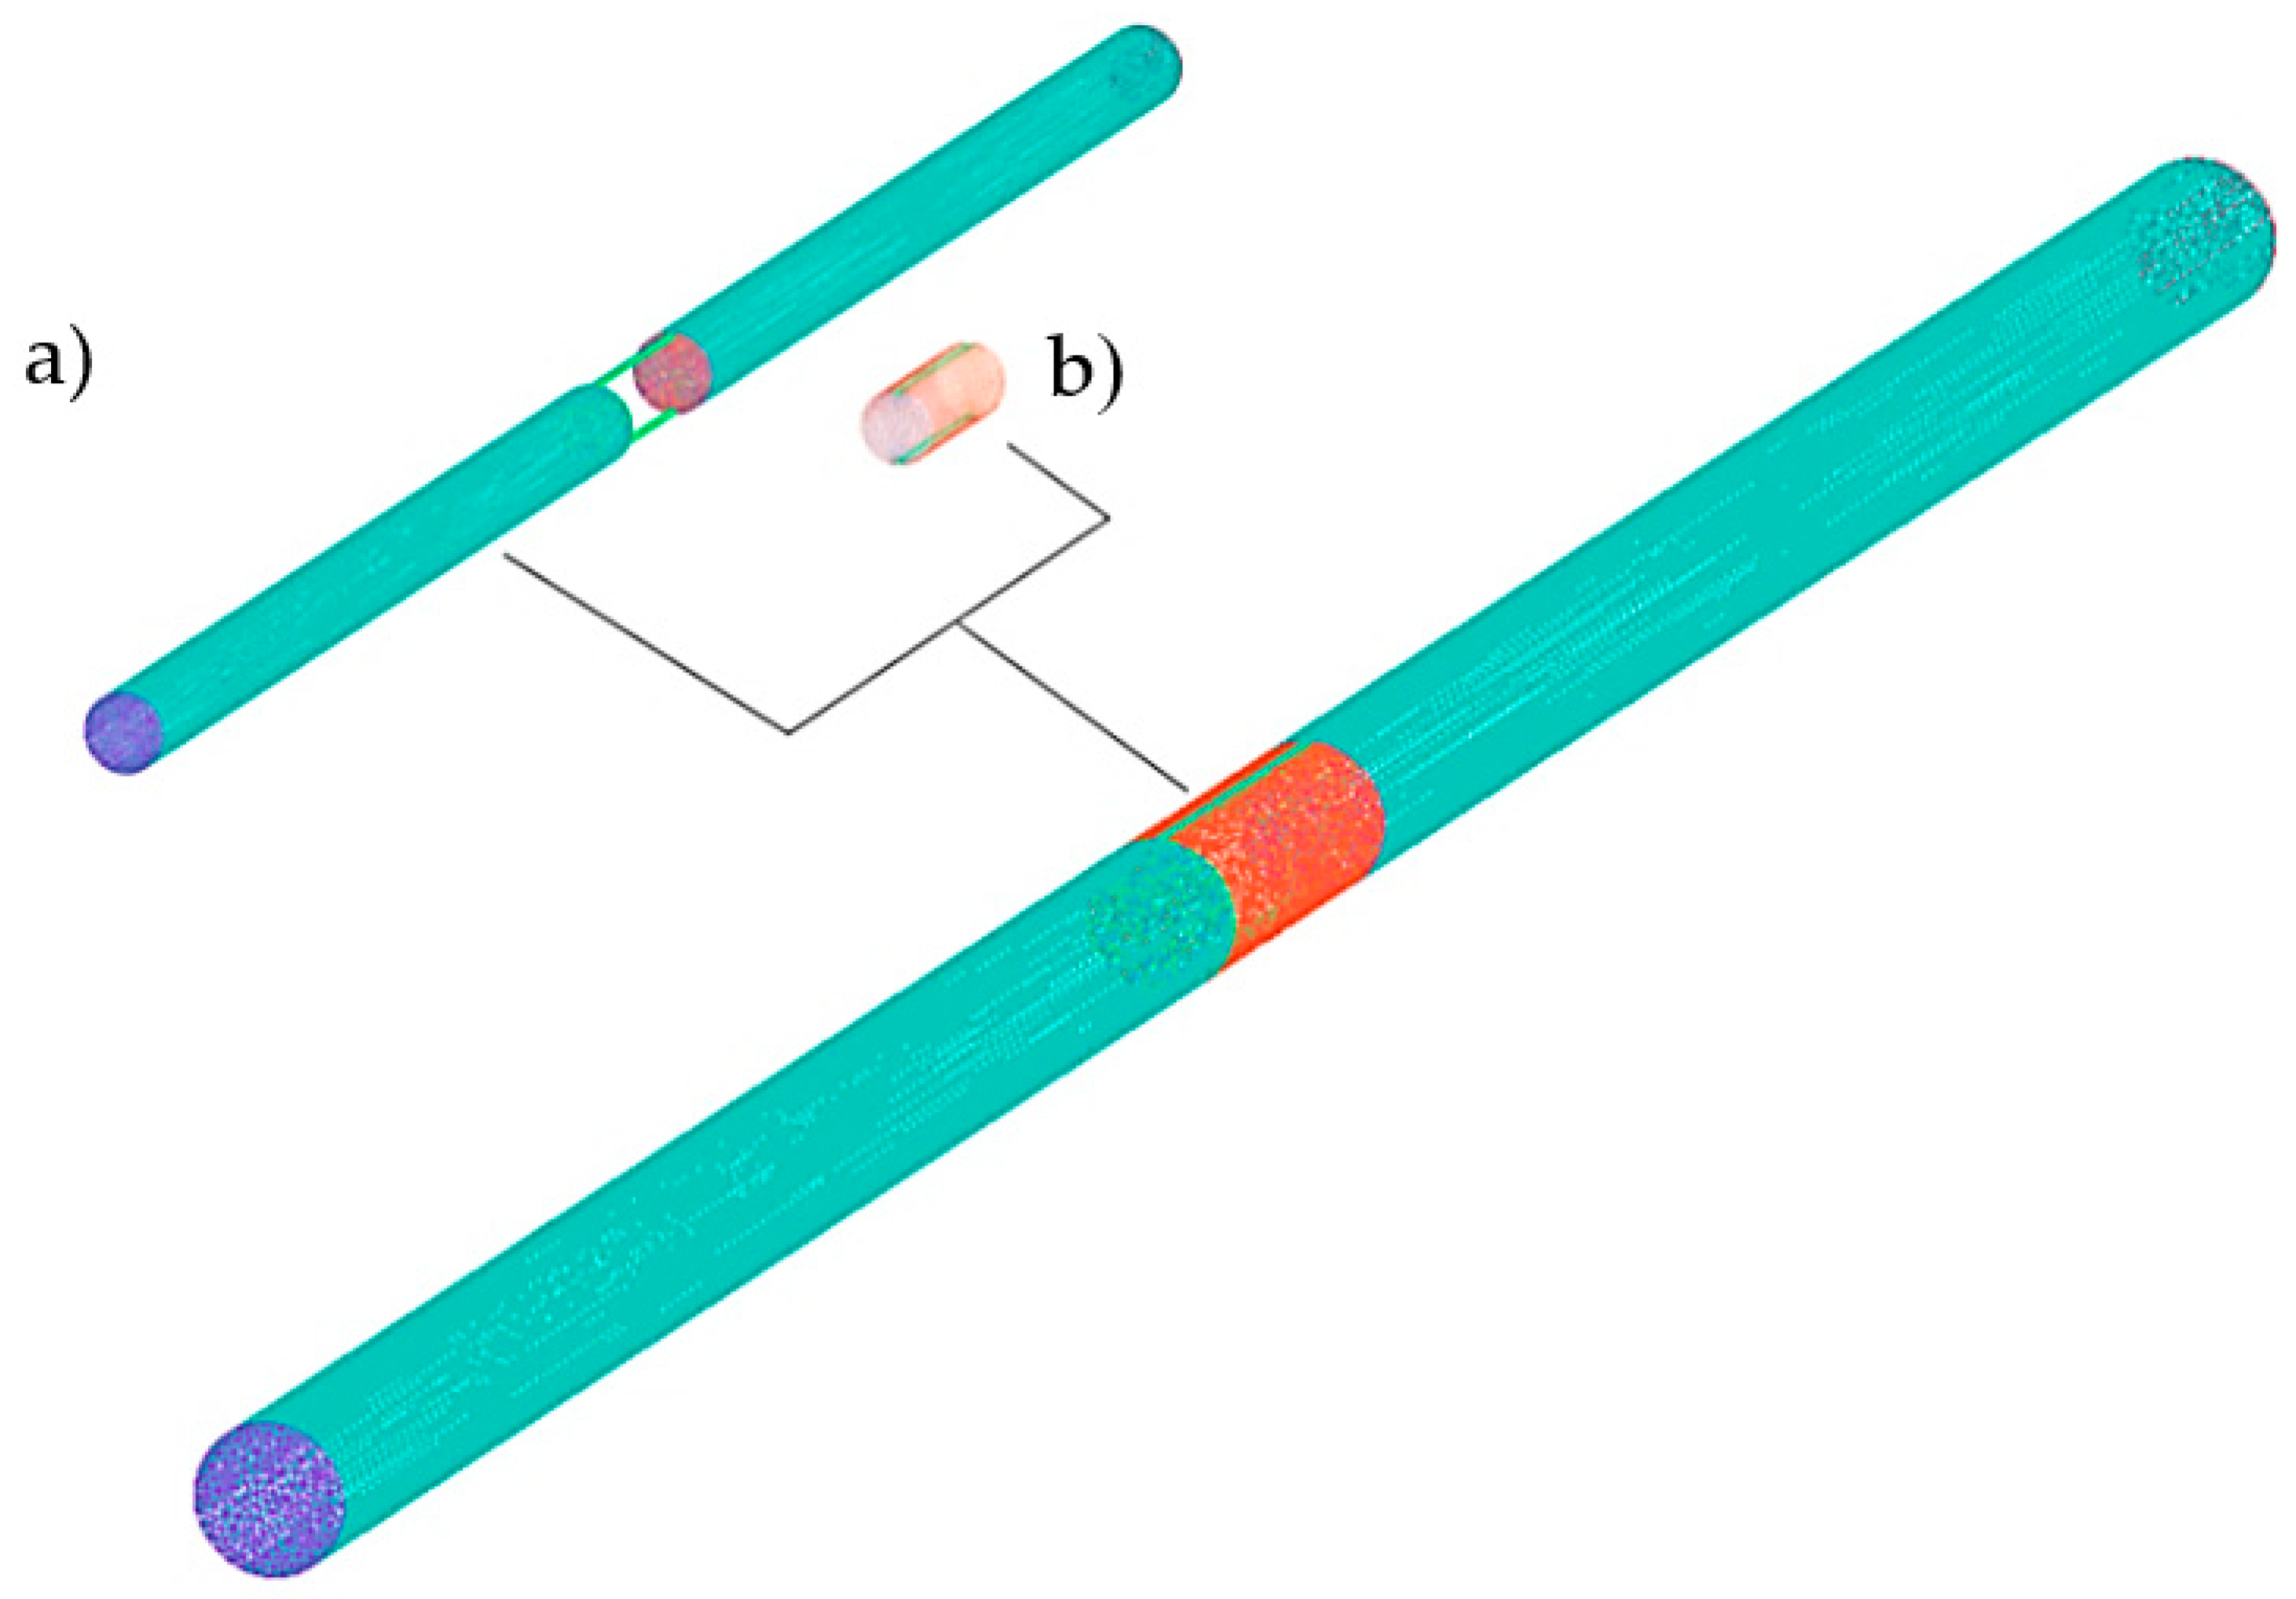
In the case of flows with a simultaneous chemical reaction, it is recommended that very dense numerical grids of the area occupied by the fluid should be aimed for in order to capture the processes occurring in the modeled flow more accurately. These requirements were decisive and resulted in the development of two types of numerical grids, namely:
- -
- A non-structural gasification reactor numerical grid constructed of 143,230 nodal points connected with 776,282 straight elements (volume 0.000714821 m3), reflecting the area occupied by the fluid.
- -
- A numerical grid of the unstructured mass model of the cylindrical coal sample built of 4132 nodes connected with 19,865 straight elements (volume 0.0000589 m3).
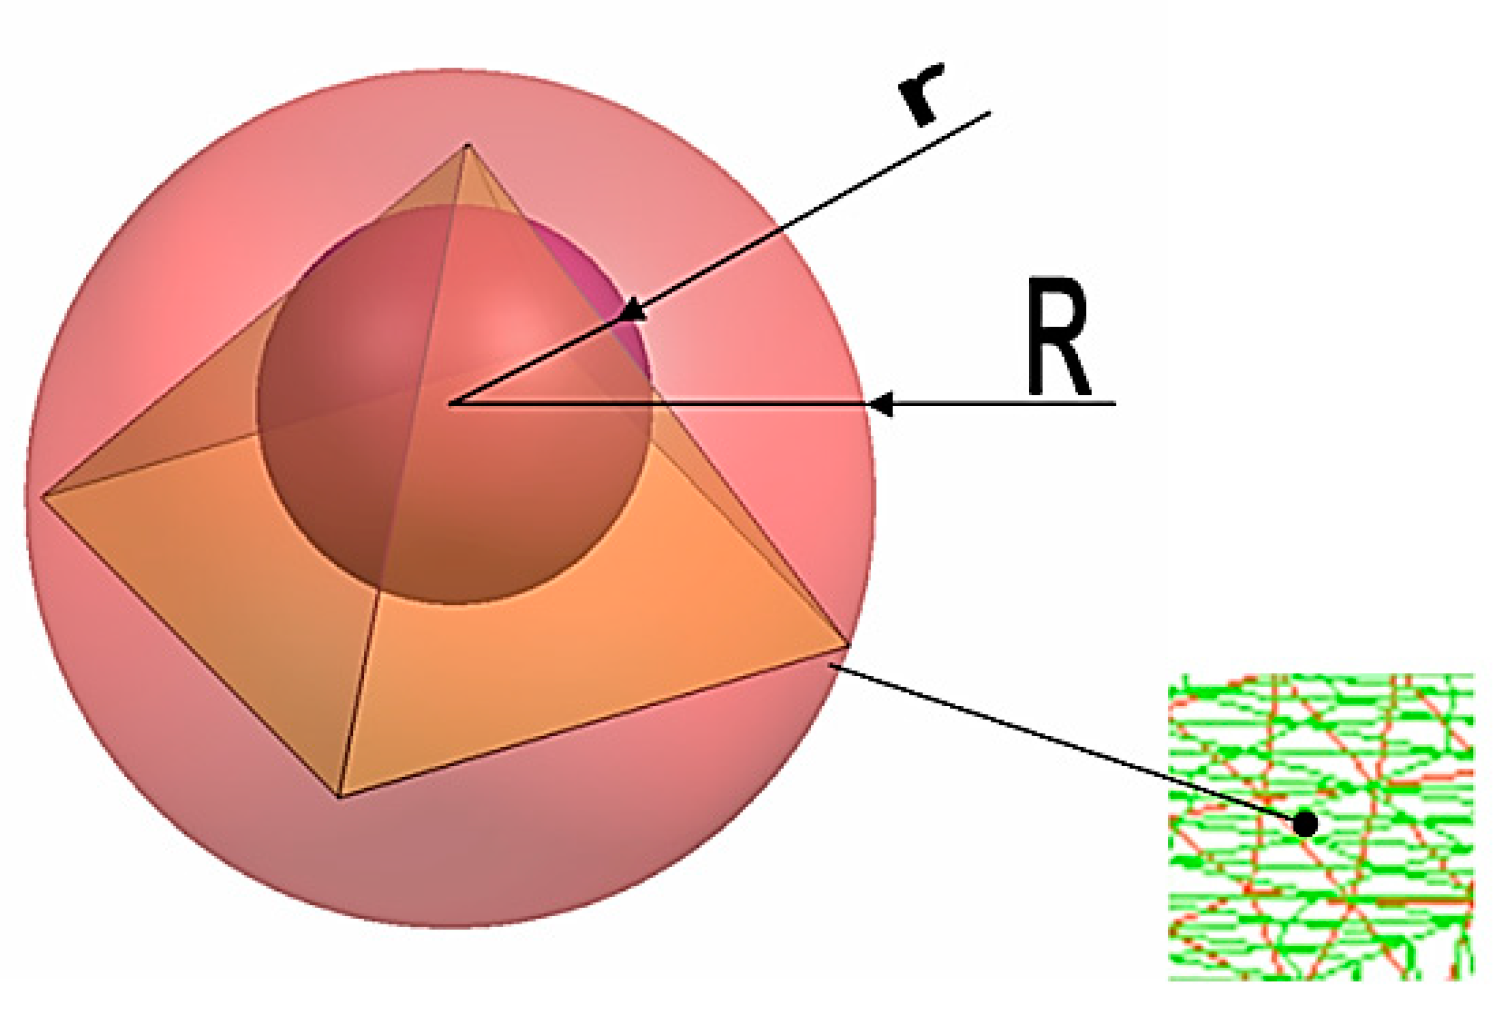
The numerical grid should be characterized by having computational cells of regular shape and identical size, which in practice proves to be too difficult to achieve. This necessitates the need for an appropriate criterion, which, by its description, will provide a measure of deviation from this optimum. In Ansys-Fluent, this criterion is the aspect ratio (aR) defined by the relation [27]:
These criteria are satisfied if the obtained value from Equation (2) is strongly less than the value of 100. This criterion ensures obtaining a stable numerical solution as well as a faithfully reproduced volume occupied by the fluid [27]. Figure 20 illustrates the idea of the mesh convergence adapted in the Ansys-Fluent code based on the aspect ratio.
For the developed numerical grid, the minimum value of the aspect ratio was aR = 21.07, which means that the numerical grid was developed properly, according to [27] recommendations.
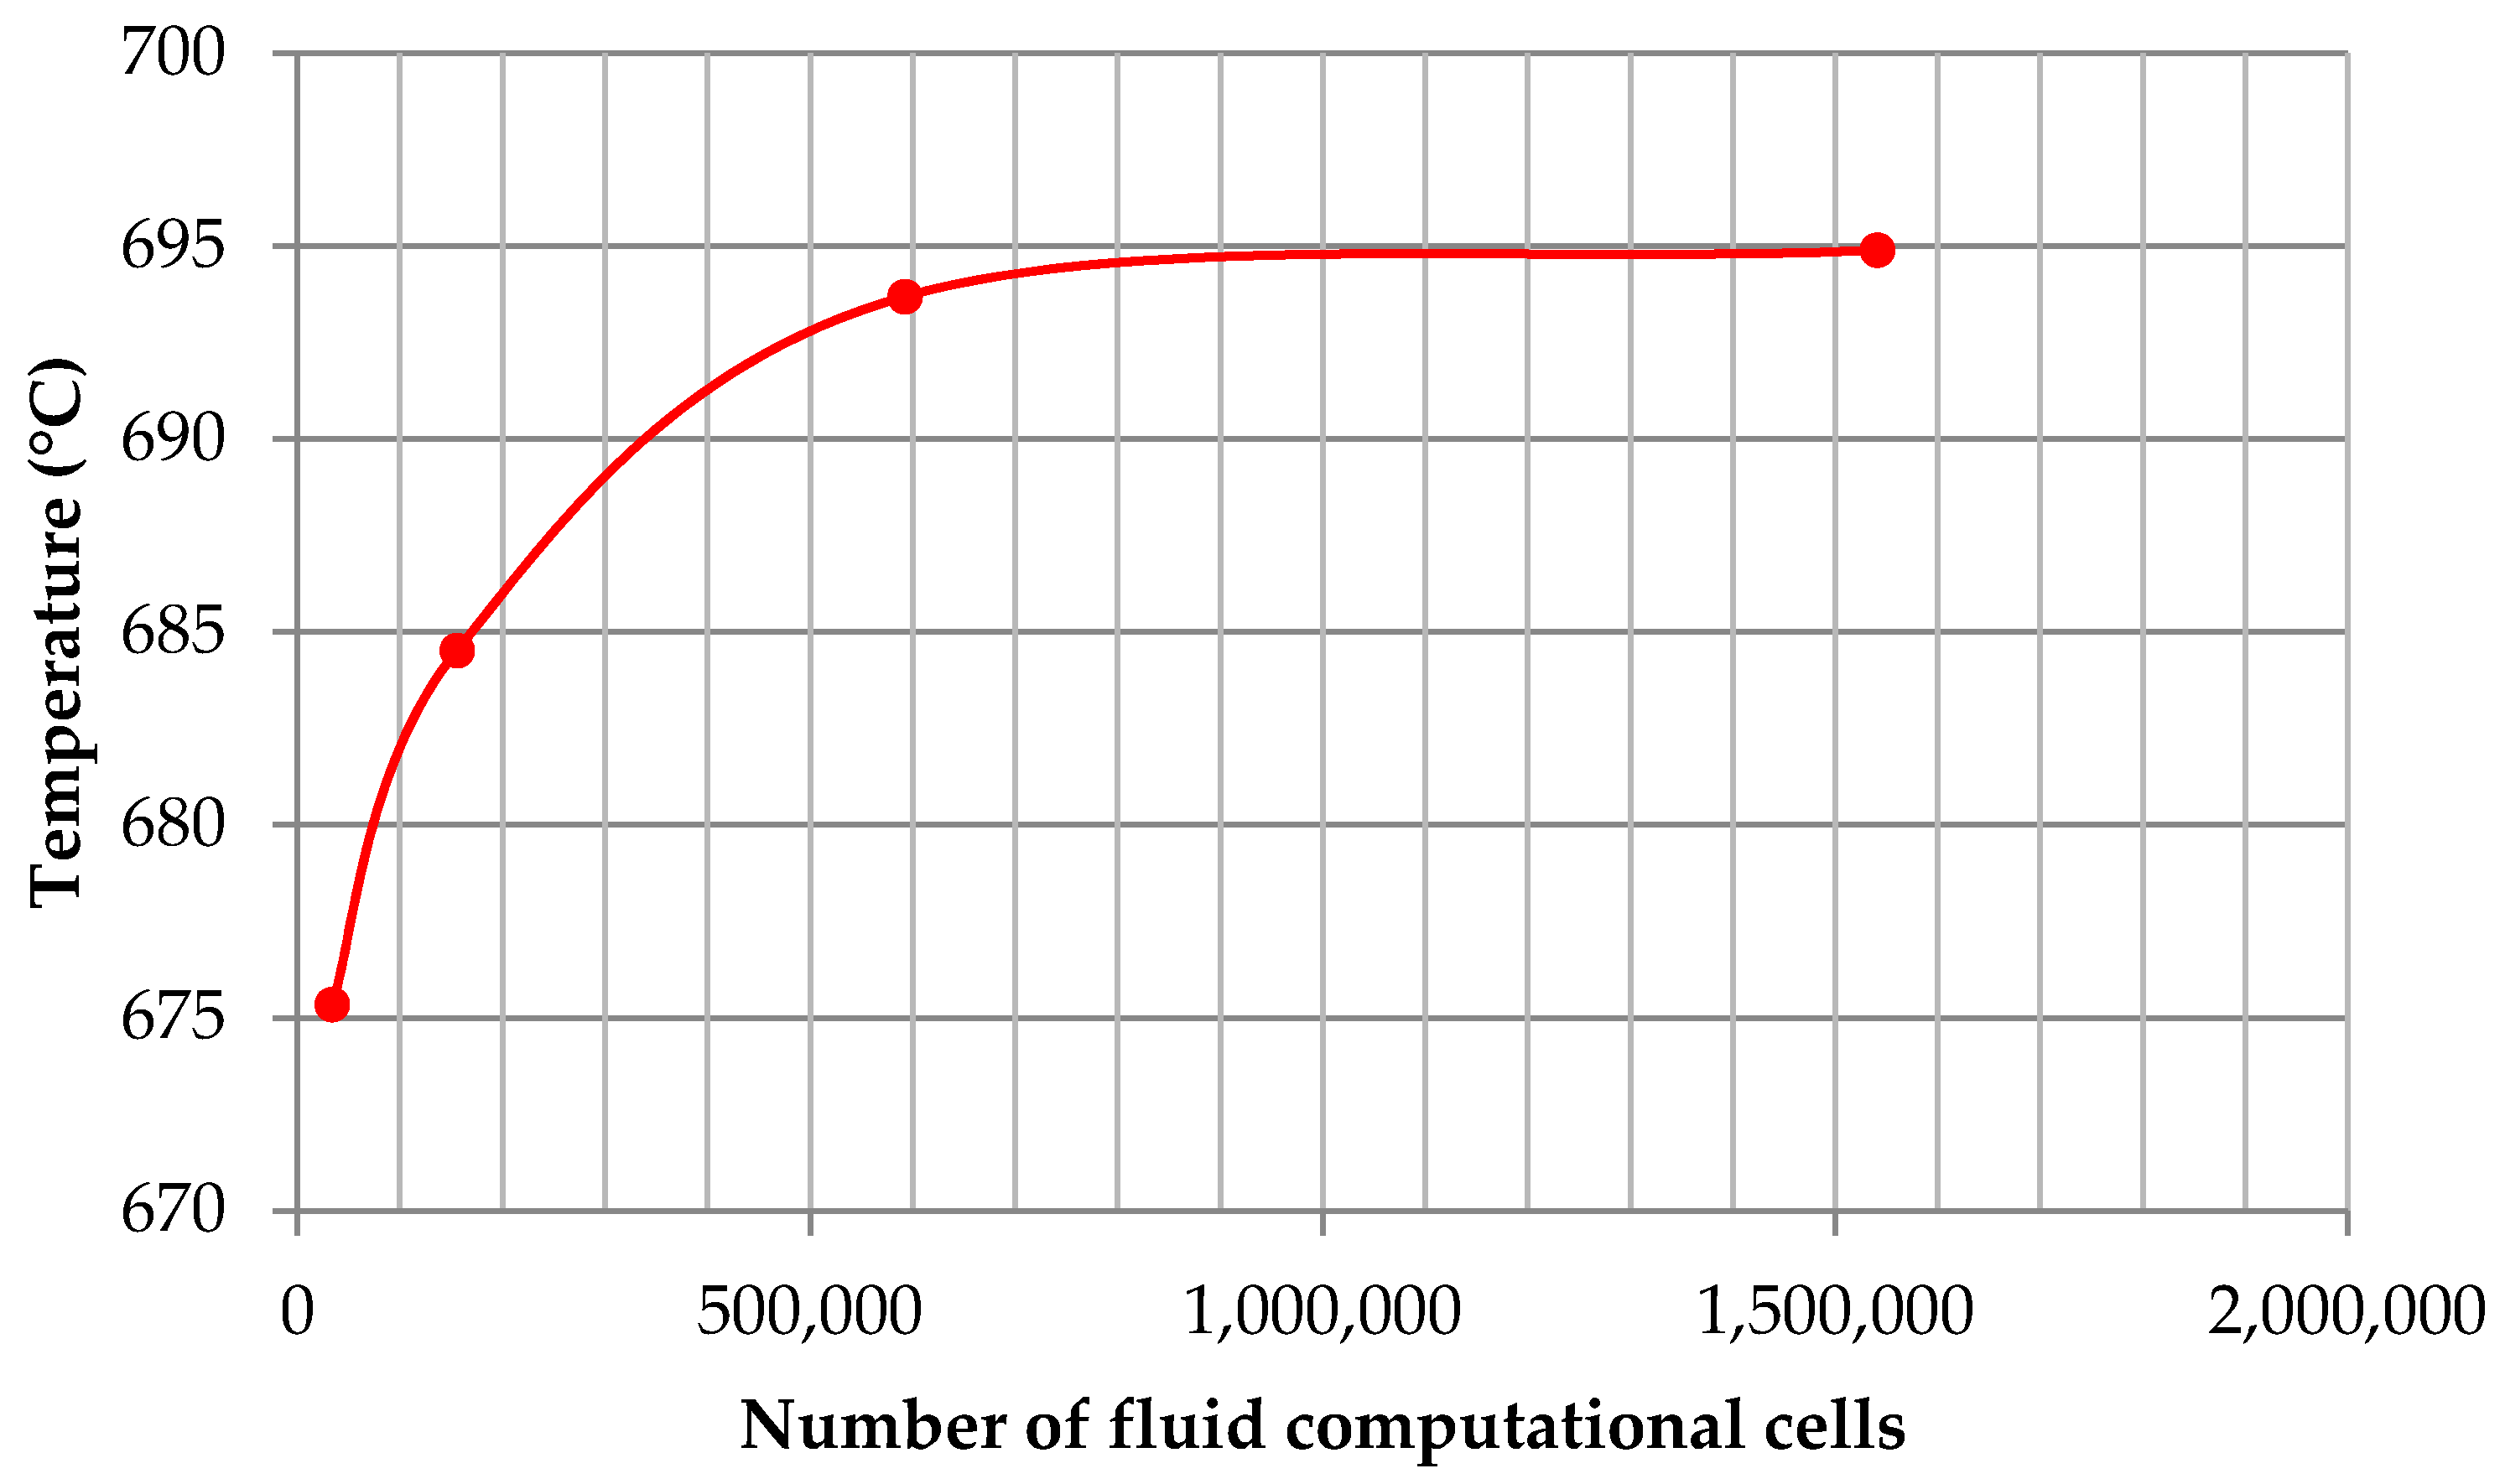
Moreover, in order to ensure that the numerical grid was correct, the influence of the mesh density was considered. Figure 21 illustrates the influence of the mesh refinement study on the temperature results in the numerical model. The fluid temperature was measured at the outlet of the reactor model.
The results of the four mesh densities were compared in Table 3.
It can be observed in Table 3 that the coarse and normal mesh forecast less accurate temperatures, but the fine and very fine mesh forecast similar results. In this case, it was decided that the mesh in the numerical model will contain above the 1,000,000 computational cells, according to the convergence study results.
2.2.3. CFD Method Assumptions
The quantitative description of the reactive flow depends on the nature of the flow as well as the kinetics of the reaction. Therefore, an essential condition for obtaining an unambiguous solution is to precisely specify the conditions of uniqueness, i.e., the characteristic features specific to a given process and object. The basic conditions of uniqueness, which is characteristic for the gasification process, is to consider four pieces of information: the scope of the interpretation of the transport equations and the accompanying models of chemical reactions, the initial and boundary conditions, and the state equation. By approaching the modeling of the coal gasification process, in terms of computational fluid dynamics (CFD) in the description of the process gas flowing, it is very important to show its properties in the form of the distribution of changes in parameters, such as temperature, pressure, and chemical composition in the reaction space with a given geometry and time interval. The modeling of the transfer process using CFD methods consists of solving a system of differential equations, describing the principle of the conservation of mass, momentum, and energy, as well as the equations of transporting fluid components, together with chemical reactions and state equations [28].
The basic equations describing the behavior of the flowing fluid along the gasification reactor in the Ansys-Fluent software are expressed by the following relationships [2,25,27,28]:
- -
- Mass conservation equation:
- -
- The source term Sp in Equation (2) is the additional mass due to the devolatilization of coal momentum conservation equation:
- -
- Energy conservation equation:The source term Sh in Equation (5) is the source for reaction heat.
- -
- Chemical reaction conservation equation:
The source terms such as Sh, Ri, and in Equation (6) appear because of the gradients in temperature and concentration. In Table 4, the source terms are listed.
In Table 4, , is the mass flow rate of volatile mater and pure steam, is the heat of reaction of coal gasification, is the molecular weight of species, is the Arrhenius molar rate, is the turbulent Schmidt number (sct = 0.7 [27]).
For the purpose of modeling the coal gasification process in the Ansys-Fluent software related to the gasification process, the most common CFD turbulence model was used to determine the viscosity of μt turbulence using the kinetic energy of vortices and dissipation rate (loss of fluid energy over time as a result of friction or turbulence) referred to as the k-ε turbulence model.
The model of viscosity of turbulence μt is expressed in the following equation [27]:
The most common forms of transport equation for the kinetic energy of turbulence k and dissipation ε have the form [27]:
- -
- For kinetic energy of turbulence
- -
- For dissipation energy
The k-ε turbulence model has been adopted in many previous literatures for numerical modeling of the coal gasification process [5,6,11,12]. In additional, the pressure-based solver was used, where the flow equations and species were solved using the second-order scheme as a spatial discretization. The SIMPLE algorithm procedure was used to solve the Navier-Stokes equations. The second order implicit was used as a transient formulation.
2.2.4. Gasification Reaction
v—volatile matter.
Equation (10) interprets the coal-drying process, while expressions (11) and (12) describe the pyrolysis process. Equation (13) ÷ (16) describe the solid phase reaction. Equation (17) ÷ (18) describes the gas phase reaction. The kinetics of the gasification process was defined by the following equation [27]:
where A is a constant for each chemical reaction, T is the absolute temperature of the reaction, E is the activation energy, and R is the universal gas constant. The parameter values used in the calculation of the gasification reaction kinetics are listed in Table 5.
As a result, a probable distribution of changes in the gasification reaction products, including CH4, H2, CO2, and CO are obtained.
2.2.5. Initial and Boundary Condition
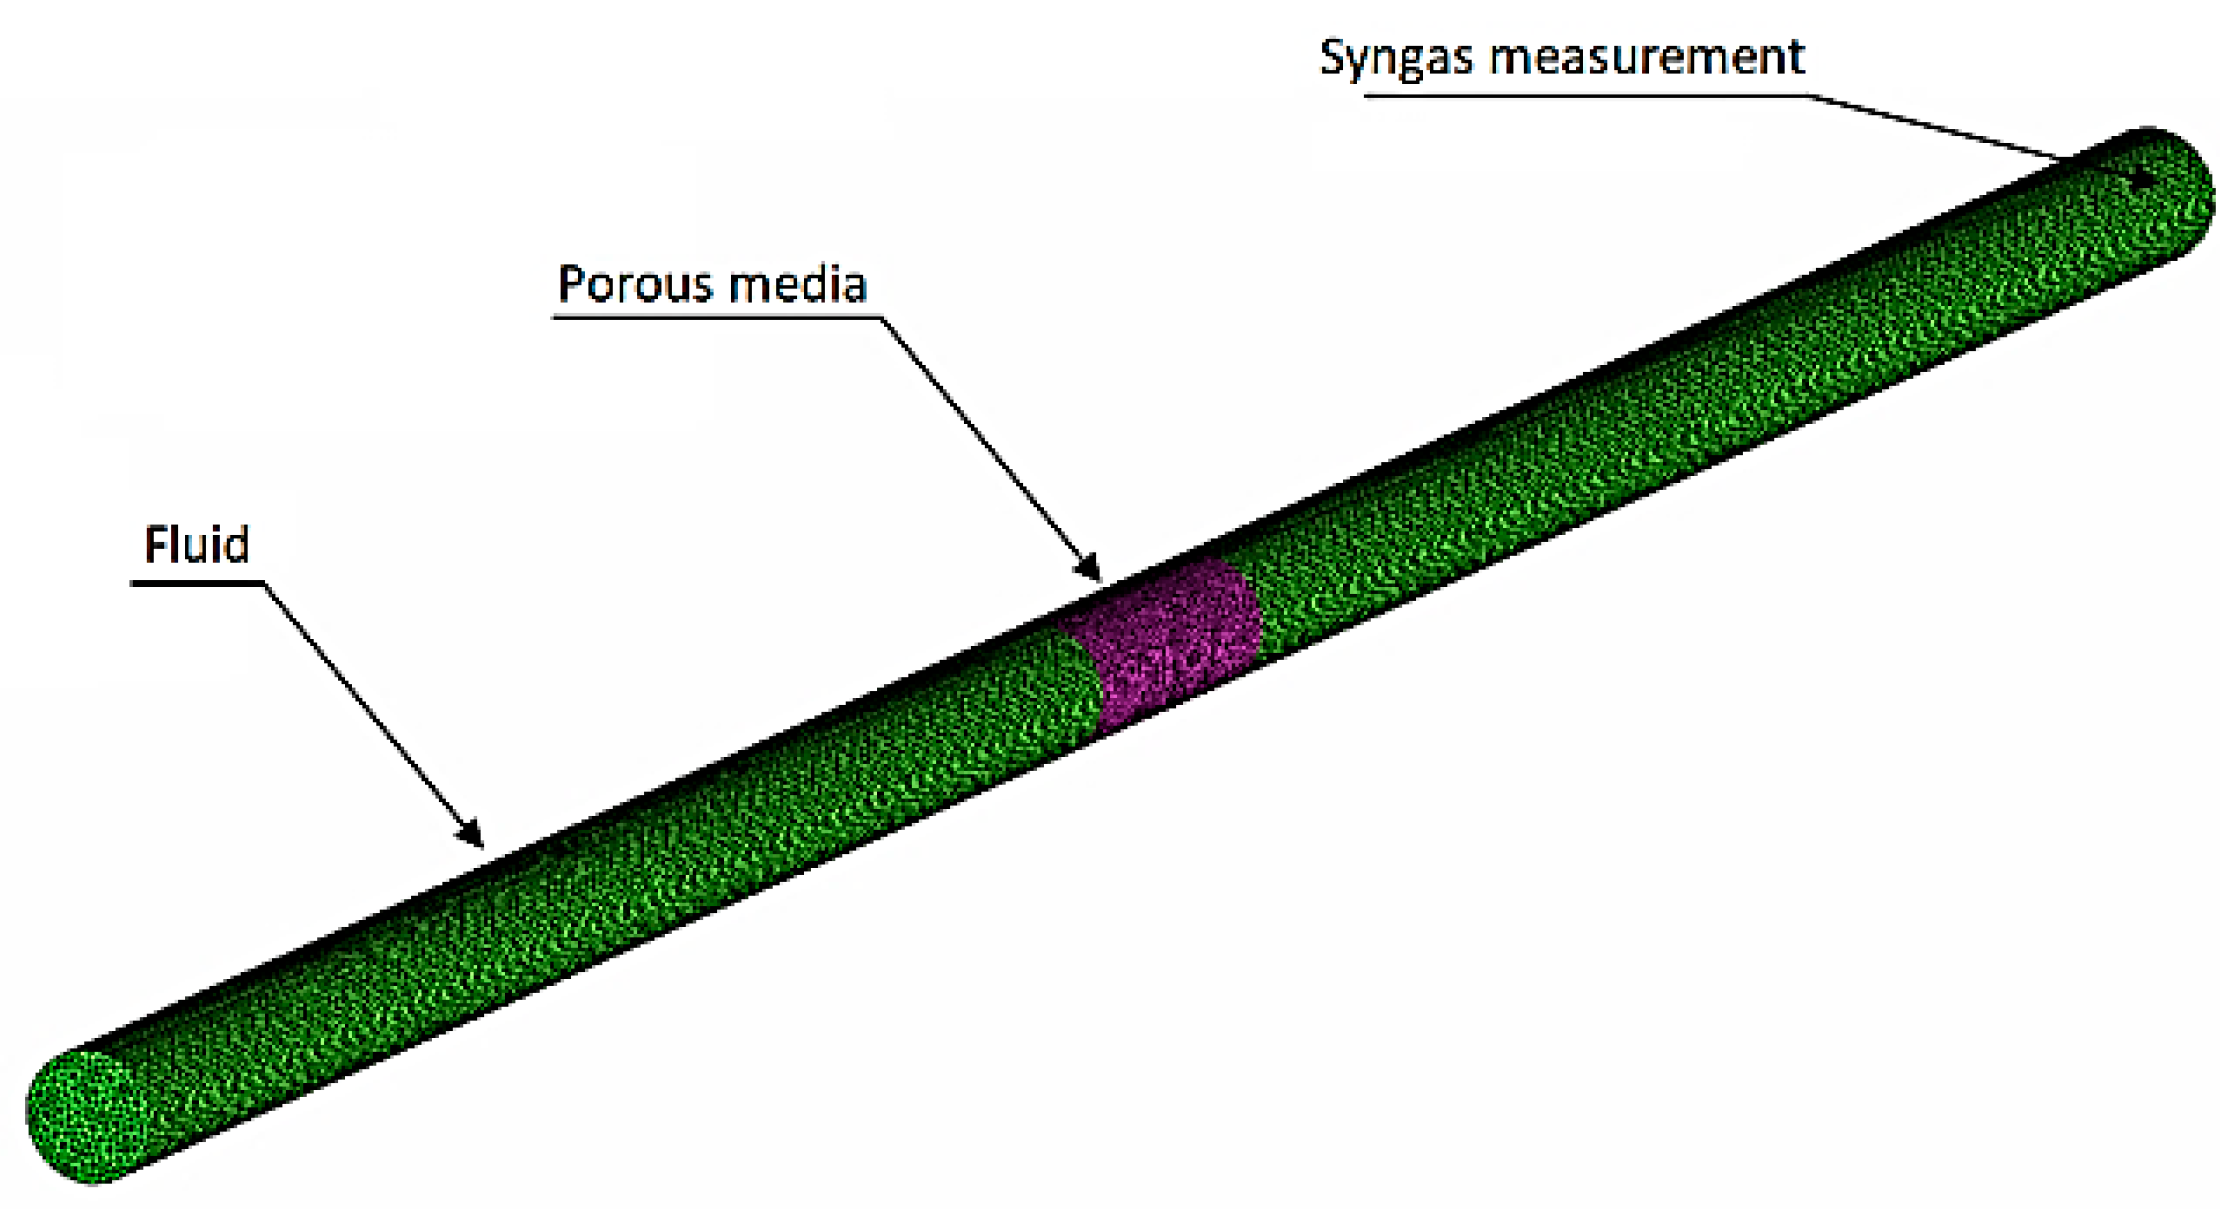
After defining the scope of the interpretation of the transport equations, the next step was to define the initial and boundary conditions. This analysis took into account the gas-phase geometry (fluid element) and the coal sample model as a porous medium, where, for specific boundary conditions, calculations were made enabling the verification of the obtained results from the real system through the developed mathematical models and numerical calculation method in the Ansys-Fluent software. The measurement system for the CH4, CO2, CO, and H2 gas composition was located at the reactor outlet, as shown in Figure 22.
The following initial and boundary conditions are included for each of the areas of the numerical grid:
- (1)
- For the gasification reactor geometry (fluid element):
- -
- The temperature and value of water vapor mass flow H2O—700 (°C) and mass flow rate (kg s−1) calculated on the basis of (16);
- -
- Specific heat of water vapor H2O cpH2O calculated from dependence (4) (J kg−1 K−1);
- (2)
- For the coal sample model (porous medium):
- -
- Rate of coal mass loss—4 (kg h−1);
- -
- Coal density—1300 (kg m−3);
- -
- -
- Coal permeability—1⸱10−15(m2);
- -
- The specific heat of coal—cpC = −464.18+4.97·T − 0.003899261·T2+1.482 ⸱ 10−6·T3− 2.885 ⸱ 10−10·T4 (J kg−1 K−1);
- -
- Temperature T—973.15 (K) (700 °C);
- -
- The value of the thermal conduction coefficient—0.9 (W m−1 K−1);
- -
- The chemical composition of coal samples adopted in the simulation are shown in Table 6.
Other physicochemical parameters for gasification reaction products were taken from the implemented internal database in the Ansys-Fluent software.
The following system settings have been considered in the Ansys-Fluent software, namely:
- -
- Transient state was considered;
- -
- Gasification pressure—101,325 (Pa);
- -
- Turbulence model—k-ε;
- -
- The fluid used in the calculation is water vapor;
- -
- The heat transfer coefficient of the gas mixture—0.0454 (W m−1K−1);
- -
- The timescale of the phenomenon—1040 s (hard coal mine A), 704 s (hard coal mine B) and 545 s (hard coal mine C);
- -
- The roughness of the gasification channel—0.1 (m);
- -
- Time step—0.25 s;
- -
- The convergence of calculations—1 ⸱ 10−4.
3. Results
In Table 7, and the corresponding figures, the values of syngas compositions including CH4, CO2, CO and H2 obtained from the numerical calculations. Figure 22 presents the composition of synthetic gas including CH4, H2, CO2, and CO obtained from the CFD simulation and the ex-situ experiment of the base case.
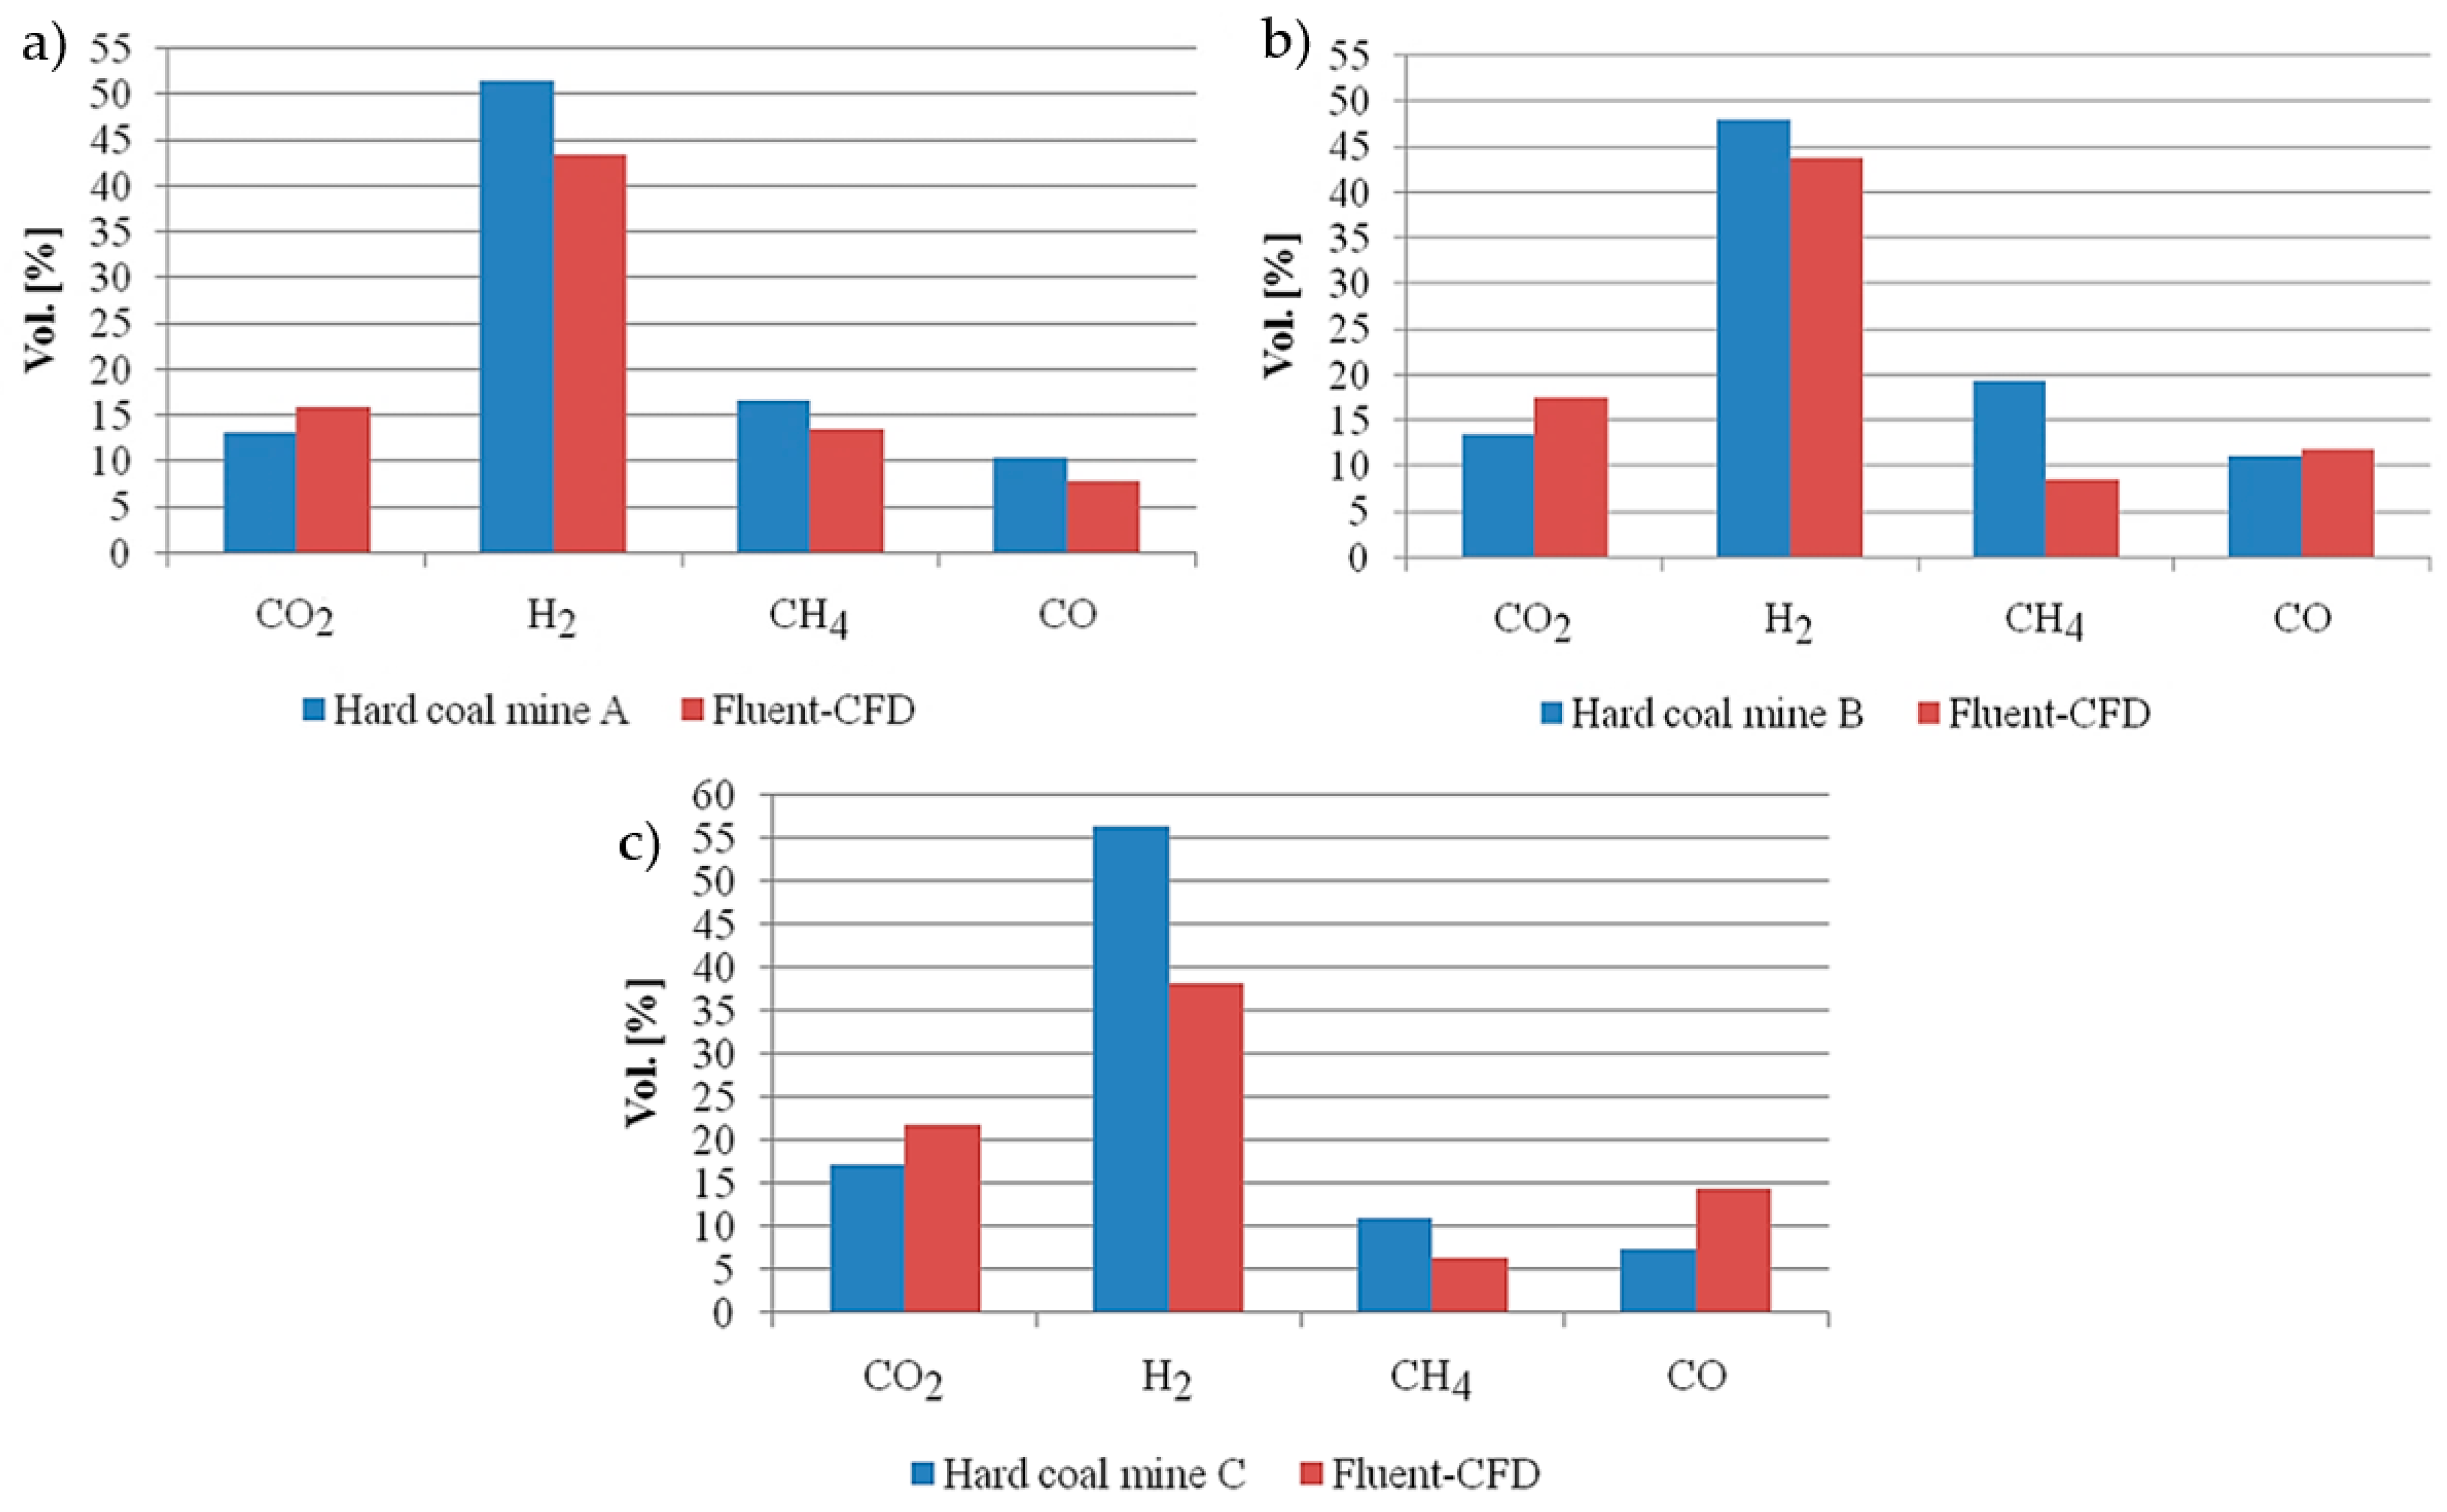
From Table 7 and Figure 23, it can be observed that the experimental and the simulated results were in good agreement as well as showed a similar tendency. Although, it can be observed that there were small deviations. In the case of the hard coal mine A, H2, CH4, CO were the three gases, whose percentages were less than 20%, but CO2 was the gas, which percentages was more than 17% for the numerical simulation and experiment. In the case of the coal sample from the hard coal mine B, CH4, and H2 were the two gases, whose percentages were less than 50% (CH4) and 10% (H2), but CO2 and CO were the two gases whose percentages were more than 20%for the numerical simulation and experiment. In the case of the hard coal mine C, CH4 and H2 were the two gases whose percentages were less than 40% (CH4) and 30% (H2), but CO2 and CO were the two gases whose the percentages were more than 20% (CO2) and 50% (CO) for the numerical simulation and experiment.
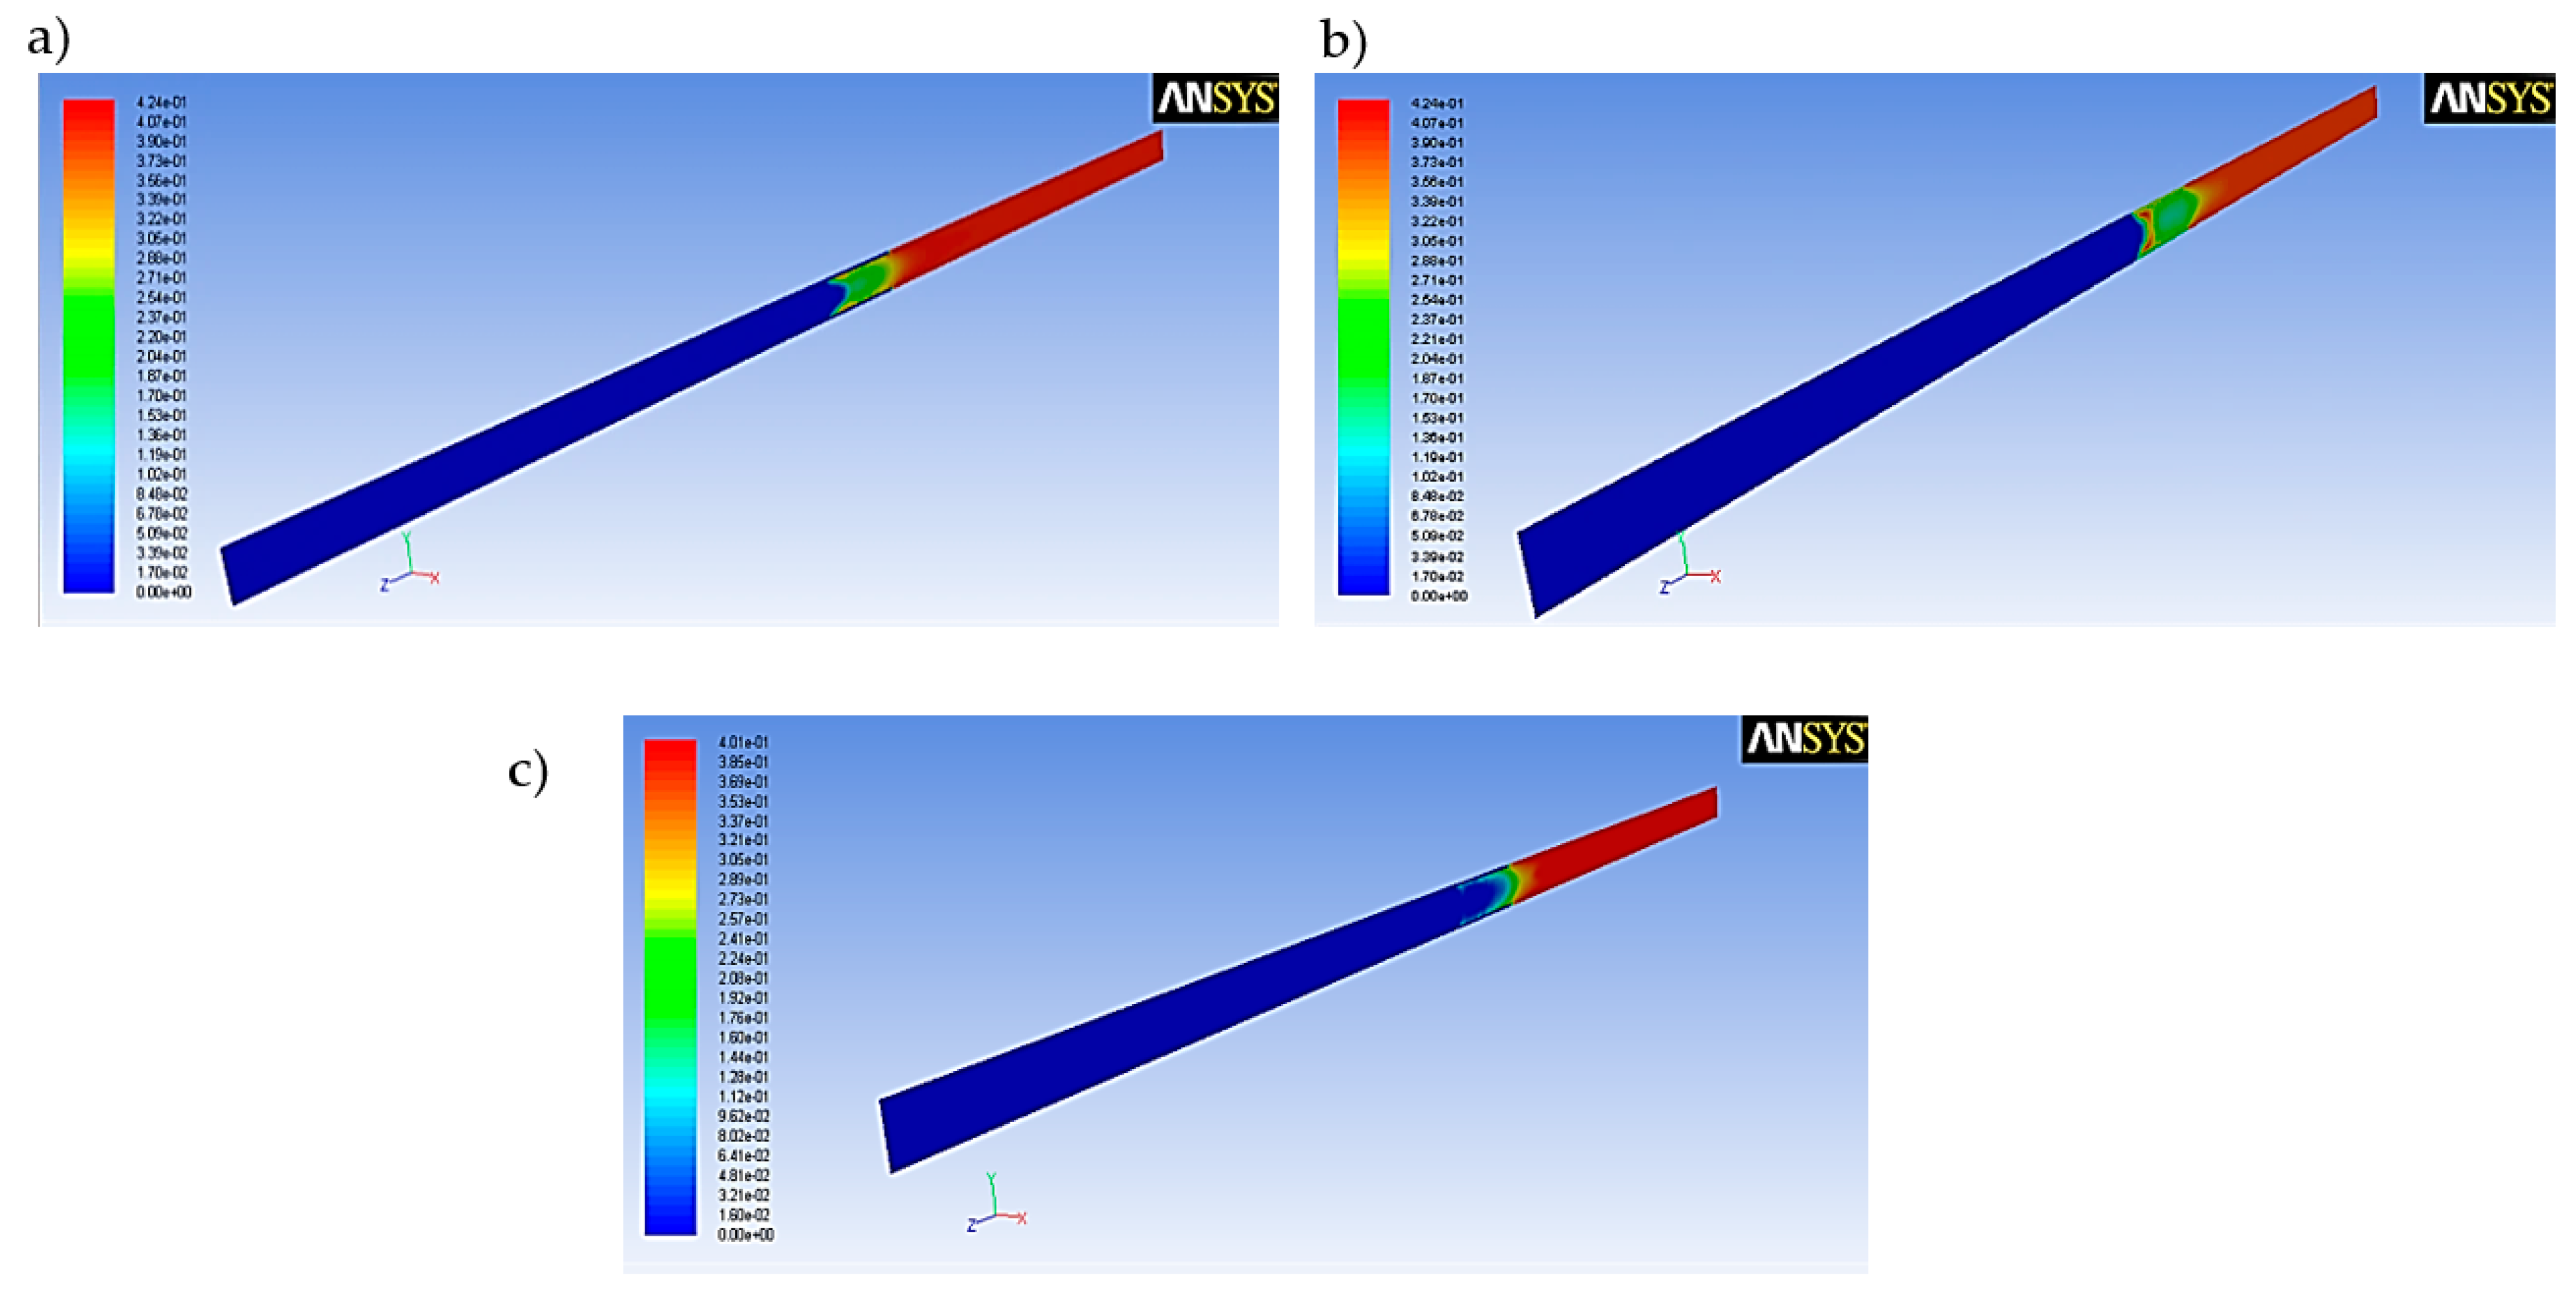
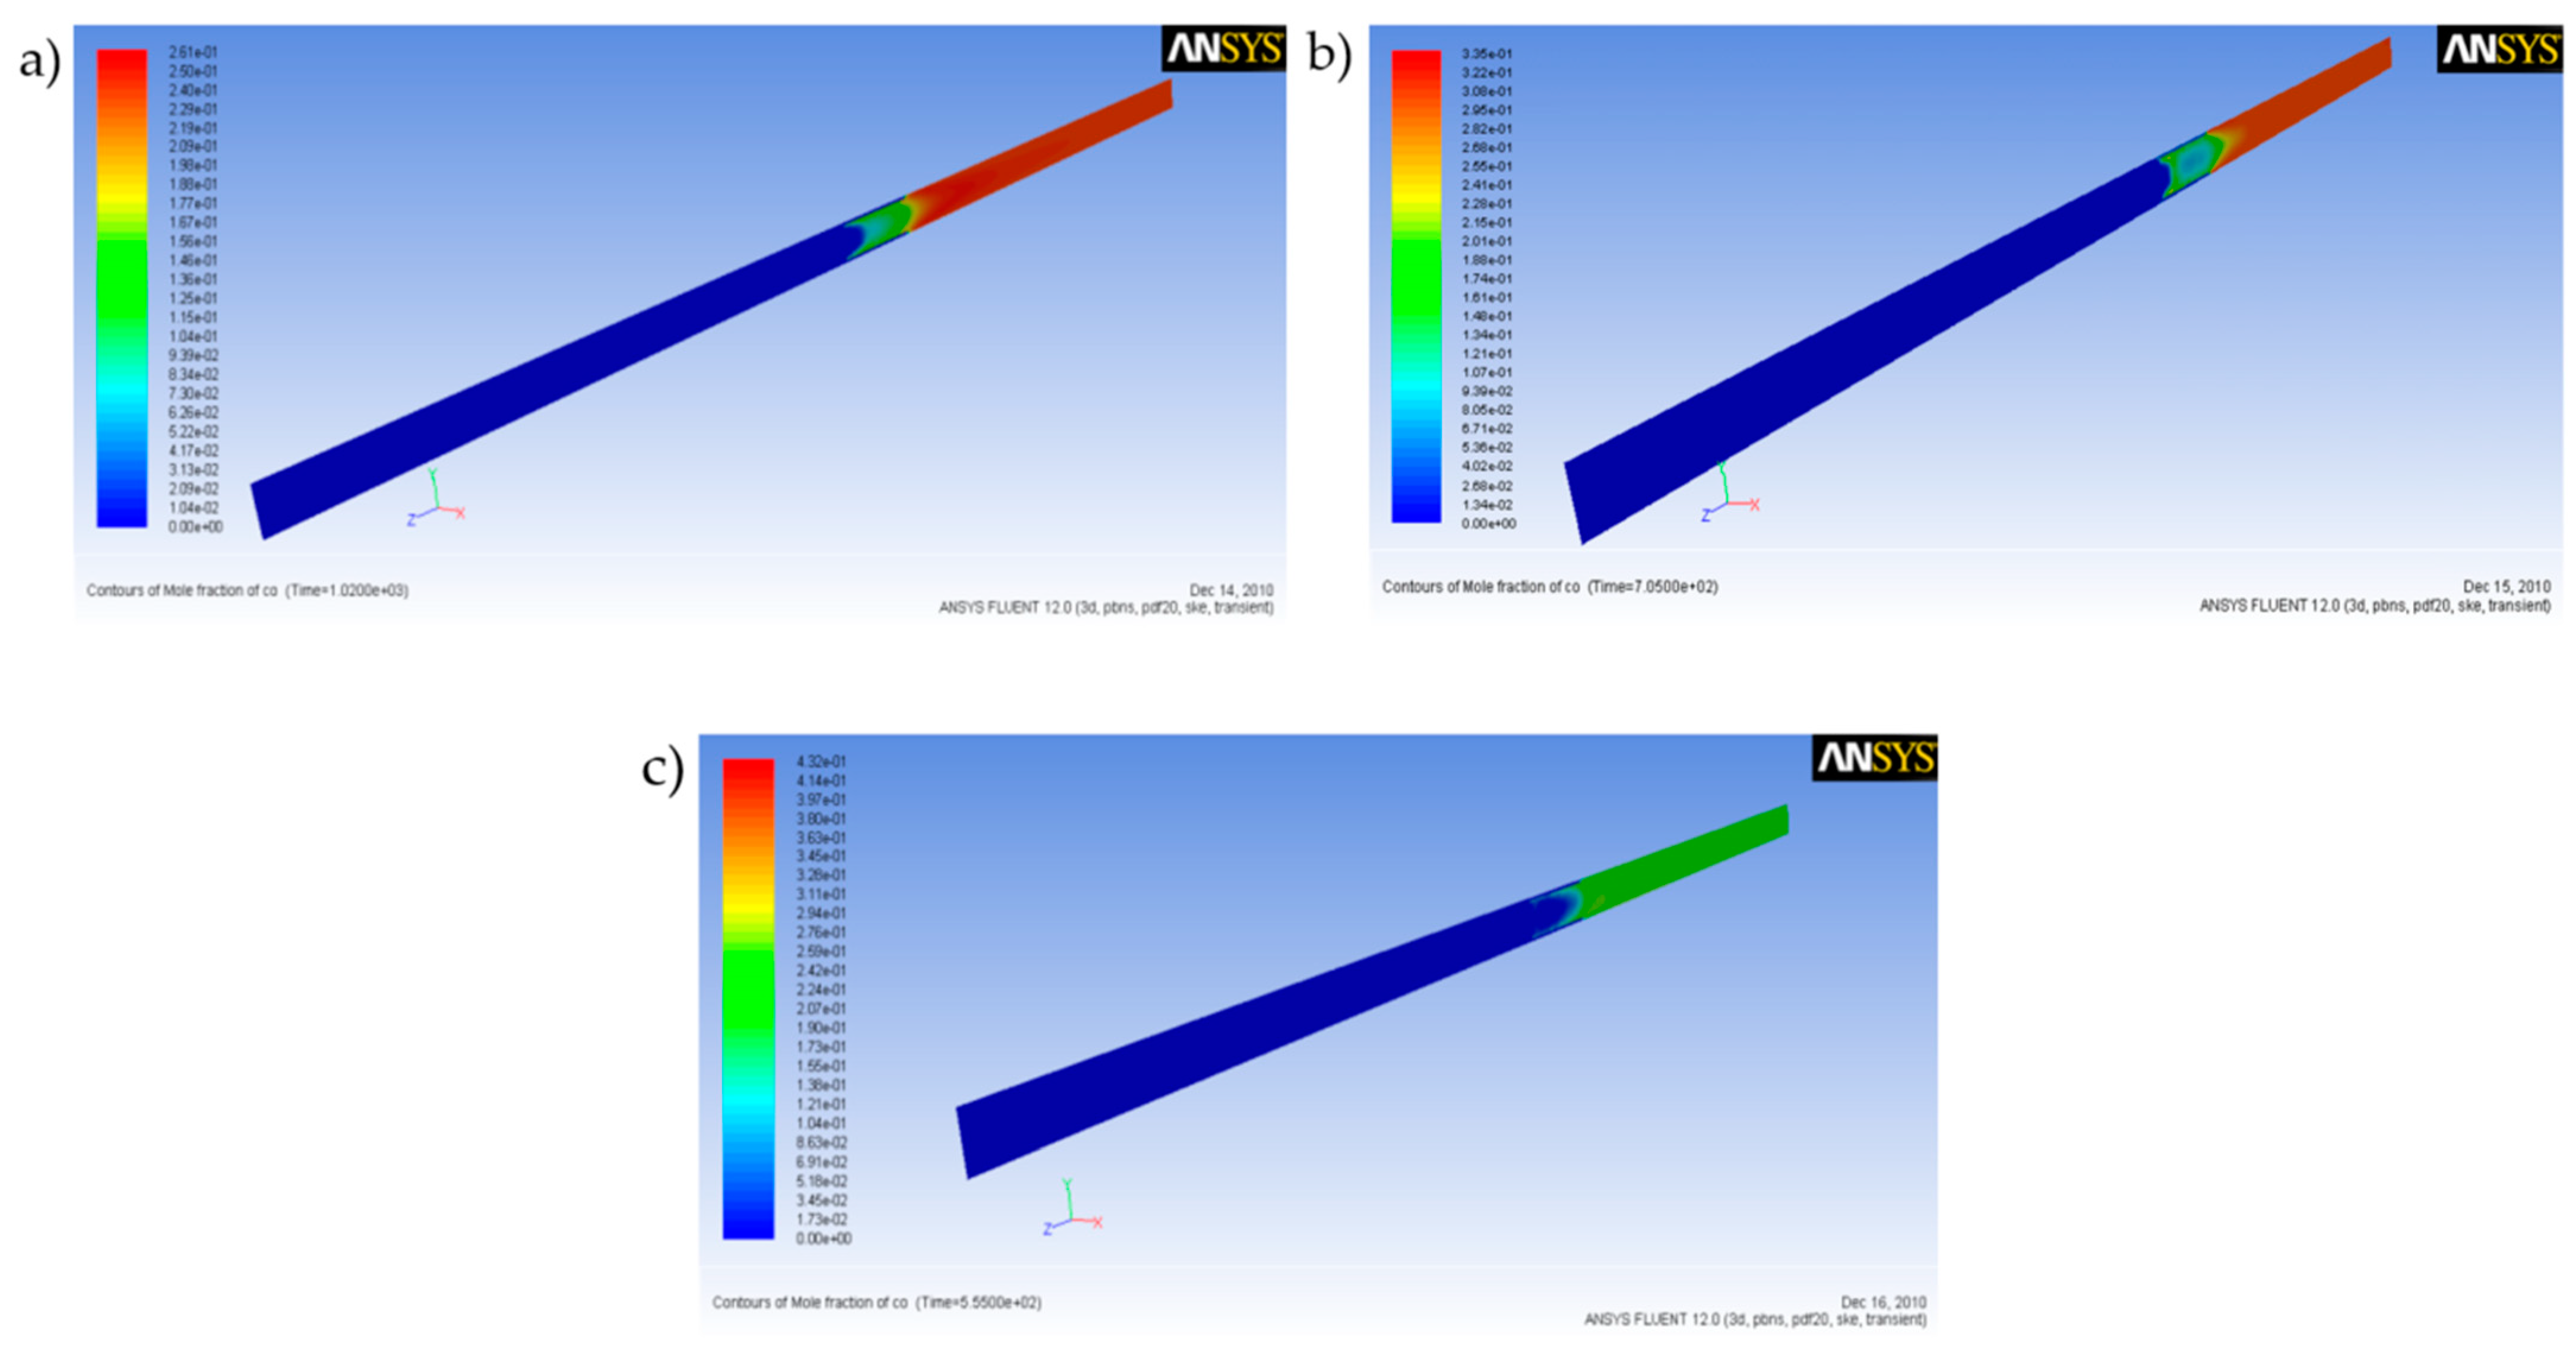
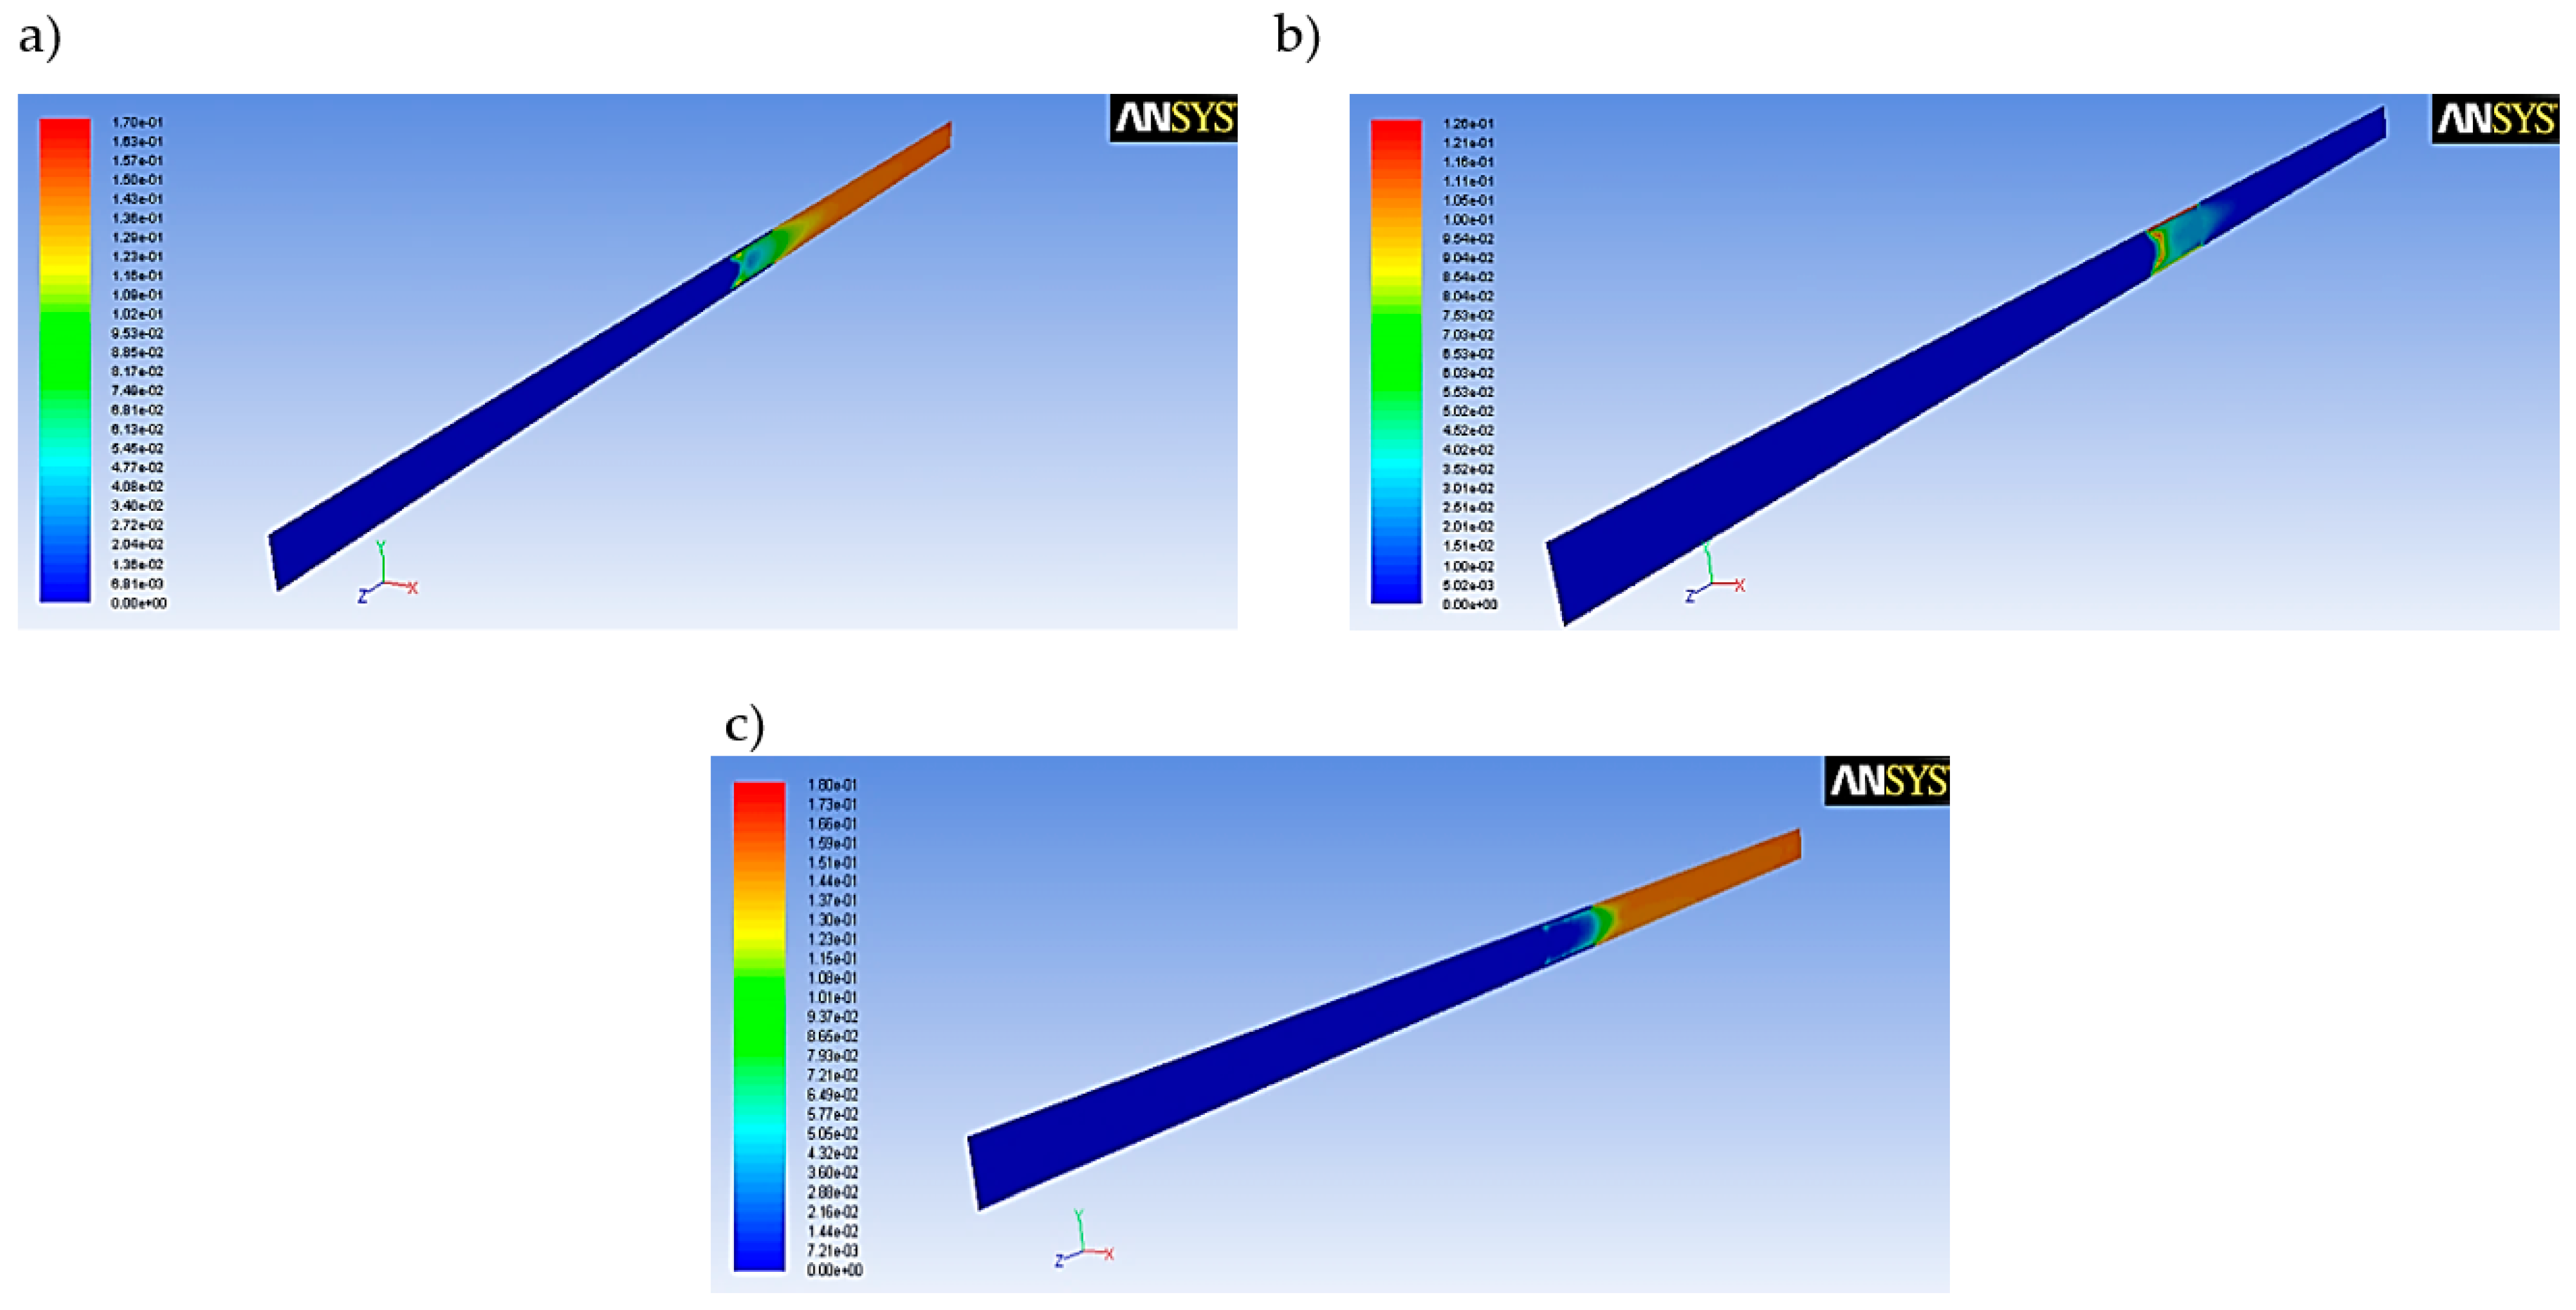
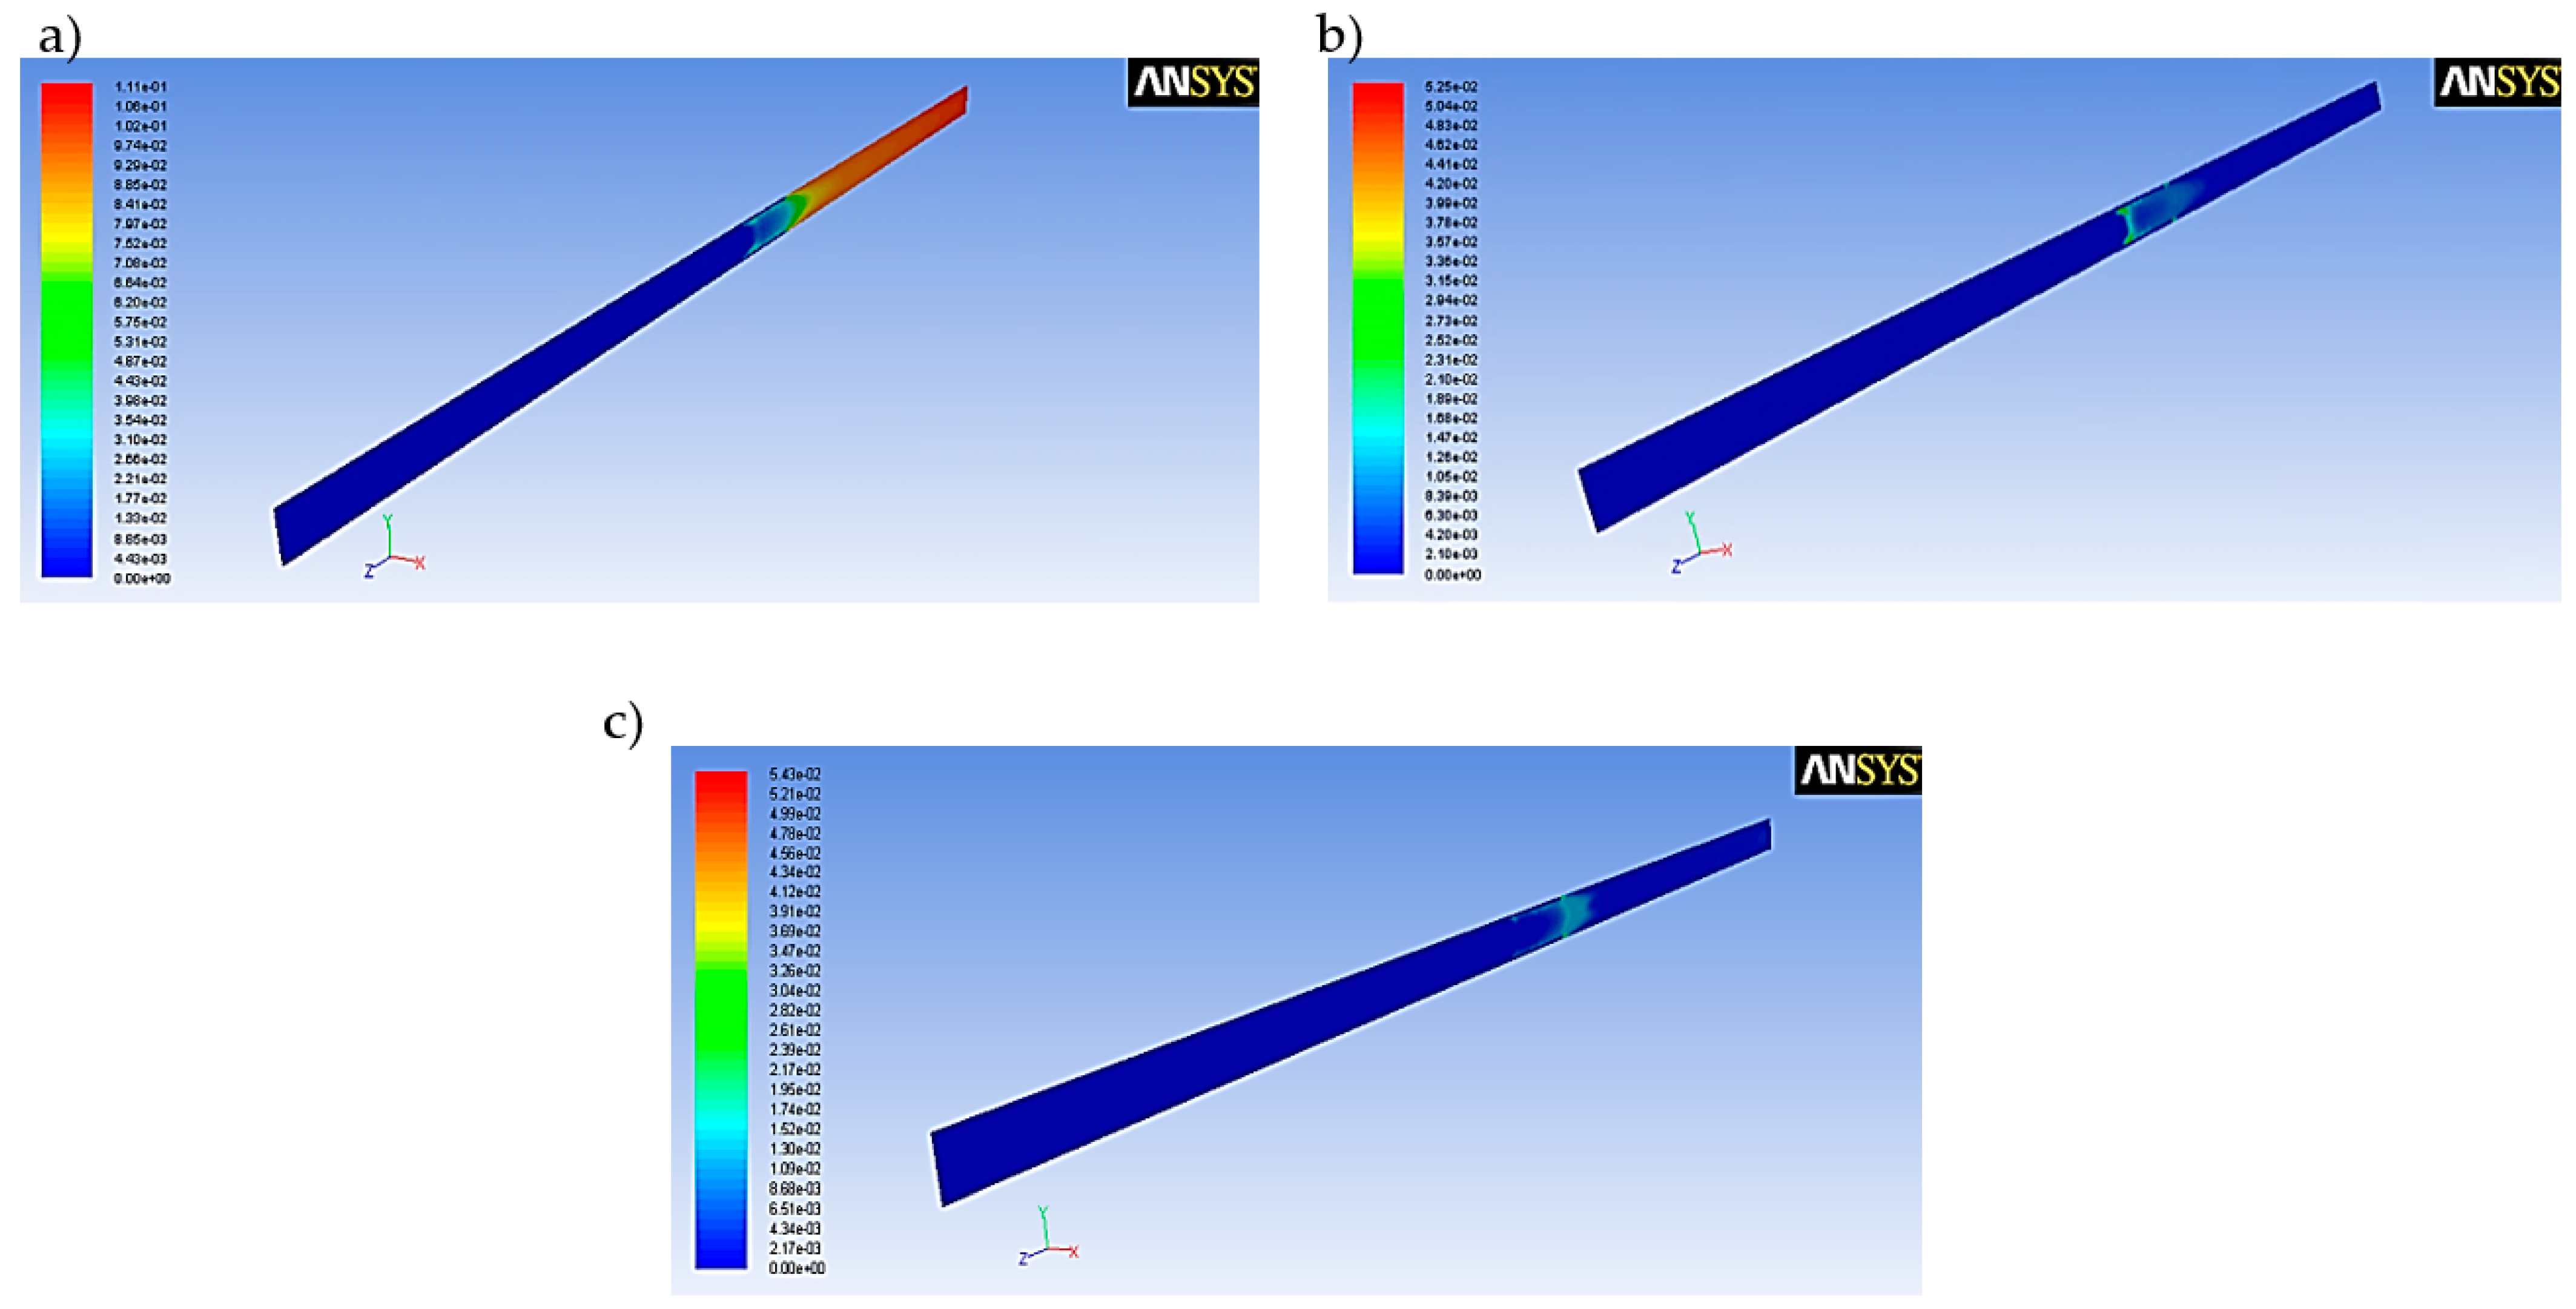
Figure 24, Figure 25, Figure 26 and Figure 27 shows the map of syngas composition including CO, CO2, CH4 and H2 of the numerical simulation of the base case using the CFD method.
The tables below present the results of relative error analysis between the average process gas concentration, including CH4, CO2, CO and H2 obtained during the in-situ experiment and the modeled values obtained from the numerical simulations (listed in Table 7).
It can be observed that a satisfactory relative error was obtained for the results summarized in Table 8 for the coal sample from the hard coal mine A. In the case of the results summarized in Table 9 and Table 10, the significant discrepancies for the concentration of H2, CO, and CH4 were observed, which prove that the constants in the kinetic of chemical reactions listed in Table 5 should be further examined.
Modeling Discussion
The discrepancies between the numerical simulated and the ex-situ experimental results are caused by many parameters. The coal gasification process is a very complicated technology. For example, the coal, it is a heterogeneous material with potential minerals and rock fractions impurities. Moreover, the permeability and porosity variations of the coal, which cannot be monitored experimentally, were described by a semi-empirical relationship in order to minimize the complexity in the real ex-situ situation. The phenomena such as the ash accumulation, cracking, and spalling of coal as well as existed for the hard coal, drying and evaporation of moisture, have been the beyond the ability of the numerical model. Due to a wide range of parameters reported by various scholars [4,17,21,25], the kinetic parameters of the reactions might have a huge impact on the overall numerical calculation results.
However, the main mechanism and phenomena of the allothermal gasification process for coal were well captured by the numerical model using the CFD method.
4. Conclusions
The paper presents a laboratory rig that enables the testing of the allothermal coal gasification process on samples in the form of a cylinder, as well as the development of a numerical model using computational fluid dynamics (CFD) methods. The Ansys-Fluent software was selected for the analysis of the technological parameters of the coal gasification process. The parameter values obtained were referred to the results obtained, based on the mathematical model, and the results of measurements in the experimental reactor. The linear correlation coefficient was used as an indicator of the model fitting to the experimental results. Based on the determined correlation coefficient, satisfactory (in most cases) compliance of the developed models with the experimental result was found.
The experimental results and the numerical simulations allowed to formulate the following conclusions:
- -
- The simulated composition of syngas were in good agreement with the experimental results showing a similar tendency;
- -
- The fundamental goal of the work was to develop a laboratory rig for the gasification of coal in the form of a solid rock in order to verify the numerical model;
- -
- The use of the CFD method allowed presenting the process of coal gasification in a quantitative manner;
- -
- The exact purposes of using the proposed model was for the possibility of predicting and investigating the process of UCG under the atmospheric pressure;
- -
- The advantages of the work involved applying a thermal–hydraulic–chemical model using the CFD method to simulate the effectiveness of the coal gasification process for hydrogen production under the atmospheric condition. Moreover, parameters, such as permeability, porosity, and solid loss, etc., which cannot be achieved by experiments, is able to predict by the numerical model;
- -
- The CFD model can be further developed to get closer to the actual situation aided by the advance of experimental monitoring;
- -
- The demonstration of significant interdependencies between the analyzed variables obtained from the numerical simulations and the experimental results confirm the adequacy of the assumptions made for the numerical model of the coal gasification process;
- -
- The CFD method proved to be a useful numerical method for enabling the development of numerical models of the coal gasification process with the use of steam as the gasification agent;
- -
- The numerical results provide opportunities for easy interpretation of phenomena during the UCG process;
- -
- The design of the coal gasification process using the CFD method can shorten the time and reduce the costs needed to develop a potential scenario for the underground coal gasification process to take place under specific geological and mining conditions.
Author Contributions
Conceptualization, T.J.; methodology, T.J.; software, T.J.; validation, T.J. and W.M.; formal analysis, T.J.; investigation, T.J.; resources, T.J. and W.M.; data curation, T.J. and W.M.; writing—original draft preparation, T.J.; writing—review and editing, T.J. and W.M.; visualization, T.J.; supervision, T.J.; project administration, T.J.; funding acquisition, T.J. All authors have read and agreed to the published version of the manuscript.
Funding
This research was funded by the Ministry of Science and Higher Education, grant number 14010400-350.
Institutional Review Board Statement
Not applicable.
Informed Consent Statement
Not applicable.
Data Availability Statement
Data available on request due to restrictions eg privacy or ethical.
Acknowledgments
This work was conducted as part of statutory research at the Central Mining Institute (No. 14010400-350), financed by the Ministry of Science and Higher Education, Poland.
Conflicts of Interest
The authors declare no conflict of interest.
Nomenclature
| Value of the mass stream of the gasification agent for t = 0, (kg m−3); | |
| Local value of the mass stream of the gasification agent, (kg m−3); | |
| A | Amplitude of the reactor operation cycle; |
| ω | The period of the reactor’s working cycle, (s−1). |
| r | Radius of the sphere inscribed on the computational cell, mm. |
| R | Radius of the sphere described in the computational cell, mm. |
| aR | Aspect ratio. |
| t | Time, s. |
| ρ | Fluid density, kg m−3. |
| Fluid velocity vector, m s−1. | |
| Sp | Source term for the mass transfer, kg m−3 s−1. |
| p | Fluid pressure, Pa. |
| Stress tensor, kg m−2 s−1. | |
| Gravitational body force, kg m−2 s−1. | |
| External body forces, kg m−2 s−1. | |
| h | Enthalpy, J kg−1. |
| T | Fluid temperature gradient, K. |
| Sh | Source term for the energy exchange, J m−3. |
| λ | Coefficient of thermal conductivity, W m−1 K−1. |
| Yi | Mass fraction of i-th fluid component, [-]. |
| Si | The rate of mass creation by addition from the dispersed phase sources, kg m−3 s−1. |
| Ri | The net rate of production of species by chemical reaction, kg m−3 s−1. |
| The diffusion flux of species, m2 s−1. | |
| k | Kinetic energy of speed fluctuation (turbulence), m2 s−2. |
| ε | The dissipation velocity of the kinetic energy turbulence, m2 s−3. |
| μt | Turbulent viscosity, Pa s. |
| Cμ | Empirical constant, Cμ = 0.09. |
| σk | The turbulent number of Prandtl, σk = 1.0. |
| P | Local production of vortex fluctuations. |
| σε | The turbulent number of Prandtl, σε = 1.3. |
| P | Local production of vortex fluctuations. |
| Cε1 | Empirical constant, Cε1 = 1.44. |
| Cε2 | Empirical constant, Cε2 = 1.92. |
References
- Hwang, M.; Song, E.; Song, J. One-Dimensional Modeling of an Entrained Coal Gasification Process Using Kinetic Parameters. Energies 2016, 9, 99. [Google Scholar] [CrossRef] [Green Version]
- Janoszek, T.; Stańczyk, K.; Smoliński, A. Modelling test of autothermal gasification process using CFD. Arch. Min. Sci. 2017, 62, 253–268. [Google Scholar] [CrossRef] [Green Version]
- Stańczyk, K.; Kapusta, K.; Wiatowski, M.; Świądrowski, J.; Smoliński, A.; Rogut, J.; Kotyrba, A. Experimental simulation of hard coal underground gasification for hydrogen production. Fuel 2012, 91, 40–50. [Google Scholar] [CrossRef]
- Tomeczek, J. Coal Gasification; Script of Technical University of Silesia: Gliwice, Poland, 1991. [Google Scholar]
- Choi, Y.C.; Li, X.Y.; Park, T.J.; Kim, J.H.; Lee, J.G. Numerical Study on the Coal Gasification Characteristics in an Entrained Flow Coal Gasifier; Elsevier: Abingdon, UK, 2001; Volume 80, pp. 2193–2201. [Google Scholar]
- Hobbs, M.L.; Radulovic, P.T.; Smoot, L.D. Combustion and Gasification of Coals in Fixed-Beds. Prog. Energy Combust. Sci. 1993, 19, 505–586. [Google Scholar] [CrossRef]
- Park, K.Y.; Edgar, T.F. Modeling of Early Cavity Growth for Underground Coal Gasification. Ind. Eng. Chem. Res. 1987, 26, 237–246. [Google Scholar] [CrossRef]
- Perkins, G.; Sahajvala, V. A Mathematical Model for the Chemical Reaction of Semi-infinite Block of Coal in Underground Coal Gasification. Energy Fuels 2005, 19, 1672–1692. [Google Scholar] [CrossRef]
- Khan, M.M.; Mmbaga, J.P.; Shirazi, A.S.; Trivedi, J.; Liu, Q.; Gupta, R. Modelling underground coal gasification—A review. Energies 2015, 8, 12603–12668. [Google Scholar] [CrossRef] [Green Version]
- Eri, Q.; Wu, W.; Zhao, X. Numerical Investigation of the Air-Steam Biomass Gasification Process Based on Thermodynamic Equilibrium Model. Energies 2017, 10, 2163. [Google Scholar] [CrossRef] [Green Version]
- Guo, Y.C.; Chan, C.K.; Lau, K.S. Numerical Studies of Pulverized Coal Combustion in a Tubular Coal Combustor with Slanted Oxygen Jet. Fuel 2003, 82, 893–907. [Google Scholar] [CrossRef]
- Kang, M.; Seo, D.; Lee, S.; Hwang, J.; Yim, S. Numerical simulation of gasification in an one stage entrained gasifier. In Proceedings of the 37th The Korean Society of Combustion Symposium, Suwon, Korea, 24–29 January 2008; pp. 29–35. [Google Scholar]
- Lee, J.M.; Kim, Y.J.; Kim, S.D. Modelling and Coal Gasification in an Internally Circulating Fluidized Bed Reactor. HWAHAK KONGHAK. Available online: https://www.cheric.org/PDF/HHKH/HK38/HK38-2-0259.pdf (accessed on 1 April 2000).
- Li, G.; Wang, L.; Wang, C.; Wang, C.; Wu, P.; Che, D. Experimental Study on Coal Gasification in a Full-Scale Two-Stage Entrained-Flow Gasifier. Energies 2020, 13, 4937. [Google Scholar] [CrossRef]
- Liu, X.; Wei, J.; Huo, W.; Yu, G. Gasification under CO2–Steam Mixture: Kinetic Model Study Based on Shared Active Sites. Energies 2017, 10, 1890. [Google Scholar] [CrossRef] [Green Version]
- Wang-Lai, Y.; Heung-Woo, L.; Jong-Won, K.; Won-Kook, L. Coal Gasification in Atmospheric Fluidized Bed. J. Korean Inst. Chem. Eng. 1986, 24, 269–276. [Google Scholar]
- Watanbe, H.; Otaka, M. Numerical Simulation of Coal Gasification in Entrained Flow Coal Gasifier. Fuel 2006, 85, 1935–1943. [Google Scholar] [CrossRef]
- Li, W.; He, S.; Li, S. Experimental Study and Thermodynamic Analysis of Hydrogen Production through a Two-Step Chemical Regenerative Coal Gasification. Appl. Sci. 2019, 9, 3035. [Google Scholar] [CrossRef] [Green Version]
- Wu, X.; Wang, Q.; Luo, Z.; Fang, M.; Cen, K. Modelling of Effects of Operation Parameters Entrained Flow Coal Gasification: Model Established and Validation. J. Zhejiang Univ. (Eng. Sci.) 2004, 38, 69–77. [Google Scholar]
- Yang, L. Numerical Study on the Underground Coal Gasification for Inclined Seams; Wiley InterSciencie: New York, NY, USA, 2005; Available online: https://0-aiche-onlinelibrary-wiley-com.brum.beds.ac.uk/doi/epdf/10.1002/aic.10554 (accessed on 22 July 2005).
- Yuan, L.; Smith, A.C. CFD modelling of spontaneous heating in a large-scale coal chamber. J. Loss Prev. Process Ind. 2009, 22, 426–433. [Google Scholar] [CrossRef]
- Sreedharan, V. CFD Analysis of Coal and Heavy Oil Gasification for Syngas Production. Ph.D. Thesis, Aalborg University, Aalborg, Denmark, 2012. [Google Scholar]
- Frank, M.; Kamenicky, R.; Dimitris Drikakis, D.; Thomas, L.; Ledin, H.; Wood, T. Multiphase flow effects in a horizontal oil and gas separator. Energies 2019, 12, 2116. [Google Scholar] [CrossRef] [Green Version]
- Gür, M.; Canbaz, E.D. Analysis of syngas production and reaction zones in hydrogen oriented underground coal gasification. Fuel 2020, 269, 117331. [Google Scholar] [CrossRef]
- Shirazi, A.S. CFD Simulation of Underground Coal Gasification; University of Alberta: Edmonton, Canada, 2012. [Google Scholar]
- Mota, R.; Krishnamoorthy, G.; Dada, O.; Benson, S.A. Hydrogen rich syngas production from oxy-steam gasification of a lignite coal—A design and optimization study. Appl. Therm. Eng. 2015, 90, 13–22. [Google Scholar] [CrossRef] [Green Version]
- Ansys-Fluent 18.2. Release Notes; ANSYS, Inc.: Canonsburg, PA, USA, 2018; Available online: https://www.luis.uni-hannover.de/fileadmin/software-lizenzen/Ueberlassung/ANSYS18.2_ReleaseNotes.pdf (accessed on 9 March 2021).
- Drikakis, D.; Frank, M.; Tabor, G. Multiscale computational fluid dynamics. Energies 2019, 12, 3272. [Google Scholar] [CrossRef] [Green Version]
- Seewald, H.; Klein, J.; Jungten, H. Pore structure of coal derived from permeation and sorption measurements. In Proceedings of the International Conference on Coal Science, Sydney, Australia, 28–31 October 1985; Pergamon Press: London, UK, 1985; p. 861. [Google Scholar]
Figure 1.
An experimental laboratory setup developed for the coal gasification: a—reactor, b—furnace, c—water pump piston, d—syngas cooler (heat exchanger), e—condensate tank, f—pump supplying the heat exchanger, g—manometer at inlet, h—manometer at outlet, i,j—inlet and outlet valves.
Figure 1.
An experimental laboratory setup developed for the coal gasification: a—reactor, b—furnace, c—water pump piston, d—syngas cooler (heat exchanger), e—condensate tank, f—pump supplying the heat exchanger, g—manometer at inlet, h—manometer at outlet, i,j—inlet and outlet valves.

Figure 2.
Visualization of a gasification reactor with a coal sample intended for gasification and a steam generator (12): a—reactor, k—steam generator, l—reactor lock.
Figure 2.
Visualization of a gasification reactor with a coal sample intended for gasification and a steam generator (12): a—reactor, k—steam generator, l—reactor lock.

Figure 3.
Coal sample: (a)—view of the basic dimensions of a coal sample, (b)—the real sample of coal.
Figure 3.
Coal sample: (a)—view of the basic dimensions of a coal sample, (b)—the real sample of coal.

Figure 4.
View of the coal sample: (a) model view, (b) real coal sample in the reactor.

Figure 5.
The length of the tested coal sample.

Figure 6.
View of the coal sample with the gasification channel.

Figure 7.
The clamps securing the reactor against opening during the gasification process.

Figure 8.
The coal sample after the experiment in the gasification reactor.

Figure 9.
Piston pump supplying the gasification reactor.

Figure 10.
Steam supply into the gasification reactor.

Figure 11.
The effect of steam supply on the syngas composition during the gasification of the coal sample from hard coal mine A (on a dry basis).
Figure 11.
The effect of steam supply on the syngas composition during the gasification of the coal sample from hard coal mine A (on a dry basis).

Figure 12.
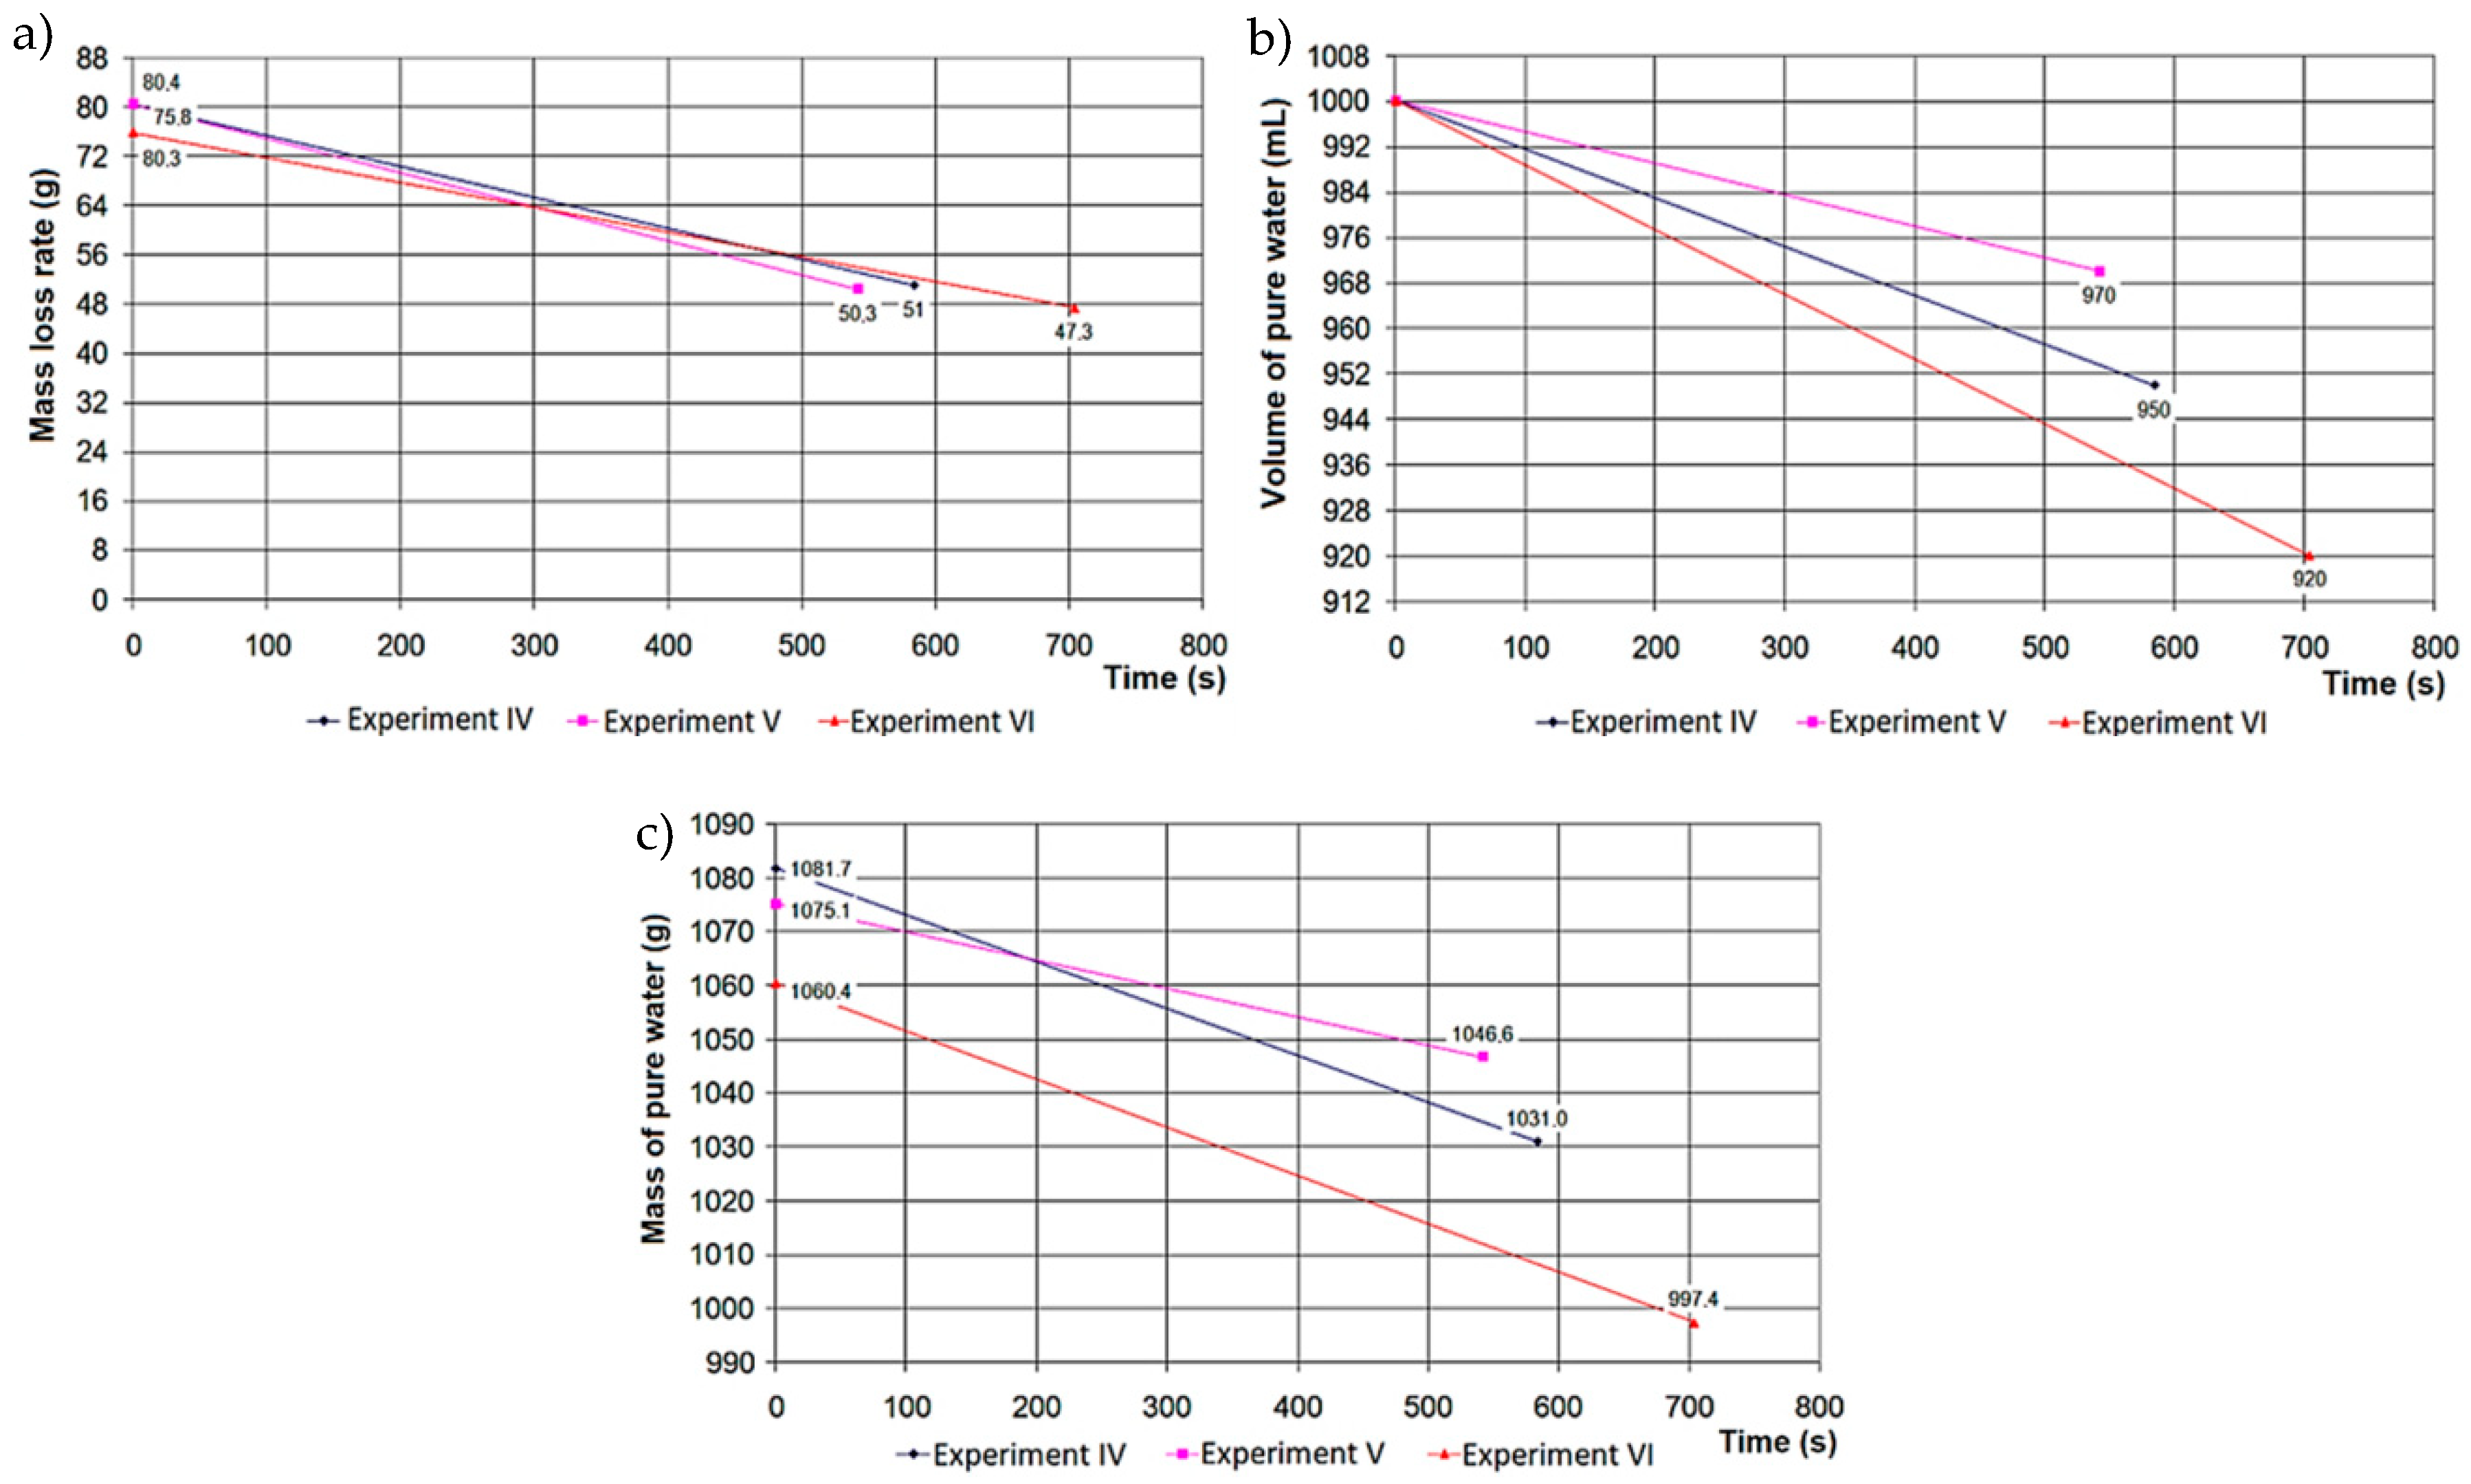
The changes of the mass (c) and volume of pure water (b) supplied to the gasification reactor and the mass loss rate (a) of the coal sample from hard coal mine A.
Figure 12.
The changes of the mass (c) and volume of pure water (b) supplied to the gasification reactor and the mass loss rate (a) of the coal sample from hard coal mine A.

Figure 13.
The effect of steam supply on the syngas composition during the gasification of the coal sample from hard coal mine B (on a dry basis).
Figure 13.
The effect of steam supply on the syngas composition during the gasification of the coal sample from hard coal mine B (on a dry basis).

Figure 14.
The changes of the mass (c) and volume of pure water (b) supplied to the gasification reactor and the mass loss rate (a) of the coal sample from hard coal mine B.
Figure 14.
The changes of the mass (c) and volume of pure water (b) supplied to the gasification reactor and the mass loss rate (a) of the coal sample from hard coal mine B.

Figure 15.
The effect of steam supply on the syngas composition during the gasification of the coal sample from hard coal mine C (on a dry basis).
Figure 15.
The effect of steam supply on the syngas composition during the gasification of the coal sample from hard coal mine C (on a dry basis).

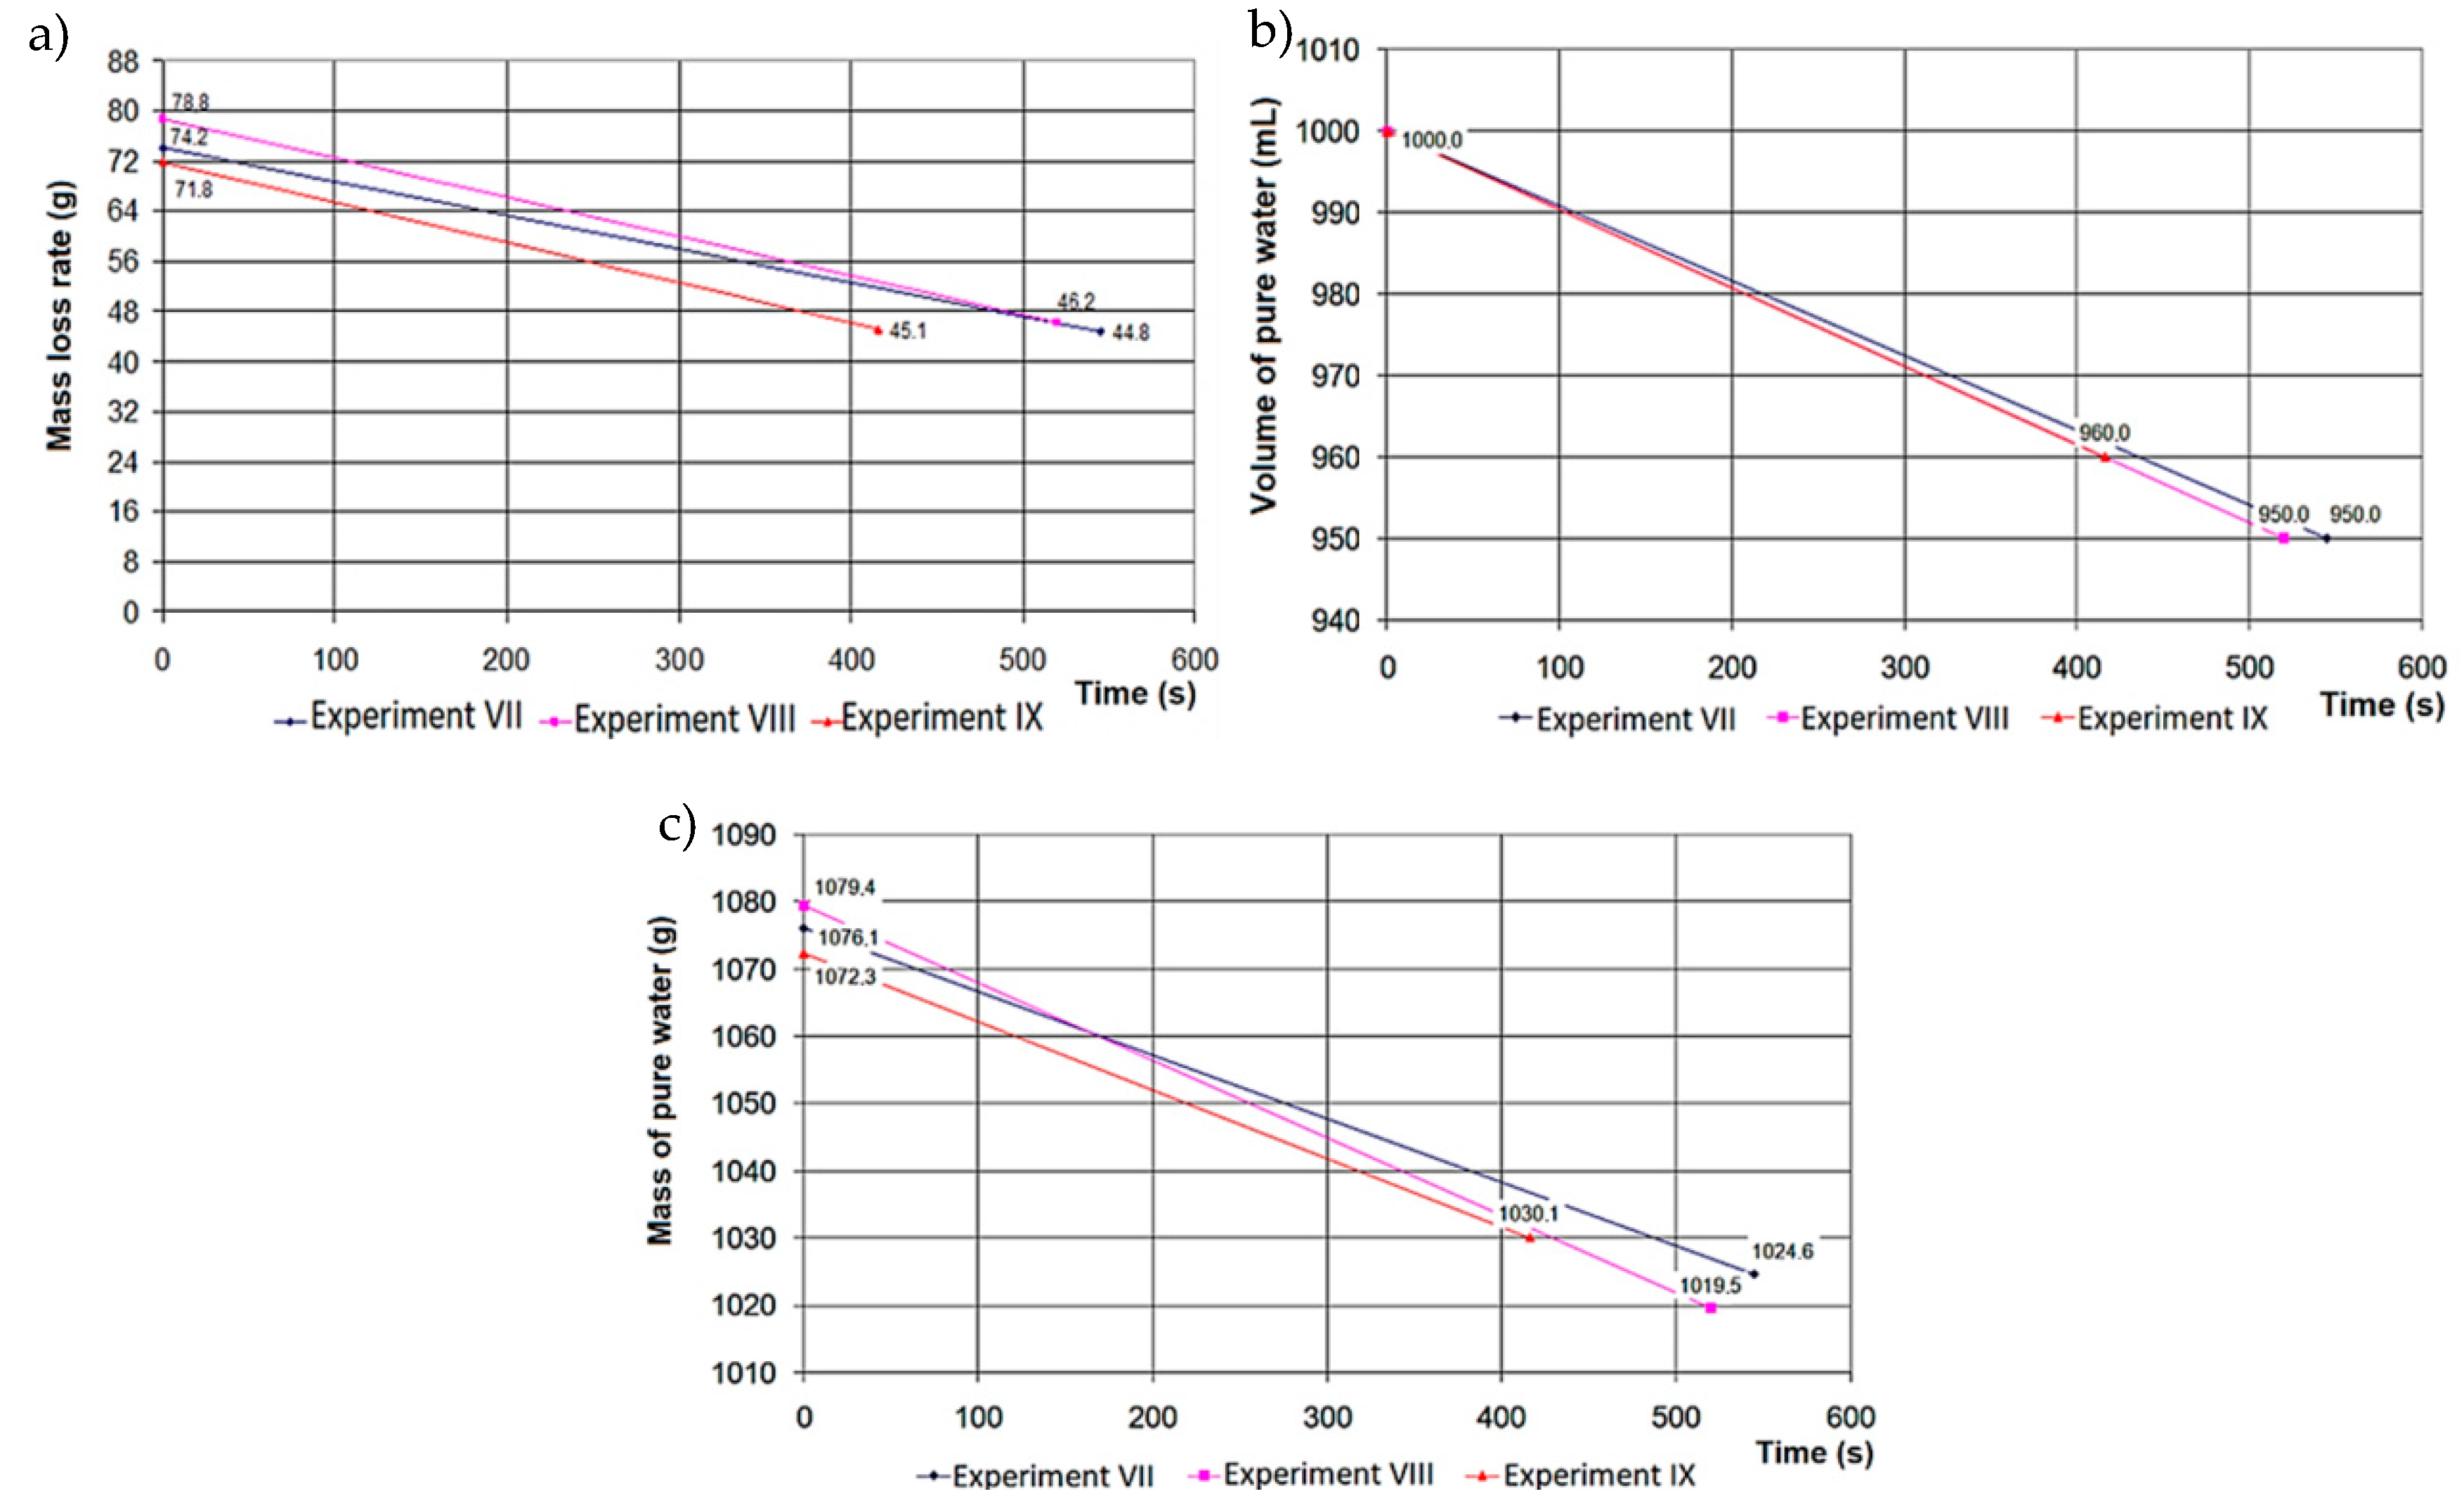
Figure 16.
The changes of the mass (c) and volume of pure water (b) supplied to the gasification reactor and the mass loss rate (a) of the coal sample from hard coal mine C.
Figure 16.
The changes of the mass (c) and volume of pure water (b) supplied to the gasification reactor and the mass loss rate (a) of the coal sample from hard coal mine C.

Figure 17.
The three-dimensional (3D) model of the coal gasification reactor.

Figure 18.
Main dimensions of the 3D model of the reactor.

Figure 19.
The numerical grid of the fluid (a) and the coal sample (b).

Figure 20.
Illustration showing the idea of the aspect ratio of a computational cell.

Figure 21.
Convergence of results in numerical grid refinement study.

Figure 22.
The measuring of syngas parameters at the outlet of the gasification reactor during numerical calculations.
Figure 22.
The measuring of syngas parameters at the outlet of the gasification reactor during numerical calculations.

Figure 23.
Changes of the syngas components determined empirically and from numerical calculations: (a) for the coal sample from hard coal mine A, (b) for the coal sample from hard coal mine B, (c) for the coal sample from hard coal mine C.
Figure 23.
Changes of the syngas components determined empirically and from numerical calculations: (a) for the coal sample from hard coal mine A, (b) for the coal sample from hard coal mine B, (c) for the coal sample from hard coal mine C.

Figure 24.
Map of H2 variations in the syngas for the numerical simulation: (a) coal sample from hard coal mine A in 1040 s, (b) coal sample from hard coal mine B in 704 s, (c) coal sample from hard coal mine C in 545 s.
Figure 24.
Map of H2 variations in the syngas for the numerical simulation: (a) coal sample from hard coal mine A in 1040 s, (b) coal sample from hard coal mine B in 704 s, (c) coal sample from hard coal mine C in 545 s.

Figure 25.
Map of CO variations in the syngas for the numerical simulation: (a) coal sample from hard coal mine A in 1040 s, (b) coal sample from hard coal mine B in 704 s, (c) coal sample from hard coal mine C in 545 s.
Figure 25.
Map of CO variations in the syngas for the numerical simulation: (a) coal sample from hard coal mine A in 1040 s, (b) coal sample from hard coal mine B in 704 s, (c) coal sample from hard coal mine C in 545 s.

Figure 26.
Map of CO2 variations in the syngas for the numerical simulation: (a) coal sample from hard coal mine A in 1040 s, (b) coal sample from hard coal mine B in 704 s, (c) coal sample from hard coal mine C in 545 s.
Figure 26.
Map of CO2 variations in the syngas for the numerical simulation: (a) coal sample from hard coal mine A in 1040 s, (b) coal sample from hard coal mine B in 704 s, (c) coal sample from hard coal mine C in 545 s.

Figure 27.
Map of CH4 variations in the syngas for the numerical simulation: (a) coal sample from hard coal mine A in 1040 s, (b) coal sample from hard coal mine B in 704 s, (c) coal sample from hard coal mine C in 545 s.
Figure 27.
Map of CH4 variations in the syngas for the numerical simulation: (a) coal sample from hard coal mine A in 1040 s, (b) coal sample from hard coal mine B in 704 s, (c) coal sample from hard coal mine C in 545 s.


Table 1.
Proximate/ultimate analysis of the coal seam from hard coal mine A, B, C.
| Parameter | Hard Coal Mine A | Hard Coal Mine B | Hard Coal Mine C | Units | ||||
|---|---|---|---|---|---|---|---|---|
| Total moisture content Wtr | 6.76 | 12.7 | 11.89 | % | ||||
| ash content Ar | 6.57 | 4.99 | 17.02 | % | ||||
| total sulphur content Str | 1 | 1 | 1.22 | % | ||||
| heat of combustion Qir | 26,940 | 25,329 | 21,070 | kJ/kg | ||||
| Analytical state | ||||||||
| moisture content Wa | 5.36 | 9.2 | 8.93 | % | ||||
| ash content Aa | 6.67 | 5.19 | 17.59 | % | ||||
| volatiles content Va | 34.85 | 30.79 | 28.93 | % | ||||
| heat of combustion Qsa | 28,550 | 27,676 | 22,945 | kJ/kg | ||||
| heat of combustion Qia | 27,381 | 26,441 | 21,860 | kJ/kg | ||||
| ash fusibility temperature | oxid. atm. | red. atm. | oxid. atm. | red. atm. | oxid. atm. | red. atm. | ||
| sintering tS | 1080 | 1060 | 1030 | 990 | 970 | 950 | °C | |
| softening tA | 1310 | 1280 | 1250 | 1180 | 1420 | 1350 | °C | |
| melting tB | 1340 | 1300 | 1370 | 1220 | >1500 | 1440 | °C | |
| flow tC | 1360 | 1310 | 1500 | 1260 | >1500 | 1480 | °C | |
| total sulphur content Sta | 1.02 | 1.04 | 1.26 | % | ||||
| ash sulphur content SAa | 0.58 | 0.45 | 0.07 | % | ||||
| flammable sulphur content SCa | 0.44 | 0.59 | 1.19 | % | ||||
| carbon content Cta | 68.5 | 66.63 | 53.94 | % | ||||
| hydrogen content Hta | 3.88 | 3.86 | 3.28 | % | ||||
| nitrogen content Na | 1.32 | 1.04 | 0.77 | % | ||||
| oxygen content Oda | 13.83 | 13.49 | 14.3 | % | ||||
| Dry state | ||||||||
| ash content Ad | 7.05 | 5.72 | 19.31 | % | ||||
| total sulphur content Std | 1.08 | 1.15 | 1.38 | % | ||||
| Dry and non-ash state | ||||||||
| volatiles content Vdaf | 39.62 | 35.97 | 39.37 | % | ||||
| heat of combustion Qsdaf | 32,455 | 32,328 | 31,226 | kJ/kg | ||||
oxid. atm.—oxidizing atmosphere, red. atm.—reducing atmosphere.
Table 2.
Results for a coal sample from hard coal mine A, B, C.
| No. | CO2 (%) | C2H6 (%) | H2 (%) | O2 (%) | N2 (%) | CH4 (%) | CO (%) | H2S (%) | texp (s) | Vsyngas (cm3) | mC1 (g) | mC2 (g) | mC3 (g) | mH20(l) (g) | VH2O(l) (mL) | |
|---|---|---|---|---|---|---|---|---|---|---|---|---|---|---|---|---|
| Hard Coal Mine A | ||||||||||||||||
| Exp. I | Trial 1 | 11.54 | 0.54 | 45 | 1.01 | 4.22 | 24.85 | 12.61 | 0.22 | 262 | 1850 | 74.2 | 44.8 | 29.4 | 51.5 | 50 |
| Trial 2 | 12.18 | 0.02 | 61.27 | 1.45 | 5.35 | 10.73 | 8.79 | 0.21 | 292 | 1900 | ||||||
| Trial 3 | 14.85 | 0.01 | 61.33 | 2.15 | 7.88 | 5.61 | 7.95 | 0.21 | 469 | 1860 | ||||||
| Exp. II | Trial 4 | 10.60 | 1.62 | 34.07 | 2.59 | 9.74 | 26.31 | 14.34 | 0.73 | 174 | 1930 | 78.8 | 46.2 | 32.6 | 59.9 | 50 |
| Trial 5 | 13.56 | 0.16 | 49.72 | 1.25 | 5.01 | 18.87 | 10.99 | 0.45 | 227 | 1890 | ||||||
| Trial 6 | 15.16 | 0.02 | 64.51 | 0.66 | 2.45 | 8.58 | 8.39 | 0.22 | 457 | 1820 | ||||||
| Exp. III | Trial 7 | 11.75 | 1.64 | 37.07 | 1.94 | 7.11 | 27.57 | 12.12 | 0.8 | 145 | 1760 | 71.8 | 45.1 | 26.7 | 42.2 | 40 |
| Trial 8 | 14.34 | 0.19 | 48.8 | 1.55 | 5.64 | 18.29 | 10.91 | 0.28 | 181 | 1780 | ||||||
| Trial 9 | 15.55 | 0.05 | 61.21 | 1.02 | 3.8 | 9.64 | 8.52 | 0.21 | 359 | 1790 | ||||||
| Hard Coal Mine B | ||||||||||||||||
| Exp. IV | Trial 10 | 12.93 | 2.34 | 34.57 | 1.76 | 6.39 | 27.76 | 13.91 | 0.34 | 122 | 1745 | 80.3 | 51 | 29.3 | 50.7 | 50 |
| Trial 11 | 14.37 | 0.67 | 48.92 | 0.24 | 0.91 | 22.11 | 12.50 | 0.27 | 207 | 1840 | ||||||
| Trial 12 | 17.14 | 0.04 | 59.91 | 0.94 | 3.37 | 10.55 | 7.88 | 0.18 | 255 | 1880 | ||||||
| Exp. V | Trial 13 | 12.35 | 1.82 | 37.92 | 1.69 | 6.30 | 26.51 | 13.41 | 0.00 | 158 | 1840 | 80.4 | 50.3 | 30.1 | 28.5 | 30 |
| Trial 14 | 13.53 | 0.24 | 49.81 | 1.43 | 5.08 | 18.81 | 11.03 | 0.06 | 178 | 1860 | ||||||
| Trial 15 | 14.88 | 0.04 | 60.81 | 0.90 | 3.28 | 11.82 | 8.27 | 0.00 | 206 | 1880 | ||||||
| Exp. VI | Trial 16 | 11.42 | 2.29 | 32.78 | 2.58 | 9.28 | 27.62 | 13.63 | 0.39 | 166 | 1880 | 75.8 | 47.3 | 28.5 | 63 | 80 |
| Trial 17 | 12.31 | 0.42 | 49.03 | 1.46 | 5.16 | 19.70 | 11.92 | 0.00 | 205 | 1850 | ||||||
| Trial 18 | 13.94 | 0.06 | 58.13 | 2.28 | 8.12 | 9.39 | 8.07 | 0.00 | 333 | 1780 | ||||||
| Hard Coal Mine C | ||||||||||||||||
| Exp. VII | Trial 19 | 15.61 | 0.28 | 54.94 | 1.25 | 4.98 | 13.94 | 8.94 | 0.06 | 151 | 1830 | 74.2 | 44.8 | 29.4 | 51.5 | 50 |
| Trial 20 | 15.99 | 0.03 | 57.37 | 2.42 | 8.69 | 8.90 | 6.39 | 0.20 | 169 | 1860 | ||||||
| Trial 21 | 19.01 | 0.01 | 63.17 | 1.28 | 4.62 | 6.11 | 5.79 | 0.00 | 225 | 1870 | ||||||
| Exp. VIII | Trial 22 | 15.20 | 0.63 | 47.93 | 1.26 | 5.25 | 19.59 | 10.14 | 0.00 | 150 | 1905 | 78.8 | 46.2 | 32.6 | 59.9 | 50 |
| Trial 23 | 16.48 | 0.04 | 58.61 | 1.39 | 5.13 | 10.86 | 7.00 | 0.49 | 183 | 1840 | ||||||
| Trial 24 | 18.34 | 0.02 | 60.73 | 1.70 | 6.21 | 7.00 | 6.00 | 0.00 | 187 | 1890 | ||||||
| Exp. IX | Trial 25 | 16.39 | 0.44 | 50.25 | 1.64 | 6.02 | 16.19 | 9.07 | 0.00 | 101 | 1770 | 71.8 | 45.1 | 26.7 | 42.2 | 40 |
| Trial 26 | 17.94 | 0.05 | 54.49 | 2.23 | 7.92 | 10.12 | 6.70 | 0.55 | 131 | 1900 | ||||||
| Trial 27 | 19.04 | 0.03 | 59.51 | 1.91 | 6.86 | 6.94 | 5.72 | 0.00 | 184 | 1830 | ||||||
Exp.—ex-situ experiment.
Table 3.
Results of numerical grid refinement study.
| No. | Mesh Quality | Number of Fluid Computational Cells | Temperature (°C) |
|---|---|---|---|
| 1 | Coarse mesh | 33,716 | 675.34 |
| 2 | Normal mesh | 155,428 | 684.52 |
| 3 | Fine mesh | 592,474 | 693.70 |
| 4 | Very fine mesh | 1,541,236 | 694.90 |
Table 4.
Source term in the governing equations.
| Source Term | Values |
|---|---|
| Sp | |
| Sh | |
| Ri | |
Table 5.
The parameters adopted in the calculation of the chemical reactions of coal gasification.
| No. | Rate of Reaction | Parameters | ||
|---|---|---|---|---|
| β | A (1/s) | E (J/mol) | ||
| 1. | (***)r1 | 0 | 5.1 … 104 | 78.24 … 103 |
| 2. | (**)r2 = k2·CO2 | 0 | 0.89 | (**)61.13 … 10−3 |
| 3. | (**)r3 = k3·CO2 | 0 | 0.84 | (**)90.10 … 10−3 |
| 4. | (**)r4 = k4·CH2O | 0 | 5.96 … 10−1.45 | (**)208.3 … 10−3 |
| 5. | (**)r5 = k5·CH2 | 0 | 6 … 10−0.1 | (**)7.53 … 10−3 |
| 6. | (***)r6 = k6·CCO2·CH2 | 0 | (*)0.0265 | (*)3960 |
| 7. | (***)r7 = k7·CCO·CH2O | 0 | (*)2.75·1010 | (*)8.36·107 |
Table 6.
Proximate/ultimate analysis of coal adopted in numerical calculations.
| Hard Coal Mine A | Hard Coal Mine B | Hard Coal Mine C | ||
|---|---|---|---|---|
| Proximate analysis | Volatiles | 34.85% | 30.79% | 28.93% |
| Fixed Carbon | 51.72% | 51.32% | 41.59% | |
| Ash | 6.67% | 5.19% | 17.59% | |
| Moisture | 6.76% | 12.70% | 11.89% | |
| Ultimate analysis | C | 68.50% | 66,63% | 53.94% |
| H | 3.88% | 3.86% | 3.28% | |
| O | 13.83% | 13.49% | 14.30% | |
| N | 1.32% | 1.04% | 0.77% | |
| S | 1.02% | 1.04% | 1.26% | |
| Heat of combustion | 2.855⸱107 J kg−1 | 2.7676⸱107 J kg−1 | 2.2945⸱107 J kg−1 | |
Table 7.
Results of numerical and experimental tests.
| Experiment | CO2 (%) | H2 (%) | CH4 (%) | CO (%) | Calculations | CO2 (%) | H2 (%) | CH4 (%) | CO (%) | |
|---|---|---|---|---|---|---|---|---|---|---|
| 1 | Hard coal mine A | 12.86 | 55.87 | 13.73 | 9.78 | CFD | 14.80 | 44.99 | 13.39 | 7.63 |
| 2 | 13.11 | 49.43 | 17.92 | 11.24 | 17.50 | 40.27 | 13.63 | 4.46 | ||
| 3 | 13.88 | 49.03 | 18.50 | 10.52 | 15.64 | 44.95 | 13.94 | 11.64 | ||
| Mean value | 13.28 | 51.44 | 16.72 | 10.51 | Mean value | 15.98 | 43.40 | 13.65 | 7.91 | |
| 4 | Hard coal mine B | 14.81 | 47.80 | 20.14 | 11.43 | CFD | 17.97 | 44.16 | 10.14 | 12.29 |
| 5 | 12.55 | 46.65 | 18.90 | 11.21 | 18.46 | 42.64 | 5.82 | 10.63 | ||
| 6 | 13.59 | 49.51 | 19.04 | 10.90 | 16.28 | 44.63 | 10.13 | 12.59 | ||
| Mean value | 13.65 | 47.99 | 19.36 | 11.18 | Mean value | 17.57 | 43.81 | 8.70 | 11.84 | |
| 7 | Hard coal mine C | 16.87 | 58.49 | 9.65 | 7.04 | CFD | 19.21 | 39.90 | 6.04 | 12.60 |
| 8 | 16.67 | 55.76 | 12.49 | 7.71 | 23.28 | 33.82 | 6.41 | 9.90 | ||
| 9 | 17.79 | 54.75 | 11.08 | 7.16 | 22.96 | 41.07 | 6.82 | 20.94 | ||
| Mean value | 17.11 | 56.33 | 11.07 | 7.31 | Mean value | 21.82 | 38.27 | 6.42 | 14.48 | |
Table 8.
Relative error analysis of CH4, CO2, CO and H2 concentrations between average values obtained from the CFD model and laboratory tests for the coal sample from hard coal mine A.
Table 8.
Relative error analysis of CH4, CO2, CO and H2 concentrations between average values obtained from the CFD model and laboratory tests for the coal sample from hard coal mine A.
| Relative Error (%) | ||||
|---|---|---|---|---|
| CO2 | CO | H2 | CH4 | |
| Experiment vs. CFD | 16.90 | 18.53 | 22.49 | 32.87 |
Table 9.
Relative error analysis of CH4, CO2, CO and H2 concentrations between average values obtained from CFD model and laboratory tests for the coal sample from hard coal mine B.
Table 9.
Relative error analysis of CH4, CO2, CO and H2 concentrations between average values obtained from CFD model and laboratory tests for the coal sample from hard coal mine B.
| Relative Error (%) | ||||
|---|---|---|---|---|
| CO2 | CO | H2 | CH4 | |
| Experiment vs. CFD | 22.31 | 9.54 | 122.53 | 5.57 |
Table 10.
Relative error analysis of CH4, CO2, CO and H2 concentrations between average values obtained from the CFD model and laboratory tests for the coal sample from hard coal mine C.
Table 10.
Relative error analysis of CH4, CO2, CO and H2 concentrations between average values obtained from the CFD model and laboratory tests for the coal sample from hard coal mine C.
| Relative Error (%) | ||||
|---|---|---|---|---|
| CO2 | CO | H2 | CH4 | |
| Experiment vs. CFD | 21.59 | 47.19 | 72.43 | 49.52 |
Publisher’s Note: MDPI stays neutral with regard to jurisdictional claims in published maps and institutional affiliations. |
© 2021 by the authors. Licensee MDPI, Basel, Switzerland. This article is an open access article distributed under the terms and conditions of the Creative Commons Attribution (CC BY) license (http://creativecommons.org/licenses/by/4.0/).
Share and Cite
MDPI and ACS Style
Janoszek, T.; Masny, W. CFD Simulations of Allothermal Steam Gasification Process for Hydrogen Production. Energies 2021, 14, 1532. https://0-doi-org.brum.beds.ac.uk/10.3390/en14061532
AMA Style
Janoszek T, Masny W. CFD Simulations of Allothermal Steam Gasification Process for Hydrogen Production. Energies. 2021; 14(6):1532. https://0-doi-org.brum.beds.ac.uk/10.3390/en14061532
Chicago/Turabian StyleJanoszek, Tomasz, and Wojciech Masny. 2021. "CFD Simulations of Allothermal Steam Gasification Process for Hydrogen Production" Energies 14, no. 6: 1532. https://0-doi-org.brum.beds.ac.uk/10.3390/en14061532
Note that from the first issue of 2016, this journal uses article numbers instead of page numbers. See further details here.