
Enclosure Design for Brake Wear Particle Measurement Using Computational Fluid Dynamics


1
Department of Mechanical System Engineering, Tongmyong University, Busan 48520, Korea
2
Vehicle Platform R&D Center, Korea Automotive Technology Institute, Cheonan-si 31214, Korea
3
Department of Automotive Engineering, Tongmyong University, Busan 48520, Korea
*
Author to whom correspondence should be addressed.
Energies 2021, 14(9), 2356; https://0-doi-org.brum.beds.ac.uk/10.3390/en14092356
Submission received: 13 March 2021
/
Revised: 17 April 2021
/
Accepted: 19 April 2021
/
Published: 21 April 2021
(This article belongs to the Special Issue Computational Fluid Dynamics (CFD) 2021)
Abstract
:The harmfulness of fine dust generated by automobile brakes to the environment has recently received attention. Therefore, we aimed to analyze and regulate the brake wear particles in dynamometers. To accurately measure the number of particles and particle mass, the sampling system used needs to minimize transportation losses and reduce the residence time in the brake enclosure system. The brake dust measurement system currently used can estimate the main transportation loss but cannot evaluate the complex flow field in the brake enclosure system under different design conditions. We used computational fluid dynamics (CFD) technology to predict the behavior of brake wear particles and analyze the static pressure characteristics, the uniformity of the system flow, and the residence time of the brake dust particles in the system. In addition, we compared the design of the basic structure of the brake enclosure system, combined with the four factors affecting the design of the brake dynamometer, with the enclosure system. As a result, we proposed that the design of the cross section of the brake dynamometer enclosure should be circular, the outlet angle of the enclosure should be 15°, the caliper should be fixed to 150°, and two sets of splitters should be added. This design improves pressure loss and reduces the residence time of brake dust particles in the brake enclosure system.
1. Introduction
As society’s concern about pollution from automobiles has gradually increased, many countries have strengthened emission restrictions on exhaust systems. However, although more attention is being paid to the pollution of the non-exhaust system of automobiles, there are no laws or regulations to limit the dust emission standards of non-exhaust systems around the world. The particles emitted by non-exhaust systems mainly come from brakes, tires and road dust. Brake wear particles are identified as one of the contributors to non-exhaust particle emission. Therefore, in the framework of UNECE-GRPE-PM program, a measurement method and procedure for brake wear particle emission are under discussion [1]. During the braking process, due to the friction between the brake pad and the brake disc, the surface of the brake pad and the brake disc is worn, releasing a large amount of heat energy and generating brake dust composed mainly of heavy metals. The generation of brake wear particles relies on the brake type and test procedure including environmental conditions and driving cycles with braking load. In recent years, there have been many efforts in analyzing the brake wear particles through the experiments such as on-road and laboratory measurements. Lee [2] proposed that more attention should be paid to reducing non-exhaust pollution from cars. The study by Victor et al. [3] found that non-exhaust emissions of German cars exceeded the emissions from car exhausts. Therefore, improved control of the brake dust released into the environment is urgently required. Lee et al. [4] found that the composition of brake dust is mainly S, Ca, Fe, Cu, Ba and other elements, most of which are metals. The brake dust analysis particle size (TSP) is limited to about 50.0 μm. It has been found that ultrafine dust particles of less than 2.5 μm account for about 42% of brake dust, while 2.5–10.0 μm dust particles account for about 40%. Thus, brake dust is an important contributor to PM 2.5 and PM 10 pollution. Recent studies evaluated the negative impact of brake dust particle pollution on human health. Metal brake nano-dust can enter human lungs through respiration and can enter the blood, increasing the risk of cardiovascular and respiratory diseases [5,6]. The three main methods for measuring brake dust use a pin-disc brake dynamometer, brake dynamometer and automobile chassis dynamometer. Among them, the brake dynamometer is currently recognized as the most accurate measurement method [7]. Hagino et al. [8] introduced the JARI (Japan Automobile Research Institute) brake dust dynamometer combined with a precise brake dust sampling system. A sampling filter with an impactor was used to measure PM (particulate matter) (PM 10 and PM 2.5) in brake dust. In the calculation of PN (particle number), the CPC (condensed particle counter) system is used to measure the fine dust, and the APS (aerodynamic particle sizer) system is used to measure coarse dust [8]. With the popularity of new energy vehicles, the problem of brake dust emissions will gradually become more prominent in the future. Although the brake dynamometers are the standard for robust measurements [7,8,9], the sampling system needs to minimize particle transport loss and reduce particle residence times inside the brake enclosure system. It is difficult for automobile chassis dynamometers to discharge the effects of tire wear and obtain reliable experimental data about brake dust polluting wheels. The brake dynamometer cannot evaluate the complex fluid dynamics in the brake housing. If the brake dynamometer is to be used as the only evaluation tool, in addition to the use of a sophisticated sampling system, it also relies on experimental verification, which is complicated and time-consuming, and the settings used affect the experimental results.
CFD (computational fluid dynamics) simulation methods are attractive, especially methods that can be run during aerodynamics and brake thermal management. As traditional methods are unable to measure turbulence and related particle dynamics inside the brake enclosure, research using a brake dynamometer has limitations. Previous studies on brake dynamometers using CFD technology mostly focused on the influence of factors such as the speed of the brake disc, the direction of rotation, and the size of the brake disc on the flow rate of the brake dynamometer. Klaus et al. [10] proposed a brake dust dynamometer based on constant volume sampling (CVS). In another study, CFD technology was used to study the influencing design factors of the brake dust dynamometer, and the overall evaluation results of CFD showed that transport loss and particle uniformity have a strong correlation with air volume, suction direction and disc rotation speed. In this study, a design method for brake dynamometers using CFD technology was proposed, referring to the possible sources of variability when measuring brake emissions under different vehicle activity cycles. The influence of four factors on the movement behavior of brake dust in the brake dynamometer was studied. Comparing the CFD simulation results of the brake dynamometer, we improved the design of the brake dynamometer enclosure, adjusted the best fixing angle of the caliper during the experiment, and proposed the best design.
2. Numerical Setup
2.1. Governing Equations
RANS turbulence models provide closure relations for the Reynolds-Averaged Navier–Stokes equations that govern the transport of the mean flow quantities. For turbulent flow in a fixed reference frame, the basic variables of fluid pressure and flow velocity can be obtained by solving the Reynolds average Navier–Stokes (RANS) equation in the form of a Cartesian tensor [11,12]:
where is the density, is the mean velocity, is the mean pressure, is the identity tensor, and is the mean viscous stress tensor. is the stress tensor.
The turbulence model we used in this study was the standard k-ε model, in which two additional transport equations of k and ε are introduced, and the turbulent viscosity was calculated based on the following two variables [11,12]:
where the turbulence model constants , , , , have standard values defined in the STAR CCM+ k-epsilon model coefficients, which were established through experiments and are widely accepted by basic turbulence. Although they work well in a wide range of engineering applications, it should be noted that in a specific simulation model, its values may need to be adjusted to obtain more accurate results [11,12].
Particle dispersion was simulated by tracking a large number of particles injected from the brake disc. The Lagrange method involves calculating the trajectory of each particle in consideration of the force acting on it. For submicron particles, in addition to resistance [13], Brown force must also be considered. However, with the particle size range studied here, the influence of other forces, such as Huffman lifting force [14], virtual mass force and pressure gradient effect [15], could be ignored. Turbulence through instantaneous fluctuations is the main mechanism of particle dispersion. However, by using the RANS equation, instantaneous particle cloud changes cannot be displayed. To consider turbulent diffusion, the discrete element method (DEM) and discrete random walk (DRW) model [16] were combined with the random eddy current life model. Through the random process, the influence of the turbulent pulsating velocity component could be modeled. Then, the statistical evolution of the particle cloud could be tracked [11].
In the momentum conservation equation under the Lagrange framework, the change of particle momentum is balanced with the resultant surface force acting on the particle and the particle’s physical force.
The equation of conservation of (linear) momentum for a material or DEM particle of mass is given by [11]
where denotes the instantaneous particle velocity [m/s], is the resultant forces [N] that act on the surface of the particle, and is the resultant body forces [N]. These forces in turn are decomposed into
where is the drag force [N], is the pressure gradient force [N], and is the virtual mass force [N]. To simplify the experimental conditions, the brake dust was regarded as a perfect rebound, namely, rebound = 1.
2.2. 3D Model of Brake Dust Dynamometer with Enclosure
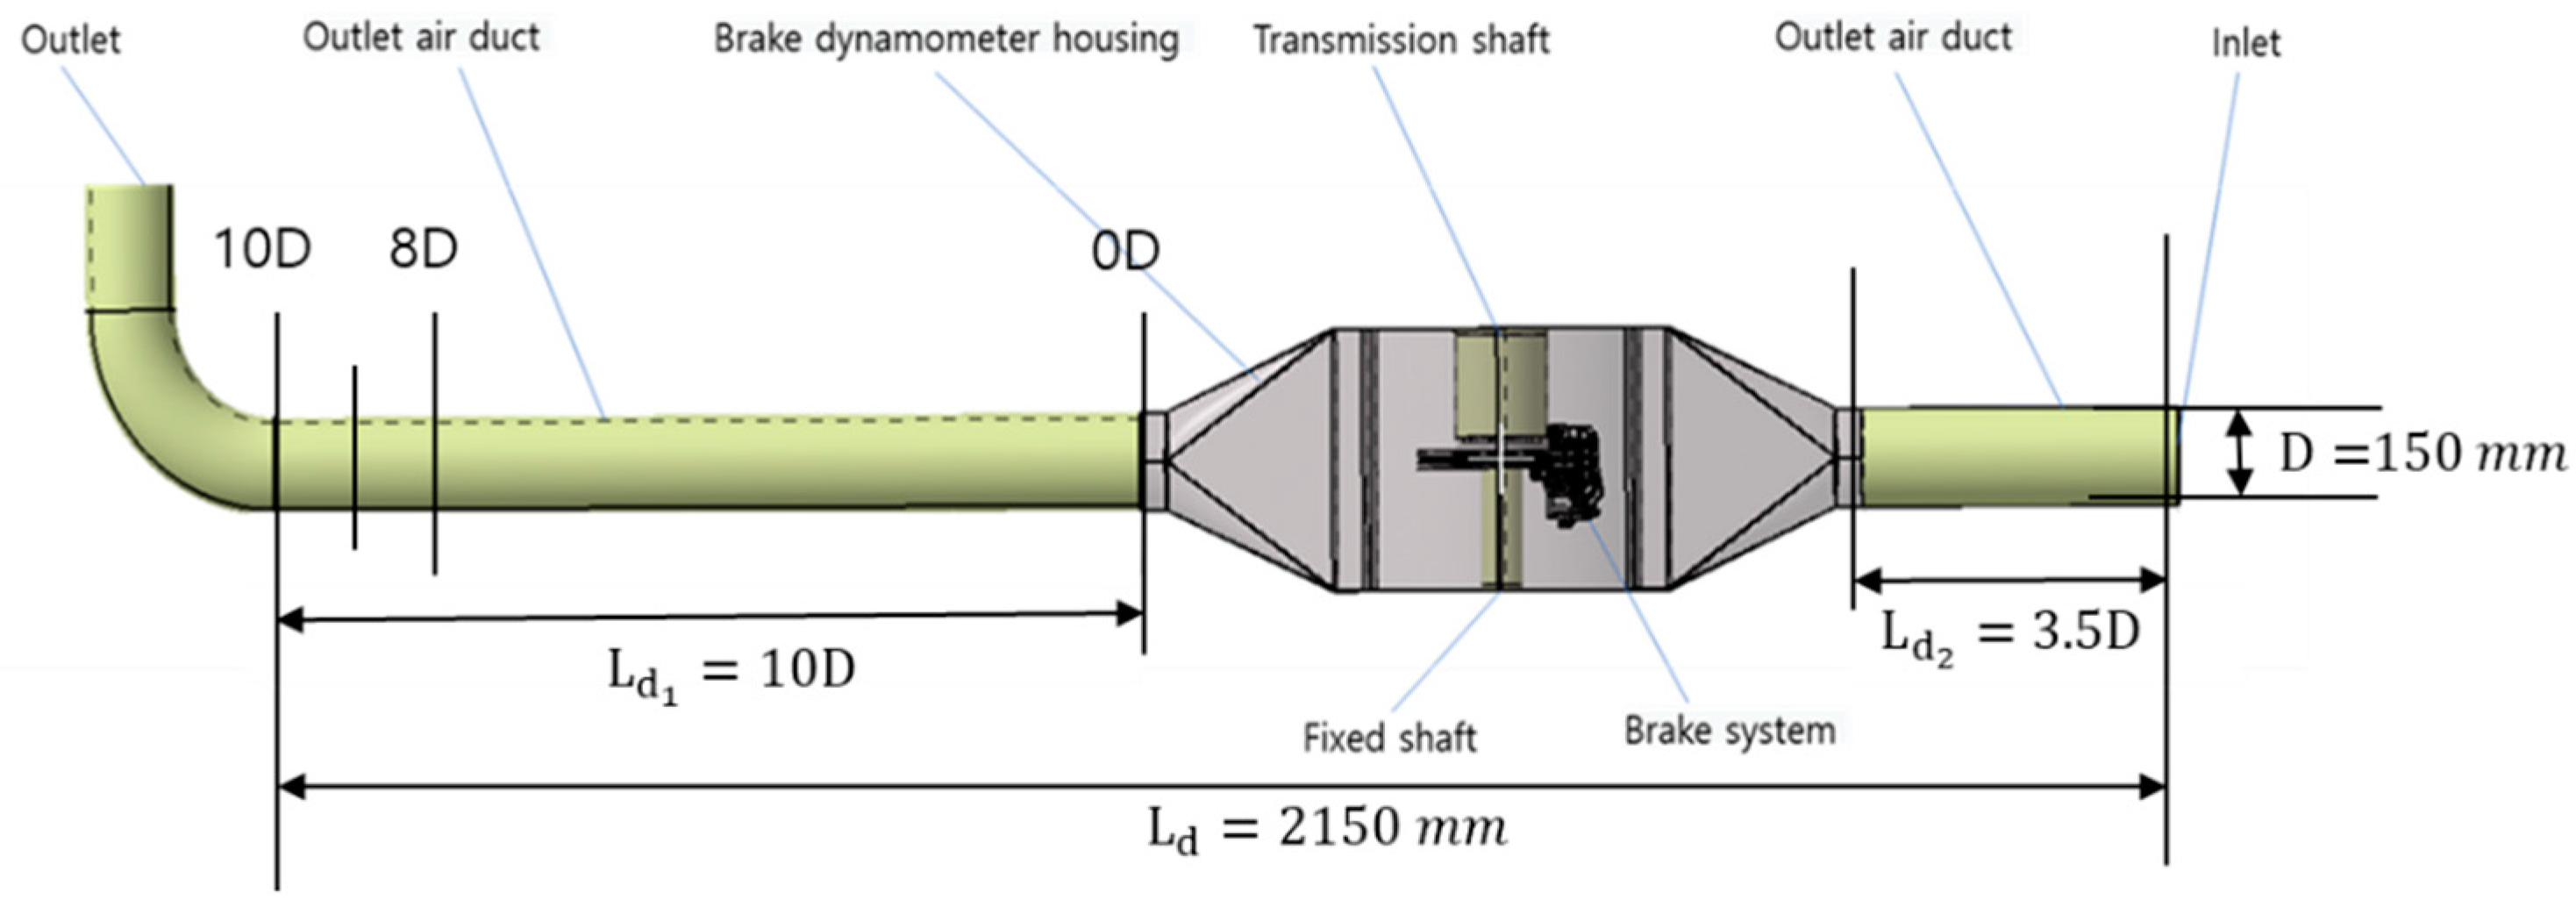
The laboratory measurement of brake emissions uses an inertia dynamometer setup, which includes mechanical subsystems, controls, and data acquisition software. The duct design, the brake enclosure size and geometry, and the geometry of the actual brake assembly all can influence the airborne behavior of the particles emitted by the friction couple. In addition, the actual vehicle application will determine the preferred brake rotation, and the cooling air flow that matches a cooling rate specification [17]. The brake dust dynamometer we designed is shown in Figure 1. The diameter of the air duct is D = 150 mm, the length of the inlet air duct was 3.5 D, the length of the outlet air duct was 10 D. In this simulation experiment, 11 sampling sections were selected between 0 and 10 D to measure the flow uniformity.
2.3. Design Parameters
Figure 2 shows a schematic diagram of the brake dust enclosure. In the brake dynamometer test, a HEPA (high efficiency particulate air) filter was used to clarify the air at the entrance to reduce the influence of inherent dust in the air on the test. The air inlet was kept at 20 ± 2 °C and 50 ± 5% RH. Since the brake disc usually rotates counterclockwise with the wheel during braking, our research mainly focused on the counterclockwise rotation direction of the brake disc. The rotation speed of the brake disc was set to 195 rpm, which simulates a normal vehicle speed. The wind speed was about 3.46 m/s. According to the International Standard (ISO 12103-1) approximate bulk density particles was assumed as 500 kg/m3 in ISO ultrafine category [18]. Brake wear particles were injected with the specified dust particle size distribution, and the diameters of the brake dust were set to 5 and 10 μm. The particle inception rate was set to 0.00925 μg/s [17]. Finally, computational fluid dynamics (CFD) was used to combine four groups of influencing factors to establish a simulation experiment. The brake dynamometer was optimized according to the simulation results, comprehensive system static pressure, turbulence intensity, average velocity distribution in the brake dynamometer, and the comparison of the braking particle residence time.
Table 1 shows four groups of simulation design parameters. The first group was the shape design of the cross-sectional area of the brake dynamometer enclosure. There were three design options, namely, a circular, hexagonal and rectangular design. The second group was the design of the inlet and outlet angle of the brake dynamometer enclosure, with four design options of 5°, 10°, 15° and 23°. The purpose of the third group was to determine the optimal fixing angle for the caliper. The fixed angle of the caliper had five design schemes: 0°, 30°, 60°, 150° and 180°. The fourth group was the optimized design of adding splitters into the enclosure of the brake dynamometer. Two optimization design ideas—adding a single group of splitters or two groups—were proposed. Among the five groups of design schemes, IV-1, 3 and IV-2, 4 were control experiments of the number of splitter groups, while IV-1, 2 and IV-3, 4 were control experiments for the caliper fixing angle tests.
In this study, STAR CCM+ was used to establish a simulation model. First, the boundary conditions were divided. The inlet of the air duct was set as the velocity inlet and the outlet of the air duct was set as the pressure outlet. To improve the mesh quality, the surface geometry was wrapped first, and the preset brake pads distance to the brake disc prevented the appearance of poor quality meshes between the disc and pads. As shown in Figure 3a, to improve the quality of the mesh we selected a hexahedral mesh as the volume mesh, with three prism layers, and the total thickness of the prism layers was set to 5 mm. Finally, about 3 million grids were divided for calculation.
A three-dimensional incompressible turbulence model was used to simulate the flow into the dynamometer enclosure, the multiple reference frame (MRF) method was used to simulate the rotation of the brake disc, and the discrete element method (DEM) was used to design the brake dust particles. As shown in Figure 3b, the boundary of the brake pad was selected as the injection position of the brake dust particles.
3. Results
3.1. The Shape of the Enclosure
Figure 4 shows the velocity results in the cross-sectional plane of the brake enclosure system with three different shapes. Generally speaking, the speed distribution was mainly concentrated in the lower part of the brake dynamometer enclosure, and the turbulent direction of the intake air deflected downward. The main reason for this is that the high-speed rotation of the brake disc increases the airflow near the brake disc in the direction of the rotation of the brake disc, while the air pressure in the direction opposite to the speed of the brake disc decreases. Therefore, the intake direction is biased toward the low pressure component. Among the three designs, the circular design of the brake dynamometer enclosure had a relatively uniform velocity distribution, and the air intake direction deflection angle was obvious. The hexagonal design had obvious differences between the upper and lower speed distributions in the brake dynamometer enclosure. The intake direction was slightly deflected downward. The quadrilateral design was relatively concentrated in the speed distribution in the brake dynamometer enclosure, and the air intake direction was slightly deflected downward. We concluded that the design of the brake dynamometer enclosure should be circular, as this shape is conducive to combining the turbulence formed by the rotation of the brake disc and makes the overall speed distribution more even. Appropriately reducing the size of the brake dynamometer enclosure can make the overall speed distribution more concentrated.
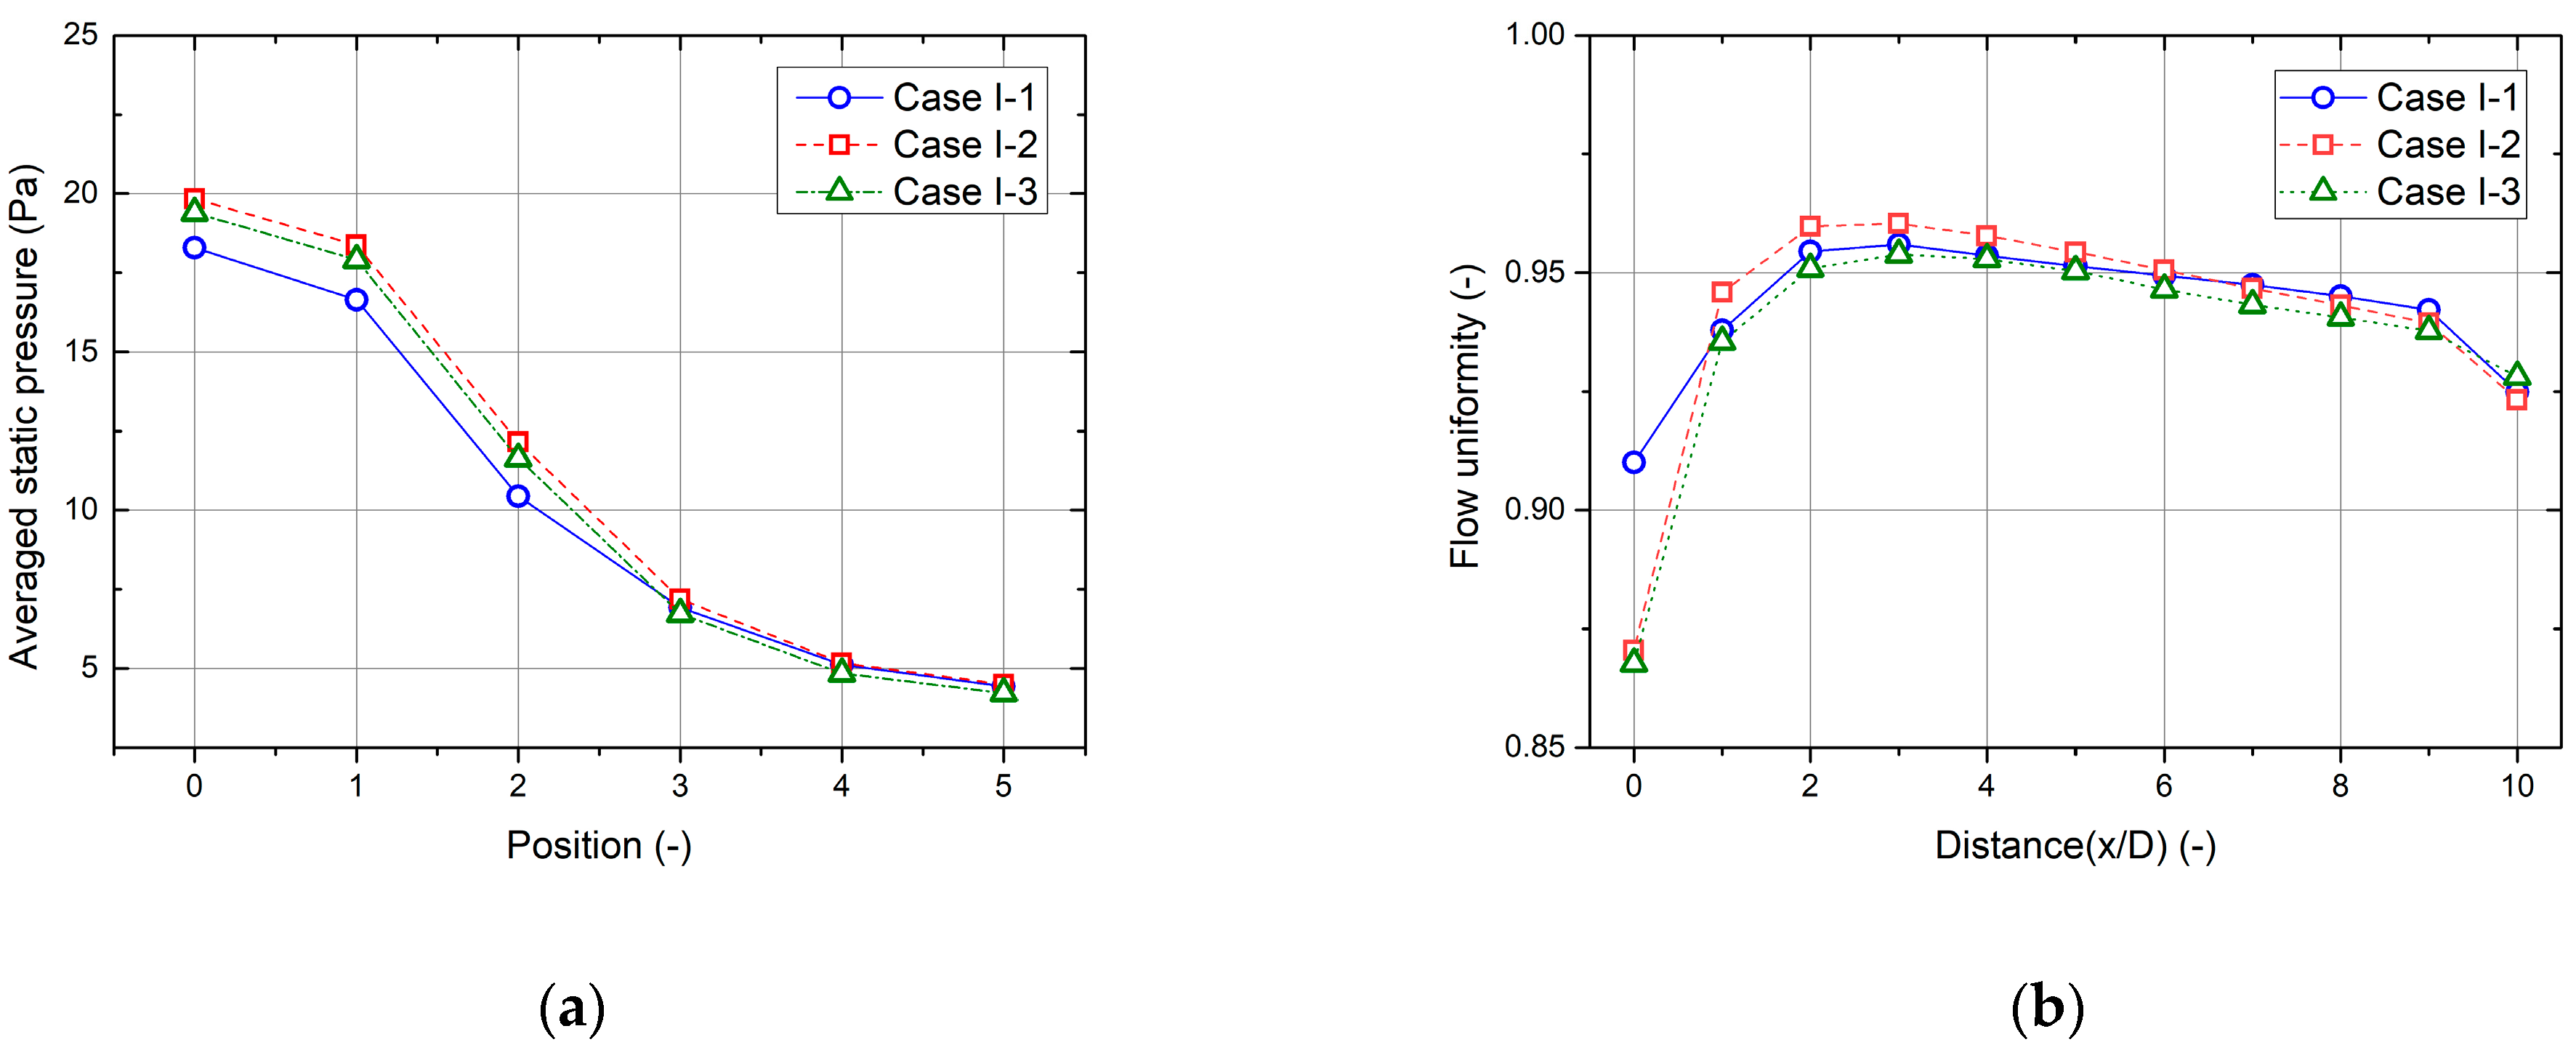
Static pressure characteristics and flow uniformity are important for evaluating enclosure design for brake dust measurement systems. The increase in static pressure will increase the resistance of the entire system, and the uniformity of the flow determines the accuracy of brake dust sampling. In the static pressure of the system, the sampling sections are the inlet section of the air pipe, the inlet and outlet sections of the brake dynamometer enclosure, the 8D section, and the outlet section of the air pipe, totaling six sampling sections. The sampling cross sections for flow uniformity were from 0 D to 10 D on the outlet duct, with a total of 11 sampling cross sections. As shown in Figure 5a, the static pressure characteristics of the hexagonal design and rectangular design were basically the same in the brake dynamometer, and the system with the circular design had the smallest overall static pressure. The speed distribution of the turbulence formed by the rotation of the brake disc was more uniform in the enclosure with a circular design, and the circulation of the turbulence was accelerated, so the total static pressure was minimized. Among the three designs, although the rectangular design had the smallest enclosure volume, the uniformity of turbulence in the brake dynamometer enclosure was higher than that of the hexagonal design. The total static pressure was not only related to the volume of the enclosure but is also related to the turbulence distribution in the enclosure. As shown in Figure 5b, in the comparison of the flow uniformity of the brake dynamometer enclosure, the flow of the hexagonal and rectangular design at 0 D (brake dynamometer enclosure outlet) flow uniformity tended to be the same. The flow uniformity of the circular design at 0D was relatively high. After 1 D, the flow uniformity of the three designs was the same.
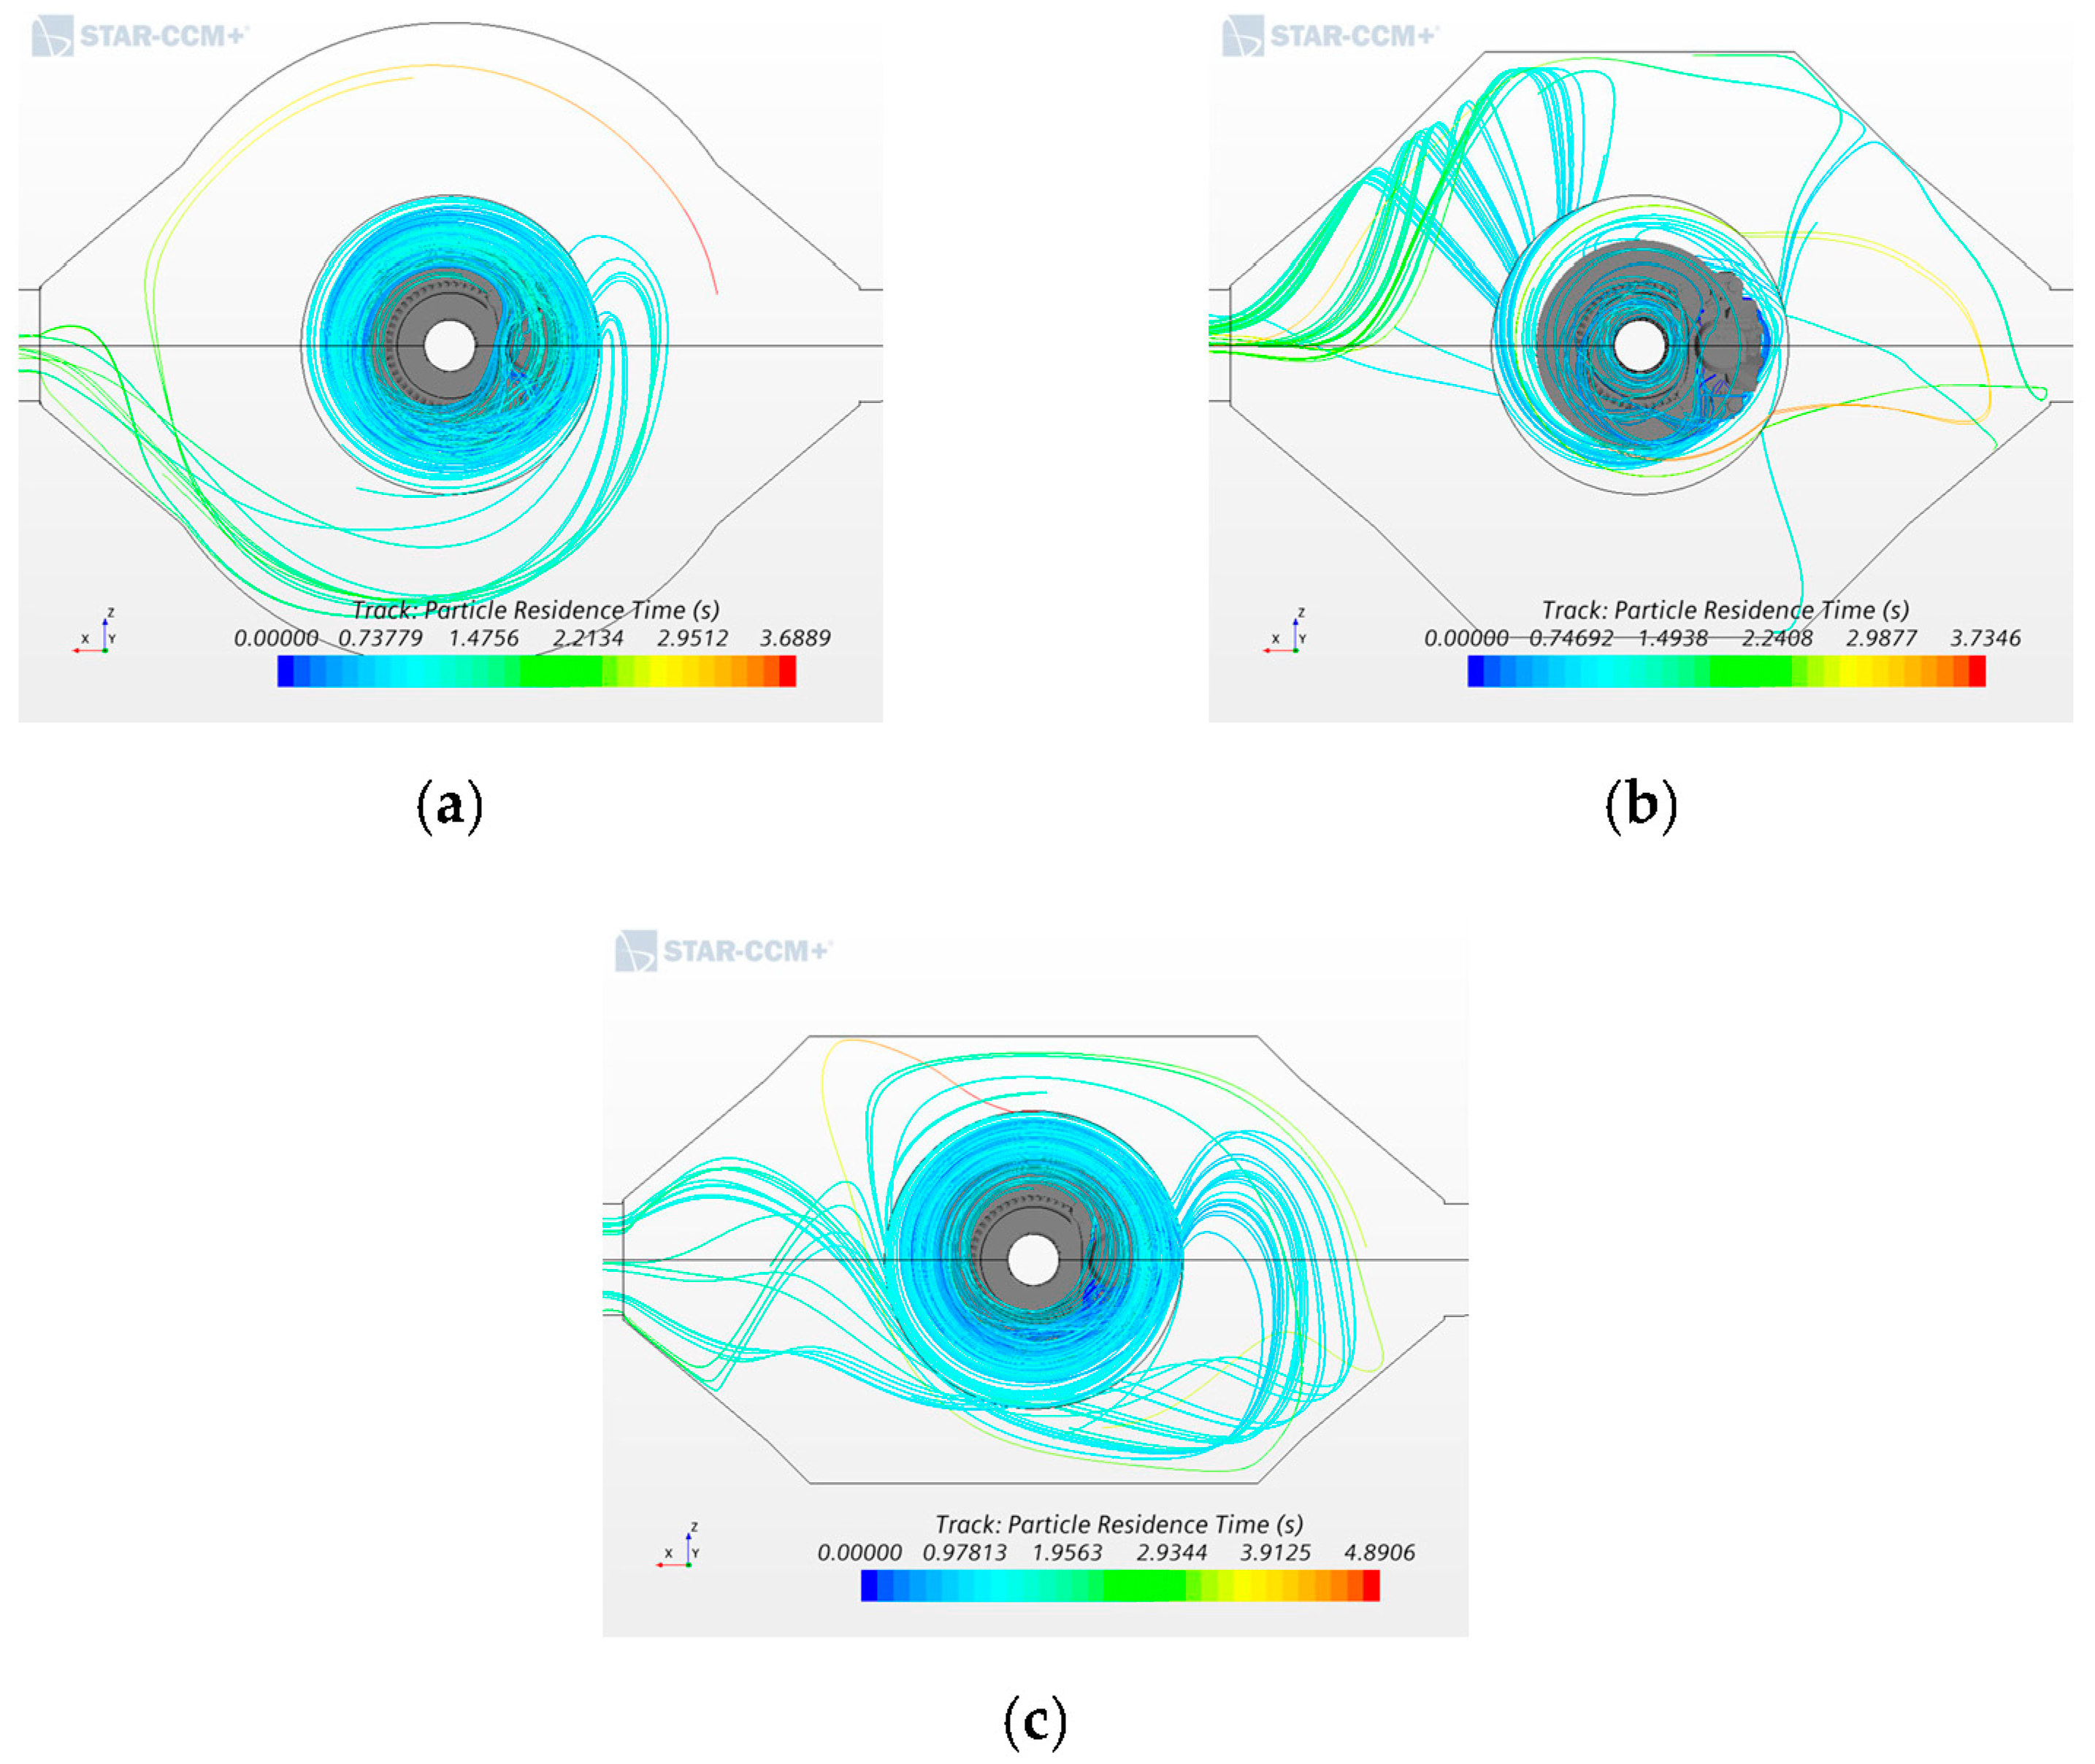
The particle residence time is the most important criterion for the evaluation of brake dust dynamometers. Figure 6 shows the results of particle trajectory of brake system with three different shapes. The retention time of particles was 3.67, 3.73 and 4.89 s for the circular, hexagonal and rectangular design, respectively. In the comparison of the motion trajectory of brake dust, the motion trajectory of dust particles in the circular design was mostly circularly centrifuged and the movement quickly entered the air duct, although a small amount of particles may be affected by the turbulence in the brake dynamometer enclosure and performance of circular movement for a long time, which would increase the retention time of brake dust. For the hexagonal and rectangular designs, the trajectory of brake dust in the housing of the brake dynamometer had different degrees of disorder. This analysis result may be because the brake dust was separated from the brake disc and subjected to a centripetal force to move in a circle within a certain period of time. Nevertheless, when the enclosure of the brake dynamometer was circular, the movement track of the brake dust was stable; therefore, we found that the optimal solution is to design a circular cross section of the enclosure of the brake dynamometer.
3.2. The Angle of the Inlet and Outlet of the Enclosure
In the design of the inlet and outlet angle of the brake dynamometer enclosure, if the inlet and outlet angles of the dynamometer enclosure are too small, the turbulence in the dynamometer enclosure will increase due to the rotating turbulence of the brake disc. The airflow forms a steady state cycle. In contrast, if the inlet and outlet angles of the brake dynamometer enclosure are too large, the turbulence entering the dynamometer enclosure cannot be combined well with the steady-state rotation turbulence of the brake disc, resulting in turbulence in the brake dynamometer enclosure.
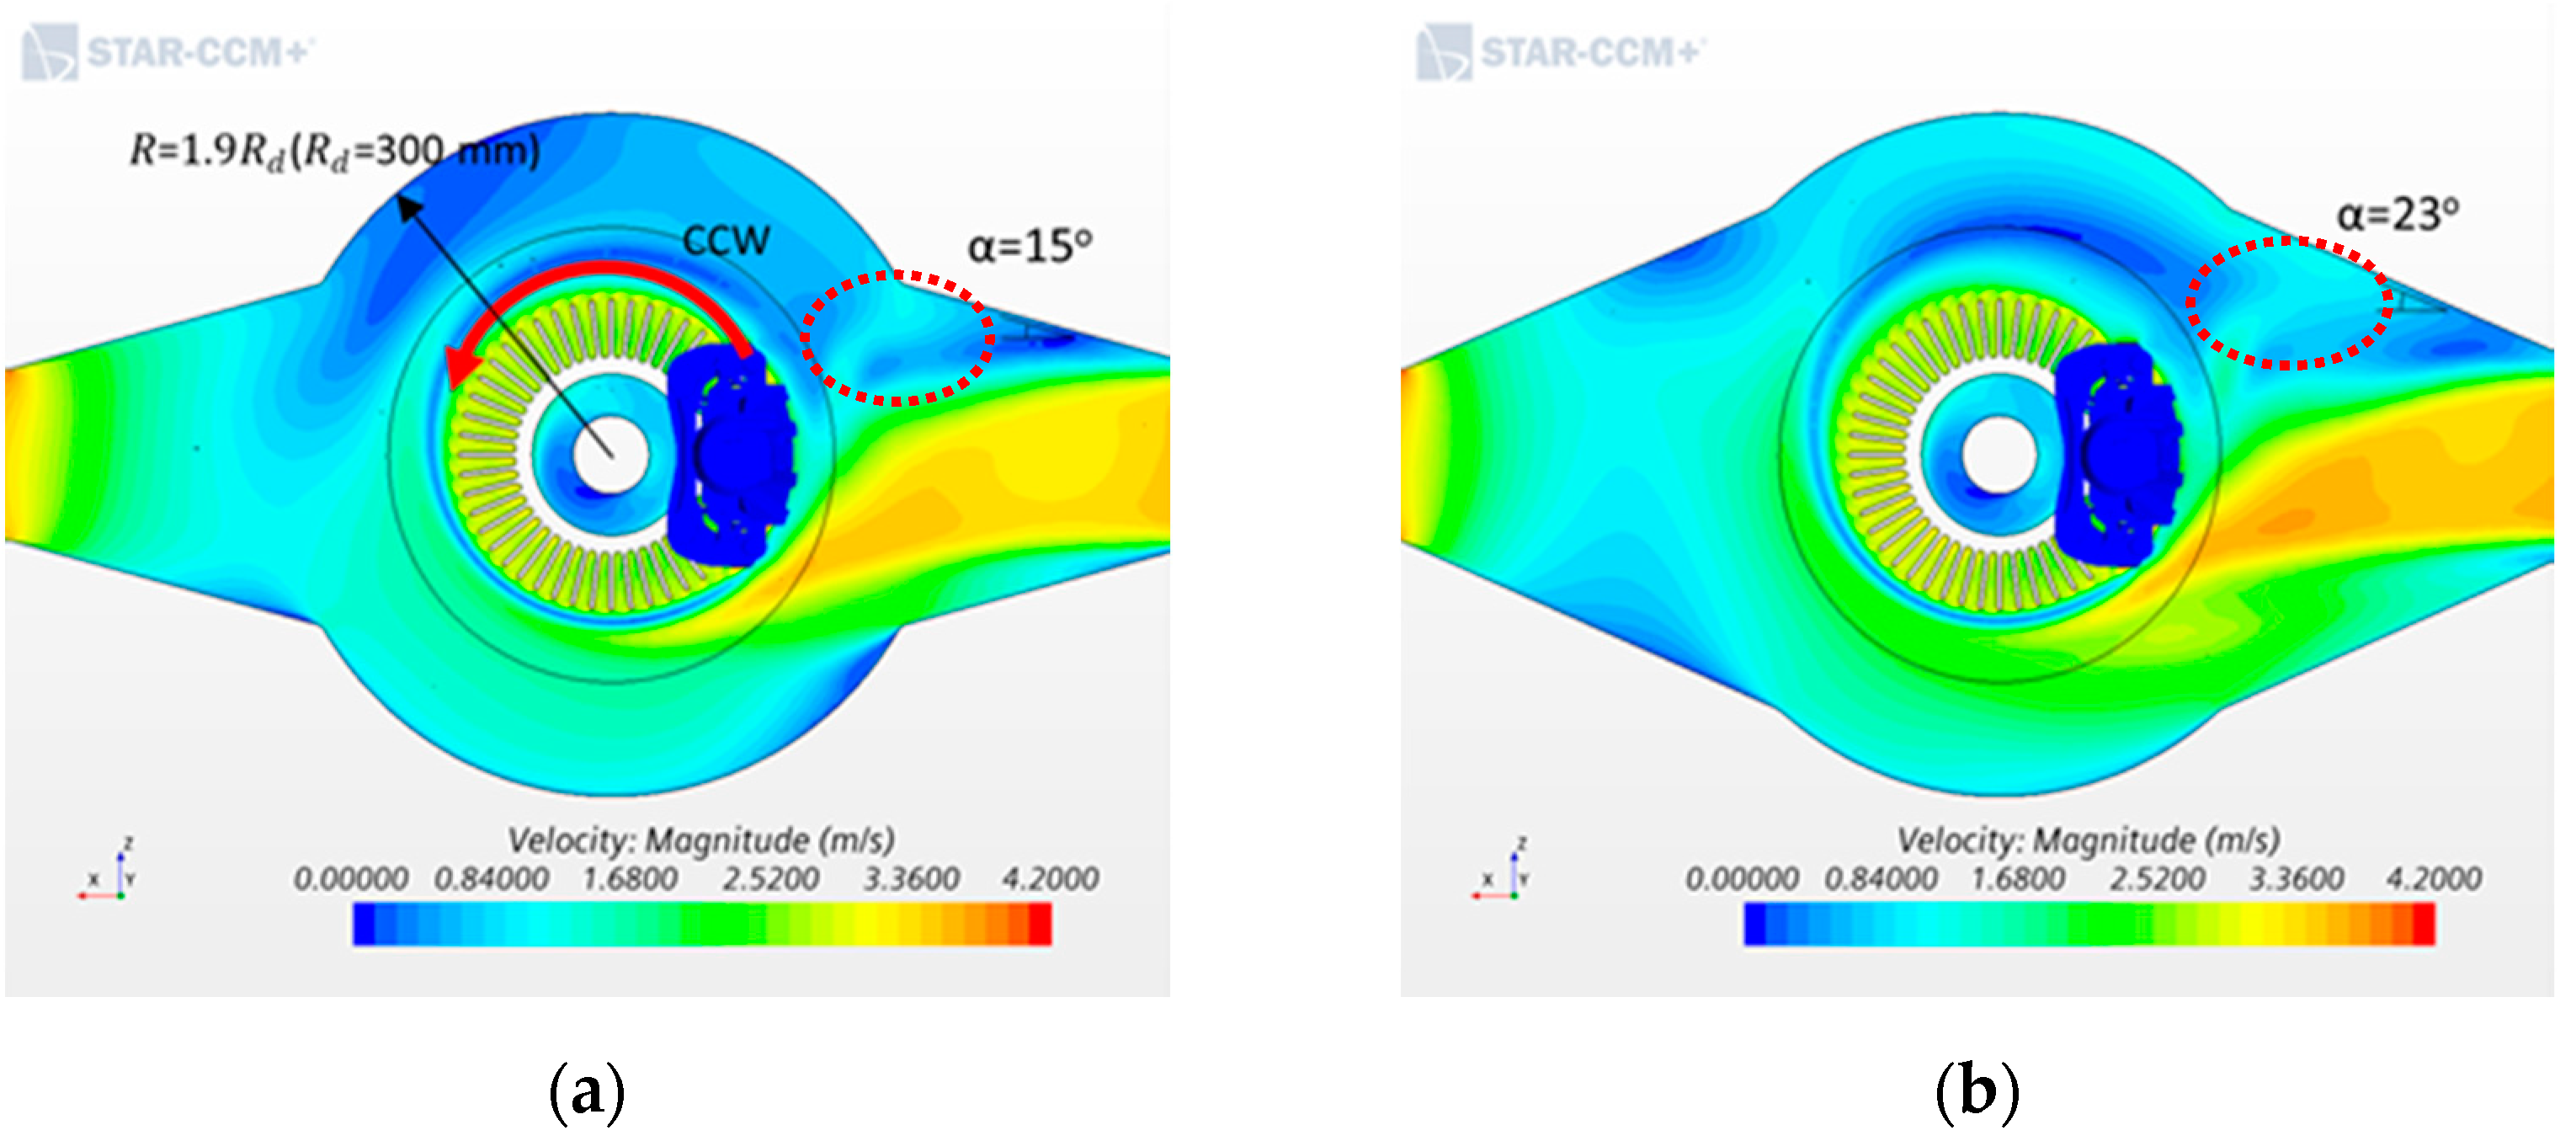
In the comprehensive comparison of these four designs, the greater the angle of the inlet and outlet of the housing, the more obvious the concentration of the intake velocity, as shown in Figure 7, where the inlet and outlet angles are α = 15° and α = 23°, respectively.
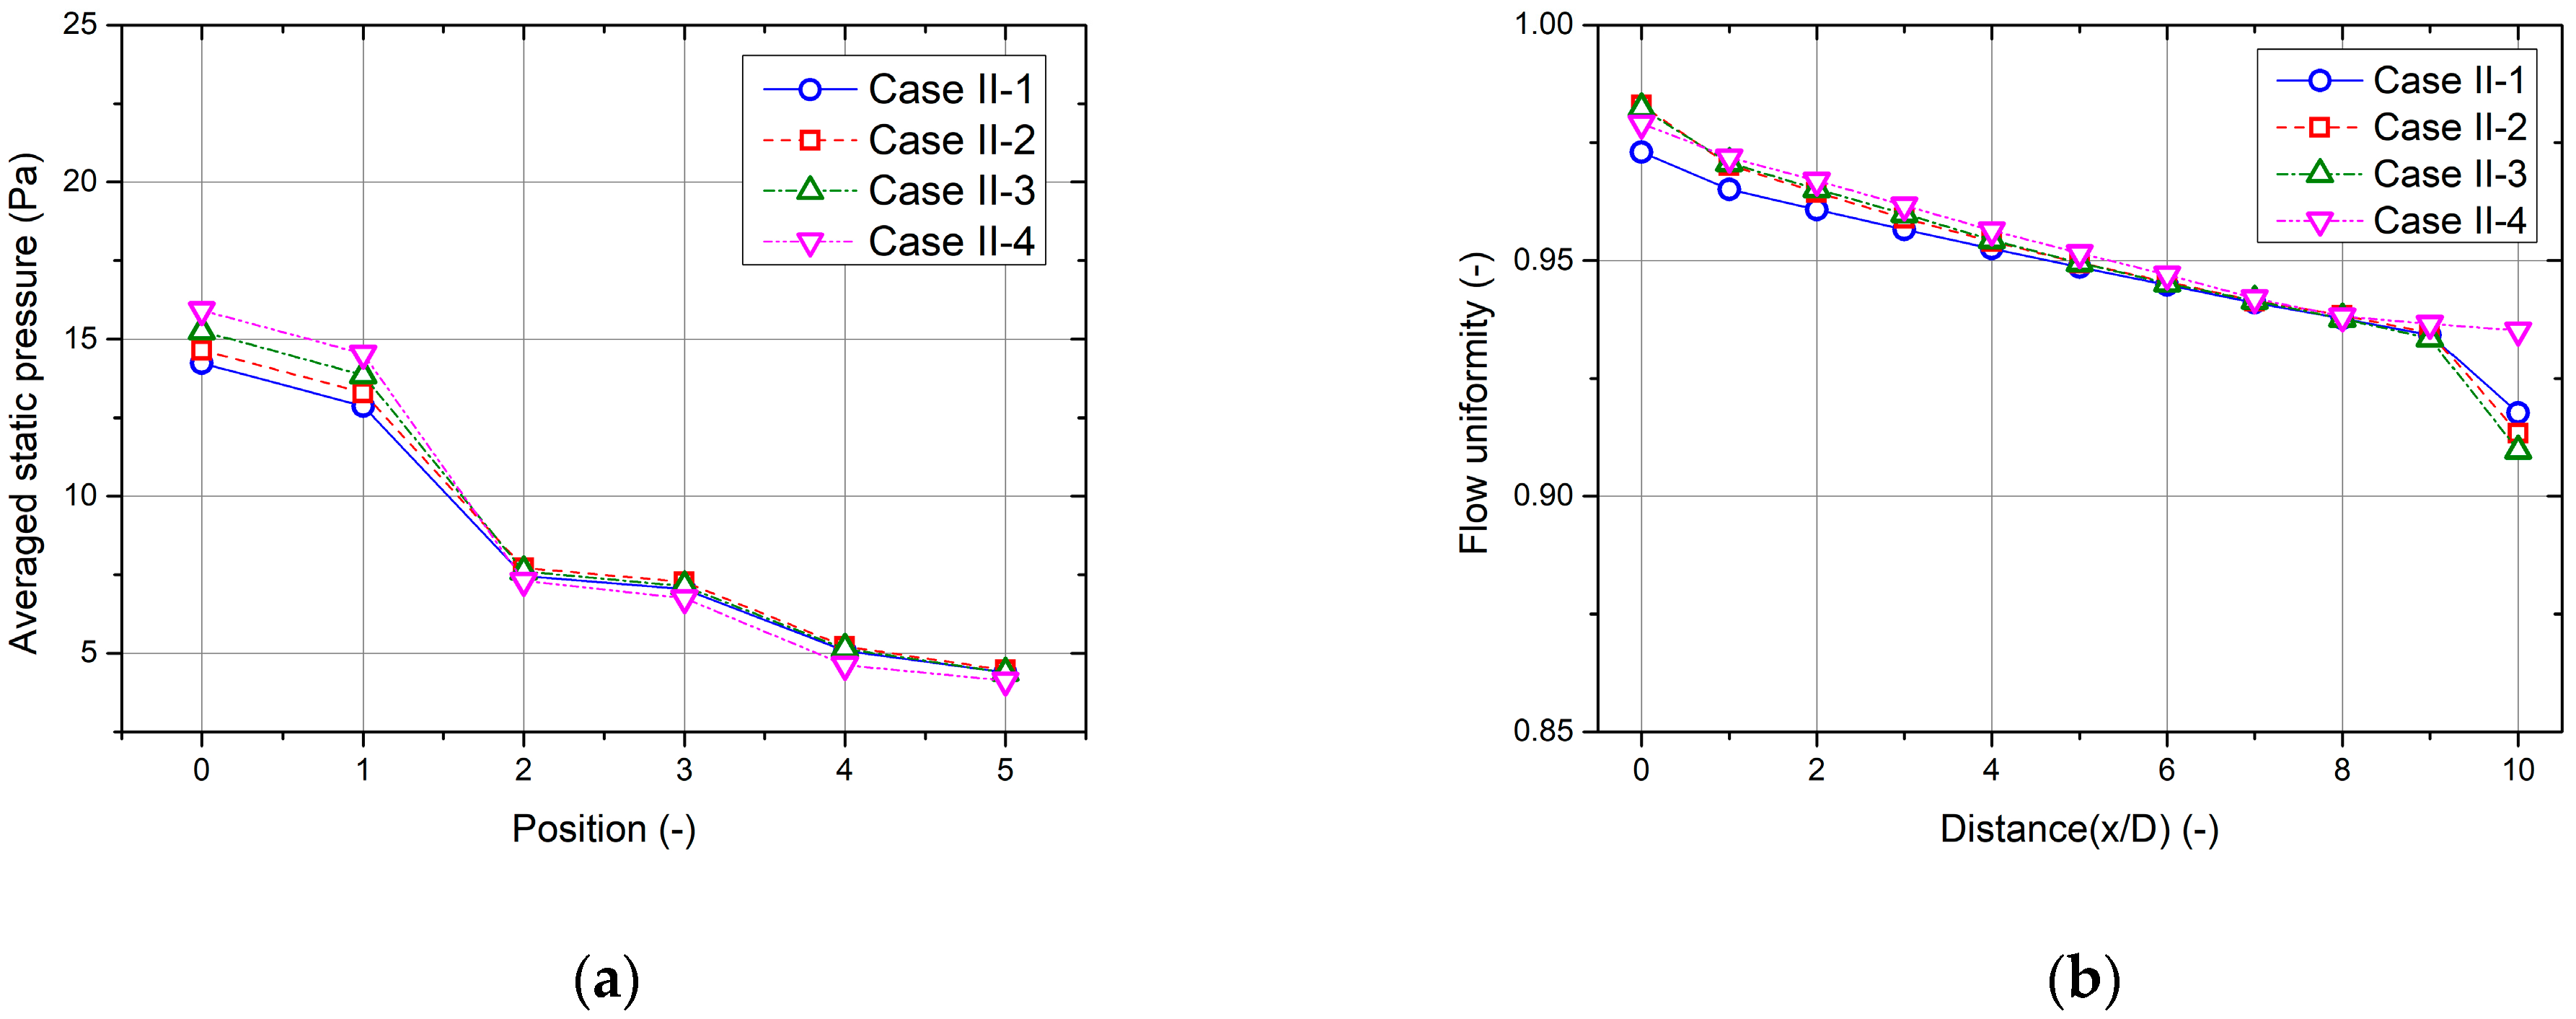
As shown in Figure 8 with the design of the inlet and outlet angles of the brake dynamometer enclosure, the sampling section of the static pressure distribution included six sections: the duct inlet section, brake dynamometer enclosure inlet and outlet sections, 8D section, and outlet section of the duct. The difference in static pressure was most obvious at the inlet section of the air duct. Figure 8a shows that the larger the angle of the inlet and outlet of the brake dynamometer enclosure was, the greater the overall static pressure of the system. This was affected by the structure of the brake disc (such as the ventilation structure), when the brake disc rotates, the turbulence generated by the rotation also spread outward. The larger the inlet and outlet angle of the brake dynamometer enclosure, the more the turbulence is concentrated in the inlet and outlet of the enclosure. As a result, the static pressure of the system increases. Figure 8b shows the flow uniformity distribution sampling section, followed by the cross section from 0 to 10 D at the outlet duct. The flow uniformity was similar at the inlet of the outlet duct. With the inlet and outlet angle of the brake dynamometer enclosure was set to α = 5°, the flow uniformity was slightly lower compared with the other three designs. As the design of the inlet and outlet was too small, the influence of the turbulence generated by the brake disc was greater. The speed concentration phenomenon at the outlet of the enclosure reduced the uniformity of the outlet of the enclosure. At 9~10 D of the outlet duct, the bending had little effect on the flow uniformity of the inlet and outlet angle of the brake dynamometer enclosure at α = 23°. The flow uniformity with an inlet and outlet angle of α = 23° was highest of the designs we tested, while the flow uniformity of the four cases was basically the same at 8 D. Therefore, in laboratory sampling, when 8 D is selected as the sampling point, the angle of the inlet and outlet of the brake dynamometer enclosure had no effect on the flow uniformity.
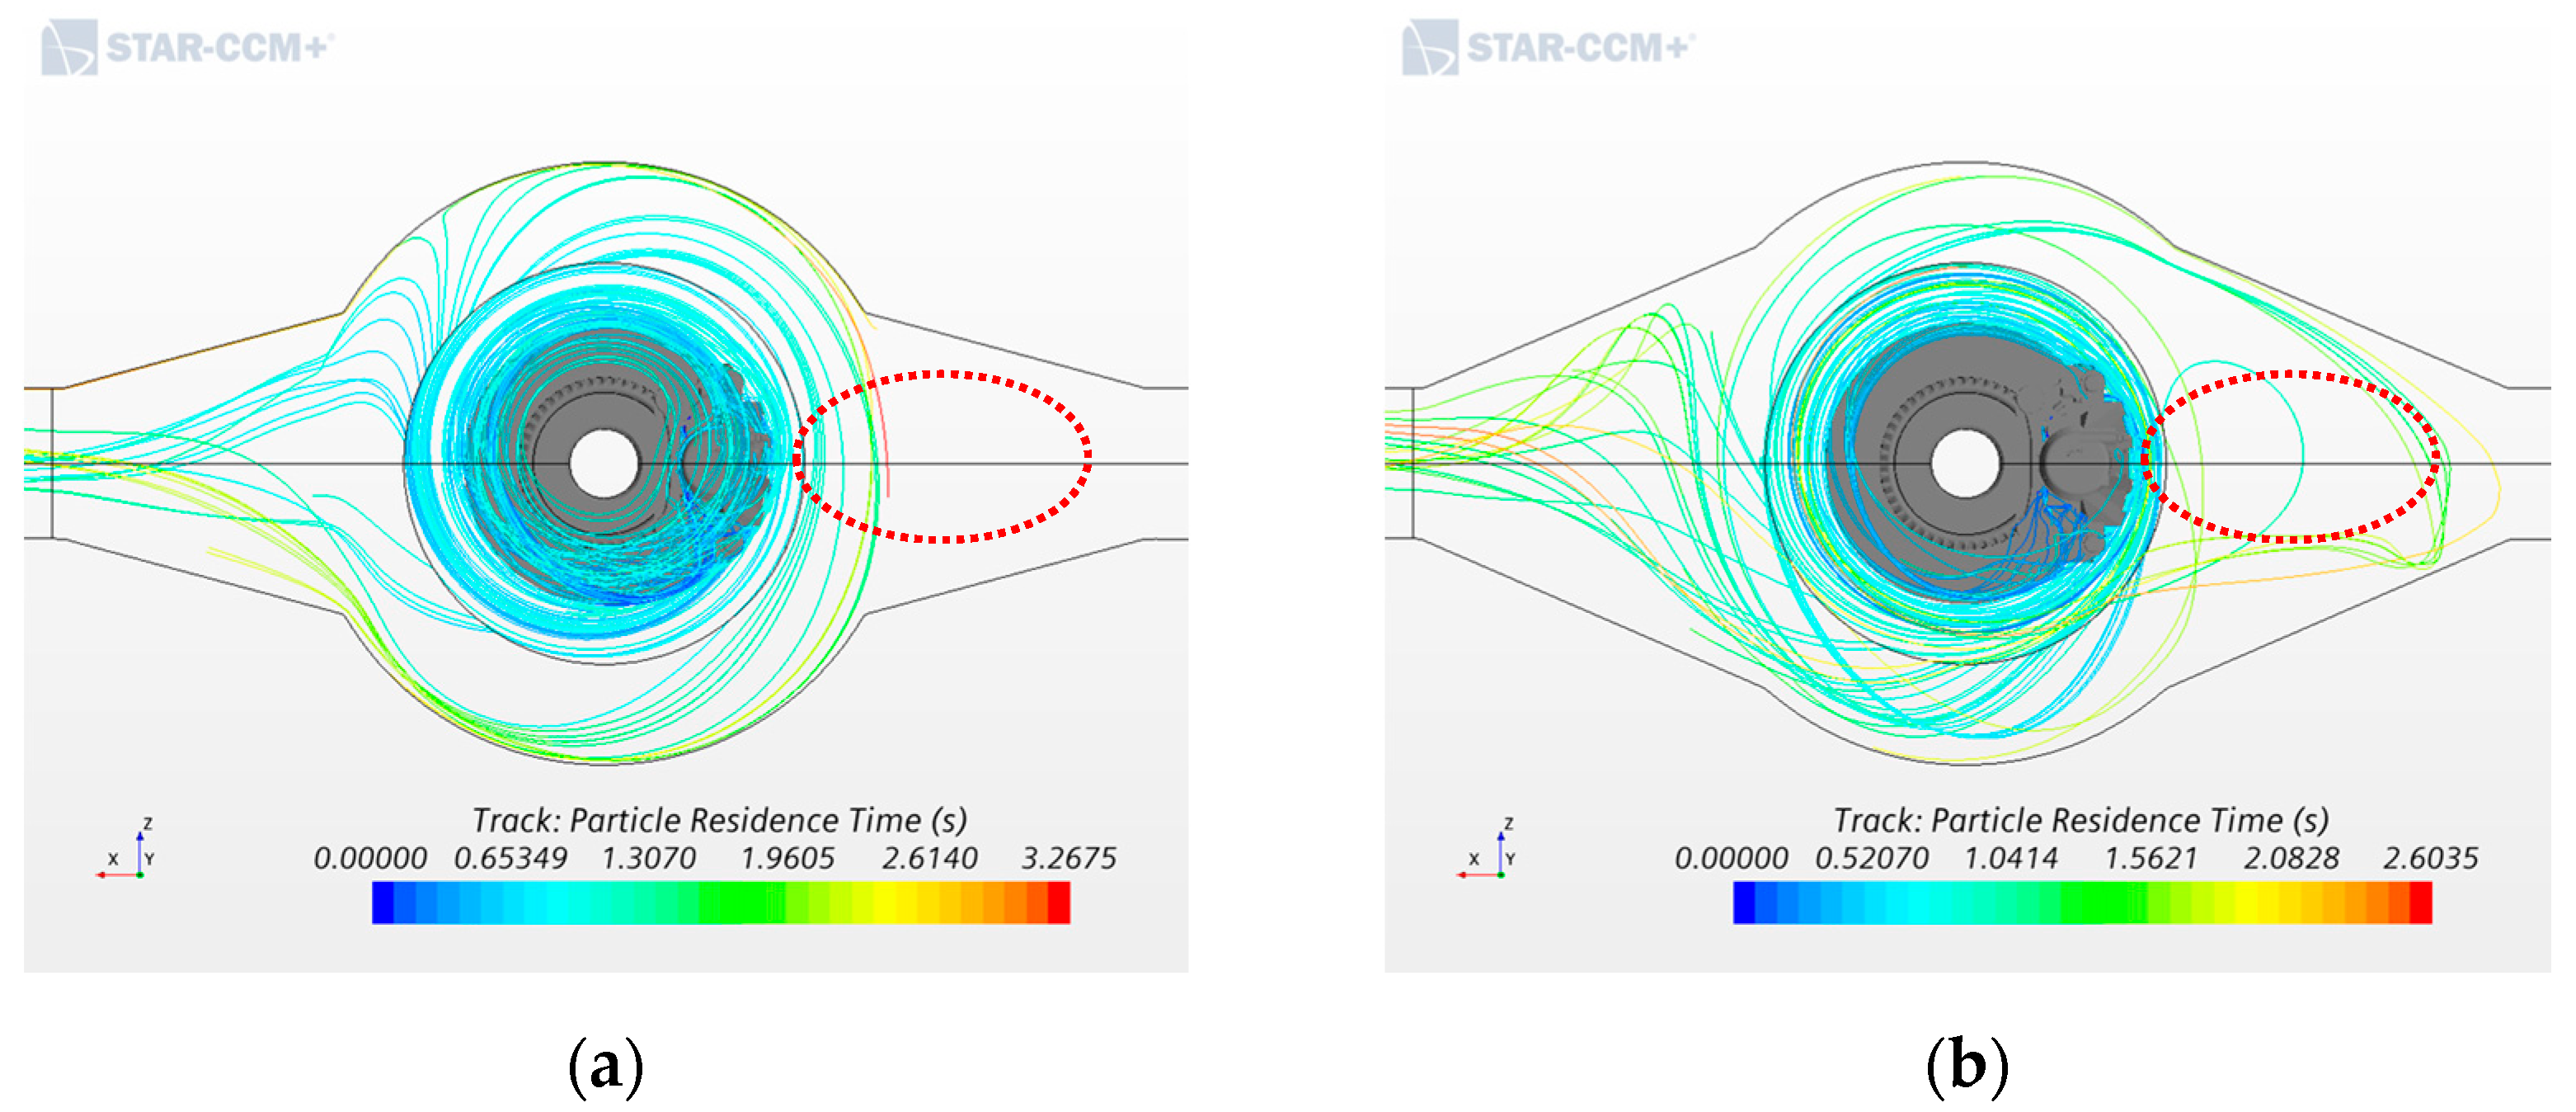
With regard to the design of the inlet and outlet angle of the brake dynamometer enclosure, the residence time of brake dust in the brake dynamometer was 3.93, 1.99, 3.27, 2.60 s for the Case II-1 ~ 4. The residence time of brake dust particles in the dynamometer was shortest with an inlet and outlet angle of α = 10°. However, the particles had more rotational motion trajectories near the fixed axis, indicating that the turbulence formed by the rotation of the brake disc was greatly affected. During the laboratory measurement of brake dust, the variable that controlled the intake turbulence should be the main factor. The turbulence of the brake disc affects the residence time of the brake dust, which is difficult to control. With the entrance angle of the brake dynamometer enclosure set to α = 15°, the residence time of the brake dust in the brake dynamometer was 3.20 s, which is relatively stable, and the movement trajectory of the brake dust was present. The sequential centrifugal movement trajectory with the design scheme with inlet and outlet angles of α = 15° and α = 23° is shown in Figure 9. Although the retention time of the brake particles was shorter when the enclosure inlet and outlet angle was α = 23°, it can be seen that disturbed turbulence formed at the entrance to the enclosure. If the trajectory of the brake particles is disordered, it will cause the brake particles to be deposited in the brake dynamometer enclosure, causing transportation loss and affecting measurement results.
3.3. The Angle of the Caliper
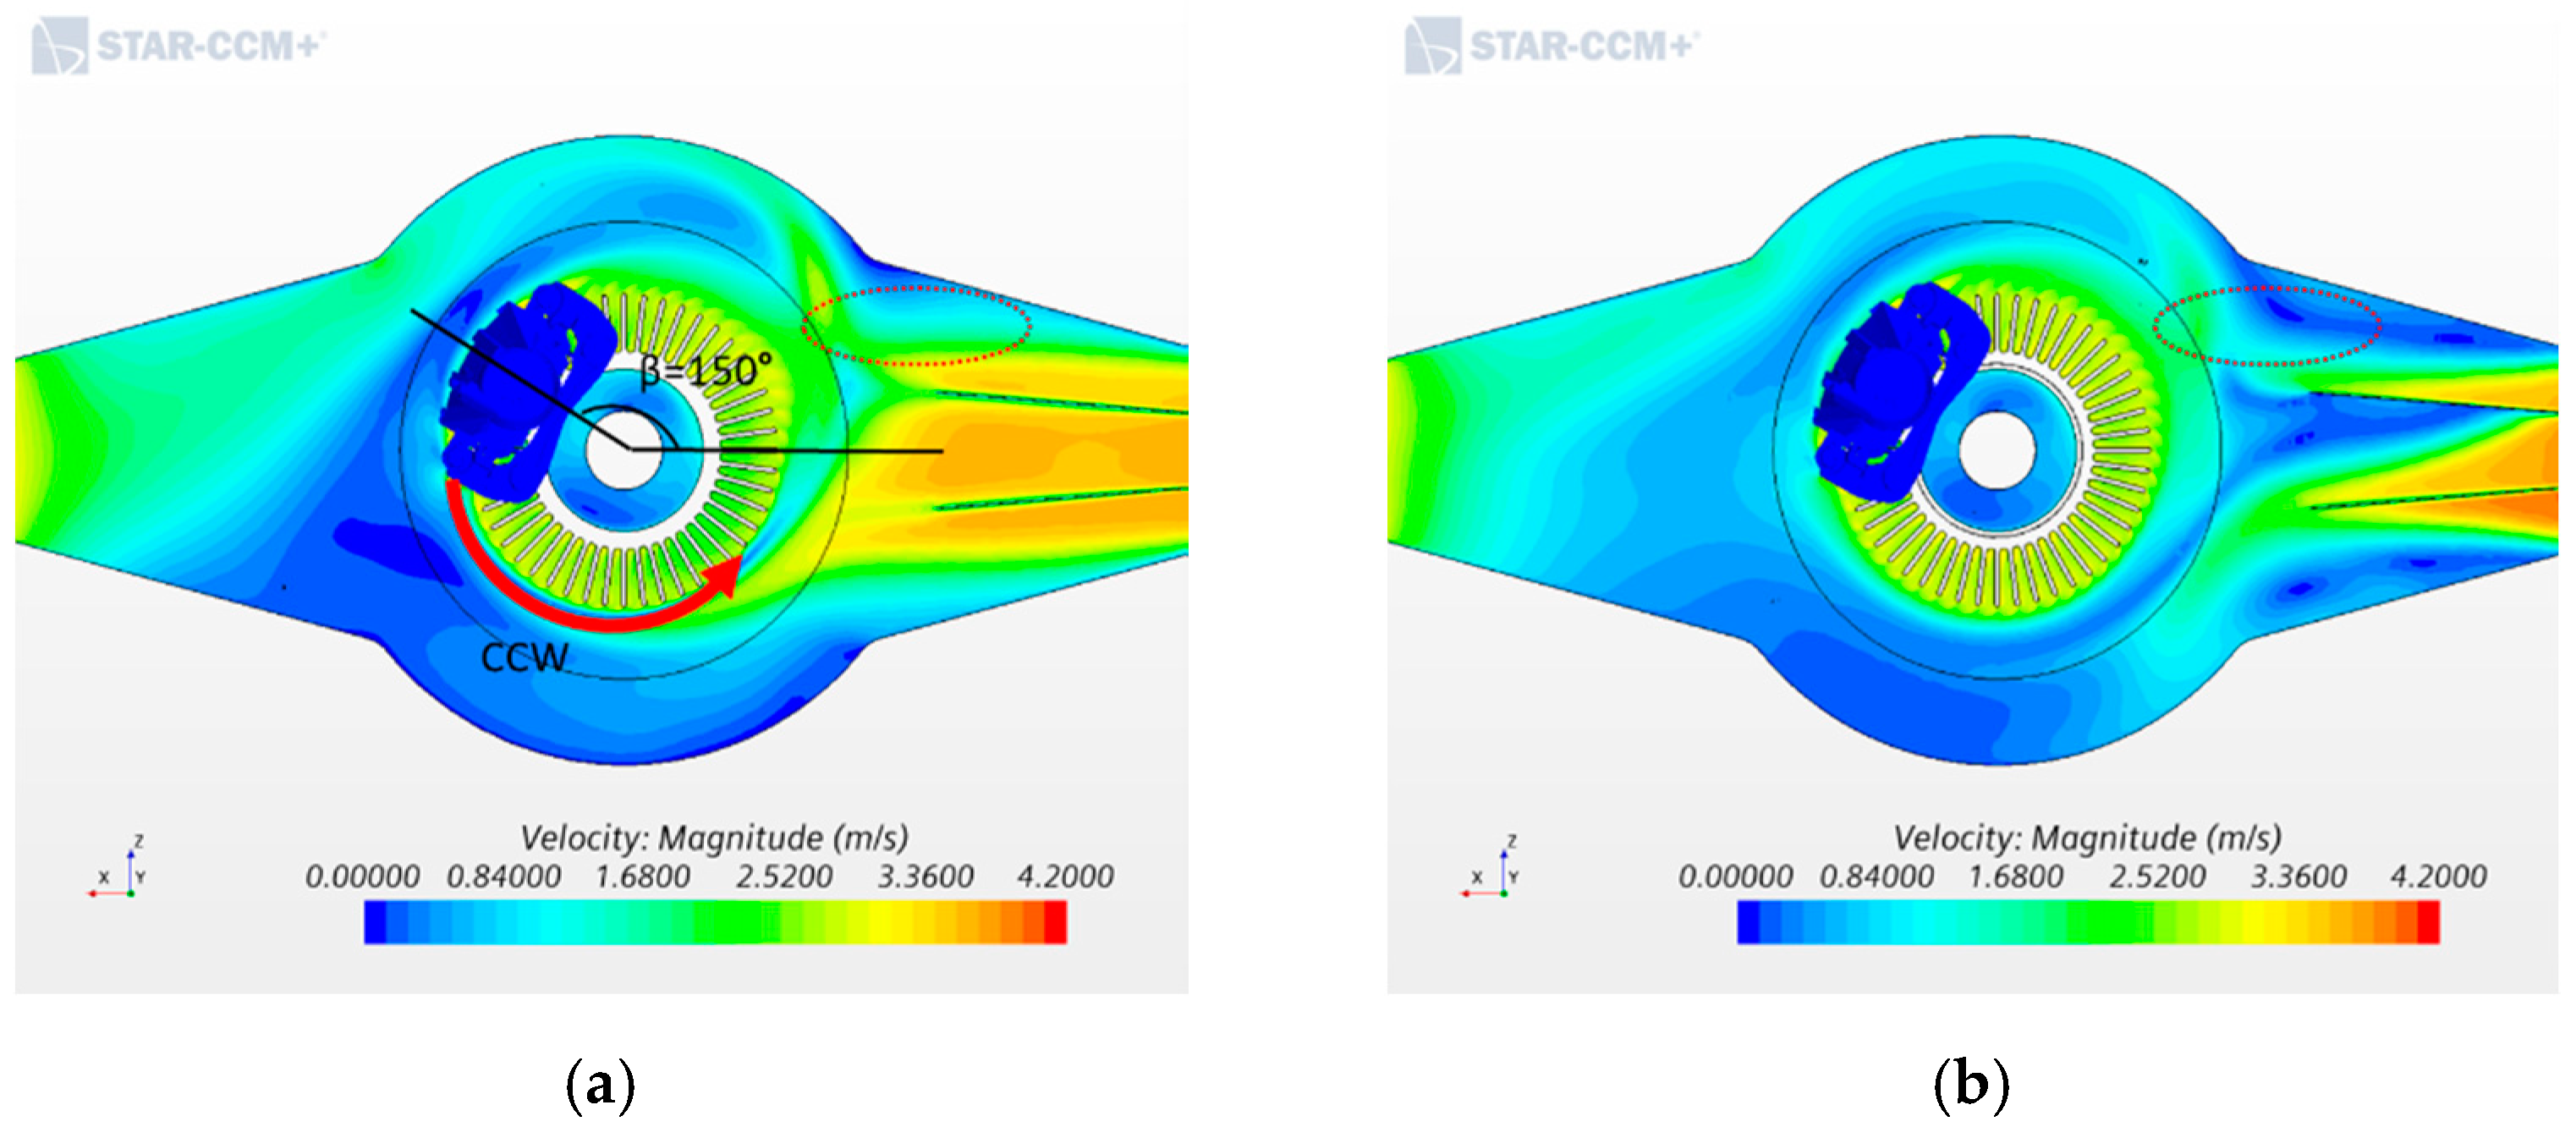
To study the effect of the angle of the caliper, we tested five installation designs with caliper installation angles of β = 0°, 30°, 60°, 150°, and 180°. For the five design cases, there was no obvious difference in the distribution of velocity magnitude in the enclosure of the brake dynamometer. The velocity distribution of the brake dynamometer enclosure was mainly concentrated in the lower half, and the velocity distribution was concentrated at the entrance to the brake dynamometer, close to the brake disc. At larger caliper installation angles, the speed concentration area was smaller. In the installation design with a caliper installation angle of 180°, there was almost no excessive speed concentration area. From the overall simulation results, the installation design plan with a caliper installation angle of 150° had an even distribution of flow velocity. Figure 10 shows the distribution of flow and velocity in the enclosure of the brake dynamometer for two designs with fixed brake caliber angles of β = 30° and β = 150°.
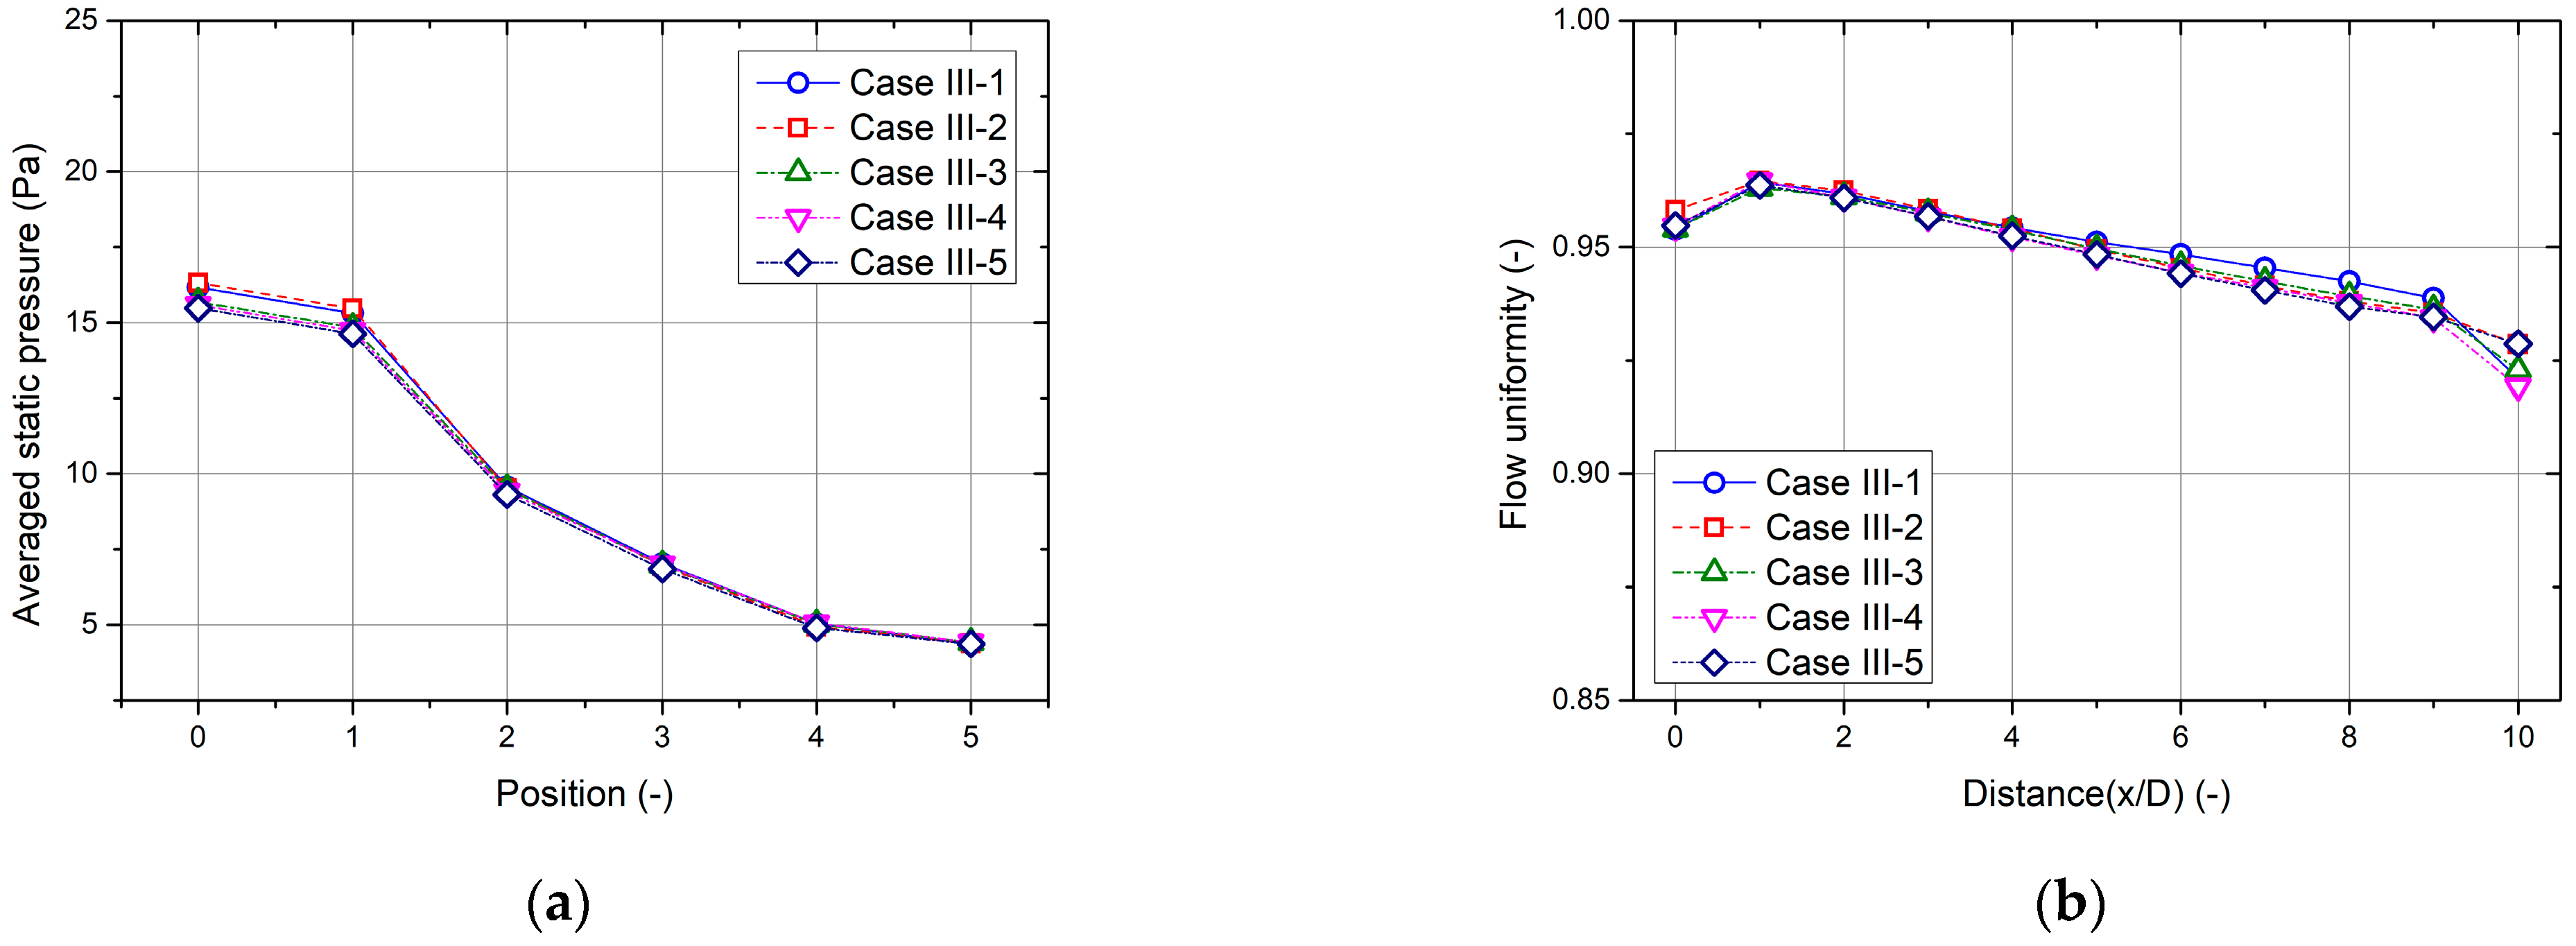
As shown in Figure 11, for the design of the angle of the caliper of the brake system, the sampling section of the static pressure distribution included the inlet section of the air duct, the inlet and outlet sections of the brake dynamometer enclosure, the 8D section, and outlet section of the air duct. Among the five design cases, the static pressure distribution of the system is shown in Figure 11a, and the designs with caliper installation angles of β = 0° and β = 30° had larger static pressure distributions of 16.17 and 16.32 Pa, respectively. The static pressures of the other three designs were almost the same (CaseIII-3 is 15.69 Pa, CaseIII-4 is 15.59 Pa, and CaseIII-5 is 15.48 Pa). As the brake dynamometers enclosure volume of the five designs was the same, the total static pressure of the system was only affected by the turbulence inside the enclosure. When the angle of the caliper was 0° or 30°, the direction of the intake air velocity was in contact with the caliper. The turbulence was generated by the rotation of the brake disc. Therefore, when the angle of the caliper was 0° or 30°, the total static pressure of the system was relatively high. As shown in Figure 11b, the flow uniformity distribution was similar for all five designs. From 5 D to 9 D, the flow uniformity of the design scheme with the caliper installation angle β = 0° was slightly higher than other schemes. This is because when the caliper is at 0°, the speed of the intake air will decrease. Therefore, the airflow in the outlet duct is the smoothest, and uniformity will be improved as a result. Overall, the change in the installation angle of the caliper has little effect on the uniformity distribution of flow in the air duct of the brake dynamometer.
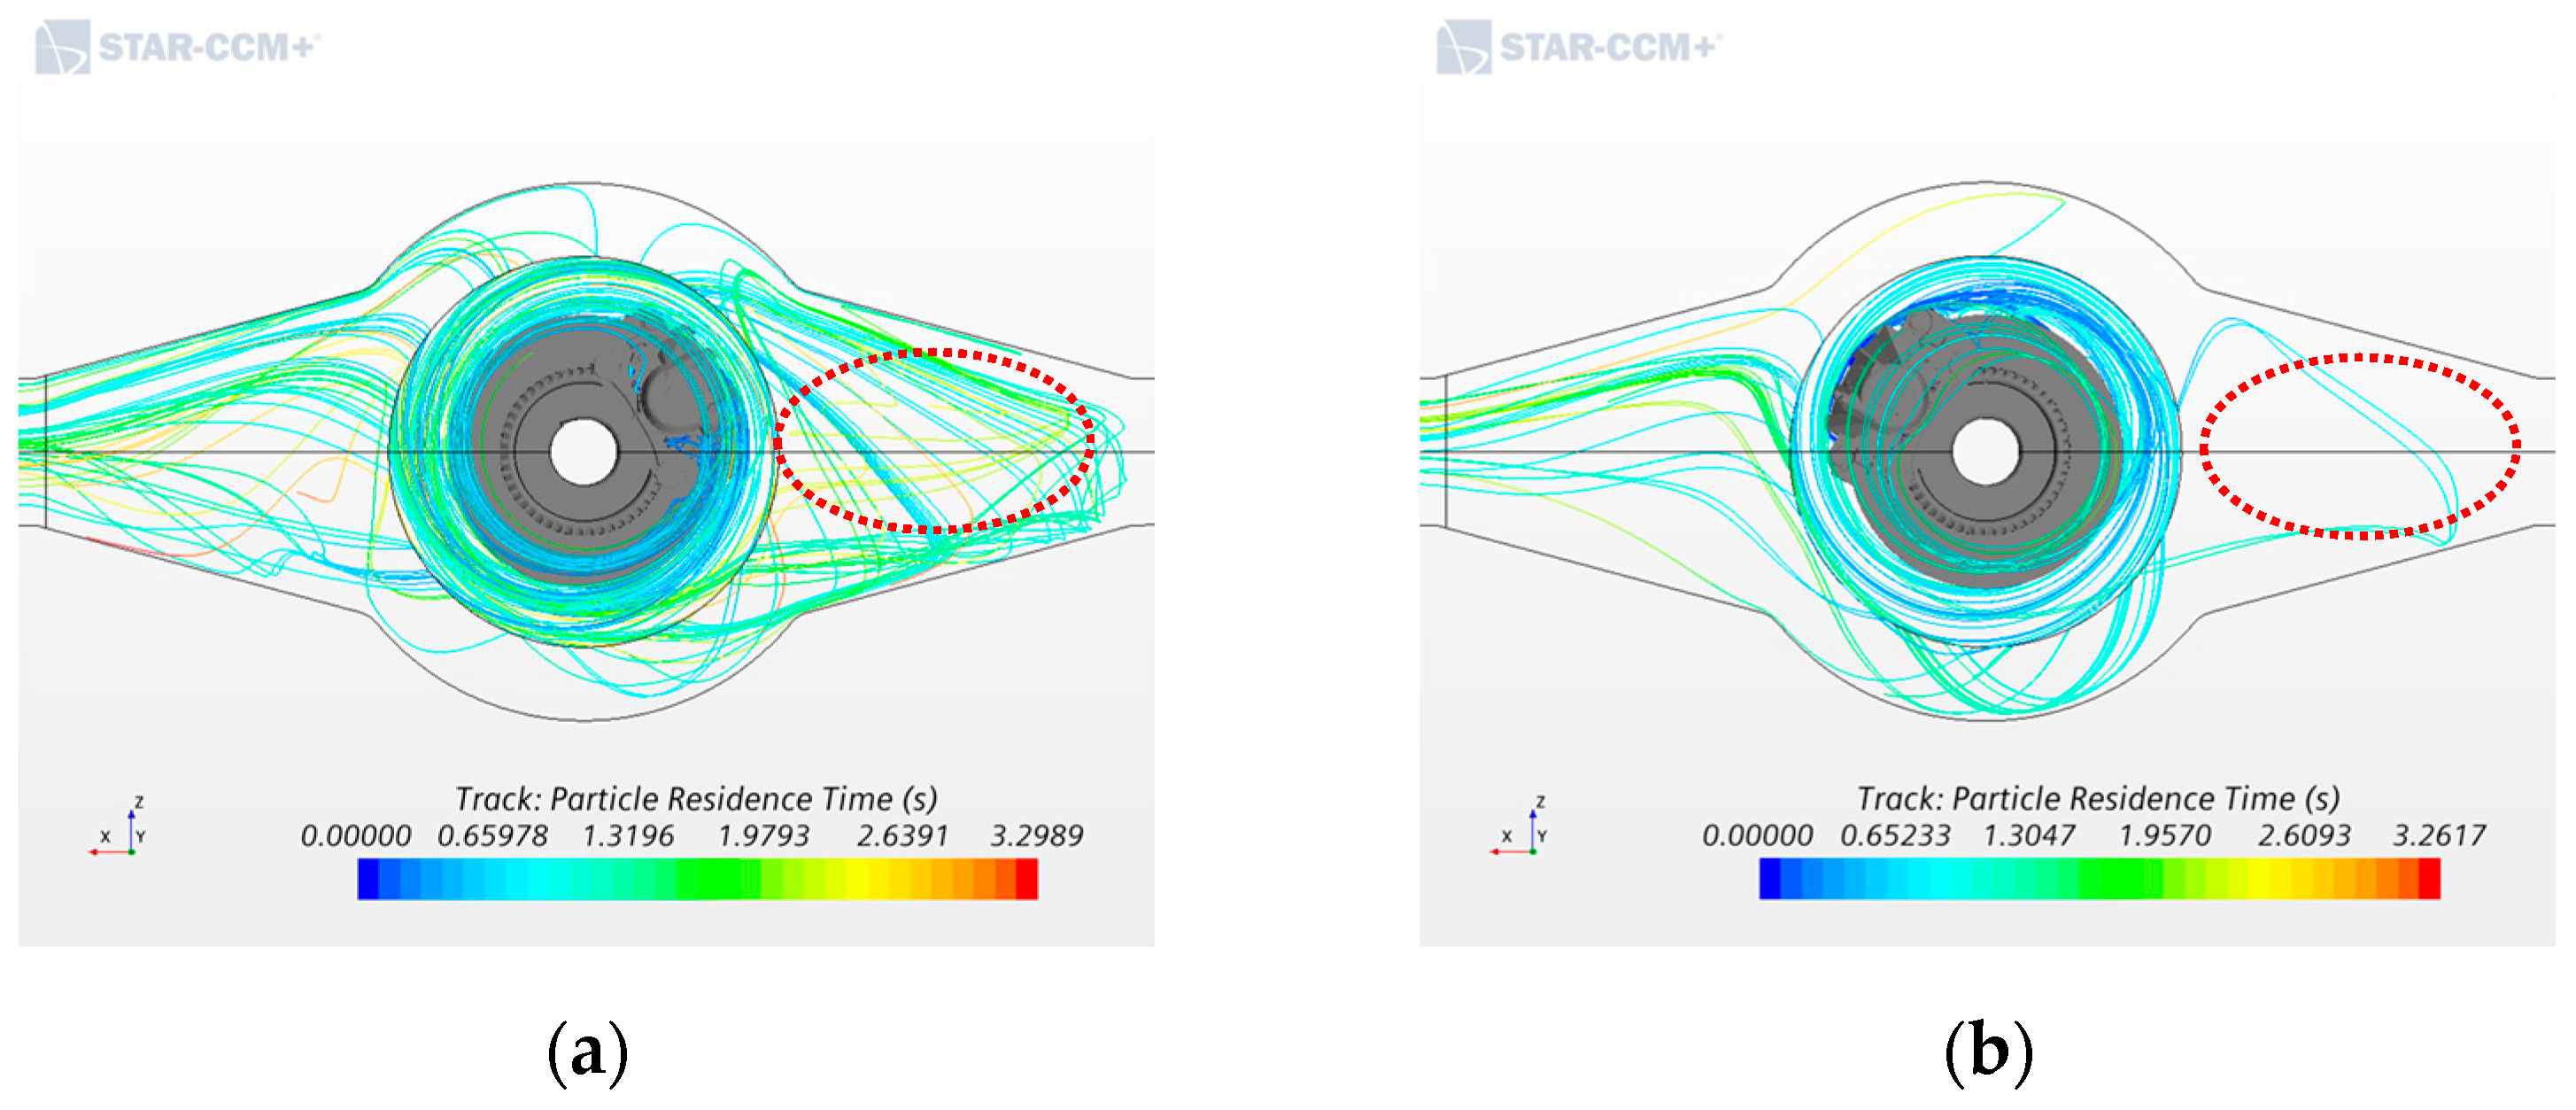
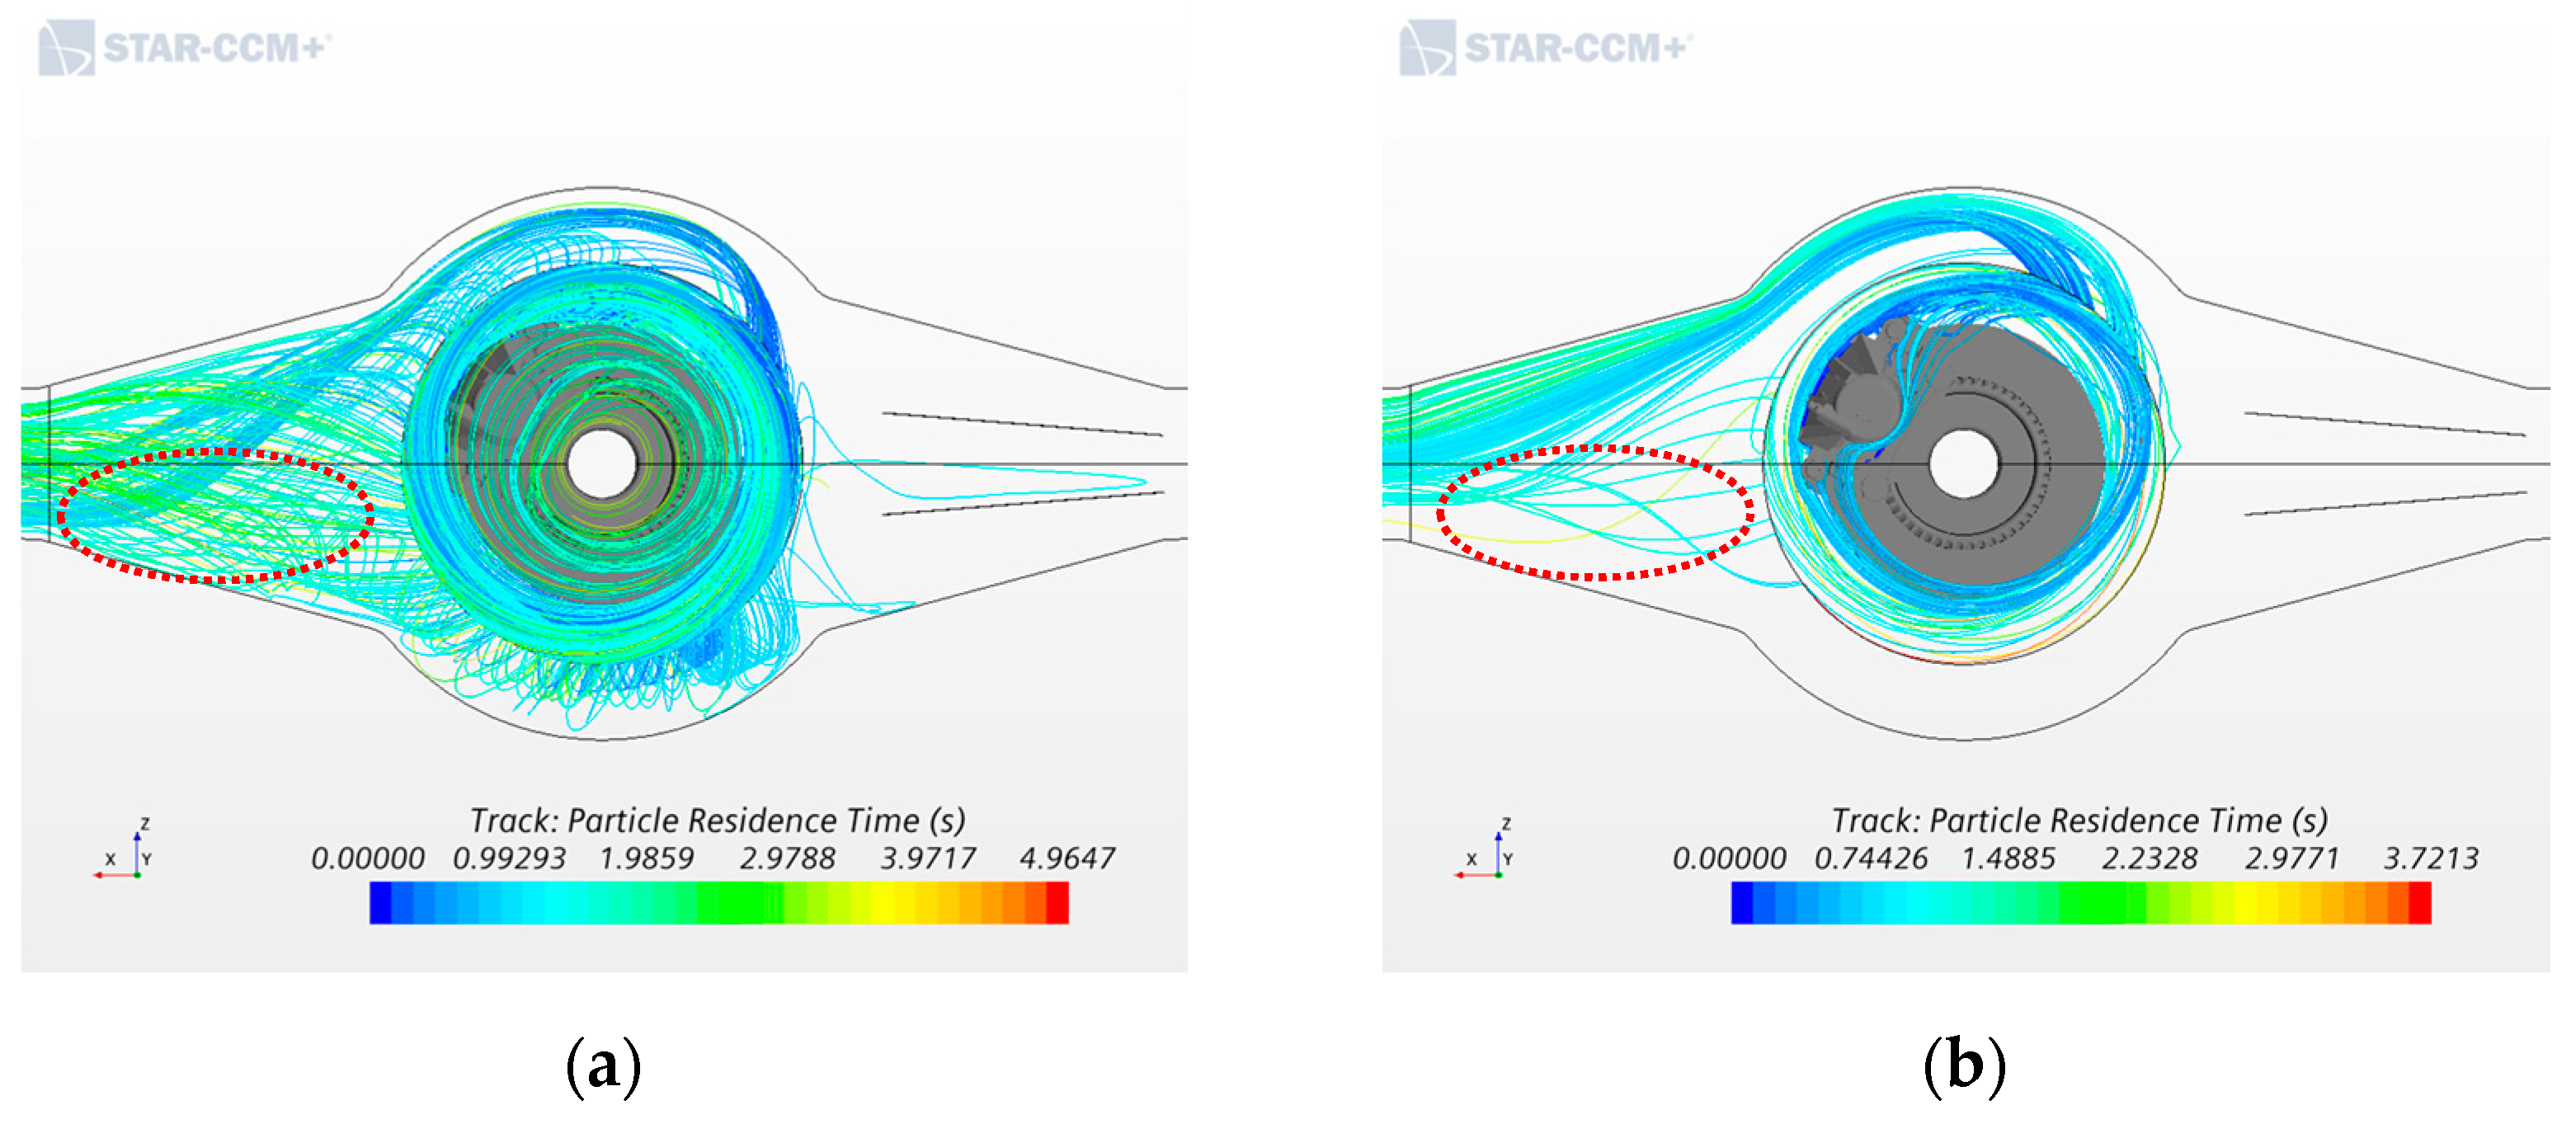
In the design of the fixed angle of the caliper of the brake system, Case III-1~ 5 residence time of brake dust particles in the brake dynamometer was 3.75, 3.30, 5.04, 3.26, and 8.29 s. Among them, the design scheme of the caliper installation angle at β = 150° had the shortest brake dust particle retention time, and the calculation result for the caliper installation angle of β = 180° was abnormal. However, in the subsequent calculations, the residence time of the brake dust particles after the calculation reaches the steady state was stabilized at about 3.7 s. With regard to the actual measurement, the disorderly discrete movement of brake dust particles caused some dust particles to be deposited in the dynamometer enclosure. Of the five groups of control tests, the trajectories of brake dust particles produced varying degrees of turbulence at the entrance to the brake dynamometer enclosure. Figure 12 shows a design with the brake caliper installation angle set to β = 30° and the 150° design scheme is the trajectory of the brake dust particles. When the brake caliper installation angle was β = 30°, a large amount of dust particles moved at the entrance of the brake dynamometer enclosure track. Among the five control cases, the design scheme with the installation angle of the brake caliper set to β = 150° had the most orderly motion trajectory of brake dust particles, and the motion trajectory of dust particles was lowest at the entrance of the brake dynamometer enclosure. The reason for is that when the caliper angle is 0°, 30° or 60°, the injection position of the brake dust particles is on the right half of the enclosure, so the trajectory of the brake dust particles on the right part of the enclosure increased. Comparing the caliper angle when it is set to 150° and 180°, with the latter setting the injection direction of brake dust particles is vertically downward, so the brake dust particles cannot be discharged quickly from the brake dynamometer enclosure. Therefore, of the five designs, when the caliper angle is 150°, the trajectory of the brake dust particles is most orderly.
3.4. The Number of Splitters
Adding splitters helps to maintain uniform flow inside the brake dynamometer enclosure. To verify this in the design of adding splitters, one set (up and down) and two sets (up and down, left and right) of splitters were added at the entrance of the enclosure to form two sets of control experiments. Figure 13 shows the two designs with two and four splitters when the caliper angle was fixed at 150°, and the flow velocity distribution inside the brake dynamometer enclosure. Figure 13a shows the flow velocity magnitude with one set of splitters. The splitters eliminate the influence of pressure in the direction of airflow deflection. Under the influence of the structure of the brake disc (such as the design of the brake disc ventilation structure), the flow condition of the airflow was deflected in the rotation direction of the brake disc. Therefore, the upper part of the brake dynamometer had a concentration of the airflow. Figure 13b shows the flow velocity magnitude with two sets of splitters. This design minimized the influence of turbulence caused by the rotation of the brake disc, and the speed direction of the airflow was deflected clockwise and counterclockwise. The speed concentration on the outside of the separator was also improved. Therefore, adding two sets of splitters had a better effect of improving the steady state turbulence at the inlet of the enclosure.
As shown in Figure 14a, in the control experiment with one set of splitters and two sets of splitters, Case IV-1~ 4 static pressure of the system was 16.39, 14.76, 17, and 15.67 Pa. When the caliper angles were 150° and 180°, the design with two sets of splitters had lower static pressure than the design with one set of splitters. Therefore, one set of splitters increases the static pressure distribution of the system, and two sets of splitters can reduce the static pressure distribution. One set of splitters will reduce the horizontal static pressure but will increase the longitudinal static pressure. Therefore, when two sets of separators are added, the total static pressure will decrease. Figure 14b shows the flow uniformity distribution for the control experiment group with one set of splitters and two sets of splitters. Between 0 and 9 D, the flow uniformity for one set of splitters was slightly higher than that of two sets of splitters. Between 9 and 10 D the flow uniformity with one set of splitters was slightly lower than that of two sets of splitters. When two sets of splitters are added, the turbulent flow speed is more concentrated and the flow enters the outlet duct faster, leading to a reduced flow uniformity. However, at 9–10 D the flow rate is faster, and it is easier to reduce the influence of the bending of the outlet duct. Therefore, the flow uniformity is higher in this instance when two sets of splitters are added.
Figure 15 shows the particle residence time and trajectory of the particles with one set of splitters and two sets of splitters when the caliper angle was set to 150°. Figure 15a provides the simulation result when adding one set of splitters and the behavior of the brake dust particles in the brake dynamometer enclosure. The particle trajectories were evenly distributed in the upper and lower parts of the enclosure, and there were only a few particle trajectories in the right side of the enclosure. This shows that adding one set of splitters can balance the turbulence between the upper and lower parts of the brake dynamometer enclosure. It also eliminates the influence of turbulence caused by the rotation of the brake disc. Figure 15b shows the simulation result of the behavior of brake dust particles in the enclosure of the brake dynamometer when two sets of splitters were added. The particle trajectory was mainly concentrated in the upper part of the enclosure, and there was no particle trajectory on the right part of the enclosure. This shows that the turbulence of the intake air flow is much greater than the influence of the turbulence form caused by brake disc rotation. After most of the brake dust particles are generated, they were quickly discharged from the enclosure, and were not affected by the turbulence to make a centrifugal movement. The particle retention time of CaseIV-1 was 4.96 s, the particle retention time of the CaseIV-2 was 3.72 s. Therefore, adding two sets of splitters had a greater effect on improving the trajectory of brake dust particles and shortening the retention time of particles.
3.5. Comprehensive Analysis of Results
Table 2 summarizes the experimental results. Comparing the static pressure of all the designs, the static pressure of the first group of designs was higher compared with the other groups of designs. After increasing the axial size of the circular design enclosure in the first group of designs and adjusting the inlet and outlet angle of the enclosure below 23°, the static pressure of the new design was significantly reduced. In the other three groups of designs, the static pressure changed little. This shows that the static pressure was mainly affected by the size of the enclosure. Comparing the flow uniformity at 8 D of all designs, the maximum flow uniformity was 0.9451 and the minimum was 0.9343—there were no obvious differences. Therefore, the four factors proposed in this study have almost no effect on flow uniformity at 8 D. For the purpose of this study, the particle residence time is required to be short and the time result of the instantaneous calculation is required to stabilize in a numerical range. There were obvious differences among the four groups of designs with regard to particle residence time. The particle maximum velocity is affected by both the intake turbulence and the rotating turbulence of the brake disc; therefore, the particle max velocity only reflects the phenomenon of local velocity concentration in the trajectory of brake dust particles.
4. Conclusions
In this study we used CFD technology to optimize the design of the basic structure of the brake dynamometer. We established a model of brake dust generated by brake wear and conducted group simulations on the four main influencing factors of brake dynamometer design. Our conclusions are as follows:
- In terms of the shape of the design in the first group of brake dynamometers enclosure, when the cross section of the enclosure of the brake dynamometer was circular, the intake turbulence and the turbulence generated by the rotation of the brake disc were combined well, the turbulence in the enclosure of the brake dynamometer was more stable, and the particle residence time was shortened. Therefore, in this study, the optimum cross section design of the brake dynamometer was found to be circular.
- It is important that the inlet and outlet angle of the enclosure of the brake dynamometer are appropriately sized. If the inlet and outlet angles are too small, the brake dust particles will continue to move in a circular motion under the action of centripetal force and the dust particle residence time will increase. If the inlet and outlet angles are too large, the internal flow will be more turbulent. If the trajectory of the brake dust is disordered, the irregular movement of the brake dust particles will cause it to be deposited in the dynamometer enclosure. In the comparison of the simulation results of the second set of designs, the optimal angle for the inlet and outlet of the brake dynamometer enclosure was 15°.
- The position of the caliper affects the combination of intake turbulence and the turbulence formed by the rotation of the brake disc. The injection position of the discharge of brake dust particles is different, which also has a great impact on the retention time of the particles. After comparing five different caliper fixed angle designs, the design with a caliper fixed angle of 150° had the most regular particle trajectory and the shortest particle residence time. Therefore, when the caliper angle was fixed at 150°, the measurement accuracy was highest.
- Adding splitters at the air inlet end of the brake dynamometer enclosure is beneficial to the stability of the turbulence inside the enclosure. We found that adding two sets of splitters is better than adding one set of splitters. The effect of turbulence stability on the brake dynamometer enclosure was better with two splitters and the residence time of particles was shorter. Therefore, the design of adding two sets of splitters was considered optimal.
In this paper, we analyzed the complex fluid dynamics of a traditional brake dynamometer enclosure through high-definition CFD technology, and the four factors that affect the design of the brake dynamometer were considered. The best design scheme for the brake dynamometer was determined to be CaseIV-2. In the additional experiment, the trajectory of the brake dust in the enclosure was shown to be stable, and the particle residence time of the brake dust of 10 μm was maintained at about 3.72 s, while the particle residence time of the brake dust of 5 μm was maintained at about 2.43 s. The residence time of brake dust particles in the brake dynamometer was reduced with the optimal design, and the gap in the research of the brake dynamometer enclosure using CFD technology was addressed.
Author Contributions
T.Z. played a leading role in writing the paper as a first author. C.N. and S.C. are coauthors and helped to build design parameters of brake enclosure system in the article. S.A. designed a 3D model of the brake enclosure system with brake system. G.L. is the corresponding author and designed paper. All authors have read and agreed to the published version of the manuscript.
Funding
This research received no external funding.
Institutional Review Board Statement
Not applicable.
Informed Consent Statement
Not applicable.
Data Availability Statement
Not applicable.
Acknowledgments
This research was supported by the BB21+ Project in 2020, and the Non-exhaust fine dust reduction project in the transportation sector research program (20003587) under the Ministry of Trade Industry and Energy, Republic of Korea.
Conflicts of Interest
The authors declare no conflict of interest.
References
- PMP-Group Particle Measurement Program (PMP) of the United Nations Working Party on Pollution and Energy (UNECE−GRPE). Available online: https://wiki.unece.org/pages/viewpage.action?pageId=2523173 (accessed on 20 April 2021).
- Lee, S.H. Characterization of Non-exhaust Particulate Matters(PM) Generated from Tire and Brake. J. Korean Soc. Automot. Eng. 2017, 39, 34–38. [Google Scholar]
- Timmers, V.R.J.H.; Achten, P.A.J. Non-exhaust PM Emissions from Electric Vehicles. Atmos. Environ. 2016, 147, 10–17. [Google Scholar] [CrossRef]
- Lee, P.G.; Jung, S.P.; Park, M.K.; Sim, S.K. Study on Dust Characteristics of Brake Pads Using Brake Dynamometer. Korean Soc. Automot. Eng. Spring Conf. 2018, 6, 401–403. [Google Scholar]
- Öberdörster, G. Pulmonary Effects of Inhaled Ultrafine Particles. Int. Arch. Occup. Environ. Health 2001, 74, 1–8. [Google Scholar] [CrossRef] [PubMed]
- Verma, C.P. Automotive Brake Materials: Characterization of Wear Products and Relevant Mechanisms at High Temperature. Ph.D. Thesis, University of Trento, Trento, Italy, 2016. [Google Scholar]
- Woo, S.H.; Kim, Y.; Lee, S.; Choi, Y.; Lee, S. Characteristic of Brake Wear Particles under Various Test Driving Cycles. J. Korean Soc. Atmos. Environ. 2020, 36, 346–359. [Google Scholar] [CrossRef]
- Hagino, H.; Oyama, M.; Sasaki, S. Laboratory Testing of Airborne Brake Wear Particle Emissions using a dynamometer system under urban city driving cycles. Atmos. Environ. 2016, 131, 269–278. [Google Scholar] [CrossRef] [Green Version]
- Mathissen, M.; Grochowicz, J.; Schmidt, C.; Vogt, R.; Hagen, F.H.F.Z.; Grabiec, T.; Steven, H.; Grigoratos, T. A Novel Real-World Braking Cycle for Studying Brake Wear Particle Emissions. Wear 2018, 414–415, 219–226. [Google Scholar] [CrossRef]
- Klaus, A.; David, H.; Toni, F.; Felix, W. CFD based Analysis of Particle-Air Interaction within a Sampling Device for Brake Dust Emissions; EuroBrake: The Hague, The Netherlands, 2018. [Google Scholar]
- Simcenter STAR-CCM+. Siemens PLM Software Manual, 2019.3. Available online: https://www.plm.automation.siemens.com/global/en/products/simcenter/STAR-CCM.html (accessed on 21 April 2021).
- Kapas, N.; Jayasundera, A. High-Fidelity Transient Thermal Modeling of a Brake Corner. SAE 2016 Brake Colloq. 2016, 9, 1184–1198. [Google Scholar] [CrossRef]
- Li, A.; Ahmadi, G. Dispersion and Deposition of Spherical Particles from Point Sources in a Turbulent Channel Flow. Aerosol Sci. Technol. 1992, 16, 209–226. [Google Scholar] [CrossRef]
- Wang, Q.; Squires, K.D.; Chen, M.; McLaughlin, J.B. On the role of the lift force in turbulence simulations of particle deposition. Int. J. Multiph. Flow 1997, 23, 749–763. [Google Scholar] [CrossRef]
- Ounis, H.; Ahmadi, G. Analysis of Dispersion of Small Spherical Particles in a Random Velocity Field. J. Fluids Eng. 1990, 112, 114–120. [Google Scholar] [CrossRef]
- Durand, A.; Mehel, A.; Murzyn, F.; Puech, S.; Larrarte, F. CFD Study of Dispersion of Particles Generated by Mechanical Braking: Application to Trains in Underground Stations. In Proceedings of the WCRR 12th World Congress Conference Paper, Tokyo, Japan, 28 October–1 November 2019. [Google Scholar]
- Agudelo, C.; Vedula, R.T.; Capecelatro, J.; Wang, Q. Design of Experiments for Effects and Interactions During Brake Emissions Testing Using High-Fidelity Computational Fluid Dynamics; SAE Technical Paper 2019–01–2139; SAE International: Warrendale, PA, USA, 2019. [Google Scholar]
- International Organization for Standardization. Road Vehicles-Test Contaminants for Filter Evaluation-Part 1: Arizona Test Dust; ISO 12103-1:2016. Available online: https://www.iso.org/standard/63386.html (accessed on 15 April 2021).
Figure 1.
A 3D model of the brake dust dynamometer with an enclosure system.

Figure 2.
Schematic diagram of brake dust dynamometer.

Figure 3.
Computation grid system: (a) brake system volume meshes; (b) brake dust injection position.
Figure 3.
Computation grid system: (a) brake system volume meshes; (b) brake dust injection position.

Figure 4.
Flow velocity magnitude: (a) circular design; (b) hexagonal design; (c) rectangular design.
Figure 4.
Flow velocity magnitude: (a) circular design; (b) hexagonal design; (c) rectangular design.

Figure 5.
Simulation results: (a) Static pressure distribution; (b) flow uniformity distribution.

Figure 6.
Particle residence time: (a) circular design; (b) hexagonal design; (c) rectangular design.
Figure 6.
Particle residence time: (a) circular design; (b) hexagonal design; (c) rectangular design.

Figure 7.
Flow velocity magnitude for the inlet and outlet angles of the enclosure: (a) α = 15°; (b) α = 23°.
Figure 7.
Flow velocity magnitude for the inlet and outlet angles of the enclosure: (a) α = 15°; (b) α = 23°.

Figure 8.
Simulation results: (a) the static pressure distribution; (b) flow uniformity distribution.
Figure 8.
Simulation results: (a) the static pressure distribution; (b) flow uniformity distribution.

Figure 9.
Particle residence time for the inlet and outlet angles of the enclosure: (a) α = 15°; (b) α = 23°.
Figure 9.
Particle residence time for the inlet and outlet angles of the enclosure: (a) α = 15°; (b) α = 23°.

Figure 10.
Flow velocity magnitude for caliper angles: (a) β = 30°; (b) β = 150°.

Figure 11.
Simulation results: (a) the static pressure distribution; (b) flow uniformity distribution.
Figure 11.
Simulation results: (a) the static pressure distribution; (b) flow uniformity distribution.

Figure 12.
Particle residence time for the caliper angles: (a) α = 15°; (b) α = 23°.

Figure 13.
Flow velocity magnitude for the inlet duct: (a) two splitters; (b) four splitters.

Figure 14.
Simulation results: (a) static pressure distribution; (b) flow uniformity distribution.

Figure 15.
Particle residence time and trajectory of the particles for the inlet duct: (a) two splitters; (b) four splitters.
Figure 15.
Particle residence time and trajectory of the particles for the inlet duct: (a) two splitters; (b) four splitters.


Table 1.
Simulation design parameters.
| Group Number | Case Number | Enclosure Section | Caliper Angle | Rotating Direction | Particle Diameter | Splitter Number |
|---|---|---|---|---|---|---|
| Group I | Case I-1 | Circle | β = 0° | CCW | 5 μm | - |
| Case I-2 | Hexagon | β = 0° | CCW | 5 μm | - | |
| Case I-3 | Rectangular | β = 0° | CCW | 5 μm | - | |
| Group II | Case II-1 | Circle (α = 5°) | β = 0° | CCW | 5 μm | - |
| Case II-2 | Circle (α = 10°) | β = 0° | CCW | 5 μm | - | |
| Case II-3 | Circle (α = 15°) | β = 0° | CCW | 5 μm | - | |
| Case II-4 | Circle (α = 23°) | β = 0° | CCW | 5 μm | - | |
| Group III | Case III-1 | New circle | β = 0° | CCW | 5 μm | - |
| Case III-2 | New circle | β = 30° | CCW | 5 μm | - | |
| Case III-3 | New circle | β = 60° | CCW | 5 μm | - | |
| Case III-4 | New circle | β = 150° | CCW | 5 μm | - | |
| Case III-5 | New circle | β = 180° | CCW | 5 μm | - | |
| Group IV | Case IV-1 | New circle | β = 150° | CCW | 10 μm | 2 |
| Case IV-2 | New circle | β = 150° | CCW | 10 μm | 4 | |
| Case IV-3 | New circle | β = 180° | CCW | 10 μm | 2 | |
| Case IV-4 | New circle | β = 180° | CCW | 10 μm | 4 |
Table 2.
Summary results of the enclosure design for brake wear particles measurement.
| Group Number | Case Number | Enclosure Section | DP (Pa) | Flow Uniformity at 8 D (-) | Particle Residence Time(s) | Particle Maximum Velocity (m/s) |
|---|---|---|---|---|---|---|
| Group I | Case I-1 | Circle | 18.2943 | 0.9451 | 3.6889 | 4.3406 |
| Case I-2 | Hexagon | 19.8382 | 0.9432 | 8.7594 | 5.3377 | |
| Case I-3 | Rectangular | 19.3985 | 0.9406 | 4.8906 | 4.5329 | |
| Group II | Case II-1 | Circle (α = 5°) | 14.2367 | 0.9377 | 3.9255 | 4.4984 |
| Case II-2 | Circle (α = 10°) | 14.6528 | 0.9384 | 1.9863 | 4.6897 | |
| Case II-3 | Circle (α = 15°) | 15.2470 | 0.9377 | 3.2675 | 4.7157 | |
| Case II-4 | Circle (α = 23°) | 15.9196 | 0.9382 | 2.6035 | 4.4754 | |
| Group III | Case III-1 | New circle | 16.1690 | 0.9425 | 3.7515 | 4.5504 |
| Case III-2 | New circle | 16.3225 | 0.9381 | 3.2989 | 4.3178 | |
| Case III-3 | New circle | 15.6877 | 0.9392 | 5.0407 | 4.3883 | |
| Case III-4 | New circle | 15.5918 | 0.9377 | 3.2617 | 4.5007 | |
| Case III-5 | New circle | 15.4829 | 0.9369 | 8.2856 | 5.0105 | |
| Group IV | Case IV-1 | New circle | 16.3897 | 0.9360 | 4.9647 | 4.7620 |
| Case IV-2 | New circle | 14.7576 | 0.9343 | 3.7213 | 4.6439 | |
| Case IV-3 | New circle | 17.0055 | 0.9407 | 6.7930 | 4.7755 | |
| Case IV-4 | New circle | 15.6629 | 0.9381 | 3.7214 | 4.5702 |
Publisher’s Note: MDPI stays neutral with regard to jurisdictional claims in published maps and institutional affiliations. |
© 2021 by the authors. Licensee MDPI, Basel, Switzerland. This article is an open access article distributed under the terms and conditions of the Creative Commons Attribution (CC BY) license (https://creativecommons.org/licenses/by/4.0/).
Share and Cite
MDPI and ACS Style
Zhang, T.; Choi, S.; Ahn, S.; Nam, C.; Lee, G. Enclosure Design for Brake Wear Particle Measurement Using Computational Fluid Dynamics. Energies 2021, 14, 2356. https://0-doi-org.brum.beds.ac.uk/10.3390/en14092356
AMA Style
Zhang T, Choi S, Ahn S, Nam C, Lee G. Enclosure Design for Brake Wear Particle Measurement Using Computational Fluid Dynamics. Energies. 2021; 14(9):2356. https://0-doi-org.brum.beds.ac.uk/10.3390/en14092356
Chicago/Turabian StyleZhang, Tuo, Sungjin Choi, Seoyeon Ahn, Chanhyuk Nam, and Geesoo Lee. 2021. "Enclosure Design for Brake Wear Particle Measurement Using Computational Fluid Dynamics" Energies 14, no. 9: 2356. https://0-doi-org.brum.beds.ac.uk/10.3390/en14092356
Note that from the first issue of 2016, this journal uses article numbers instead of page numbers. See further details here.