
Cooling Design for PEM Fuel-Cell Stacks Employing Air and Metal Foam: Simulation and Experiment


Department of Mechanical Engineering, University of Detroit Mercy, 4001 W. McNichols Rd., Detroit, MI 48221, USA
*
Author to whom correspondence should be addressed.
Energies 2021, 14(9), 2687; https://0-doi-org.brum.beds.ac.uk/10.3390/en14092687
Submission received: 17 March 2021
/
Revised: 2 May 2021
/
Accepted: 3 May 2021
/
Published: 7 May 2021
(This article belongs to the Special Issue Design, Modeling, and Optimization of Novel Fuel Cell Systems)
Abstract
:A new study investigating the cooling efficacy of air flow inside open-cell metal foam embedded in aluminum models of fuel-cell stacks is described. A model based on a commercial stack was simulated and tested experimentally. This stack has three proton exchange membrane (PEM) fuel cells, each having an active area of 100 cm2, with a total output power of 500 W. The state-of-the-art cooling of this stack employs water in serpentine flow channels. The new design of the current investigation replaces these channels with metal foam and replaces the actual fuel cells with aluminum plates. The constant heat flux on these plates is equivalent to the maximum heat dissipation of the stack. Forced air is employed as the coolant. The aluminum foam used had an open-pore size of 0.65 mm and an after-compression porosity of 60%. Local temperatures in the stack and pumping power were calculated for various air-flow velocities in the range of 0.2–1.5 m/s by numerical simulation and were determined by experiments. This range of air speed corresponds to the Reynolds number based on the hydraulic diameter in the range of 87.6–700.4. Internal and external cells of the stack were investigated. In the simulations, and the thermal energy equations were solved invoking the local thermal non-equilibrium model—a more realistic treatment for airflow in a metal foam. Good agreement between the simulation and experiment was obtained for the local temperatures. As for the pumping power predicted by simulation and obtained experimentally, there was an average difference of about 18.3%. This difference has been attributed to the poor correlation used by the CFD package (ANSYS) for pressure drop in a metal foam. This study points to the viability of employing metal foam for cooling of fuel-cell systems.
1. Introduction
A fuel cell is a direct-energy-conversion system: It transforms the chemical energy of hydrogen to electricity. Theoretically, the thermodynamic efficiency of a fuel cell can be 80% or greater. There are no harmful emissions of fuel cells [1]. Hence, fuel cells are seriously investigated as a clean power source for automobiles [2]. Fuel cells are also being considered as a replacement for various kinds of power plants [3]. A good example of the use of fuel cells in buses is given in [4], where it is indicated that these buses had a 62% lower harmful emission compared to buses with diesel engines. Small-size fuel cells may be applied to power portable devices [5].
Proton exchange membrane fuel cells (PEMs) are most popular. PEMs operate at low temperatures, typically 60 to 80 °C, while solid-oxide fuel cells usually operate at about 700 °C [6]. PEMs have a quick startup, and they are less likely to suffer from corrosion [7]. Compared to other types of fuel cells, PEMs seem to be more robust with little or no sealing issues [8]. Not only do PEMs possess high power density, but they also have higher power output compared to direct-methanol fuel cells. The light weight and tininess of PEMs make them the prime contender for replacing the internal combustion engine [8].
The voltage of one PEM is only 0.7 V, approximately. To meet more power requirements, many PEMs are usually grouped and connected in series, which is called stacking. The stacking is commonly done through bipolar plates. In this case, single cells with alternating polarity are pressed next to each other with a bipolar plate between each two adjacent PEMs. This arrangement reduces the internal resistance of the stack and works very well for power requirements greater than 100 W.
The chemical reaction within PEMs produces heat. If this heat is not dissipated, the operating temperature of the cells will keep increasing. This would result in lower efficiency [9]. The higher temperature could also damage the membrane [10]—an expensive and delicate component. Different methods have been used in the thermal management of fuel cells. Cooling with cathode airflow is only used with small-size fuel cells. In this case, the outside area of the stack must be larger than the active area for the stack, and heat is dissipated from the outside area by convection. The disadvantage of this cooling method is that it requires larger cathode channels, which increases the stack’s size [11]. In fuel cells larger than 100 W, air needs to be forced through separate cooling channels [12]. In some cooling designs, heat is released from the stack to the surroundings by highly conductive heat spreaders placed adjacent to the air channels [13]. Cooling with liquids (e.g., antifreeze, water) is used because liquids have higher specific heats and thermal conductivities than air. This kind of cooling is used frequently in the automotive industry [14]. A cooling liquid has to be pumped through cooling channels in the bipolar plates of the stack. After absorbing the heat, the coolant is cooled in a separate heat exchanger, e.g., the radiator. The required additional liquid-cooling loop and its accessories are considered disadvantageous in terms of adding weight, volume, and cost.
Metal foam with open pores has a high porosity with cells formed by thin connected strands. Metal foam can be manufactured from various metals and their alloys, e.g., steel, copper, nickel, and aluminum. Several aspects of metal foam have been presented in [15]. The internal structure of the foam can be used to produce new properties. Because of their high porosity, metal foams are highly permeable, and due to their structure, metal foams are suitable for mixing and convection heat transfer.
Metal foams, especially those made from aluminum and nickel, have been investigated for use as flow fields for distributing reactants in fuel cells [16,17,18,19,20,21,22,23]. These metal-foam flow fields outperformed the common serpentine flow fields [20,23]. Awin and Dukhan [24] conducted multiple experiments on aluminum-foam flow fields; they have shown that these flow fields enhanced the performance of PEMs.
Various aspects of heat transfer in metal foam have been investigated widely. For example, Mancin et al. [25] experimentally obtained the heat-transfer coefficient for air flow in aluminum foam. A novel predictive model for the heat-transfer coefficient was proposed. In a more extensive experimental study, Mancin et al. [26] studied 21 highly porous aluminum- and copper-foam samples with pore densities between 2 and 40 pores per inch (ppi). The influence of the foam’s height measured from a heated base was investigated, as were the air flow rate and heat flux. Two correlations for the heat-transfer coefficient and pressure drop were constructed. A compact heat exchanger made by embedding circular pipes in metal foam was investigated by Girillo et al. [27]. For thermal development in metal foam, Iasiello et al. [28] should be consulted. Orihuela et al. [29] investigated heat transfer in an annulus packed with metal foam. Several studies [30,31,32,33,34] provided numerical simulations of heat transfer in a metal foam. Mahdi et al. [35] and Mashayekhi et al. [36] investigated battery thermal control using metal foam and PCM composites. Valizade et al. [37] and Peng et al. [38] studied the application of metal foam in solar receivers. Guarino et al. [39] looked at the practical aspect of thermal contact resistance and its effect on heat transfer in a metal foam. A good reference for natural convection in metal foam is the study of Barbieri et al. [40].
Indeed, very few studies investigated metal foam as a potential cooling medium for fuel cells. Boyd and Hooman published a purely numerical study on a small metal-foam cooling system for fuel cells [3]. Odabaee et al. [41] studied metal-foam air-cooling potential for fuel cells. This was intended as a replacement for water cooling. Their experiment examined the enhancement of heat transfer for a thin layer of aluminum foam positioned between adjacent bipolar plates. The study showed that to extract the same amount of heat, water-based systems required twice the power compared to air-cooled metal-foam systems. Afshari et al. [42] simulated a heat-transfer model in a 15 cm × 15 cm square area of cooling channels with different designs: straight flow; serpentine flow with multipasses; and metal foam. They proved that metal foam is the best cooling medium. Santamaria et al. [43] investigated a nickel-foam microchannel for coolingfuel cells. They determined the pressure drop experimentally at different Reynolds numbers for nickel foams having different porosities. They also analyzed heat transfer and fluid flow and used available data to validate their model. A study by Toghyani et al. [44] investigated PEMs’ performance using a distributor made from metal foam and compared it to three common flow fields. Current density, temperature, hydrogen mass fraction, and pressure drop were compared for the different models. 3D designs were modeled and analyzed numerically. Results showed that both pressure drop and stack performance are affected by metal-foam permeability. Vazifeshenas et al. [45] studied the effects of using metal foam in the cooling channel of a fuel cell. They designed a 3D model for three flow paths: parallel, serpentine, and serpentine with multichannels. The inclusion of metal foam enhanced heat transfer at the cost of increased pressure drop. They found that copper foam provided larger Nusselt numbers.
Some of the limitations of previous studies include the fact that some of these studies were purely numerical/simulation [3,42], while others were focused on liquid cooling [41,42,45]. Also, some of these studies were intended for a single fuel cell, and they employed a single metal foam with one porosity and one pore size [39]. For air cooling using metal foam, previous studies invoked the local thermal equilibrium assumption [3,43]. This assumption asserts that the temperatures of the air and the metal inside the foam are locally equal, and as such there is no convection heat transfer between them. It has been shown that his assumption is not valid for gas flow in metal foam [46,47]. None of the previous studies investigated an end cell in a stack. Such a cell is subjected to asymmetric heating since the heat comes from only one side of the cell. This study numerically and experimentally investigates an air-cooling system for a commercial PEMs stack employing aluminum foam. In the numerical part, the local thermal equilibrium assumption is relaxed and is replaced by the more physically meaningful assumption of local thermal nonequilibrium. Moreover, both internal and external cells of the stack are investigated.
2. Simulations and Numerical Investigations
2.1. Numerical Determination of Metal Foam Porosity and Pore Density
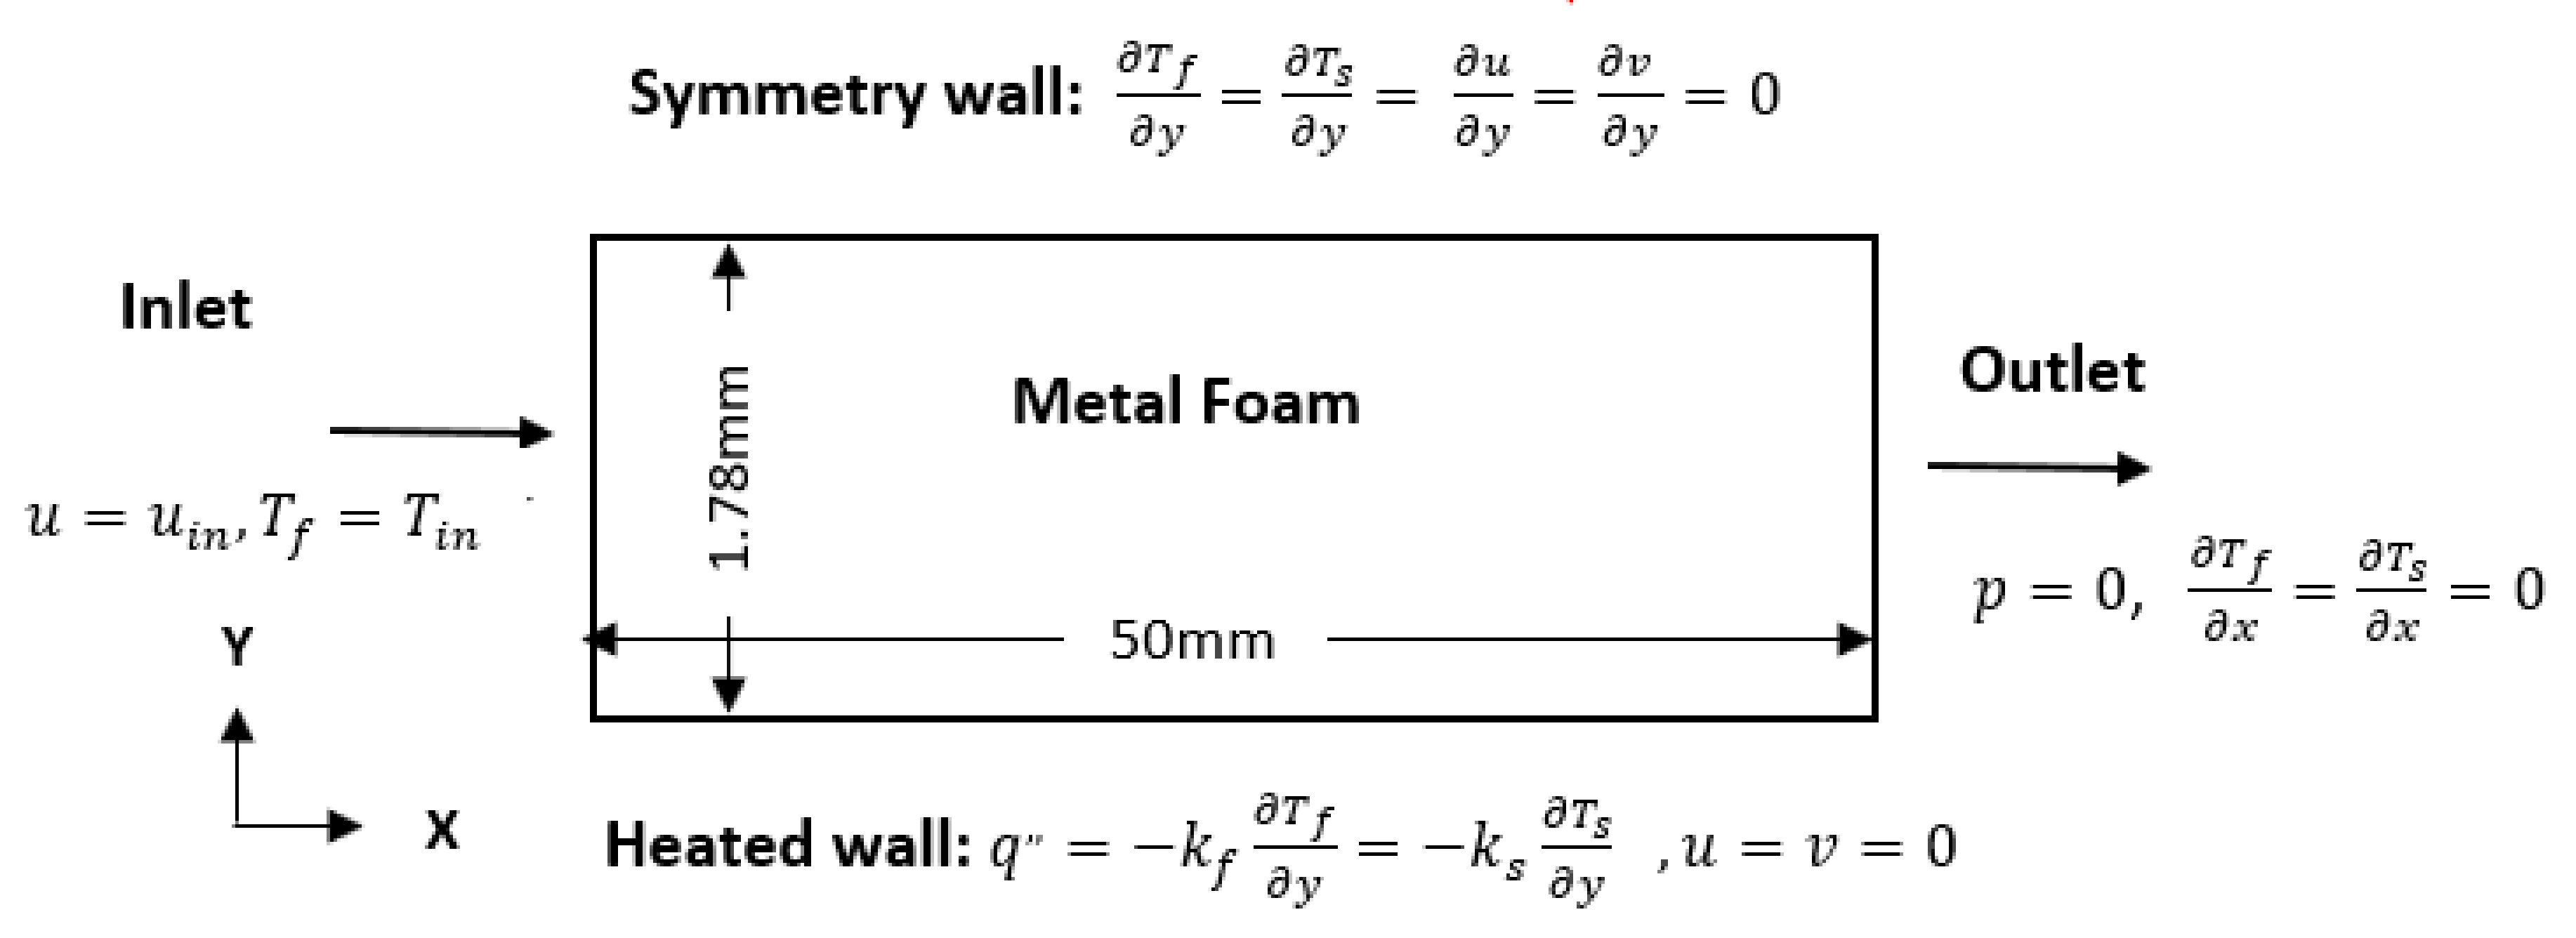
A preliminary numerical study was conducted in order to elucidate the effect of porosity and pore density of aluminum foam on its cooling capability. The study was also used to ascertain the effect of air velocity through the foam on heat dissipation. A summary of this study will be given here, however, more details relevant to this study will be elaborated on in Section 2.2 in conjunction with the simulation presented therein. The preliminary study was 2-dimensional (Figure 1). It simulated a channel between two parallel plates filled with aluminum foam and cooled by air. The two plates comprising the channel represented adjacent fuel cells in a stack. Each plate was subjected to a heat flux of 2.5 W/cm2. The dimensions of the metal foam sheet between them were 50 mm × 3.56 mm. Different pore densities of 20, 40, 80, and 100 pores per inch (ppi) with different porosities of 60, 70, 80, and 90% of the foam were investigated. Average inlet air speeds for each case ranged from 0.2 to 3 m/s. One-half of this channel was simulated taking advantage of the symmetry. The solution domain and boundary conditions are shown in Figure 1.
The following governing equations were solved using ANSYS- Fluent:
where ɛ and k are the porosity and permeability of the foam, respectively.
where and are the velocity components in the flow direction (x) and perpendicular to the flow direction (y), and is the pressure. and are the density and viscosity of the fluid, respectively. is the form drag coefficient for the foam. and are the effective thermal conductivities of the fluid and the solid, respectively. ɛ and are the porosity and permeability of the foam, respectively. is the interfacial heat transfer coefficient, and is the interfacial surface area density (m2/m3) inside the foam. and are the fluid and solid temperatures, respectively.
The following boundary conditions were imposed:
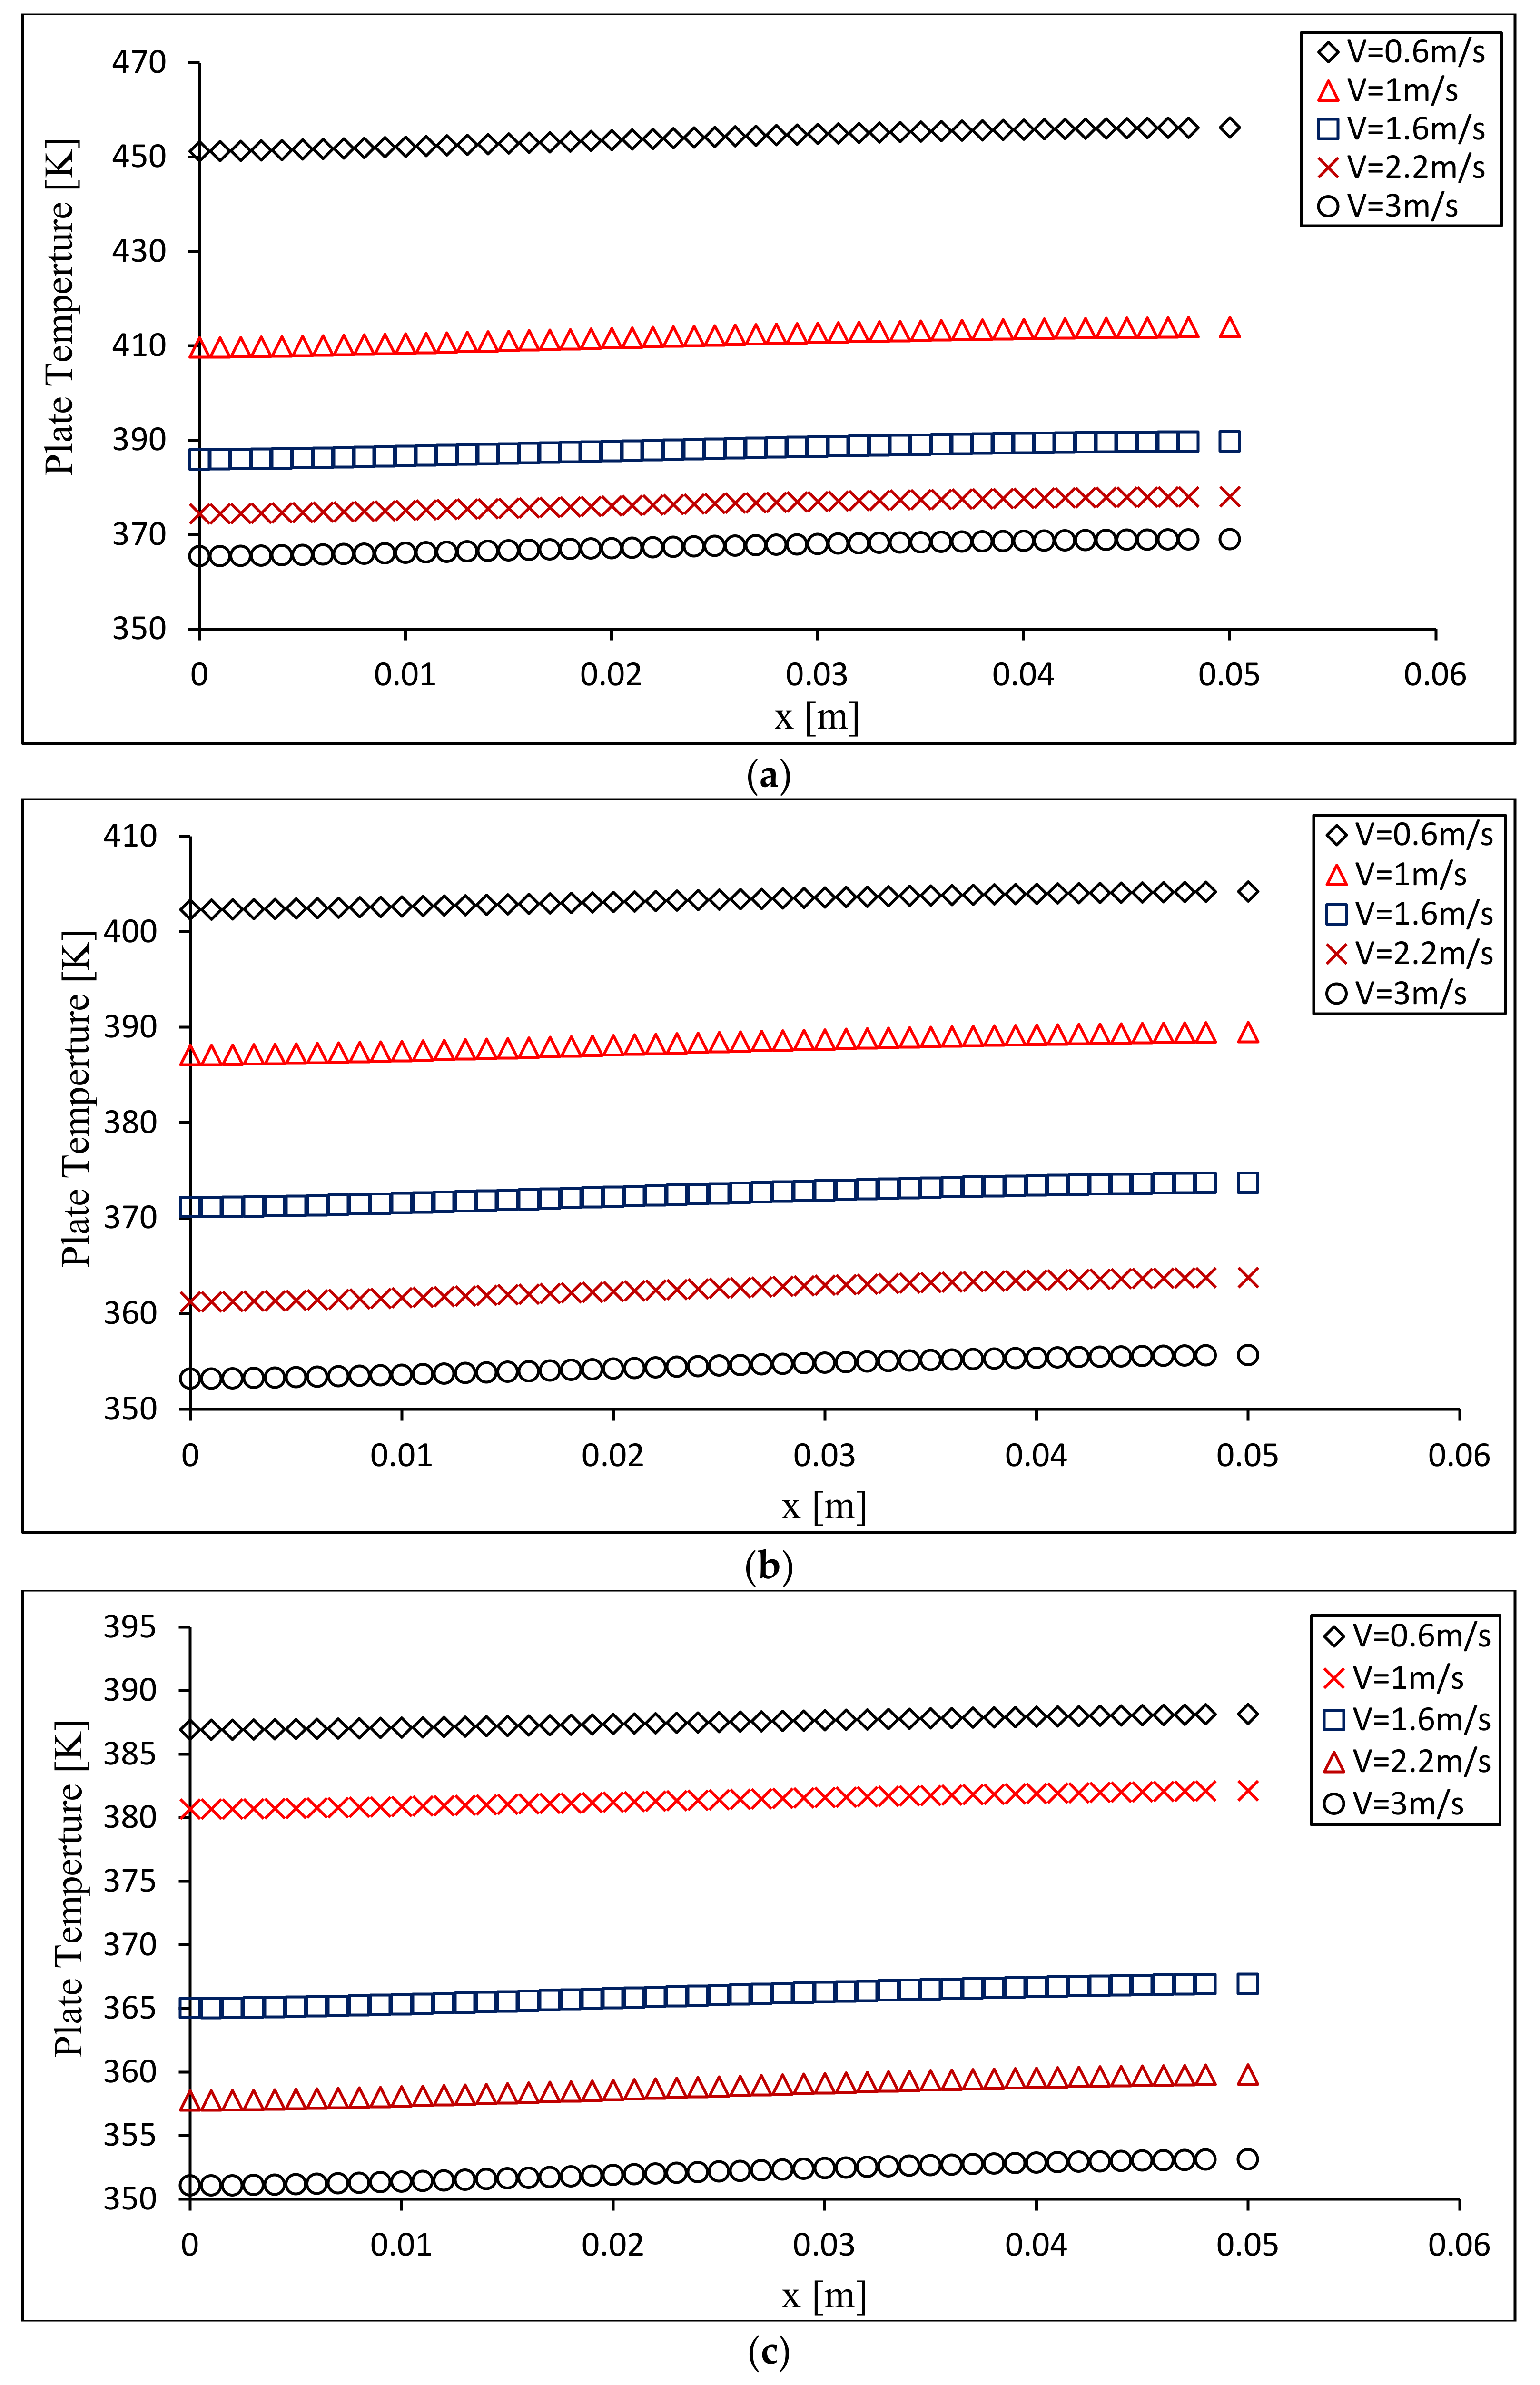
Results showed that the higher the ppi, the higher was the heat-removal capability of the foam. This is because the surface-area density of the foam increases with increasing ppi. Even though 100 ppi can be achieved, commercial aluminum foam is usually available at no more than 40 ppi. Therefore, 40-ppi aluminum foam was chosen to be further investigated in terms of porosity. Figure 2 shows the heated wall’s temperature as a function of distance from the inlet at various inlet speeds. Part (a) is for 90%, part (b) is for 70%, and part (c) is for 60% porous foam. A few trends can be identified based on this figure. The wall temperature decreases with increasing inlet air speed. This is due to the fact that convection heat transfer in the foam is more efficient at a higher coolant speed. The wall’s temperature increases slightly in the flow direction as air absorbs heat while moving through the foam.
The model with 60% porosity shows the lowest range of maximum wall temperatures. In the 60% porosity case, the maximum plate temperatures reached the safe operating region of PEMs at an inlet velocity of about 1.5 m/s or higher. The operationally safe temperature range for PEMs is below 90 °C or 363 K [24]. It should be noted here that these results were for geometry and heat flux that are different from the stack to be investigated in this paper. Nonetheless, the results mentioned above give guidance to the porosity and pore density of the foam (60% and 40 ppi) that is recommended for designing foam-based cooling systems for actual fuel-cell stacks.
2.2. Stack Cooling Simulations
The investigation then moved to study the above metal foam (40 ppi and 60% porosity) for cooling of a common commercial stack, EFC-100-03-6-ST made by ElectroChem Inc., Woburn, MA, USA. This stack is intended for use in the automotive industry and power backup systems. It has three PEM fuel cells, each having an active area of 100 cm2. The total output power of the stack is 500 W. Currently, the stack is water-cooled to maintain the operating temperature of 60–90 °C. The water is pumped through serpentine flow fields in four channels; each channel is 1.78 mm × 0.89 mm × 73.66 mm (0.07″ × 0.035″ × 2.9″). Table 1 lists the key features and the specifications of this stack.
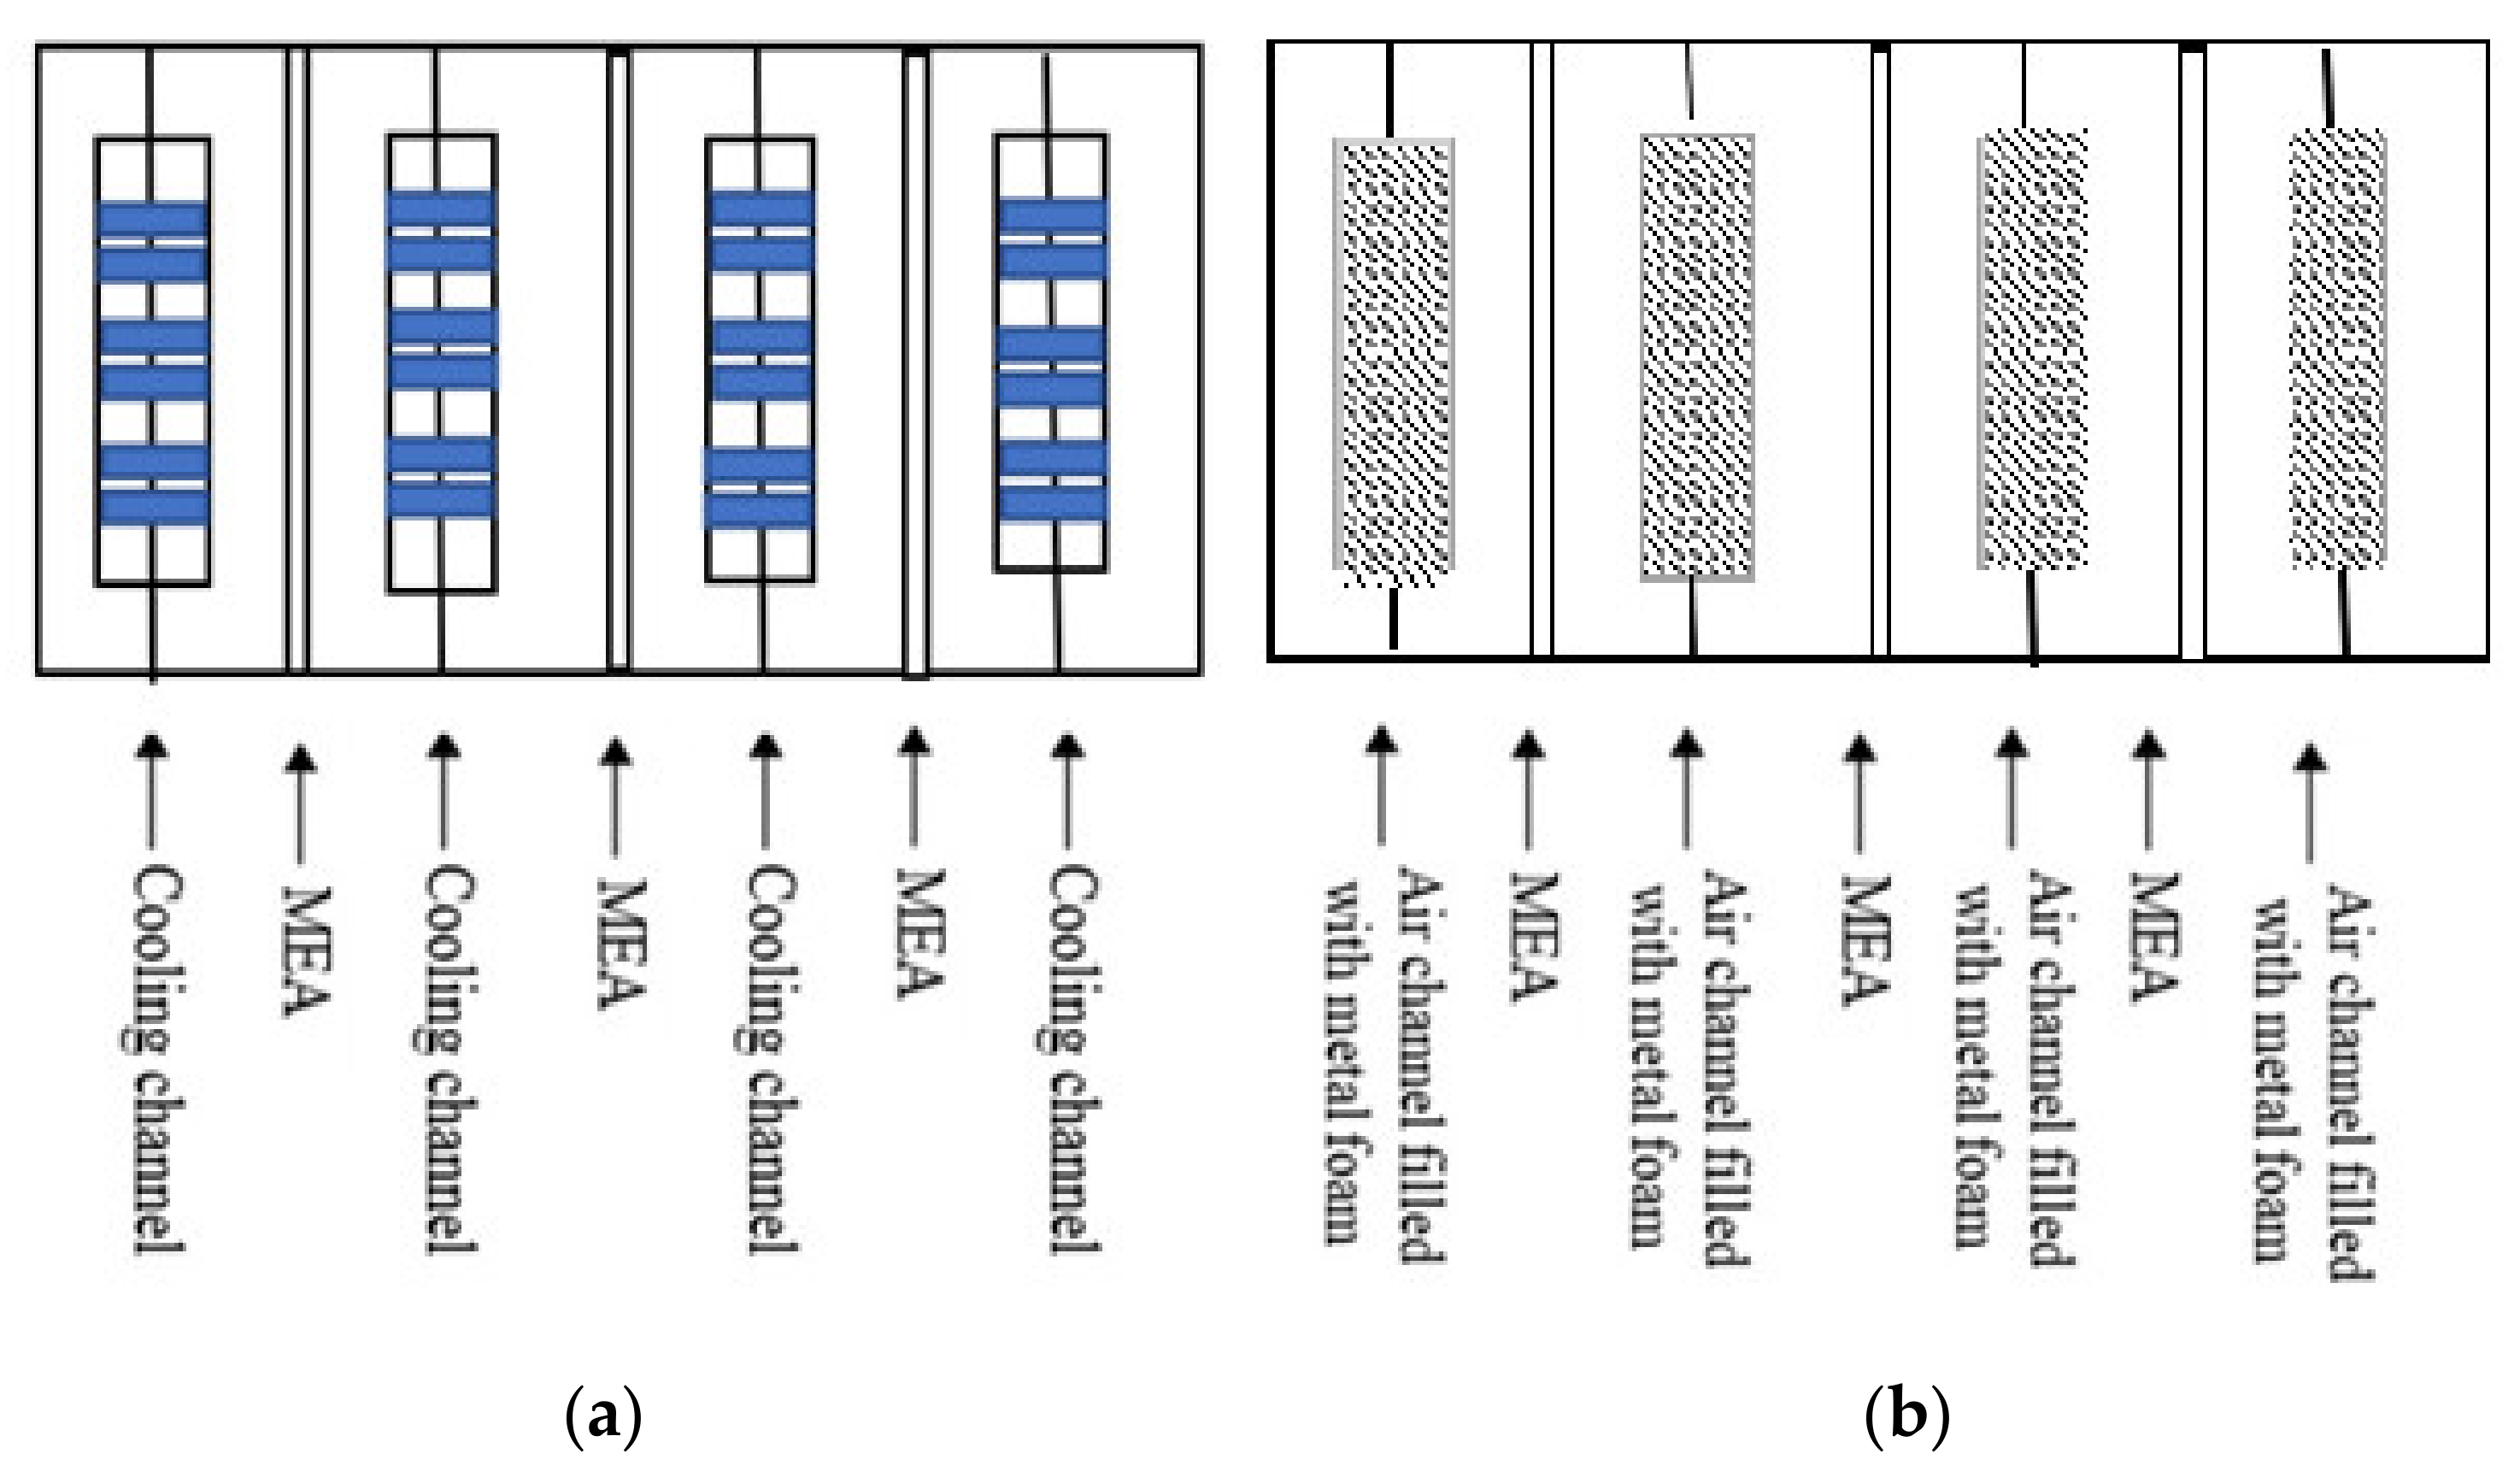
For simulation purposes, the geometry of the water-cooling field of the commercial stack, EFC-100-03-6-ST, was built in a 3D physical design in SolidWorks and imported into ANSYS-CFD. However, all shoulders between the serpentine small channels in the bipolar plate were removed, which made the cooling field one large channel having dimensions (L × W × H) 100 mm × 73.66 mm × 3.56 mm. The new design for air cooling stipulates that this large channel is filled with metal foam in order to dissipate heat more efficiently to air that will flow through it, as shown in Figure 3. In the simulation, the actual fuel cells including the bipolar plates were replaced by 100 mm × 100 mm × 7.12 mm aluminum plates. One large air-cooling channel was machined along with each plate. The depth of this channel was 3.65 mm.
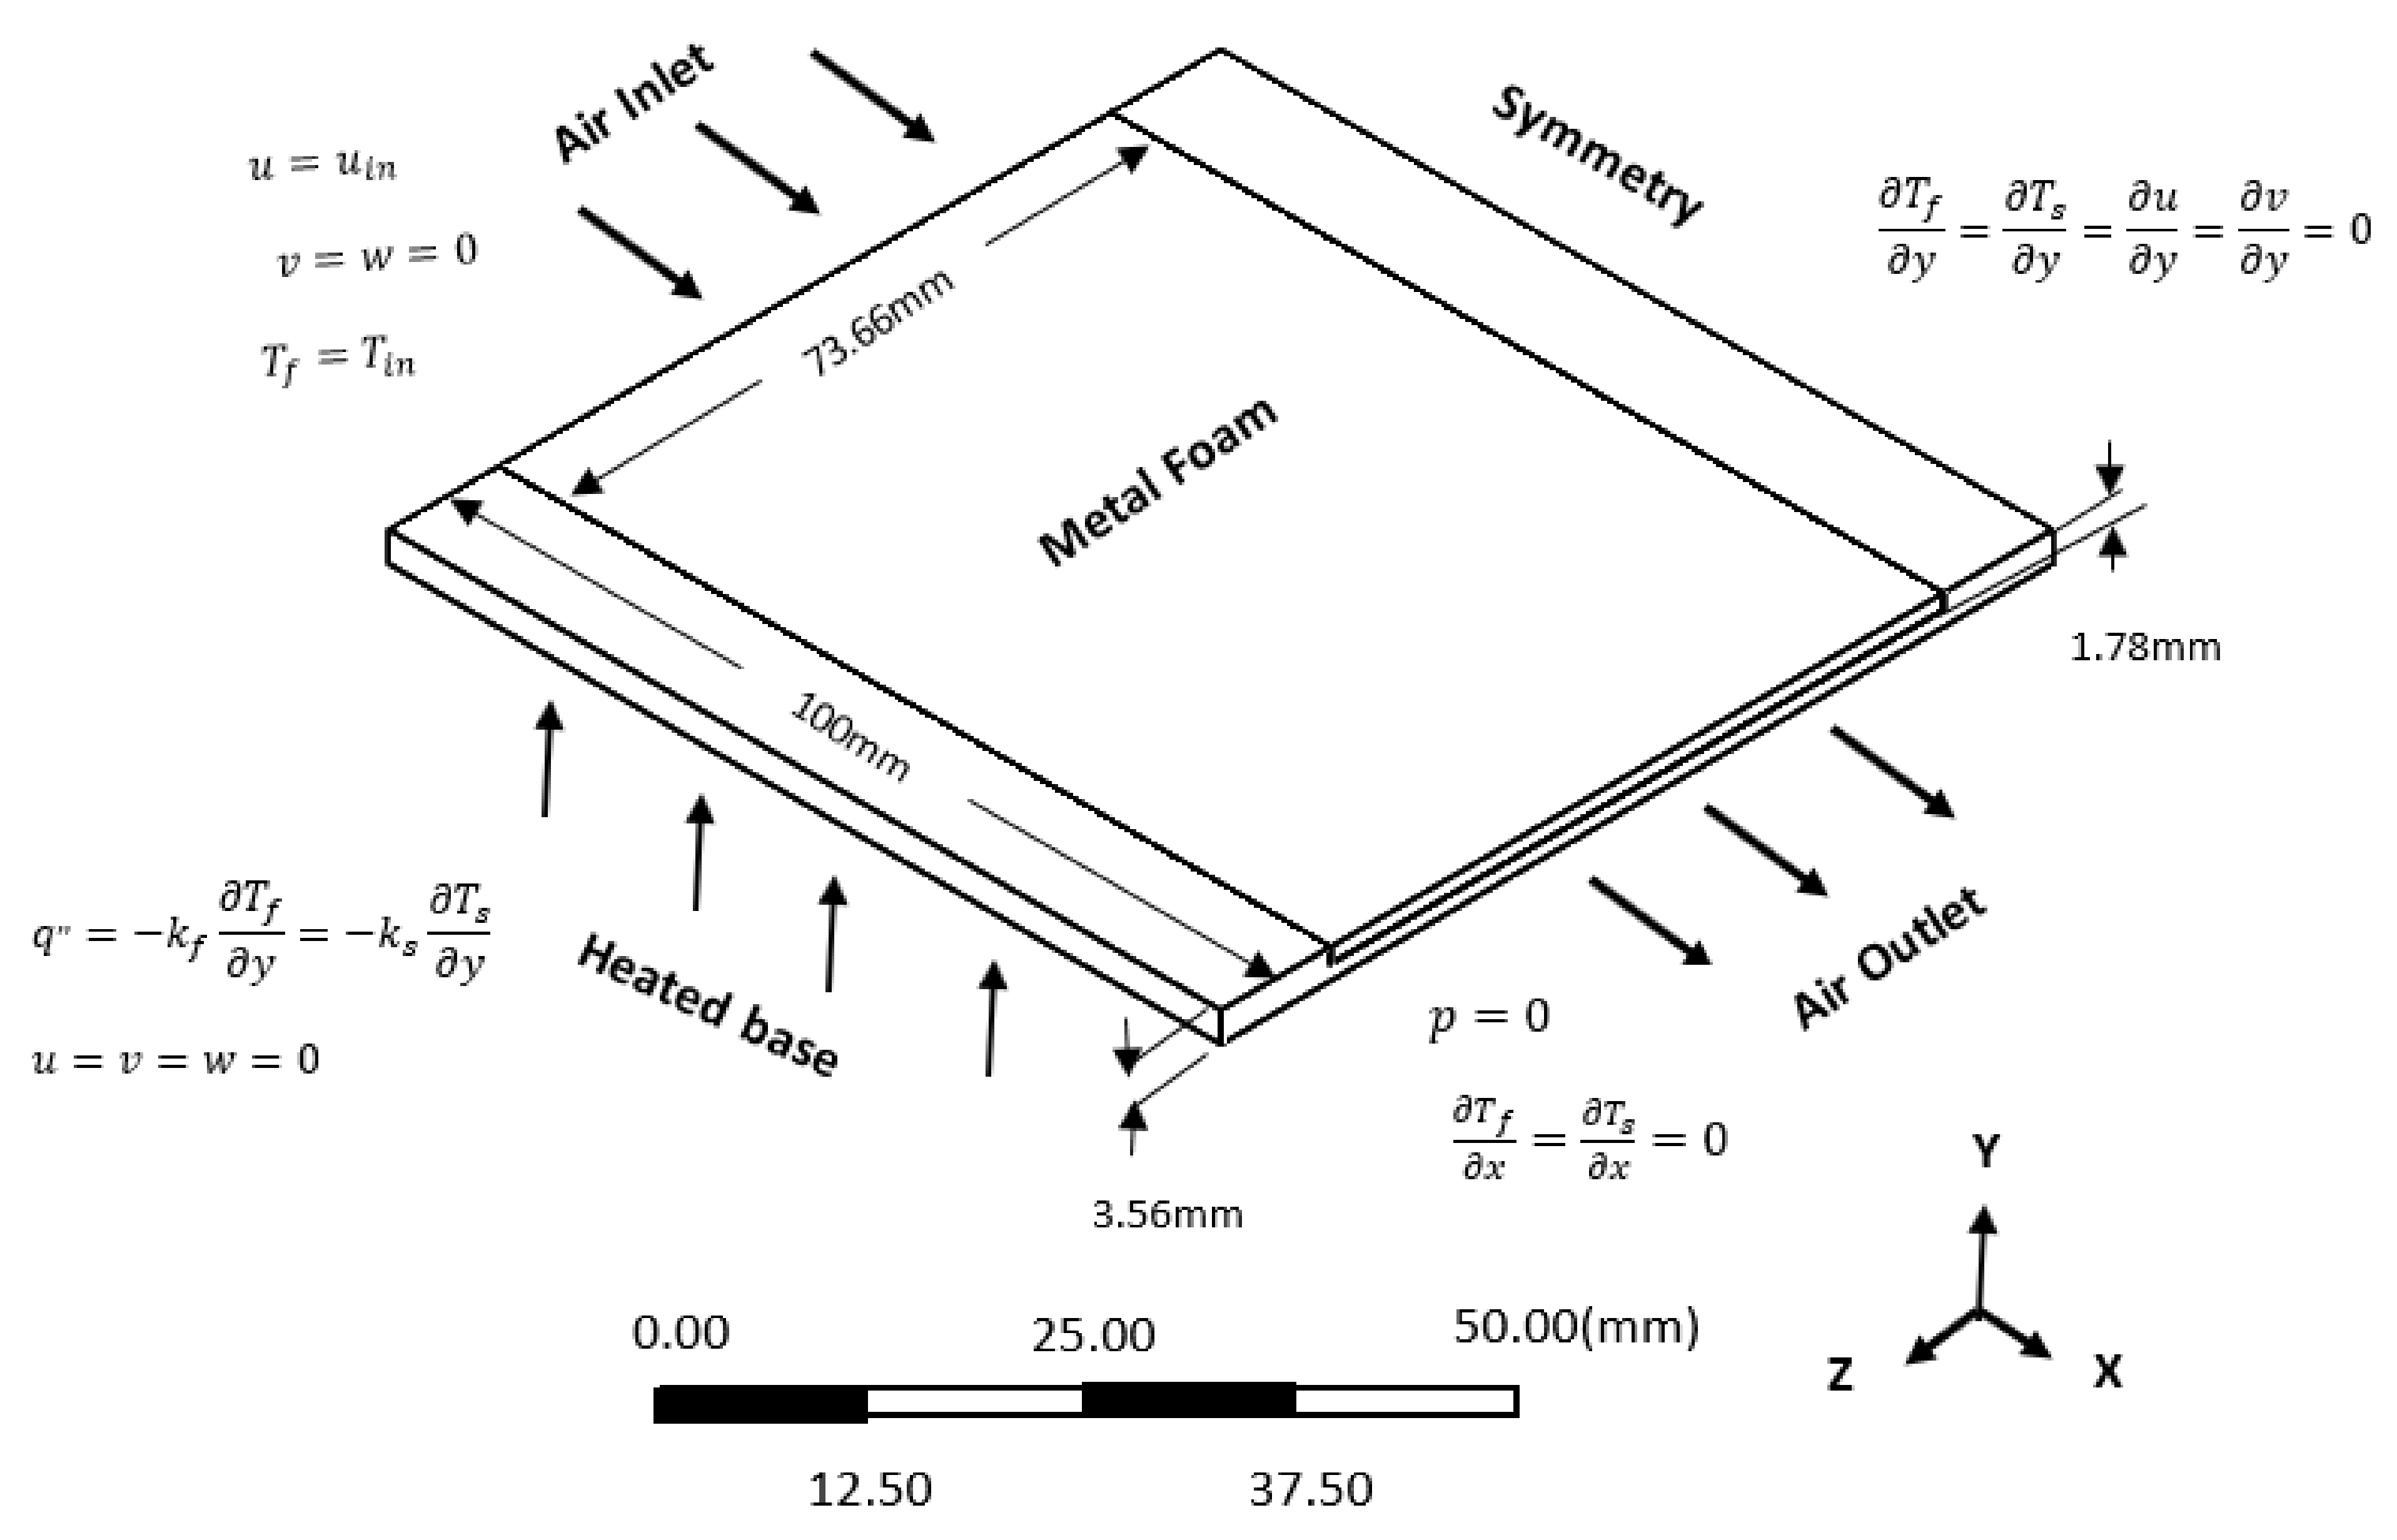
The heat produced by each fuel cell was applied to each metal-foam cooling channel in the form of constant heat flux. Since the total heat removal requirement for the stack is 500 W, as indicated by the manufacturer, this amount was divided equally among the fuel cells, which resulted in a heat flux of 1.55 W/cm2 applied to each side of an internal cell and on only one side of an end cell. Each cooling channel was filled with metal foam having the properties shown in Table 2. A drawing of the 3-dimensional heat transfer problem is shown in Figure 4.
2.3. Numerical Solution
The governing equations were solved invoking the local thermal nonequilibrium in ANSYS-CFD. This assumption allows the local temperatures of the fluid and the solid in the foam to be different, and hence there is convection heat transfer from the solid to the fluid. The governing equations for this 3D case are:
where ɛ and k are the porosity and the permeability of the foam, respectively, and is the velocity vector.
The following boundary conditions were imposed:
The equations were solved for inlet air velocities from 0.2 to 1.6 m/s.
The viscous and inertial resistances (correspond to the last two terms in Equation (10)) needed to be entered for metal foam. They were calculated according to the following equations given by ANSYS-CFD:
where is the pore diameter of the foam. Both interfacial surface area density and heat transfer coefficient were calculated and manually entered to solve the energy equations. Dukhan and Patel [48] calculated the interfacial area density for 40 PPI of metal foam. They used a correlation provided by ERG Materials and Aerospace given as Equation (20).
where is the surface area per unit volume of the foam. Kuwahara et al. [34] provided the following correlation for the coefficient of interfacial convective heat transfer in metal foam:
where Rep is the Reynolds number based on the pore diameter. This correlation was used to calculate the heat transfer coefficient.
2.4. Meshing and Mesh Independence
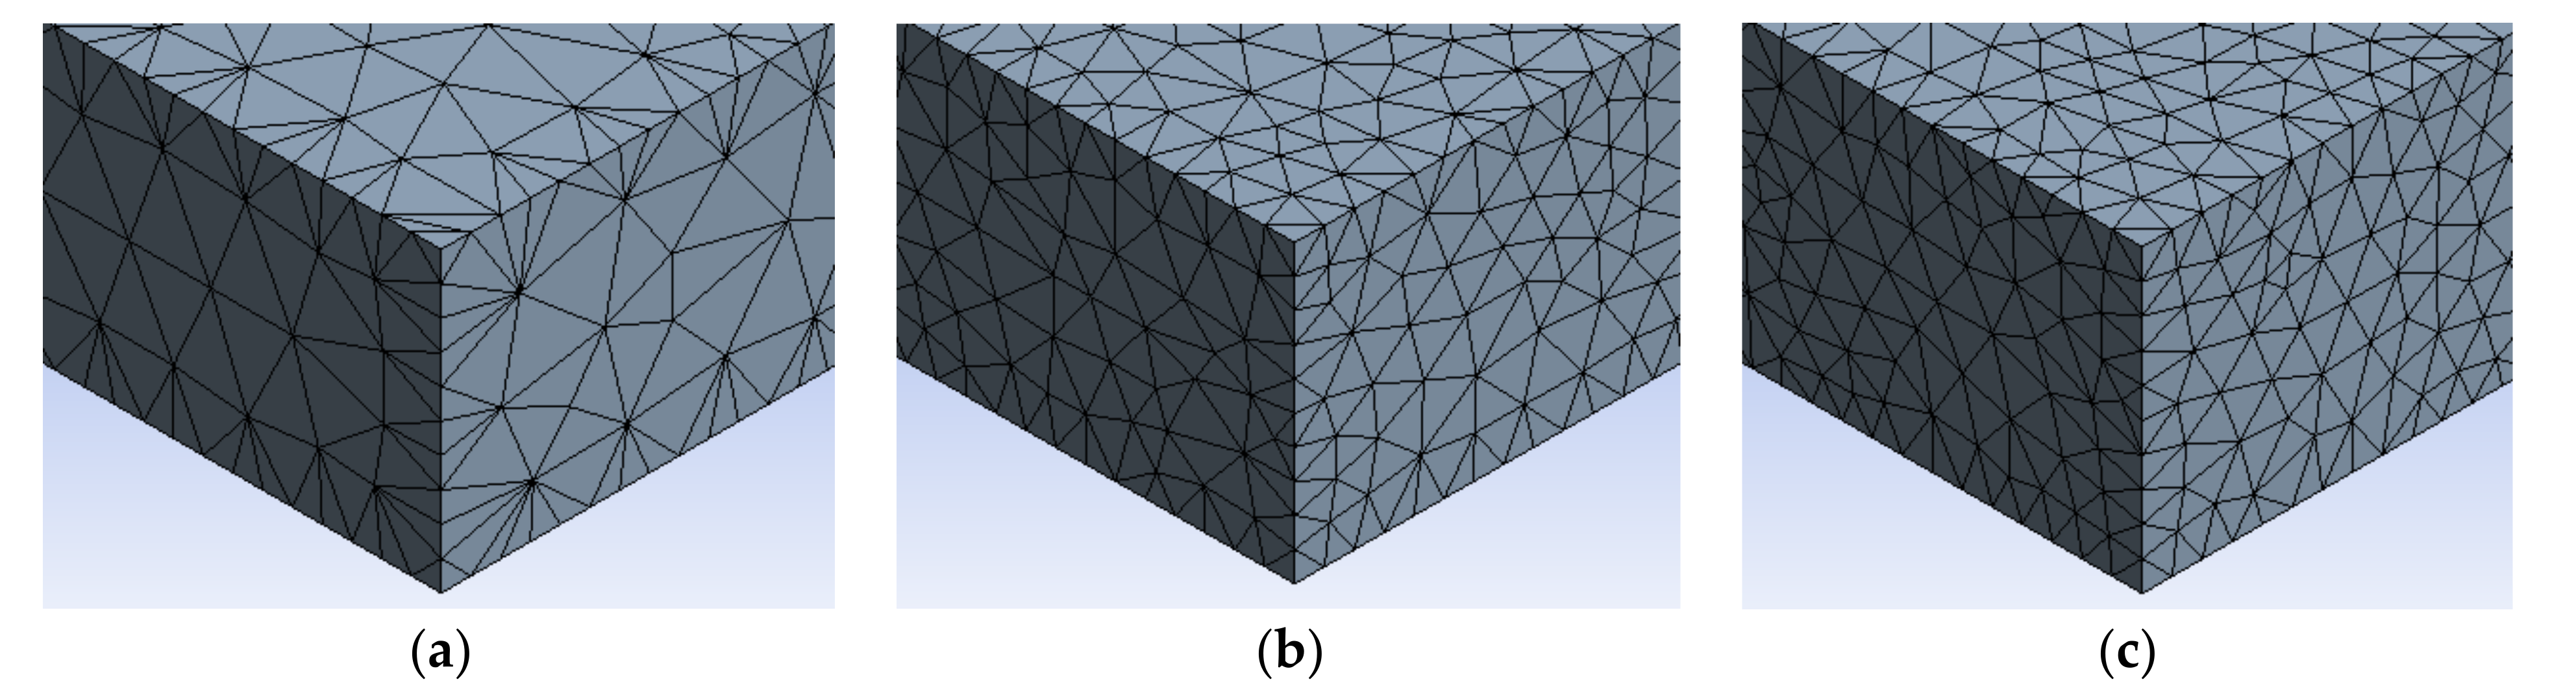
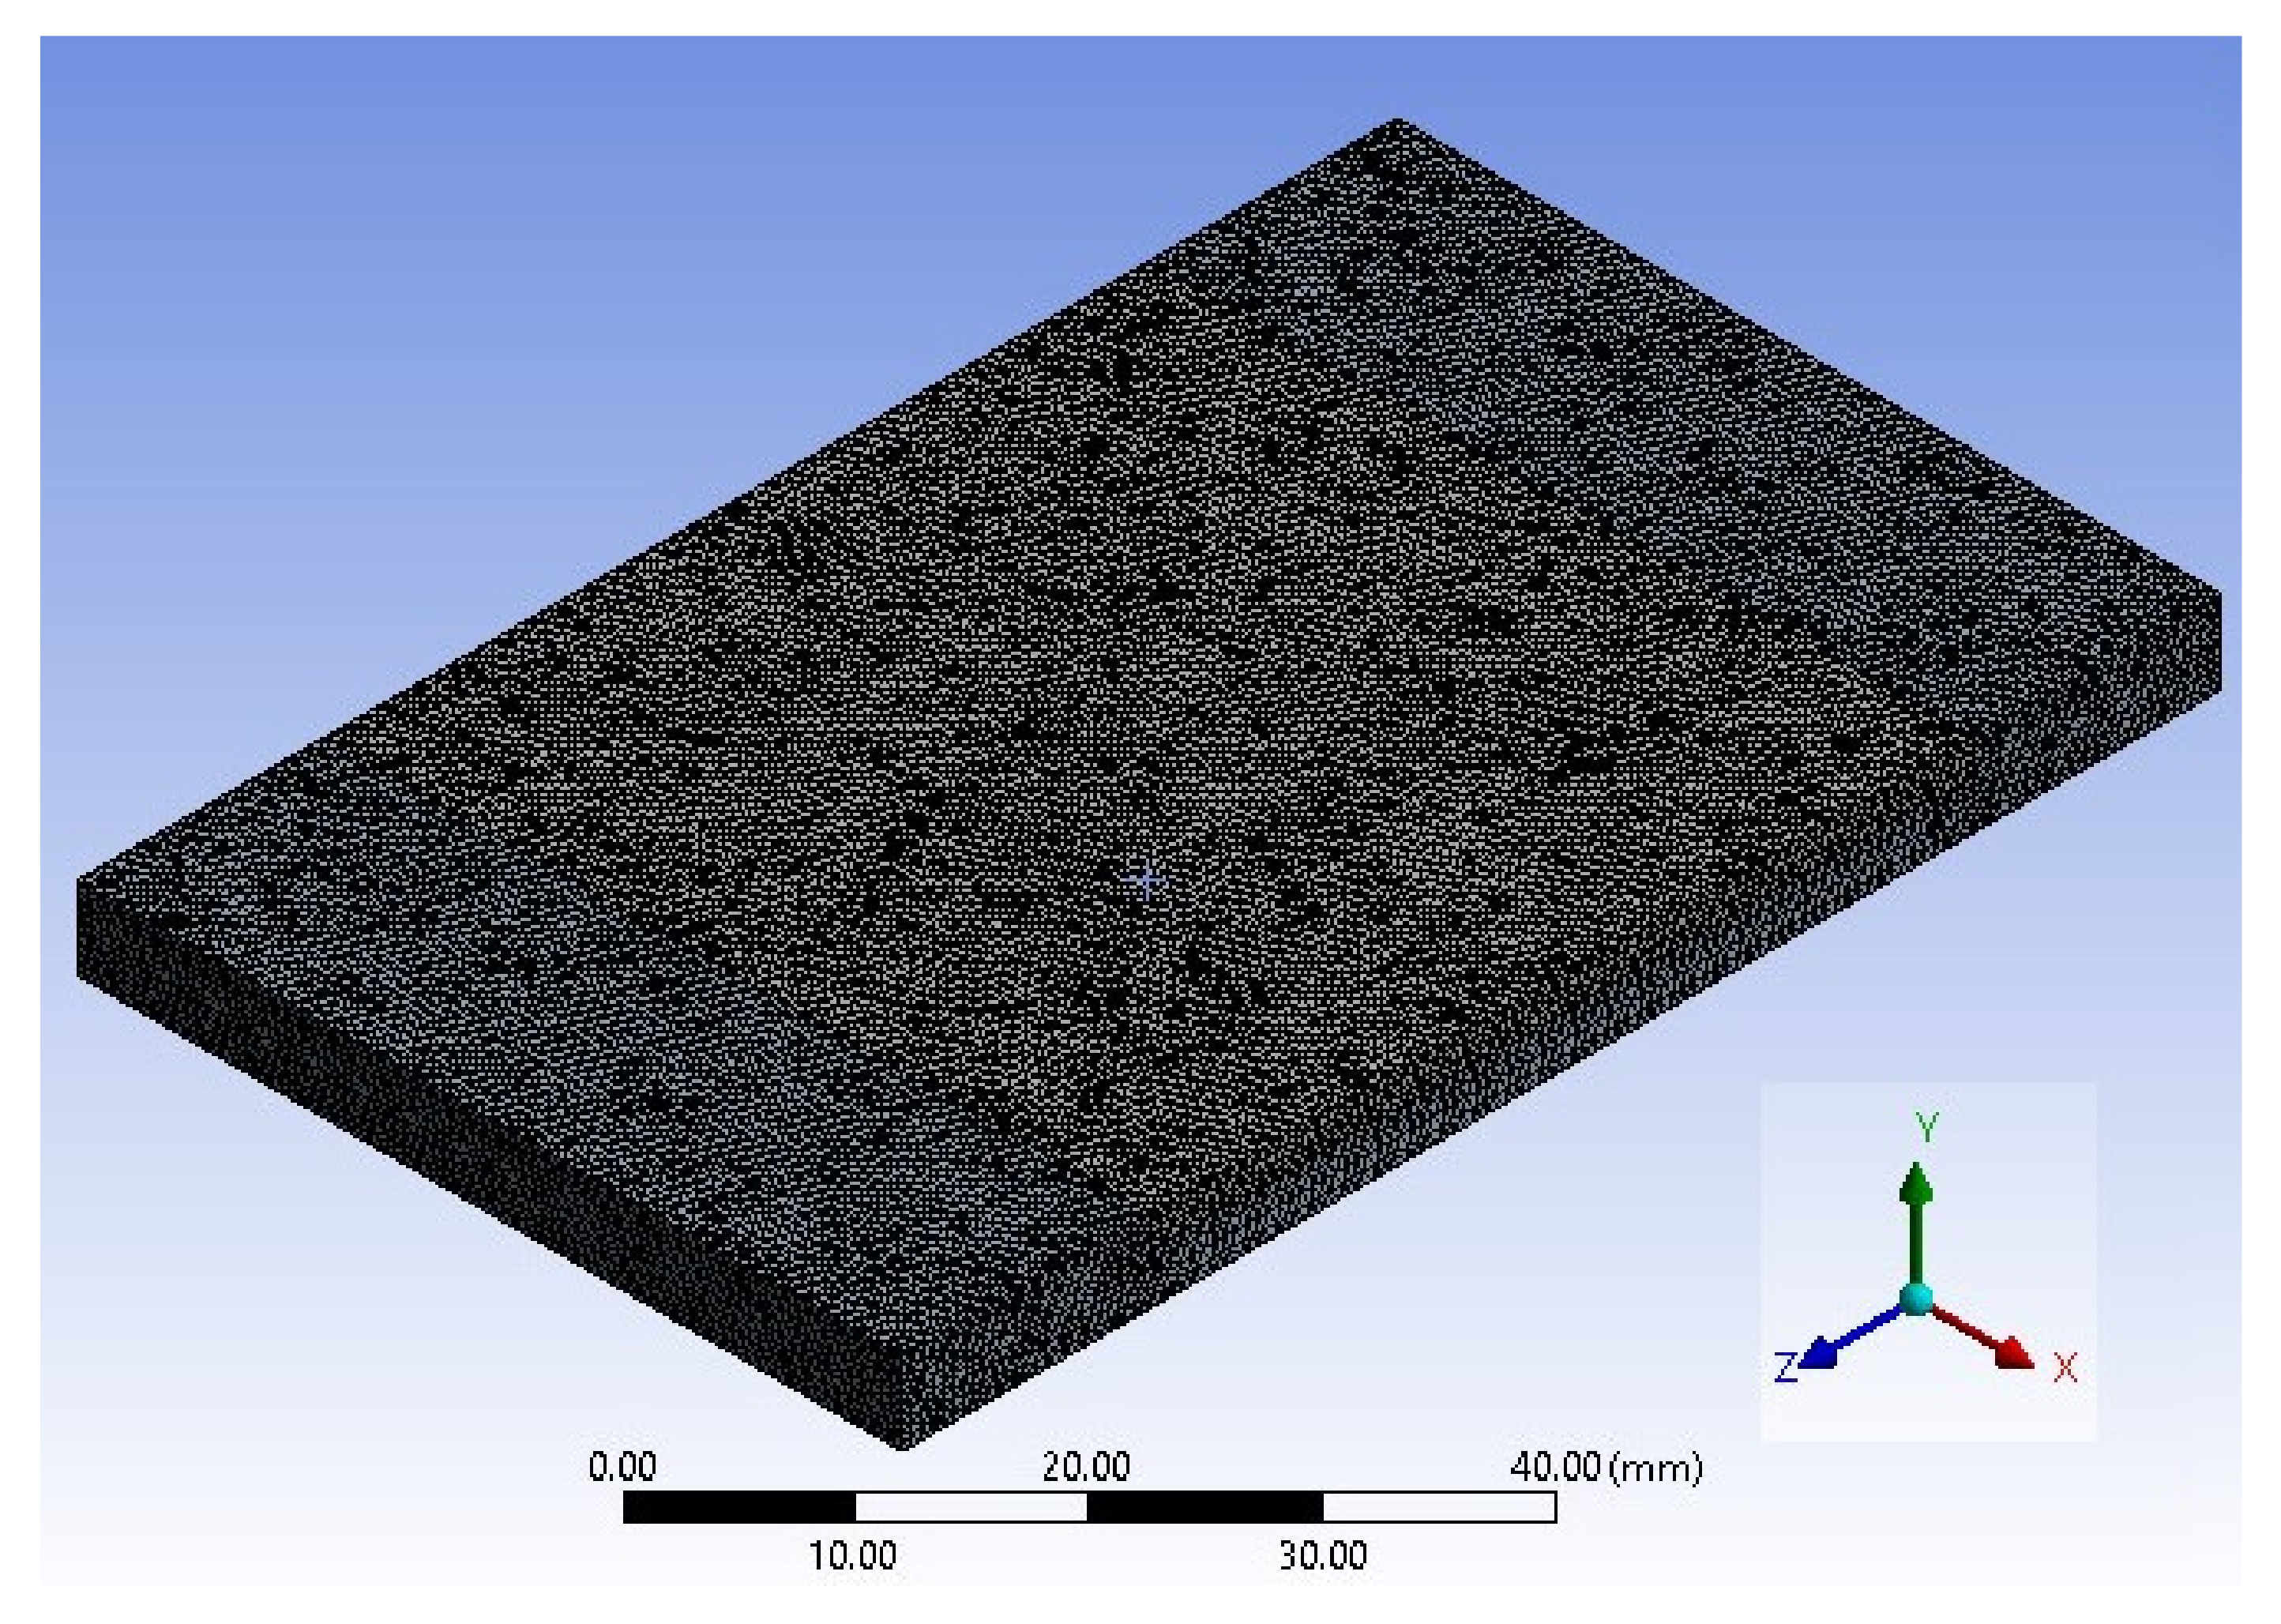
The computational domain was meshed using three different meshes: coarse, medium, and fine, as shown in Figure 5a–c, respectively. All meshes employed tetrahedron elements. A mesh-independence study was carried out on these meshes. The results are shown in Table 3. As can be seen in this table, the difference between the fine and medium meshes was very small: the difference between the obtained pressure drop for the fine and medium meshes is only 0.11%. Therefore, the medium mesh was used in subsequent analysis, in order to save time. The meshed geometry using the medium mesh is shown in Figure 6.
Medium-smoothing-quality meshes were applied to all designed geometries with a de-feature size of 5 × 10⁻³ mm. Mesh quality and smooth transition inflation were checked with 0.272 of the transition ratio. The smooth transition option was recommended by ANSYS based on the geometry of the model. This option calculates the local initial height of tetrahedral elements according to the total height of the elements, so that the rate of volume change, and the transition between each layer, are smooth. The transition ratio is the volume-based growth rate of the last tetrahedral elements. It works best for planar surfaces. ANSYS automatically assigns a transition ratio of 0.272 for a smooth transition. Double precision and serial processing options were selected. For pressure–velocity, the coupling simple scheme solution method was selected. Least squares cell-based gradient spatial discretization, PRESTO solution method for pressure, and second-order upwind for momentum and energy were applied. For all monitors for checking convergence, absolute criteria were chosen to be equal to 10−6.
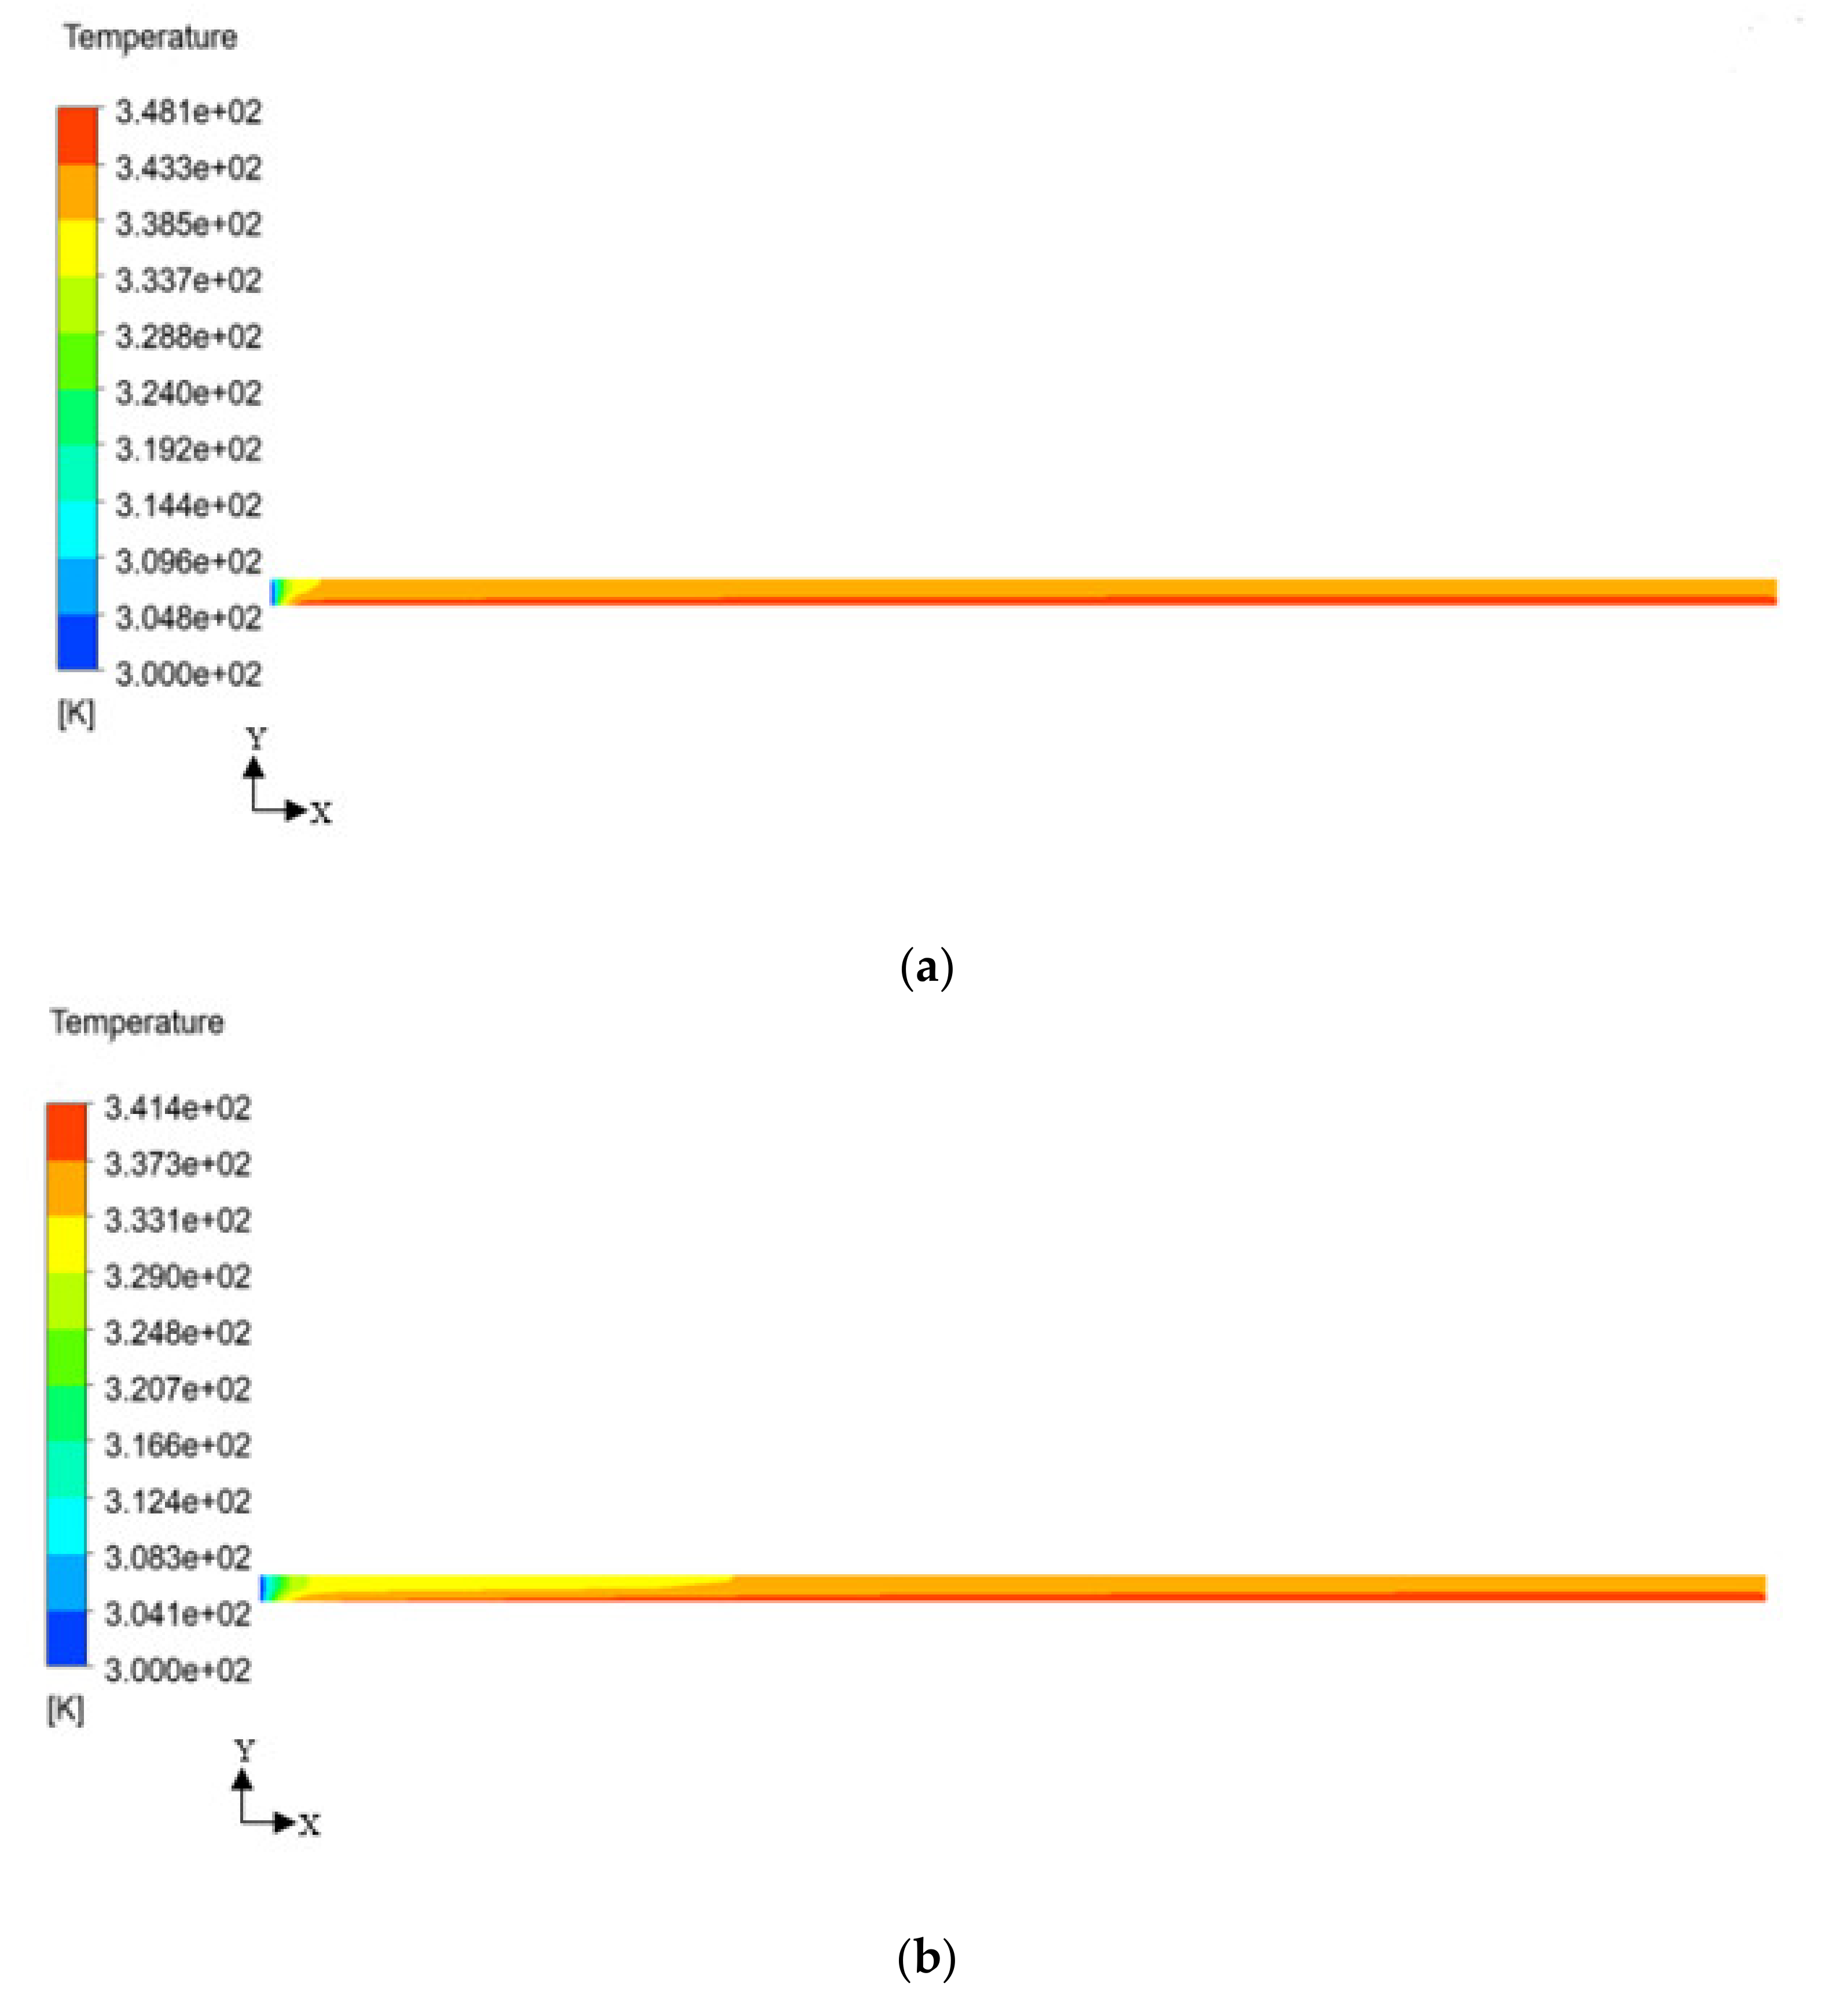
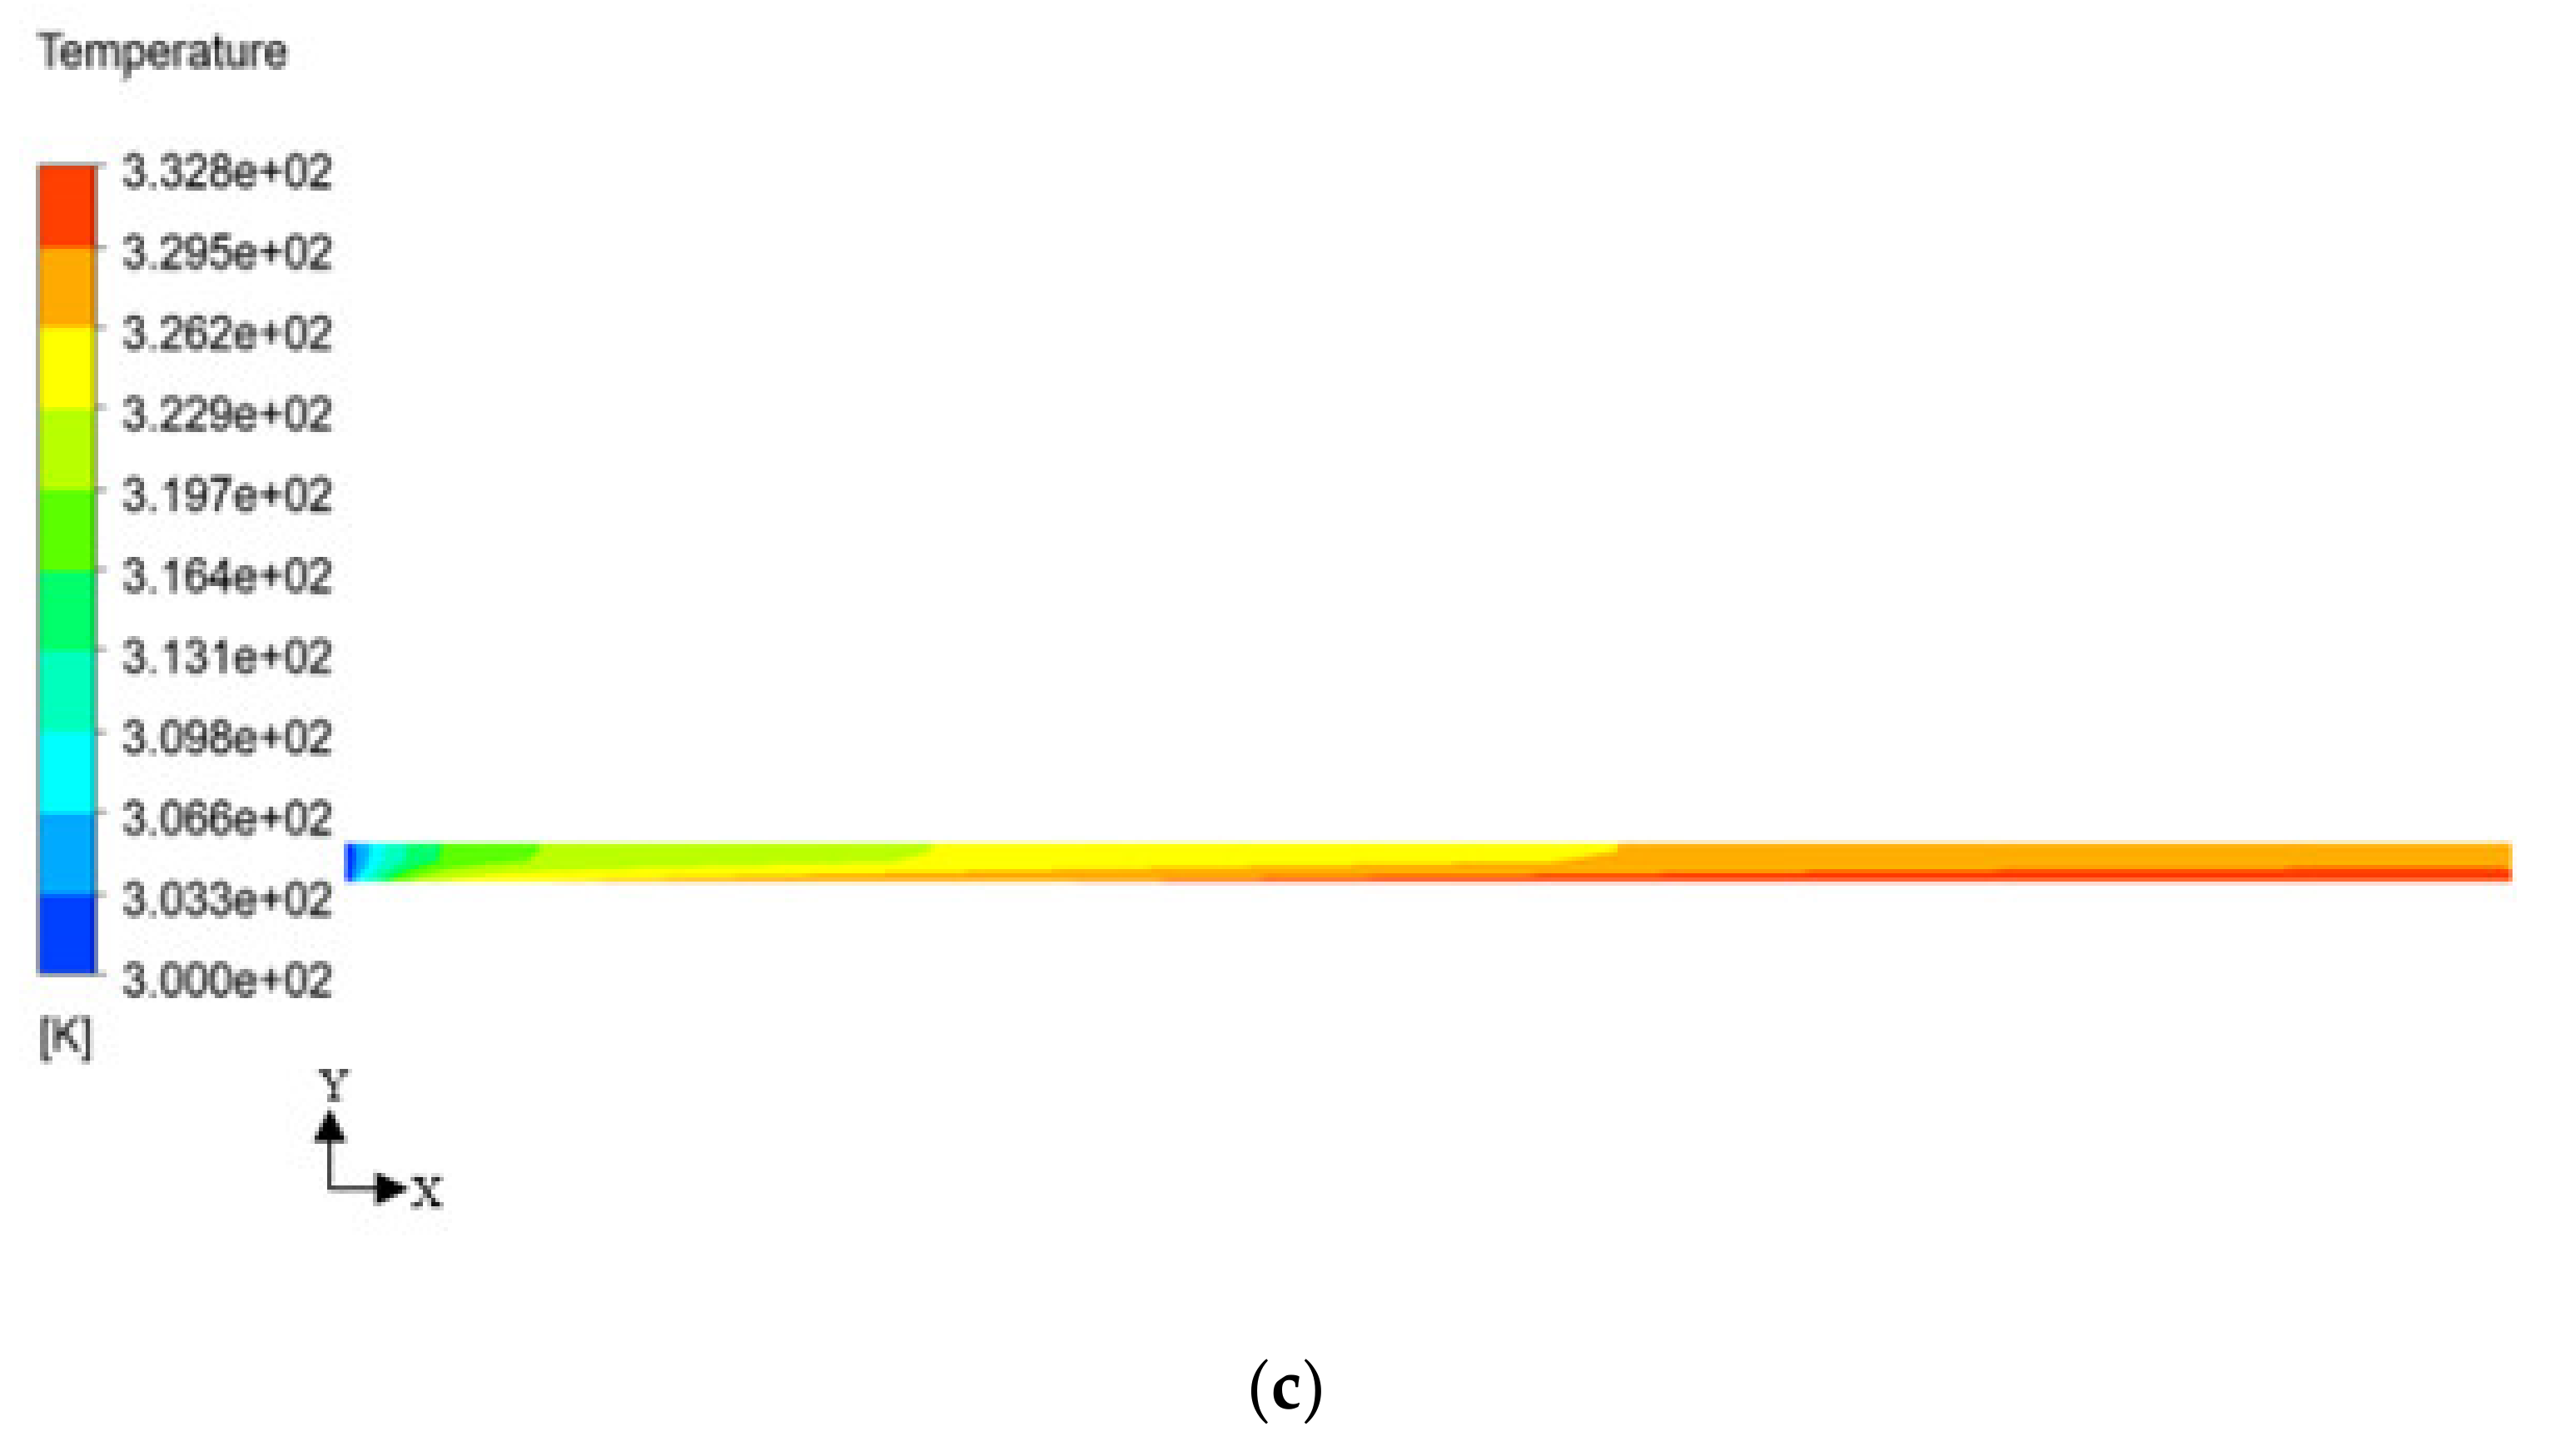
Figure 7 shows 2-dimensional contour plots of the temperature inside the foam at different air speeds. As the air speed increases, the temperature along the foam decreases. Also, the temperature at the bottom is maximum due to proximity to the heated plate. As expected, the temperature increases along the plate as air absorbs more heat.
3. Experiment
3.1. Experimental Stack Model
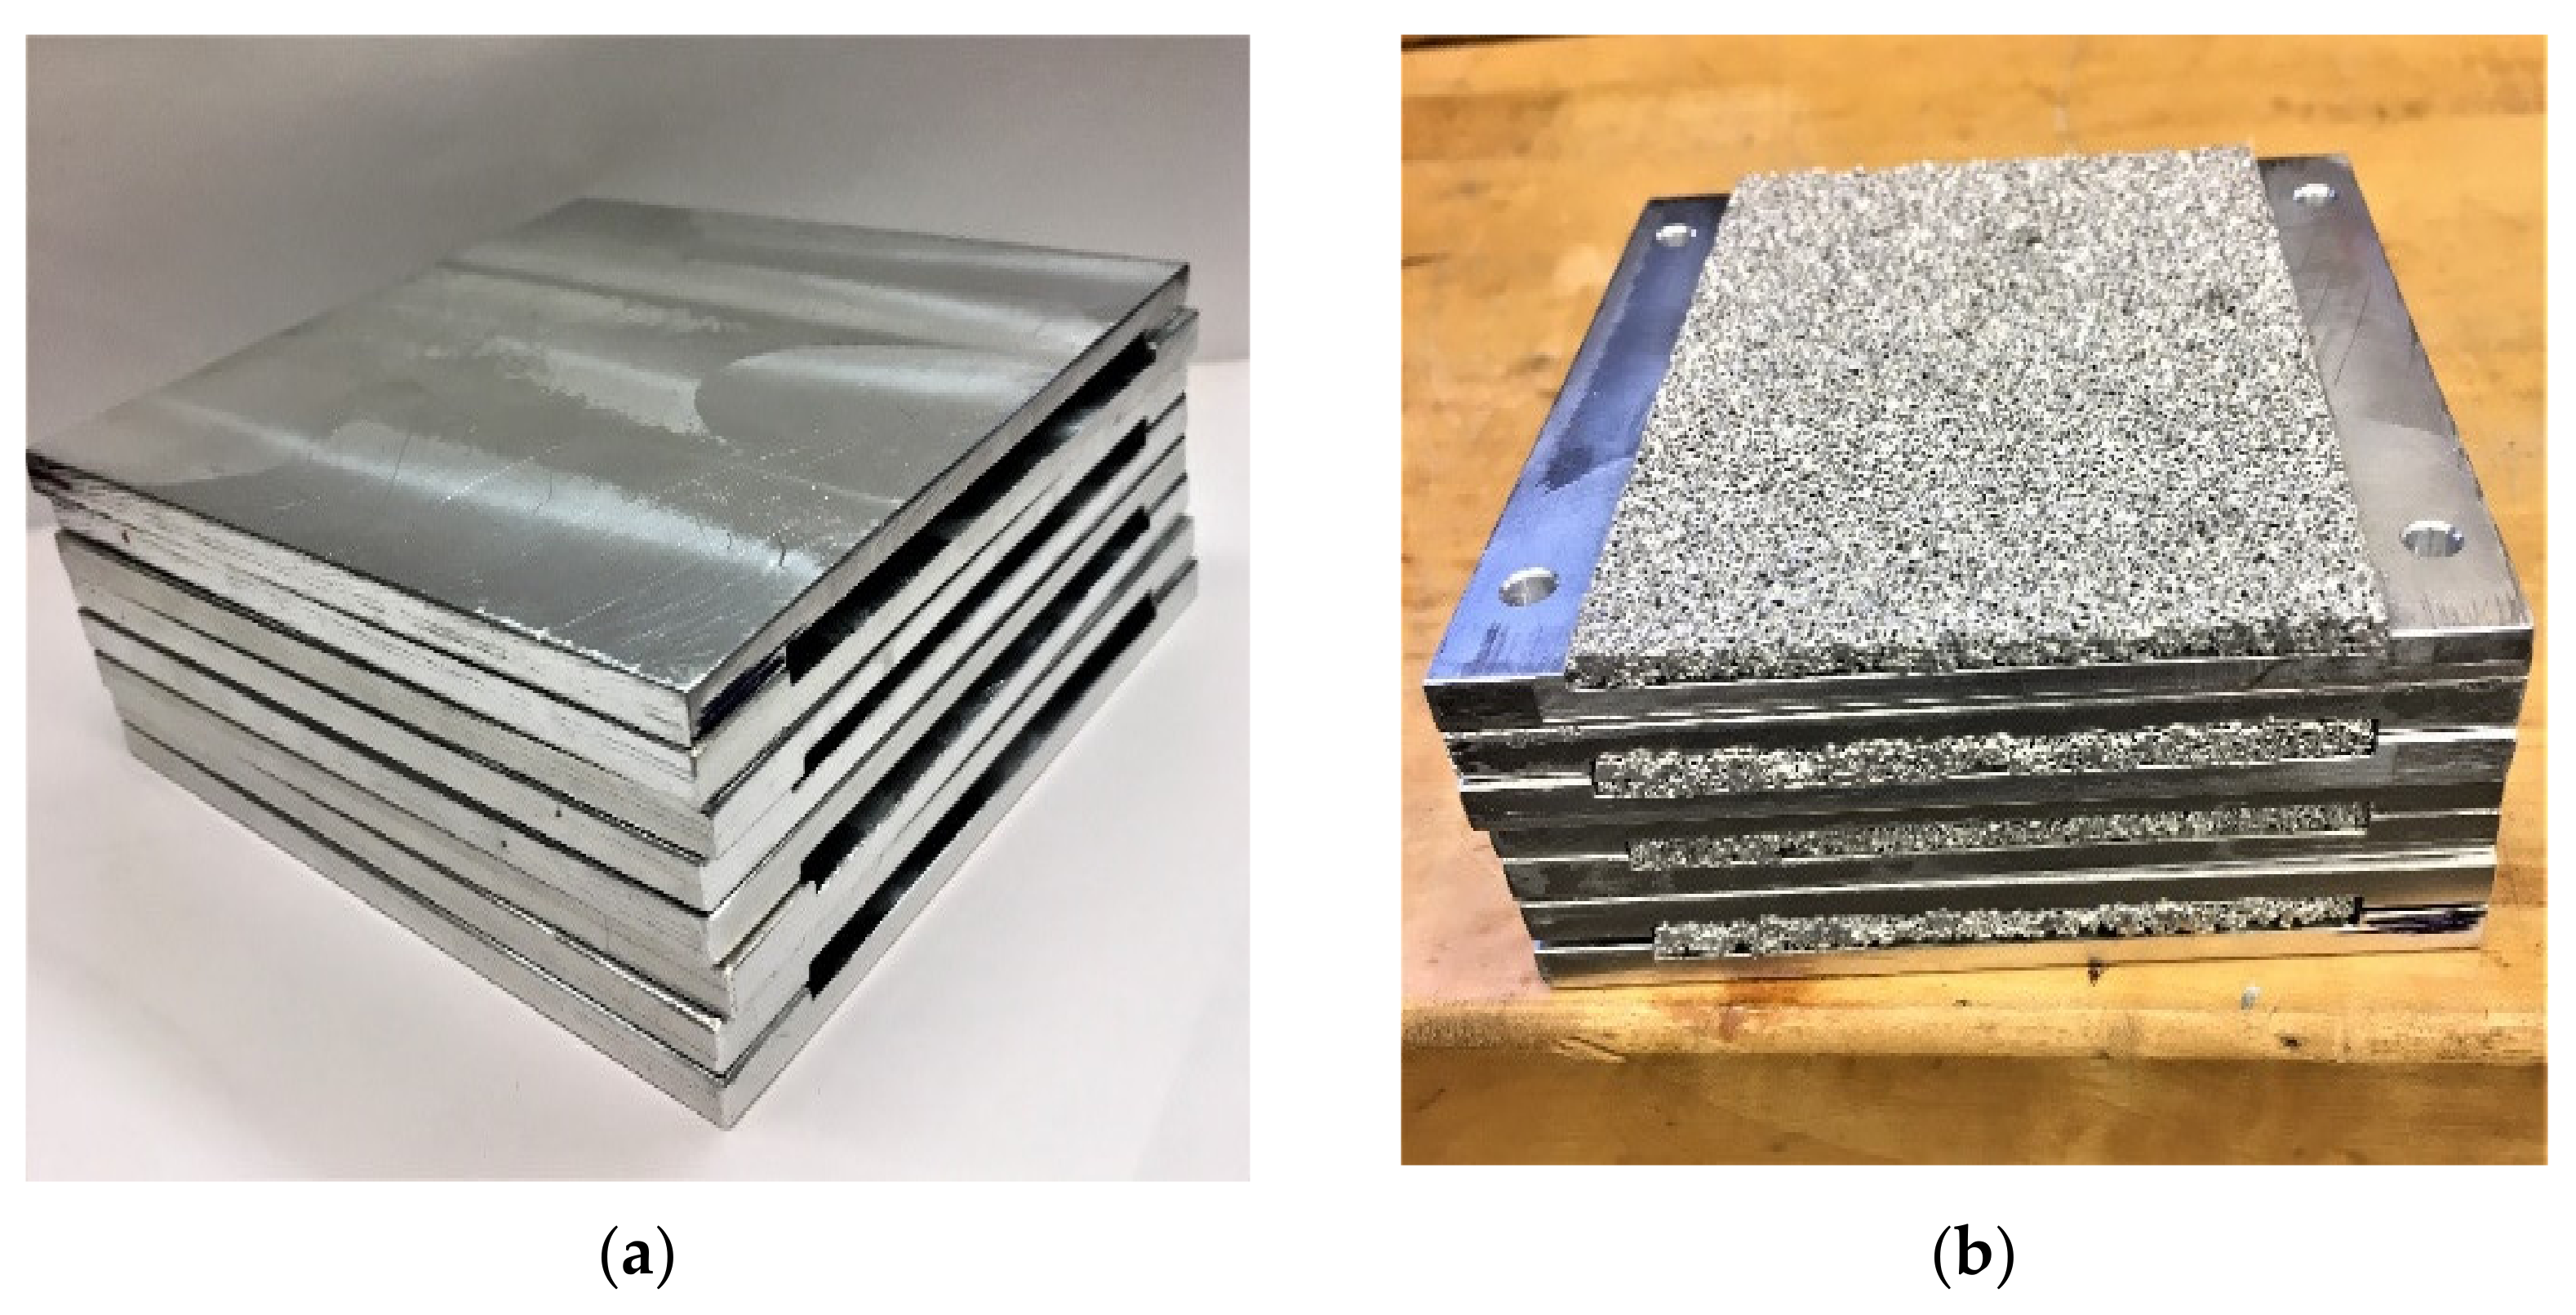
An aluminum model was constructed in order to experimentally verify the simulation results. For that reason, this model was identical to the geometry used in the simulation. As in simulations, all shoulders between air channels in the bipolar plates were removed forming one large channel in each bipolar plate, Figure 8a. Commercial aluminum foam was mechanically compressed into each channel, Figure 8b.
Three heaters were inserted between the aluminum plates to provide heat on both sides of the internal plates and on one side of the end plates. These heaters provided the heat produced by the actual fuel cells. The thermofoil heaters were manufactured by Minco (model HK6915) with a thickness of 0.015 mm (0.060 in) and a square face area of 51.92 cm2 (8.05 in2). For an input voltage of 115 V, each heater could provide up to 1.55 W/cm2.
3.2. Metal Foam and Test Section
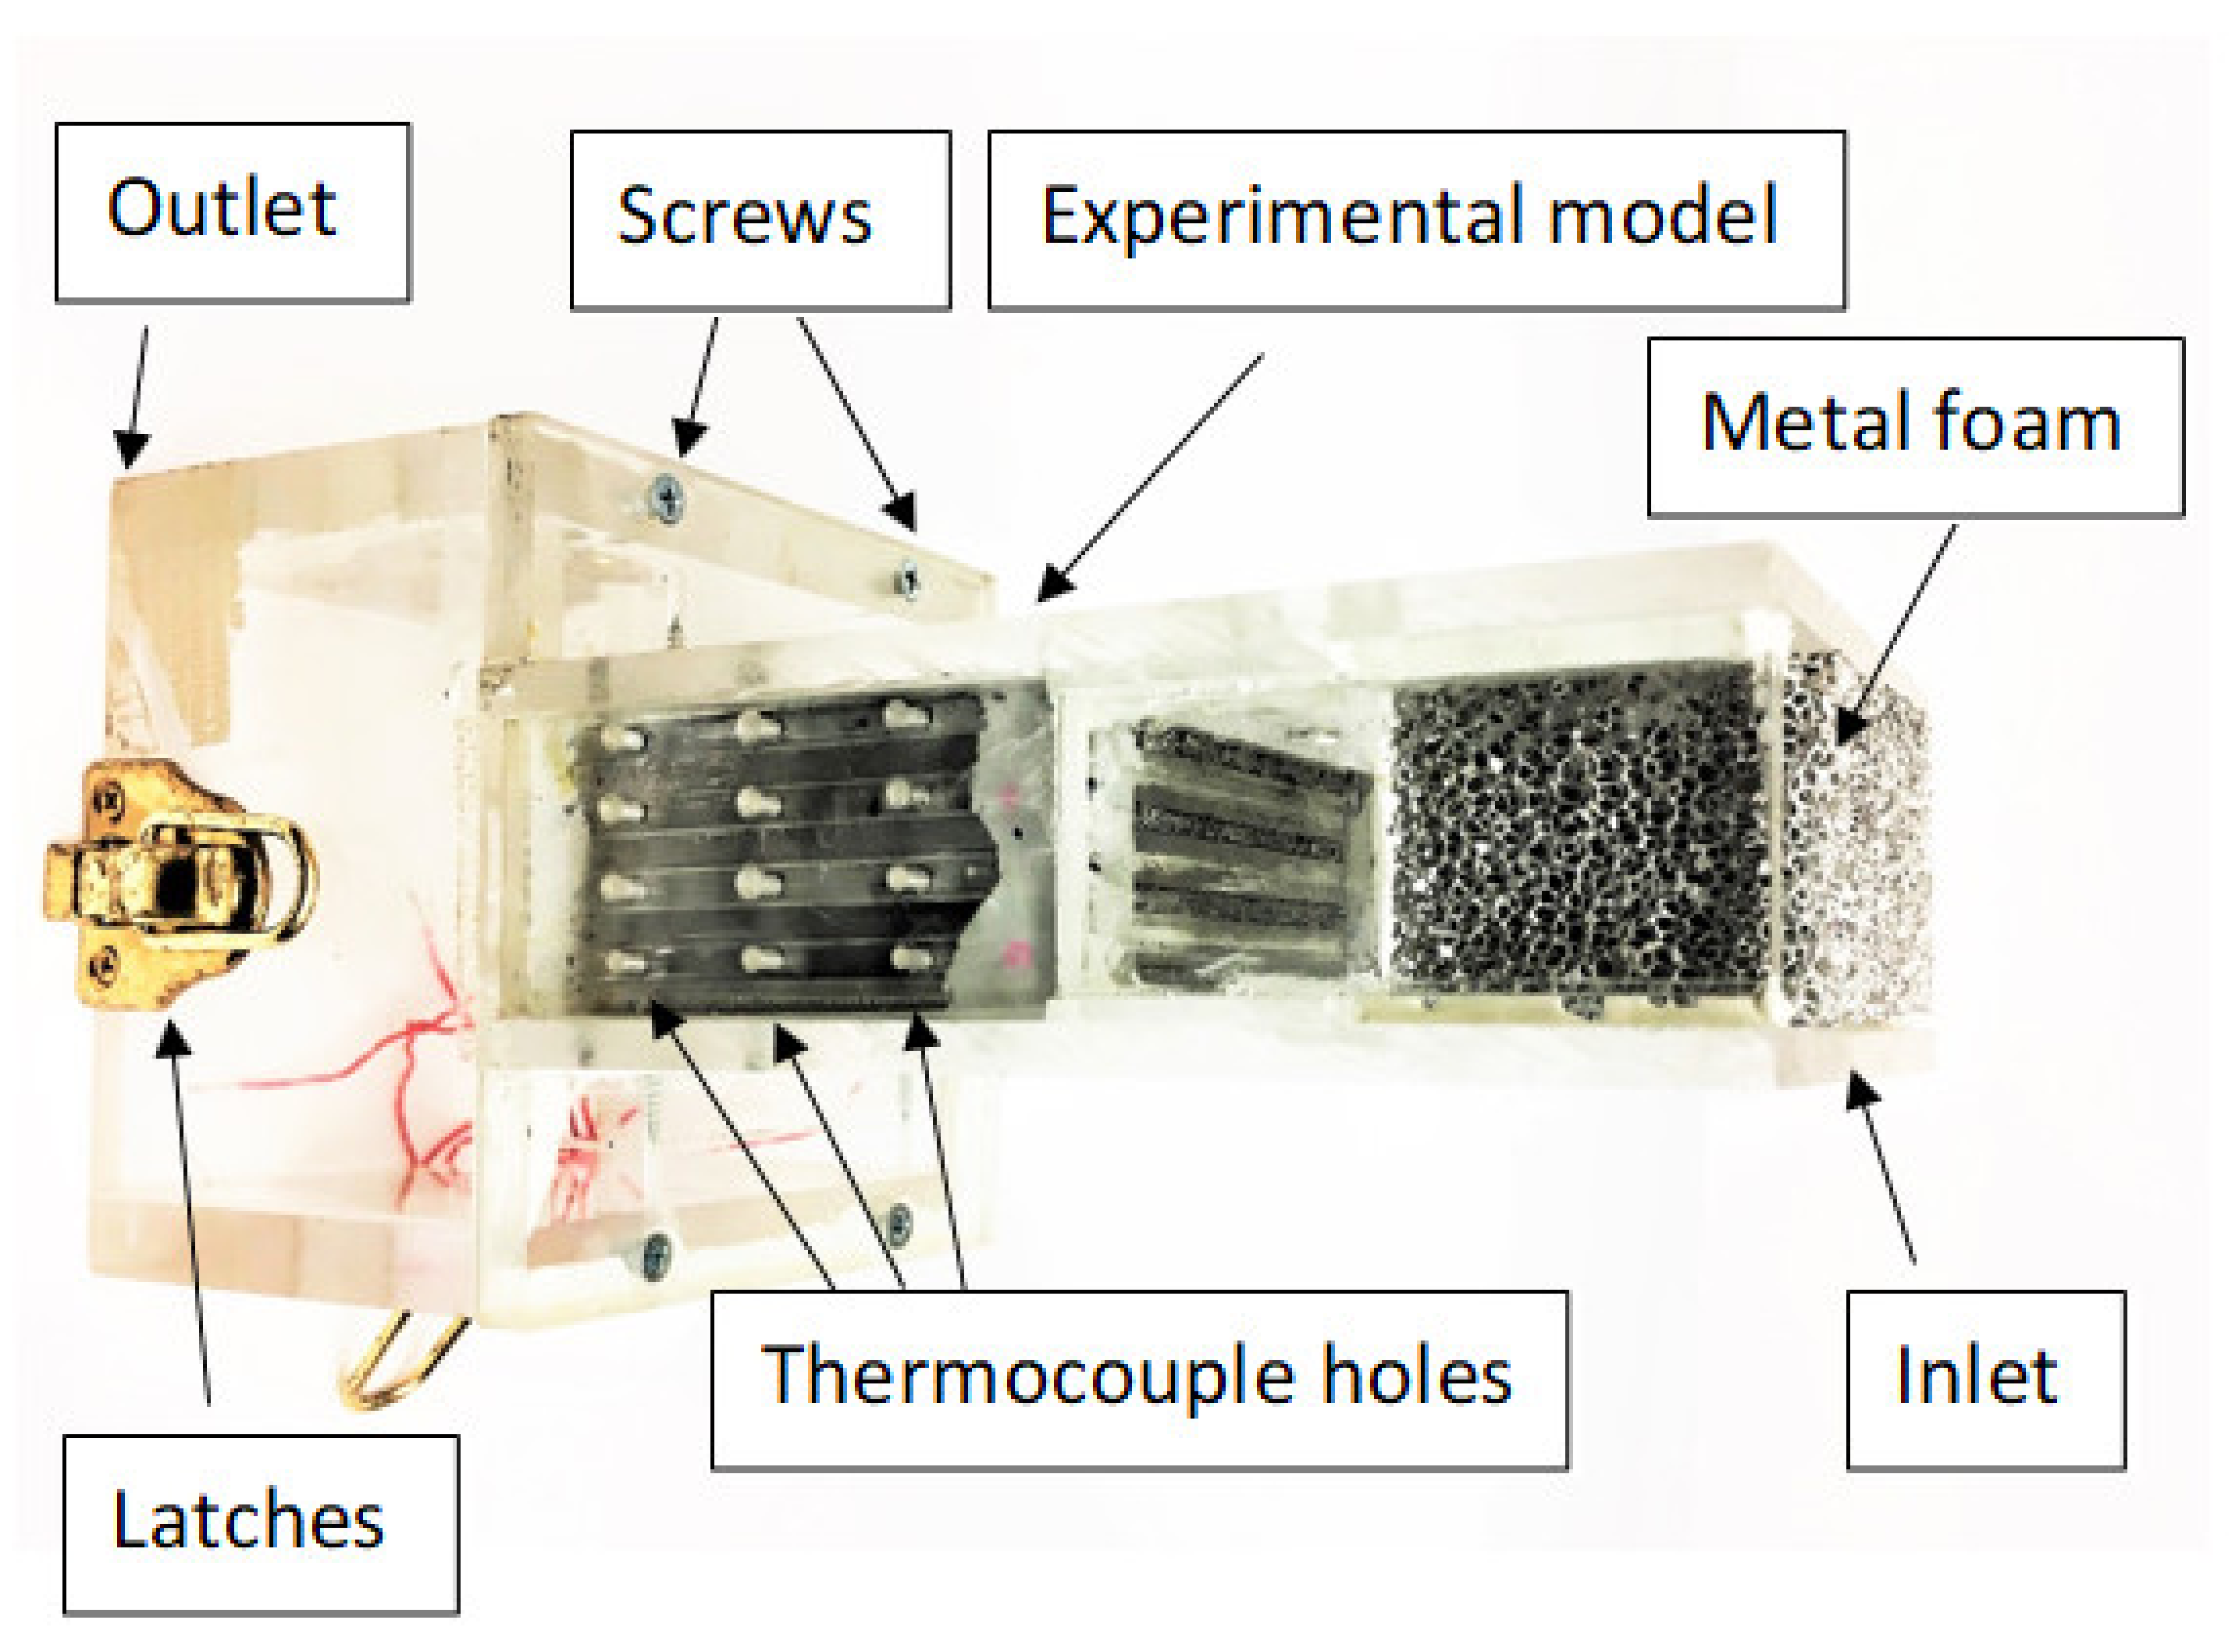
Aluminum foam having 40 ppi with a porosity of 90.3% was obtained commercially [49]. The foam needed to be mechanically compressed in order to achieve 60% porosity (same porosity as in the simulation). The compression was done according to Boomsma et al. [50]. To house the experimental model, a test section was constructed of Plexiglas pieces glued together as shown in Figure 9. The inlet of the test section had dimensions 3.98 cm × 7.62 cm (1.57 in × 3 in). In order to get a uniform velocity profile entering the experimental model (as in the simulations), a piece of metal foam was inserted into the inlet of the test section at 3.81 cm (1.5 in) from the experimental stack. The outlet of the test section was enlarged to a square cross-section of 12.50 cm in order to be connected to the inlet of a suction machine by latches. Twelve holes were drilled on the left side of the test section, through the Plexiglas, for inserting thermocouples for measuring plate temperatures at various locations, Figure 9. One other hole was drilled on the right side of the test section for heater wires.
3.3. Experimental Setup
The larger opening of the test section was connected to a suction unit (SuperFlow SF-600) to form an open-loop wind tunnel, as shown in Figure 10. A connecting duct between the inlet of the suction unit and the outlet of the test section was made of Plexiglas and measured 60 cm in length. The suction unit could force ambient air to flow through the stack model and across the tunnel. A speed controller on the suction unit was used to control air speed through the tunnel.
Beads of ready-made insulated thermocouples (type K) having a diameter of 0.08 mm were inserted in each hole from one slide of the test section. The other ends of the thermocouples were connected to a data acquisition module (Omega OMB-DAQ-56), which was connected to a computer. The module had multiple channels and could receive voltage signals from thermocouples and other transducers. A Honeywell industrial vacuum pressure transducer model PX2EG1XX001BAAAX measured absolute vacuum pressure in the range 0 to 1 bar downstream from the test section. The pressure drop through the stack model was then calculated as the difference between the vacuum pressure after the model and the atmospheric pressure at the inlet, which was practically constant during experimental runs at 98.69 kPa, approximately. A hot-wire anemometer manufactured by Kanomax was used to measure the average air speed in the tunnel. The measuring range of this device was 0.01 to 30 m/s with a resolution of 0.01 m/s and an accuracy of 0.015 m/s. This device also could measure the test section’s outlet temperature, which was within its range (−20 to 70 °C).
For each run, the suction unit was turned on, then the power input to each heater was adjusted to produce the same heat flux that was applied in the simulations (1.55 W/cm2). The average velocity through the tunnel was adjusted to the desired value by controls on the suction unit. Before recording any measurements, steady-state conditions were reached, which took 25 min, approximately. At steady state, all thermocouple readings, as well as pressures before and after the test section, were recorded. The air speed and the temperature after the test section were also recorded. The measurements were taken three times and the average was considered in the data analysis. This was repeated for various average air speeds between 0.2 and 1.6 m/s.
3.4. Measurements Error
For the thermocouples measuring the temperatures in the stack model, the error was 0.4%. The test section’s outlet air temperature was measured by the hot-wire anemometer, which had a resolution of 0.1 °C and an accuracy of ±0.5 °C. As for the pressure measurement, the pressure transducer had an error of ±2%. The root-sum-squares, Equation (22), was used to calculate the uncertainty in the pressure drop measurement [51]. A fixed error of 2% and a reading error of 0.25% were stated by the pressure transducer’s manufacturer.
where is the pressure uncertainty, is the fixed error, and is the reading error. The inlet velocity was measured by a digital nanometer. The uncertainty of 3% as a fixed error and 0.015 m/s as a reading error were reported by the device’s manufacturer. The pressure uncertainty was obtained as 2.06%, and air velocity uncertainty was calculated to be 3%.
4. Results, Comparisons, and Discussion
4.1. Local Temperatures
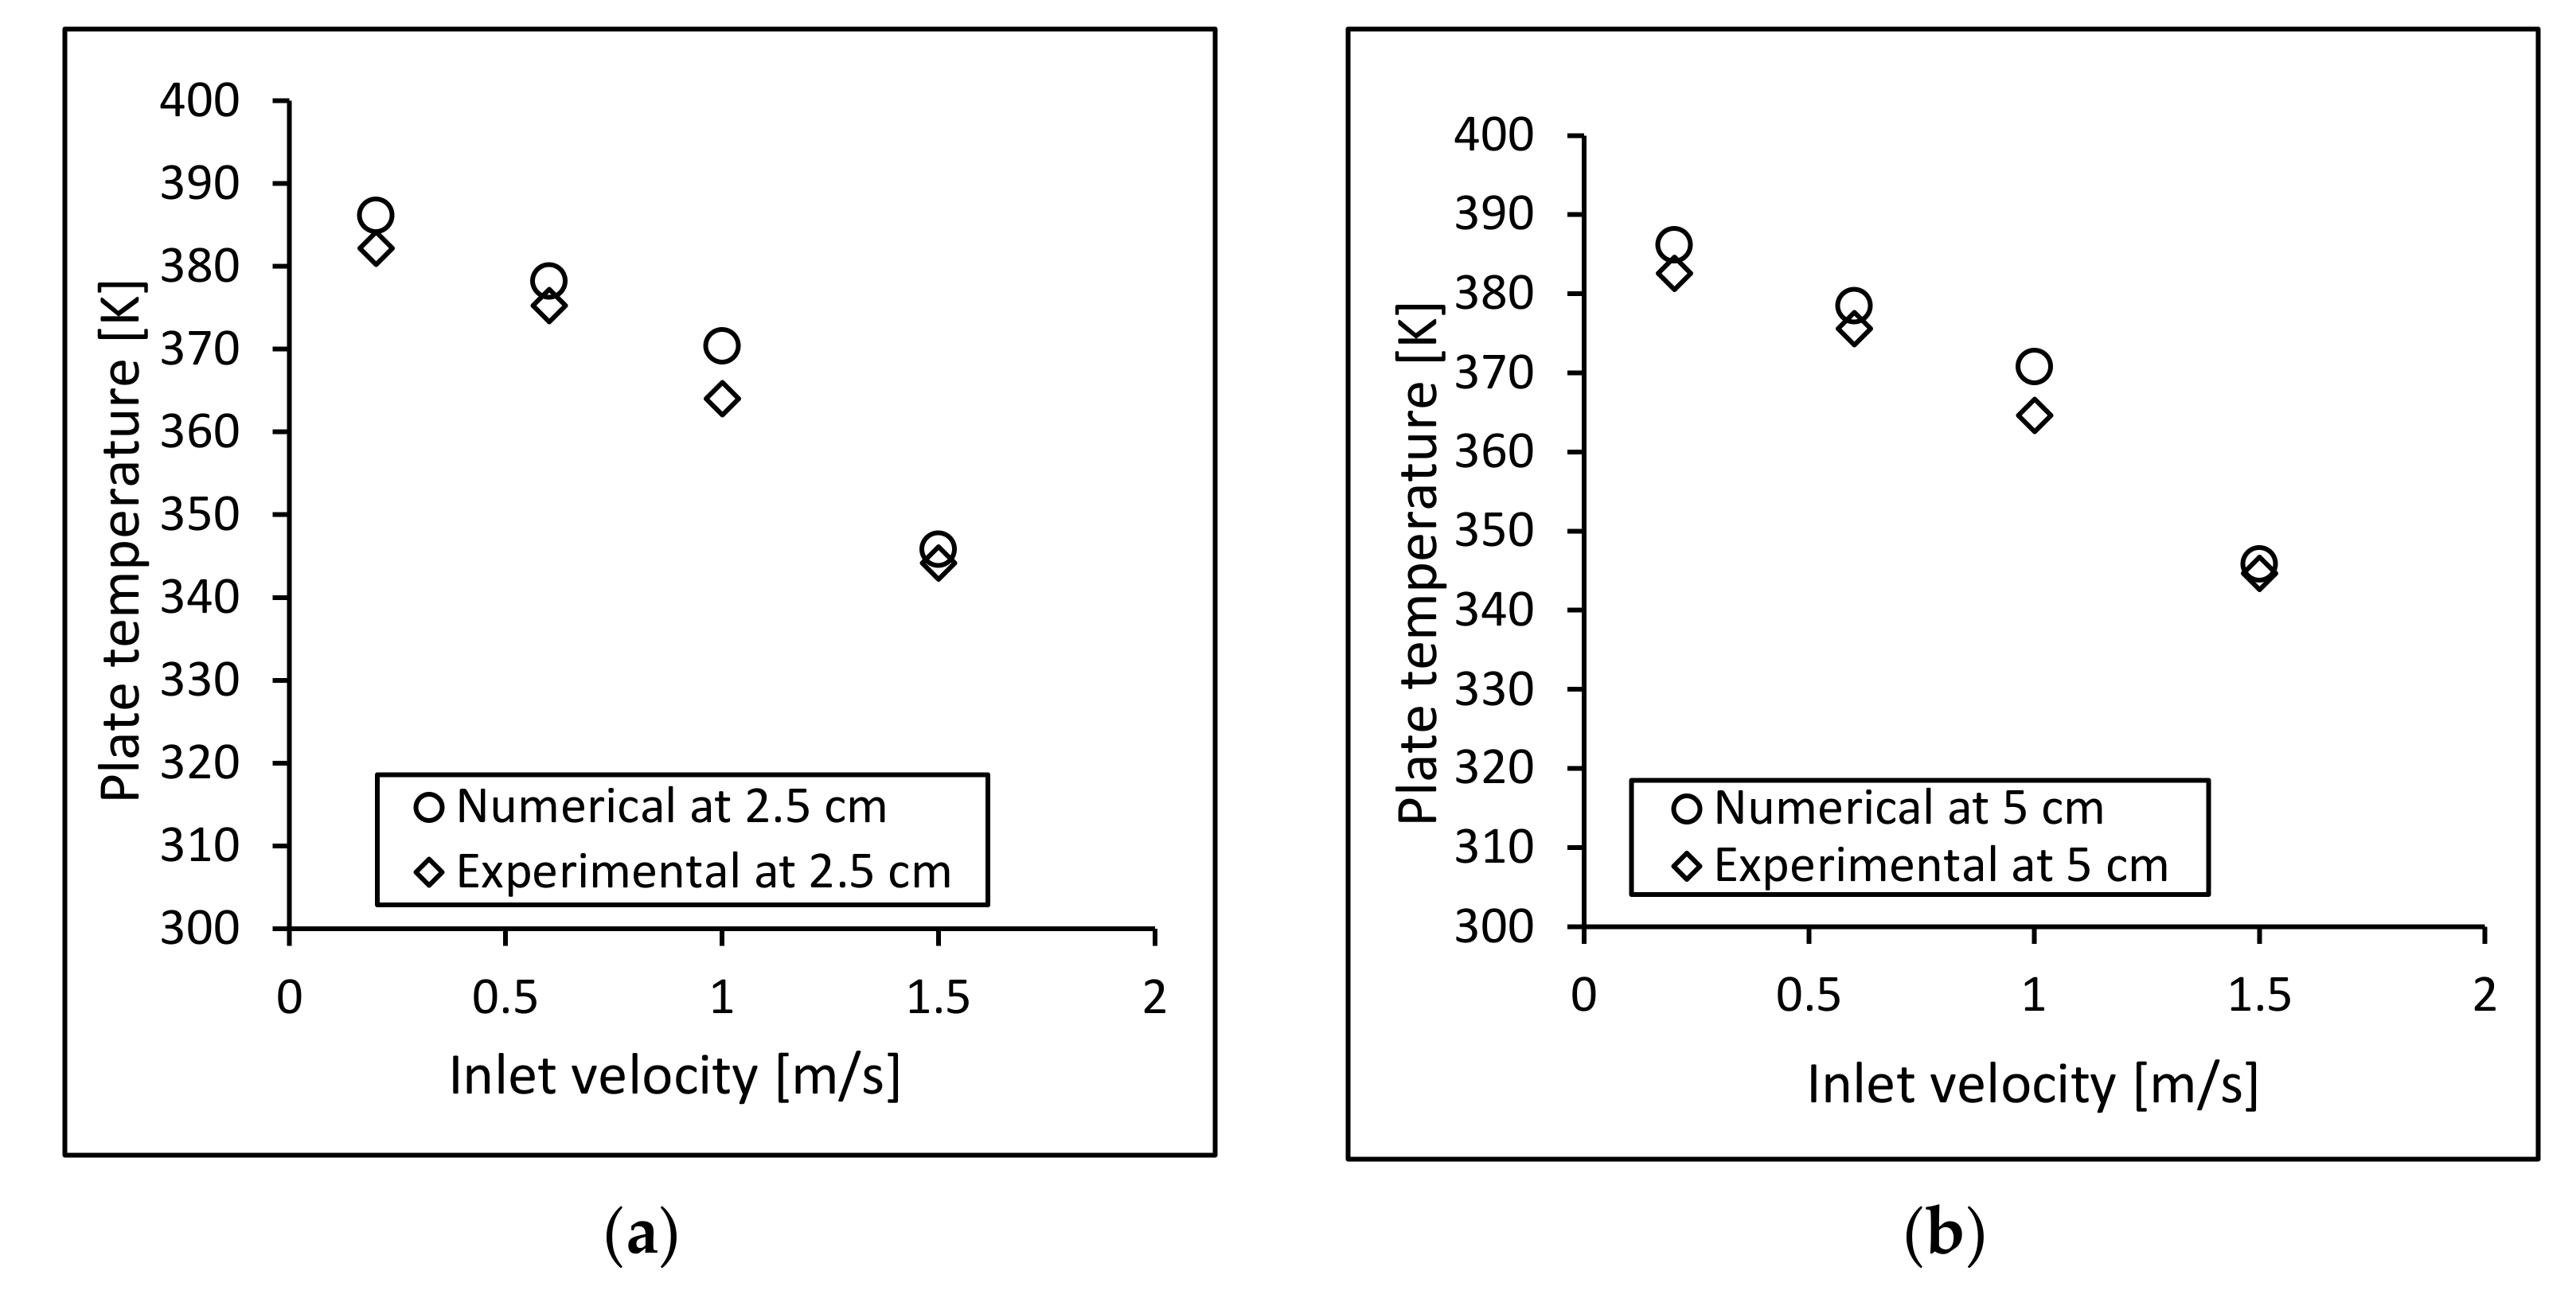
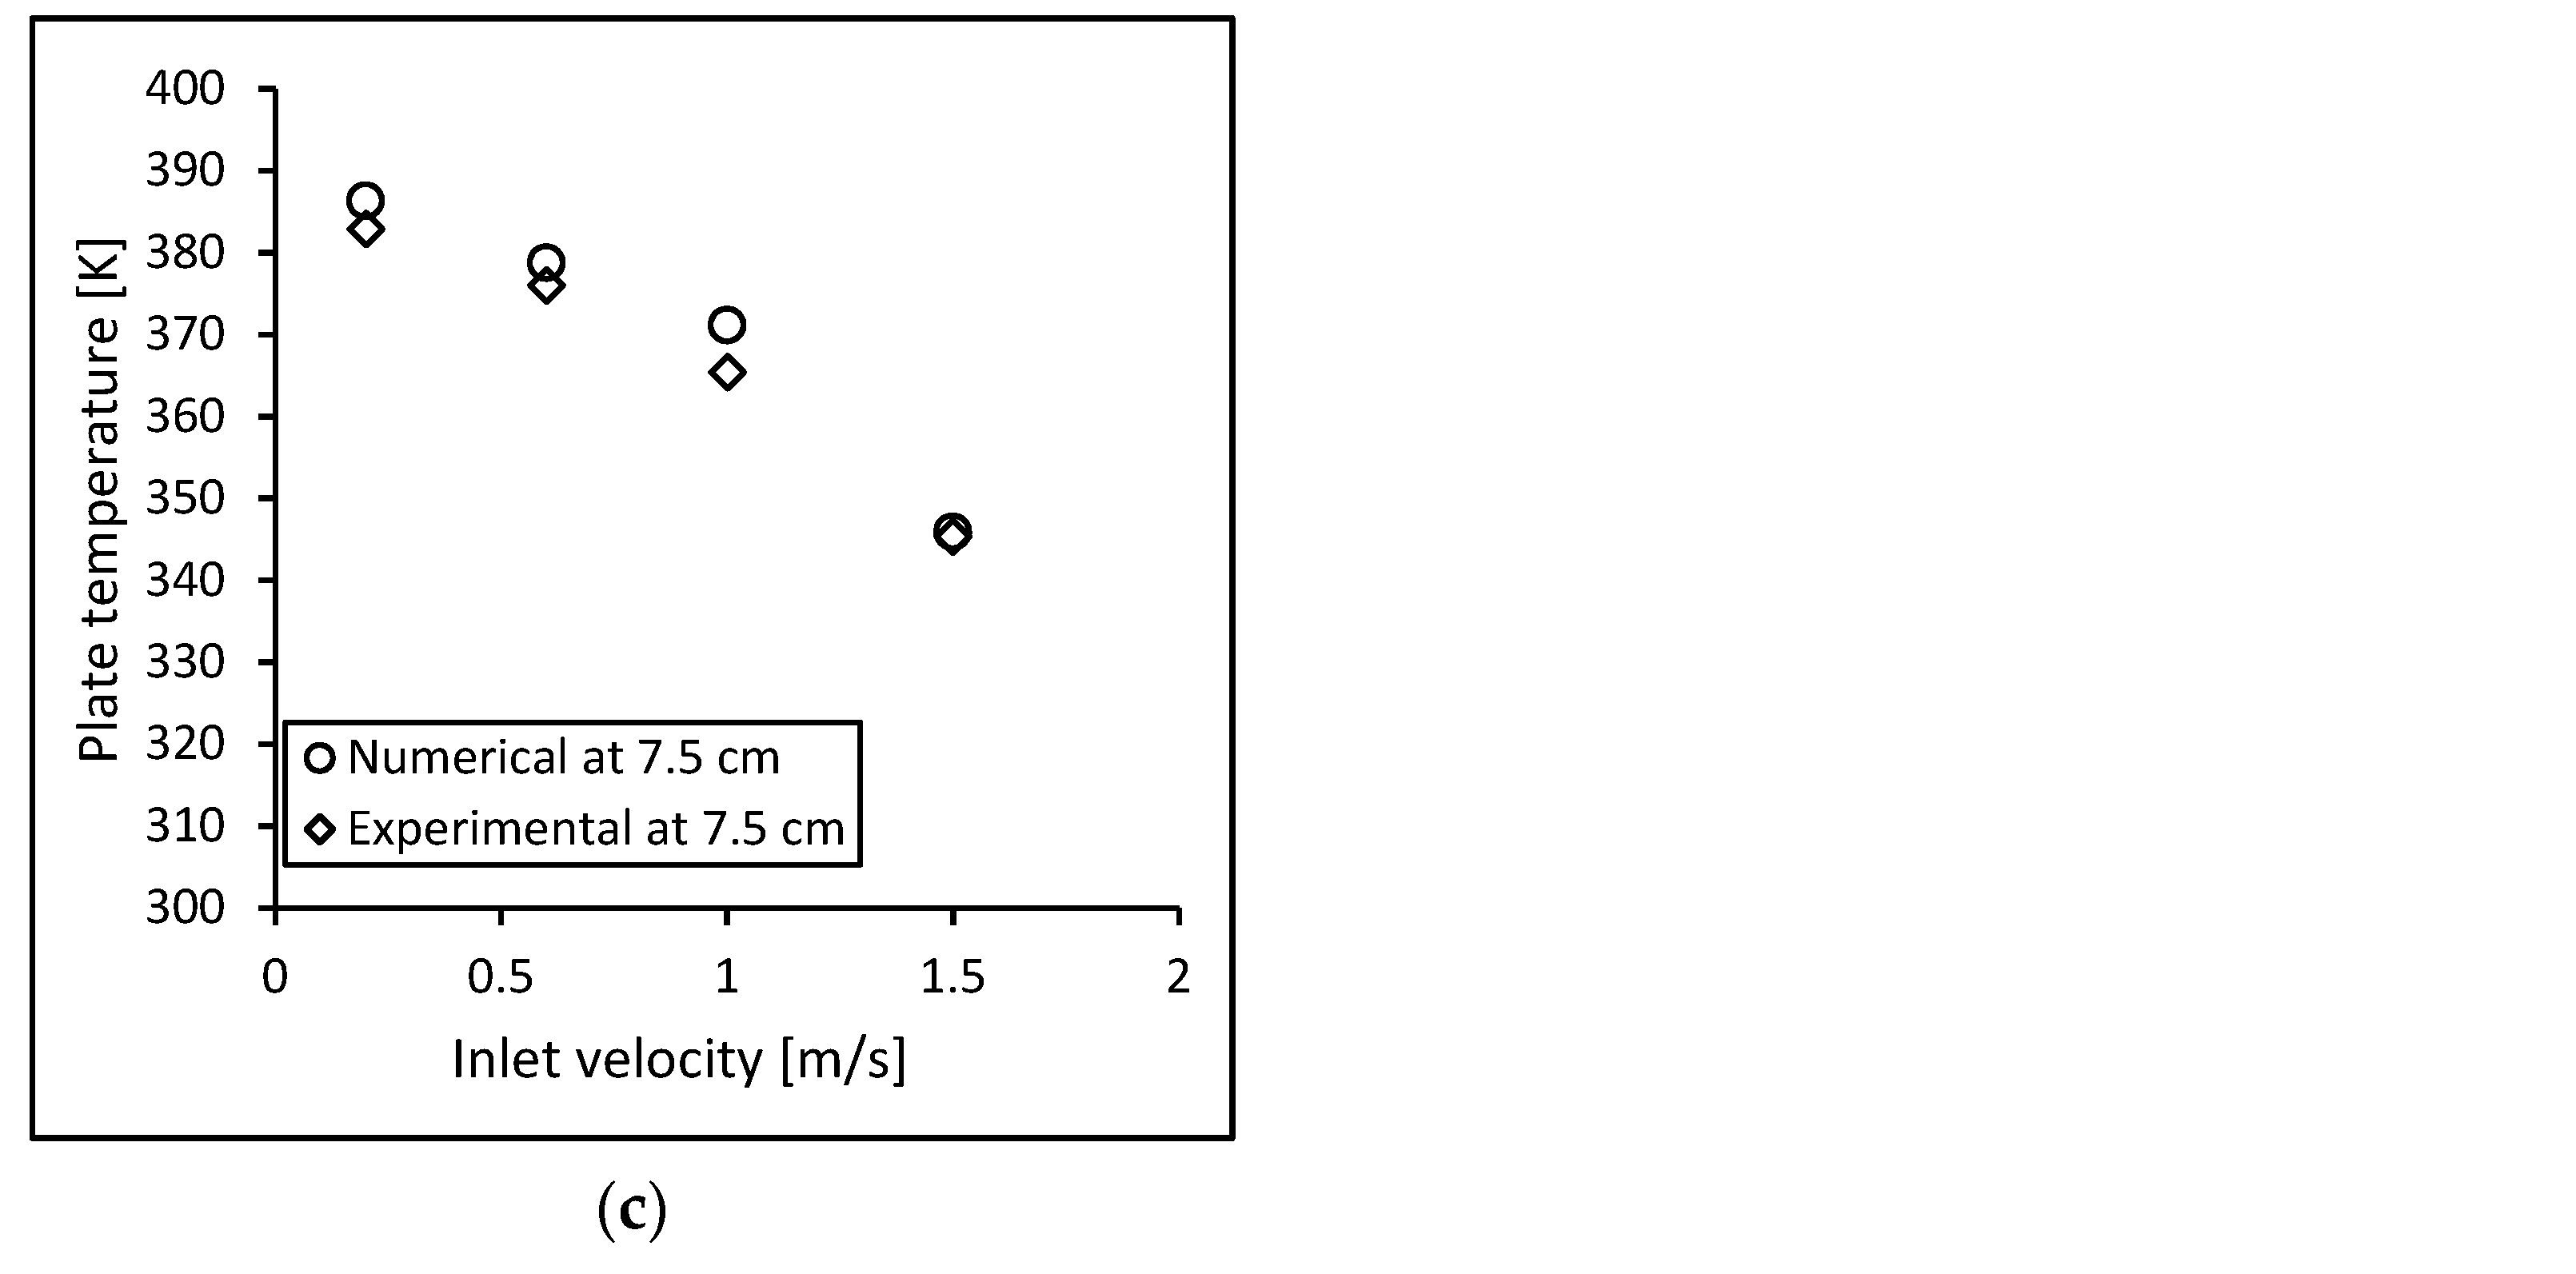
Figure 11a–c shows a comparison between the temperatures obtained experimentally and numerically. These plots are for an internal plate (plate 2), representing an internal cell in the stack. The temperatures are plotted against the inlet velocity at different axial distances from the air inlet. Part (a) is for location 2.5 cm, part (b) is for 5 cm, and part (c) is for 7.5 cm. The agreement between the numerical and experimental values for all locations is excellent. As expected, the temperature decreases as the velocity increases. This is due to the fact that the heat-transfer coefficient increases with velocity, and more heat is swept by the air from the heated plate. This is clearly shown by Equation (21) for the interstitial heat-transfer coefficient that is proportional to the Reynolds number (or the velocity) to the power 0.6. One can notice that the agreement improves as the velocity increases for all locations: the numerical and experimental temperatures for a velocity of 1.5 m/s coincide. This could be attributed to possibly better prediction of the volume-averaged porous-media model (Equations (18)–(21)) within Fluent at higher velocities, or the improved validity of the various input quantities calculated by Equations (18), (19) and (21). The temperatures at the three axial locations are about the same because of the efficient cooling of metal foam, and because of the relatively short length of the model in the flow direction (10 cm).
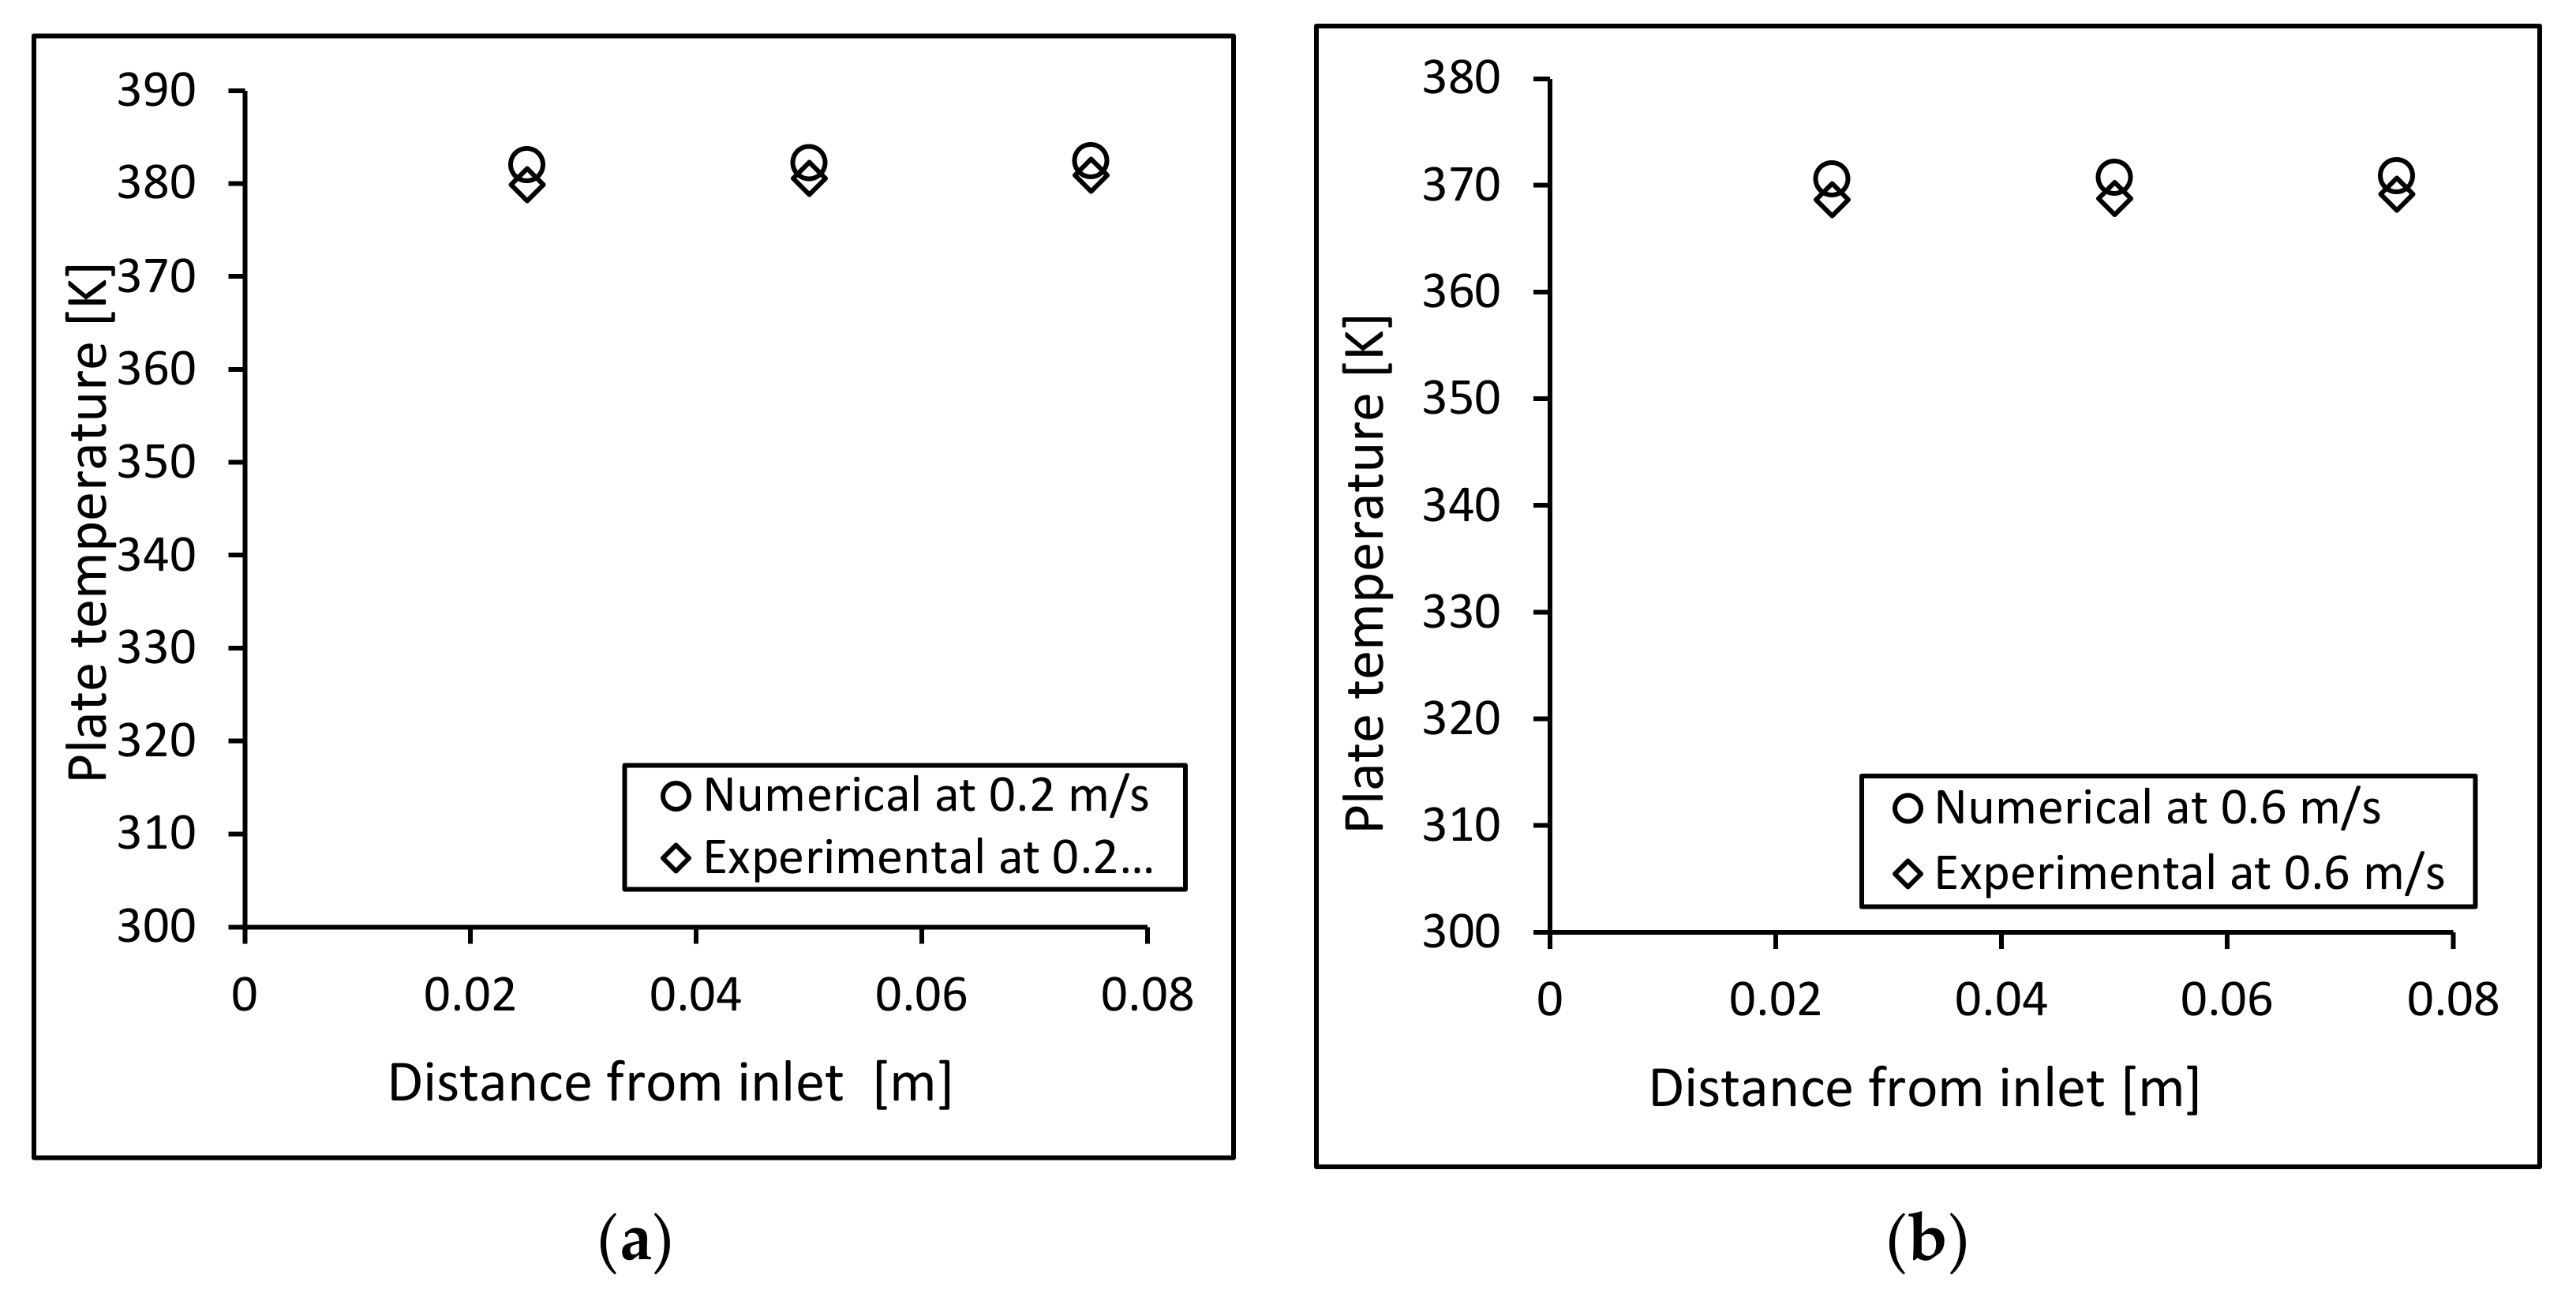
Figure 12 shows that the general behavior of the local temperature for an end plate is similar to that of an internal plate, meaning that the local temperature increases in the flow direction since the air heats up as it travels through the foam. In addition, the agreement between the experimental and numerical temperatures is very good, especially for the lower velocities 0.2 and 0.6 m/s (Figure 12a,b). For the higher velocity of 1 m/s, part (c) of the figure, there is a little difference between the experimental and numerical temperatures, with the numerical analysis over-predicting the local plate temperatures. As expected, the local temperature decreases as the velocity increases due to increased convection rates at higher velocities. The temperature value for an end plate is lower than that of an internal plate because an end plate is heated from one side only.
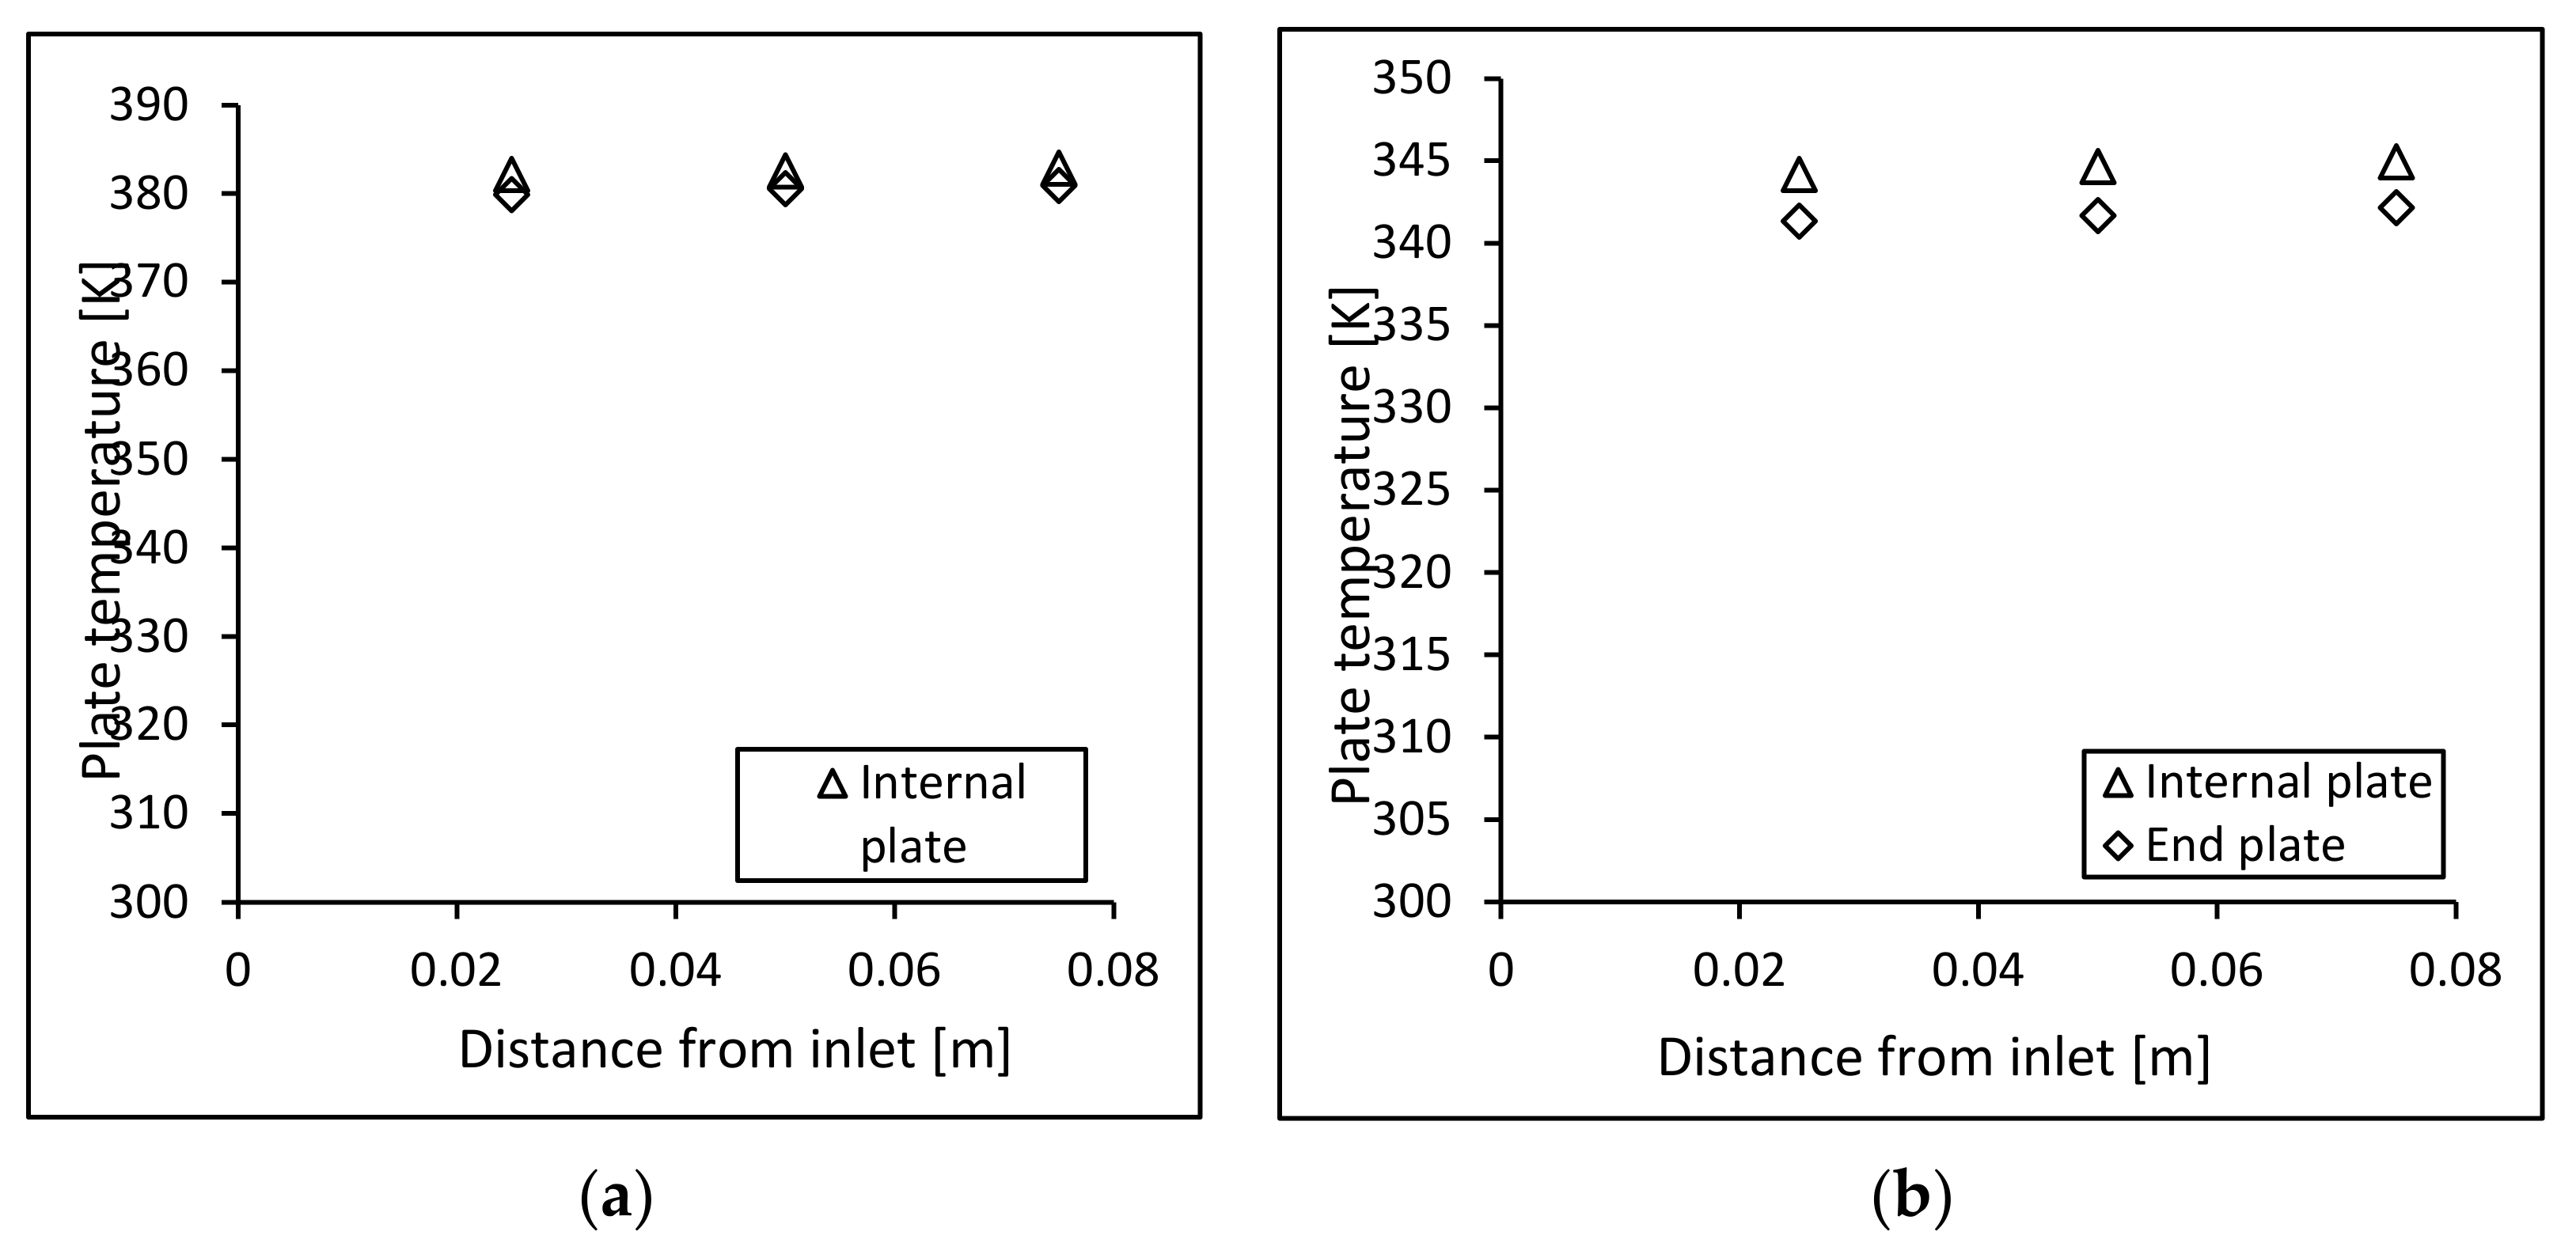
A useful comparison from a practical point of view is between internal and external plate temperatures. Such a comparison is shown in Figure 13; part (a) is for the low air velocity of 0.2 m/s, while part (b) is for 1.5 m/s. For the low velocity of 0.2 m/s, the internal and external plates have practically identical temperatures at the three locations along the flow direction. The temperature increases in the flow direction, as the air absorbs heat from the heated plates. For the high velocity of 1.5 m/s, the internal and external plate temperatures are close to each other, but there is a noticeable difference between them, as shown in part b of Figure 13. The internal plate temperature is slightly higher. This means that no special design is needed for an external cell in terms of cooling.
4.2. Pumping Power
The numerical and experimental results of the pressure drop were used to calculate the pumping power. Equation (23) was used to calculate the pumping power:
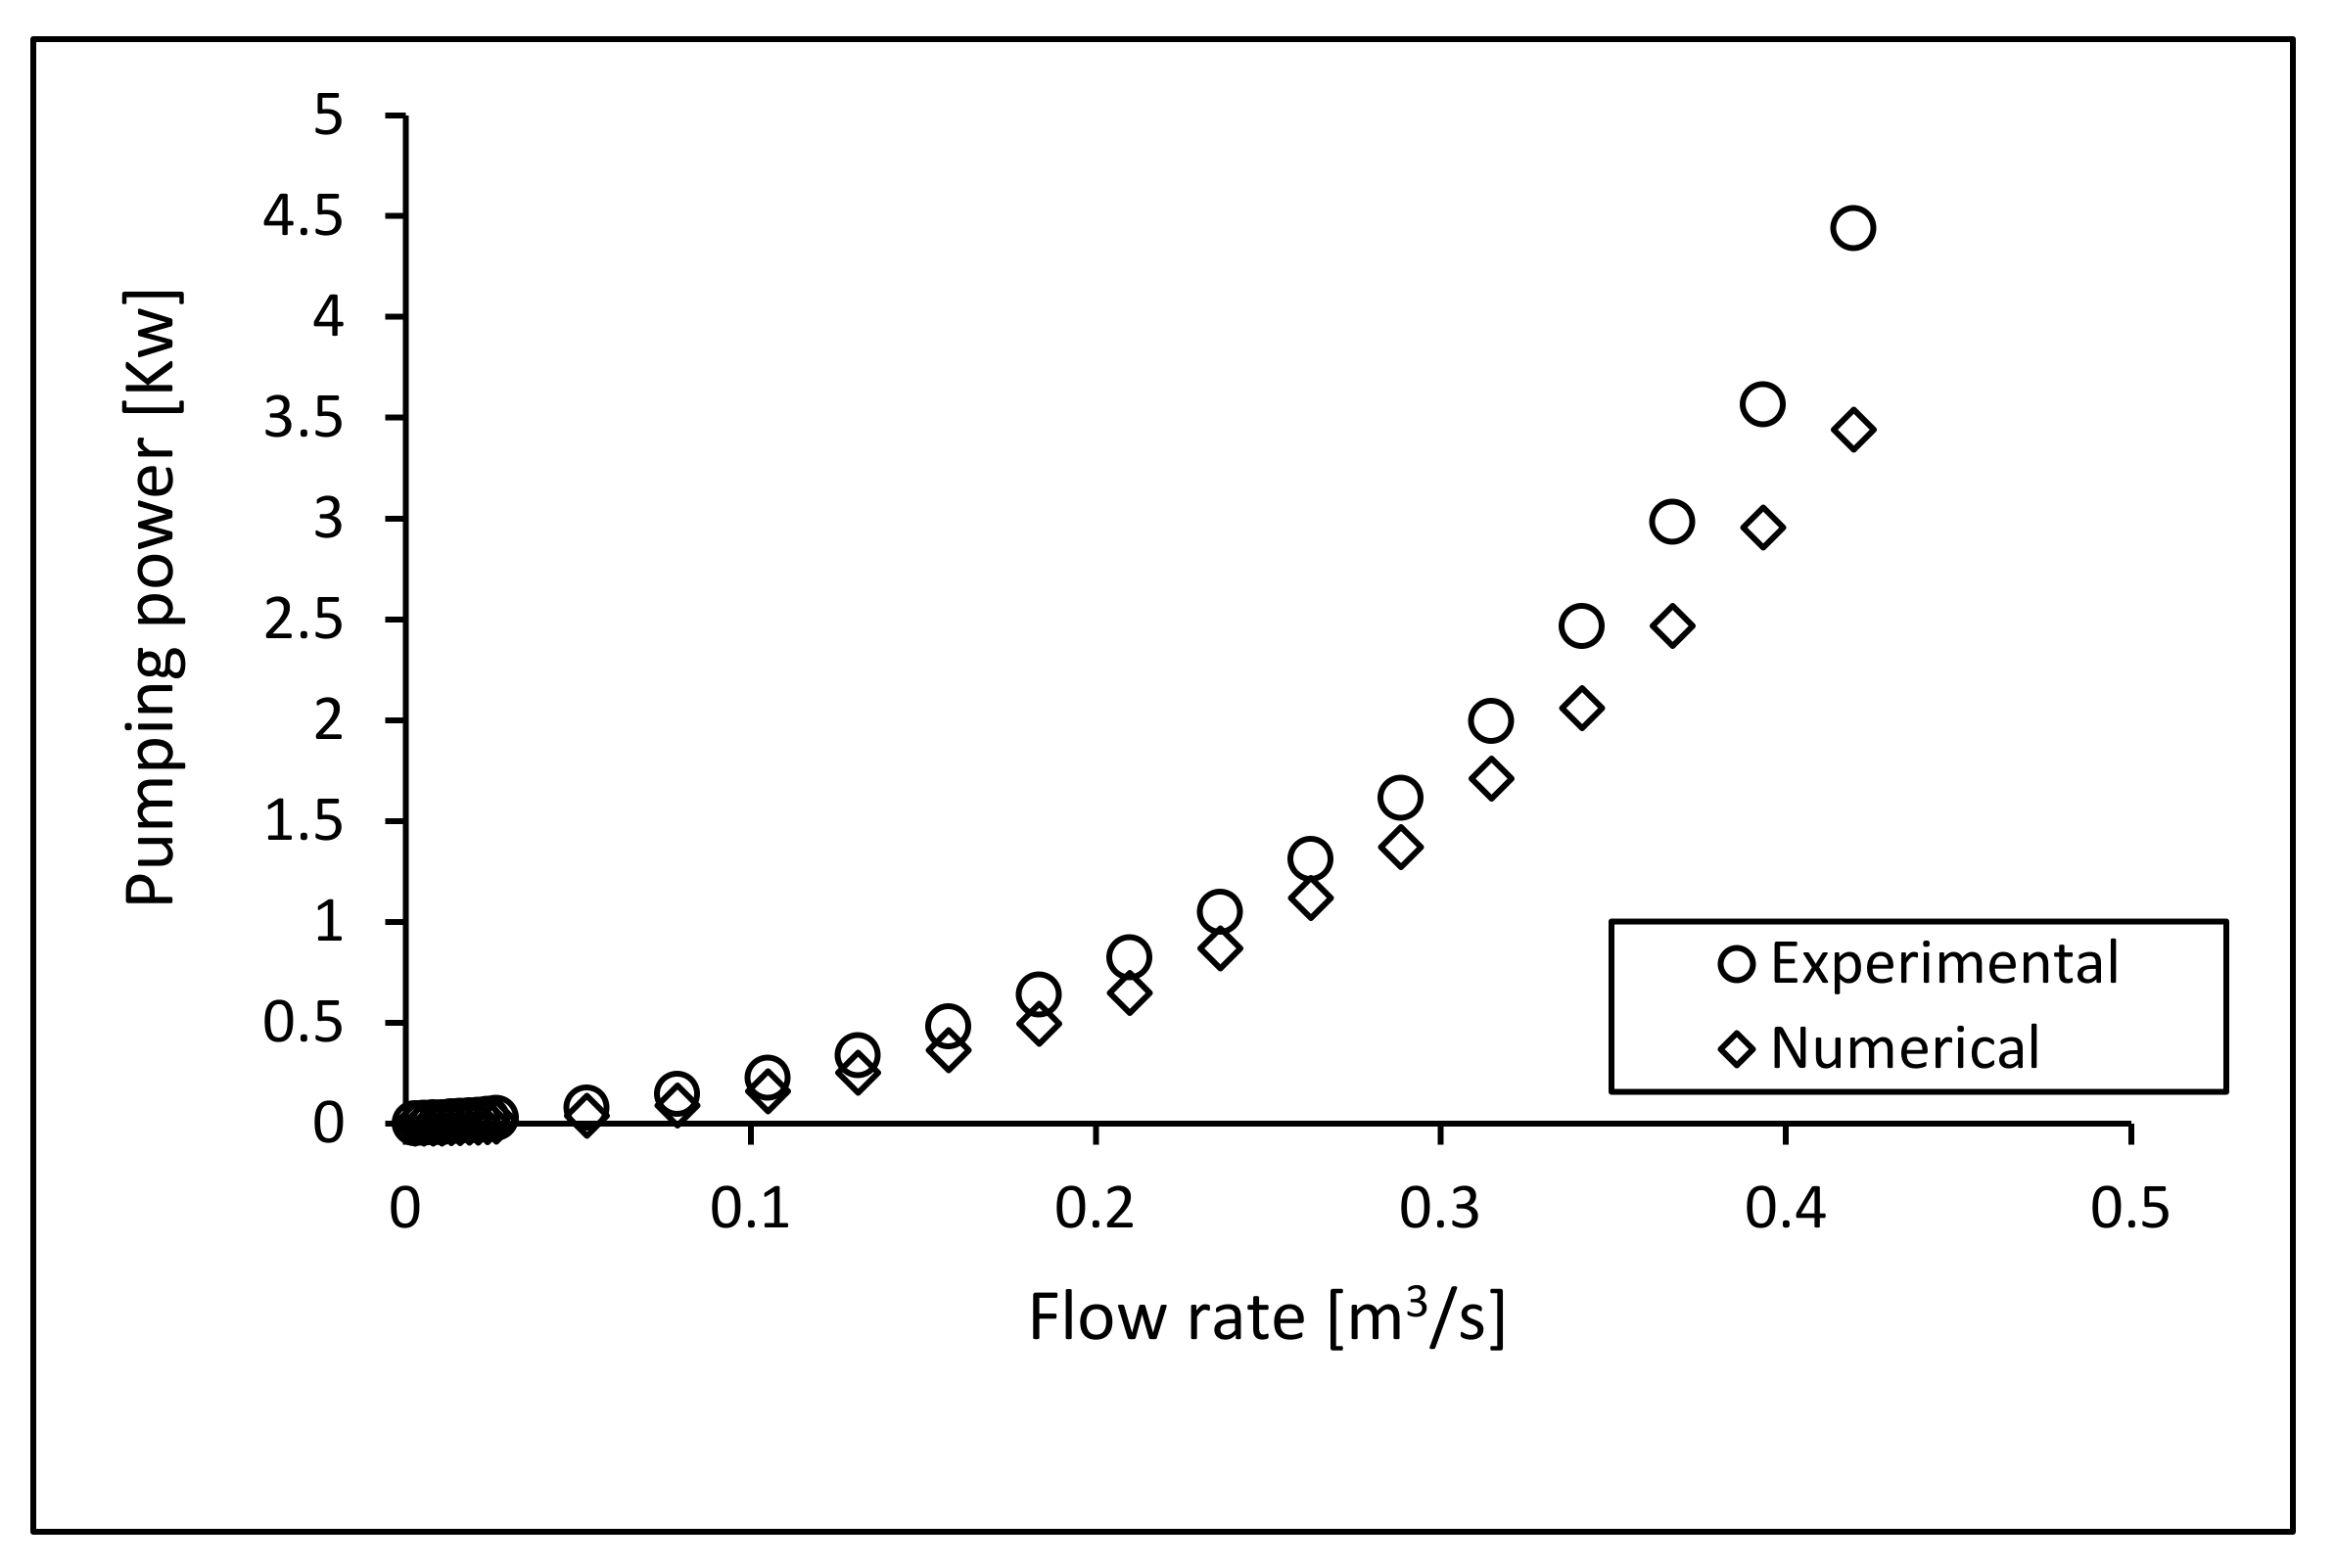
where represents the pumping power in watts needed to pump the air through the cooling system, is the volumetric flow rate across the foam (m3/s), and is the pressure drop between inlet and outlet (Pa). Figure 14 has a comparison between the numerical and experimental pumping power needed to force air to flow through the foam channels. As shown in the figure, the pumping power is low at low flow rates. Increasing the flow rate of the air substantially increases the pumping power. While experimental and numerical curves have the same behavior, the numerical result shows a lower trend. The considerable difference warrants some explanation.
Considering the inputs for the reciprocal of the permeability and the Iner.Resis that were calculated by Equations (18) and (19) then entered into ANSYS-CFD, one realizes that these two terms are based on Ergun’s correlation [52]. It is likely that the Ergun equation is not applicable to metal foam, especially because of the vast geometrical difference between the foam’s structure and that of packed spheres, for which the correlation was developed. The disagreement between the pressure drop in the foam obtained experimentally, and calculated numerically by applying Ergun’s equation, is expected to be larger in the form drag term. Thus, the difference will increase with increasing air velocity through the foam, since the form drag is a strong function of velocity. These trends are reflected in the pumping power as shown in Figure 14. The maximum difference in pumping power as predicted by ANSYS-CFD and as obtained experimentally reached 22.4% at the highest velocity of 1.6 m/s. The end-user of ANSYS-CFD does not seem to have provisions to alter the way this package calculates pressure drop for metal foam.
5. Conclusions
A new design for cooling fuel-cell stacks was examined numerically and experimentally. The design employs metal foam in flow channels for air cooling. The purpose of the foam was to increase the surface area available for heat transfer. The commercial aluminum foam that was used had 40 pores per linear inch and a porosity of 60%. This low porosity was achieved by mechanical compression. Air speeds were in the range of 0.1–1.6 m/s. In the simulation, the local thermal nonequilibrium model was utilized. The cooling design mimics that of commercial PEM fuel-cell stacks having three cells. The heat dissipated by the cells was represented by heaters that provided constant heat flux. The local temperature in the flow direction for both internal and end plates was obtained. The required pumping power across the metal foam was also determined. The new cooling system could remove the 500 watts of waste heat generated by the stack, keeping the stack within the safe range of operating temperatures of 60–90 °C. The numerical and experimental temperatures agreed very well at low velocities, with the small difference between them becoming greater for high velocities. As expected, the temperature decreased as the velocity increased. The temperature value for an end plate was lower than that of an internal plate because an end plate was heated from one side. However, the internal and external plates’ temperatures were generally close to each other. This means that no special design is needed for an external cell in terms of cooling. ANSYS-CFD employs the Ergun equation for entering the viscous and form drags and calculating the pressure drop through the foam. This correlation is not applicable to metal foam, and thus ANSYS-CFD pressure drop (and thus pumping power) predictions can significantly be different from experimental values. This calls for considering more appropriate correlations for pressure drop in metal foam to be used in ANSYS-CFD. In general, the results suggest that the design can be used for cooling fuel-cell stacks for a reasonable pumping power. The thickness of the metal-foam-filled cooling channels can possibly be reduced, which should be investigated in the future. Moreover, including the actual electro–chemical performance of the fuel-cell stack in the modeling would be a logical next step for verifying the efficacy of this proposed cooling design.
Author Contributions
Conceptualization, N.D; methodology, N.D; software, A.A.H.; validation, A.A.H.; formal analysis, A.A.H.; investigation, A.A.H.; resources, N.D.; data curation, A.A.H.; writing—original draft preparation, A.A.H.; writing—review and editing, N.D.; visualization, A.A.H.; supervision, N.D.; project administration, N.D.; funding acquisition, N.D. All authors have read and agreed to the published version of the manuscript.
Funding
This research received no external funding.
Institutional Review Board Statement
Not applicable.
Informed Consent Statement
Not applicable.
Data Availability Statement
The data presented in this study are available in this article.
Acknowledgments
The authors received generous technical support from Robert Burke for which the authors are thankful.
Conflicts of Interest
The authors declare no conflict of interest.
References
- Kumar, A.; Reddy, R.G. Polymer electrolyte membrane fuel cell with metal foam in the gas flow-filed of bipolar/end plates. J. New Mater. Electrochem. Syst. 2003, 6, 231–236. [Google Scholar]
- EG&G Services Parsons Inc. Fuel Cell Handbook, 5th ed.; US Department of Energy, Office of Fossil Energy, National Energy Technology Laboratory: Morgantown, WV, USA, 2000.
- Boyd, B.; Hooman, K. Air-cooled micro-porous heat exchangers for thermal management of fuel cells. Int. Commun. Heat Mass Transf. 2012, 39, 363–367. [Google Scholar] [CrossRef]
- Kusie, J.; Knight, J.; Morton, J. News Release; Ministry of Transportation and Infrastructure: Coquitlam, BC, Canada, 2010. [Google Scholar]
- Enache, S.; Petreanu, I.; Pătularu, L.; Ebrasu, D.; Schitea, D.; Varlam, M. On the road to high performance PEM fuel cells for portable applications. Prog. Cryog. Isot. Sep. 2014, 17, 73–80. [Google Scholar]
- Carton, J.G.; Olabi, A.G. Design of experiment study of the parameter that affect performance of three flow plate configuration of proton exchange membrane fuel cell. Energy 2010, 35, 2796–2806. [Google Scholar] [CrossRef] [Green Version]
- Carton, J.G.; Olabi, A.G. Representative model and flow characteristics of open pore cellular foam and potential use in proton exchange membrane fuel cells. Int. J. Hydrogen Energy 2015, 40, 5726–5738. [Google Scholar] [CrossRef] [Green Version]
- Alaswad, A.; Baroutaji, A.; Achour, H.; Carton, J.; Al Makky, A.; Olabi, A.G. Developments in fuel cell technologies in the transport sector. Int. J. Hydrogen Energy 2016, 3, 164. [Google Scholar] [CrossRef] [Green Version]
- Carney, D. Fuel Cell Futures, no longer a dream. ASE Automot. Eng. 2015, 14–21. Available online: https://www.sae.org/news/2015/10/fuel-cell-futures-no-longer-a-dream (accessed on 5 January 2021).
- Parajón-Costa, B.S.; Wagner, C.C.; Baran, E.J. Fuel cell handbook. Z. Anorg. Allg. Chem. 2003, 629, 1085–1090. [Google Scholar] [CrossRef]
- Shahsavari, S. Thermal Analysis of Air-Cooled Fuel Cells. Ph.D. Thesis, School of Engineering Science, Simon Fraiser University, Burnaby, BC, Canada, 2011. [Google Scholar]
- Zhang, G.; Kandlikar, S. A critical review of cooling techniques in proton exchange membrane fuel cell stacks. Int. J. Hydrogen Energy 2012, 37, 2412–2429. [Google Scholar] [CrossRef]
- Hashmi, S.M.H. Cooling Strategies for PEM FC Stacks. Ph.D. Thesis, Von der Fak. Maschinenbau der Helmut-Schmidt-Universität, Hamburg, Germany, 2010. [Google Scholar]
- Fly, A. Thermal and Water Management of Evaporatively Cooled Fuel Cell Vehicles. Ph.D. Thesis, Loughborough University, Loughborough, UK, 2015. [Google Scholar]
- Dukhan, N. Metal Foam: Fundamentals and Applications; DEStech Publications: Lancaster, PA, USA, 2013. [Google Scholar]
- Hontanon, E.; Escudero, M.J.; Bautista, C.; Garcia-Ybarra, P.L.; Daza, L. Optimization of flow field in PEMFC using computational fluid dynamics techniques. J. Power Sources 2000, 86, 363–368. [Google Scholar] [CrossRef]
- Gamburzev, S.; Appleby, A.J. Recent performance improvement of the proton exchange membrane fuel cell (PEMFC). J. Power Sources 2002, 107, 5–12. [Google Scholar] [CrossRef]
- Birgersson, E.; Vynnycky, M. A quantitative study of the effect of flow-distributor geometry in the cathode of a PEM fuel cell. J. Power Sources 2006, 153, 76–88. [Google Scholar] [CrossRef]
- Tseng, C.J.; Tsai, B.T.; Liu, Z.S.; Chang, T.C.; Chang, W.C.; Lo, S.K. A PEM fuel cell with metal foam as flow distributor. Energy Convers. Manag. 2012, 62, 14–21. [Google Scholar] [CrossRef]
- Baroutaji, A.; Carton, J.G.; Stokes, J.; Olabi, A.G. Design and development of proton exchange membrane fuel cell using open pore cellular foam as flow plate material. J. Energy Chall. Mech. 2014, 17, 95–102. [Google Scholar]
- Wilberforce, T.; Al Makky, A.; Baroutaji, A.; Sambi, R.; Olabi, A.G. Computational fluid dynamic simulation and modelling (CFX) of flow plate in PEM fuel cell using aluminum open cellular foam material. In Proceedings of the IEEE Texas Power and Energy Conference, College Station, TX, USA, 9–10 February 2017. [Google Scholar] [CrossRef]
- Wilberforce, T.; Al Makky, A.; Baroutaji, A.; Sambi, R.; Olabi, A.G. Optimization of bipolar plate through computational fluid dynamic simulation and modelling using nickel open pore cellular foam material. Renew. Energy Power Qual. J. 2017, 1, 886–892. [Google Scholar] [CrossRef]
- Kumar, A.; Reddy, R.G. Materials and design development for bipolar/end plates in fuel cells. J. Power Sources 2004, 129, 62–67. [Google Scholar] [CrossRef]
- Awin, Y.; Dukhan, N. Experimental Performance Assessment of Metal-Foam Flow Fields for PEM Fuel Cells. Appl. Energy 2019, 252, 113458. [Google Scholar] [CrossRef]
- Mancin, S.; Zilio, C.; Cavallini, A.; Rossetto, L. Heat transfer during air flow in aluminum foams. Int. J. Heat Mass Transf. 2010, 53, 4976–4984. [Google Scholar] [CrossRef]
- Mancin, S.; Zilio, C.; Diani, A.; Rossetto, L. Air forced convection through metal foams: Experimental results and modeling. Int. J. Heat Mass Transf. 2013, 62, 112–123. [Google Scholar] [CrossRef]
- Cirillo, L.; Manca, O.; Marinelli, L.; Nardini, S. Experimental investigation on compact heat exchanger in Aluminum foam. In Proceedings of the ASME 2015 International Mechanical Engineering Congress and Exposition, Houston, TX, USA, 13–19 November 2015. IMECE2015-53218. [Google Scholar]
- Iasiello, M.; Cunsolo, S.; Bianco, N.; Chiu, W.K.; Naso, V. Developing thermal flow in open-cell foam. Int. J. Therm. Sci. 2017, 111, 129–137. [Google Scholar] [CrossRef]
- Orihuela MD, P.; Anuar, F.S.; Abdi, I.A.; Odabaee, M.; Hooman, K. Thermohydraulics of a metal foam-filled annulus. Int. J. Heat Mass Transf. 2018, 117, 95–106. [Google Scholar] [CrossRef]
- Liu, H.; Yu, Q.; Qu, Z.; Yang, R. Simulation and analytical validation of forced convection inside open-cell metal foams. Int. J. Therm. Sci. 2017, 111, 234–245. [Google Scholar] [CrossRef]
- Bai, M.; Chung, J. Analytical and numerical prediction of heat transfer and pressure drop in open-cell metal foams. Int. J. Therm. Sci. 2011, 50, 869–880. [Google Scholar] [CrossRef]
- Iasiello, M.; Cunsolo, S.; Oliviero, M.; Harris, W.M.; Bianco, N.; Chiu, W.K.; Naso, V. Numerical analysis of heat transfer and pressure drop in metal foams for different morphological models. J. Heat Transf. 2014, 136, 11260. [Google Scholar] [CrossRef]
- Jafarizade, A.; Panjepour, M.; Meratian, M.; Emami, M.D. Numerical Simulation of Gas/Solid Heat Transfer in Metallic Foams: A General Correlation for Different Porosities and Pore Sizes. Transp. Porous Media 2019. [Google Scholar] [CrossRef]
- Kuwahara, F.; Shirota, M.; Nakayama, A. A numerical study of interfacial convective heat transfer coefficient in two-energy equation model for convection in porous media. Int. J. Heat Mass Transf. 2001, 44, 1153–1159. [Google Scholar] [CrossRef]
- Mahdi, M.; Sepehr, H.; Siavashi, M.M. Battery thermal management with thermal energy storage composites of PCM, metal foam, fin and nanoparticle. J. Energy Storage 2020, 28. [Google Scholar] [CrossRef]
- Mashayekhi, M.; Houshfar, E.; Ashjaee, M. Development of hybrid cooling method with PCM and Al2O3 nanofluid in aluminium minichannels using heat source model of Li-ion batteries. Appl. Therm. Eng. 2020, 187. [Google Scholar] [CrossRef]
- Valizade, M.; Heyhat, M.; Maerefat, M. Experimental study of the thermal behavior of direct absorption parabolic trough collector by applying copper metal foam as volumetric solar absorption. Renew. Energy 2020, 145, 261–269. [Google Scholar] [CrossRef]
- Peng, H.; Li, M.; Liang, X. Thermal-hydraulic and thermodynamic performance of parabolic trough solar receiver partially filled with gradient metal foam. Energy 2020, 211. [Google Scholar] [CrossRef]
- Guarino, S.; Di Ilio, G.; Venettacci, S. Influence of Thermal Contact Resistance of Aluminum Foams in Forced Convection: Experimental Analysis. Materials 2017, 10, 907. [Google Scholar] [CrossRef] [PubMed] [Green Version]
- Barbieri, M.; Di Ilio, G.; Patanè, F.; Bella, G. Experimental investigation on buoyancy-induced convection in aluminum metal foams. Int. J. Refrig. 2017, 76, 385–393. [Google Scholar] [CrossRef]
- Odabaee, M.; Mancin, S.; Hooman, K. Metal foam heat exchangers for thermal management of fuel cell systems—An experimental study. Exp. Therm. Fluid Sci 2013, 51, 214–219. [Google Scholar] [CrossRef]
- Afshari, E.; Ziaeirad, M.; Shariati, Z. ScienceDirect A study on using metal foam as coolant fluid distributor in the polymer electrolyte membrane fuel cell. Int. J. Hydrogen Energy 2015, 41, 1902–1912. [Google Scholar] [CrossRef]
- Santamaria, A.; Zhang, J. Metal foam microchannel heat exchangers for cooling of fuel cells & flow batteries. Am. Soc. Mech. Eng. Fluids Eng. Div. FEDSM 2017, 1B, 1–7. [Google Scholar] [CrossRef]
- Toghyani, S.; Afshari, E.; Baniasadi, E. Metal foams as flow distributors in comparison with serpentine and parallel flow fields in proton exchange membrane electrolyzer cells. Electrochim. Acta 2018, 290, 506–519. [Google Scholar] [CrossRef]
- Vazifeshenas, Y.; Sedighi, K.; Shakeri, M. Heat transfer in PEM cooling flow field with high porosity metal foam insert. Appl. Therm. Eng 2018, 147, 81–89. [Google Scholar] [CrossRef]
- Calmidi, V.; Mahajan, R. Forced convection in high porosity metal foams. ASME J. Heat Transf. 2000, 122, 557–565. [Google Scholar] [CrossRef]
- Yang, C.; Ando, K.; Nakayama, A. A Local Thermal Non-Equilibrium Analysis of Fully Developed Forced Convective Flow in a Tube Filled with a Porous Medium. Transp. Porous Media 2011, 89, 237–249. [Google Scholar] [CrossRef]
- Dukhan, N.; Patel, P. Equivalent particle diameter and length scale for pressure drop in porous metals. Exp. Therm. Fluid Sci. 2007, 32, 1059–1067. [Google Scholar] [CrossRef]
- ERG Materials and Aerospace. Available online: http://ergaerospace.com (accessed on 14 January 2021).
- Boomsma, K.; Poulikakos, D.; Zwick, F. Metal foams as compact high performance heat exchangers. Mech. Mater. 2003, 35, 1161–1176. [Google Scholar] [CrossRef]
- Figliola, R.; Beasley, D. Theory and Design for Mechanical Measurements; John Wiley and Sons: New York, NY, USA, 2000; pp. 149–163. [Google Scholar]
- Ergun, S. Fluid flow through packed columns. Chem. Eng. Prog. 1952, 48, 89–94. [Google Scholar]
Figure 1.
Solution domain for preliminary study.

Figure 2.
Local wall temperature at various inlet air speeds for 40 ppi foam having porosity: (a) 90%, (b) 70%, and (c) 60%.
Figure 2.
Local wall temperature at various inlet air speeds for 40 ppi foam having porosity: (a) 90%, (b) 70%, and (c) 60%.

Figure 3.
(a) Current fuel-cell stack with water-cooling serpentine small channels; (b) fuel-cell stack with shoulders of small channels removed creating one large channel filled with metal foam for air-cooling. MEA stands for Membrane Electrode Assembly.
Figure 3.
(a) Current fuel-cell stack with water-cooling serpentine small channels; (b) fuel-cell stack with shoulders of small channels removed creating one large channel filled with metal foam for air-cooling. MEA stands for Membrane Electrode Assembly.

Figure 4.
A drawing of the 3-dimensional heat transfer problem that was solved in ANSYS-CFD with dimensions and boundary conditions.
Figure 4.
A drawing of the 3-dimensional heat transfer problem that was solved in ANSYS-CFD with dimensions and boundary conditions.

Figure 5.
Sections of meshed geometry: (a) coarse mesh, (b) medium mesh, and (c) fine mesh.

Figure 6.
Complete meshed geometry using medium mesh.

Figure 7.
Contour plots of the temperature in the foam at air inlet speed: (a) 0.2 m/s, (b) 1 m/s, (c) 1.5 m/s.
Figure 7.
Contour plots of the temperature in the foam at air inlet speed: (a) 0.2 m/s, (b) 1 m/s, (c) 1.5 m/s.


Figure 8.
(a) Aluminum plates with open cooling channels representing bipolar plates in the commercial stack EFC-100-03-6-ST, (b) cooling channels filled with aluminum foam; one channel uncovered to show metal foam.
Figure 8.
(a) Aluminum plates with open cooling channels representing bipolar plates in the commercial stack EFC-100-03-6-ST, (b) cooling channels filled with aluminum foam; one channel uncovered to show metal foam.

Figure 9.
Complete test section before integration into the experimental setup.

Figure 10.
Schematic of the complete experimental setup.

Figure 11.
Comparison between experimental and numerical results for internal plate 2 at (a) 2.5 cm; (b) 5.0 cm; (c) 7.5 cm from the inlet.
Figure 11.
Comparison between experimental and numerical results for internal plate 2 at (a) 2.5 cm; (b) 5.0 cm; (c) 7.5 cm from the inlet.


Figure 12.
Comparison between experimental and numerical results for end plate 1: Temperature along plate length for flow velocity: (a) 0.2 m/s; (b) 0.6 m/s; (c) 1.0 m/s.
Figure 12.
Comparison between experimental and numerical results for end plate 1: Temperature along plate length for flow velocity: (a) 0.2 m/s; (b) 0.6 m/s; (c) 1.0 m/s.


Figure 13.
End plate and internal plate temperatures at different locations in the flow direction: (a) for 0.2 m/s; (b) for 1.5 m/s.
Figure 13.
End plate and internal plate temperatures at different locations in the flow direction: (a) for 0.2 m/s; (b) for 1.5 m/s.

Figure 14.
Numerical and experimental pumping power at different inlet flow rates.


Table 1.
EFC-100-03-6-ST key features and specifications.
| Model: | EFC-100-03-6-ST |
|---|---|
| Active Area | 100 cm2 |
| Power output | 500 W |
| Weight | 4 kg |
| Flow Field Pattern | Serpentine design |
| Channels | 4 |
| Cooling channel | 0.07″ × 0.035″ × 2.9″ |
| Operating temperature | 60–90 °C |
| Supply coolant pressure drop | 20–30 psi |
| Removed heat | 500 W |
| Cooling system | Water method |
| Nominal Cell Voltage (Per Cell) | 0.65 +/− 0.05 V |
| Nominal Current Density (Per Cell) | 400 +/− 50 mA/cm2 |
| maximum temperature | 180 °C |
| Thickness of separator plate | 64 mm |
Table 2.
Metal foam properties.
| Material | Pores Per Inch (ppi) | Porosity ɛ (%) | Uncompressed Pore Diameter Dp (mm) |
|---|---|---|---|
| Aluminum | 40 | 60 | 0.625 |
Table 3.
Results of mesh-independence study.
| Mesh | Number of Nodes | Number of Elements | Pressure Drop [Pa] |
|---|---|---|---|
| Coarse | 13,468 | 42,799 | 328.27 |
| Medium | 35,179 | 136,414 | 329.014 |
| Fine | 47,337 | 192,619 | 329.574 |
Publisher’s Note: MDPI stays neutral with regard to jurisdictional claims in published maps and institutional affiliations. |
© 2021 by the authors. Licensee MDPI, Basel, Switzerland. This article is an open access article distributed under the terms and conditions of the Creative Commons Attribution (CC BY) license (https://creativecommons.org/licenses/by/4.0/).
Share and Cite
MDPI and ACS Style
Hmad, A.A.; Dukhan, N. Cooling Design for PEM Fuel-Cell Stacks Employing Air and Metal Foam: Simulation and Experiment. Energies 2021, 14, 2687. https://0-doi-org.brum.beds.ac.uk/10.3390/en14092687
AMA Style
Hmad AA, Dukhan N. Cooling Design for PEM Fuel-Cell Stacks Employing Air and Metal Foam: Simulation and Experiment. Energies. 2021; 14(9):2687. https://0-doi-org.brum.beds.ac.uk/10.3390/en14092687
Chicago/Turabian StyleHmad, Ali A., and Nihad Dukhan. 2021. "Cooling Design for PEM Fuel-Cell Stacks Employing Air and Metal Foam: Simulation and Experiment" Energies 14, no. 9: 2687. https://0-doi-org.brum.beds.ac.uk/10.3390/en14092687
Note that from the first issue of 2016, this journal uses article numbers instead of page numbers. See further details here.