Article

Benchmarking of Single-Stage and Two-Stage Approaches for an MMC-Based BESS

by
Jonathan Hunder Dutra Gherard Pinto
1,
William Caires Silva Amorim
1,
Allan Fagner Cupertino
2,*,
Heverton Augusto Pereira
3 and
Seleme Isaac Seleme Junior
4
1
Graduate Program in Electrical Engineering, Federal University of Minas Gerais, Belo Horizonte 31270-901, MG, Brazil
2
Department of Materials Engineering, Federal Center for Technological Education of Minas Gerais, Belo Horizonte 30421-169, MG, Brazil
3
Department of Electrical Engineering, Federal University of Viçosa, Viçosa 36570-900, MG, Brazil
4
Department of Electronic Engineering, Federal University of Minas Gerais, Belo Horizonte 31270-901, MG, Brazil
*
Author to whom correspondence should be addressed.
Submission received: 14 April 2022 / Revised: 10 May 2022 / Accepted: 12 May 2022 / Published: 14 May 2022

Abstract

:
Modular multilevel converter-based battery energy storage systems (MMC-based BESS) can play an important role when applied to power systems, for example, stabilizing and improving power quality. The integration of batteries in an MMC is usually performed in two ways: single-stage (SS) and two-stage (TS) (i.e., with dc/dc converter). Different references discuss the control strategies, sizing methodologies, and the advantages/drawbacks of these approaches. However, a deep comparison of these topologies is still missing in the literature. Thus, benchmarking SS and TS approaches is provided in this work. The battery current spectrum, the battery lifetime, the converter power losses, and the total costs are evaluated for both approaches. In addition, energy oversizing due to rounding is an important figure of merit since batteries account for a large amount of the costs. The case study is evaluated considering commercial battery racks (standard solution) and battery cells (customized solution). For the case studies, different insulated gate bipolar transistor (IGBT) models and states of charge (SOC) ranges are considered. The system under review is a 10.9 MVA/5.76 MWh connected to a 13.8 kV power system. This system aims to perform a time-shift for an industry. In an analysis to optimize the costs of a project that evaluates several variables, the best configuration option is found in the most balanced option. In this sense, when balancing costs in project sizing, power losses, and battery replacement, the optimal design is the SS approach in the customized solution.

1. Introduction

In recent decades, economic and population growth have contributed to increased demand for electricity in the world [1]. Renewable energy sources (RES) such as photovoltaic systems (PV) and wind farms (WPP) have emerged as alternatives to supply this energy demand.
One of the main concerns regarding RES is intermittency, which is an inherent characteristic. Battery energy storage systems (BESS) have grown considerably. The use of a BESS presents benefits such as flexibility in the location for installation, shorter construction time of the facilities, and quick response time to system events [2]. This technology has been used to provide several ancillary services, such as time-shift and peak shaving, among other services.
The connection of the BESS to the grid is carried out through power electronics [3]. References [4,5] indicate the modular multilevel converter (MMC) is an option to perform BESS integration with the grid. The MMC is composed of dozens or hundreds of submodules (SM) connected in cascade in each converter arm [
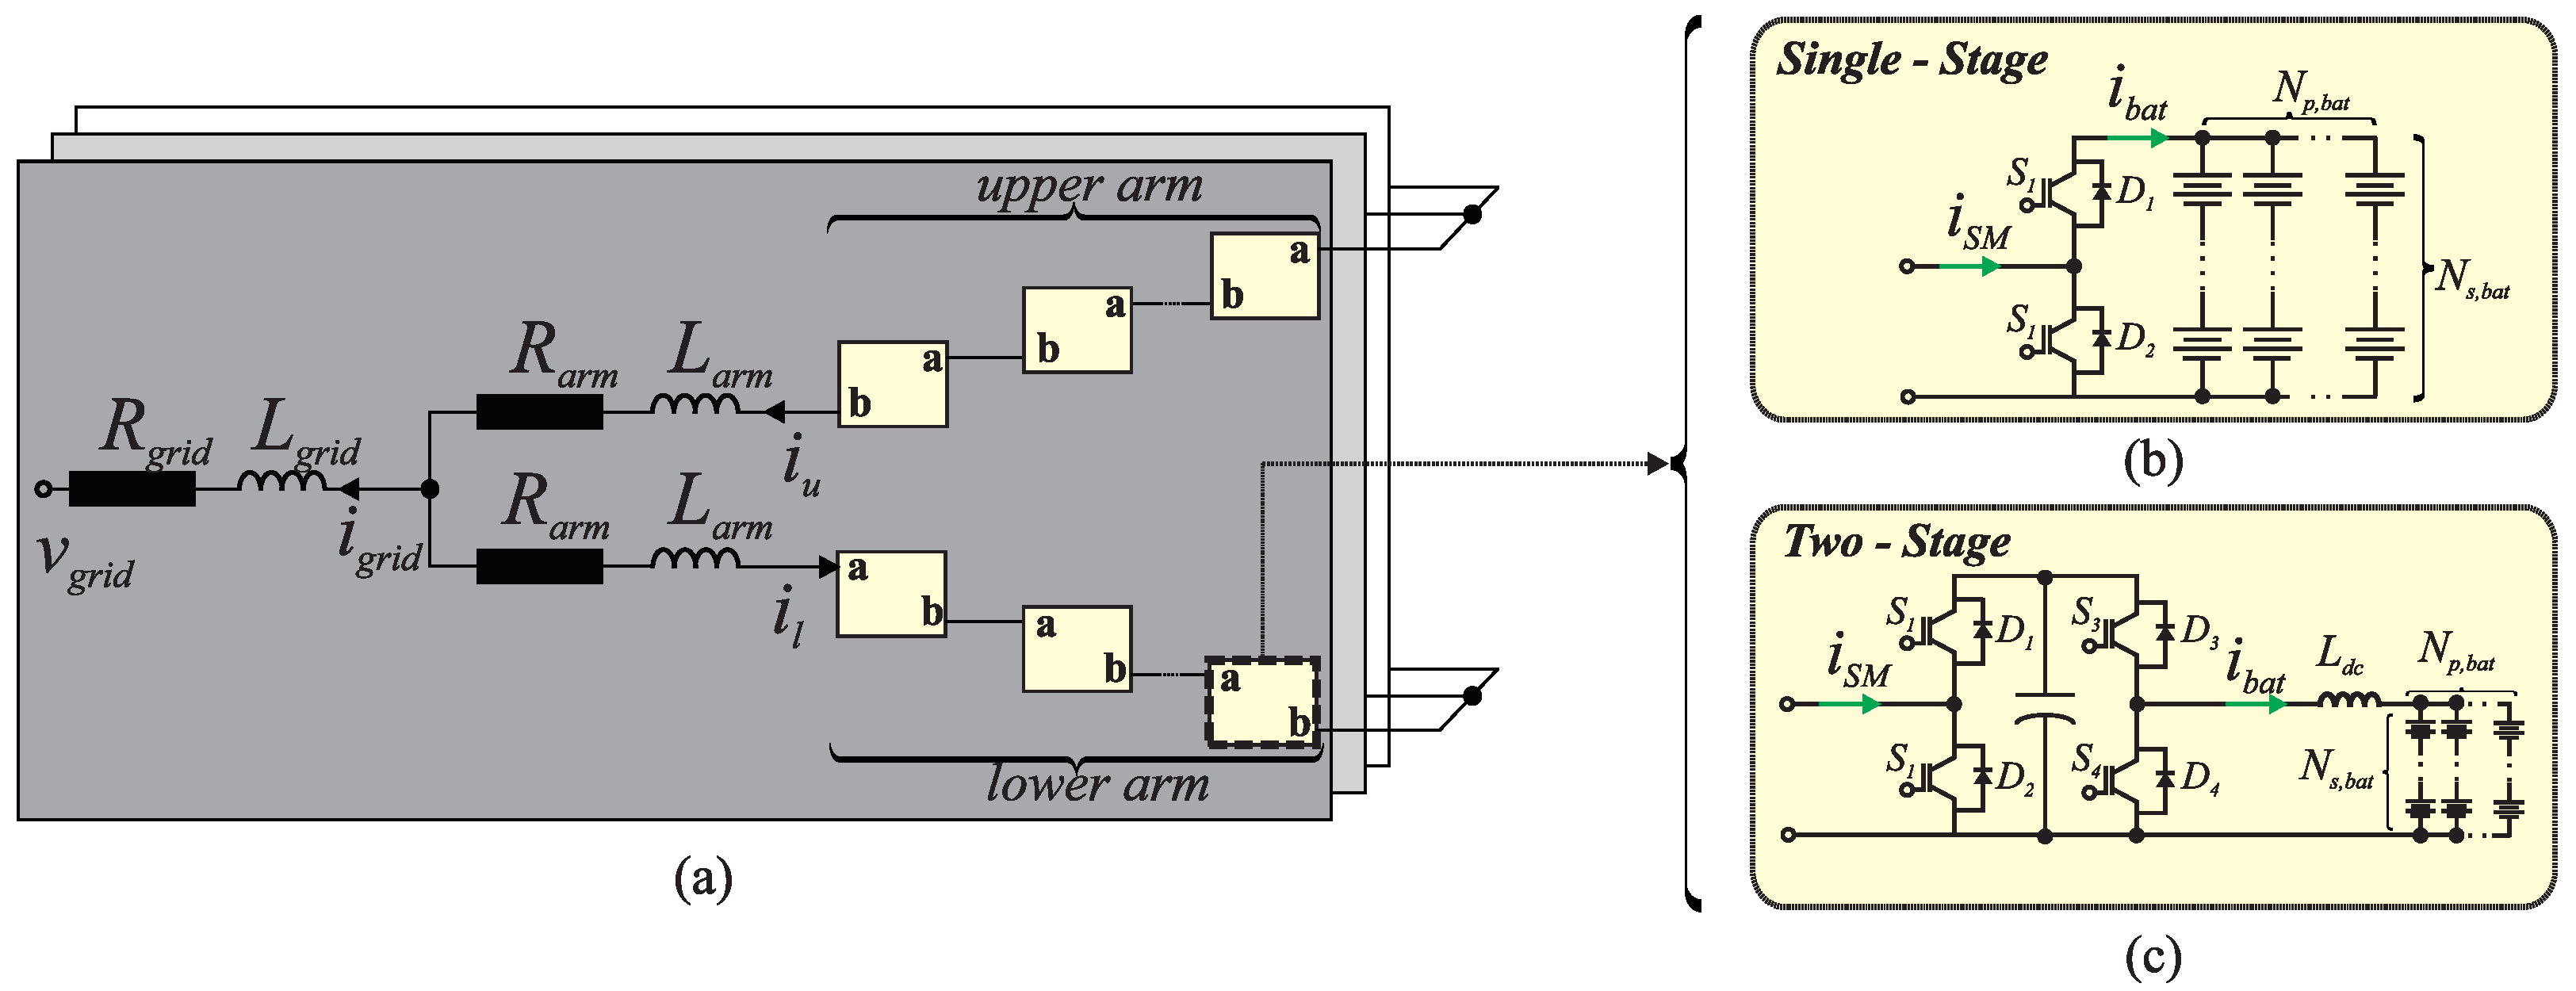
6]. This topology shown in Figure 1a presents some advantages such as a high voltage level, a low switching frequency, fault tolerance, redundancy, modularity and design flexibility [7].
The association of a BESS with MMC is denominated as an MMC-based BESS. In this system, the battery rack can be connected directly to the MMC dc-link, called a centralized configuration, or disposed in each SM of the MMC, called a distributed configuration [8]. In a centralized configuration, long strings of batteries are needed to obtain high voltage [9]. According to Figure 1b,c, two configurations of an MMC-based BESS are investigated in this work: single-stage (SS) and two-stage (TS). In the SS approach, the batteries are connected to the SM. This connection can be direct [10] or through passive filters [10,11]. The battery current presents low-order harmonic components. These components, especially the first-order and second-order, increase the battery RMS current. References [10,12] state that low-order harmonics can increase the internal temperature of batteries. Therefore, it would increase the internal losses of the battery, which could reduce battery life. An alternative to mitigate the low-order harmonic contents is the use of passive filters [11]. However, the use of these filters can increase the volume of SM, especially associated with inductors [13].
In the TS approach, the batteries are decoupled from the SM through a dc/dc converter [11,14]. The current in the batteries presents a considerable reduction in low-order harmonics. In this case, the SM volume is reduced. References [11,14] claim that this approach is interesting from a battery life point of view. Furthermore, the voltage of Li-ion batteries can vary by up to 30% from a fully discharged to a fully charged state [15]. In the TS approach, the dc/dc converter varies the duty cycle to keep the SM voltage constant. Consequently, the number of batteries and SMs can be reduced.
Reference [16] presents MMC settings to associate with a BESS. Among the configurations, those that offer the potential for greater efficiency and reliability are presented. Reference [15] presents the integration of an MMC with a BESS through the dc/dc converter in each SM. However, the literature does not present a comparison between SS and TS approaches considering metrics such as cost, efficiency, volume, and lifetime. Furthermore, evaluating the performance of topologies is necessary.
The roundings functions used in BESS sizing impact the energy oversizing of the project. Thus, this work evaluates projects with commercial battery racks (standard solution) and projects with customized battery racks (customized solution). In the customized solution, small battery cells are used to form the battery rack. In this sense, a figure of merit varying the grid voltage, required energy and energy oversizing is perfomed.
The adopted case study compares SS and TS approaches for standard and customized solutions. The case study is carried out for 10.9 MVA/5.76 MWh–13.8 kV for an MMC-based BESS. This system aims to perform time-shift in an industrial plant. In the analysis, different IGBT models and different SOC ranges are compared.
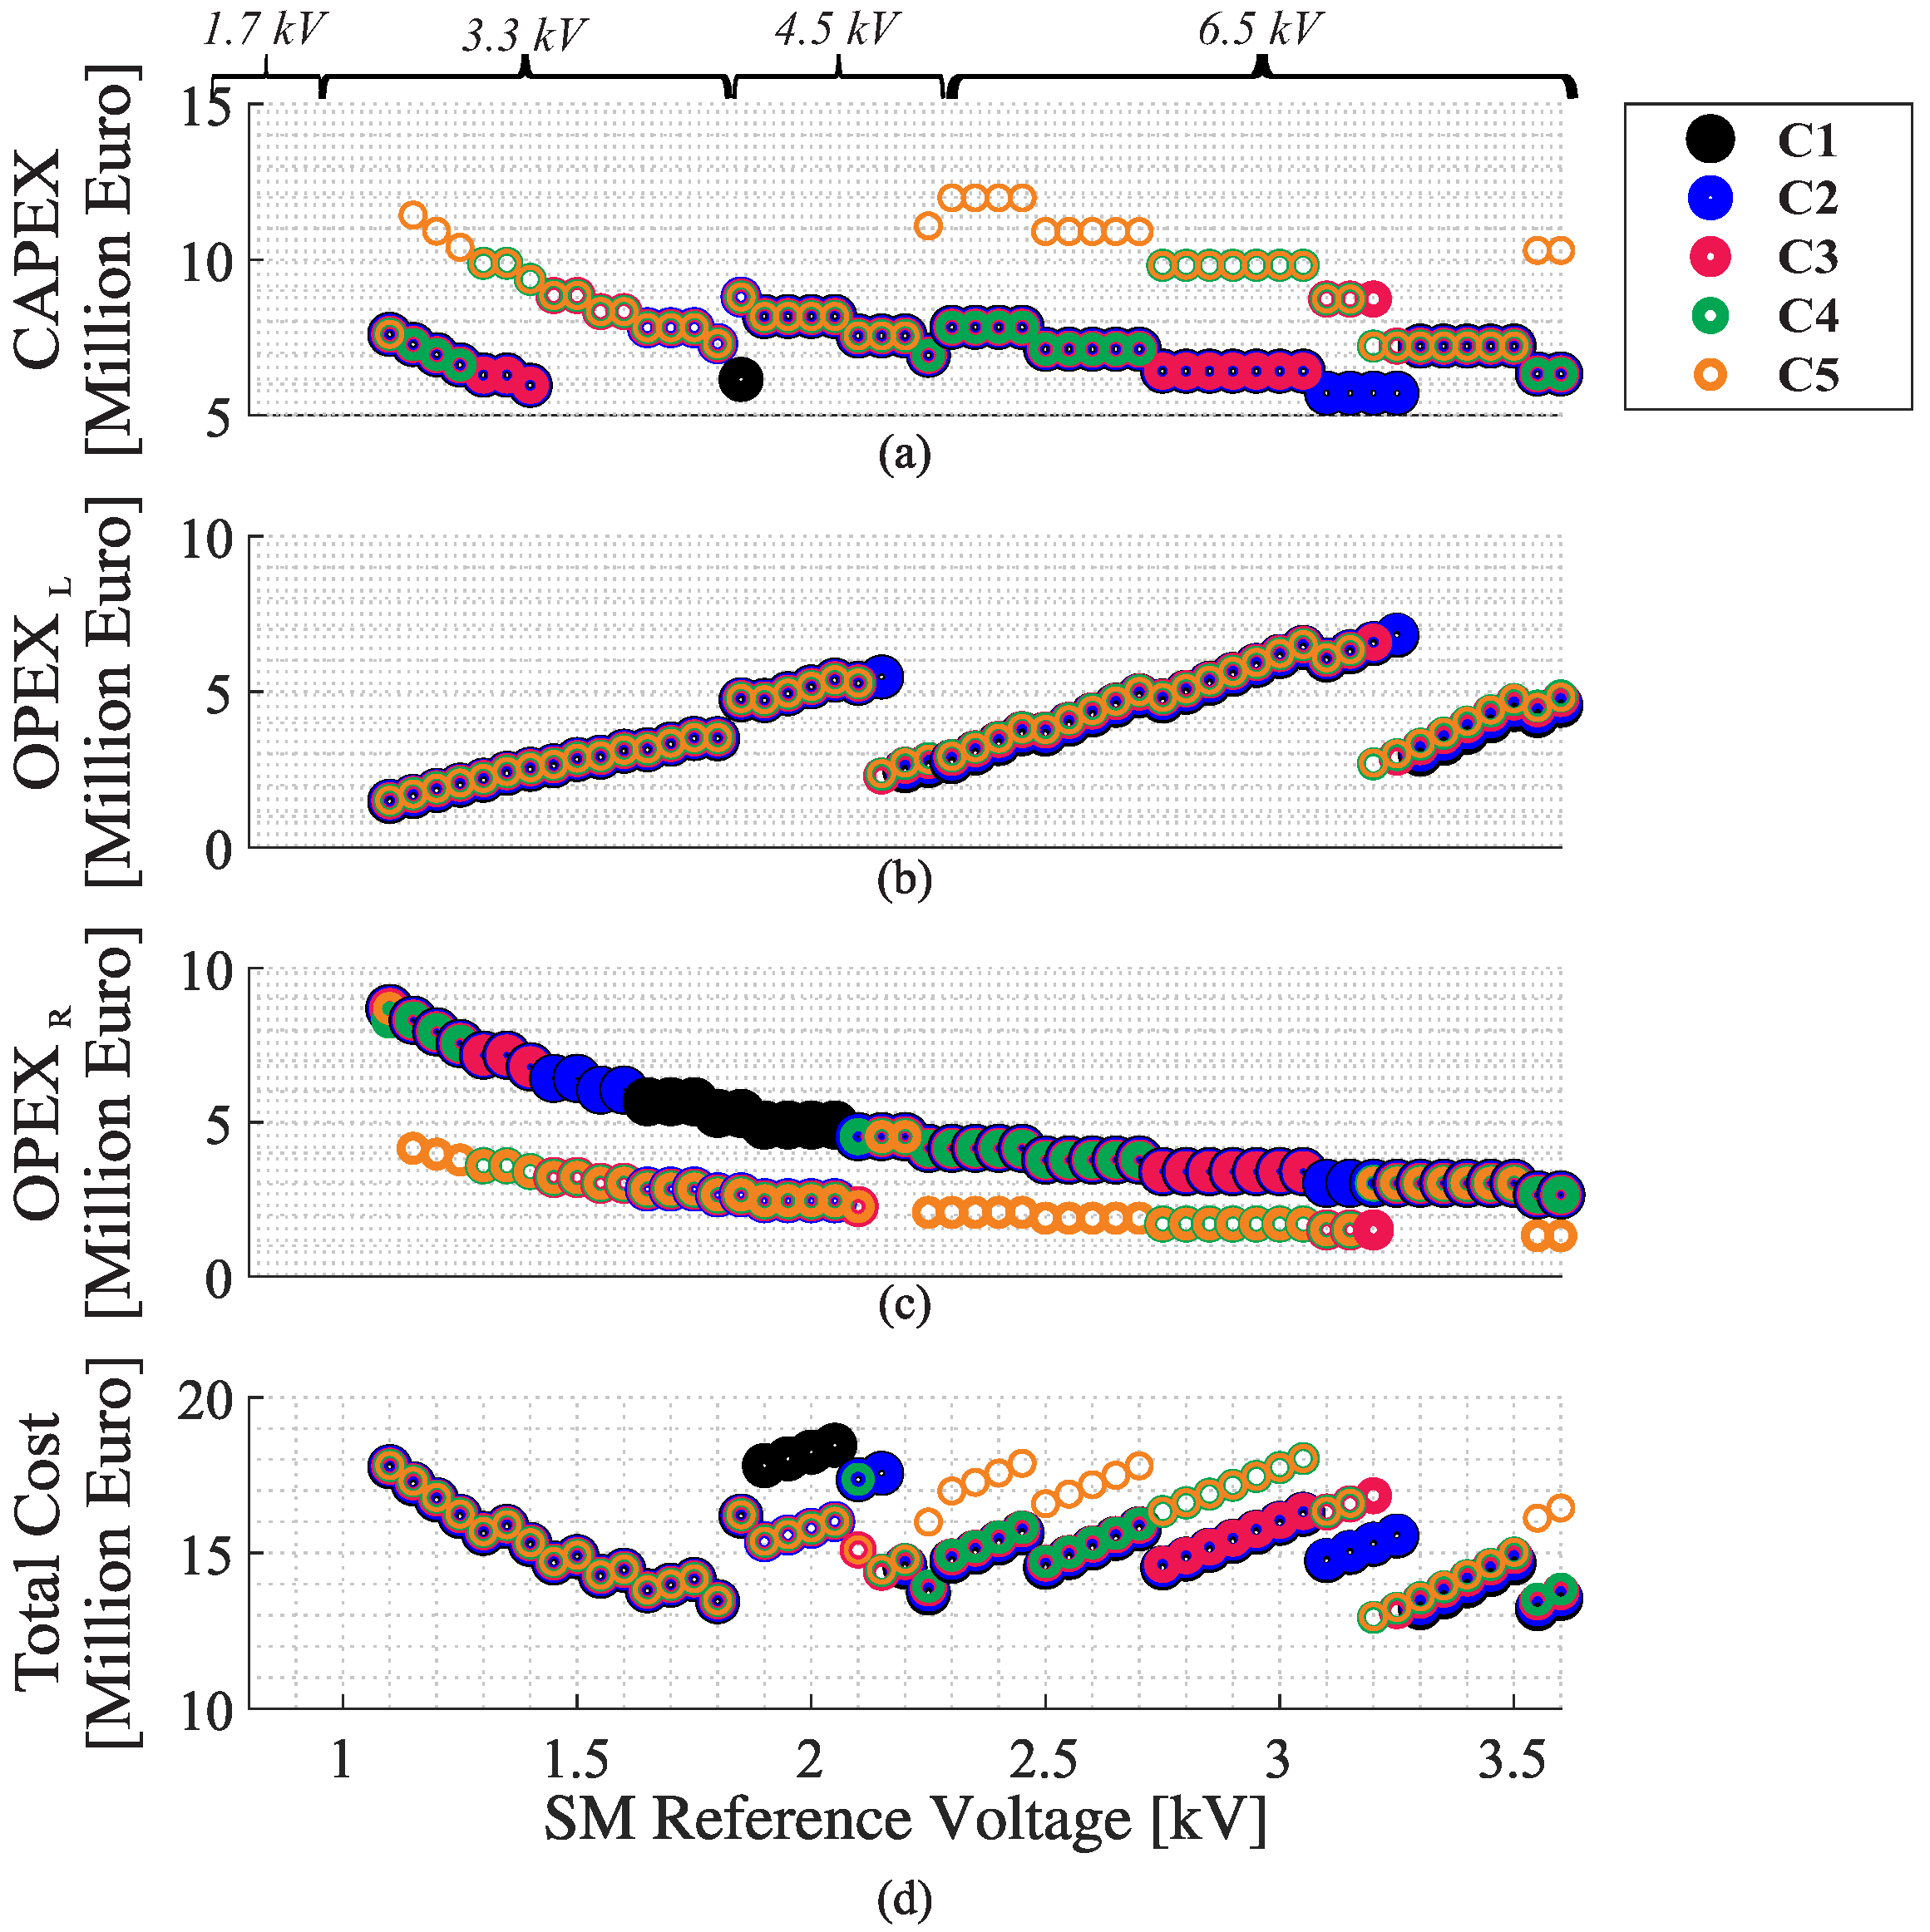
The metric used to compare the SS and TS approaches is the total project cost. The total costs can be divided into two terms: capital expenditure (CAPEX) and operational expenditure (OPEX) [17]. In addition, an analysis of the battery lifetime is carried out. The replacement of batteries is analyzed considering an operating period of 25 years.
This paper is organized as follows: Section 2 presents a methodology for BESS sizing in SS and TS approaches. In Section 3, an analysis of the battery current for SS and TS approaches is performed. Section 4 analyzes the effects of rounding on BESS sizing in both customized and standard solutions. Section 5 presents the case studies and methodologies to calculate the costs related to each design of the single-stage and two-stage approaches. Afterward, the results for the SS and TS approaches in the customized and standard solutions are presented in Section 6. A discussion of the results obtained is in Section 7. Finally, the conclusions about the work are presented in Section 8.

2. MMC-Based BESS Design

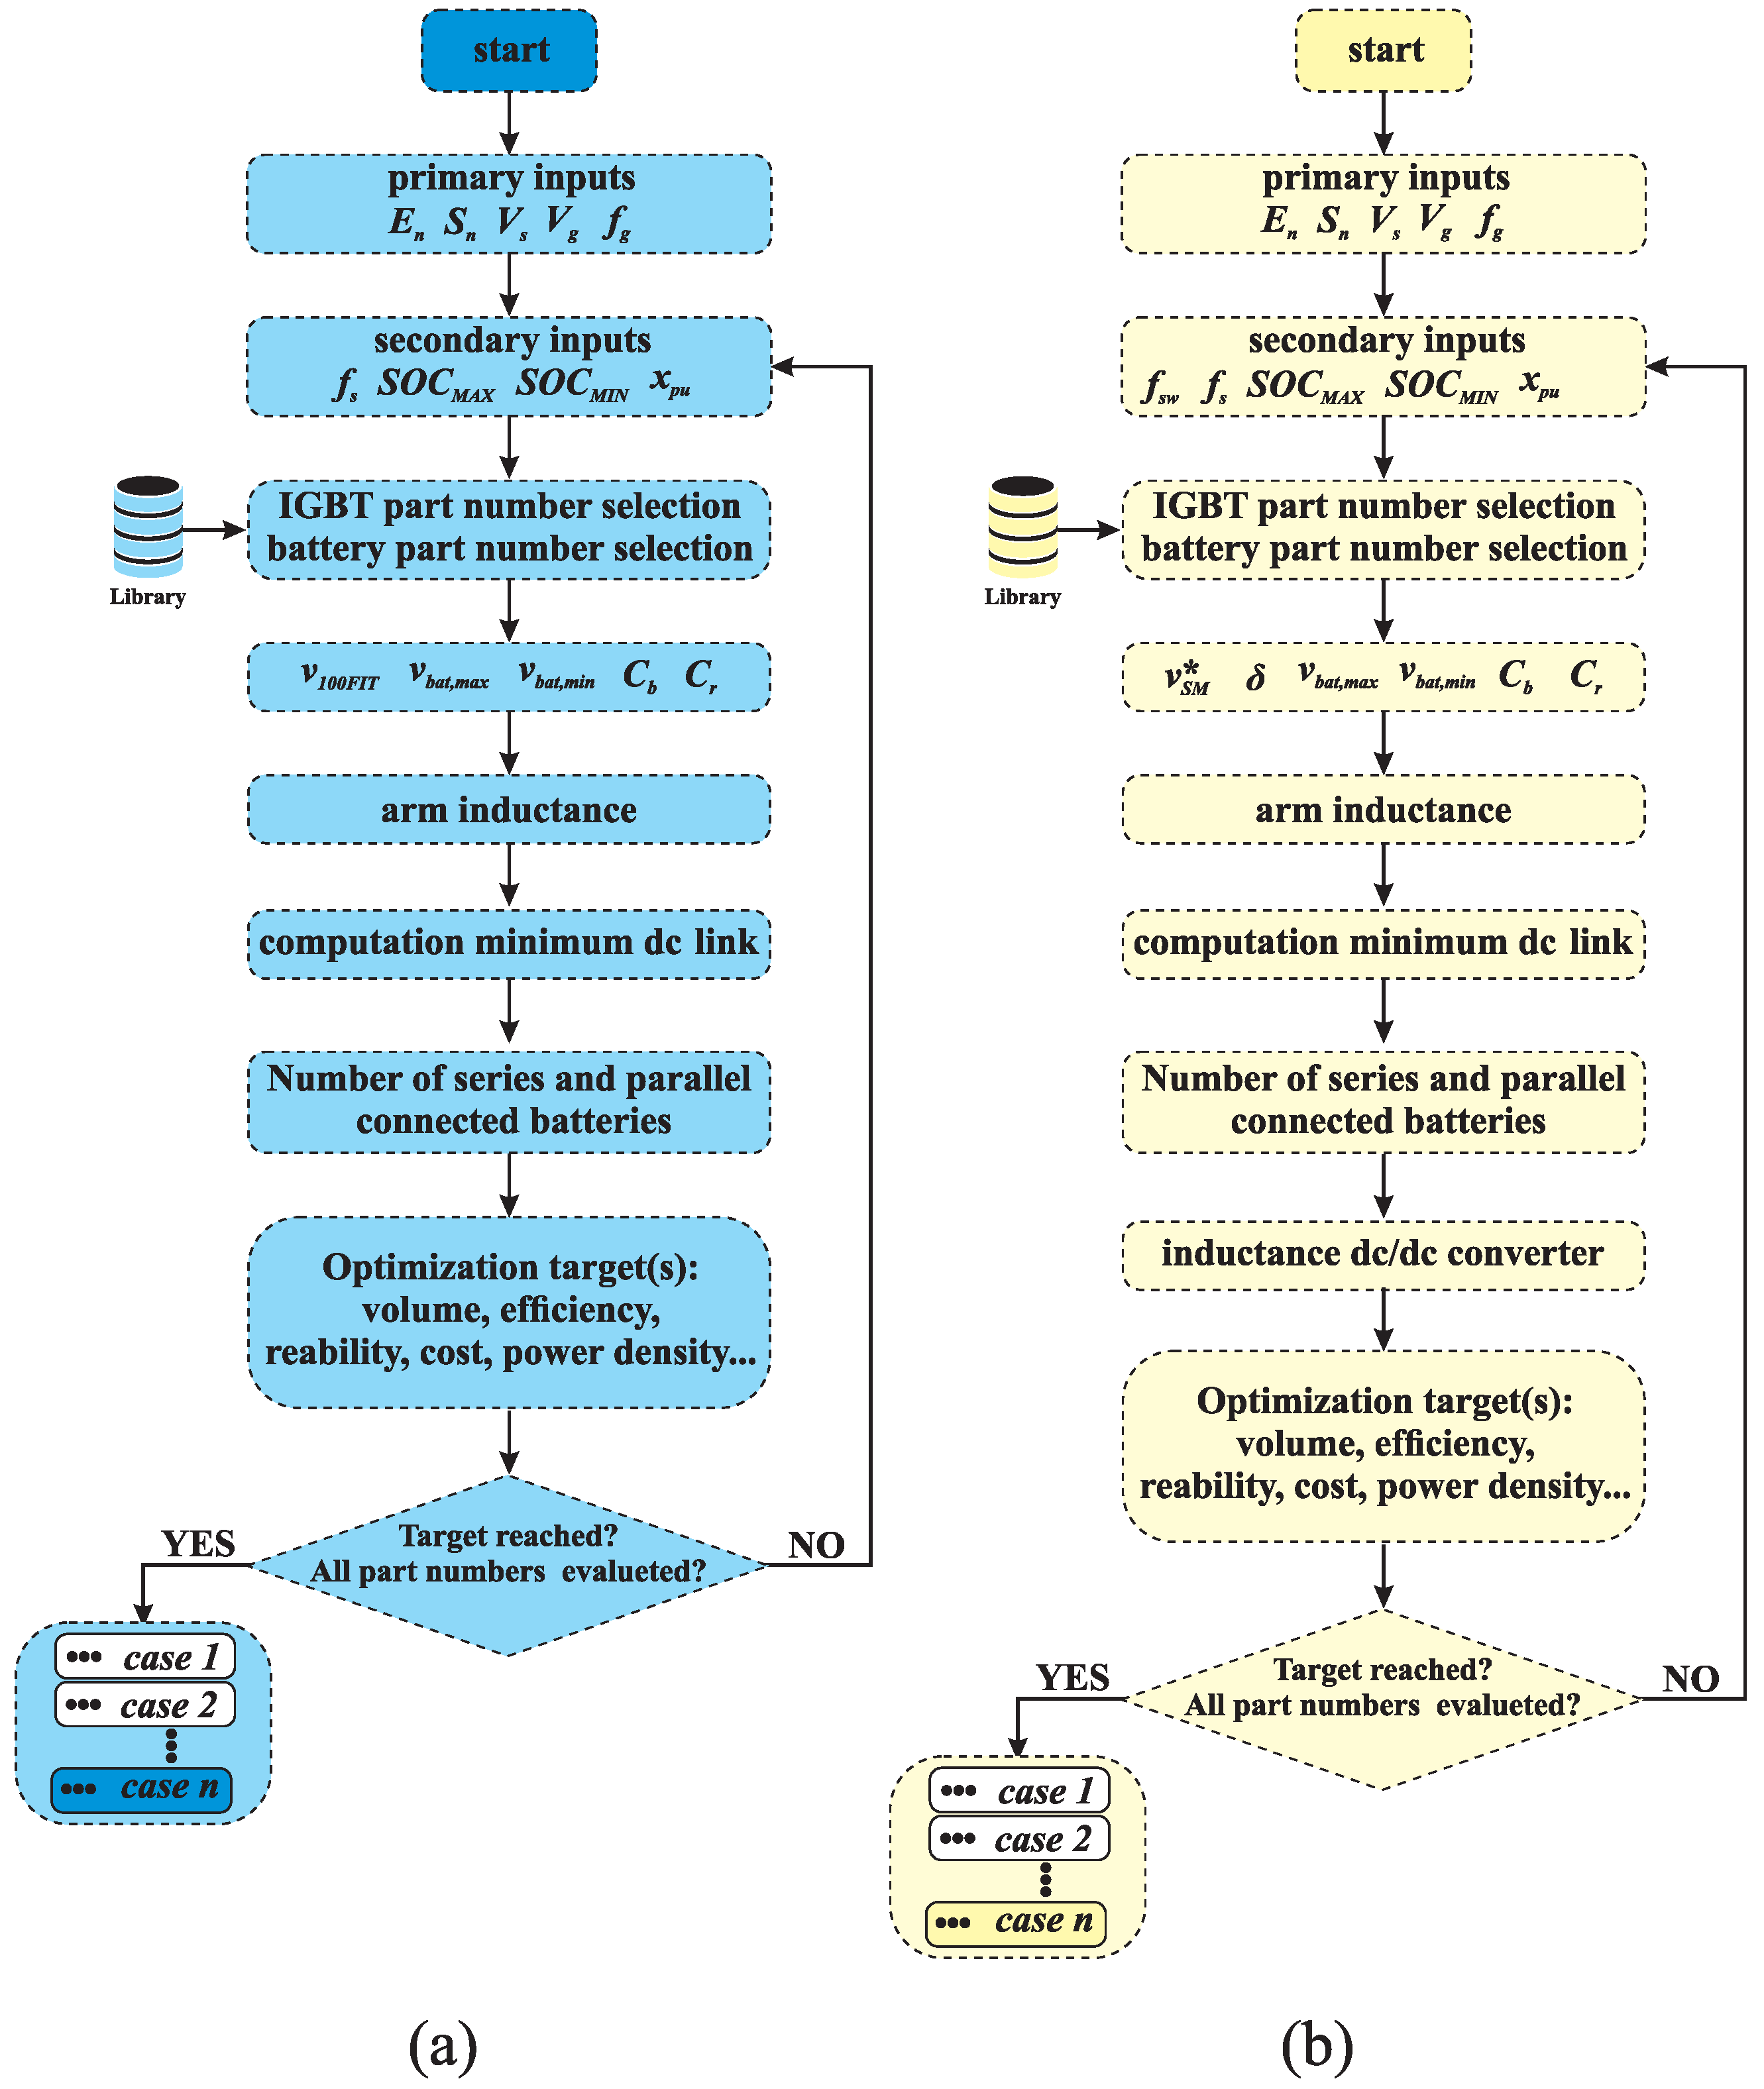
The flowcharts to optimize the BESS designs in SS and TS approaches are presented in Figure 2a,b, respectively.
The first input parameters are the MMC-based BESS specifications such as nominal energy storage ( E s ), nominal power ( S n ), grid voltage ( V g ), and grid frequency ( f g ). Furthermore, in the first step in the converter design, the minimum required output voltage that guarantees the connection to the grid is calculated. This value is computed by [8]:
V ^ s 1.05 V ^ g 1 + Δ V + x p u ,
where V ^ g is the maximum value of the line-to-neutral voltage, Δ V is the maximum variation, in pu, verified in the grid voltage, and x p u is the converter output reactance, in pu. The margin of 5% is assumed to guarantee a suitable dynamic behavior in the current control [11,18].
The next input parameters are variables that can be changed for optimization purposes. For both approaches, the following are considered: switching frequency ( f s ), SOC interval ( S O C m a x and S O C m i n ), and per unit equivalent output reactance of the converter ( x p u ). Furthermore, in the TS approach, the switching frequency of the dc/dc converter is considered ( f s w ). In this step, the adjustment of the parameters has an influence on the optimization of the system. For example, the SOC operating range affects the volume and efficiency of the MMC and the lifetime batteries.
The MMC must be able to synthesize V ^ s in the limit region of the modulator. The sum of the capacitor voltages ( v c ) is obtained from V ^ s . This relationship depends on the topology and the modulation strategy used. In this way, the sum of the capacitor voltages of each arm when using the SPWM is 2 V ^ s . Another interesting approach that makes it possible to extend the linear region of the modulator is to consider 1 / 6 third harmonic injection [19]. Thus, the sum of the capacitors is v c = 3 V ^ s .
In the SS approach, the number of series batteries in each string, N s , b a t , can be calculated according to:
N s , b a t = floor v S M * v b a t , m a x ,
where v b a t , m a x is the maximum battery voltage, and v S M * is the SM maximum voltage (equivalent of blocking voltage of IGBT, V 100 F I T ). The 100-FIT voltage leads to a FIT rate of one failure in 10 9 h of operation. This value is used in projects of reliable converters [20]. The function floor is used in Equation (2) to ensure that the maximum voltage of the batteries exceeds the V 100 F I T . The total number of SM is computed by:
N S M = ceil v c N s , b a t v b a t , m i n ,
where v b a t , m i n is the minimum battery rack voltage, limited by the SOC m i n . The number of batteries in parallel must fulfill two requirements: power and energy. Therefore, the number of batteries connected in parallel can be calculated as follows:
N p , b a t = ceil max P n v b a t , m i n C r C n , 100 E n E n , b a t ( S O C m a x S O C m i n ) 6 N S M N s ,
where P n is the MMC nominal power, C r is the rate of battery discharging, C n is the battery nominal capacity, E n is the requirement of nominal energy storage in the converter, E n , b a t is the battery rack nominal energy, SOC m a x is the maximum allowed SOC, and SOC m i n is the minimum allowed SOC. Note that in Equation (4), the calculation SOC m a x SOC m i n is considered an approximation of the value of battery power. This approximation applies because the OCV × SOC curve presents a linear behavior at the beginning and at the end.
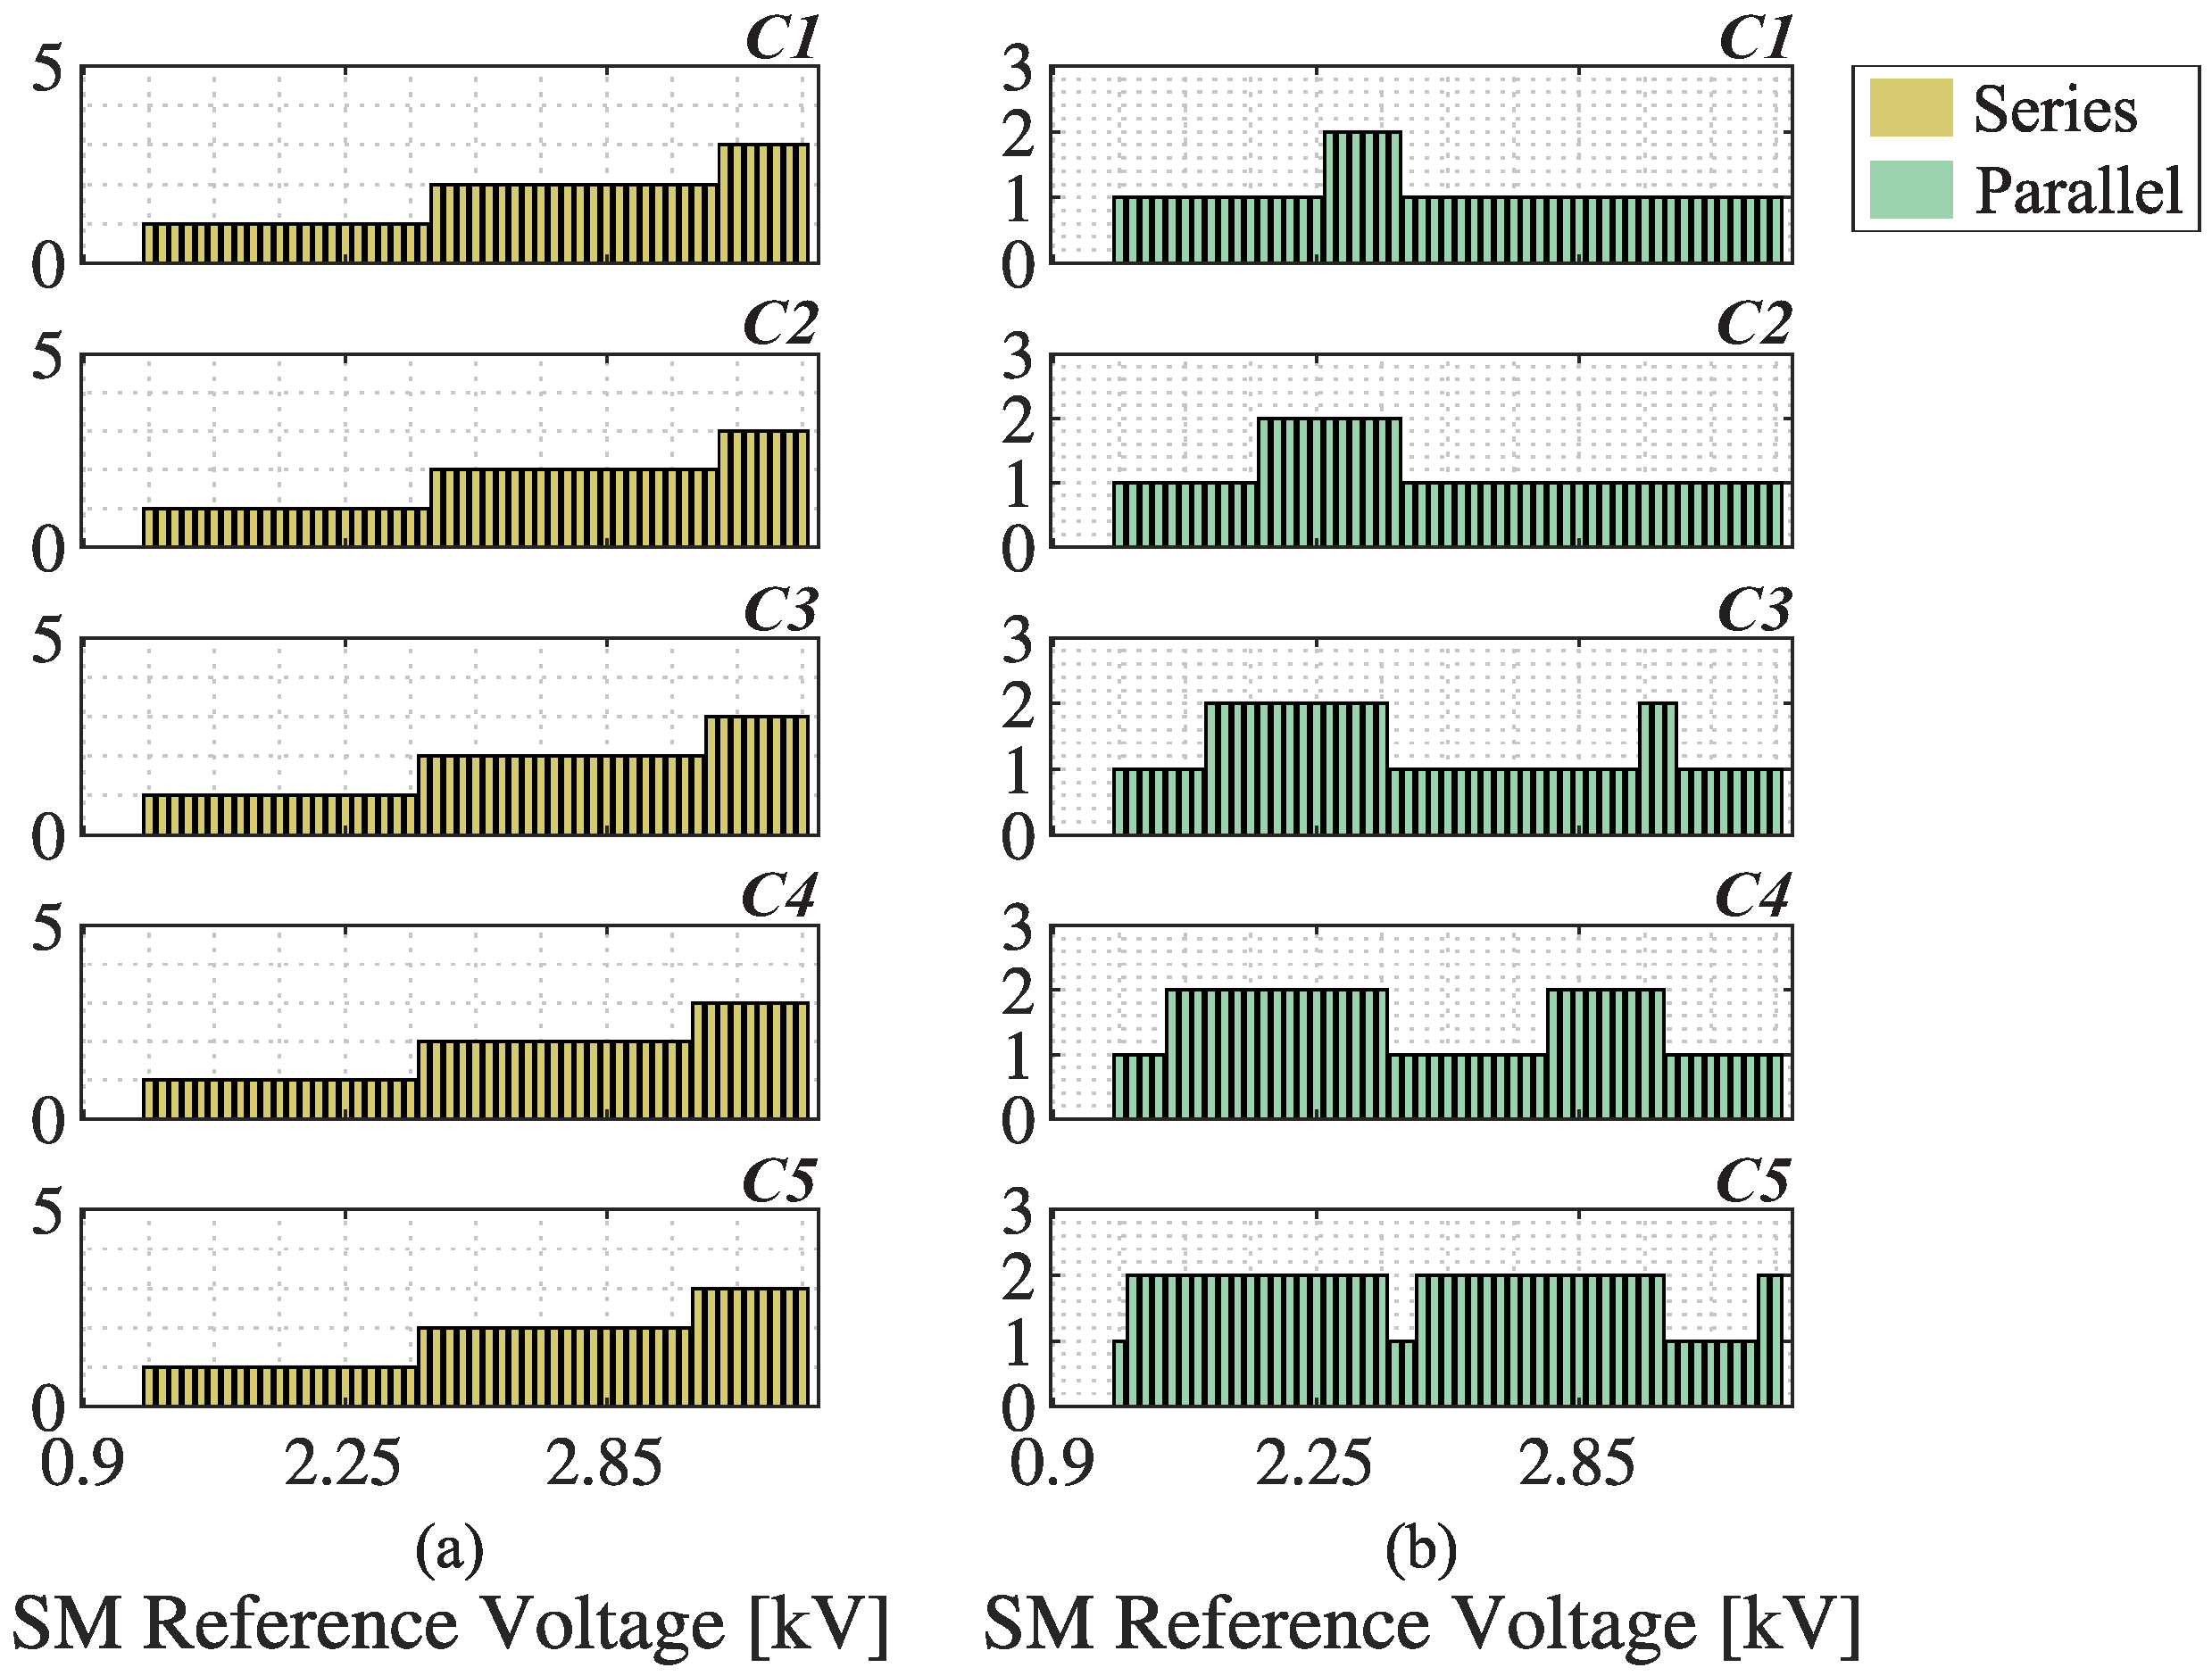
In the TS approach, the dc/dc is a boost converter. Thus, the total voltage of the battery rack varies according to the duty cycle. Since the dc/dc converter decouples the batteries from the SM, the number of batteries in a series by string is represented by:
N s , b a t = floor v S M * v b a t , m a x σ ,
where v S M * is the SM reference voltage, and σ is the gain used to guarantee that the dc/dc converter controller does not saturate. As the converter used is of the boost type, the condition v S M * > v b a t , m a x must be met; v S M * must be higher than the battery voltage and lower than the power module’s maximum voltage (recommended by the manufacturer). Finally, N S M for the TS approach is determined as follows:
N S M = ceil v c v S M * .
As presented in [15], in the TS approach, v S M * is a variable to be analyzed in the converter optimization process. Finally, Equation (4) can be used to determine the number of batteries in parallel for the TS approach.

Passive Components

The capacitance SM is defined based on the power requirement of the converter. According to [19], it can be calculated as follows:
C = W c o n v S n 3000 N S M ( v S M * ) 2 ,
where W c o n v is the requirements of the energy storage in the converter, given in kJ/MVA, and S n is the converter nominal power. According to [7,21], considering 10% ripple criterion of SM voltage, W = 40 kJ/MVA is the typical adopted for the MMC.
The arm inductance of the MMC is computed by:
L a r m = x a r m V ^ g 2 ω S n ,
where x a r m is the value of arm reactance, in pu, and ω is the grid angular frequency. According to [22], typical arm inductance values can vary in the range of 0.05 to 0.15 pu. In this work, 0.15 is adopted.
The maximum value of the arm current value is adopted to determine the semiconductors devices and inductors [7]. As previously discussed, at balanced conditions, the circulating current can be neglected. In this way, the maximum arm current is calculated as follows:
max ( i g , n ) 2 = S n 6 V ^ g ,
Finally, for the TS approach, the minimum value of inductance to guarantee that the dc/dc converter operates in continuous conduction mode can be expressed by:
L d c = v b a t , m a x ( v S M * v b a t , m a x ) v S M * f s w Δ I b a t ,
where f s w is the switching frequency of the dc/dc converter, and Δ I b a t is the maximum battery current ripple.

3. MMC Mathematical Model

According to [22], the upper arm current of phase-n, ( i u , n ) and the lower arm current of phase-n, ( i l , n ) can be written as follows:
i u , n = i g , n 2 + i c , n , i l , n = i g , n 2 + i c , n ,
where i g , n is the grid current of phase-n, and i c , n is the circulating current of phase-n.
The upper arm voltage of phase-n ( v u , n ) and the lower arm voltage of phase-n ( v l , n ) can be expressed by:
v u , n = i = 1 N n u , n v S M , n i , v l , n = i = 1 N n l , n v S M , n i ,
where v S M , n i is the i-th SM voltage, and n u , n and n l , n are the insertion index for the upper and lower arms, respectively.
Regardless of whether the system is a SS or TS approach, the variation in arm power will generate a ripple current in the battery. In addition, if the system is balanced, i c , n = 0 . Therefore, the instantaneous active power in the upper arm is given by:
p u , n = 3 2 V ^ s , n V ^ s , n cos ( ω t + θ v ) + 1 6 V ^ s , n ( 3 ω t ) v u , n 1 2 I ^ g cos ( ω t + θ v + ϕ ) i u , n .
where the injection of 1/6 of a third harmonic in the modulation strategy is assumed [19], and V ^ s , n is the amplitude of the line-to-neutral output voltage.
Assuming negligible power losses and that the converter power is evenly distributed to the SM, the SM current can be approximated by:
i S M v u , n i u , n N S M v S M * .
Therefore, i S M can be expressed as follows:
i S M 1 8 m I ^ g [ cos ( ϕ ) d c c o m p o n e n t + 3 cos ( ω t + θ v + ϕ ) 1 s t h a r m o n i c cos ( 2 ω t + 2 θ v + ϕ ) 2 n d h a r m o n i c + 1 6 cos ( 2 ω t θ v ϕ ) 2 n d h a r m o n i c + 1 6 cos ( 4 ω t + θ v + ϕ ) 4 t h h a r m o n i c ] ,
where I ^ g is the amplitude of the grid current, and m is the modulation index, given by:
m = 2 V ^ s , n N S M v S M * .
According to Equation (15), i S M has significant first, second, and fourth harmonic components which can generate a ripple current in the battery. In the SS approach, once v S M * = v b a t , if no filter is applied in the SM, the fundamental, second, and fourth harmonic components flow in the battery.
In the TS approach, the lower order harmonic components are strongly attenuated. Compared with the SS approach, the fundamental and second-order harmonics have been reduced considerably. On the other hand, in the TS approach, harmonic components are derived from the switching of the dc/dc converter. The battery current ( i b a t ) in the SS approach without passive filters is equivalent to i S M . On the other hand, in the TS approach, i b a t is equivalent to the dc component (in an operating condition of perfect filtering of the components ac).
Therefore, the effective current in the battery in the SS approach ( i b a t , R M S ( S S ) ) and in the TS approach ( i b a t , R M S ( T S ) ) can be calculated as follows, respectively:
i b a t , R M S ( S S ) = 1 8 m I ^ g cos 2 ( ϕ ) + 67 36 , i b a t , R M S ( T S ) = σ 1 8 m I ^ g cos ( ϕ ) ,
where σ is the duty cycle. Furthermore, cos 2 ( ϕ ) = 1 .
The harmonics increase the RMS value of the current and consequently of the temperature. Consequently, it increases battery losses and reduces battery life [23,24]. Therefore, the temperature variation in the batteries in the SS approach ( Δ T b a t ( S S ) ) and in the TS approach ( Δ T b a t ( T S ) ) can be calculated as follows:
Δ T b a t ( S S ) = i b a t , R M S ( S S ) N p , b a t ( S S ) 2 R s R T H , Δ T b a t ( T S ) = i b a t , R M S ( T S ) N p , b a t ( T S ) 2 R s R T H ,
where R s and R T H are the battery equivalent to internal resistance and battery thermal resistance. In addition, N p , b a t ( S S ) and N p , b a t ( T S ) are the number of batteries in parallel for single and TS approaches.
To compare the temperature variation in the SS and TS approaches, we considered the power for both systems andthe full-rated power in the SM for both. Therefore, in the TS approach, the duty cycle ( σ ) varies the current so that both process the same power. Consequently, N p , b a t ( T S ) = N p , b a t ( S S ) / σ .
Finally, the relationship between Δ T b a t ( S S ) and Δ T b a t ( T S ) can be obtained as follows:
Δ T b a t ( S S ) Δ T b a t ( T S ) 2.86
It is important to note that this temperature variation is increased by the ambient temperature of the batteries. Furthermore, this relationship is only valid if the same power synthesized by the SM in both approaches is considered.
Some variables can influence this relationship to be changed such as rounding in dimensions, different designs, and the type of service provided by the battery. For systems where the battery current is low, the battery cycles little or does not run for some interval and the temperature variation is low. Therefore, this variation may not significantly affect battery degradation.

4. Effects of Rounding Functions on BESS Design

As discussed in Section 3, due to the use of floor and 
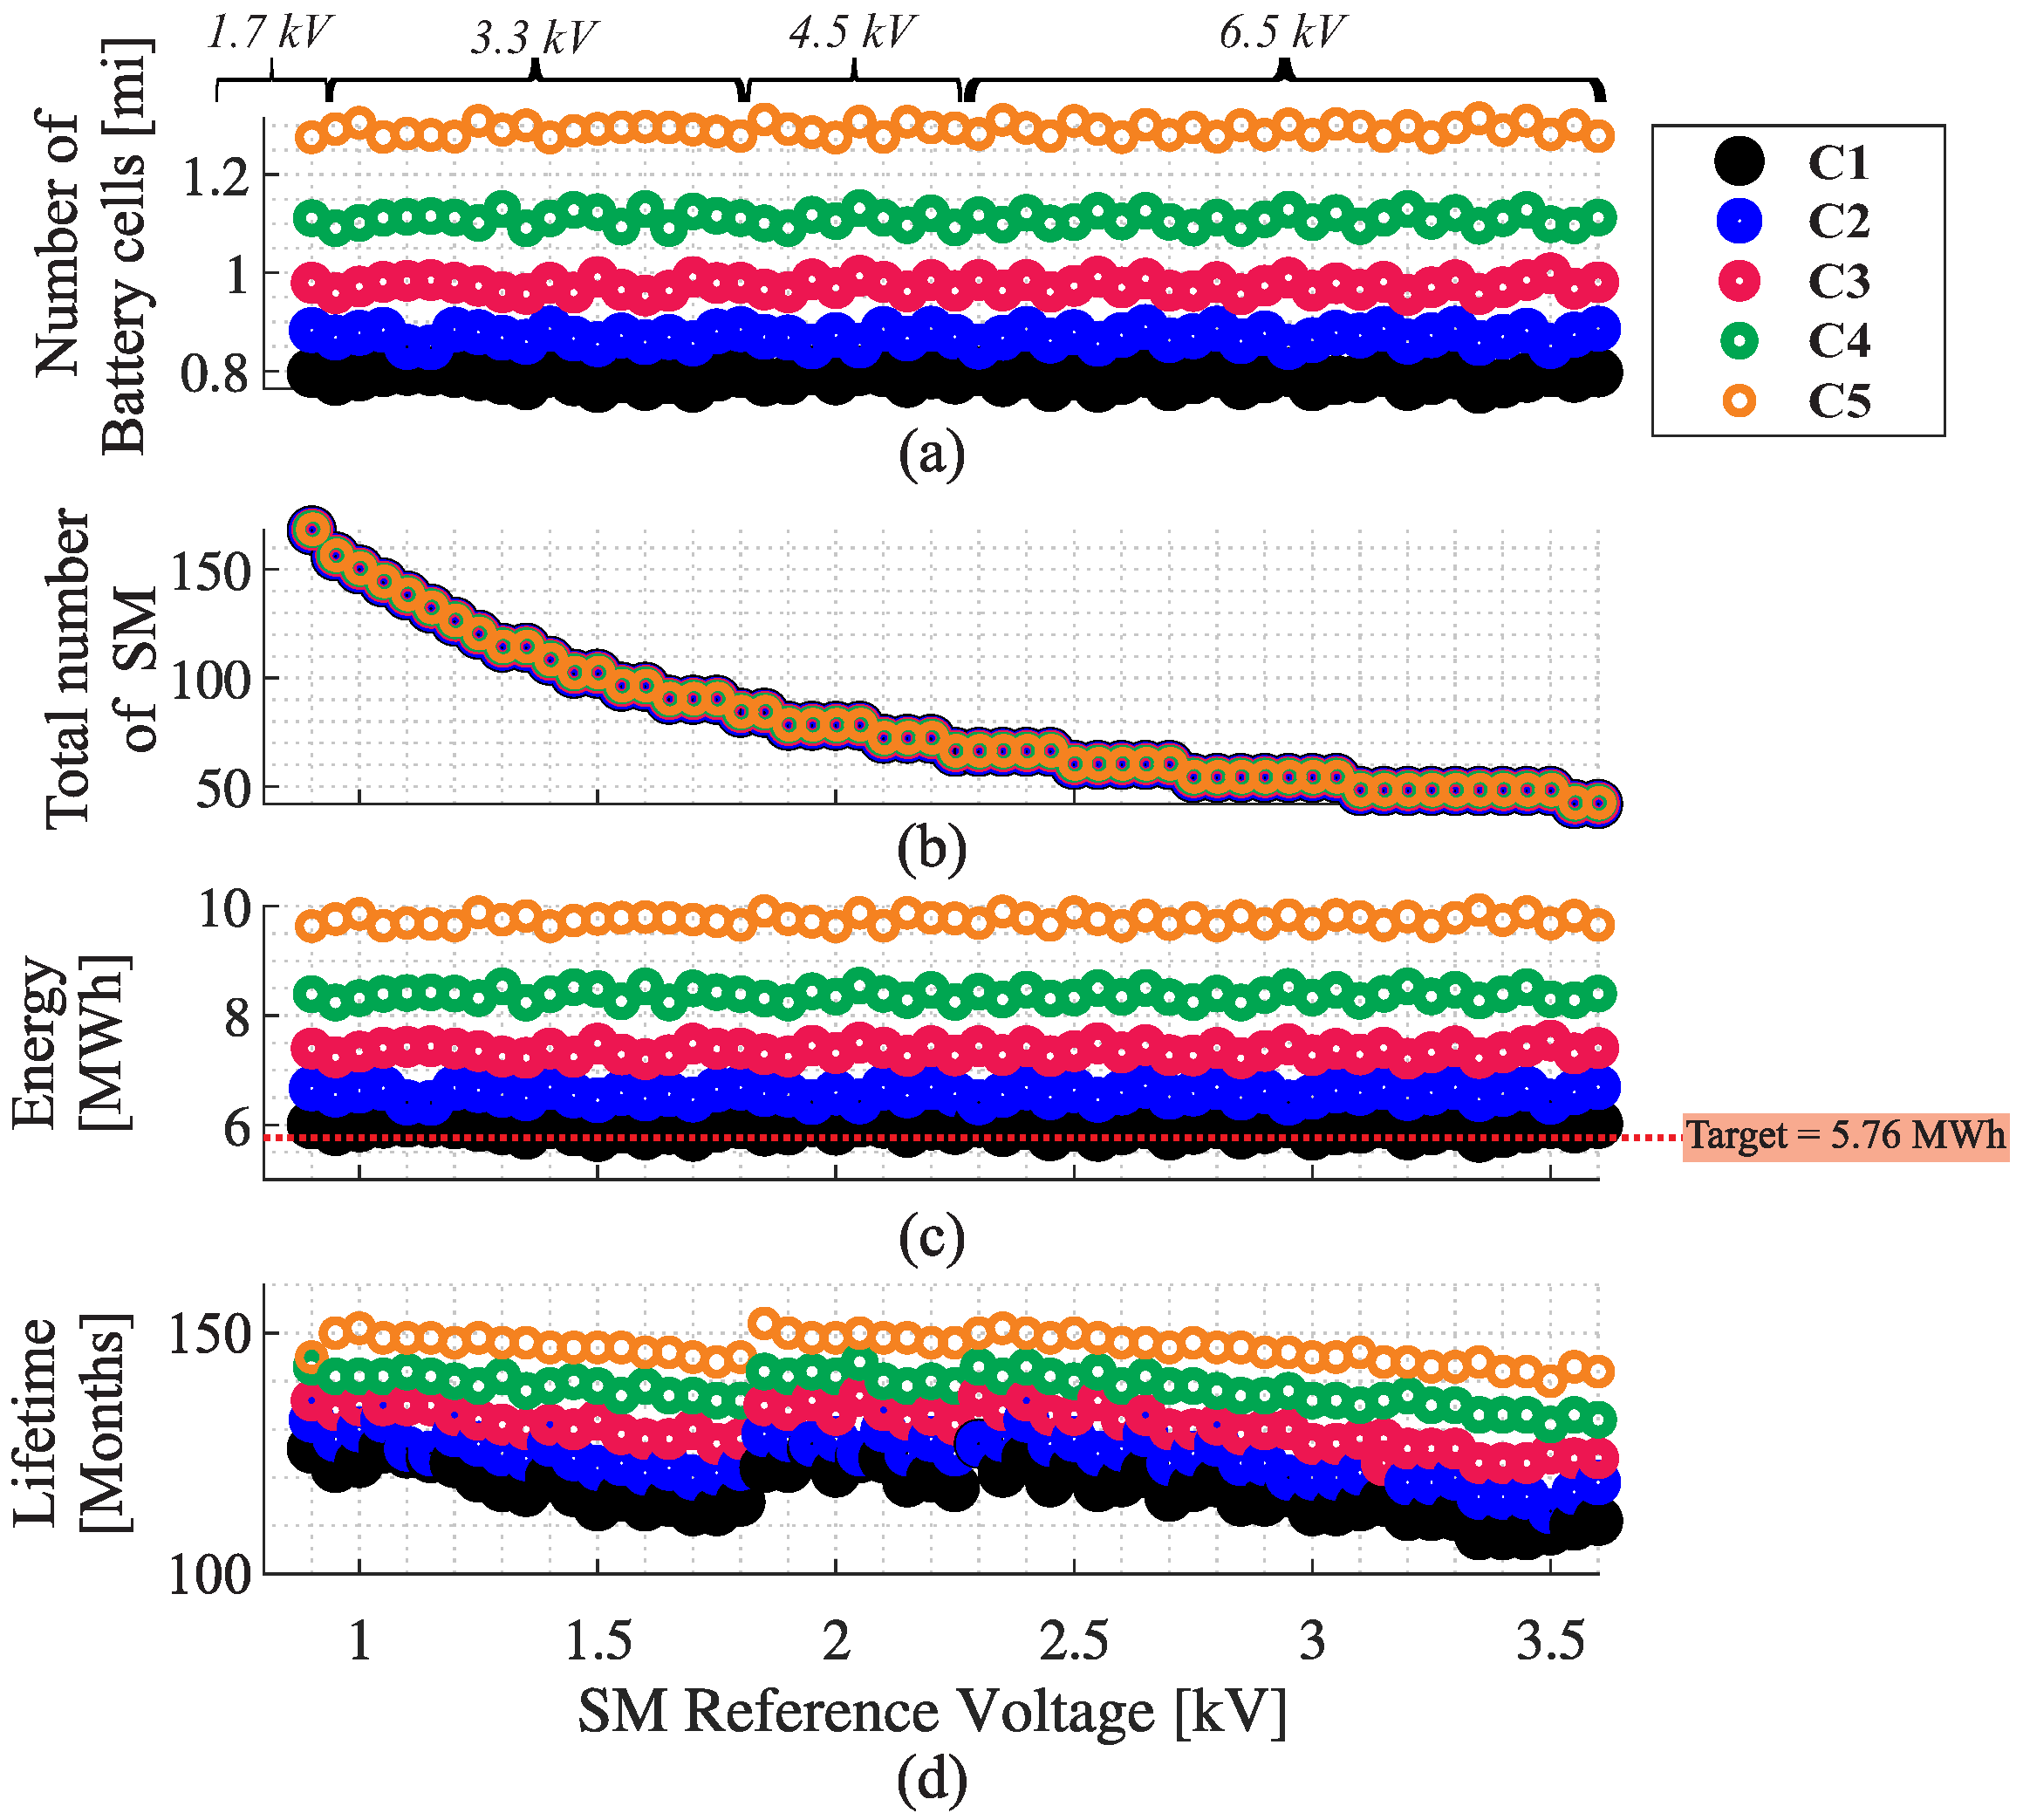
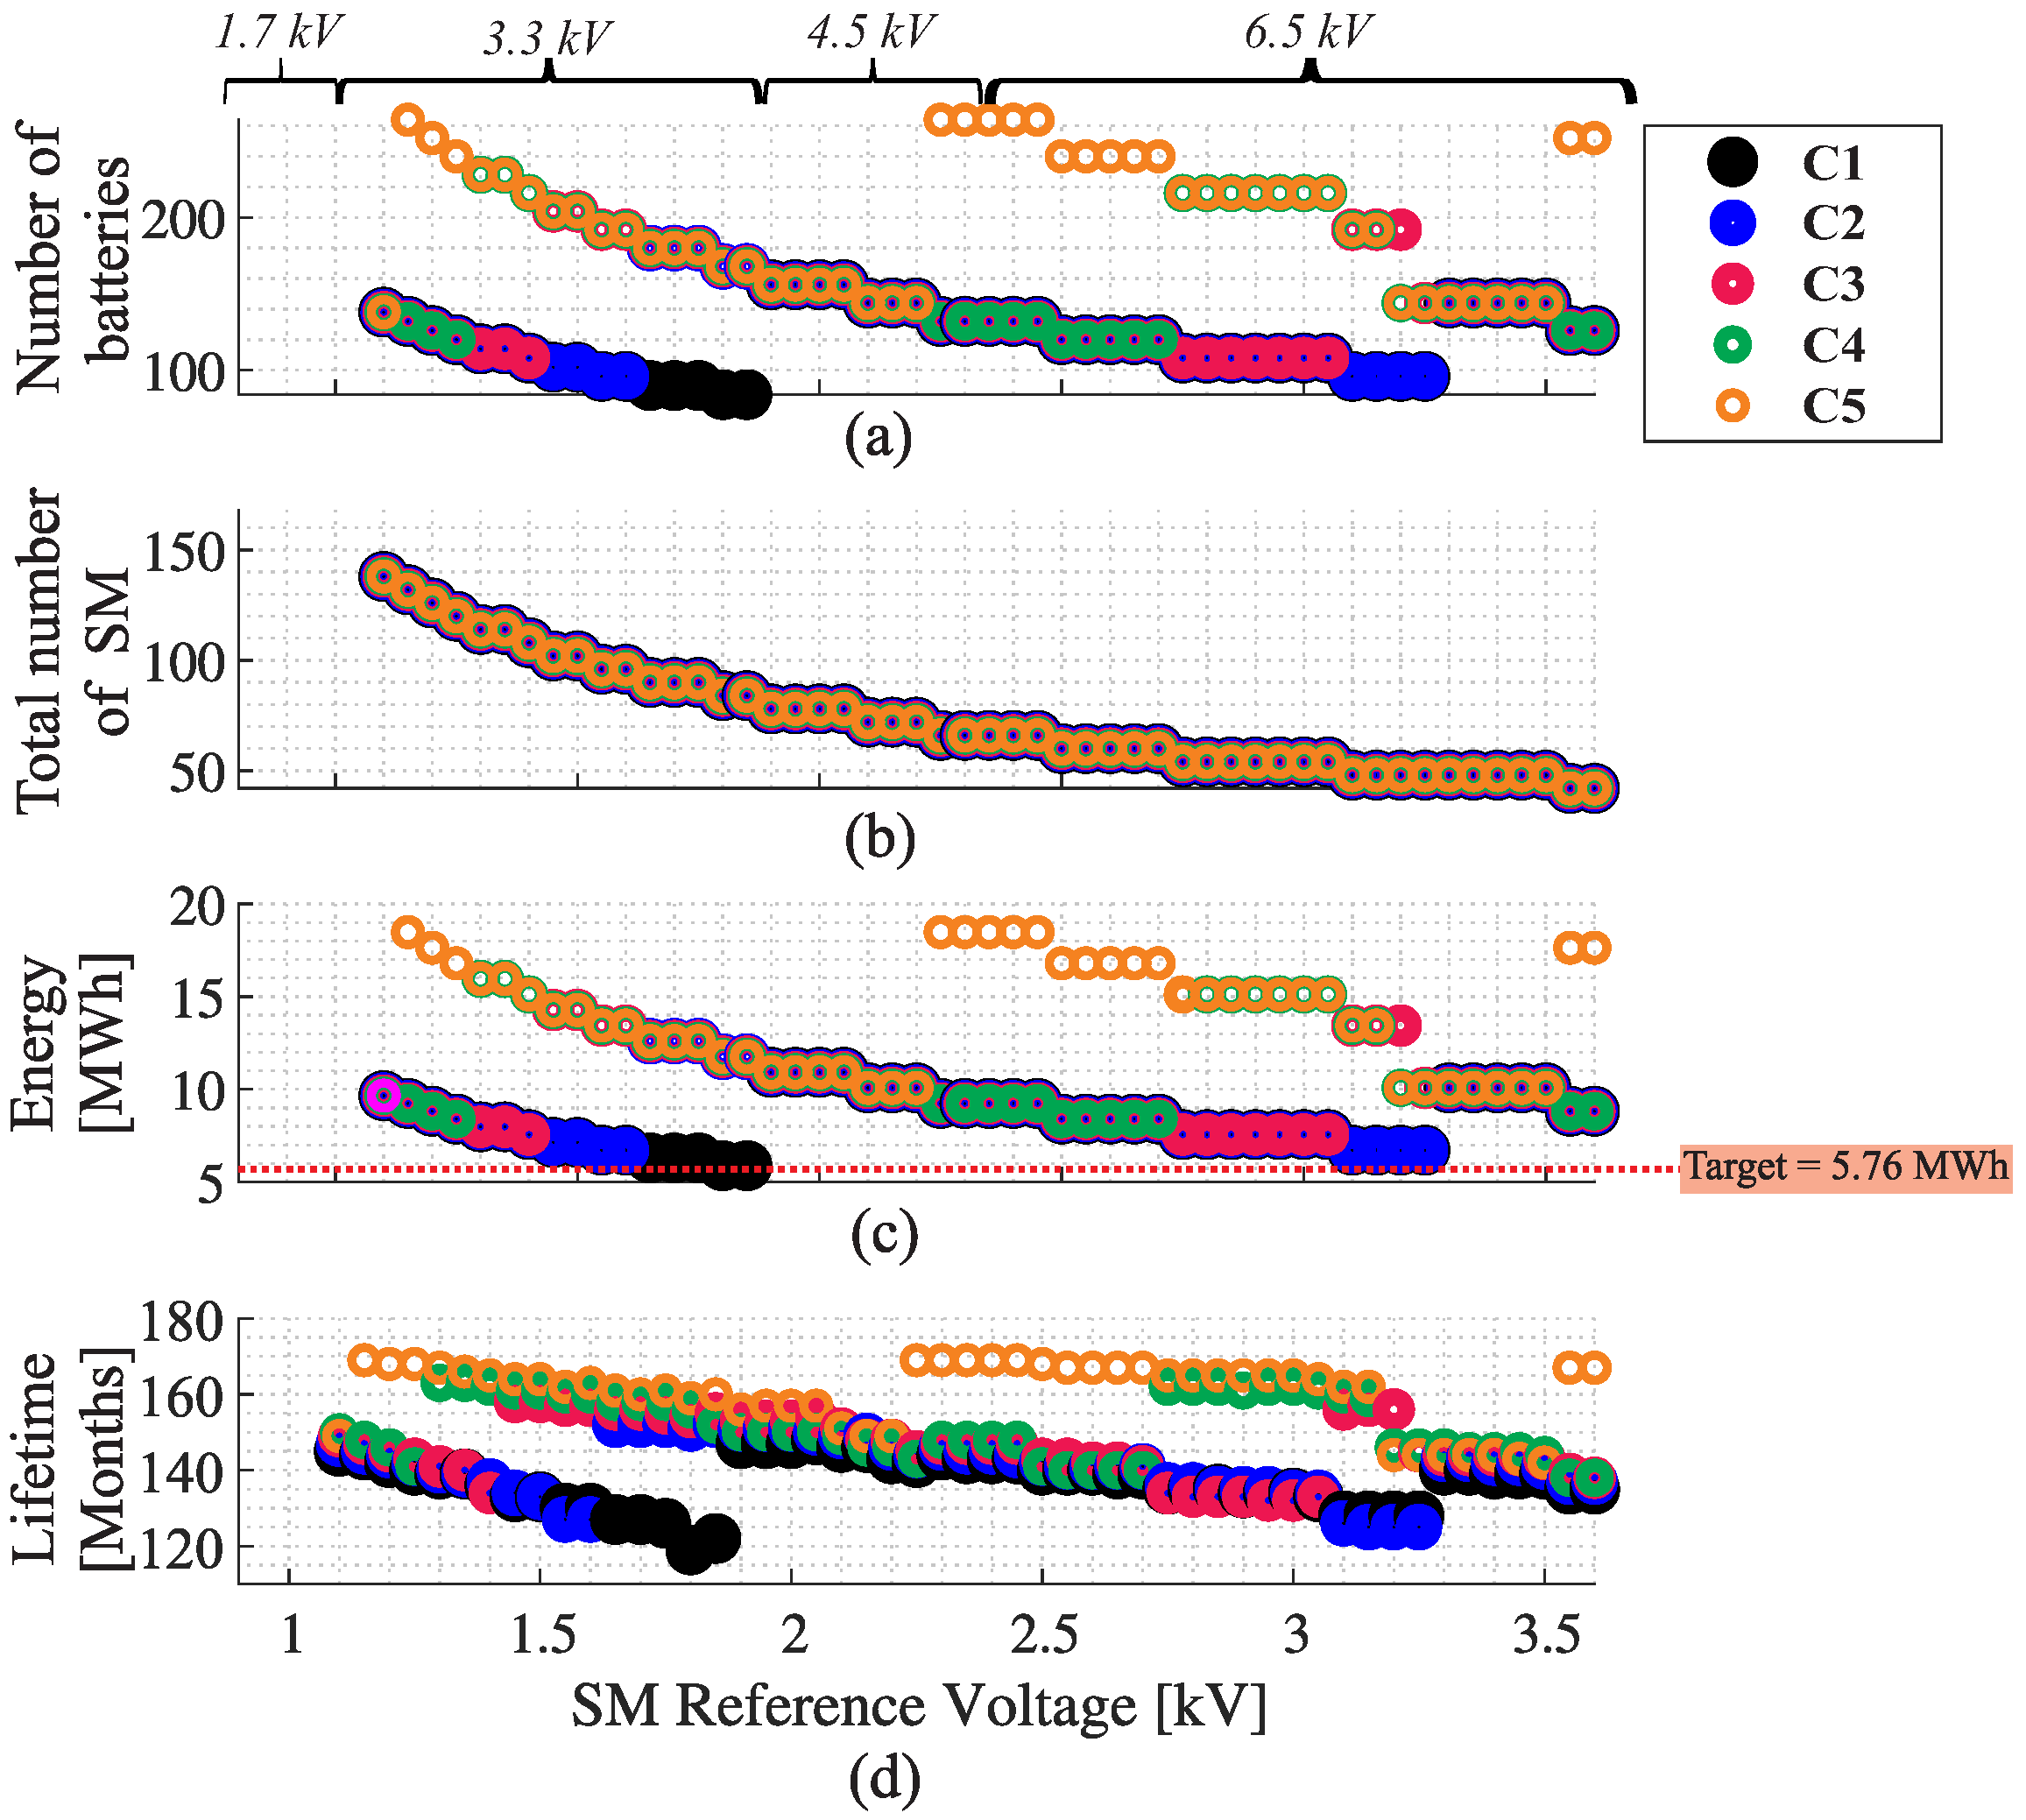
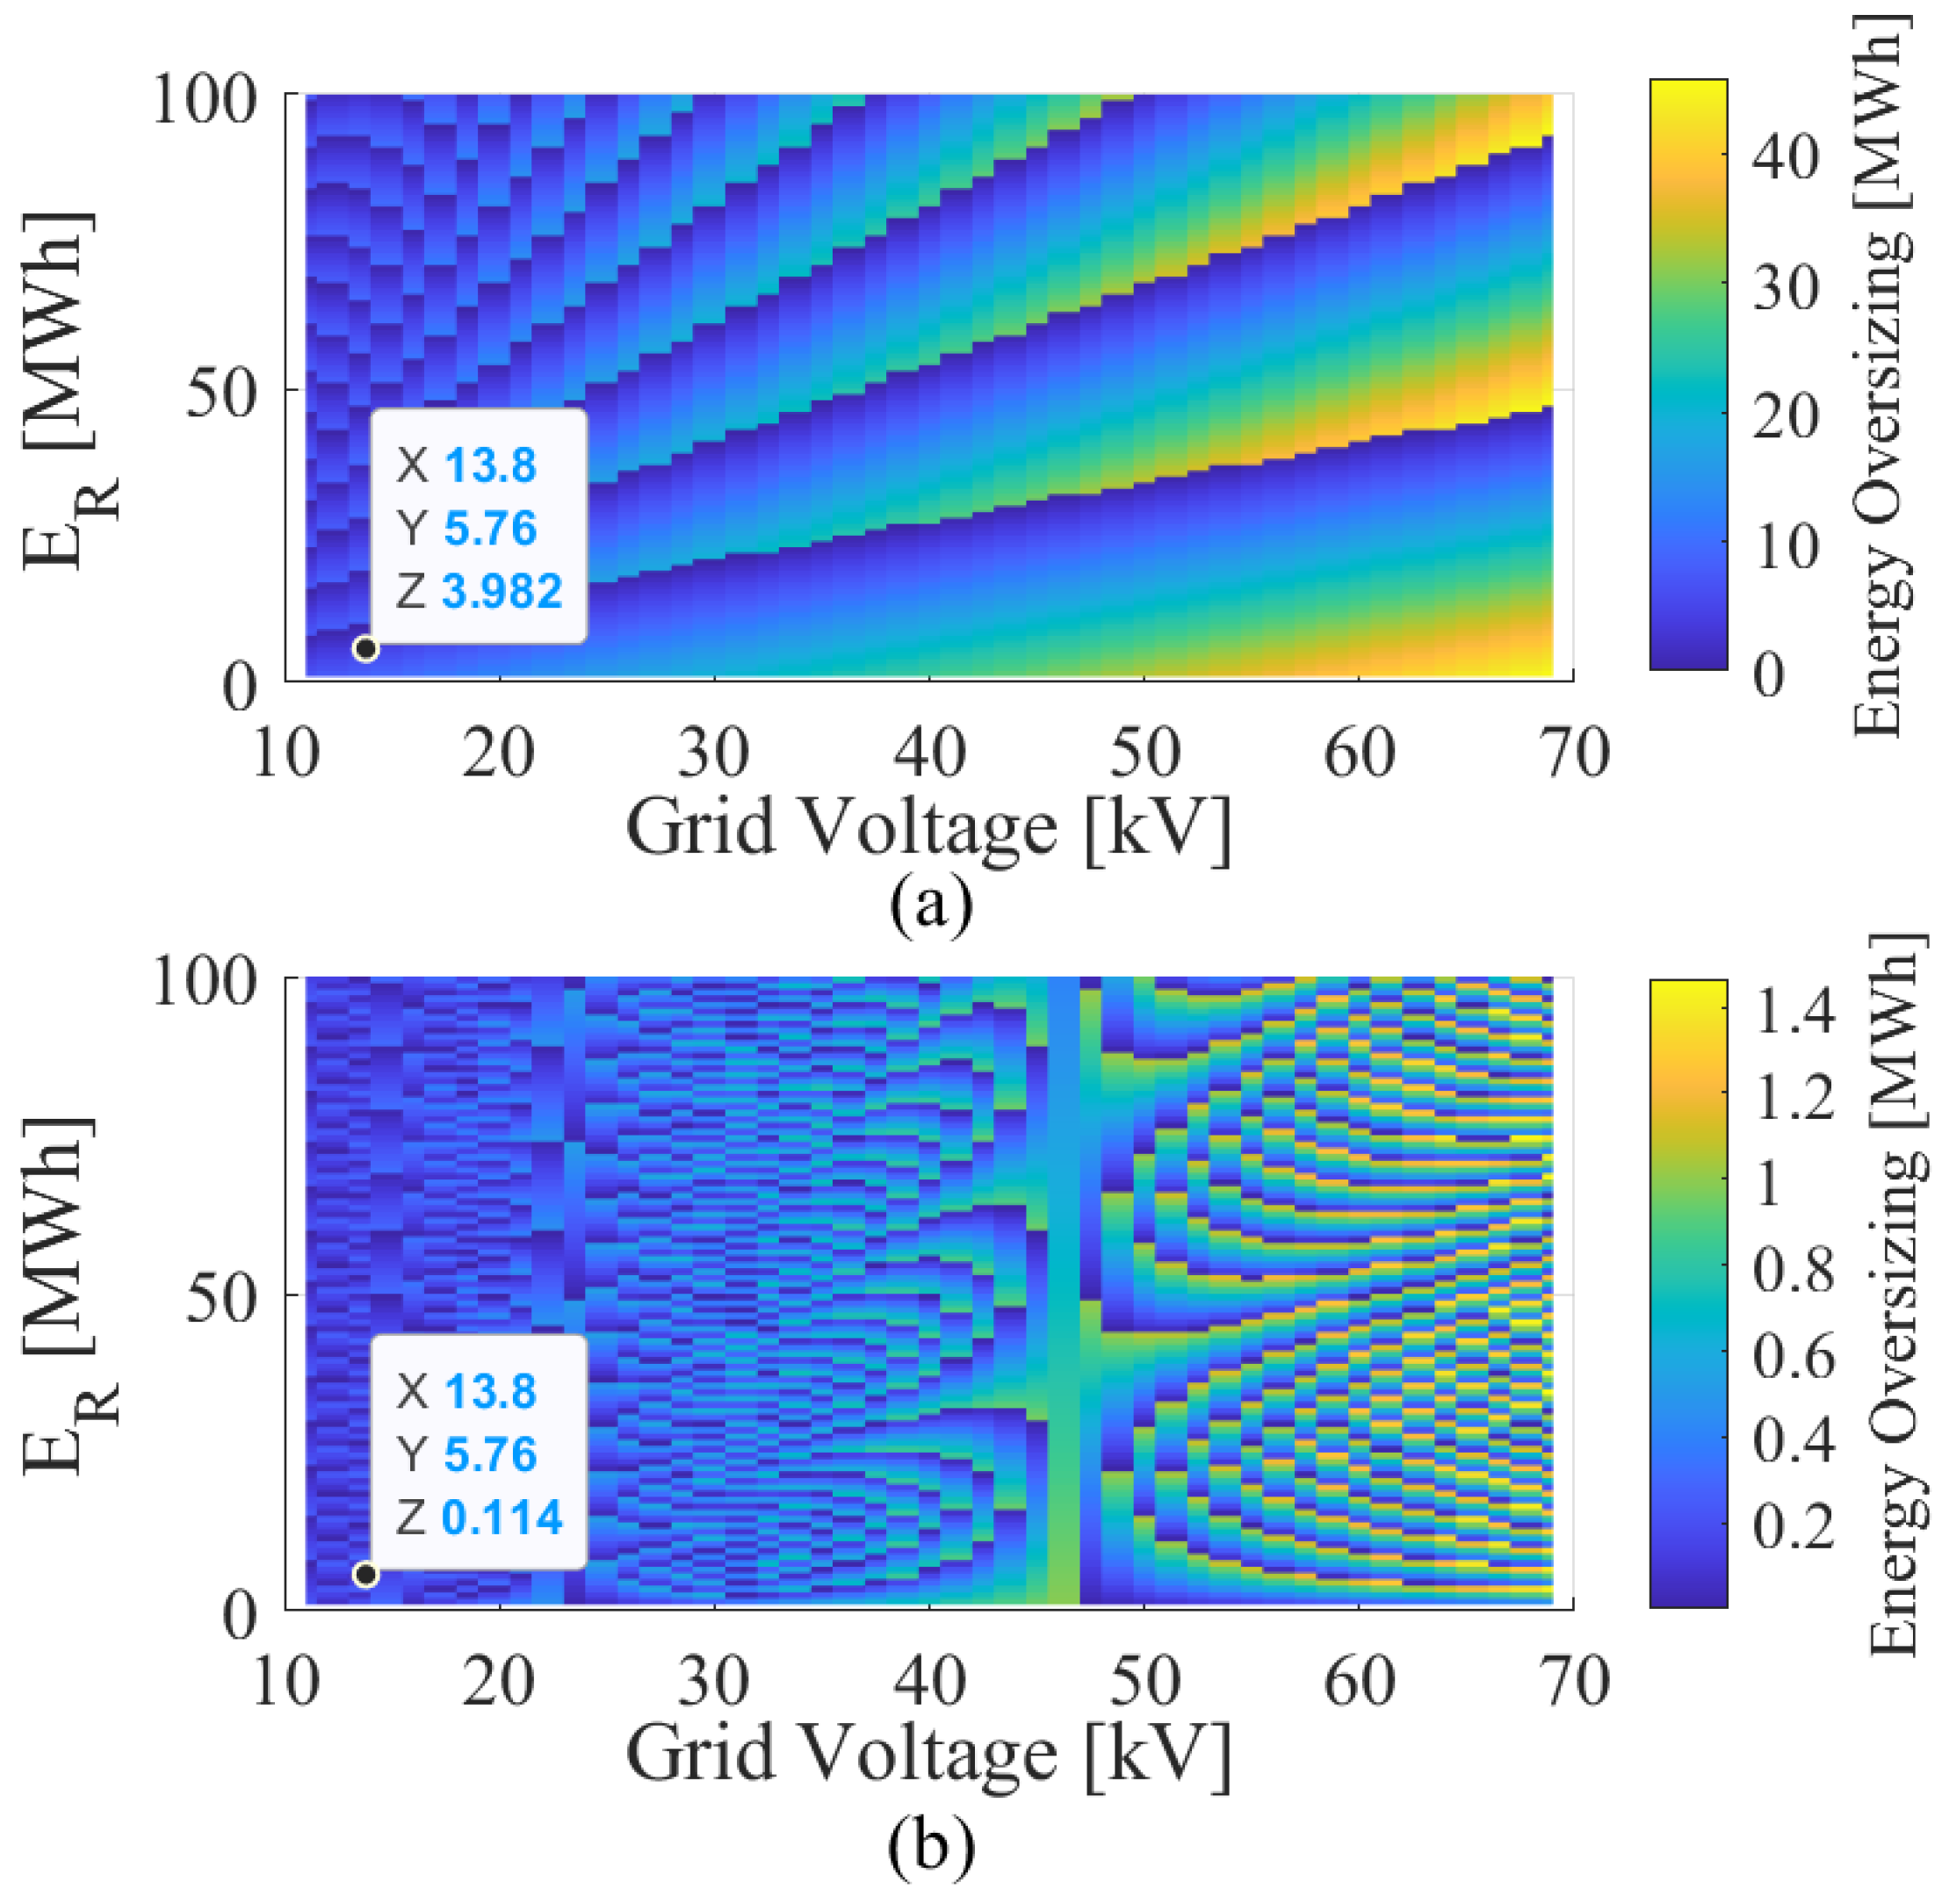
ceiling rounding functions in the BESS sizing, the required nominal energy storage capability and the actual energy storage capability can differ significantly. This difference can be measured through the energy oversizing given by:
E O = E B E R ,
where E B is the total energy of the batteries, and E R is the energy required by the system. The magnitude of E O is a function of the design ratings and the battery rack characteristics. This work investigates standard and customized solutions.
A standard solution is sized with commercially available battery racks. These battery racks have high values of voltage, energy storage, and Ah-capacity. On the other hand, the customized solution uses a battery cell with lower voltages, energy, and capacity to carry out the project.
One cell and one rack battery were selected to exemplify the consequences of rounding in the sizing for the SS and TS approaches. For the standard case study, a battery rack was chosen, and for the customized alternative, a battery cell was adopted. Table 1 presents the parameters of the battery rack and the battery cell needed to carry out this study.
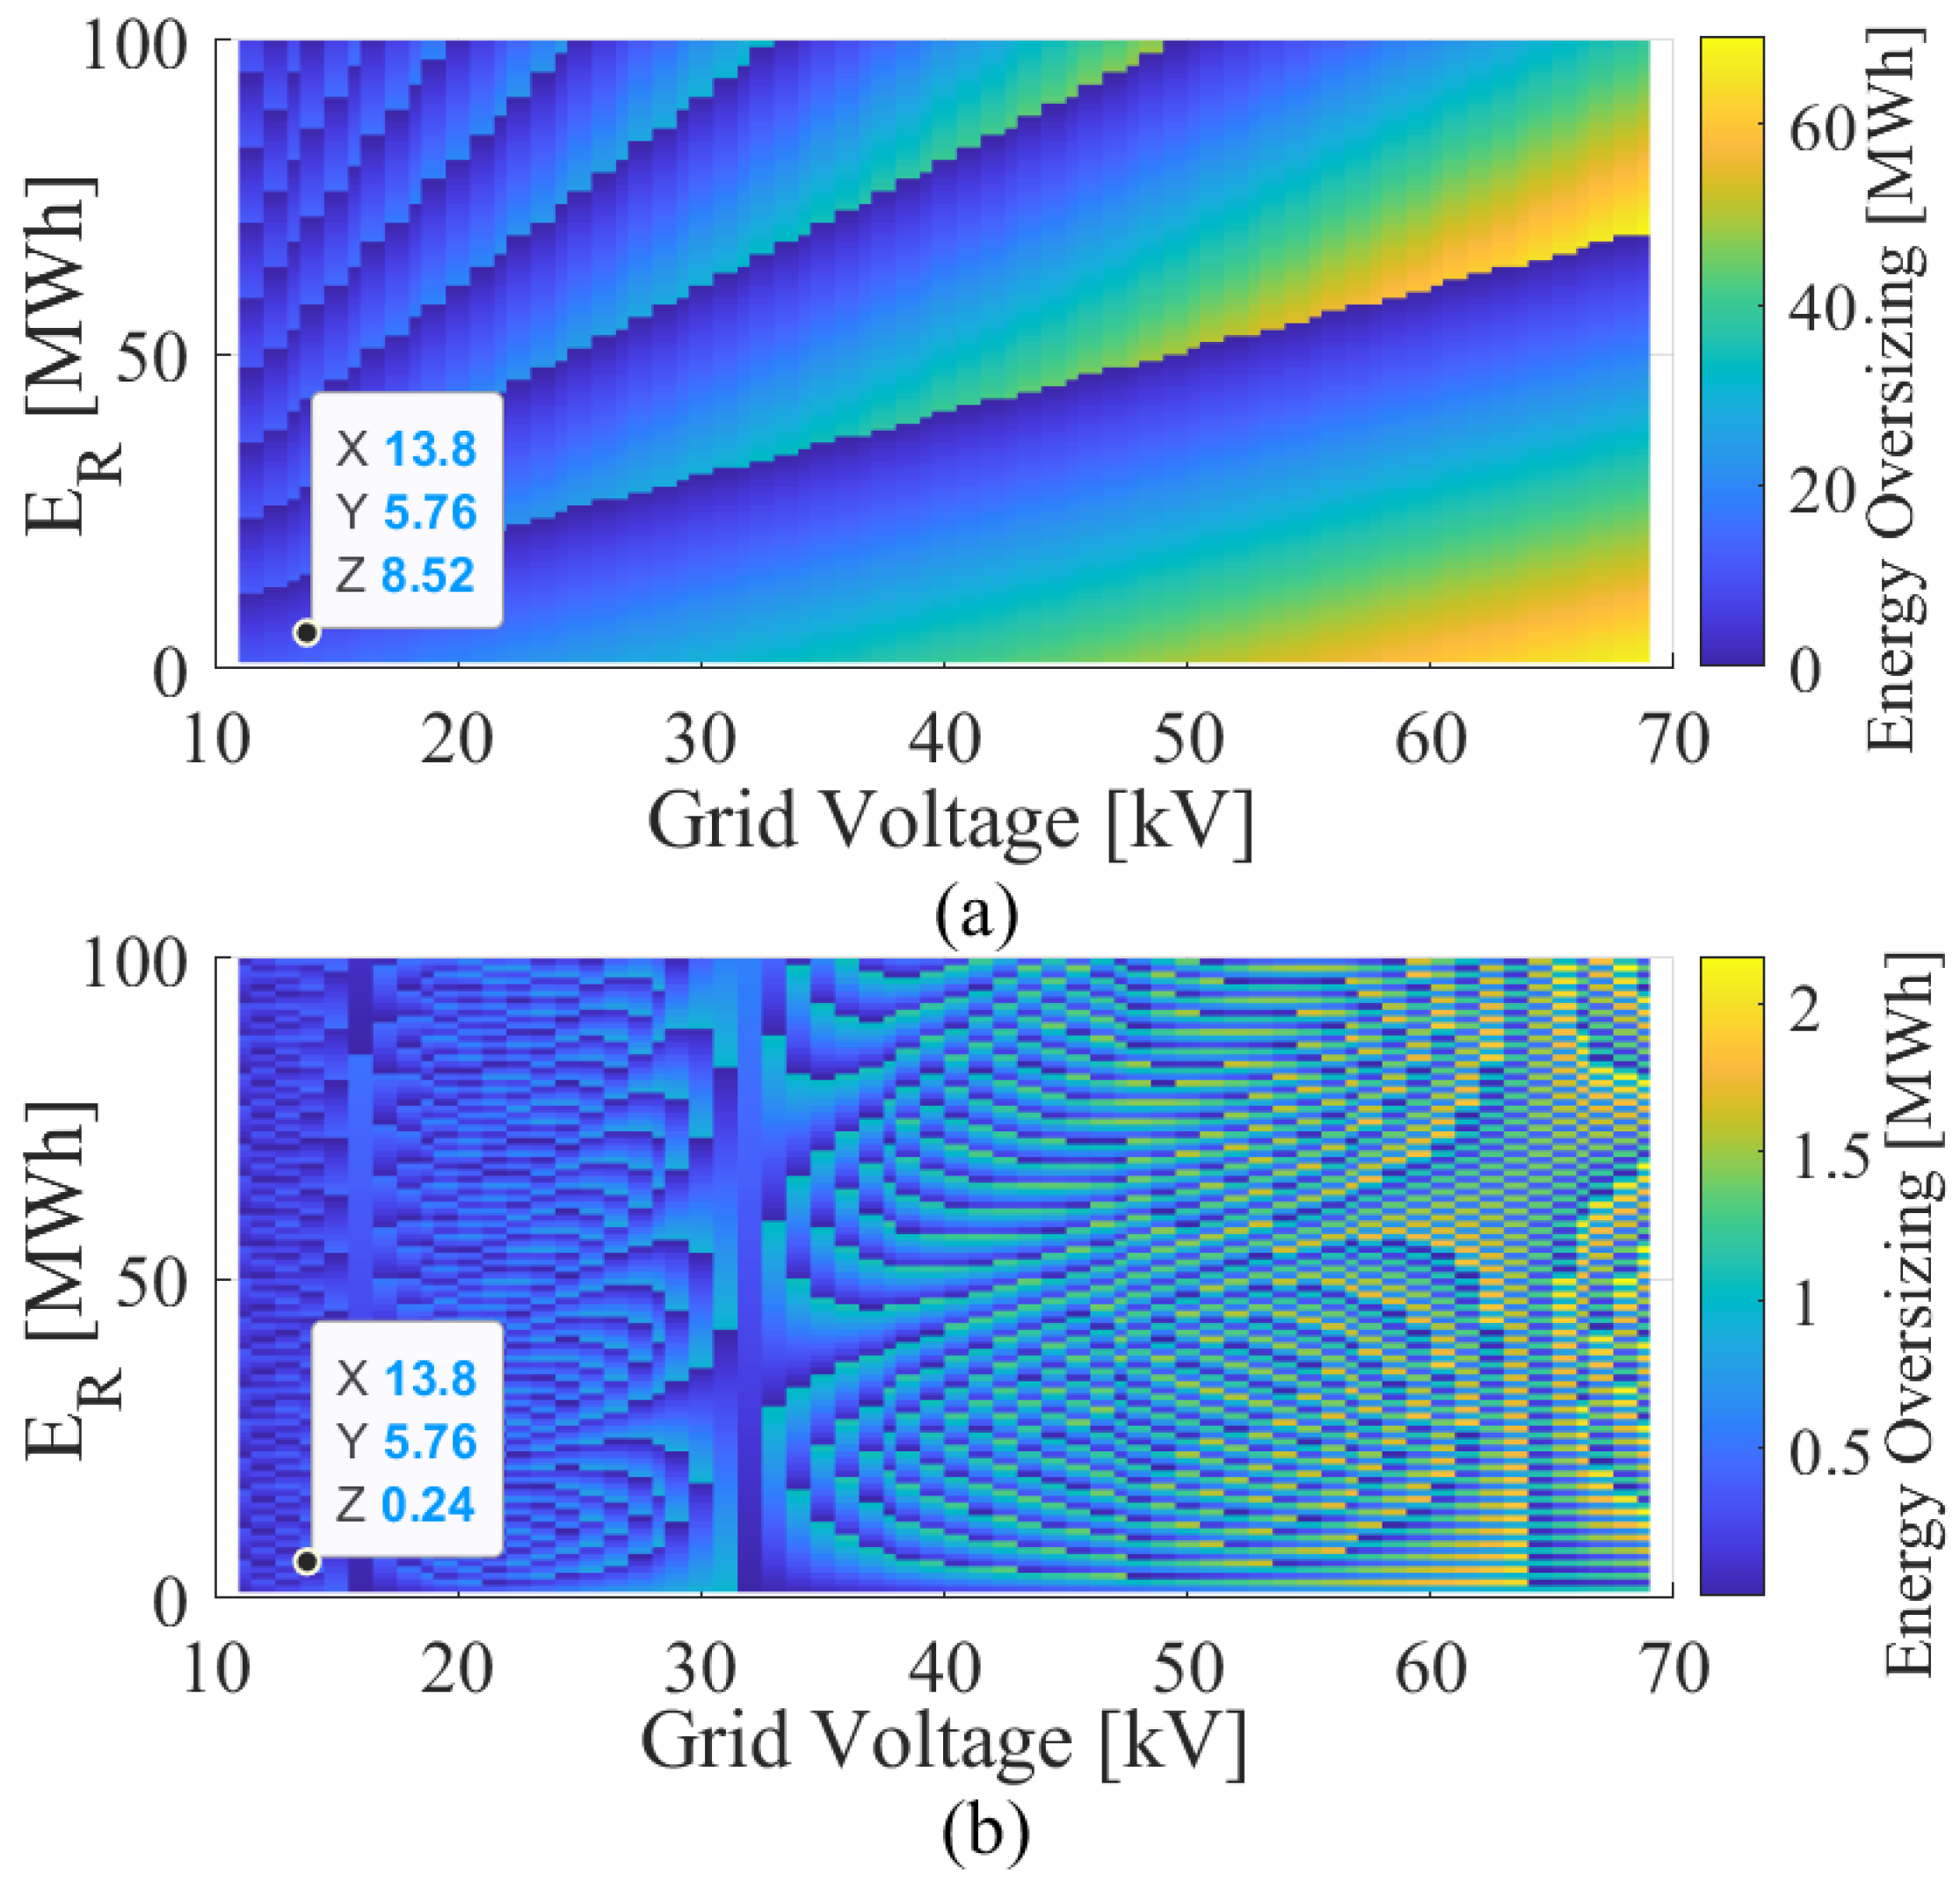
According to the parameters defined for the batteries, BESS sizing was carried out considering different values of grid voltage (11 kV to 69 kV) and energy requirements (1 MWh to 100 MWh). To exemplify the behavior of the system, IGBT-blocking voltage 4.5 kV was used for the SS and TS approaches. Furthermore, the dc-link voltage used for the tests was 2.25 kV. Note that these values are just for example, they are not necessarily the best configuration options for the SS and TS approaches.
Figure 3 presents an analysis of energy oversizing for different voltage and energy required values. In Figure 3a, the values for the standard solution are shown. Note that projects with less energy oversizing are shown diagonally in the darkest color. For the selected case study, the energy oversizing approaches 50%. On the other hand, in the customized solution shown in Figure 3b, the range of energy oversizing in the standard solution is up to 30 times higher than in the customized solution. Furthermore, more areas have less energy oversizing.
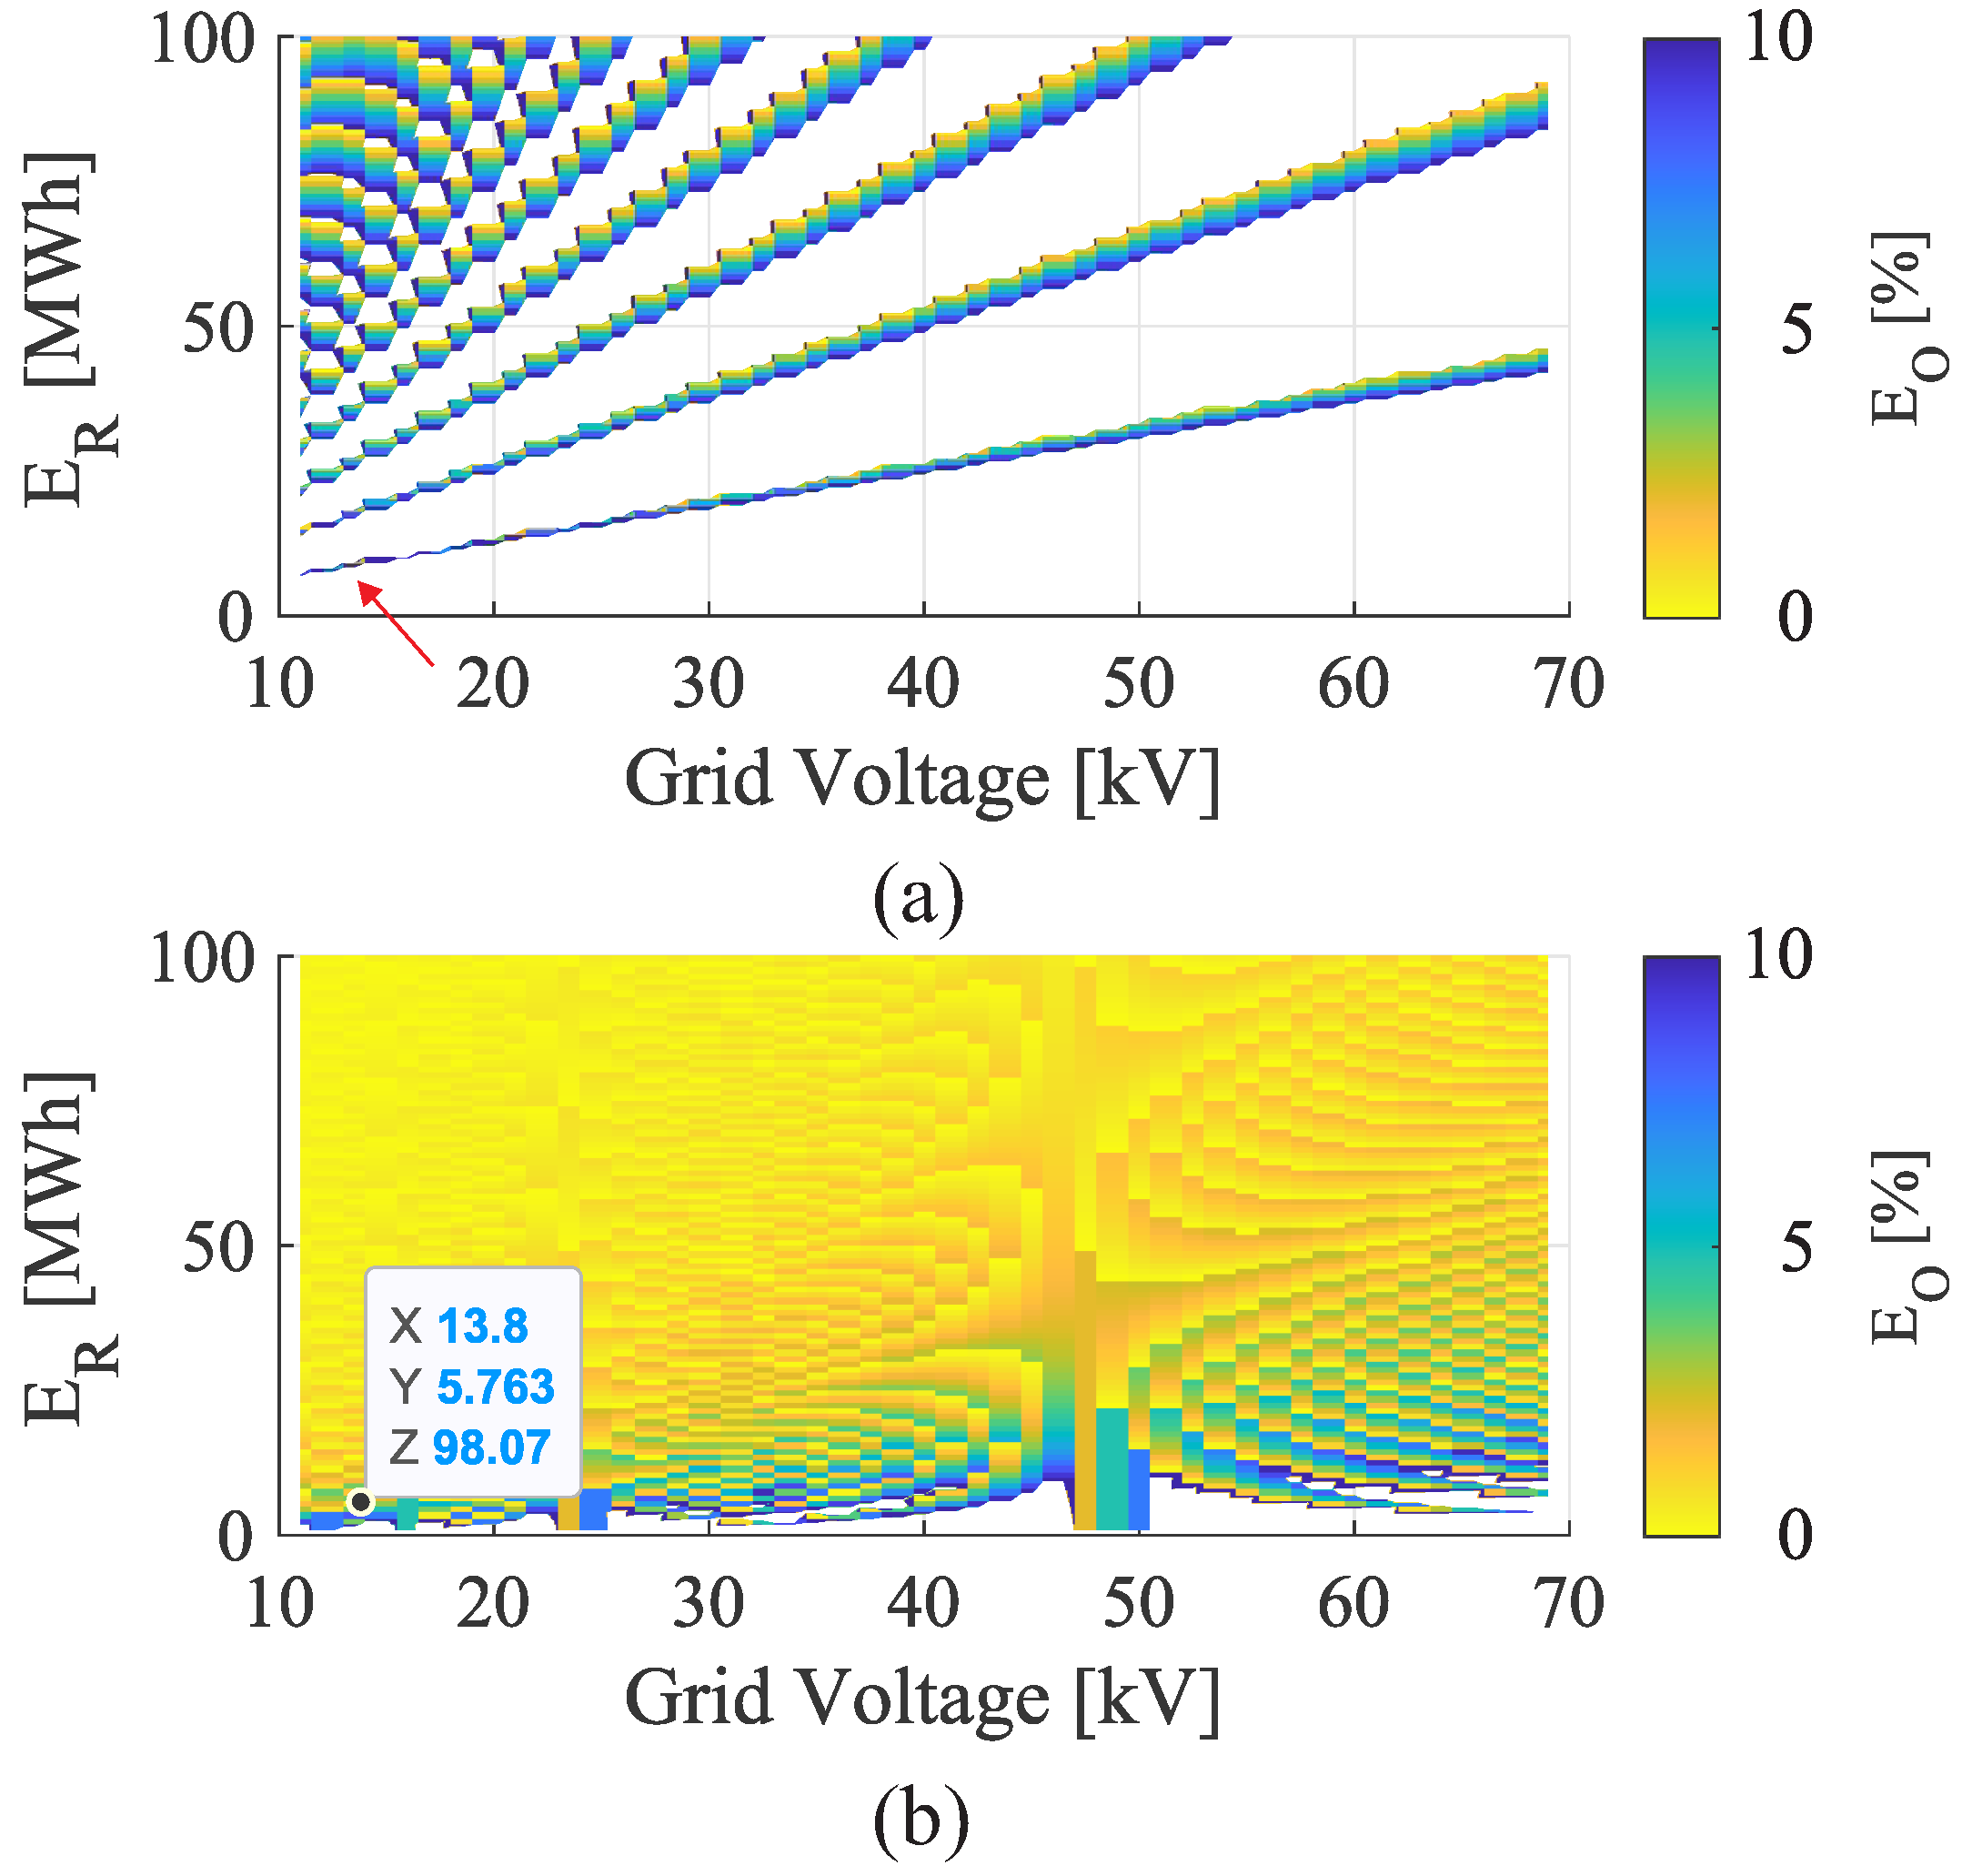
Figure 4a,b analyze the energy oversizing for the TS approach in the customized and standard solution, respectively. In the TS approach, the dc/dc converter adds a degree of freedom which makes the magnitude of energy oversizing decrease compared to the SS approach. In addition, in Figure 4b, there are more regions with less energy oversizing. Finally, the highlighted points in Figure 3 and Figure 4 refer to the case study that will be discussed in the next sections. Note that the chosen parameters E R and mains voltage do not lead to designs optimized for the standard solution.
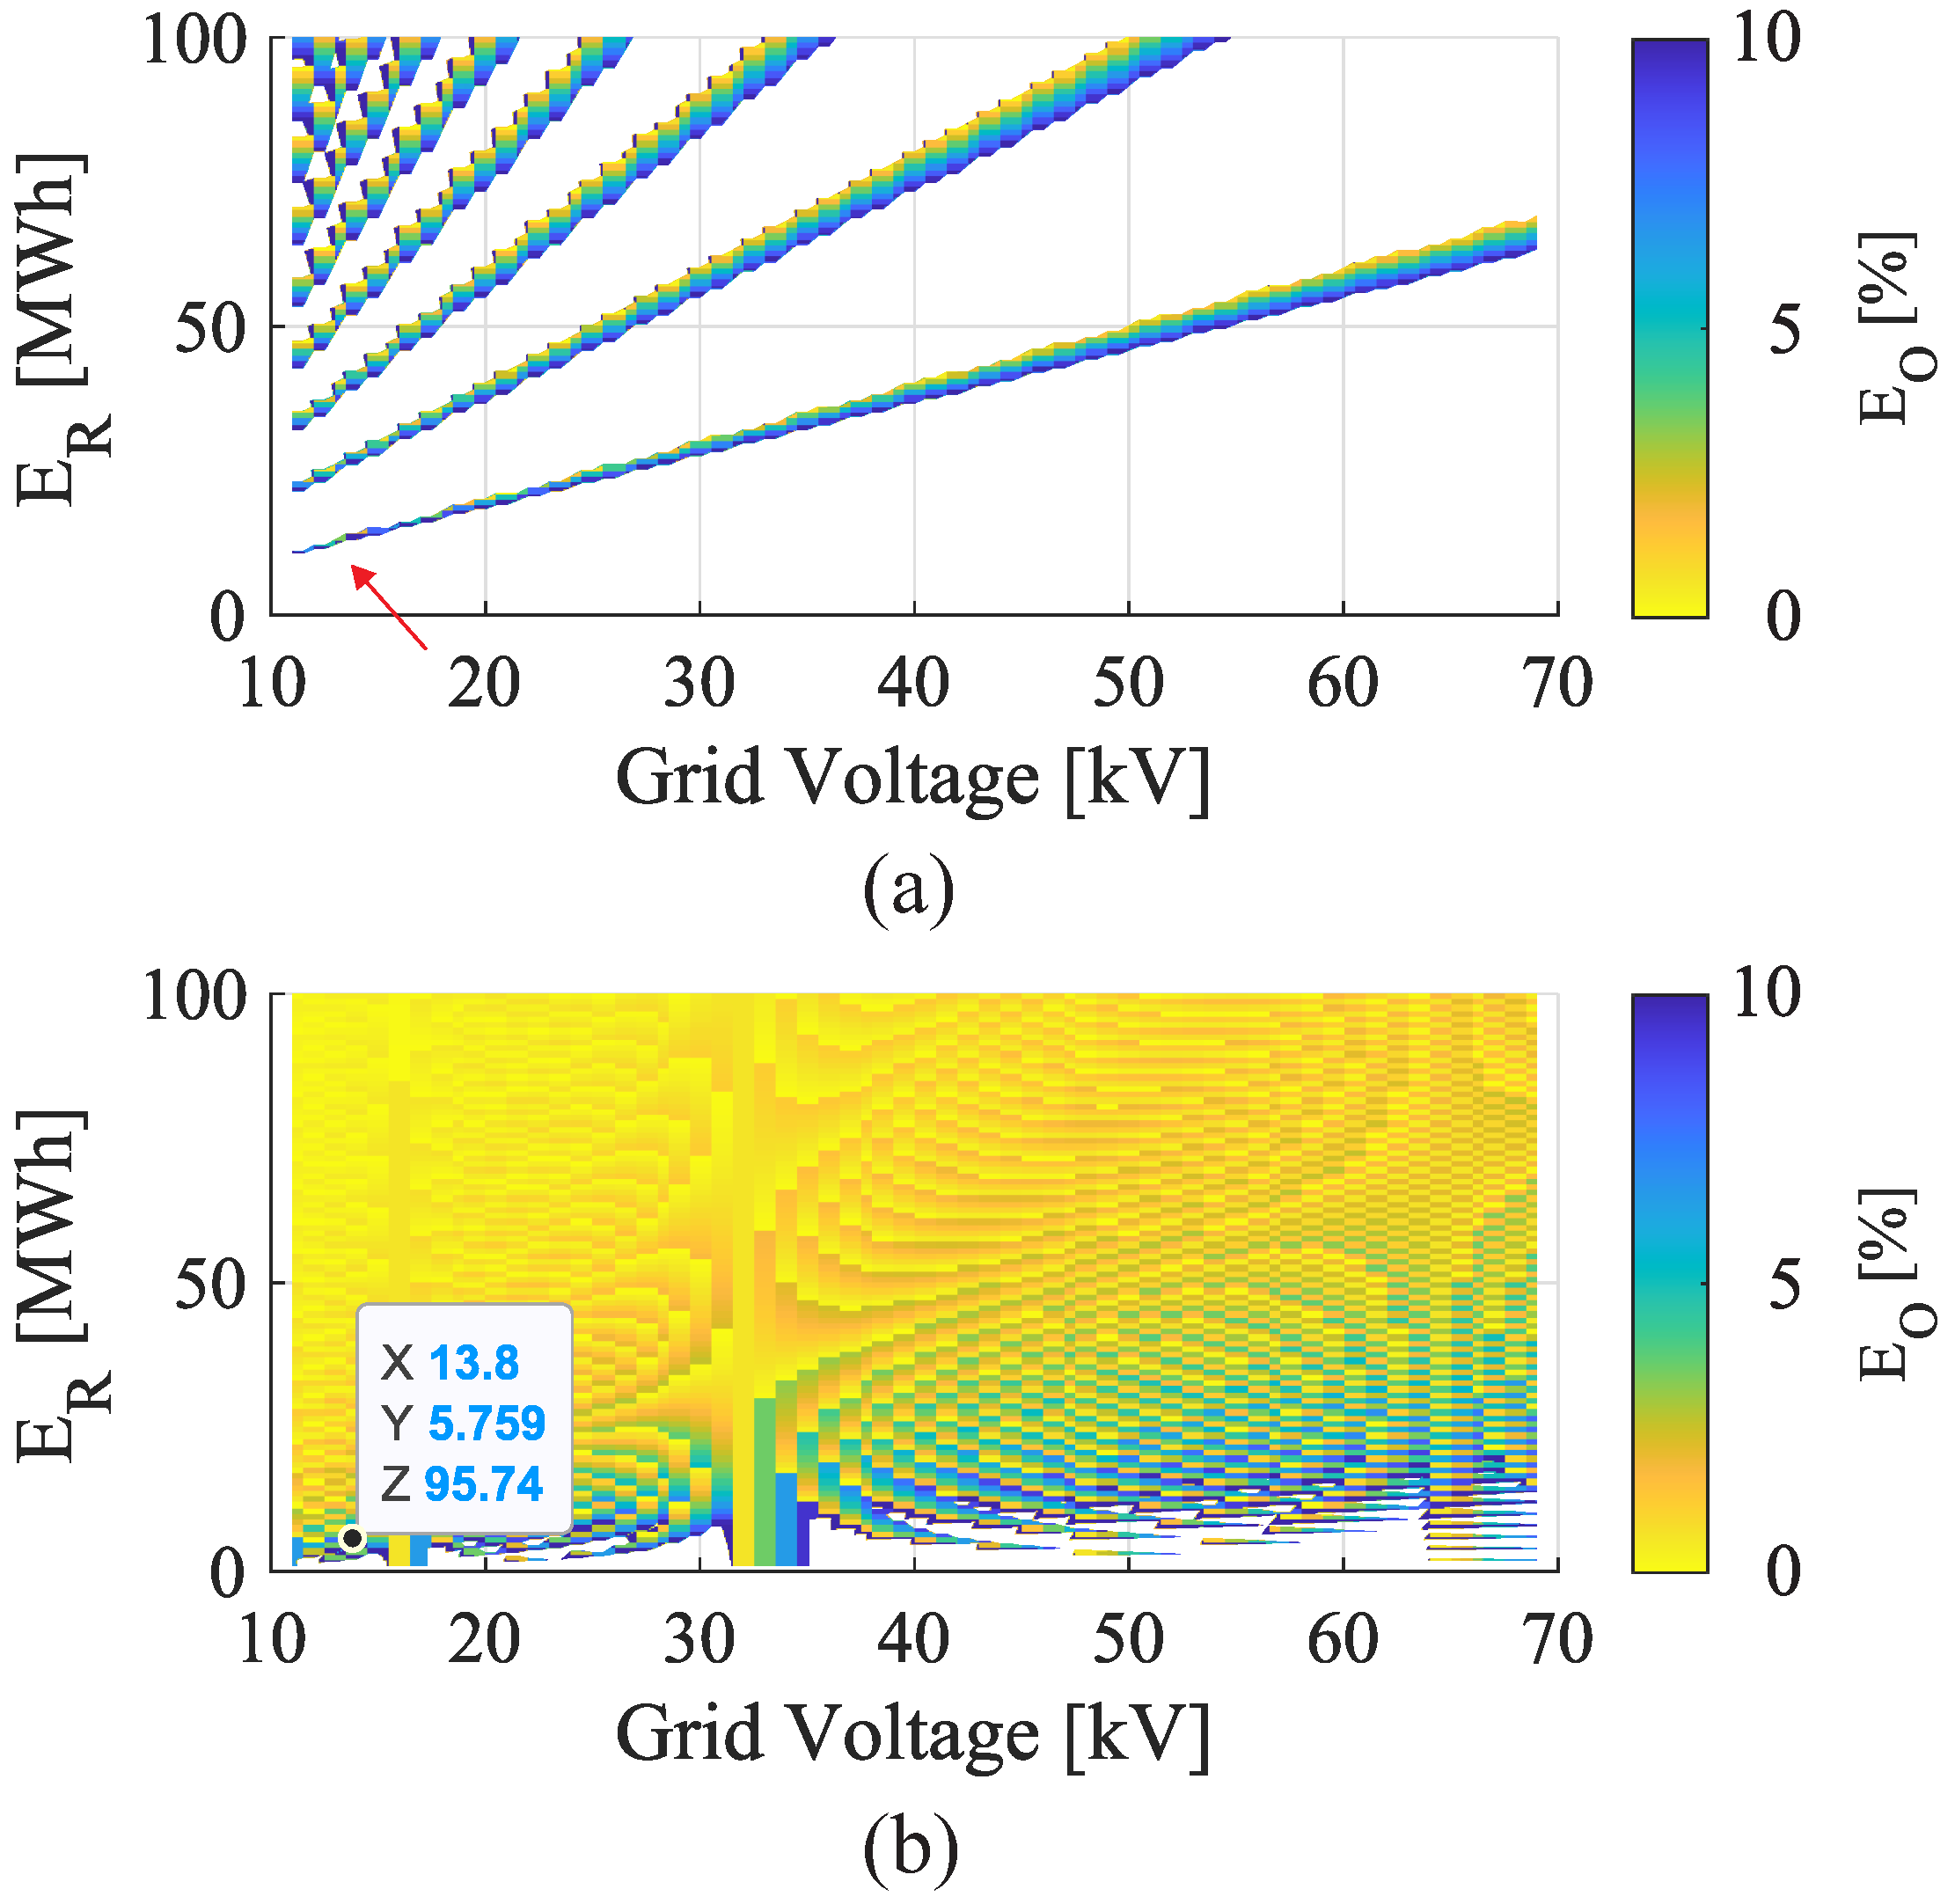
After evaluating energy oversizing for different types of projects with grid voltage and energy required, the next figures aim to select the best projects. Figure 5 selects the projects from Figure 3 that have a maximum of 10% energy oversizing. In the standard solution shown in Figure 5a, note that the point selected in Figure 3a is not within the applied limit. As for the customized solution shown in Figure 5b, it shows that the point selected in Figure 3b is within the stipulated 10% limit.
Figure 6a presents the projects selected for the TS approach in the standard solution. Note that the project selected in Figure 4 is not contained within the established limit. Considering the TS approach customized solution presented in Figure 6b, the projects contemplate the energy oversizing closer to 0%. However, in the same way as in Figure 5b, for low values of required energy, few projects are selected.
As noted, battery behavior and characteristics are important for design analysis. In addition, the TS approach offers more flexibility, reducing the oversizing factor for some solutions. It is worth mentioning that another degree of freedom is the voltage change SM in a TS approach, as discussed in [15].

5. Case Study

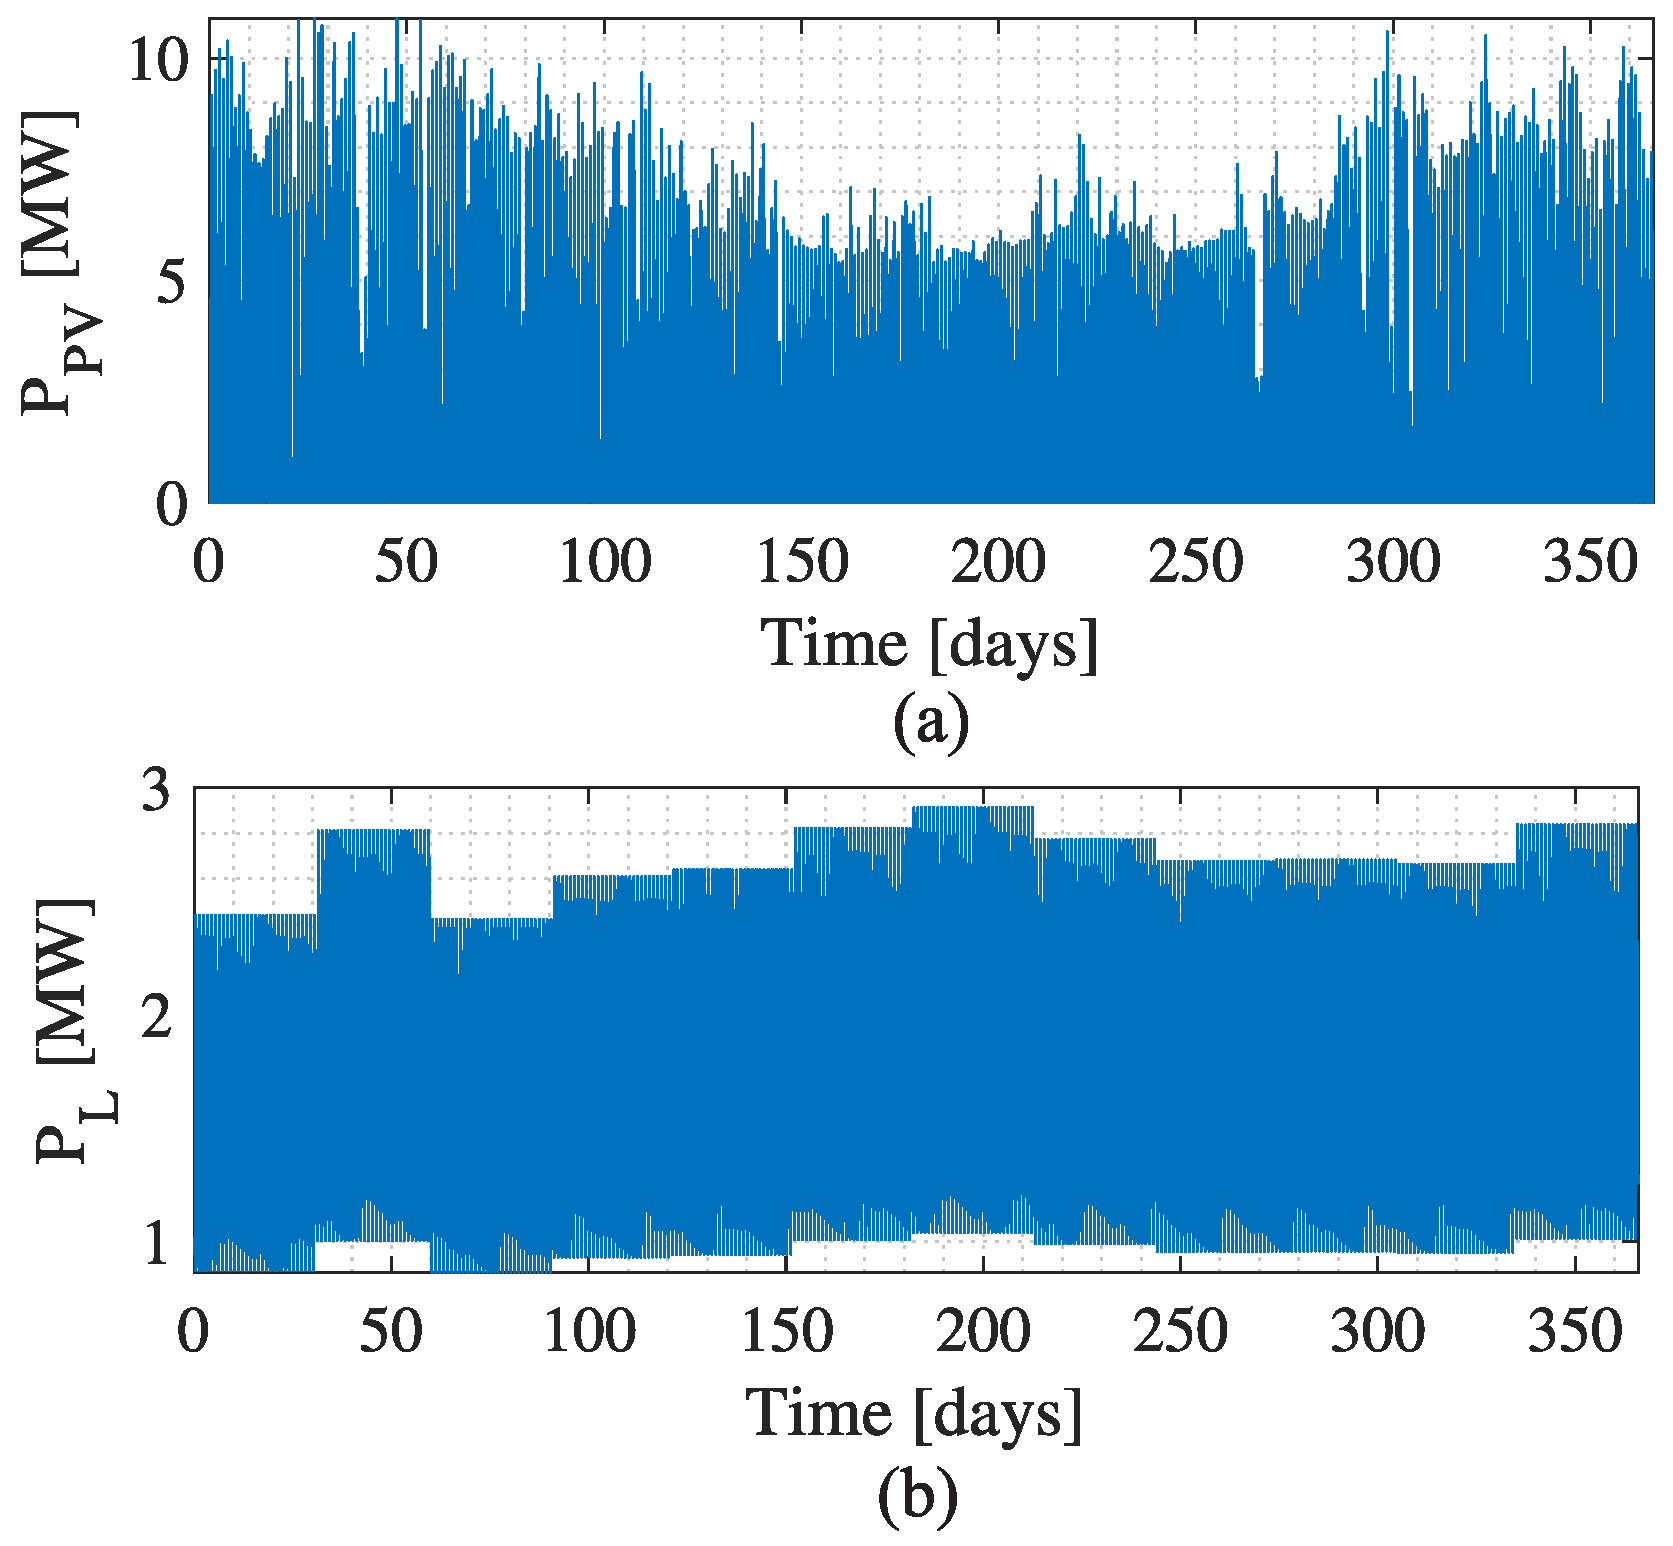
Figure 7a shows the PV power plant generation for the city of Viçosa in the state of Minas Gerais, Brazil, based on a 10 MW PV system. In addition, Figure 7b presents the active power profile over one year for a typical load at the Federal University of Viçosa.
The association of an MMC-based BESS with a grid and the load consists of generating and storing energy at the lowest tariff time (off-peak hours) and using it at the highest tariff interval (peak hours). In order not to charge demand at peak hours, the load has to be supplied throughout the entire collection time interval. This period of time and days analyzed varies by location and utility. In this work, an interval of 3 h was considered, from 5 p.m. to 8 p.m. (except on weekends).
The parameters adopted to carry out the study of the MMC-based BESS are presented in Table 2.
Based on experimental results for a single LiFePO 4 battery from [27], the OCV characteristic of a single battery cell as a function of the SOC is presented in Figure 8a. This curve was estimated based on a curve-fitting with an 11-order polynomial. Then, these values were extrapolated to estimate the curve for the Samsung battery rack as shown in Figure 8b.
Reference [27] presents the experimental results for a LiFePO 4 battery. Based on this study, Figure 8a presents the OCV per SOC curve for a battery. Figure 8b shows a polynomial analysis performed to determine the equation that corresponds to it. In this study, the fit obtained was an 11-order polynomial.
In the case studies adopted for the MMC-based BESS, minimum and maximum SOC intervals were considered. The minimum values were between 0 SOC m i n 20 %. The five scenarios are shown in Table 3.
In the SM and the dc/dc converter, the HiPak power modules manufactured by ABB were used. Table 4 presents their respective blocking voltages.
Both SM and dc/dc converters used the same blocking voltage. In the development of the thermal project, the power modules of the converters were installed in the same heatsink. In [7,15], how to calculate the respective parameters is discussed.
The power losses in semiconductor devices are divided into conduction ( P c o n d ) and switching losses ( P s w ). The P c o n d has a direct relationship with the duty cycle of the converter [28]. In addition, other power losses are observed in the passive elements of the converter, i.e., capacitors and inductors. This work proposes a methodology to obtain losses for an MMC-based BESS single and TS approach. PLECS and MATLAB/Simulink software was used to simulate the power losses of each system as mentioned in [7,15].
In the SS approach, the semiconductor device losses of the SM and ohmic losses in the arm inductors were considered in the power losses estimation. On the other hand, in the TS approach, the semiconductor device losses of the SM, ohmic losses in the arm inductors, and ohmic losses in the dc/dc converter were considered in the power losses estimation.
Calculating the power losses in the SS, the losses in the semiconductors, and the ohmic losses in the inductors of each arm were considered. In the TS, all those mentioned in the SS plus the losses related to the dc/dc convert were considered. The energy loss estimates were performed considering different operating conditions, considering a range of −1 pu to 1 pu of power for the generation of look-up tables. In addition, a mission profile with one-year of operation for an MMC-based BESS is used to calculate all converter power losses. The mission profile adopted in this work was based on the methodology described in [7,15].
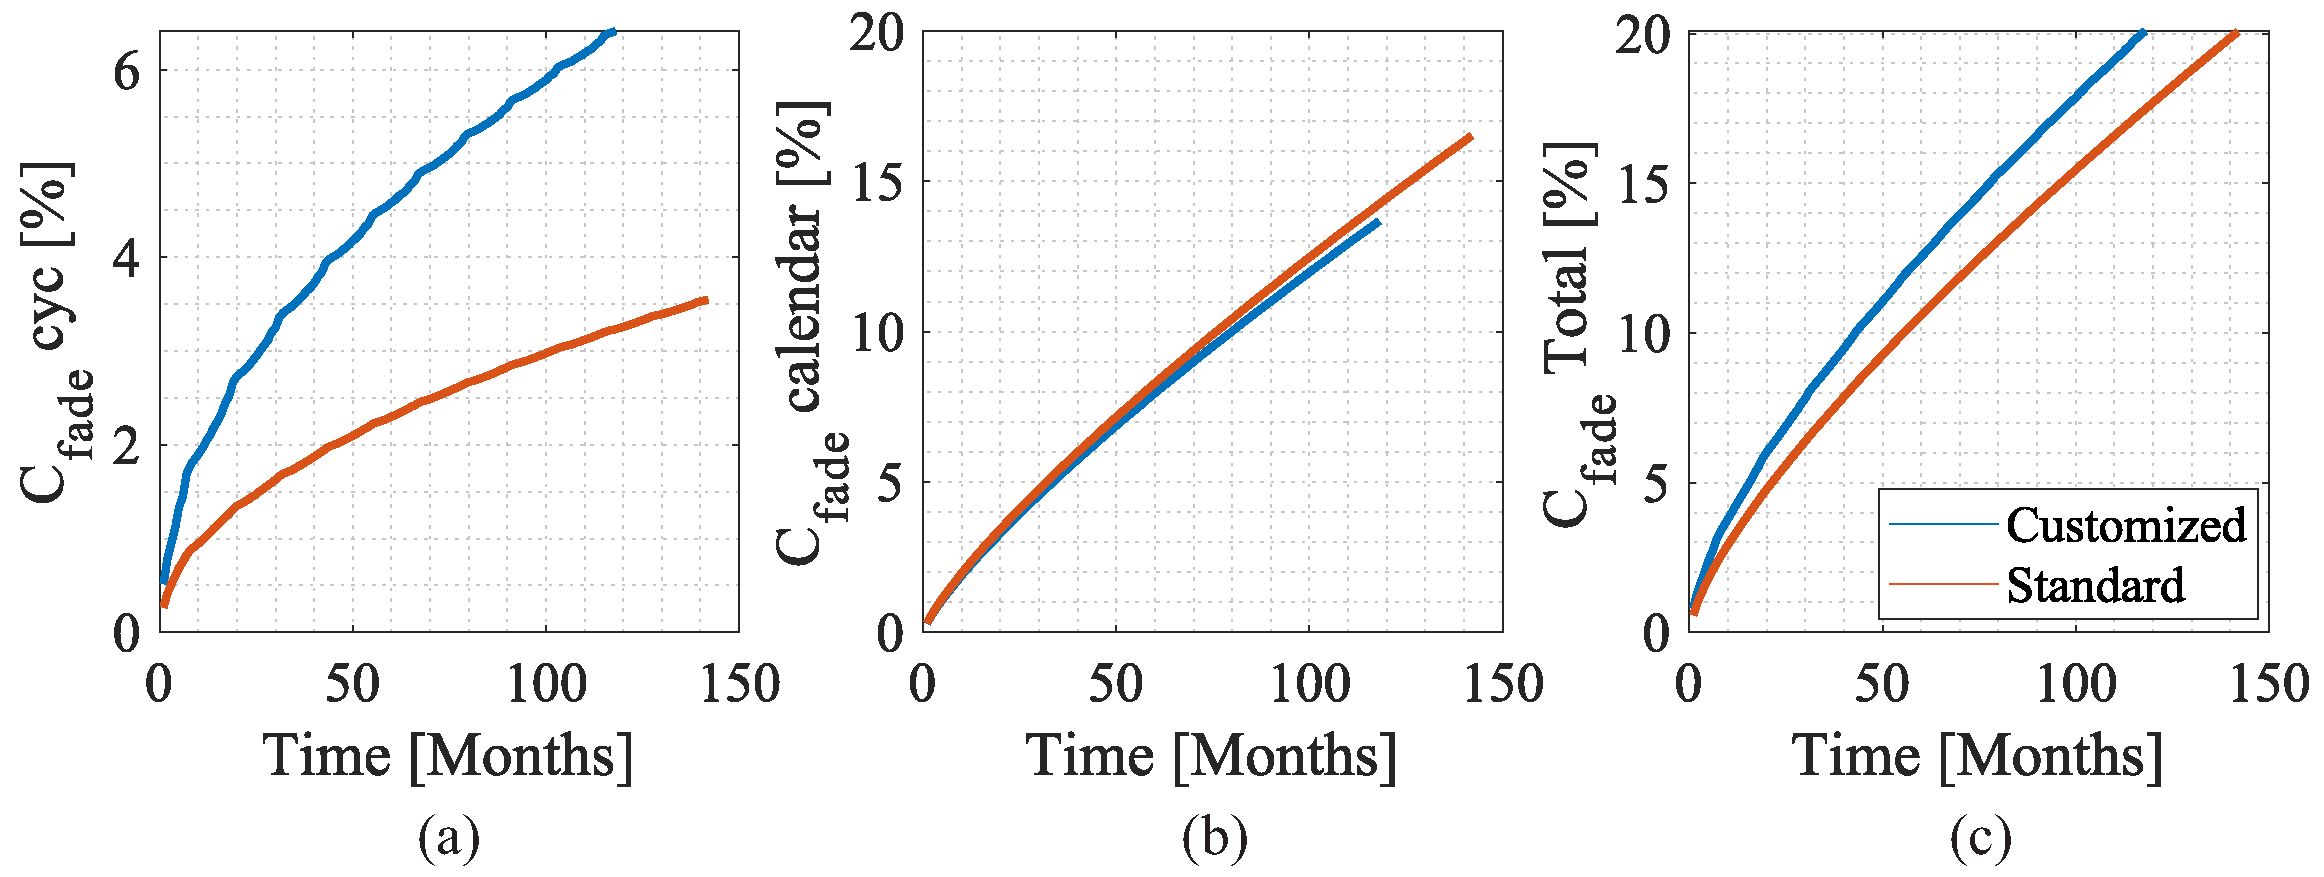
In addition to converter power losses, another analysis performed in this paper is battery life. The lifetime model used for Li-on batteries was proposed by [29]. This model considers the aging process due to two factors: cycling and calendar mechanism. The cycling is due to the battery SOC cycling, and the calendar is due to the idle operation mode.
The battery electrical equivalent model was used to obtain the SOC mission profile from the input of the battery current mission profile. Based on the operation conditions, the parameters such as internal resistance and battery capacity are updated monthly based on the calendar and the cycling aging process. Based on the battery power mission profiles, the SOC estimation was performed. Thus, the counting algorithm was divided into the rain flow (for the cycling operation) and idle counting algorithm (for the idle operation) to extract the main parameters of each charge/discharge cycle and idle operation cycle. Thus, it is possible to estimate the capacity fade due to cycling and calendar degradation processes, represented by C c y c and C c a l , respectively. The equation for the cycling capacity fade is proposed by [29] and given by:
C c y c = 2 . 642 0.0194 S O C 0.004 e 0.017 T 0.012 c d 0.716 DOD 0.5 ,
where n c is the number of SOC cycles, SOC is the medium state-of-charge, DOD is the battery depth-of-discharge in percentage, and T is the battery internal temperature in Kelvin. The total capacity fade was computed by the nonlinear accumulation process and used to find the total capacity fade due to the cycling aging process C c y c , t o t . Therefore, a nonlinear accumulation method was adopted to obtain the total capacity fade for cycling aging ( C c y c , t o t ) as presented in [15]. With regard to the calendar capacity fade estimated for each month, the C c a l is calculated as:
C c a l = 1.9775 . 10 11 e 0.07511 T 1.639 e 0.007388 S O C t 0.8 ,
where t is the idling time in months, SOC is the state of charge in one idle period in percentage, and T is the battery internal temperature in Kelvin [29]. In addition, a nonlinear accumulation method was adopted to obtain the total capacity fade for calendar aging ( C c a l , t o t ) as presented in [15]. Finally, the total capacity fade due to the cycling and calendar capacity fade is shown as:
C f a d e , t o t = C c a l , t o t + C c y c , t o t .
In this sense, in the situation where the battery capacity has achieved a capacity fade equal to 20 %, it is considered that the battery has reached its end of life.
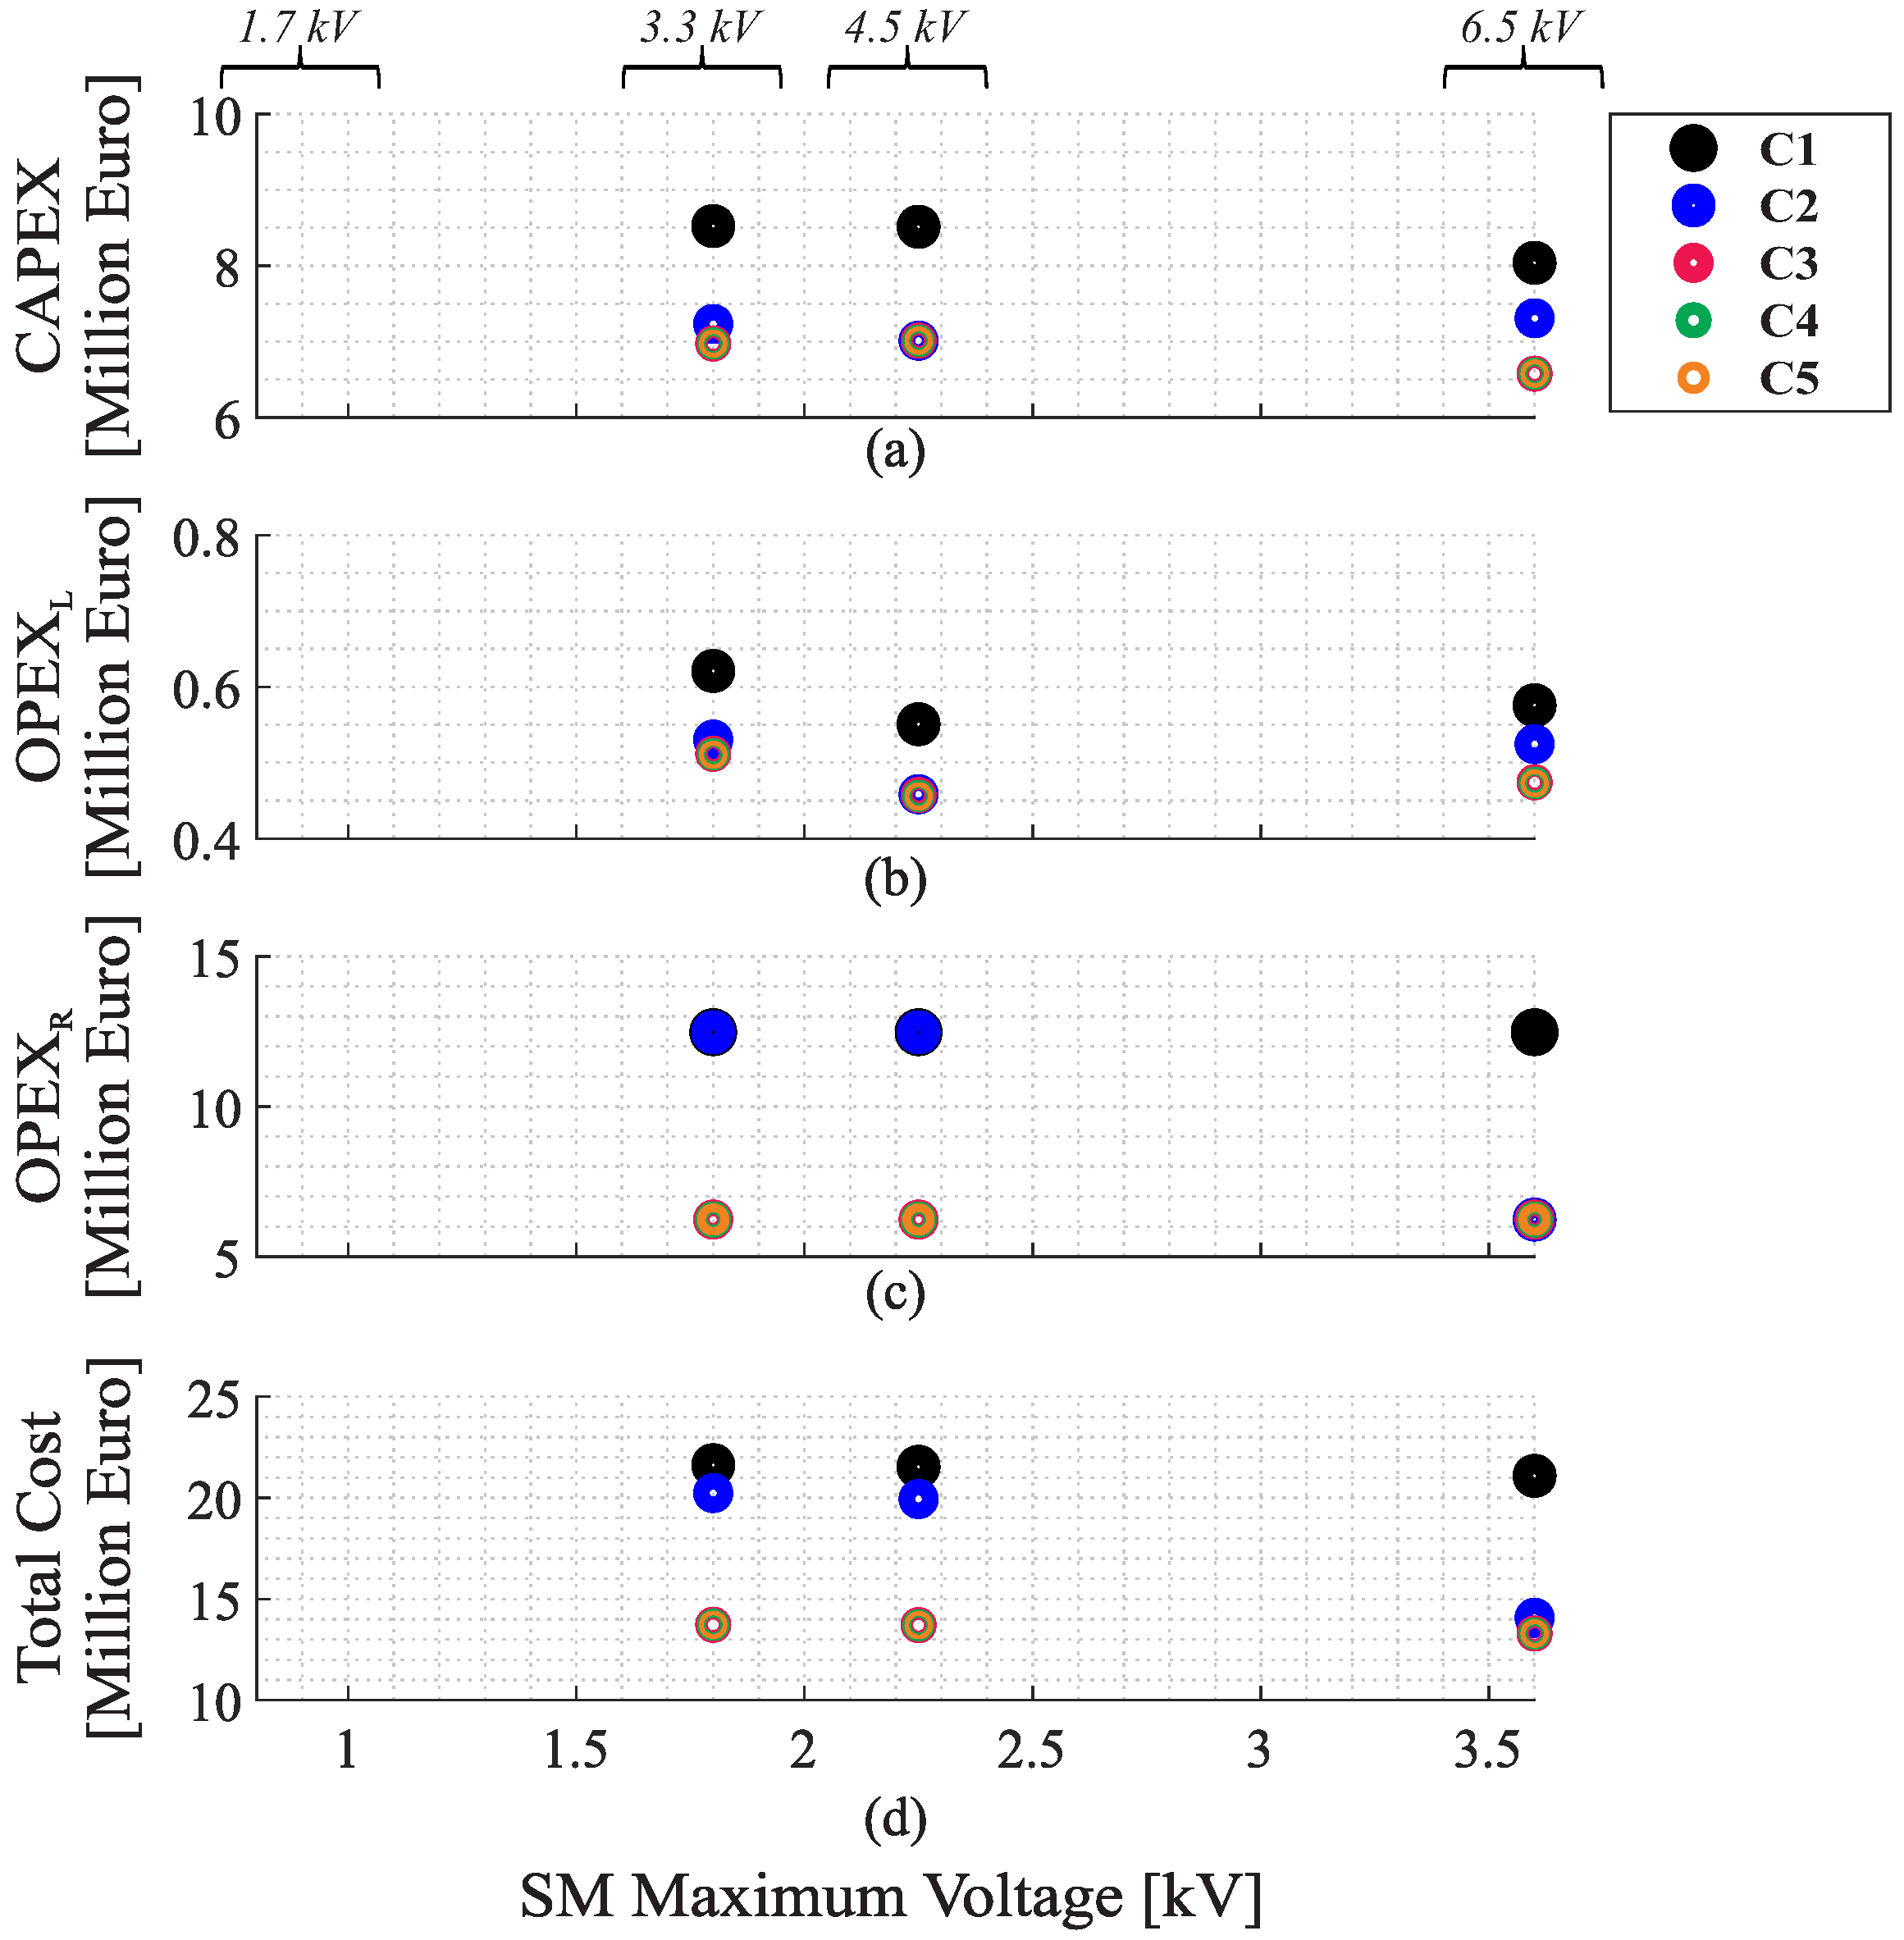
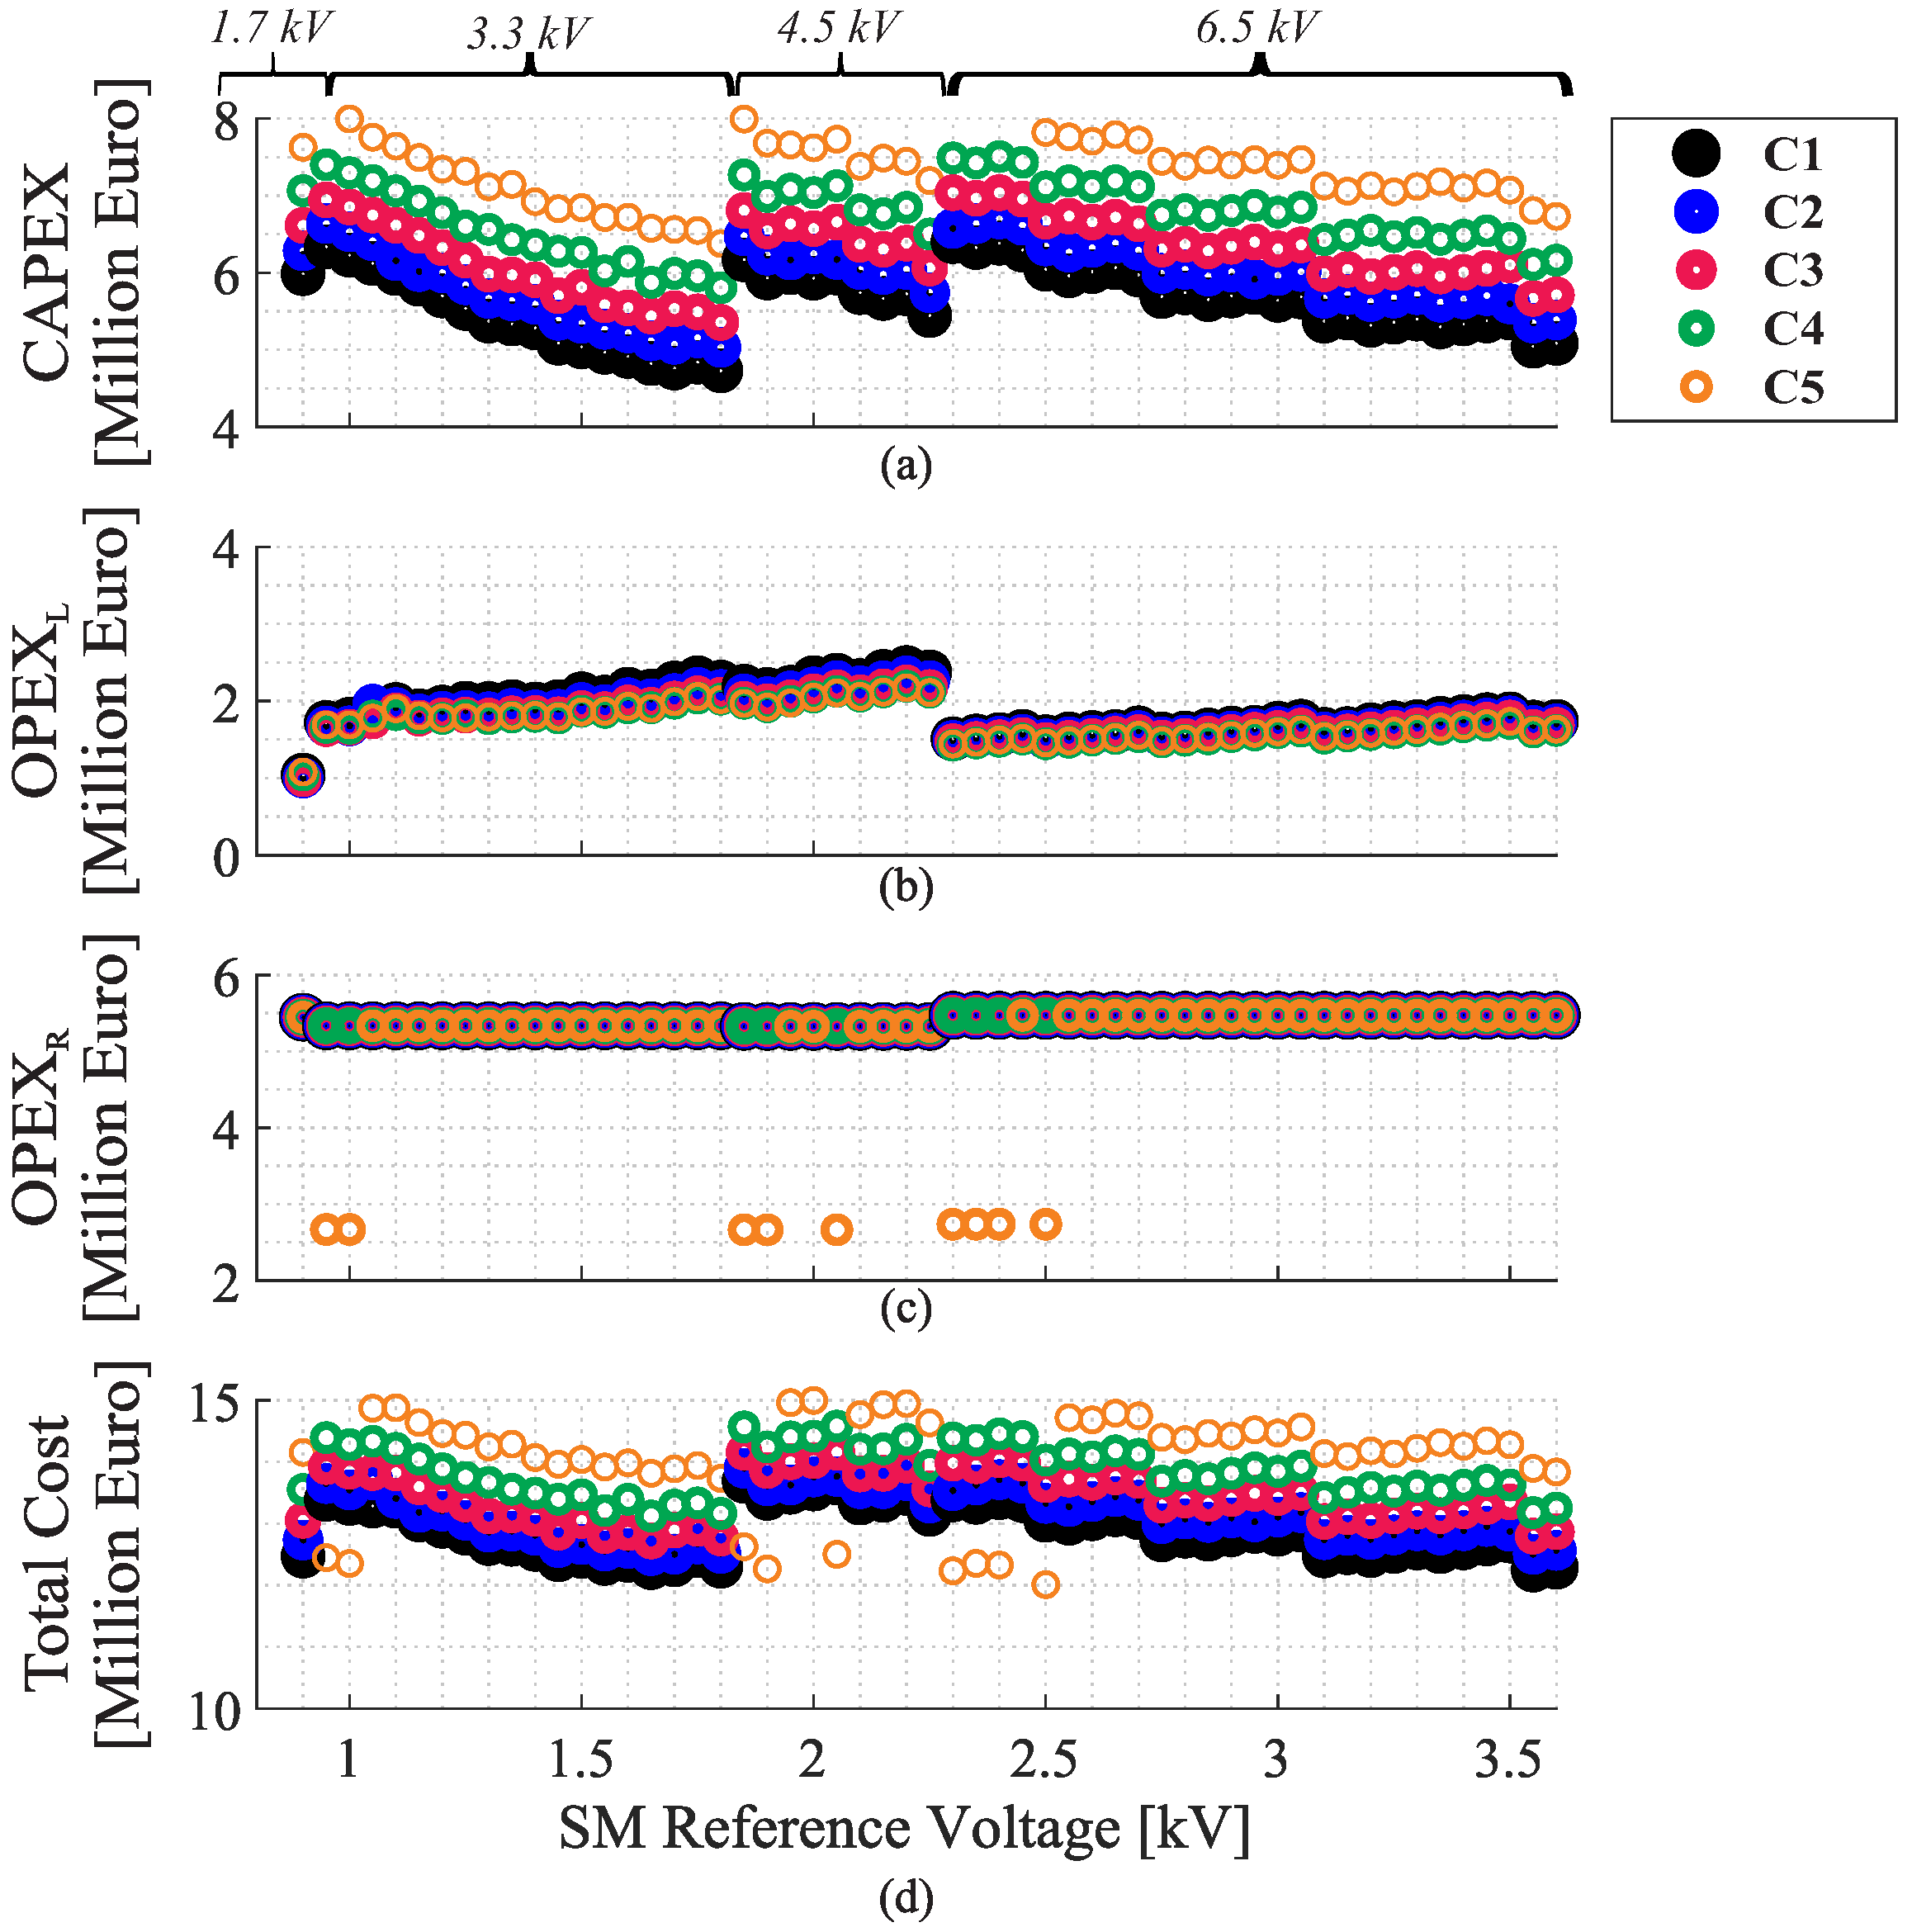
After obtaining the power losses and battery lifetime evaluation for the SS and TS approaches, this paper uses the CAPEX and OPEX methodology to quantify each project. The CAPEX is related to converter costs, such as batteries, semiconductors devices, capacitors, and inductors [17]. For power electronics (semiconductors, cabinets, instrumentation, controls, etc.) a cost is estimated at EUR 3.5/kVA of the installed switching power ( P s w ) [17]. According to [17,30], the costs related to capacitors and lithium-ion batteries are EUR 150/kJ and EUR 450/kWh, respectively.
According to [15], the OPEX cost refers to power losses ( O P E X L ) and replacement of batteries ( O P E X R ). In calculating the O P E X L , the price per kilowatt-hour was estimated to be EUR 1.1/kWh [31]. The O P E X R depends on the need to replace batteries over the operating time. Therefore, the total cost can be calculated as follows:
T O T A L C O S T = C A P E X + O P E X L + O P E X R O P E X .

6. Results

6.1. Single-Stage Approach Customized Solution

Figure 9a shows the N s , b a t per string for each blocking voltage of the IGBT and for each case study. Once the blocking voltage increases, the association of battery cells in series increases. On the other hand, the N p , b a t decreases, as shown in Figure 9b.
Compared to the same IGBT-blocking voltage, the total number of battery cells is the same in all case studies. However, to obtain the energy requirements of the BESS, the number of battery cells in parallel increases. For example, for the 3.3 kV IGBT, C5 needs more battery cells in parallel than C1.
Figure 10a exhibits the total number of battery cell for each case study and for each v S M * . As discussed in Figure 9b, case studies with a smaller SOC range need more batteries to fulfill energy requirements. Figure 10b shows the amount of SM for each design. As seen previously, the N depends on the N s , b a t and the v b a t , m i n . According to Figure 10a, the 3.3 kV IGBT uses fewer batteries in series than the others. Furthermore, in C1, v b a t , m i n = 0 V, and for C5, v b a t , m i n 3.2 V. Consequently, the C1 and 3.3 kV IGBT designs need more SM. The other cases had quantities close to SM due to the rounding of the c e i l i n g function used in Equation (3).
Figure 10c shows the nominal energy of each project. All cases were designed for a target of 5.76 MWh. However, due to sizing rounding, some cases were penalized with energy oversizing. Finally, Figure 10d compares battery lifetime for each case study and for each v S M * . The case studies with the most energy oversizing shown in Figure 10c are the ones with the longest battery life.
Figure 11a shows the CAPEX. Note that the behavior is similar to Figure 10a. Therefore, it is concluded that the cost related to energy storage is the largest portion of CAPEX. The costs related to OPEX L are shown in Figure 11b. Reflecting the behavior of Figure 10b, designs with more SM have higher OPEX L . The OPEX R is shown in Figure 11c. According to the battery life shown in Figure 10d, the replacement estimate is considering an operation period of 25 years.
Figure 11d presents the total costs for each design. The CAPEX and O P E X R variables determined the final cost. In this sense, all case studies and all blocking voltage of IGBT required two battery replacements. Finally, C2 for IGBT of the 3.3 kV presents the best overall total configuration cost, being the best configuration option for the SS approach customized solution.
Table 5 highlights the designs with the lowest total costs. The best configuration is highlighted in blue.

6.2. Single-Stage Approach Standard Solution

All analyses performed in the previous section were also made for the standard solution. Note, that in the standard solution, due to rounding, designs for the 1.7 kV IGBT were not performed. The N s , b a t increase with the blocking voltage of the IGBT as shown in Figure 12a. On the other hand, the SOC range does not change N s , b a t .
Figure 12b exhibit the N p , b a t for different IGBT-blocking voltage and SOC ranges. The number of strings in parallel is the same for all blocking voltages and case studies. This is justified by the fact that these are commercial battery models with a predetermined voltage, capacity, and energy parameters. Thus, all designs are within a range of values and in rounding have the same final value.
Figure 13a shows the number of battery racks for each case study. For any IGBT-blocking voltage, note that the N s is the same. Furthermore, the value of N p is repeated for all cases. Thus, the number of batteries in each project is different due to the number of SM shown in Figure 13b. As a result, C1 needs more SM than other designs.
Figure 13c shows the amount of energy available in each project. Note that in all cases, the values are greater than the target. This is a consequence of using the standard solution. Finally, Figure 13d shows the lifetime of the batteries for the projects. Note, that the smaller the SOC range, the longer the battery life is.
Figure 14 presents a comparison of battery life between the SS approach, customized and standard. These results are from C1 for the IGBT-blocking voltage of 4.5 kV. In the customized solution, projects were closer to the required energy target. Consequently, the batteries tended to cycle more as shown in Figure 14a. On the other hand, in the standard solution, as the projects presented greater energy oversizing, the batteries had a smaller cycling mechanism.
Another effect that impacts battery degradation is calendar aging. In this analysis, the intervals of inactivity of the batteries were considered. According to Figure 14b, this degradation mechanism is superior to cycling in the customized and standard solution. This is justified by the fact that the batteries assist the system only during peak hours. In addition, as the standard solution has higher energy oversizing, the inactivity intervals are longer. Finally, Figure 14c shows the lifetime of the batteries for each model. This time was counted after reaching a total capacity fade of 20%.
Figure 15a shows the CAPEX for each project. Regarding the customized solution, CAPEX was higher, mainly due to two factors: an increase in the number of SM and energy oversizing of battery racks. Figure 15b shows the OPEX L for the cases under analysis. The costs for battery replacements is shown in Figure 15c. Finally, the total costs are shown in Figure 15d. CAPEX and OPEX R costs are determinants for the optimized option. In this sense, C3, C4, and C5 were the optimal options for the three classes of IGBT.
Table 6 shows the total costs for the optimal cases for each IGBT case. In addition, it highlights the best configuration overall: C3, C4, and C5, for the 6.5 kV IGBT, result in EUR 13.29 million. Compared with the customized solution, the best configuration options for the standard solution are approximately 34% more expensive.

6.3. Two-Stage Approach Customized Solution

Figure 16a shows the N s , b a t for the respective SM reference voltage. This is because of the association of the dc/dc converter that varies the duty cycle to reach the same voltage value on the dc-link. On the other hand, as shown in Figure 16b, the N p , b a t increases or decreases according to the SM reference voltage. As N s , b a t increases, N p , b a t adjusts to fulfill the energy requirements.
Figure 17a shows the number of battery cells for each SM reference voltage value and for each IGBT-blocking voltage. Cases with a longer SOC range need fewer battery cells to achieve the power requirement. In addition, the distance between the number of batteries between C3, C4, and C5 is justified by the rounding for that value range.
For the v S M * , the SM number is the same for the five case studies as shown in Figure 17b. The TS approach allows for a variation of the duty cycle to keep the dc/dc converter input voltage at V 100 F I T . Note that in the TS approach, the number of batteries and SM decreases compared to the customized SS approach. This way, as shown in Figure 17c, the designs are closer to the energy target. Projects with less energy oversizing tend to cycle more. Consequently, the lifetime of the batteries gets shorter as shown in Figure 17d.
In the TS approach, as all cases have the same number of SM for a given reference voltage, the number of battery cells is the determining factor for CAPEX. Thus, according to Figure 18a, cases with a larger SOC range show a lower CAPEX. Furthermore, as shown in Figure 18b, the OPEX L are close among all cases. This small difference is due to the size of L d c which varies between cases.
Figure 18c shows the OPEX R . As seen in Figure 18d, the lifetime of the battery cells became shorter. As such, most cases required more than one replacement. Finally, the total cost is displayed in Figure 18d. For the IGBT 1.7 kV and 3.3 kV, C1 presented the lowest costs. As for the 4.5 kV and 6.5 kV IGBT, C5 was the ideal cost option.
Table 7 presents the designs that have the lowest costs for each IGBT-blocking voltage. In addition, the design considered the overall best is highlighted. For the 6.5 kV IGBT, C5 shows an estimated cost of EUR 12.01 million.

6.4. Two-Stage Approach Standard Solution

According to Figure 19a, as the reference voltage increases, N s , b a t remains constant until the quantity is rounded to the next integer. In the same way, N p , b a t is shown in Figure 19b. The N p , b a t varies depending on the need to fulfill the power and energy requirements.
In the standard solution, rounding in N s , b a t and N p , b a t is more evident. According to Figure 20a, the number of batteries in an SM reference voltage is the same for different case studies. In addition, as discussed in the customized solution, the SM total is the same across all case studies as shown in Figure 20b.
In the TS approach, the degree of freedom provided by the dc/dc converter allows the analysis of different SM reference voltages. In this way, some designs are close to the energy target as seen in Figure 20c. Finally, Figure 20d shows the lifetime of the batteries. Note that some projects already have a longer lifetime than the customized solution.
The costs of all case studies for the TS approach were estimated, as shown in Figure 21. The costs related to CAPEX are shown in Figure 21a. As the number of SM is equal between the cases, the number of battery racks is the variable that differentiates the costs between the cases.
The OPEX L of each project is shown in Figure 21b. When compared to the customized model, costs are more adjusted between cases. One of the reasons is the size of the dc/dc converter inductor. Because of rounding, the inductor size is the same for cases with the same reference voltage.
The costs for replacing the battery rack, OPEX R , are shown in Figure 21c. Note that most C5 designs required only one battery replacement. This balance between the number of battery racks and replacements is important for the total cost of projects. Thus, Figure 21d presents the total costs for the projects analyzed.
Figure 22 presents an analysis of the mechanisms that cause battery degradation. These results are from C1 for the IGBT-blocking voltage of 4.5 kV ( v S M * = 2.25 kV). The same behavior for the customized and standard solution seen in the SS approach can be analyzed for the TS approach. However, some models in the TS approach may have a shorter lifetime than the SS one because the dc/dc converter allows for more simplified designs.
Table 8 presents the designs that have the lowest costs for each IGBT-blocking voltage. In addition, the design considered the overall best is highlighted. For the 6.5 kV IGBT, Case Study 4 shows an estimated cost of EUR 12.93 million.

7. Discussions

Table 9 presents the best configuration design of the customized and standard solution for the SS and TS approaches. In the customized solution, the SS approach has the lowest total cost. The blocking voltage and the higher number of semiconductor devices contributed to the TS approach presenting a cost approximately 34 % higher. In both, the best configuration design is the cases that present higher energy oversizing. Consequently, they entail a higher cost for the designs. However, energy oversizing influences the lifetime of batteries. Therefore, cases with greater energy oversizing require fewer battery replacements.
The standard solution uses IGBT with a higher blocking voltage than the customized solution, and the selected case studies are the ones with the smallest SOC range. Unlike the customized solution, the optimized options are for cases that have the lowest energy oversizing. In addition, due to rounding, some cases have the same number of batteries and/or SM. For example, in the standard SS approach, the best configuration options are C3, C4, and C5.
Finally, as discussed in Section 3, the temperature rise in the TS approach is smaller than in the SS approach, which can interfere with battery lifetime. However, in the standard solution, the selected results of the TS approach present a lower battery lifetime than the SS approach. This fact is justified by the TS approach having less energy oversizing.

8. Conclusions

This paper proposes a comparative analysis of the designs for two approaches used in an MMC-based BESS: SS and TS. The projects were sized using a methodology to optimize total costs. Considering the search for an optimized design, some parameters were analyzed: different IGBT-blocking voltage, different SOC range, rounding effects, lifetime, and the need for battery replacement.
In the SS approach, the current batteries contain low-frequency harmonic components. In effect, it increases the rms current and, consequently, the temperature variation in the batteries. On the other hand, in the TS approach, because of the dc/dc converter, only the dc component goes to the batteries. Therefore, in the TS approach, the temperature variation in the batteries is smaller than in the SS approach.
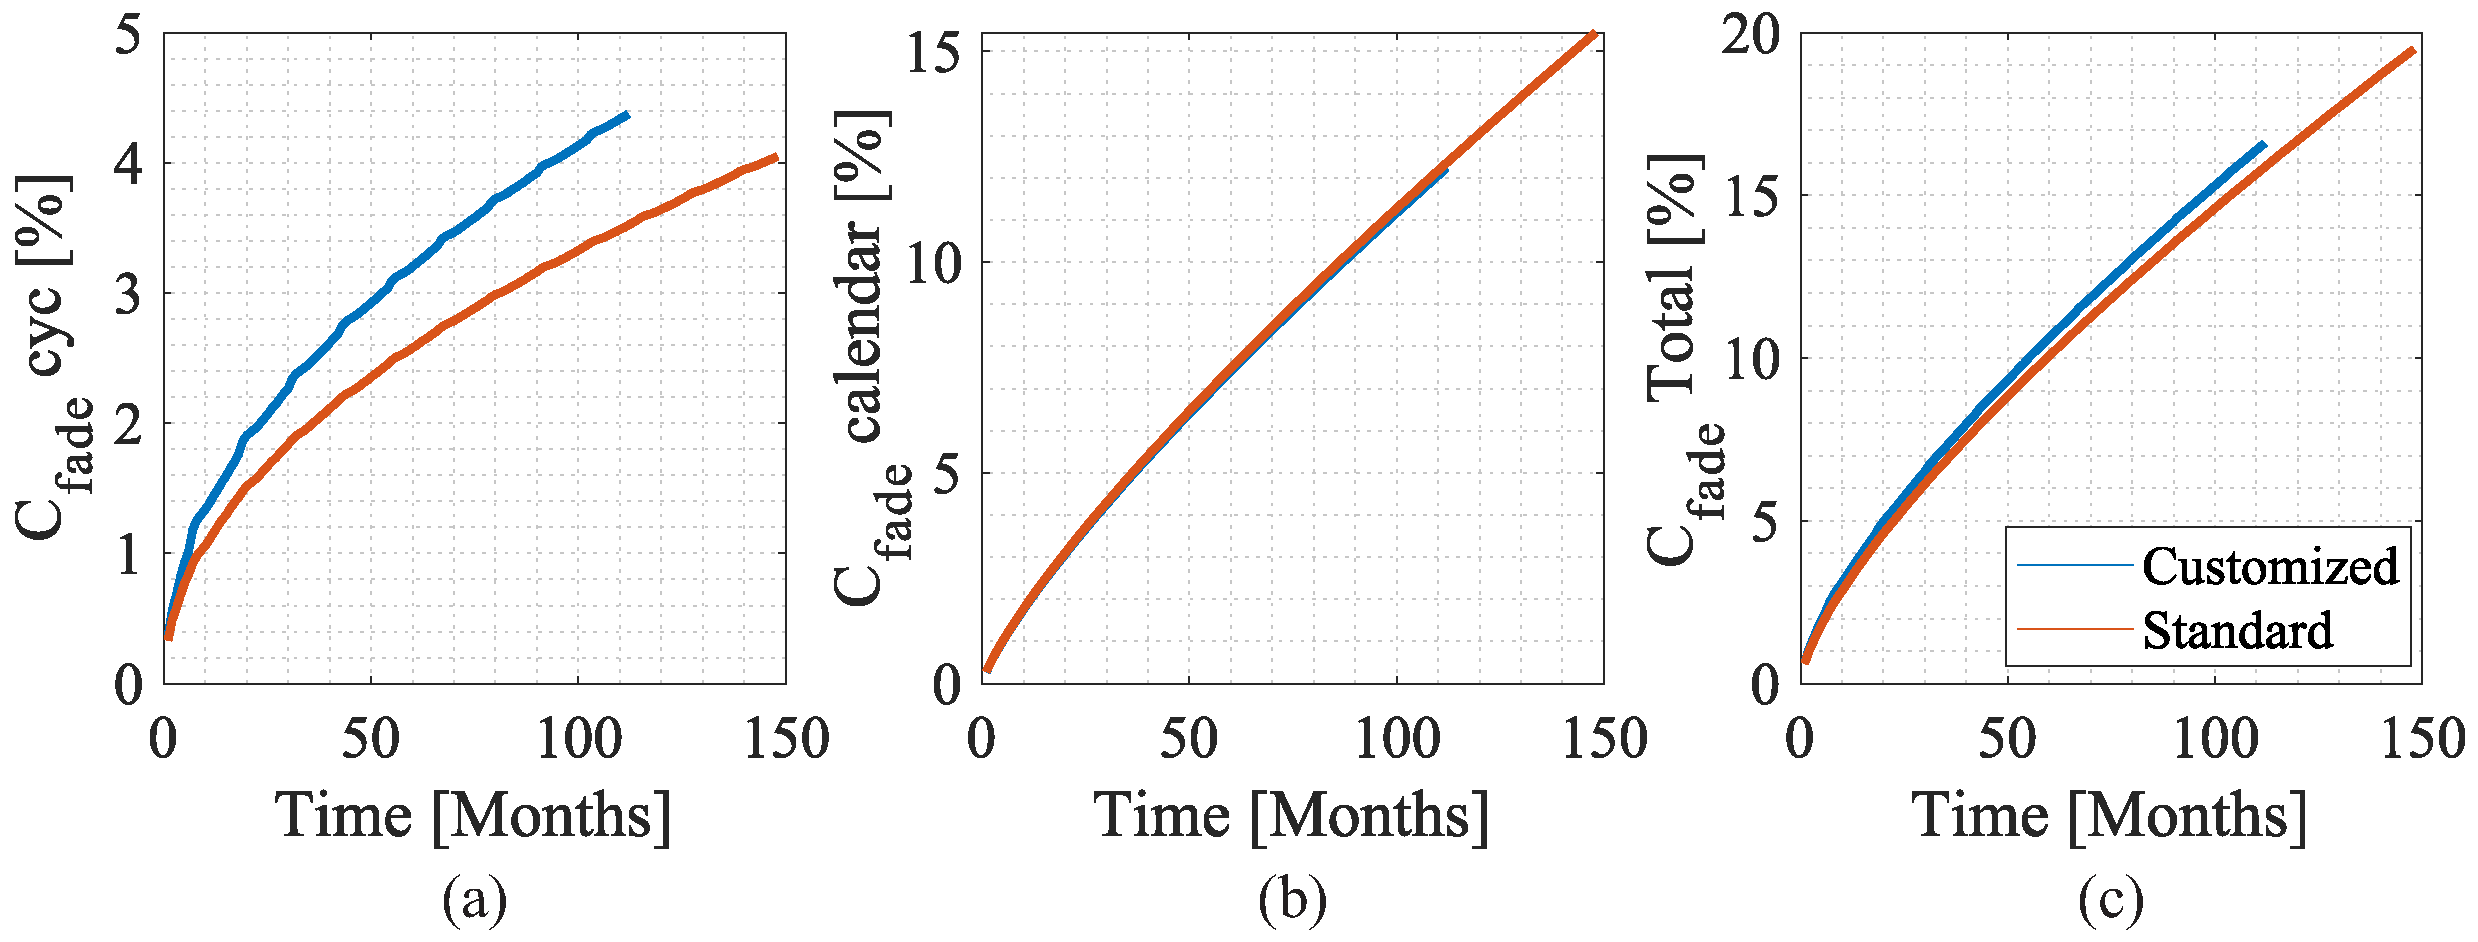
For the case study presented in this paper, calendar aging degradation is greater. As the specially customized TS approach designs have more compact designs, degradation by cycles increases. Consequently, the battery life is shorter. In the SS approach, due to rounding in the BESS sizing, projects are left with more power oversizing, which consequently leads to a longer battery lifetime.
Finally, it is important to emphasize that the methodology to obtain the optimal design is a function that depends on several variables. In addition, during the project, there were some trade-offs between these variables. Therefore, in this paper, it was concluded that the best configuration is the SS approach in the customized solution.

Author Contributions

Conceptualization, J.H.D.G.P., W.C.S.A., A.F.C., H.A.P. and S.I.S.J.; Investigation, S.I.S.J.; Methodology, J.H.D.G.P., W.C.S.A., A.F.C., H.A.P. and S.I.S.J.; Resources, J.H.D.G.P., W.C.S.A., A.F.C., H.A.P. and S.I.S.J.; Writing—original draft, J.H.D.G.P., W.C.S.A., A.F.C., H.A.P. and S.I.S.J.; Writing—review & editing, J.H.D.G.P., W.C.S.A., A.F.C., H.A.P. and S.I.S.J. All authors have read and agreed to the published version of the manuscript.

Funding

This research was funded by CNPq (Grant 408058/2021-8), and FAPEMIG (Grant APQ-02556-21).

Acknowledgments

The authors would like to thank the Brazilian agencies CAPES, CNPq (Grant 408058/2021-8), and FAPEMIG (Grant APQ-02556-21) for funding.

Conflicts of Interest

The authors declare no conflict of interest.

References

  1. Babatunde, O.M.; Munda, J.L.; Hamam, Y. A comprehensive state-of-the-art survey on power generation expansion planning with intermittent renewable energy source and energy storage. Intern. J. Energy Res. 2019, 43, 6078–6107. [Google Scholar] [CrossRef]
  2. Gyuk, I.; Kulkarni, P.; Sayer, J.H.; Boyes, J.D.; Corey, G.P.; Peek, G.H. The United States of storage [electric energy storage]. IEEE Power Energy Mag. 2005, 3, 31–39. [Google Scholar] [CrossRef]
  3. Bharadwaj, C.A.; Maiti, S. Modular multilevel converter based hybrid energy storage system. In Proceedings of the 2017 IEEE PES Asia-Pacific Power and Energy Engineering Conference (APPEEC), Bangalore, India, 8–10 November 2017; pp. 1–6. [Google Scholar]
  4. Wang, G.; Konstantinou, G.; Townsend, C.D.; Pou, J.; Vazquez, S.; Demetriades, G.D.; Agelidis, V.G. A Review of Power Electronics for Grid Connection of Utility-Scale Battery Energy Storage Systems. IEEE Trans. Sustain. Energy 2016, 7, 1778–1790. [Google Scholar] [CrossRef] [Green Version]
  5. Mohamed, F.; Khanal, S.; Disfani, V.R. MMC-Based Grid Integration of PV-BESS with Power Grid Support Capabilities. In Proceedings of the 2020 52nd North American Power Symposium (NAPS), Tempe, AZ, USA, 11–13 April 2021; pp. 1–6. [Google Scholar]
  6. Marquardt, R. StromRichterschaltungen Mit Verteilten Energiespeichern. German Patent DE10103031A1, 25 July 2001. [Google Scholar]
  7. Cupertino, A.F.; Farias, J.V.M.; Pereira, H.A.; Seleme, S.I.; Teodorescu, R. DSCC-MMC STATCOM Main circuit parameters design considering positive and negative sequence compensation. J. Control Autom. Electr. Syst. 2018, 29, 62–74. [Google Scholar] [CrossRef]
  8. Chaudhary, S.K.; Cupertino, A.F.; Teodorescu, R.; Svensson, J.R. Benchmarking of modular multilevel converter topologies for ES-STATCOM realization. Energies 2020, 13, 3384. [Google Scholar] [CrossRef]
  9. Baruschka, L.; Mertens, A. Comparison of Cascaded H-Bridge and Modular Multilevel Converters for BESS application. In Proceedings of the 2011 IEEE Energy Conversion Congress and Exposition, Phoenix, AZ, USA, 17–22 September 2011; pp. 909–916. [Google Scholar]
  10. Wersland, S.B.; Acharya, A.B.; Norum, L.E. Integrating battery into MMC submodule using passive technique. In Proceedings of the 2017 IEEE 18th Workshop on Control and Modeling for Power Electronics (COMPEL), Stanford, CA, USA, 9–12 July 2017; pp. 1–7. [Google Scholar]
  11. Vasiladiotis, M.; Rufer, A. Analysis and Control of Modular Multilevel Converters with Integrated Battery Energy Storage. IEEE Trans. Power Electron. 2015, 30, 163–175. [Google Scholar] [CrossRef]
  12. Uno, M.; Tanaka, K. Influence of High-Frequency Charge–Discharge Cycling Induced by Cell Voltage Equalizers on the Life Performance of Lithium-Ion Cells. IEEE Trans. Veh. Technol. 2011, 60, 1505–1515. [Google Scholar] [CrossRef]
  13. Song, Q.; Liu, W.; Li, X.; Rao, H.; Xu, S.; Li, L. A Steady-State Analysis Method for a Modular Multilevel Converter. IEEE Trans. Power Electron. 2013, 28, 3702–3713. [Google Scholar] [CrossRef]
  14. Zhang, L.; Gao, F.; Li, N. Control strategy of MMC battery energy storage system under asymmetrical grid voltage condition. Chin. J. Electr. Eng. 2016, 2, 76–83. [Google Scholar]
  15. Pinto, J.H.D.G.; Amorim, W.C.S.; Cupertino, A.F.; Pereira, H.A.; Junior, S.I.S.; Teodorescu, R. Optimum Design of MMC-Based ES-STATCOM Systems: The Role of the Submodule Reference Voltage. IEEE Trans. Ind. Appl. 2021, 57, 3064–3076. [Google Scholar] [CrossRef]
  16. Soong, T.; Lehn, P.W. Evaluation of Emerging Modular Multilevel Converters for BESS Applications. IEEE Trans. Power Deliv. 2014, 29, 2086–2094. [Google Scholar] [CrossRef]
  17. Engel, S.P.; Stieneker, M.; Soltau, N.; Rabiee, S.; Stagge, H.; De Doncker, R.W. Comparison of the modular multilevel DC converter and the dual-active bridge converter for power conversion in HVDC and MVDC grids. IEEE Trans. Power Electron. 2014, 30, 124–137. [Google Scholar] [CrossRef]
  18. Backlund, B.; Rahimo, M.; Klaka, S.; Siefken, J. Topologies, voltage ratings and state of the art high power semiconductor devices for medium voltage wind energy conversion. In Proceedings of the 2009 IEEE Power Electronics and Machines in Wind Applications, Lincoln, NE, USA, 24–26 June 2009; pp. 1–6. [Google Scholar]
  19. Ilves, K.; Norrga, S.; Harnefors, L.; Nee, H.P. On Energy Storage Requirements in Modular Multilevel Converters. IEEE Trans. Power Electron. 2014, 29, 77–88. [Google Scholar] [CrossRef]
  20. Stieneker, M.; De Doncker, R.W. Dual-active bridge dc-dc converter systems for medium-voltage DC distribution grids. In Proceedings of the 2015 IEEE 13th Brazilian Power Electronics Conference and 1st Southern Power Electronics Conference (COBEP/SPEC), Fortaleza, Brazil, 29 November–2 December 2015; IEEE: Piscataway, NJ, USA, 2015; pp. 1–6. [Google Scholar]
  21. Harnefors, L.; Antonopoulos, A.; Norrga, S.; Angquist, L.; Nee, H. Dynamic Analysis of Modular Multilevel Converters. IEEE Trans. Ind. Electron. 2013, 60, 2526–2537. [Google Scholar] [CrossRef]
  22. Sharifabadi, K.; Harnefors, L.; Nee, H.P.; Norrga, S.; Teodorescu, R. Design, Control, and Application of Modular Multilevel Converters for HVDC Transmission Systems; John Wiley & Sons: Hoboken, NJ, USA, 2016. [Google Scholar]
  23. Bragard, M.; Soltau, N.; Thomas, S.; De Doncker, R.W. The Balance of Renewable Sources and User Demands in Grids: Power Electronics for Modular Battery Energy Storage Systems. IEEE Trans. Power Electron. 2010, 25, 3049–3056. [Google Scholar] [CrossRef]
  24. Xie, H.; Angquist, L.; Nee, H.P. A Converter Topology Suitable for Interfacing Energy Storage with the DC Link of a StatCom. In Proceedings of the 2008 IEEE Industry Applications Society Annual Meeting, Edmonton, AB, Canada, 5–9 October 2008; pp. 1–4. [Google Scholar]
  25. Samsung. ESS Batteries by Samsung SDI; Top Safety and Reliability Solutions: Midlothian, VA, USA, 2018. [Google Scholar]
  26. A123 Systems. A123 Systems Nanophosphate High Power Lithium Ion Cell ANR26650m1-b; A123 Systems: Waltham, MA, USA, 2012. [Google Scholar]
  27. Meng, J.; Ricco, M.; Luo, G.; Swierczynski, M.; Stroe, D.; Stroe, A.; Teodorescu, R. An Overview and Comparison of Online Implementable SOC Estimation Methods for Lithium-Ion Battery. IEEE Trans. Ind. Appl. 2018, 54, 1583–1591. [Google Scholar] [CrossRef]
  28. Jones, P.S.; Davidson, C.C. Calculation of power losses for MMC-based VSC HVDC stations. In Proceedings of the 2013 15th European Conference on Power Electronics and Applications (EPE), Lille, France, 2–6 September 2013; pp. 1–10. [Google Scholar]
  29. Stroe, D.I. Lifetime Models for Lithium Ion Batteries used in Virtual Power Plants. Ph.D. Thesis, Deptatment Energy Technoloy, Aalborg University, Aalborg, Denmark, 2014. [Google Scholar]
  30. Becker, A.; Loges, H.; Kippelt, S.; Gitis, A.; Merei, G.; Echternacht, D.; Müller, M.; Zeh, A.; Kleimaier, M.; Leuthold, M.; et al. Electricity storage systems in medium-and low-voltage networks. In Proceedings of the International ETG Congress 2015, VDE, Bonn, Germany, 17–18 November 2015; pp. 1–8. [Google Scholar]
  31. Alvarez, R.; Wahle, M.; Gambach, H.; Dorn, J. Optimum semiconductor voltage level for MMC submodules in HVDC applications. In Proceedings of the 18th European Conference on Power Electronics and Applications, Karlsruhe, Germany, 5–9 September 2016; IEEE: Piscataway, NJ, USA, 2016; pp. 1–9. [Google Scholar]
Figure 1. (a) Schematic of an MMC-based BESS topology (b) Single-stage approach and (c) two-stage approach.
Energies 15 03598 g001
Figure 2. Flowcharts to optimize the designs of the MMC-based BESS: (a) SS approach configuration; (b) TS approach configuration.
Energies 15 03598 g002
Figure 3. Energy oversizing optimization detection map for IGBT-blocking voltage 4.5 kV for: (a) SS approach standard solution; (b) SS approach customized solution. Remark: Please note that the color bar presents different scales in (a,b).
Energies 15 03598 g003
Figure 4. Energy oversizing optimization detection map for IGBT-blocking voltage 4.5 kV for: (a) TS approach standard; (b) TS approach customized. Remark: Please note that the color bar presents different scales in (a,b).
Energies 15 03598 g004
Figure 5. Selection of optimal designs with up to 10% energy oversizing to 4.5 kV IGBT-blocking voltage for the SS approach: (a) standard solution; (b) customized solution.
Energies 15 03598 g005
Figure 6. Selection of optimal designs with up to 10% energy oversizing to 4.5 kV IGBT-blocking voltage for the TS approach: (a) standard solution; (b) customized solution.
Energies 15 03598 g006
Figure 7. Mission profiles used in the case study: (a) PV power plant; (b) university load.
Energies 15 03598 g007
Figure 8. Battery behavior curve: (a) experimental results [27] and polynomial fit; (b) curve estimation for Samsung battery model.
Energies 15 03598 g008
Figure 9. Battery cell design for customized SS approach for the five case studies: (a) series; (b) parallel.
Energies 15 03598 g009
Figure 10. Results for the SS approach in the customized solution for different blocking voltages and SOC: (a) number of batteries; (b) total number of SM; (c) system power; (d) lifetime battery.
Energies 15 03598 g010
Figure 11. Estimated costs for all cases studies evaluated for the customized SS approach: (a) CAPEX; (b) OPEX L ; (c) OPEX R ; (d) total cost.
Energies 15 03598 g011
Figure 12. Battery rack design for a customized SS approach for the five case studies: (a) series; (b) parallel.
Energies 15 03598 g012
Figure 13. Results for the SS approach in the standard solution for different blocking voltages and SOC: (a) number of batteries; (b) total number of SM; (c) system power; (d) battery lifetime.
Energies 15 03598 g013
Figure 14. Lifetime battery analysis for 4.5 kV IGBT in SS approach in customized and standard solutions.: (a) Cycling mechanism (b) calendar mechanism and (c) total fade.
Energies 15 03598 g014
Figure 15. Estimated costs for all cases studies evaluated for the customized SS approach: (a) CAPEX; (b) OPEX L ; (c) OPEX R ; (d) total cost.
Energies 15 03598 g015
Figure 16. Number of batteries for TS approach in the customized solution: (a) in series; (b) in parallel.
Energies 15 03598 g016
Figure 17. Results for the TS approach in the customized solution for different blocking voltages and SOC: (a) number of batteries; (b) total number of SM; (c) system power; (d) battery life.
Energies 15 03598 g017
Figure 18. Specification of costs for all cases studies evaluated for the TS approach in a customized solution: (a) CAPEX; (b) OPEX L ; (c) OPEX R ; (d) total costs.
Energies 15 03598 g018
Figure 19. Number of batteries for the TS approach in the standard solution: (a) in series; (b) in parallel.
Energies 15 03598 g019
Figure 20. Results for the TS approach in the standard solution for different blocking voltages and SOC: (a) number of batteries; (b) total number of SM; (c) system power; (d) battery life.
Energies 15 03598 g020
Figure 21. Specification of costs for all cases studies evaluated for the TS approach in standard solution: (a) CAPEX; (b) OPEX L ; (c) OPEX R ; (d) total costs.
Energies 15 03598 g021
Figure 22. Lifetime battery analysis for 4.5 kV IGBT in TS approach in customized and standard solutions.: (a) Cycling mechanism (b) calendar mechanism and (c) total fade.
Energies 15 03598 g022
Table 1. Parameters of the battery rack P3-R070 [25] and the battery cell A123 26650 [26].
ParametersStandardCustomized
Total energy storage [ E n ]70 kWh7.6 Wh
Capacity [ C n ]78 Ah2.5 Ah
C-Rate [ 1 / h ]31
Maximum voltage [SOC = 100%]992 V3.4 V
Minimum voltage [SOC = 0%]750 V2.5 V
Table 2. Parameters of the MMC-based BESS.
ParametersValue
Rated apparent power ( S n )10.9 MVA
Rated reactive power ( Q n )10.9 MVAr
Rated active power ( P n )10.9 MW
Total energy storage ( E n )5.76 MWh
Output voltage (line to line) ( V g )13.8 kV
Grid frequency ( f n )60 Hz
Arm reactance ( x a r m )0.15 pu
Submodule capacitance for 40 kJ/MVA (C)8 mF
Switching frequency (dc/dc converter) ( f s w )1000 Hz
Switching frequency of the HB ( f c )270 Hz
Table 3. Case studies adopted for the MMC-based BESS.
Case 1 (C1)Case 2 (C2)Case 3 (C3)Case 4 (C4)Case 5 (C5)
SOC m i n 0 %5 %10 %15 %20 %
SOC m a x 100 %95 %90 %85 %80 %
Table 4. Possible candidates for the SM realization.
Part NumberBlocking VoltageCurrent Rating V 100 FIT
5SND 0800M1701001.7 kV800 A0.90 kV
5SND 0500N3303003.3 kV500 A1.80 kV
5SNA 0650J4503004.5 kV650 A2.25 kV
5SNA 0600G6501006.5 kV600 A3.60 kV
Table 5. Best cases for each blocking voltage (SS customized).
Rated Blocking Voltage [kV]SM Reference Voltage [kV]Case StudyTotal Cost [EUR]
1.70.9210.69
3.31.819.74
4.52.25110.2
6.53.6110.58
Table 6. Best Cases for each blocking voltage—SS standard.
Rated Blocking Voltage [kV]SM Reference Voltage [kV]Case StudyTotal Cost [EUR]
3.31.83, 4 and 513.72
4.52.253, 4 and 513.70
6.53.63, 4 and 513.29
Table 7. Best cases for each blocking voltage—TS approach in customized solution.
Rated Blocking Voltage [kV]SM Reference Voltage [kV]Case StudyTotal Cost [EUR]
1.70.9112.47
3.31.65112.29
4.51.9512.27
6.52.5512.01
Table 8. Best cases for each blocking voltage—TS approach standard solution.
Rated Blocking Voltage [kV]SM Reference Voltage [kV]Case StudyTotal Cost [EUR]
3.31.8113.44
4.52.25113.71
6.53.2412.93
Table 9. Cost and energy losses analysis for best configuration cases.
Customized Solution
Approach V ps [kV]Total Cost [EUR] E O [MWh]Lifetime [Months]
SS3.39.740.082113
TS6.512.014.12150
Standard solution
SS6.513.295.58162 *
TS6.512.934.32146
* Battery lifetime for C3, C4, and C5.
Publisher’s Note: MDPI stays neutral with regard to jurisdictional claims in published maps and institutional affiliations.

