
Reactive Power and Voltage Optimization of New-Energy Grid Based on the Improved Flower Pollination Algorithm

1
Electric Power Research Institute, State Grid Jiangxi Electric Power Co., Ltd., Nanchang 330096, China
2
School of Mechanical Electronic and Information Engineering, University of Mining and Technology (Beijing), Beijing 100083, China
*
Author to whom correspondence should be addressed.
Energies 2022, 15(10), 3653; https://0-doi-org.brum.beds.ac.uk/10.3390/en15103653
Submission received: 19 March 2022
/
Revised: 5 May 2022
/
Accepted: 6 May 2022
/
Published: 16 May 2022
Abstract
:In order to solve the reactive power and voltage control problem caused by the high proportion of new energy connected to the power grid, this paper takes the minimum voltage deviation, minimum network loss and maximum dynamic reactive power margin of the whole system as the comprehensive optimization objectives and establishes a reactive power and voltage optimization model by considering the reactive power regulation ability of SVC (Static Var Compensator) and new energy units. In view of the continuous and discrete variables in the model, the traditional continuous FPA (Flower Pollination Algorithm) is discretized to form an improved continuous-discrete hybrid FPA, and the tournament selection mechanism is adopted to speed up the convergence. Through the example analysis of the IEEE-39 bus system, the feasibility of the proposed reactive power and voltage optimal control method in the new energy grid is verified. Compared with GA (Genetic Algorithm), the results show that the improved FPA has high optimization accuracy, which is suitable for solving the reactive power and voltage optimization problem of the new energy grid.
1. Introduction
A large number of new energy power plants connected to the grid poses a challenge to the reactive power and voltage scheduling of the system. Due to the random fluctuation of new energy output and the insufficient reactive power regulation capacity of the system, the voltage exceeds the limit frequently, the network loss increases sharply, and the dynamic reactive power regulation margin is limited. At present, many new energy power plants are equipped with SVC. Combined with the traditional voltage regulation measure, the reactive power regulation ability of the SVC and new energy power plant should be fully utilized to establish comprehensive optimization objectives for reactive power and voltage control [1,2,3]. With the increase in optimization objectives, optimization variables and constraints, the traditional reactive power and voltage optimization methods will no longer be applicable. It is urgent to study new reactive power and voltage optimization methods.
The intelligent algorithm has been widely used to solve the optimal control problem of the power system. GA is widely used to solve this problem. The work [4] introduces the application of a modified non-dominated sorting GA version II in reactive power optimization. The work [5] uses the benders cut set method to generate and select a new population, and then adopts successive linear programming to solve the reactive power problem based on GA. The work [6] proposes an improved dynamic GA that can dynamically adjust the parameters to solve the problem of reactive power and voltage optimal control. The work [7] proposes a reactive power optimization method based on the improved GA. Through the development of the coding method and other links, the convergence speed has been improved. Many other algorithms have been adopted. The work [8] uses the nature-inspired gravitational search algorithm to solve a multi-objective and multi-constrained optimal reactive power flow problem. According to the genetic simulated annealing algorithm and niche technology, the calculation speed of the reactive power optimization problem has been improved in [9]. The work [10] proposes a dynamic gas molecular optimization algorithm with Pareto optimality to solve the multi-objective reactive power optimization problem. The work [11] compares three improved PSO (Particle Swarm Optimization algorithms) with the traditional one to prove the superiority of the improved PSO in reactive power optimization. The work [12] optimizes the parallel node and size of reactive power supplement equipment to control the deviation of voltage. The work [13] puts forward a distributed reactive power optimization method based on a reactive gradient random algorithm. The work [14] proposes the improved fill function particle group algorithm to optimize the reactive power with a wind farm. The work [15] combines the two algorithms to improve the optimization performance. The work [16] presents a modified FPA to solve the optimal power flow problem, and the effectiveness is verified based on the IEEE-30 bus system. The work [17] uses FPA to solve the optimal dispatching of the distribution network with a microgrid. In recent years, FPA has been widely used in the field of a power system. This paper will study its applicability and application method in reactive power and voltage optimization.
Aiming at the above problems of reactive power and voltage optimization in a new energy power system, an optimization method based on the improved continuous-discrete hybrid FPA is proposed in this paper. The feasibility and effectiveness of this method are verified by numerical simulations. The main contributions are as follows:
- (1)
- The reactive power and voltage optimization model is established by considering the voltage deviation, network loss and dynamic reactive power margin;
- (2)
- An improved continuous-discrete hybrid FPA is proposed to solve the optimization problem with the simultaneous existence of discrete and continuous variables;
- (3)
- The elite selection mechanism is introduced to shorten the operation time and obtain the global optimal solution quickly and accurately.
2. Reactive Power and Voltage Optimization Model of New Energy Grid
2.1. Optimization Objectives
After the new energy is connected to the grid, there will be phenomena such as frequent voltage out of limit, a surge in network loss and insufficient dynamic reactive power regulation margin. In order to solve these problems, in this paper, the objective of the optimization is to minimize the voltage deviation , minimize the network loss and maximize the dynamic reactive power margin The specific functions are as follows:
where is the actual voltage value of node k; is the expected voltage value of point k during normal operation; K is the number of nodes; , are the voltage of nodes i, j, respectively, and , are the voltage phase angle difference and admittance of nodes i, j, respectively. represents the set of all branches; , are the upper limit value and actual value of reactive power output of the m-th SVC and M is the number of SVCs.
In order to obtain the expression of the objective function, the dynamic reactive power margin is inverted first. Then, the three functions are normalized and appropriate weights are selected. The final objective function is shown in the following formula:
where ,
is the maximum deviation of node k;
,
are the active power network loss before and after optimization, respectively.
is the lower limit value of the reactive output of the m-th SVC. Therefore, the reactive power and voltage optimization problem is transformed into solving the minimum value problem of F.
2.2. Constraints
- (1)
- Power flow equality constraintwhere and are injection active and reactive power of node I; and are the real and imaginary part of the mutual admittance of node i and node k, respectively; is the voltage phase angle difference between node i and node k.
- (2)
- Inequality constraints
- a.
- Output constraints on thermal power units:where is the reactive power output of the i-th thermal power unit; and are the lower and upper limits of the reactive power output of the i-th thermal power unit, respectively; is the voltage of the parallel node of the i-th thermal motor unit; and are the upper and lower limits of the voltage for the i-th thermal motor unit, and NG is the number of units.
- b.
- Constraints on SVC reactive power regulation capacity, capacitor switching capacity and transformer tap regulation capacity:where is the number of capacitor input groups; and are the minimum and maximum values of the number of capacitor groups that can be switched; is the tap position of the adjustable transformer; and are the minimum and maximum tap positions of the adjustable transformer; is the reactive power of the m-th SVC; and are the lower and upper limits of reactive power for the m-th SVC, respectively.
- c.
- Constraints on the load node voltage:where is the voltage amplitude of the i-th load node; and are the lower and upper limits of voltage amplitude for the i-th load node, respectively.
- d.
- Constraints on reactive voltage regulation capacity of new energy units:where is the reactive power output of the point of common coupling (PCC) of renewable energy; and are the lower and upper limits of reactive power output for the PCC of renewable energy, respectively; is the voltage amplitude of the PCC of renewable energy; and are the lower upper limits of voltage amplitude for the PCC of renewable energy, respectively; is the number of new energy generator sets.
3. The Improved FPA
3.1. Basic FPA Analysis
FPA is a new heuristic swarm intelligence optimization algorithm inspired by the pollination process of flowering plants. The algorithm dynamically controls the balance between global search and local search by transforming probability [18,19,20]. In order to simulate the process of flower pollination, the abiotic self-pollination can be considered as a process of local pollination, and the cross-pollination can be regarded as a global pollination process carried out by the pollinators carrying pollen gametes through Levy flight [21,22].
In FPA, the transformation probability p controls the conversion between the global pollination and the local one, which means that there is a probability of p for global pollination and a probability of 1-p for the local one.
The updated equation of the global pollination is as follows:
where is the i-th pollen individual in the t-th iteration population; is the historical optimal solution; is the step size; L represents pollination intensity, which follows Levy distribution as shown in the formula below:
where is a constant, is the standard gamma function, s is the step size, and the value range of the minimum step size is [0.1, 1].
Accordingly, the updated equation of the local pollination can be expressed as follows:
where and are the t-th and k-th pollen individuals in the population of the t-th iteration, respectively, and is a random number that obeys the uniform distribution of [0,1].
3.2. Applicability Analysis of FPA
According to the analysis in Section 3.1, local and global pollinations are completely random, which are controlled by setting the transformation probability. In fact, adjacent flowers and flowers not too far away are more likely to be pollinated by local flowers than those far away. Therefore, for most applications, p = 0.8 is more effective.
Obviously, the output results of the particle position update Equations (8) and (10) for both local and global pollination are floating-point values, which is excellent for the processing of continuous variables. As a new algorithm, FPA has fewer parameters, easier adjustment and better global optimization ability than GA. However, the variables in this model are both continuous and discrete, and therefore the basic FPA can not work. A commonly used method to deal with discrete variables is to round the results directly, which not only violates the practical significance of the algorithm but also does not necessarily meet the constraints of the power flow equation. Thus, it is of great significance to design an improved FPA for continuous-discrete hybrid variables.
3.3. Discrete FPA
In order to obtain the discrete FPA, two main problems need to be solved: one is to redefine the related concepts in flower pollination, and the other is to design the discrete change strategies. In what follows, the definition of discrete variables related to the global and local pollinations are put forward, as well as the corresponding discrete change strategies.
- (1)
- Global pollination: In the basic FPA, the step size of global pollination is determined through the Levy flight. In order to connect the step size with the discrete global pollination process, the value range of the levy step size is divided into four intervals, i.e., , , , . The corresponding δ for each interval are 10, 30, 60 and 70%, respectively, where δ is the percentage of the number of discrete variables to be changed in the total number of discrete variables. In order to be the same as the definition of global pollination in the continuous part, after each flower executes the change strategy, the value of the solution at the historical optimal corresponding position is assigned to the solution at the position to be changed of each flower.
- (2)
- Global pollination: This process strives to ensure that the feasible solution generated each time does not change too much. Thus, in the change strategy of the discrete local pollination, the number of discrete variables to be changed can be set to a small fixed value based on the concept of gradient, which is taken as 15%.
By defining the discrete change strategy of global and local pollinations, the obtained discrete FPA is suitable for the optimization of discrete variables in this model, which is more reasonable and effective for problem-solving. Moreover, although FPA has better performance than other evolutionary algorithms, in order to avoid falling into local optimization and further improve the convergence speed of the algorithm, the tournament selection mechanism is introduced in this paper. The main idea is to take some individuals from the population every time they are put back, and then put the remaining individuals with the highest fitness into the sub population until the newly selected population size reaches the one before the strategy is adopted.
4. Reactive Power and Voltage Optimization Method Based on The Improved Continuous-Discrete Hybrid FPA
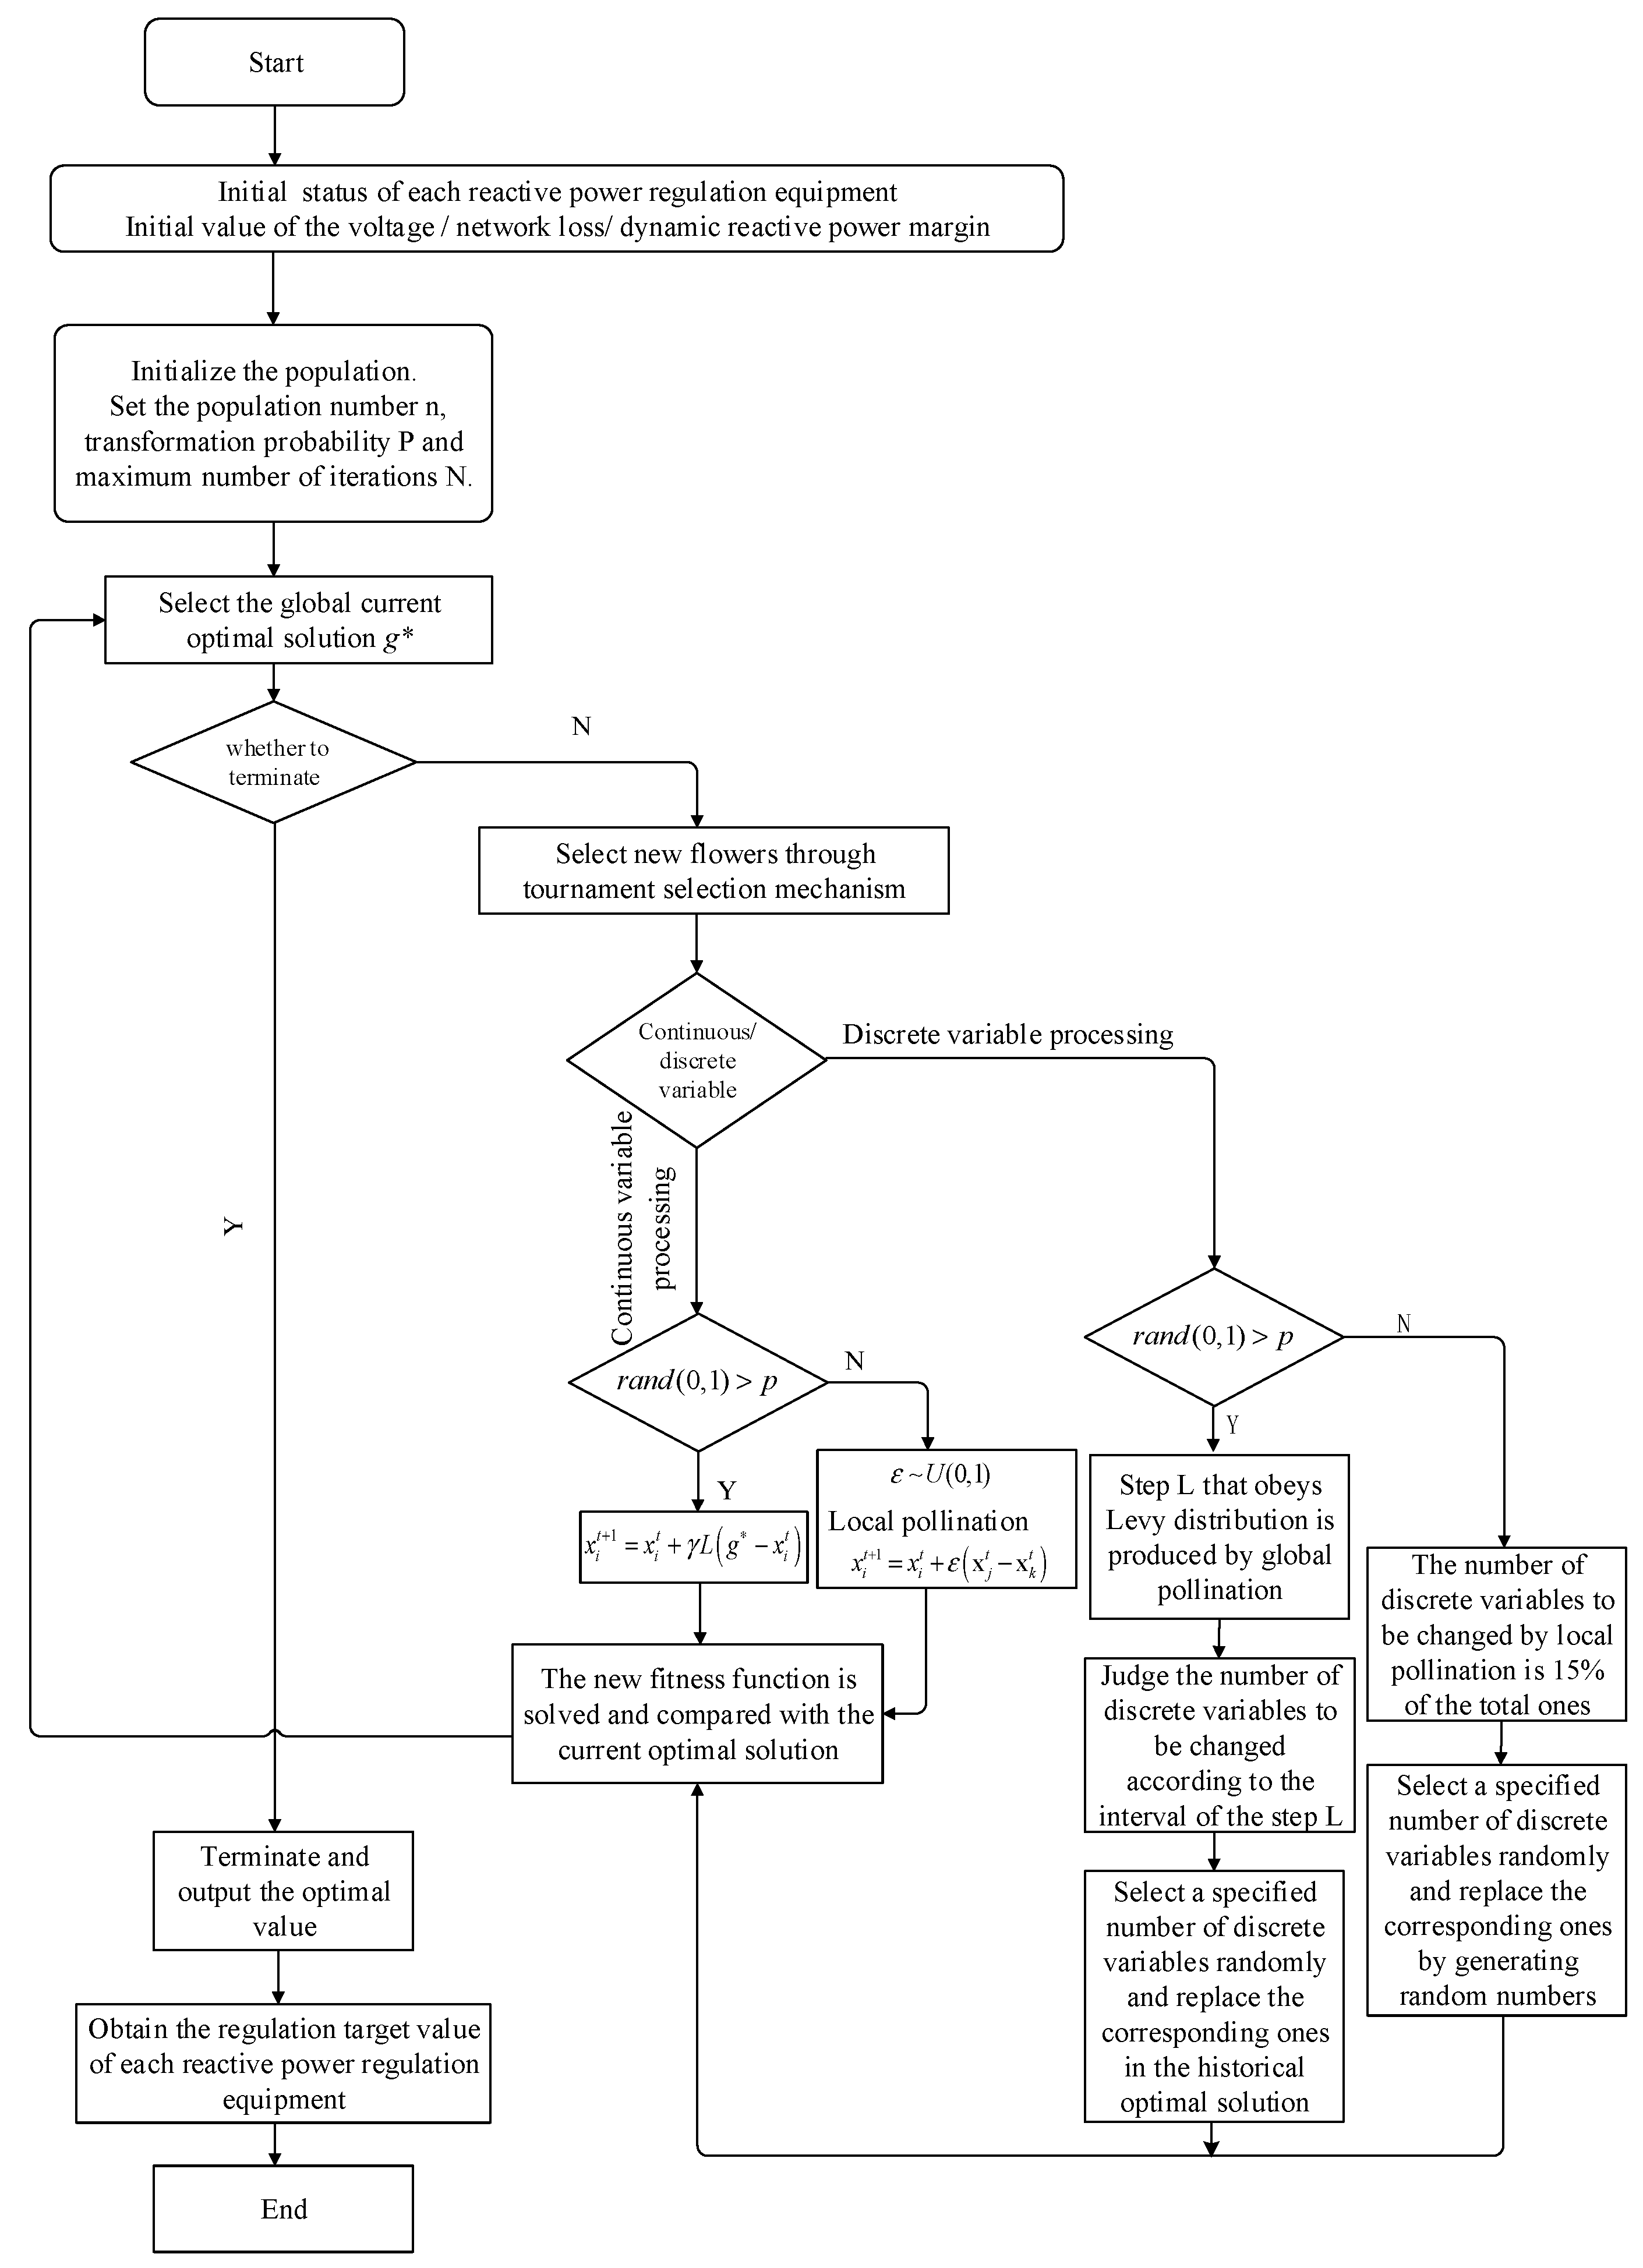
Since the fitness of each flower is determined by the current continuous and discrete variables, this section will propose an FPA with mixed processing of continuous and discrete variables. However, the continuous and discrete variables are not decoupled. Based on the discrete FPA analysis in Section 3.3, the change of the discrete variable value in global pollination needs to be replaced according to the corresponding discrete variables in the historical optimal solution. Therefore, before operating on specific variables, it is necessary to judge their types. Then, the operations described in Section 3.1 are performed for continuous variables and the processing of the discrete pollination algorithm in Section 3.3 is performed for discrete variables. After the fitness is obtained in each iteration, the tournament selection mechanism is executed to obtain a better population, and then the next iteration is executed. The flow chart of the improved continuous-discrete hybrid FPA is shown in Figure 1.
5. Example Analysis
5.1. Example Setting
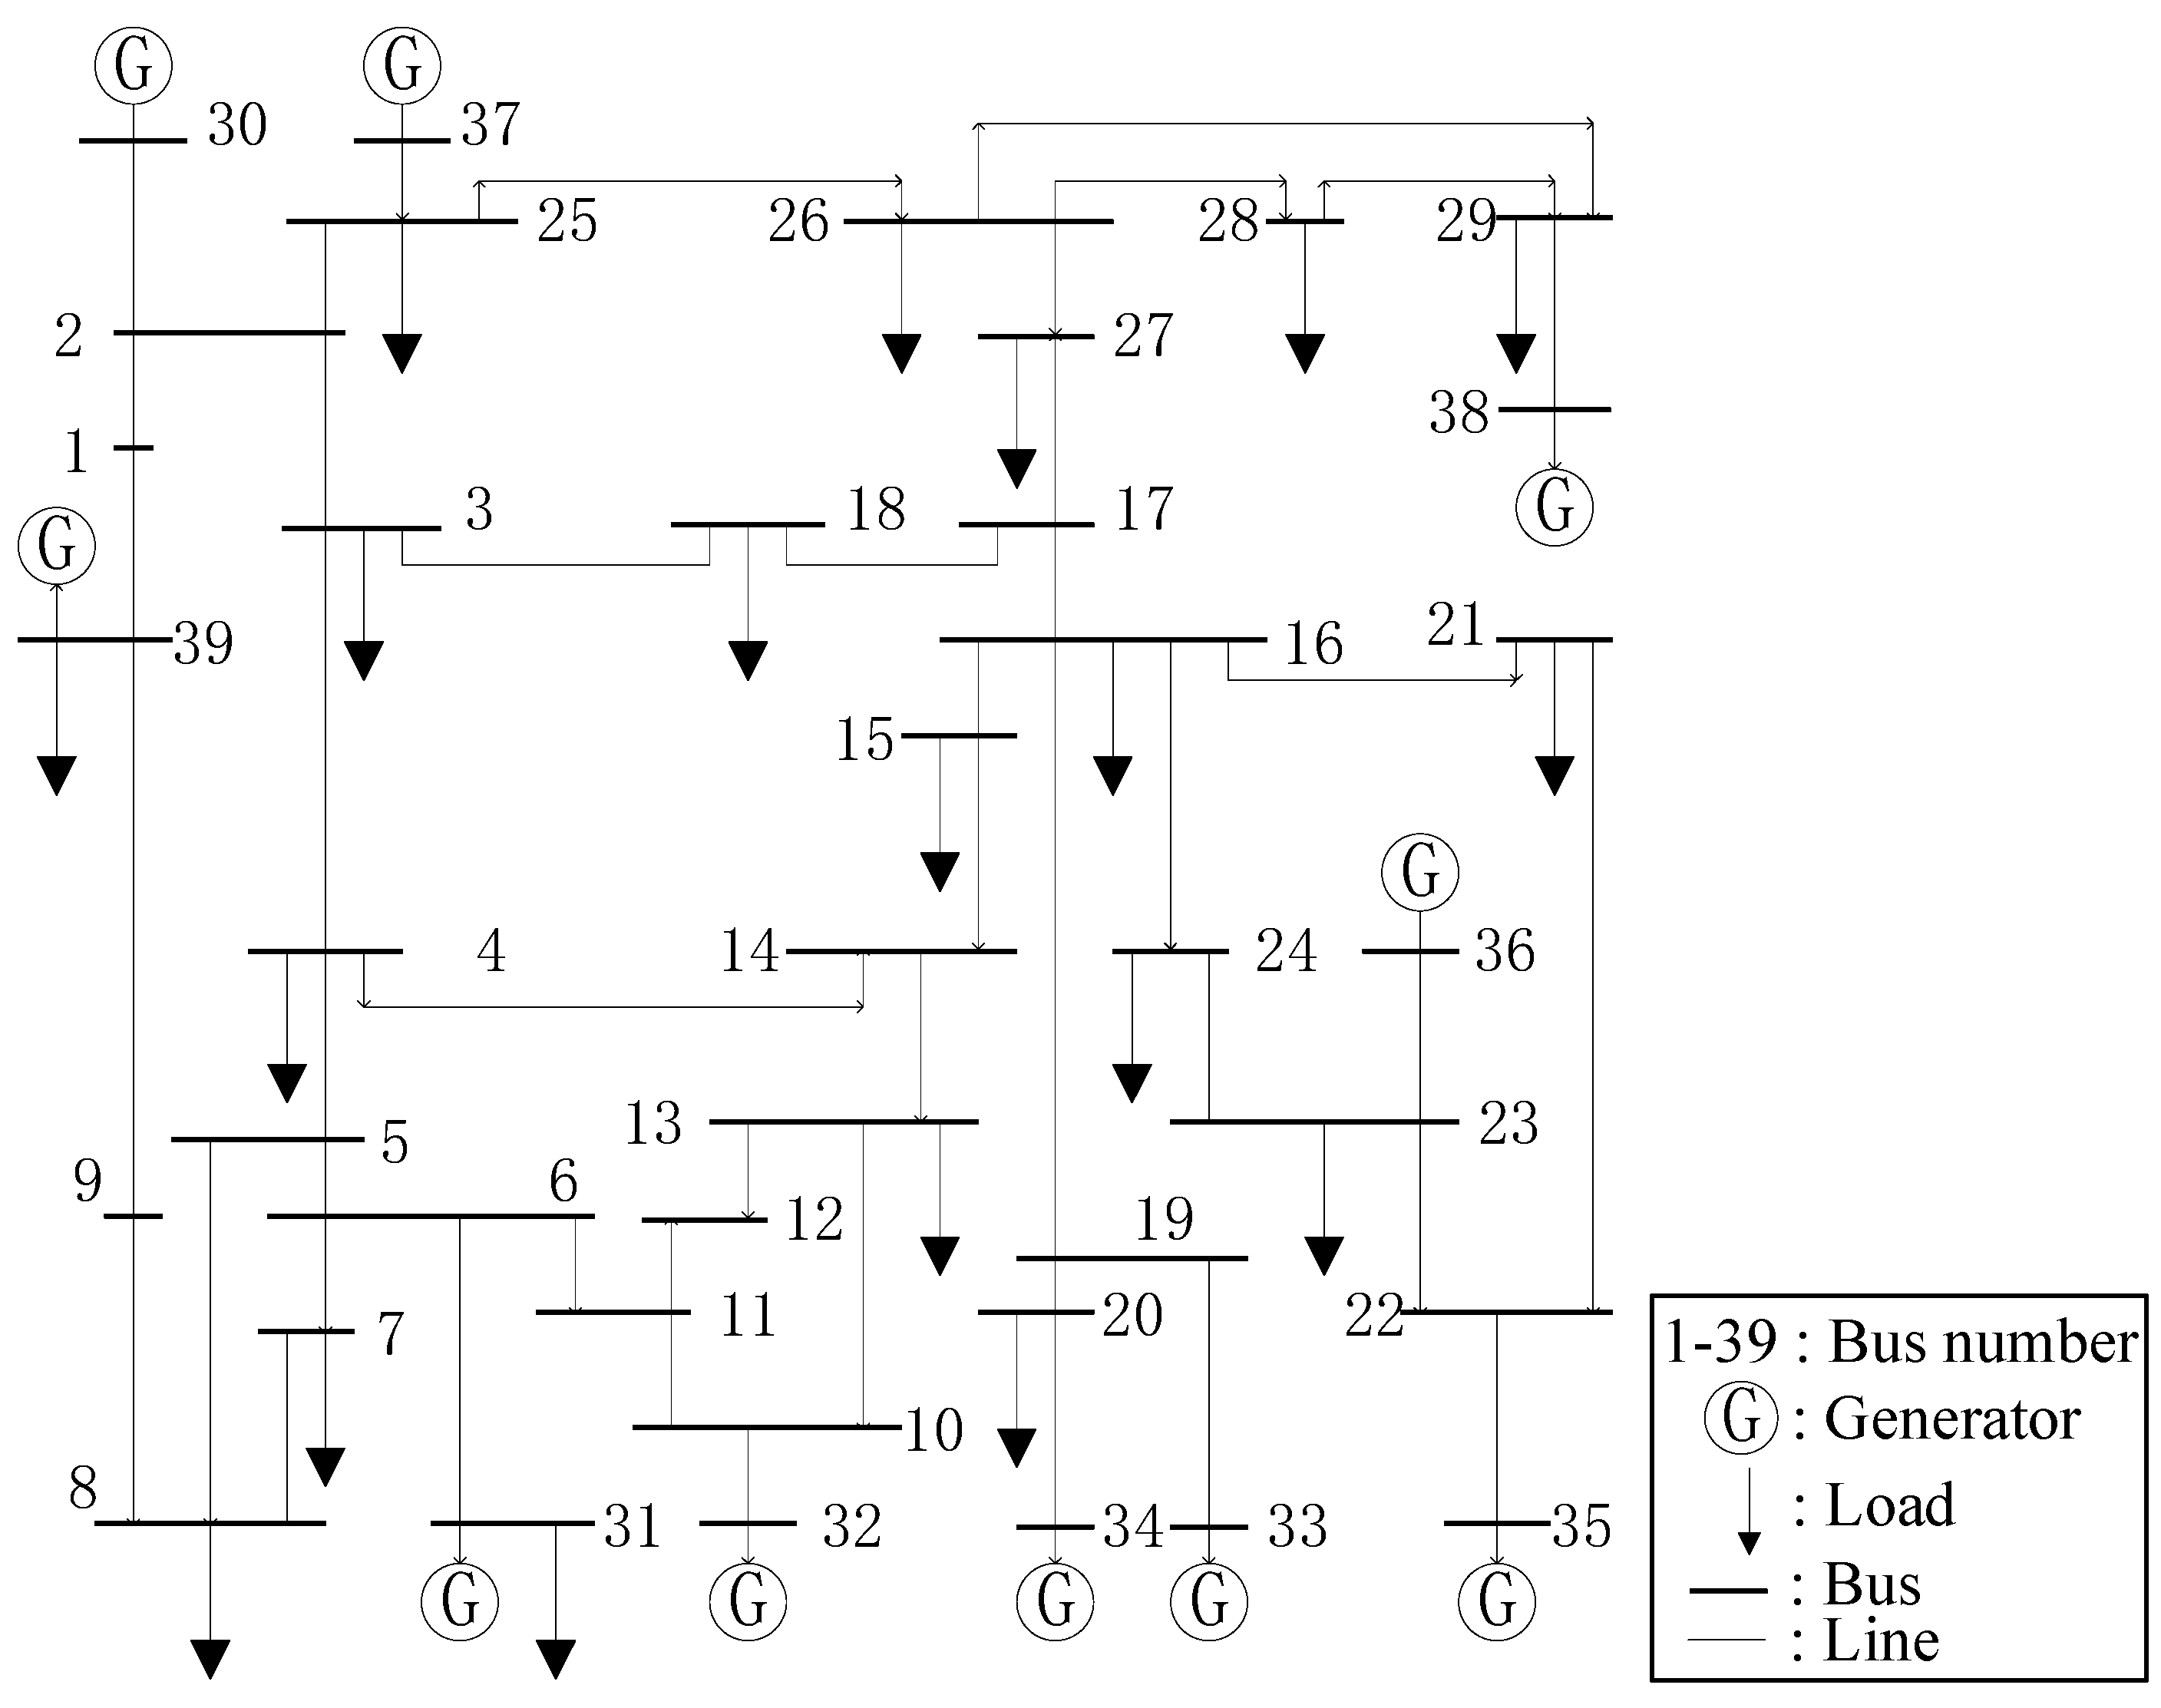
In order to verify the feasibility and advancement of the improved continuous-discrete hybrid FPA proposed in Section 4, the IEEE-39 bus system is selected to conduct the experiment. The specific topology is shown in Figure 2, the access location and specific access capacity of new energy units are shown in Table 1 and Table 2. In this paper, the Newton Raphson algorithm is used to calculate the steady-state power flow distribution of the power grid, which is based on the Matpower software.
In this system, the installed capacity of the traditional power supply (thermal power unit) accounts for 67.74% of the load active power, while the total installed capacity of the new energy accounts for 43.54% of the load active power. SVC is set at the corresponding PPC of renewable energy. The capacitor can be switched in four gears, and the switching capacity is 0, 16, 32, 48 MW, respectively. The transformer tap is set with 25 control gears, which change every 0.025 p.u. and the adjustment range is from 0.9 to 1.5 p.u. Before optimization, the network loss of the whole network is 143.402 MW, the reactive power margin of dynamic compensation equipment is 285.2146 Mvar, and the voltage of each bus is shown in Table 3.
From Table 3, it can be seen that most buses in the system have exceeded the limit. The voltages of some buses are lower than the minimum voltage of 0.94 p.u., while some have exceeded the upper voltage limit of 1.1 p.u. The whole system has a large network loss and a small reactive power margin, which needs compensation and optimization.
5.2. Feasibility Analysis of the Example
In this example, the optimization variables are the voltages of 10 thermal power units, 12 transformer tap gears, 10 wind and solar new energy reactive power outputs, 10 SVC reactive power outputs and the switchable group numbers of 2 capacitor banks. Three weights are chosen as λ1 = λ2 = λ3 = 0.33 in the objective function (2), and λ is selected as 1.5 in formula (9). In this example, K = 39 and M = 10 in formula (1). The optimization results of the improved continuous-discrete hybrid FPA are shown in Table 4, Table 5, Table 6, Table 7 and Table 8.
From Table 4, Table 5, Table 6 and Table 7, one knows that based on the improved continuous-discrete hybrid FPA optimization, all the constraints are satisfied and the bus voltages after optimization are within the constraint range. Moreover, it can be deduced from Table 8 that the reactive power is reasonably distributed and supplemented through the optimal control in this paper. Specifically, the power loss of the whole network is reduced by 22.468 MW, and the dynamic reactive power margin of SVC is increased by 303.225 MVar, which further improves the ability of the system to deal with voltage fluctuation.
5.3. Advancement Analysis of the Example
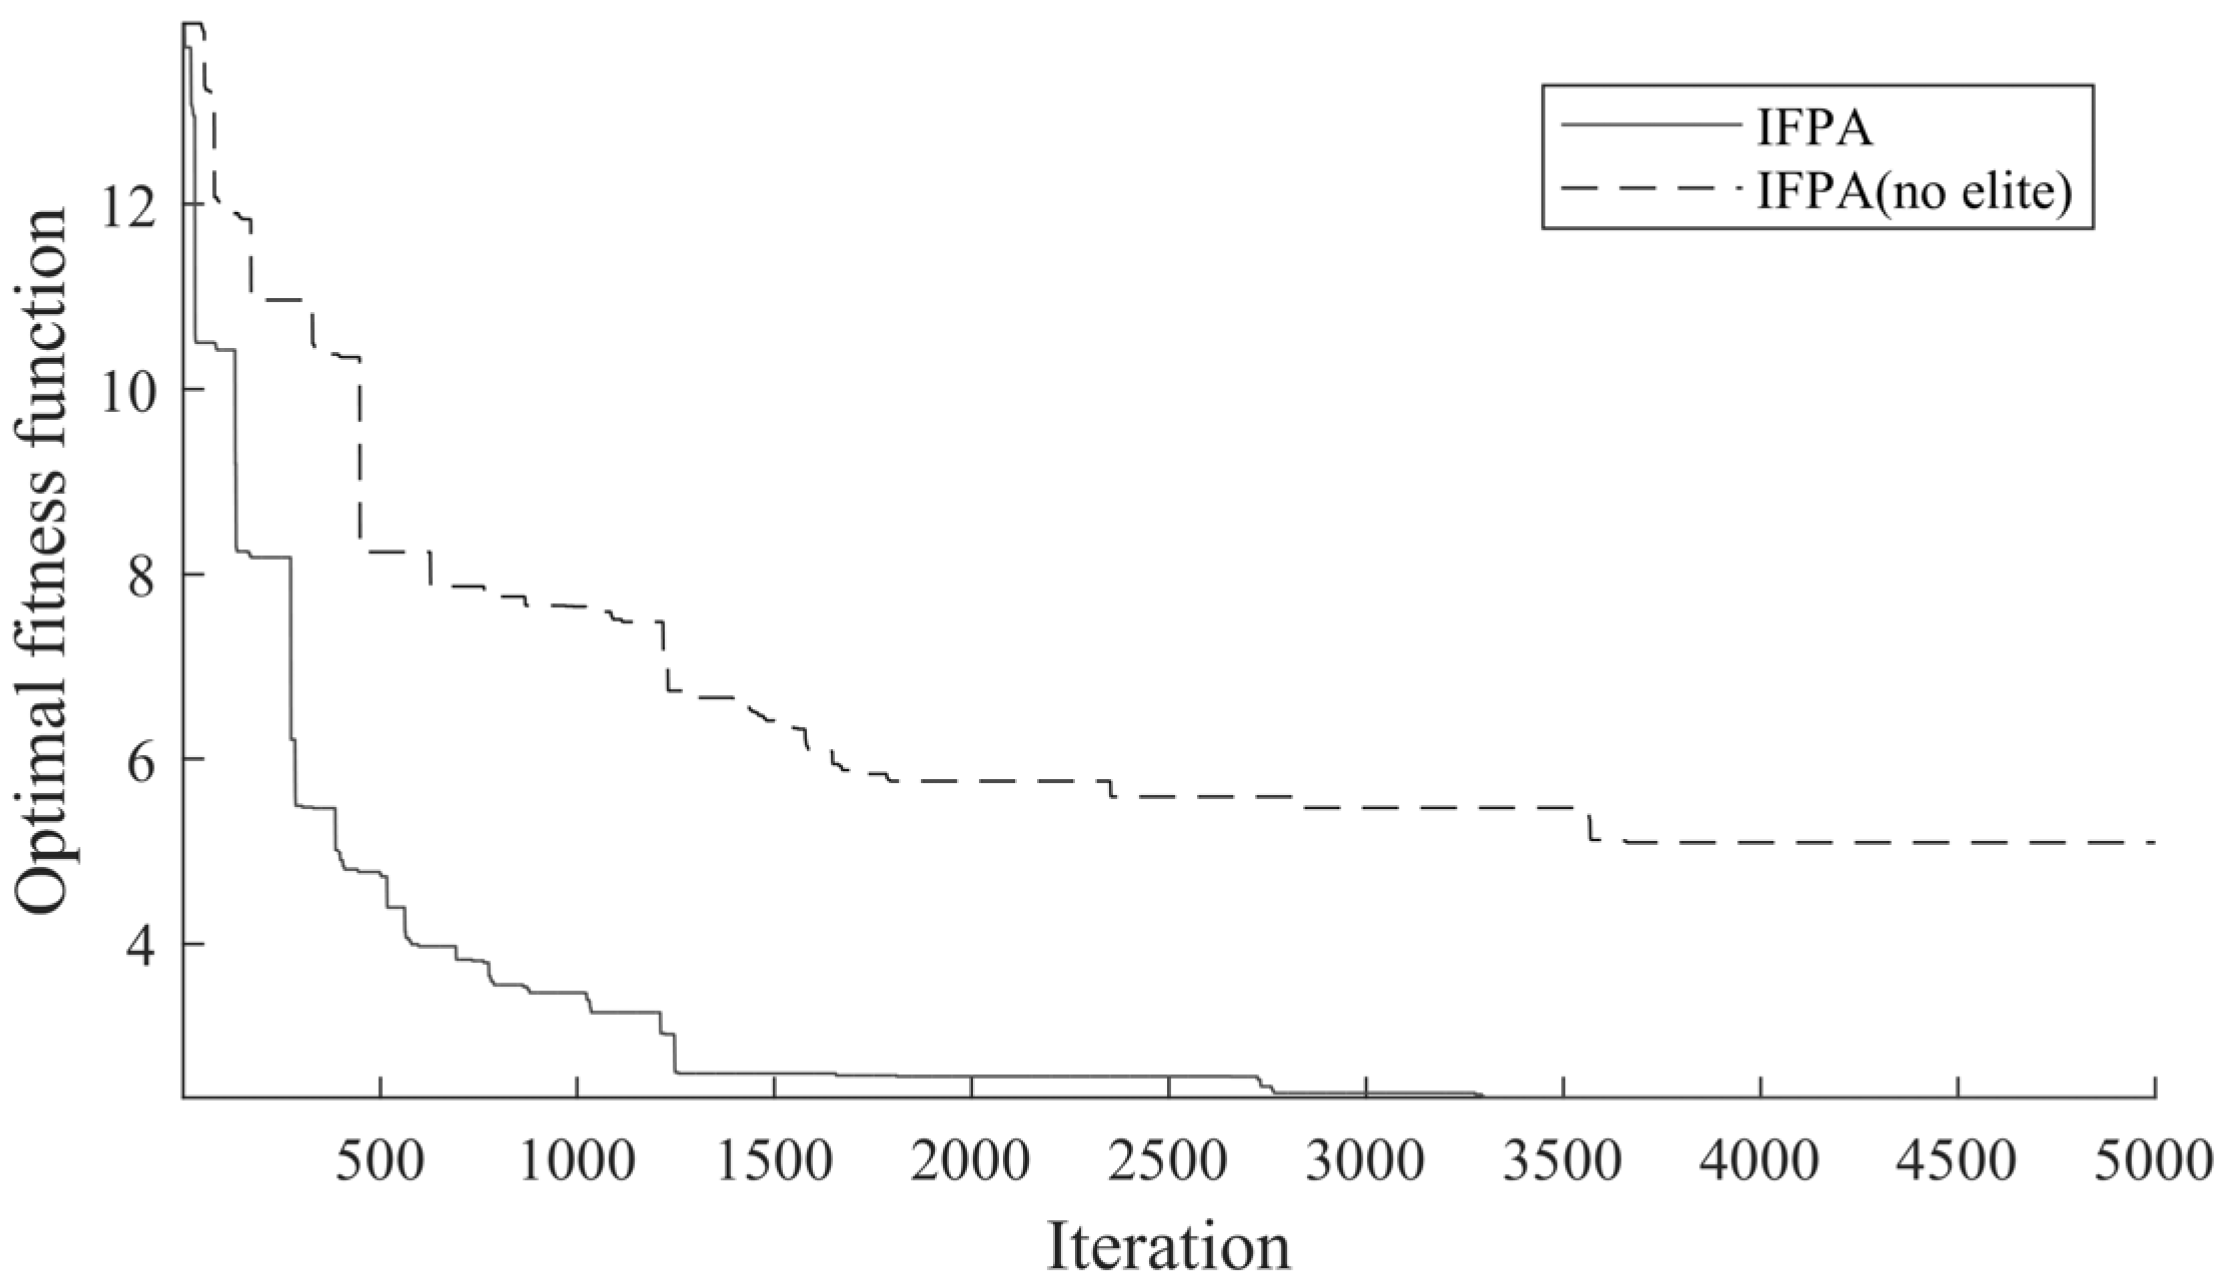
In this subsection, ablation experiments are carried out to verify the influence of the tournament selection mechanism on the convergence speed of the algorithm. Figure 3 shows the comparison results, which indicates that after adding the tournament selection strategy, the fitness function converges faster and is less likely to fall into local optimization. Without the tournament selection mechanism, the fitness function converges in the 3600th generation with the fitness value of 5.1763. While with the tournament selection mechanism, the fitness function converges at 3.1683 in the 3200th generation. Obviously, the tournament selection mechanism can improve the optimization accuracy and speed up the optimization efficiency.
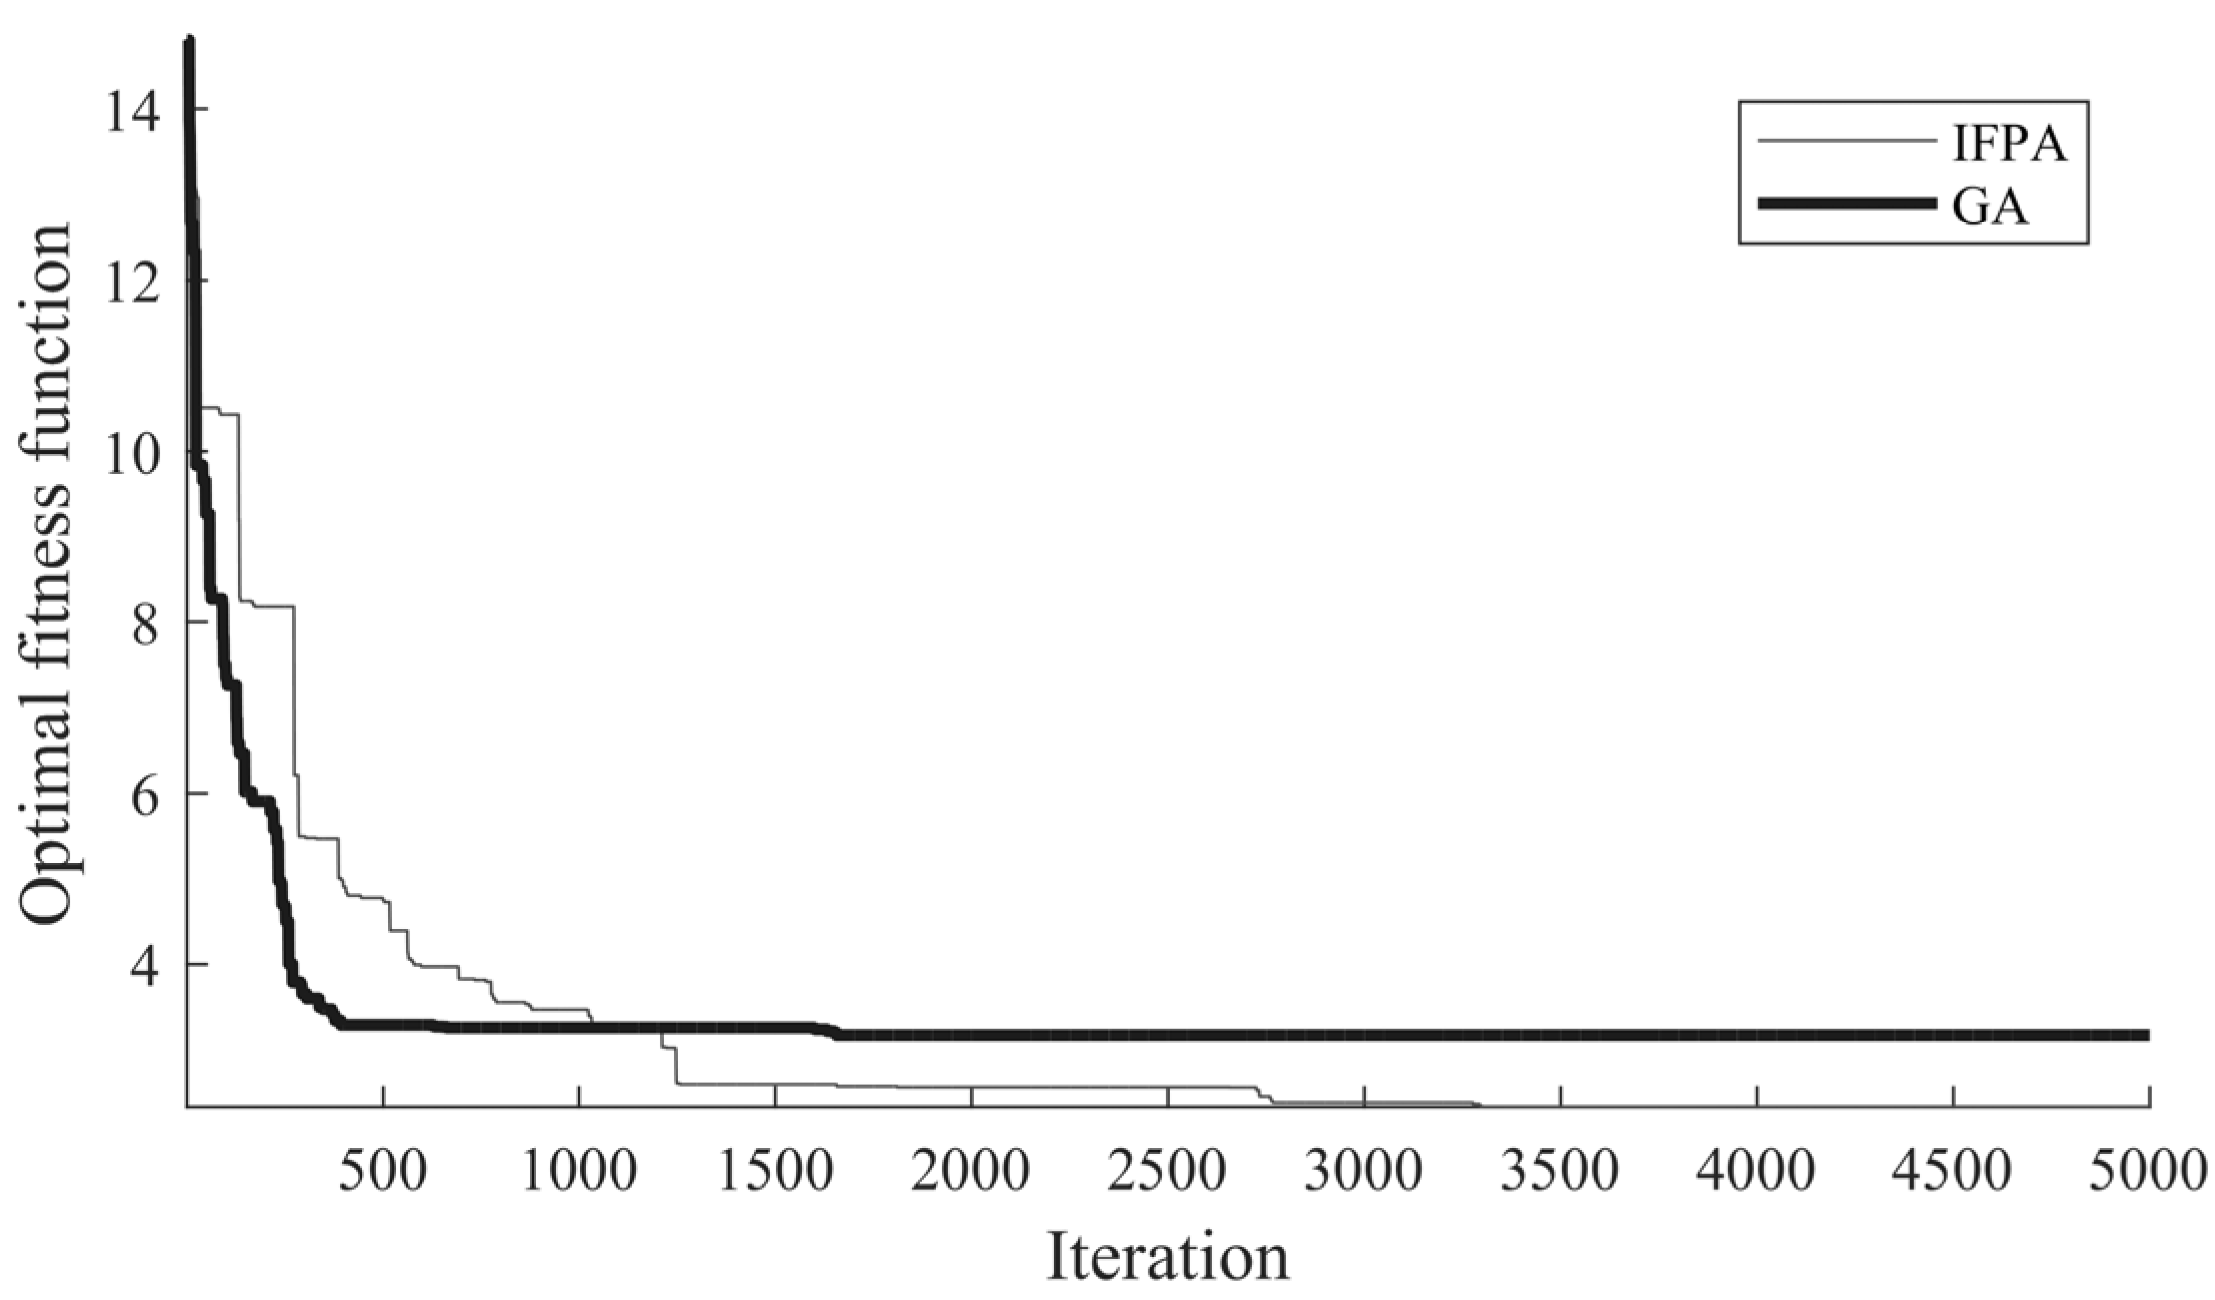
In order to illustrate the advancement of the proposed improved FPA, a classical algorithm GA, which is commonly used in reactive power optimization of the power system, is chosen to conduct the Comparative experiment. Figure 4 shows the corresponding fitness function curves for these two algorithms.
In Figure 4, the optimal fitness function values for the improved FPA and GA are 2.3333 and 3.1683, respectively, which implies GA has fallen into local optimization in the 400th generation. Thus, the improved FPA is superior to GA in solving the reactive power and voltage control problem proposed in this paper, which further proves the advancement of the proposed algorithm.
6. Discussion
This paper has proposed an improved continuous-discrete hybrid FPA to deal with the problem of the reactive power and voltage optimization of the new energy grid. On one hand, comprehensively considering the voltage deviation, network loss and dynamic power margin, a more reasonable optimization objective is obtained. On the other hand, a continuous-discrete hybrid FPA with an elite selection mechanism is adopted to achieve the optimal solution. This method provides a new prospect to solve the reactive power and voltage optimization problem to a certain extent. This paper only considers the global reactive power optimization at the system level and does not involve the internal characteristics of reactive power compensation equipment and new energy generating unit. In the future, we will further study the internal model and voltage control at the equipment level.
Author Contributions
Conceptualization, H.H. and Y.L.; methodology, H.H. and J.L.; validation, W.Z. and B.L.; data curation, J.L. and W.Z.; writing—original draft preparation, H.H. and B.L.; writing—review and editing, H.H. and Y.L. All authors have read and agreed to the published version of the manuscript.
Funding
This research received no external funding.
Institutional Review Board Statement
Not applicable.
Informed Consent Statement
Not applicable.
Data Availability Statement
Not applicable.
Conflicts of Interest
The authors declare no conflict of interest.
References
- Qu, L.; Zhang, S.; Lin, H.C.; Chen, N.; Li, L. Multiobjective Reactive Power Optimization of Renewable Energy Power Plants Based on Time-and-Space Grouping Method. Energies 2020, 13, 3556. [Google Scholar] [CrossRef]
- Chen, C. An Adaptive Particle Swarm Optimization Algorithm Based on Guiding Strategy and Its Application in Reactive Power Optimization. Energies 2019, 12, 1690. [Google Scholar]
- Danalakshmi, D.; Gopi, R.; Hariharasudan, A.; Otola, I.; Bilan, Y. Reactive Power Optimization and Price Management in Microgrid Enabled with Blockchain. Energies 2020, 13, 6179. [Google Scholar] [CrossRef]
- Ramesh, S.; Kannan, S.; Baskar, S. Application of Modified NSGA-II Algorithm to Reactive Power Optimization. In Proceedings of the International Conference on Computational Science, Engineering and Information Technology, Tirunelveli, India, 23–25 September 2011; Springer: Berlin/Heidelberg, Germany, 2011. [Google Scholar]
- Lee, K.Y.; Bai, X. Optimization method for reactive power planning by using a modified simple genetic algorithm. IEEE Trans. Power Syst. 1995, 10, 1843–1850. [Google Scholar] [CrossRef] [Green Version]
- Liu, S.C.; Zhang, J.H.; Liu, Z.Q.; Wang, H.Q. Reactive power optimization and voltage control using an improved genetic algorithm. In Proceedings of the International Conference on Power System Technology, Zhejiang, China, 24–28 October 2010. [Google Scholar]
- Chang, S.; Zhang, S. Research on Reactive Power Optimization Algorithm of Power System Based on Improved Genetic Algorithm. In Proceedings of the 2017 International Conference on Industrial Informatics—Computing Technology, Intelligent Technology, Industrial Information Integration (ICIICII), Wuhan, China, 2–3 December 2017. [Google Scholar]
- Ramamoorthy, A.; Ramachandran, R. Reactive power optimization using GSA. In Proceedings of the Power India International Conference, Delhi, India, 5–7 December 2015. [Google Scholar]
- Xin, M.; Liu, R.L. Reactive power optimization in power system based on improved niche genetic algorithm. In Proceedings of the 2010 International Conference on Computer Design and Applications, IEEE, Qinhuangdao, China, 25–27 June 2010. [Google Scholar]
- Panthagani, P.; Rao, R.S. Pareto-based allocations of multi-type flexible AC transmission system devices for optimal reactive power dispatch using Kinetic Gas Molecule Optimization algorithm. Meas. Control 2020, 53, 239–249. [Google Scholar] [CrossRef] [Green Version]
- Vlachogiannis, J.G.; Lee, K.Y. A Comparative Study on Particle Swarm Optimization for Optimal Steady-State Performance of Power Systems. IEEE Trans. Power Syst. 2006, 21, 1718–1728. [Google Scholar] [CrossRef] [Green Version]
- Nassar, I.A.; Omara, M.A.; Abdella, M.M. Enhancement of Voltage Profile in Power Systems by Using Genetic Algorithm. In Proceedings of the 2019 21st International Middle East Power Systems Conference (MEPCON), Cairo, Egypt, 17–19 December 2019. [Google Scholar]
- Jun, X.; Chunxiang, L.; Yichen, X. Reactive Power Optimization for Distribution Network Based on Distributed Random Gradient-Free Algorithm. Energies 2018, 11, 534. [Google Scholar] [CrossRef] [Green Version]
- Wang, H.; Wang, Z.J. Reactive power optimization of power system with wind farm. In Proceedings of the 2019 Chinese Control and Decision Conference (CCDC), IEEE, Nanchang, China, 3–5 June 2019; pp. 5768–5771. [Google Scholar]
- Sarkar, M.N.I.; Meegahapola, L.G.; Datta, M. Optimal Reactive Power Dispatch Considering Reactive Power Support from Renewable Energy Generators. In Proceedings of the 2019 IEEE International Conference on Industrial Technology (ICIT), IEEE, Melbourne, VIC, Australia, 13–15 February 2019; pp. 667–672. [Google Scholar]
- Regalado, J.A.; Barocio, E.; Cuevas, E. Optimal Power Flow Solution Using Modified Flower Pollination Algorithm. In Proceedings of the IEEE Autumn Meeting on Power, Electronics and Computing, Ixtapa, Mexico, 4–6 November 2015. [Google Scholar]
- Zhan, F.; Xiong, H.; Chen, F. Flower Pollination Algorithm for Distribution Network Optimization Scheduling Including Microgrid. In Proceedings of the 2019 IEEE 8th Joint International Information Technology and Artificial Intelligence Conference (ITAIC), Chongqing, China, 24–26 May 2019. [Google Scholar]
- Yang, X.S. Flower Pollination Algorithm for Global Optimization; Springer: Berlin/Heidelberg, Germany, 2012. [Google Scholar]
- Ma, X.X.; Wang, J.S. An Improved Flower Pollination Algorithm to Solve Function Optimization Problem. IAENG Int. J. Comput. Sci. 2018, 45, 364–370. [Google Scholar]
- Mergos, P.E.; Yang, X.S. Flower pollination algorithm parameters tuning. Soft Comput. 2021, 25, 14429–14447. [Google Scholar] [CrossRef]
- Kopciewicz, P.; Łukasik, S. Exploiting flower constancy in flower pollination algorithm: Improved biotic flower pollination algorithm and its experimental evaluation. Neural Comput. Appl. 2019, 32, 11999–12010. [Google Scholar] [CrossRef] [Green Version]
- Nabil, E. A Modified Flower Pollination Algorithm for Global Optimization. Expert Syst. Appl. 2016, 57, 192–203. [Google Scholar] [CrossRef]
Figure 1.
Flow chart of the reactive power and voltage optimization method based on improved continuous-discrete hybrid FPA.
Figure 1.
Flow chart of the reactive power and voltage optimization method based on improved continuous-discrete hybrid FPA.

Figure 2.
The topology of the IEEE-39 bus system.

Figure 3.
Fitness function curves before and after adding tournament selection mechanism.

Figure 4.
Fitness function curves of the improved FPA and GA.


Table 1.
Parameters of the new energy power generation under the IEEE-39 bus system.
| Generator Name | Bus | Rated Active Power Value/MW | Reactive Power Range/Mvar |
|---|---|---|---|
| Wind power 1 | 1 | 300 | (−98.58, 98.58) |
| Wind power 2 | 4 | 300 | (−98.58, 98.58) |
| Wind power 3 | 7 | 300 | (−98.58, 98.58) |
| Wind power 4 | 8 | 300 | (−98.58, 98.58) |
| Wind power 5 | 20 | 300 | (−98.58, 98.58) |
| PV 1 | 21 | 300 | (−98.58, 98.58) |
| PV 2 | 23 | 300 | (−98.58, 98.58) |
| PV 3 | 25 | 300 | (−98.58, 98.58) |
| PV 4 | 27 | 300 | (−98.58, 98.58) |
| PV 5 | 29 | 300 | (−98.58, 98.58) |
Table 2.
Parameters of switchable reactive power compensation device.
| Name | Bus | Maximum Switchable Capacity/MVar | Switchable Gear |
|---|---|---|---|
| SVC 1 | 1 | 60 | / |
| SVC 2 | 4 | 60 | / |
| SVC 3 | 7 | 60 | / |
| SVC 4 | 8 | 60 | / |
| SVC 5 | 20 | 60 | / |
| SVC 6 | 35 | 60 | / |
| SVC 7 | 36 | 60 | / |
| SVC 8 | 37 | 60 | / |
| SVC 9 | 38 | 60 | / |
| SVC 10 | 39 | 60 | / |
| Capacitor bank 1 | 9 | 48 | 4 |
| Capacitor bank 2 | 10 | 48 | 4 |
Table 3.
The voltage of each bus in the initial state before optimization.
| Bus Number | Voltage Amplitude/p.u. | Bus Number | Voltage Amplitude/p.u. |
|---|---|---|---|
| 1 | 0.999 | 21 | 1.300 |
| 2 | 0.978 | 22 | 1.068 |
| 3 | 0.956 | 23 | 0.845 |
| 4 | 1.010 | 24 | 1.168 |
| 5 | 1.069 | 25 | 1.013 |
| 6 | 1.090 | 26 | 1.067 |
| 7 | 1.090 | 27 | 1.066 |
| 8 | 1.090 | 28 | 1.083 |
| 9 | 1.047 | 29 | 1.087 |
| 10 | 0.899 | 30 | 0.94 |
| 11 | 0.841 | 31 | 0.979 |
| 12 | 0.865 | 32 | 0.946 |
| 13 | 0.924 | 33 | 1.06 |
| 14 | 0.998 | 34 | 0.978 |
| 15 | 1.132 | 35 | 0.979 |
| 16 | 1.202 | 36 | 0.951 |
| 17 | 1.227 | 37 | 1.000 |
| 18 | 0.905 | 38 | 1.060 |
| 19 | 1.268 | 39 | 0.984 |
| 20 | 1.057 |
Table 4.
Comparison of bus voltage amplitudes before and after optimization.
| Bus Number | Voltage Amplitude before Optimization/p.u. | Voltage Amplitude after Optimization/p.u. | Bus Number | Voltage Amplitude before Optimization/p.u. | Voltage Amplitude after Optimization/p.u. |
|---|---|---|---|---|---|
| 1 | 0.999 | 1.009 | 21 | 1.300 | 1.094 |
| 2 | 0.978 | 0.994 | 22 | 1.068 | 1.07 |
| 3 | 0.956 | 1.018 | 23 | 0.845 | 0.978 |
| 4 | 1.010 | 1.024 | 24 | 1.168 | 1.057 |
| 5 | 1.069 | 1.098 | 25 | 1.013 | 1.007 |
| 6 | 1.090 | 1.092 | 26 | 1.067 | 0.955 |
| 7 | 1.090 | 0.988 | 27 | 1.066 | 0.946 |
| 8 | 1.090 | 0.94 | 28 | 1.083 | 0.962 |
| 9 | 1.047 | 1.022 | 29 | 1.087 | 0.965 |
| 1 | 0.999 | 1.009 | 30 | 0.94 | 0.945 |
| 11 | 0.841 | 0.966 | 31 | 0.979 | 1.057 |
| 12 | 0.865 | 0.982 | 32 | 0.946 | 0.962 |
| 13 | 0.924 | 0.941 | 33 | 1.06 | 1.057 |
| 14 | 0.998 | 0.989 | 34 | 0.978 | 1.06 |
| 15 | 1.132 | 1.05 | 35 | 0.979 | 0.946 |
| 16 | 1.202 | 1.091 | 36 | 0.951 | 1.041 |
| 17 | 1.227 | 1.1 | 37 | 1.000 | 0.975 |
| 18 | 0.905 | 1.035 | 38 | 1.060 | 0.958 |
| 19 | 1.268 | 1.1 | 39 | 0.984 | 1.044 |
| 20 | 1.057 | 1.024 |
Table 5.
Comparison of reactive power outputs of new energy units before and after optimization.
| Name | Bus | Reactive Power Outputs before Optimization/MVar | Reactive Power Outputs after Optimization/MVar |
|---|---|---|---|
| Wind power 1 | 1 | 73.5392 | 94.4489 |
| Wind power 2 | 4 | 34.5052 | −97.6893 |
| Wind power 3 | 7 | 32.7185 | −87.2426 |
| Wind power 4 | 8 | −34.2146 | −94.3411 |
| Wind power 5 | 20 | 15.1978 | 90.6202 |
| PV 1 | 35 | 89.3735 | 94.2635 |
| PV 2 | 36 | 48.4663 | −98.0834 |
| PV 3 | 37 | −85.582 | 92.5211 |
| PV 4 | 38 | −20.7897 | 93.3045 |
| PV 5 | 39 | −35.1074 | −96.1935 |
Table 6.
Comparison of SVC reactive power outputs before and after optimization.
| Name | Bus | Reactive Power Outputs before Optimization/MVar | Reactive Power Outputs after Optimization/MVar |
|---|---|---|---|
| SVC 1 | 1 | 36.4317 | 0.523067 |
| SVC 2 | 4 | 48.3998 | 1.08066 |
| SVC 3 | 7 | 12.2406 | 0.643371 |
| SVC 4 | 8 | 27.2473 | 1.13296 |
| SVC 5 | 20 | 26.6678 | 4.01776 |
| SVC 6 | 35 | 1.7604 | 0.376127 |
| SVC 7 | 36 | 47.7693 | 1.18005 |
| SVC 8 | 37 | 6.8443 | 0.618046 |
| SVC 9 | 38 | 51.9223 | 0.538719 |
| SVC 10 | 39 | 55.5019 | 1.44947 |
Table 7.
Comparison of transformer tap gears and capacitor bank numbers before and after optimization.
Table 7.
Comparison of transformer tap gears and capacitor bank numbers before and after optimization.
| Name | Branch (Bus-Bus) | Gears or Bank Numbers Before Optimization | Gears or Bank Numbers After Optimization |
|---|---|---|---|
| Tap 1 | 11–12 | 24 | 4 |
| Tap 2 | 13–12 | 21 | 2 |
| Tap 3 | 31–6 | 23 | 6 |
| Tap 4 | 32–10 | 24 | 12 |
| Tap 5 | 33–19 | 18 | 12 |
| Tap 6 | 34–20 | 13 | 0 |
| Tap 7 | 35–22 | 16 | 8 |
| Tap 8 | 36–23 | 22 | 2 |
| Tap 9 | 37–25 | 18 | 19 |
| Tap 10 | 30–2 | 10 | 11 |
| Tap 11 | 38–29 | 20 | 2 |
| Tap 12 | 20–19 | 9 | 24 |
| Capacitor bank 1 | 9 | 2 | 0 |
| Capacitor bank 2 | 10 | 0 | 0 |
Table 8.
Comparison of network loss and dynamic reactive power margin before and after optimization.
Table 8.
Comparison of network loss and dynamic reactive power margin before and after optimization.
| Name | Before Optimization | After Optimization |
|---|---|---|
| network loss | 143.402 MW (2.1%) | 120.934 MW (1.8%) |
| dynamic reactive power margin | 285.2146 MVar | 588.4398 MVar |
Publisher’s Note: MDPI stays neutral with regard to jurisdictional claims in published maps and institutional affiliations. |
© 2022 by the authors. Licensee MDPI, Basel, Switzerland. This article is an open access article distributed under the terms and conditions of the Creative Commons Attribution (CC BY) license (https://creativecommons.org/licenses/by/4.0/).
Share and Cite
MDPI and ACS Style
He, H.; Li, J.; Zhao, W.; Li, B.; Li, Y. Reactive Power and Voltage Optimization of New-Energy Grid Based on the Improved Flower Pollination Algorithm. Energies 2022, 15, 3653. https://0-doi-org.brum.beds.ac.uk/10.3390/en15103653
AMA Style
He H, Li J, Zhao W, Li B, Li Y. Reactive Power and Voltage Optimization of New-Energy Grid Based on the Improved Flower Pollination Algorithm. Energies. 2022; 15(10):3653. https://0-doi-org.brum.beds.ac.uk/10.3390/en15103653
Chicago/Turabian StyleHe, Hao, Jia Li, Weizhe Zhao, Boyang Li, and Yalong Li. 2022. "Reactive Power and Voltage Optimization of New-Energy Grid Based on the Improved Flower Pollination Algorithm" Energies 15, no. 10: 3653. https://0-doi-org.brum.beds.ac.uk/10.3390/en15103653
Note that from the first issue of 2016, this journal uses article numbers instead of page numbers. See further details here.