Article

Industrial End-Users’ Preferred Characteristics for Wood Biomass Feedstocks

1
Skogforsk, The Forestry Research Institute of Sweden, Uppsala Science Park, SE-751 83 Uppsala, Sweden
2
Department of Water Management, Faculty of Agriculture, University of Novi Sad, Trg. D. Obradovica 8, 21000 Novi Sad, Serbia
3
School of Forest Sciences, University of Eastern Finland (UEF), F-80101 Joensuu, Finland
4
Department of Crop Production Ecology, Swedish University of Agricultural Sciences (SLU), SE-750 07 Uppsala, Sweden
5
Natural Resources Institute Finland (Luke), Yliopistokatu 6 B, F-80100 Joensuu, Finland
6
Department for Renewable Energy Sources, Climate and Environmental Protection, Energy Institute Hrvoje Pozar (EIHP), Savska c.163, 10000 Zagreb, Croatia
7
Economic Analysis Division, Canadian Forest Service, Natural Resources Canada, Ottawa, ON K1A 0E4, Canada
8
Department of Forest Biomaterials and Technology, Swedish University of Agricultural Sciences, SE-901 83 Umeå, Sweden
*
Author to whom correspondence should be addressed.
Submission received: 18 April 2022 / Revised: 10 May 2022 / Accepted: 17 May 2022 / Published: 19 May 2022

Abstract

:
The use of sustainably sourced biomass is an important tool for mitigating the effects of climate change; but biomass is far from being a homogeneous resource. The aim of this study was to examine the decision-making process of industrial end-users considering biomass procurement. An online, two-part survey generated responses from 27 experienced professionals, representing a portfolio of facilities varying in size, technology, and biomass types, across Australia, Canada, Finland, and Sweden. A PAPRIKA conjoint analysis approach was used to analyze the data so that the attributes that influenced procurement decisions could be weighted and ranked. The results provided an insight into end-users’ views on factors including facility location, size, and biomass storage, handling, and procurement for different wood-based industrial services. The most important decision-making attribute appeared to be the type of biomass assortment, at individual, national, and aggregated levels. Of seven sub-categories of biomass assortments, sawdust (35%) was the most preferred type followed by stem wood chips (20%) and energy wood (15%). We concluded that, from the end-user’s perspective, a pre-defined biomass assortment is the most important factor when deciding on feedstock procurement at a bioenergy facility. These results help us better understand end-users’ perceptions of biomass properties in relation to their conversion processes and supply preferences and can inform product development and the securement of new niches in alternative business environments by existing and future biohubs.

1. Introduction

Sustainably sourced biomass has an important role to play in climate change mitigation and adaptation strategies by providing a supply of renewable carbon to the economy. Stable and secure sustainable biomass supplies are needed for energy independence as well as for de-fossilizing the economy [1]; in addition, de-fossilization driven by climate change mitigation strategies is expected to increase the demand for biomass further.
This higher demand is driven not only by combustion and combined heat and power (CHP) plants but by more sophisticated conversion streams [2], highlighting the need for sustainable biomass assortments of consistent quality with easily controllable characteristics [3]. Most biochemical producers relying on woody biomass require consistent high-quality feedstock; for example, biomass refinery plants using gasification and pyrolysis conversion technologies are more sensitive than traditional combustion plants to particle size, ash content, and moisture content [3,4]. However, differences in biomass feedstock, as a result of local forest conditions, energy production traditions, and supply chains [5], can influence the regional preferences of feedstock end-users.
At a regional level, logistic biohubs are increasingly being recognized as an important part of an efficient raw material supply chain for pulp, paper, and biomaterial industries [6,7,8,9]. The business models for biohubs and their functionality depend greatly on, for example, the type, amount, and quality of industrial feedstock demand as key measures for optimizing raw material utilization [10,11,12]. For the whole supply chain, from forest to final product, to work efficiently, a good understanding of suppliers’ capabilities and customers’ needs is also needed [13].
All biomass conversion processes require comminution and some level of other pre-treatment, such as drying, sieving, etc. The quality of wood chips can be defined in the same way as pre-defined assortments such as wood pellets or energy wood by their moisture and ash content, type, particle size, and heating value [14]. Inconsistencies in biomass quality between individual deliveries as well as between biomass suppliers cause the most problems for process control at facilities, even once they have been adjusted for specific biomass properties and their variation [15,16,17,18]. On the supply side, handling a comminuted biomass of various particle sizes and moisture content has a considerable effect on biomass storage, drying, loss, and self-ignition [19,20,21,22,23,24].
This highlights the need for a better understanding of how facilities perceive different aspects of pre-defined biomass assortments and specific biomass characteristics in order to streamline biomass supply and demand in regional biohubs. Key biomass characteristics include moisture content, particle size, and ash content [14] as well as availability and supply [25]. Depending on the biomass conversion process used, the requirements for specific biomass properties can vary; in general, large-scale, bubbling, fluidized bed boilers are the least sensitive to moisture content, ash and particle size, and variation compared with smaller grate-type boilers [26].
The aim of this study was to describe and assess end-users’ preferences regarding biomass feedstock characteristics and to analyze the key factors that influence procurement. The goal was to determine end-users’ perceptions of different wood-based industrial facilities, rank the features of business models in terms of facility location, size, and biomass storage, handling, and procurement, and determine relative weights and ranking for biomass attributes based on the opinions of experienced professionals from bioenergy facilities across different countries.

2. Materials and Methods

2.1. Survey Design and Data Collection

In order to characterize different biomass feedstocks and assess the end-users’ preferences, a list of attributes and associated levels was created after a series of discussions held in 2020. The attributes were defined as properties, features, or characteristics of biomass feedstock that had two or more categories or levels of performance or output, resulting in a final list of 10 attributes with two to seven levels (Table 1). A wide range of levels was deliberately used, to maximize the output of the survey.
These attributes formed the basis of a two-part survey. The first part included 28 general-purpose questions concerning the location of the facility, the conversion technologies used, total capacity or biomass demand, etc. In addition, the first part included questions regarding biomass properties (ash, moisture content, and particle size, and their acceptable range and values), storage, supply, and billing. The questions were framed to guide the respondents towards the second part of the survey [27], which was based on a PAPRIKA conjoint analysis approach, to define weights and ranks for the biomass attributes [28]. The respondents were asked to rank the levels for each predefined attribute in terms of importance (or attractiveness) at the beginning of the survey, before pairwise comparisons of hypothetical alternatives were presented (see Appendix A Figure A1).
A database of experienced bioenergy facility professionals (one per facility) was constructed to cover the range of targeted end-user profiles, with contributions from the International Energy Agency’s (IEA) Bioenergy network in Australia, Canada, Croatia, Finland, and Sweden. To be included in the database, the professionals had to represent a bioenergy facility and have at least 1 year’s experience in, for example, logistics, business development, process engineering, and supply of biomass. Of the resulting 100 professionals, the average length of experience in their current position was 8 years, ranging from 1 to 37 years. The facilities represented covered a range of conversion technologies, including different sizes of heat plants, CHP plants, and integrated combustion plants with gasification, pyrolysis, or pelletizing. The online survey was sent out to the potential respondents from 7 July to 19 October 2021.

2.2. Data Methods

The results of the survey were analyzed in two steps: first, descriptors of the main variables were used to characterize the facilities and biomass feedstocks; second, applying a PAPRIKA conjoint analysis approach, the biomass attributes were weighted and ranked. Conjoint analysis is a survey-based statistical technique that that can be used to determine how the different attributes that make up an individual product or service are valued by respondents [29], based on a controlled set of hypothetical alternatives (sometimes called concepts, profiles, or products) created from a combination of levels from all or some of the constituent attributes. A PAPRIKA approach (for technical development, see [28]) is based on pairwise ranking of potentially all undominated pairs of all possible alternatives. An undominated pair refers to a pair of alternatives where one is characterized by a higher ranked category for at least one attribute and a lower category for at least one other attribute than the other alternative.
For this survey, the respondents were asked to rank or rate the attributes of the different feedstocks under consideration using a pairwise comparison to determine weights for the attributes (part-worth utilities) based on their expert knowledge and judgment involving trade-offs between the attributes. The questions were based on partial alternatives, starting with only two attributes at a time, in contrast to the full-alternatives method, which presents all attributes together at once. Each question was based on a choice between two hypothetical alternatives defined by two attributes at a time, presuming that the other attributes were equal to the one presented. The analysis resulted in an implicit valuation of the weights or part-worth utilities of the attributes [30], which was estimated using 1000minds software (see https://www.1000minds.com/ (accessed on 1 December 2021)). More details about the PAPRIKA method are presented in Appendix B.

3. Results

3.1. Characterization of the Facilities’ Biomass Supply

Of the 100 facilities and professionals approached, 27 completed the first part of the survey (the general-purpose questions) and 20 completed the whole survey (a response rate of 27% and 20%, respectively). The respondents came from Australia, Canada, Finland, and Sweden, and their responses covered the whole range of targeted biomass end-use conversion technologies and included facilities of different sizes (Table 2). The main biomass conversion technologies represented were combustion, pelletizing, gasification, and torrefaction, as well as pyrolysis, lignin extraction, and hydrothermal liquefaction. Biomass conversion technologies such as pyrolysis, gasification, torrefaction, and lignin extraction were often integrated into other processes or were part of bigger complexes with multiple end products that could be considered biorefineries.
A wide range of biomass assortments was used, the most frequent being sawdust, energy wood, and pulpwood (Table 3). There was no apparent consensus among the combustion plants under 5 MW for a particular assortment; instead, it appeared that the plants were adapted for different assortments even within the same country. None of the smaller combustion plants used bark, possibly because of the challenge in achieving consistent quality parameters. However, bark use was widespread in the larger combustion plants or when combustion was a part of gasification, pyrolysis, or pelletizing. A similar pattern was seen with wood pellet production. Pellet plants in Canada focused mainly on sawdust, while, in Sweden, the use of bark and stem wood complemented the drying processes and raw material base. Pellet plants with integrated lignin and sugar extraction (for the production of bioethanol) as well combustion reported up to seven other assortments on their procurement list.
Most facilities had a good understanding of generally defined assortments, but their views on specific biomass properties, such as ash content levels, particle size, and moisture content, were rather unclear and weakly defined. However, although specific particle size definitions were unclear, it was evident that extremes in particle size, either oversized or too fine, caused the most problems in processing (Table 4). The accepted range of moisture content was very wide, although most facilities received their feedstock within 10% of their estimated optimal parameters.
In general, smaller combustion plants received the most non-comminuted (i.e., not chipped) biomass and often did not perform comminution on site. In some cases, this was because they were outsourcing this service. Larger facilities reported receiving less non-comminuted biomass, but they did perform comminution on site. A notable exception to this was lignin extraction and combustion, where pulpwood was the main assortment for the biorefinery that dominated the complex.
The procurement of raw materials for production was a significant part of each facility’s daily operations, and the length of the procurement contract was part of the supply risk evaluation and price optimization process. There were no large differences between the countries in the lengths of procurement contracts awarded. The most common contract periods were for up to 1 or 3 years, each representing 44% of the range (Figure 1). Small combustion plants (≤5 MW) in Canada had the widest range of contract periods, with almost a quarter of the facilities having varied preferences. In general, newer facilities and those involving biorefinery products or processes were associated with longer procurement contracts, whereas well-established facilities mostly preferred mid- to mid-long-term contracts in order to adapt more easily to changing market situations.
Nearly half of the facilities (48%) showed a preference for receiving electronic bills before the feedstock arrived and to know what was being delivered, while a third (33%) preferred to receive feedstocks from third-party accredited suppliers whose delivered volumes could be trusted, making re-measurement at the gate unnecessary.
The most common problem reported regarding biomass storage, by 50% of the facilities in Canada and Finland, 40% in Australia, and 33% in Sweden, was a lack of space (Figure 2). Other common problems associated with storage were biomass loss, self-ignition, and environmental restrictions. Environmental restrictions were especially common in Australia and Canada, as reported by 20% and 33% of the facilities, respectively. Sweden reported the fewest problems associated with storage, with 50% of their facilities reporting no problems at all.
High biomass losses were a particular problem for large combustion plants (over 50 MW) in Sweden and Finland. These large CHP plants were usually located relatively close to cities where land available for storage yards was limited. However, self-ignition and environmental restrictions were a particular problem in Canada where even 25% of the small combustion plants had issues. To mitigate some of the problems related to storing biomass at their own facilities, 25% of the Swedish, 40% of the Australian, 67% of the Canadian, and 75% of the Finnish respondents were willing to rent out extra storage, with 24 h access 7 days a week for all involved in the facility (Figure 3). Most preferred to rent extra storage to address their space restrictions rather than delegate suppliers to handle the biomass on their behalf. Respondents in Australia and Canada (60% and 33%) were the most willing to outsource some of their storage to suppliers and share the risks involved in biomass storage. In contrast, none of the respondents from Sweden was willing to outsource the handling of stored biomass to a supplier without direct control over it.

3.2. Feedstock Preferences

Only 20 facilities were included in the analysis of feedstock preferences because seven responses were only partially complete and, therefore, could not be used (for details of the facilities included and codes used in the study, see Table A1). The estimated individual weightings indicated that the type of biomass assortment (attribute A1) had the largest influence on the respondents’ preferences (Figure 4). This attribute had the highest aggregated weight (average 29.6%) and was ranked as the most important by 18 of the 20 respondents. The remaining two respondents (DM19 and DM10) ranked attribute A1 as second and seventh (the lowest weighting, at 5.7%), respectively.
Aggregating the data by country (Figure 5) indicated a stronger preference for biomass assortment (attribute A1) in Finland and Sweden than in Canada. An aggregation for the Australian facilities could not be determined because of the lack of variability (there was only one respondent). The attribute ranked second was assortment availability within the supply region (attribute A2, weight = 14.8%), and the third was price (attribute A3, weight = 11.8%). All other attributes had weights lower than 10%, apart from the lowest ranked attribute, which was ash content (A10, weight = 4.2%).
Within attribute A1, sawdust (L7) was the preferred type of biomass assortment, with seven respondents (35% of all respondents) ranking it first, although there was some variability (Table 5). Stem wood chips were preferred by four respondents (20%), while energy wood was ranked first by three respondents (15%). Interestingly, each biomass assortment was the preferred choice of at least one respondent. (The estimates for weighting all attributes and levels are presented in the Appendix A, Table A2, Table A3, Table A4 and Table A5).

4. Discussion

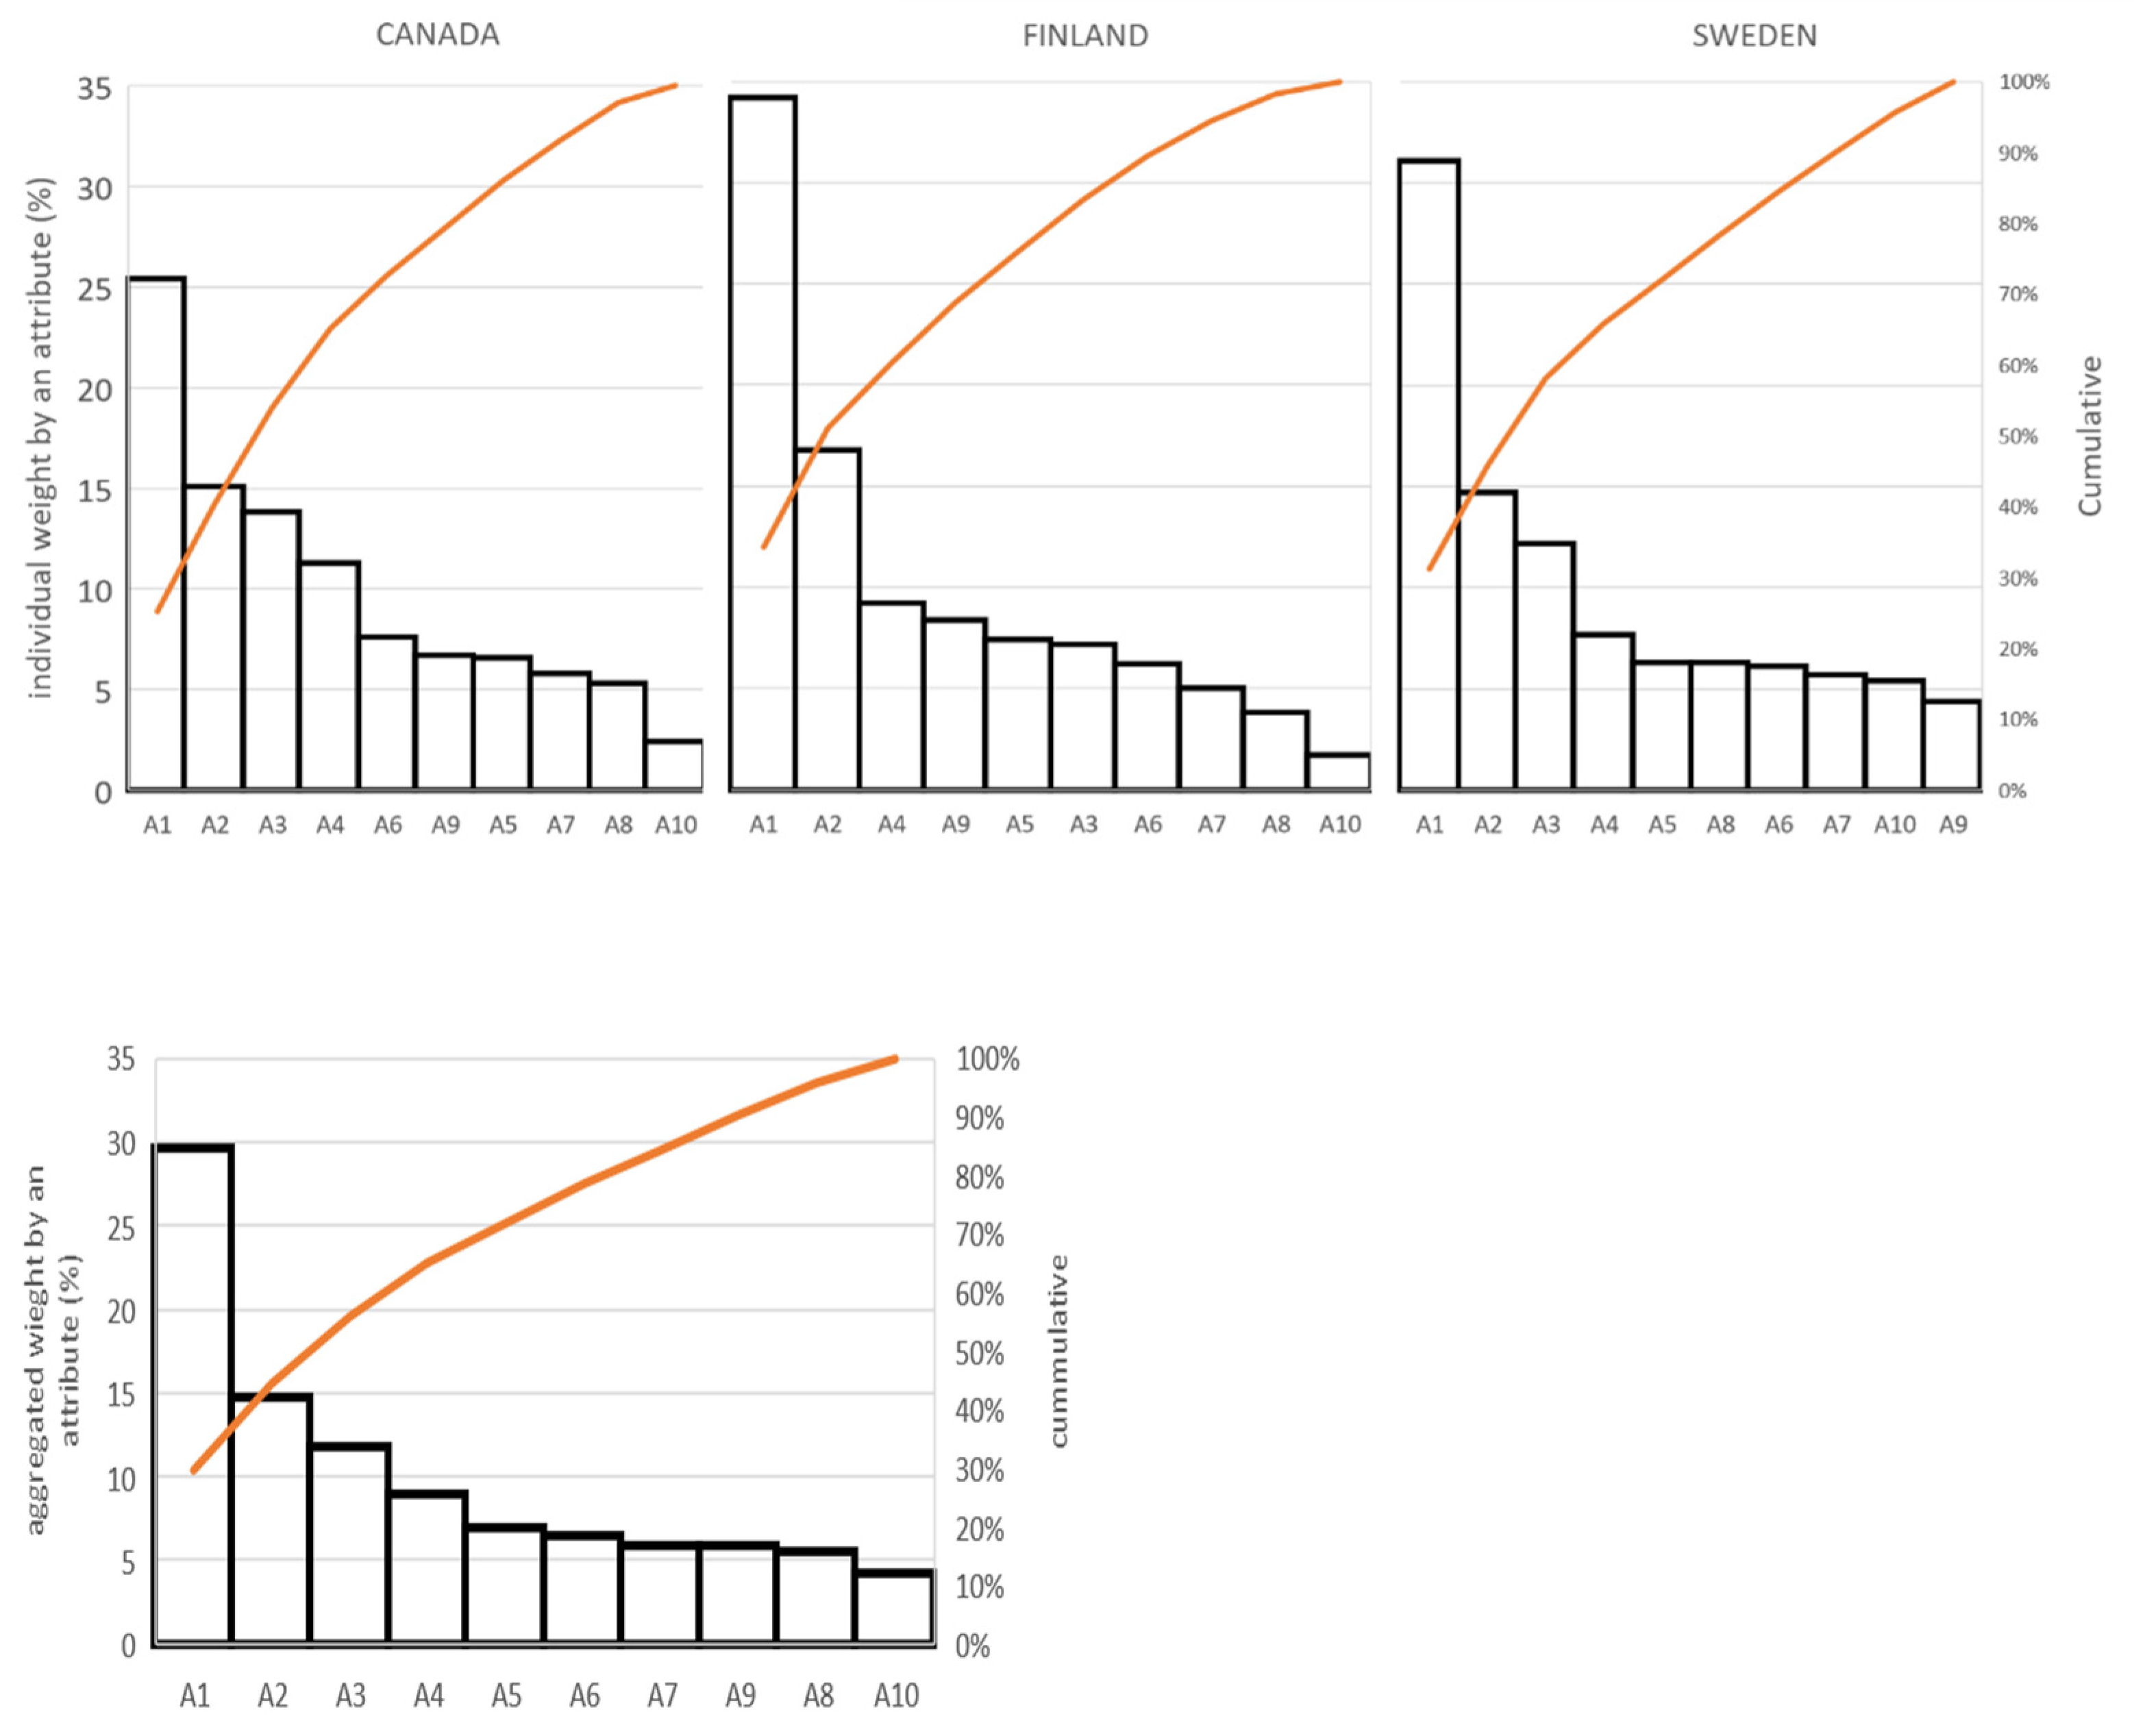
The characteristics of biomass feedstocks are key factors that affect the decision-making process along the supply chain. This study analyzed the preferred biomass feedstock characteristics of professionals from a variety of bioenergy facilities. Four countries with significant bioenergy developments were included, representing a well-established bioenergy sector covering a wide range of conditions and technologies. Canada has some of the largest areas of forested land, with solid biofuels representing about 133 TWh, and it was the second-largest exporter of wood pellets in 2017, representing 11.9% of total global exports [31]. Despite their smaller land areas, Finland and Sweden are pioneers in the use of advanced wood biofuels. In both these countries, bioenergy has become the largest energy source, surpassing oil, and wood fuels represent around 100 TWh and 140 TWh, respectively [32,33]. They are world leaders in the use of solid biomass, with the highest per capita energy use [34], and provide important regional biohubs in pellet production and consumption [35]. In Australia, solid biofuels contribute 50 TWh to the country’s energy supply, which, compared with its area of forested land, indicates a large potential to increase over the next few years [36].
The respondents represented a wide range of bioenergy facilities, including the most common biomass conversion technologies at the market level. For this type of study, the representativity and reliability of the results are linked to the selection and relevance of the respondents involved. The pool of potential respondents was chosen to include senior and experienced decision makers who could provide qualified assessments. However, as in any study based on surveys, there were obvious challenges and limitations: despite targeting a large data set of professionals, the response rate was lower than expected. The study was carried out during the coronavirus pandemic, when, globally, much work was carried out from home and access to field studies at industry sites was largely restricted. One of the most accessible methods for continuing research during the pandemic was carrying out surveys; but, for the potential respondents, fatigue arising from receiving multiple surveys from different research groups and adapting to different work environments might have affected the response rate. However, even though there was only one response each from larger biorefineries using pulpwood and their by-products for biofuel and biomaterial production, the survey reached a wide and representative range of small to big heat and CHP plants as well integrated combustion plants with gasification, pyrolysis, and pelletizing (Table 2), providing sufficient empirical data for a better understanding of the mechanisms of biorefinery and integrated processes that can affect feedstock demand and its preferred properties.
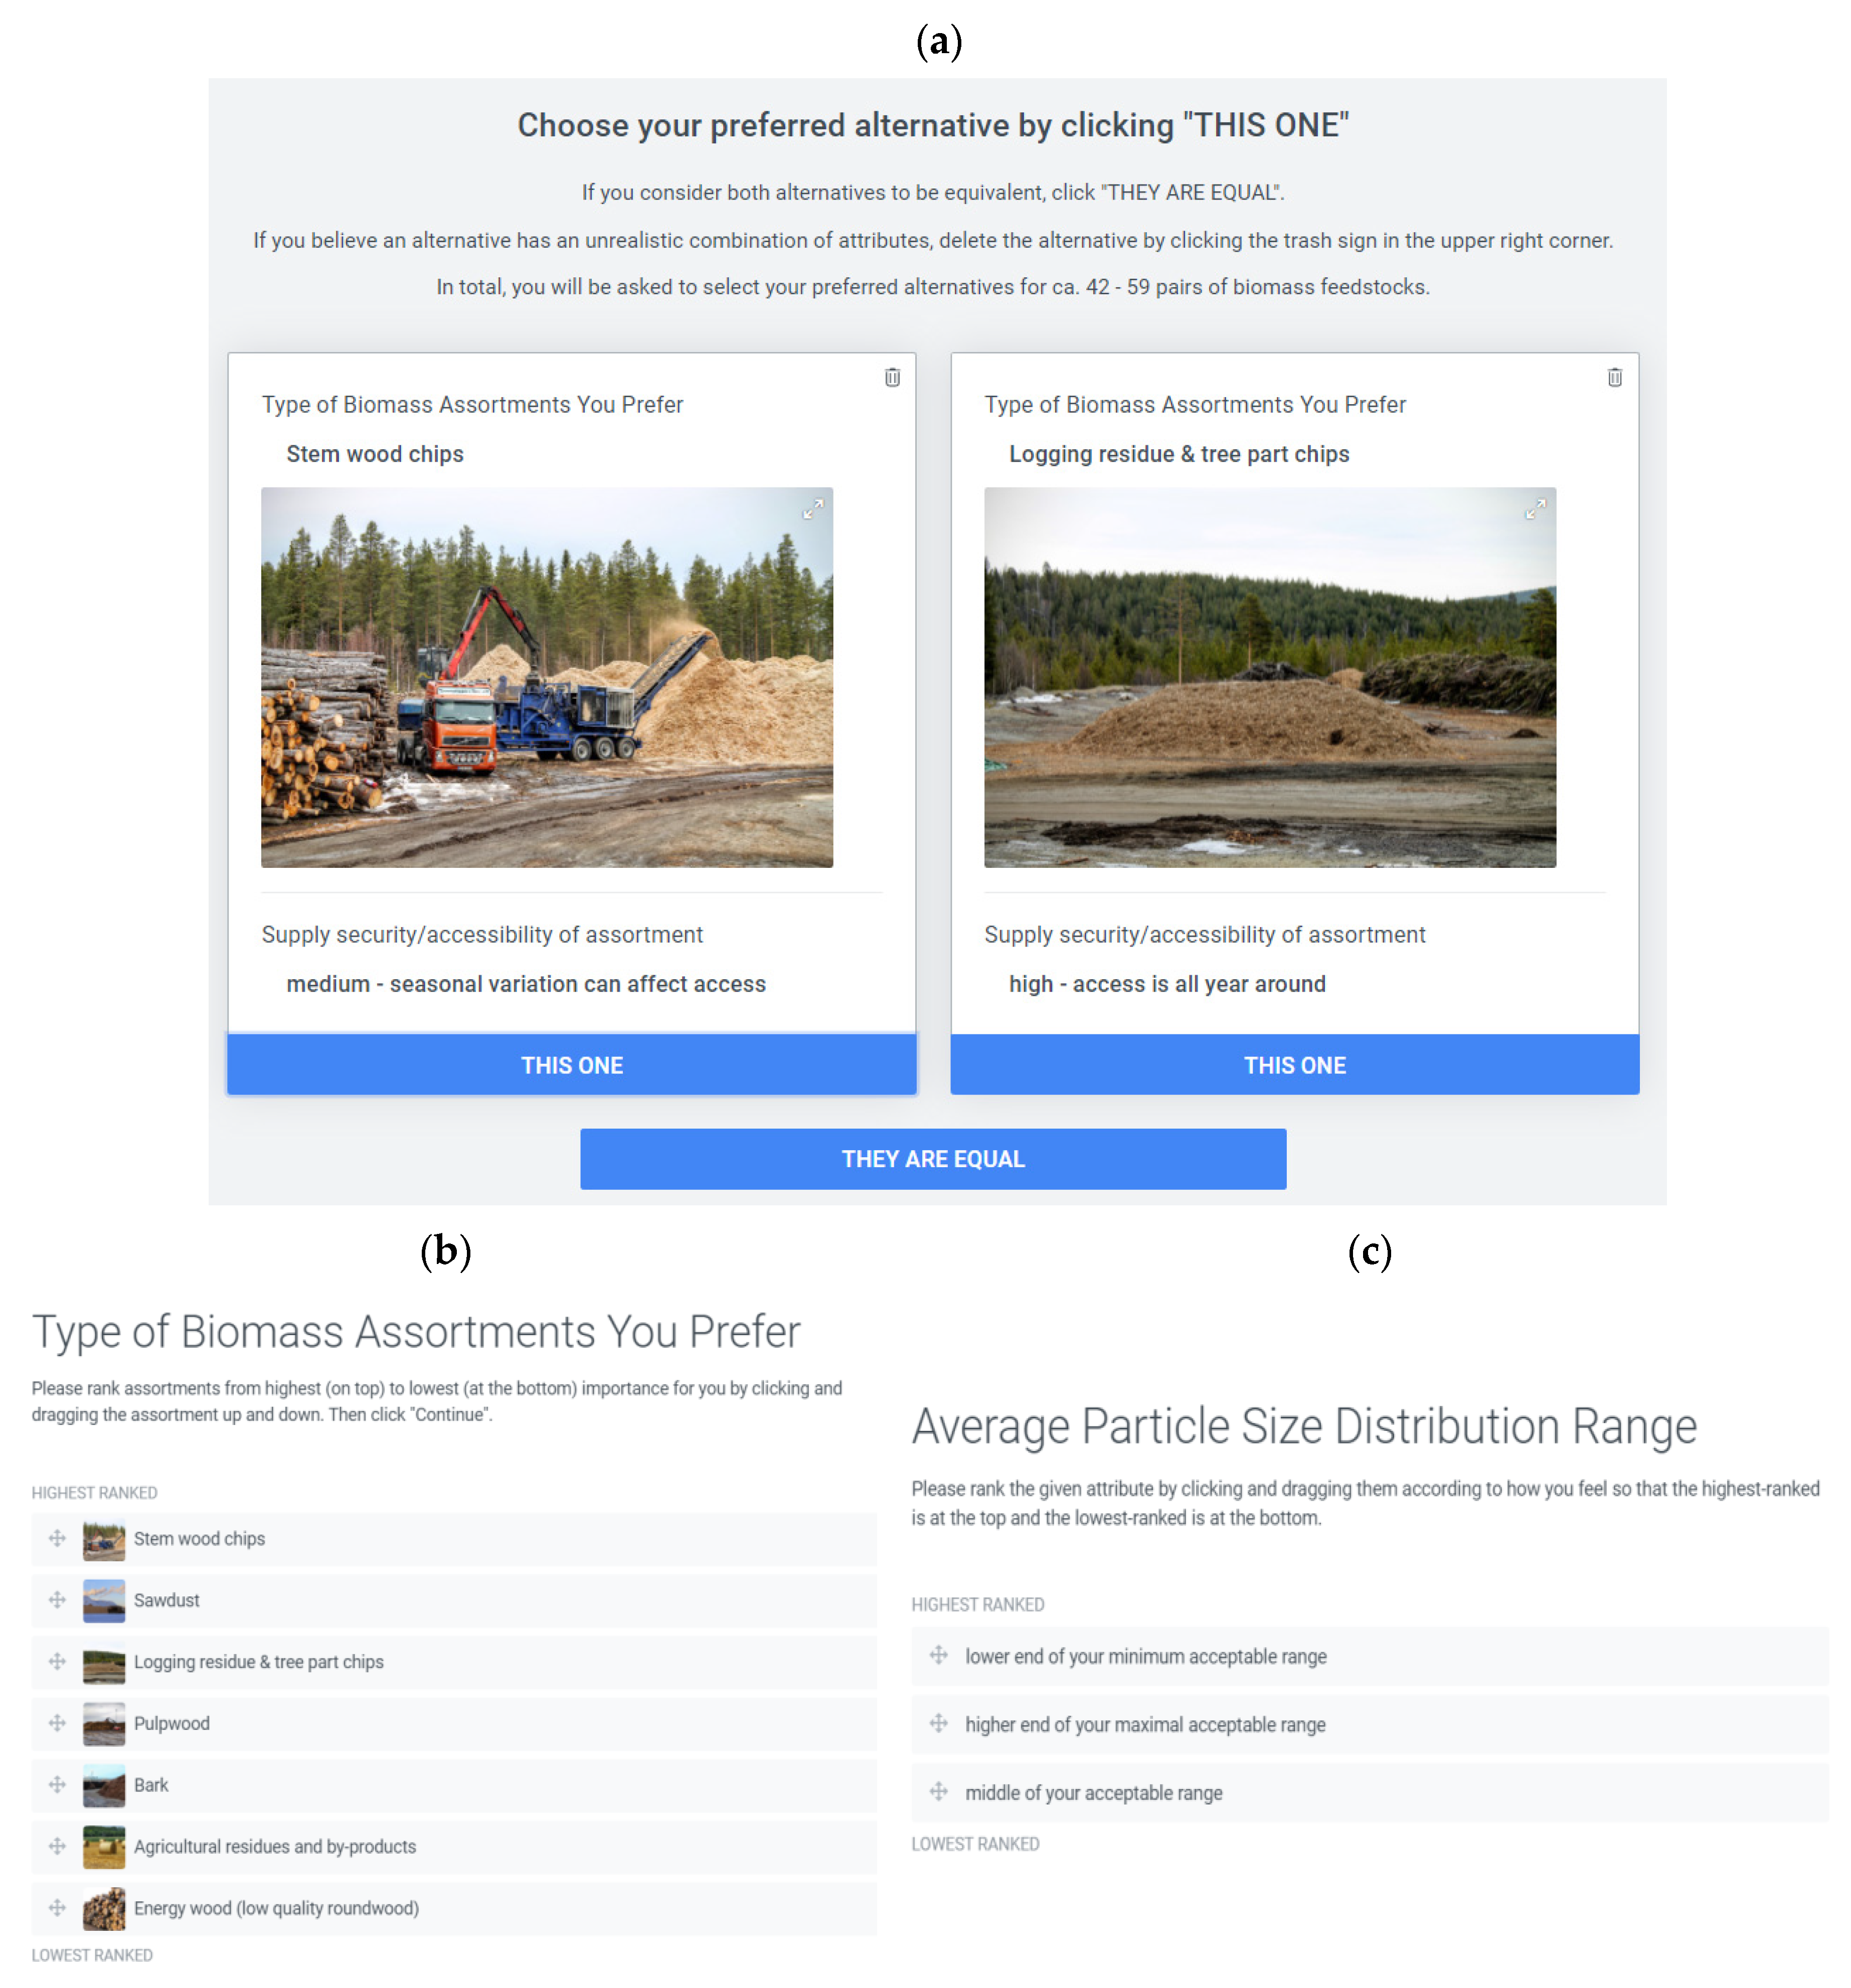
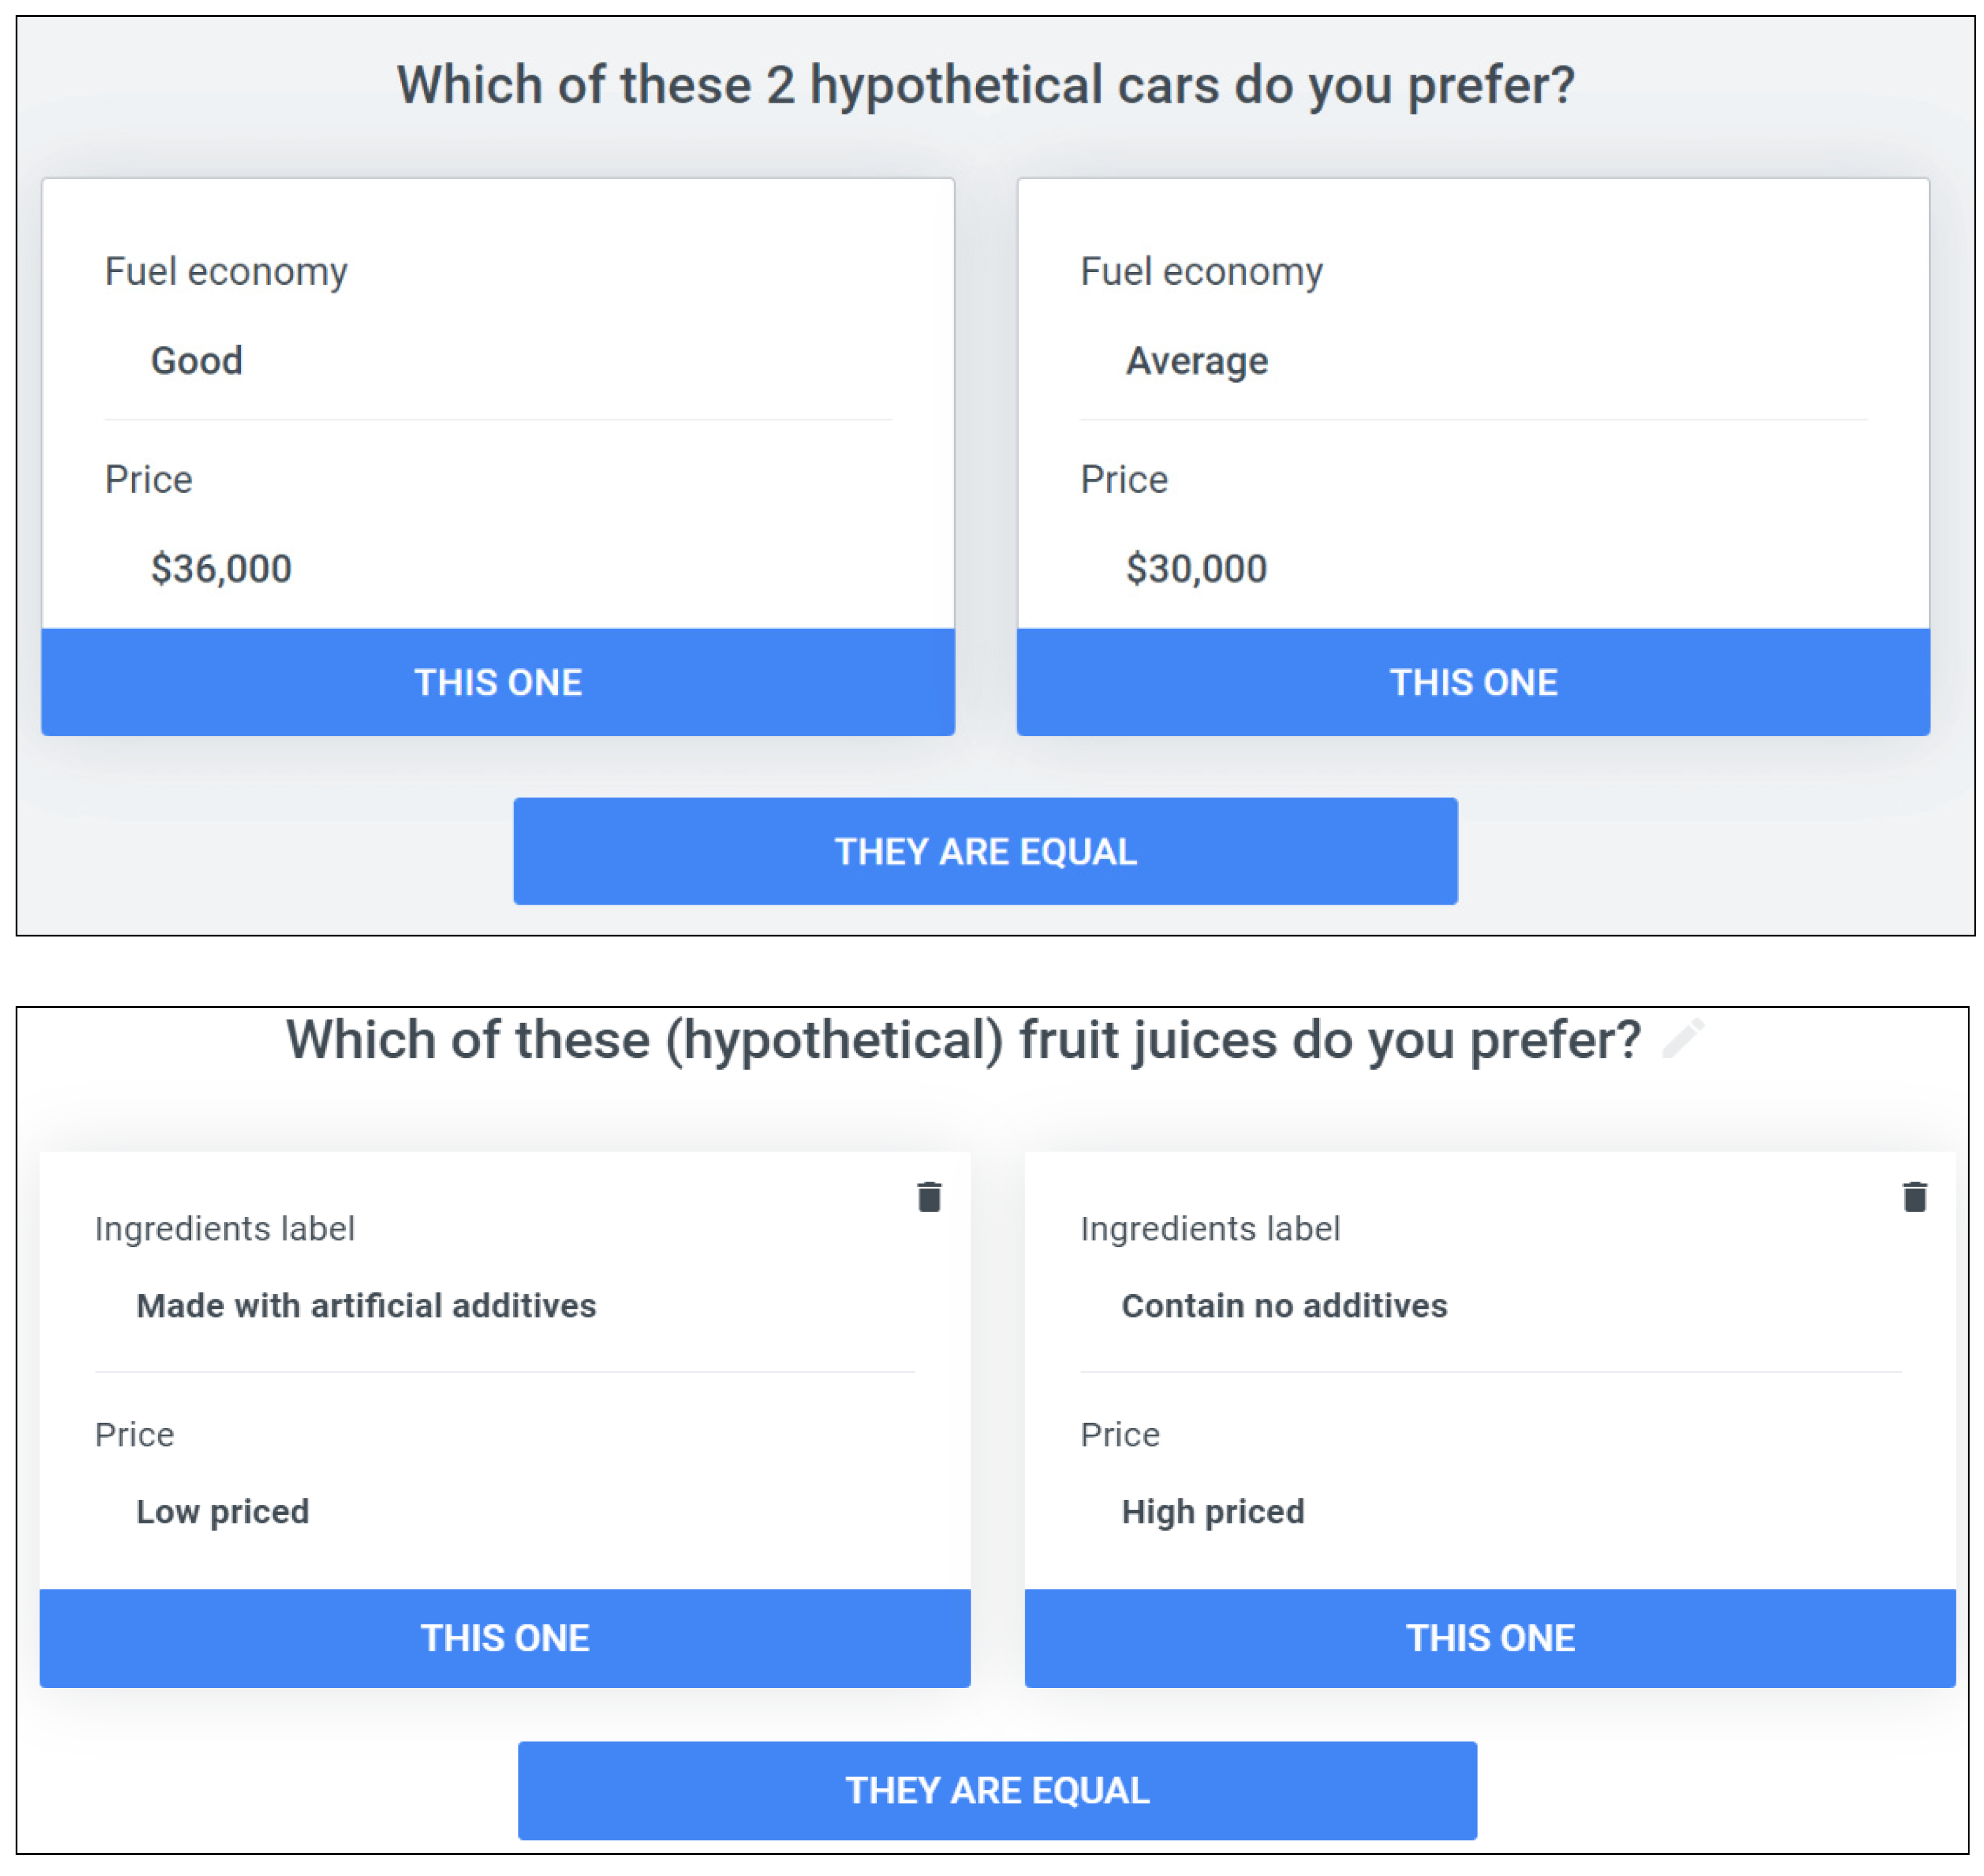
The analysis of expert preferences is a complex task, often carried out using pairwise comparison, which was the approach taken here. Conjoint analysis has been used for choice modeling and discrete choice experiments and is widely used in the social sciences for marketing research and designing new products. The advantage of choice-based methods is that choosing, unlike scaling, is a natural task, of which we all have considerable experience; it is also both observable and verifiable [37]. The main premise is that the decision maker evaluates the overall desirability of a complex product based on a function of the value of its separate yet conjoined parts [30]. In this study, the use of attributes and levels to characterize biomass feedstocks and then to rank the main preferences was a simple and clear approach that facilitated a categorization of the heuristics used by the end-users when evaluating feedstock alternatives and making their choices [30].
Based on work proposed initially by mathematical psychologists [38] Green and Rao, [39] applied the notion of conjoint measurement to discover which product attributes are more important to consumers. The same approach has been used in the forest sector, for example, for the definition of policy instruments [40], forest contracts [41], forest conservation programs [42], initiatives to foster investments in the forest sector [43], and forest machine manufacturing [44]. There are alternative methods for addressing similar research questions based on similar data sets. For example, the Analytical Hierarchy Process (AHP) was combined with the Technique for Order of Preference by Similarity to Ideal Solution (TOPSIS) in a study of the characteristics of biomass for gasification [45]. However, conjoint analysis has several advantages that justify its use: the overall questions are less demanding because the respondents do not need to produce complex preference assessments and they are not presented with a long list of pairwise comparisons [46]. Questions are repeated with different pairs of hypothetical alternatives, all involving different combinations of attributes, until enough information about the preferences has been collected to weight the attributes accordingly. In addition, the PAPRIKA method can be described as an ‘adaptive’ conjoint analysis because each time a choice is made it formulates the next question based on the previous choices, facilitating an interaction with the respondent. In contrast to the AHP methods, the number of pairs to be explicitly ranked is minimized by identifying and eliminating all those pairs implicitly ranked as corollaries of the explicitly ranked pairs via the transitive property of additive value models [28]. This allows more complex sets of attributes and levels to be considered that would otherwise result in exponential numbers of pairwise comparisons [44]. The responses can then be subjected to mathematical analyses based on linear programming (see [28]) to calculate ’part-worth utilities’, weighting the relative importance of the attributes and providing a solid methodological basis for further analysis.
Expert-based analyses do not need a large number of responses because they are not based on frequentist methods. A qualified assessment can represent the common practices carried out across a large facility, and our number of respondents is in accordance with similar studies. For example, Kulišić et al. [47,48] had 35 and 41 respondents when assessing biofuel policy preferences in Croatia and the BIOEAST region, respectively. Fernandez-Tirado et al. [49] had 12 respondents when analyzing biodiesel alternatives in Spain, and Schillo et al. [50] had 33 respondents when analyzing biofuels policies in Canada. Previous studies have also addressed the issue of representivity and the number of responses needed to perform these types of assessments, highlighting expertise as the most important factor to take into account. Even a single expert may suffice as a basis for analysis, and efforts to add additional experts can, in fact, compromise the accuracy of a study if their expertise is not well balanced [51]. In this sense, the number of experts involved is in line with similar studies and provides a valid basis for analysis, provided the due caution.
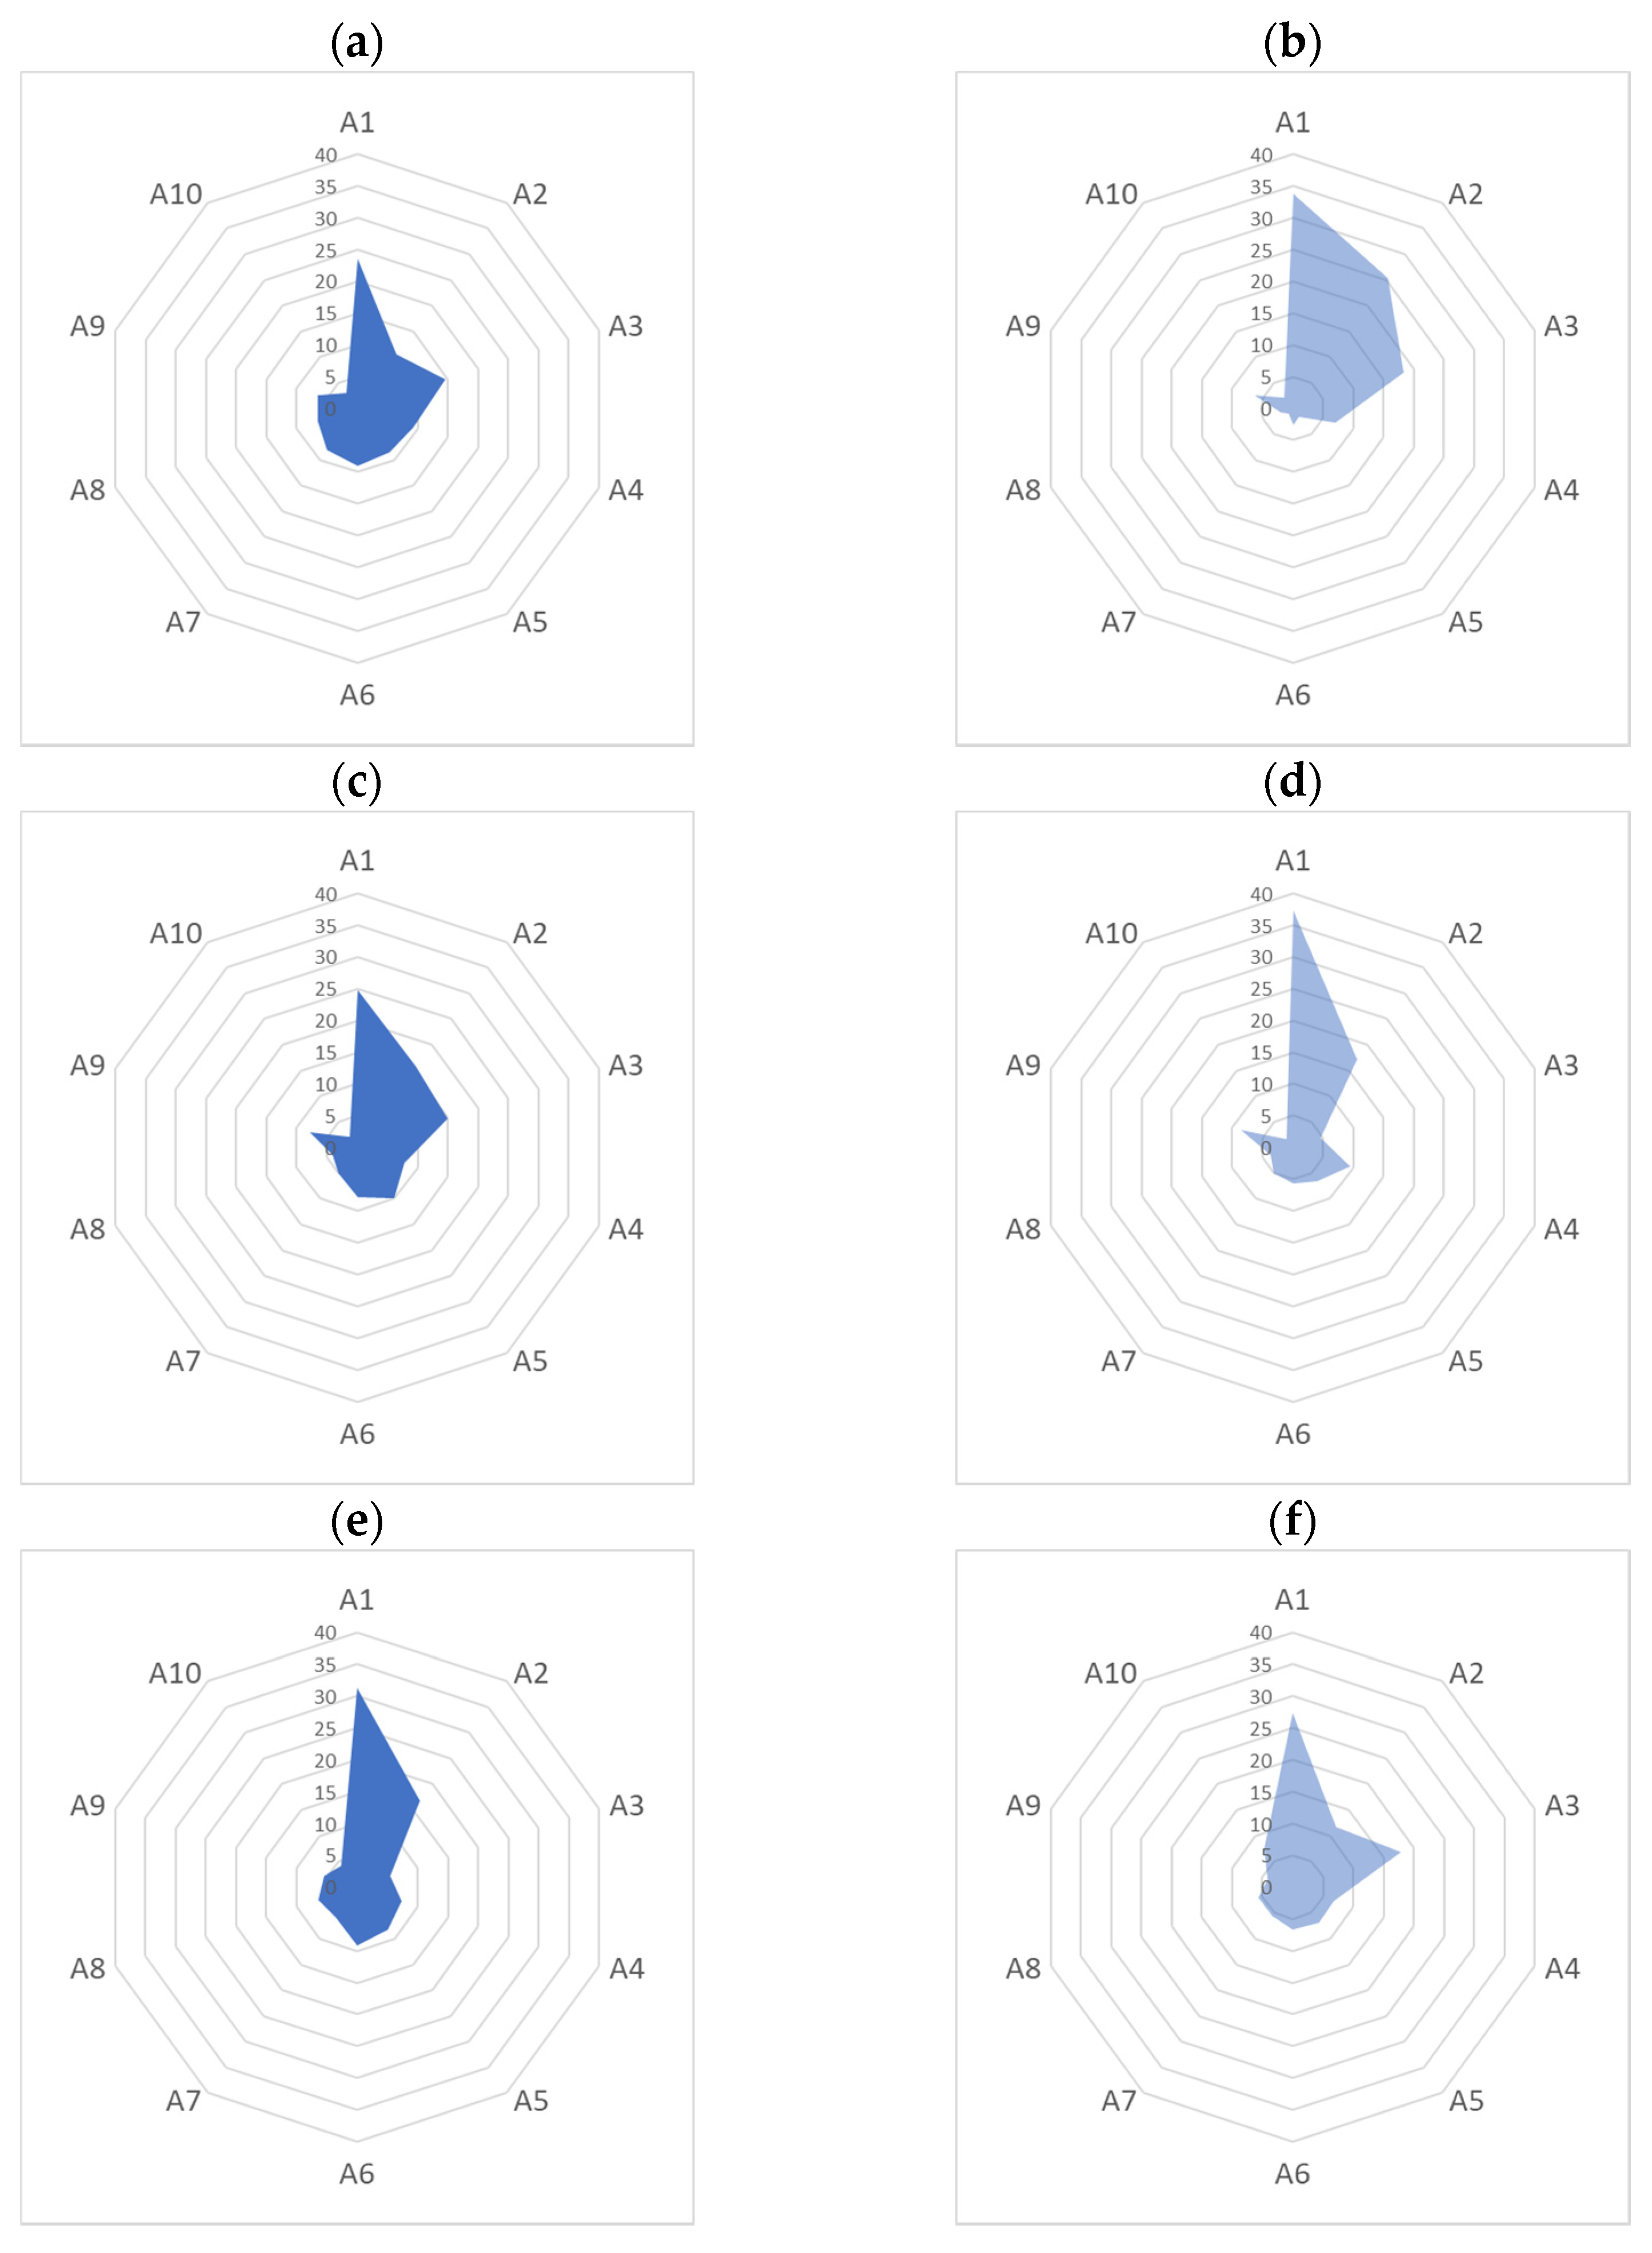
The results revealed a wide range in the relative importance placed on biomass assortment attributes, suggesting that each biomass supplier has to look after specific end-user needs, with some concentrating on a single assortment and others considering a larger variety. The broader the accepted assortment is, the greater is the possibility for mixing and matching different biomass sources to deliver an optimal feedstock to the end-user with effects in the procurement and operational costs for logistics operators [52]. The availability of specific raw material assortments for particular industrial processes depends largely on the geographic location of the facility itself, the predictability of feedstock accessibility, and the surrounding wood-based industrial facilities capable of supplying certain biomass by-products, e.g., bark, sawdust, or shavings [5], as well as the industrial process applied, such as combustion, gasification, pyrolysis, etc. Depending on the industrial process and the location of the facility, some of the biomass assortments may have to be upgraded to improve their quality and bulk density or/and their supply streams may need to be divided into more precise assortments to optimize the profitability of each biomass unit by delivering the best-suited biomass for a particular industry at the best price [15,53]. Thus, not only can extra value be added to the biomass itself, but, under certain conditions, long-distance transportation from biohubs to the industrial plant can be improved with the use of railroads, waterways, or high-payload trucks, reducing traffic intensity and air and noise pollution in populated areas [10,54,55]. Biohubs and terminals are especially important to operators in terms of buffering peak congestion in response to increased logging volumes and mitigating damage as logging moves into increasingly fragile terrains. Terminals can help reduce periods of peak congestion and facilitate the transportation of raw material out of the forest under the best possible weather conditions.
While there are well-established centralized biomass measurement systems in Sweden and Finland, facilities in Australia and Canada are more open to digital measurement and delivery services. Among the countries represented, the Finnish respondents were the most reluctant to move towards electronic billing and measurements outside the receiving facilities, highlighting the importance of the type of biomass feedstock for most decision makers, particularly in Finland and Sweden. This suggests that biomass assortment standards, especially for energy production, are more established in Nordic countries and that decision makers associate many biomass properties directly with a specific assortment. In contrast, biomass suppliers in Australia and Canada can more readily negotiate biomass supply according to specific biomass requirements if they can control its quality.
In recent years, Nordics have seen the development of large forest industry terminals specializing in either industrial roundwood or biomass for energy supplies [6,8,56]. At the same time, Nordic countries have experienced an upscaling of existing forest industry facilities (mainly pulp and paper mills) with the addition of adjacent biorefinery units. This has opened up opportunities to store, modify, and upgrade the quality and bulk density of biomass at one joint biohub or terminal and to deliver several biomass assortments, such as roundwood, logging residues, bark, chips, pre-processed biomass, etc., in bulk [8,56,57,58]. The different operating environments of biomass suppliers and receivers can provide opportunities for various emerging business models for supplying renewable carbon products alongside a political consensus to reduce or eliminate fossil carbon. Business models indicate how a company can add value to a product, and circular business models can also add value to secondary biomass [59].
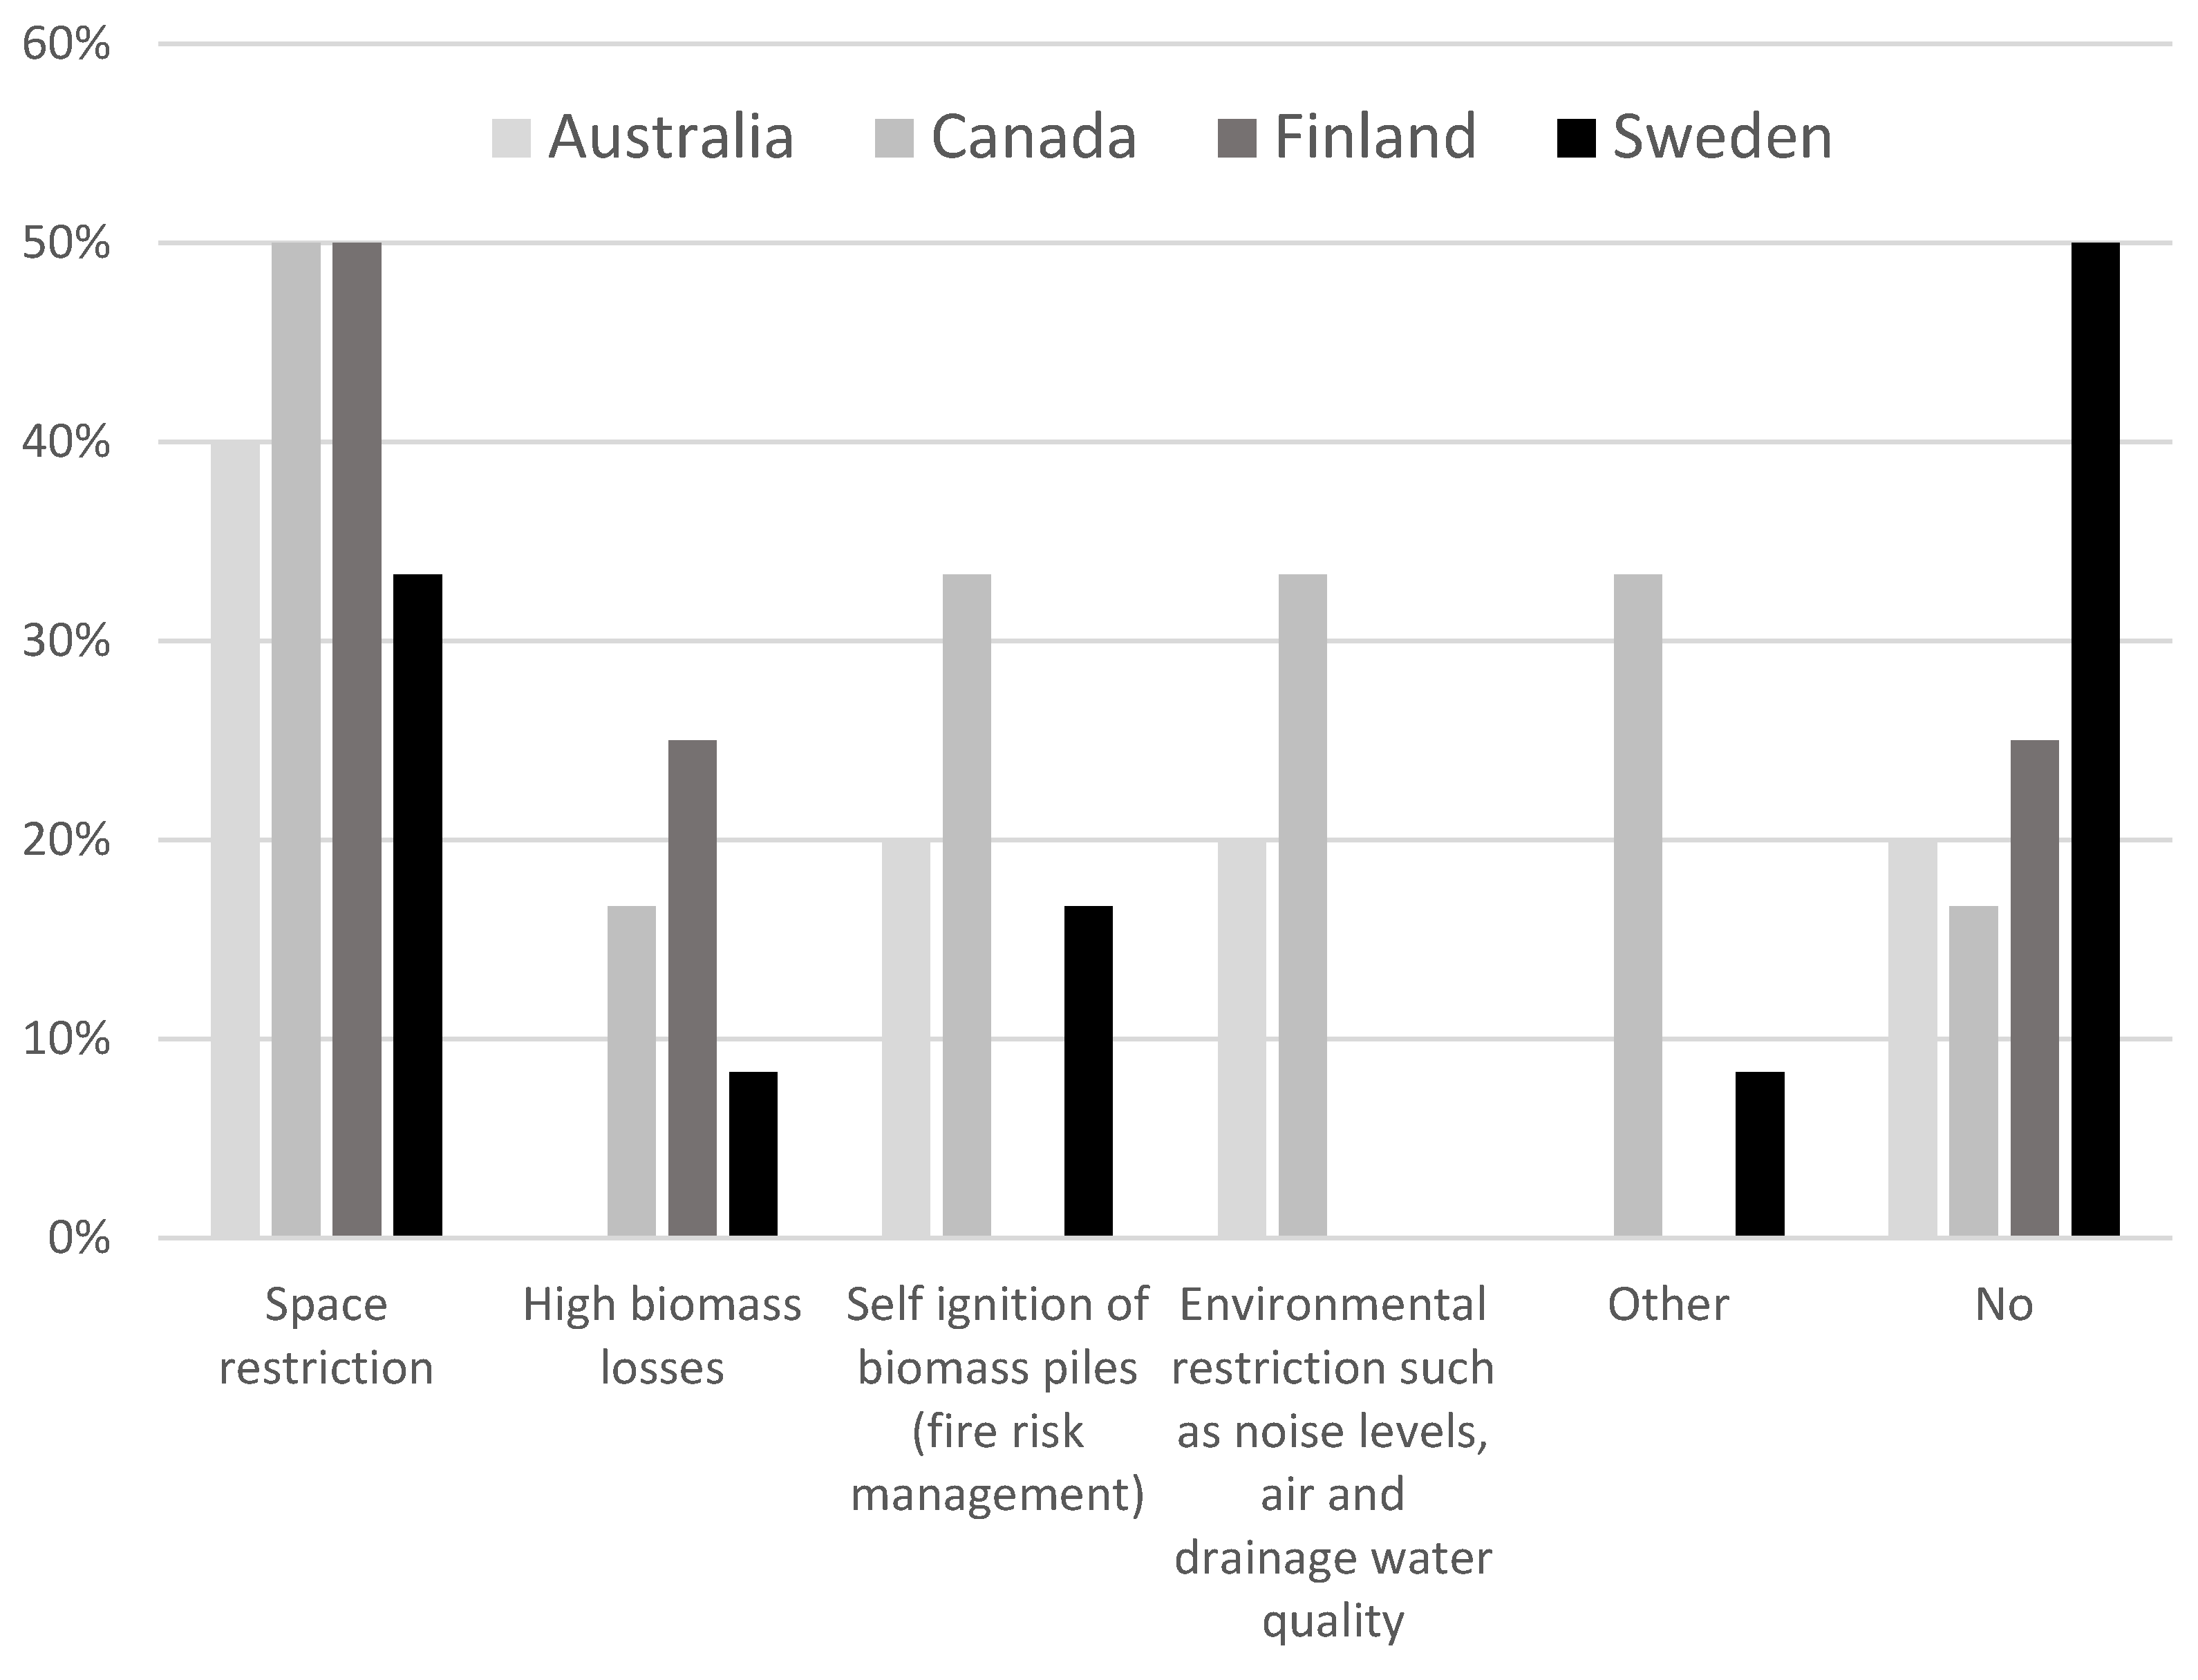
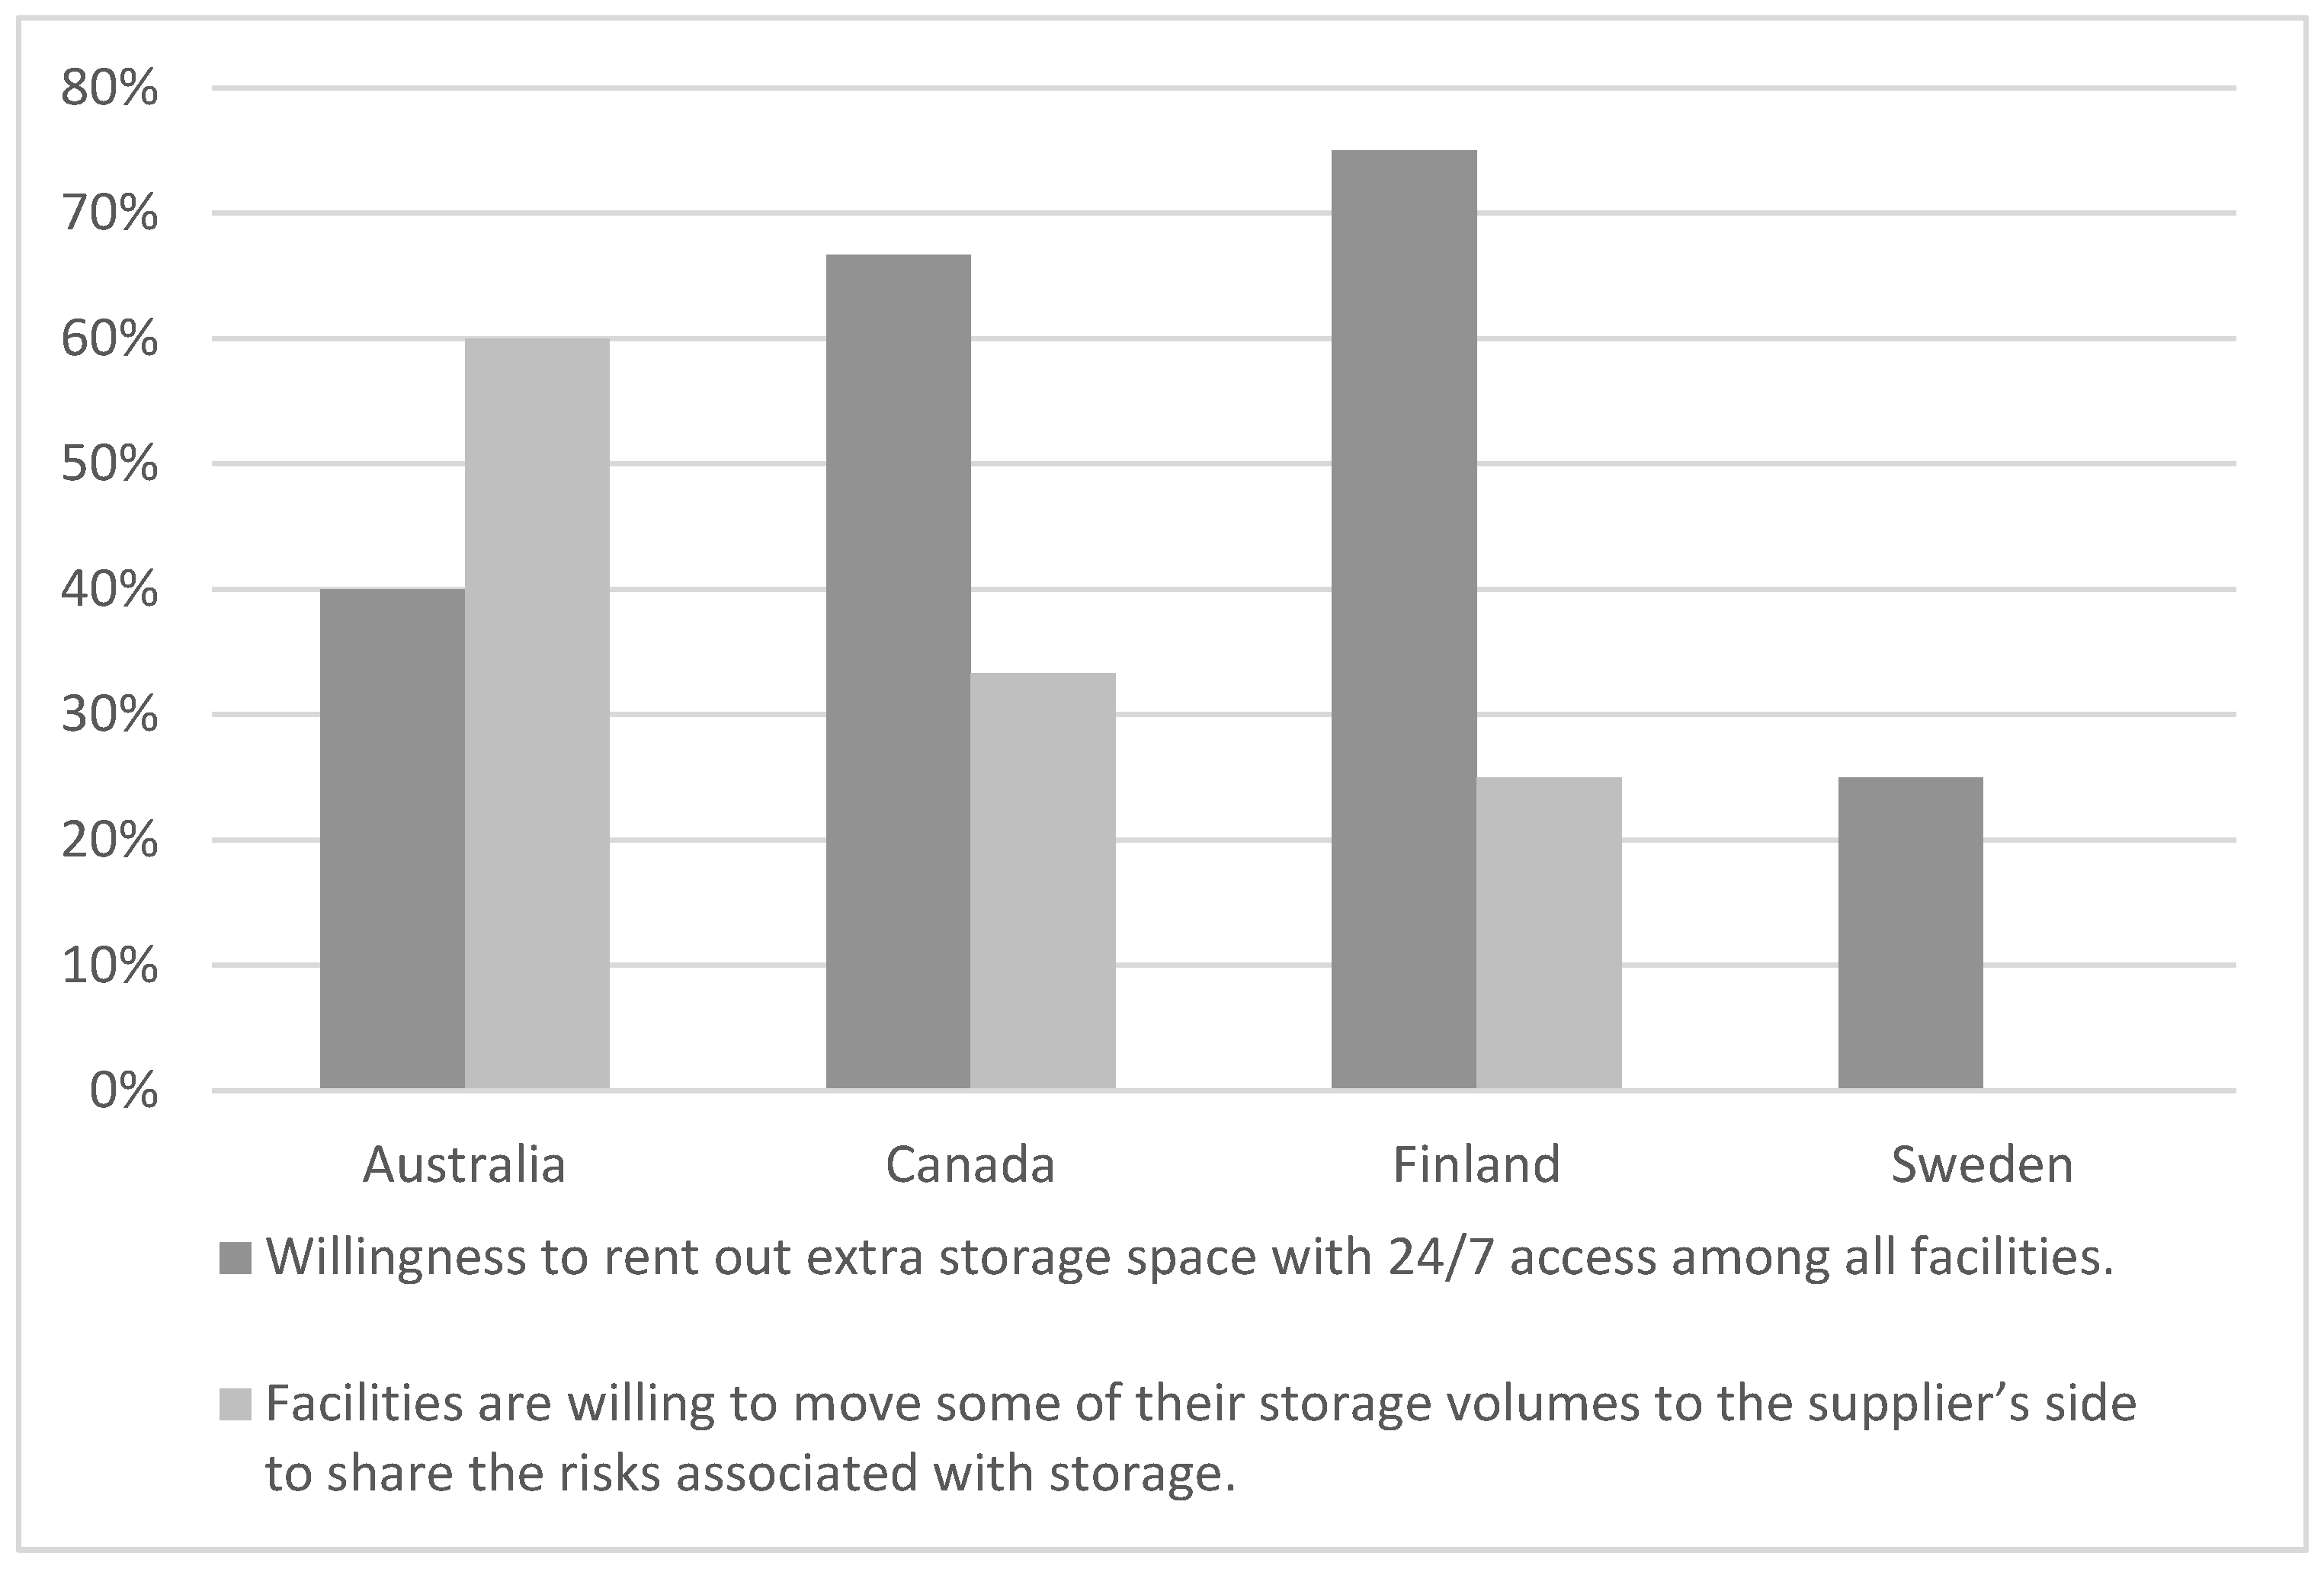
Another area offering challenges and opportunities is biomass storage and handling, especially in Australia and Canada, where decision makers are more open to sharing their knowledge and handing over some control to suppliers. More than 30% of all facilities reported limited storage capacity followed by a number of other biomass handling-related issues, such as biomass loss as a result of biological activity, self-ignition, and, especially in Australia and Canada, environmental restrictions. If possible, 25% to 75% of the facilities would like to rent out extra storage space to address this problem, but most of them are reluctant to hand full responsibility for the stock over to the supplier.
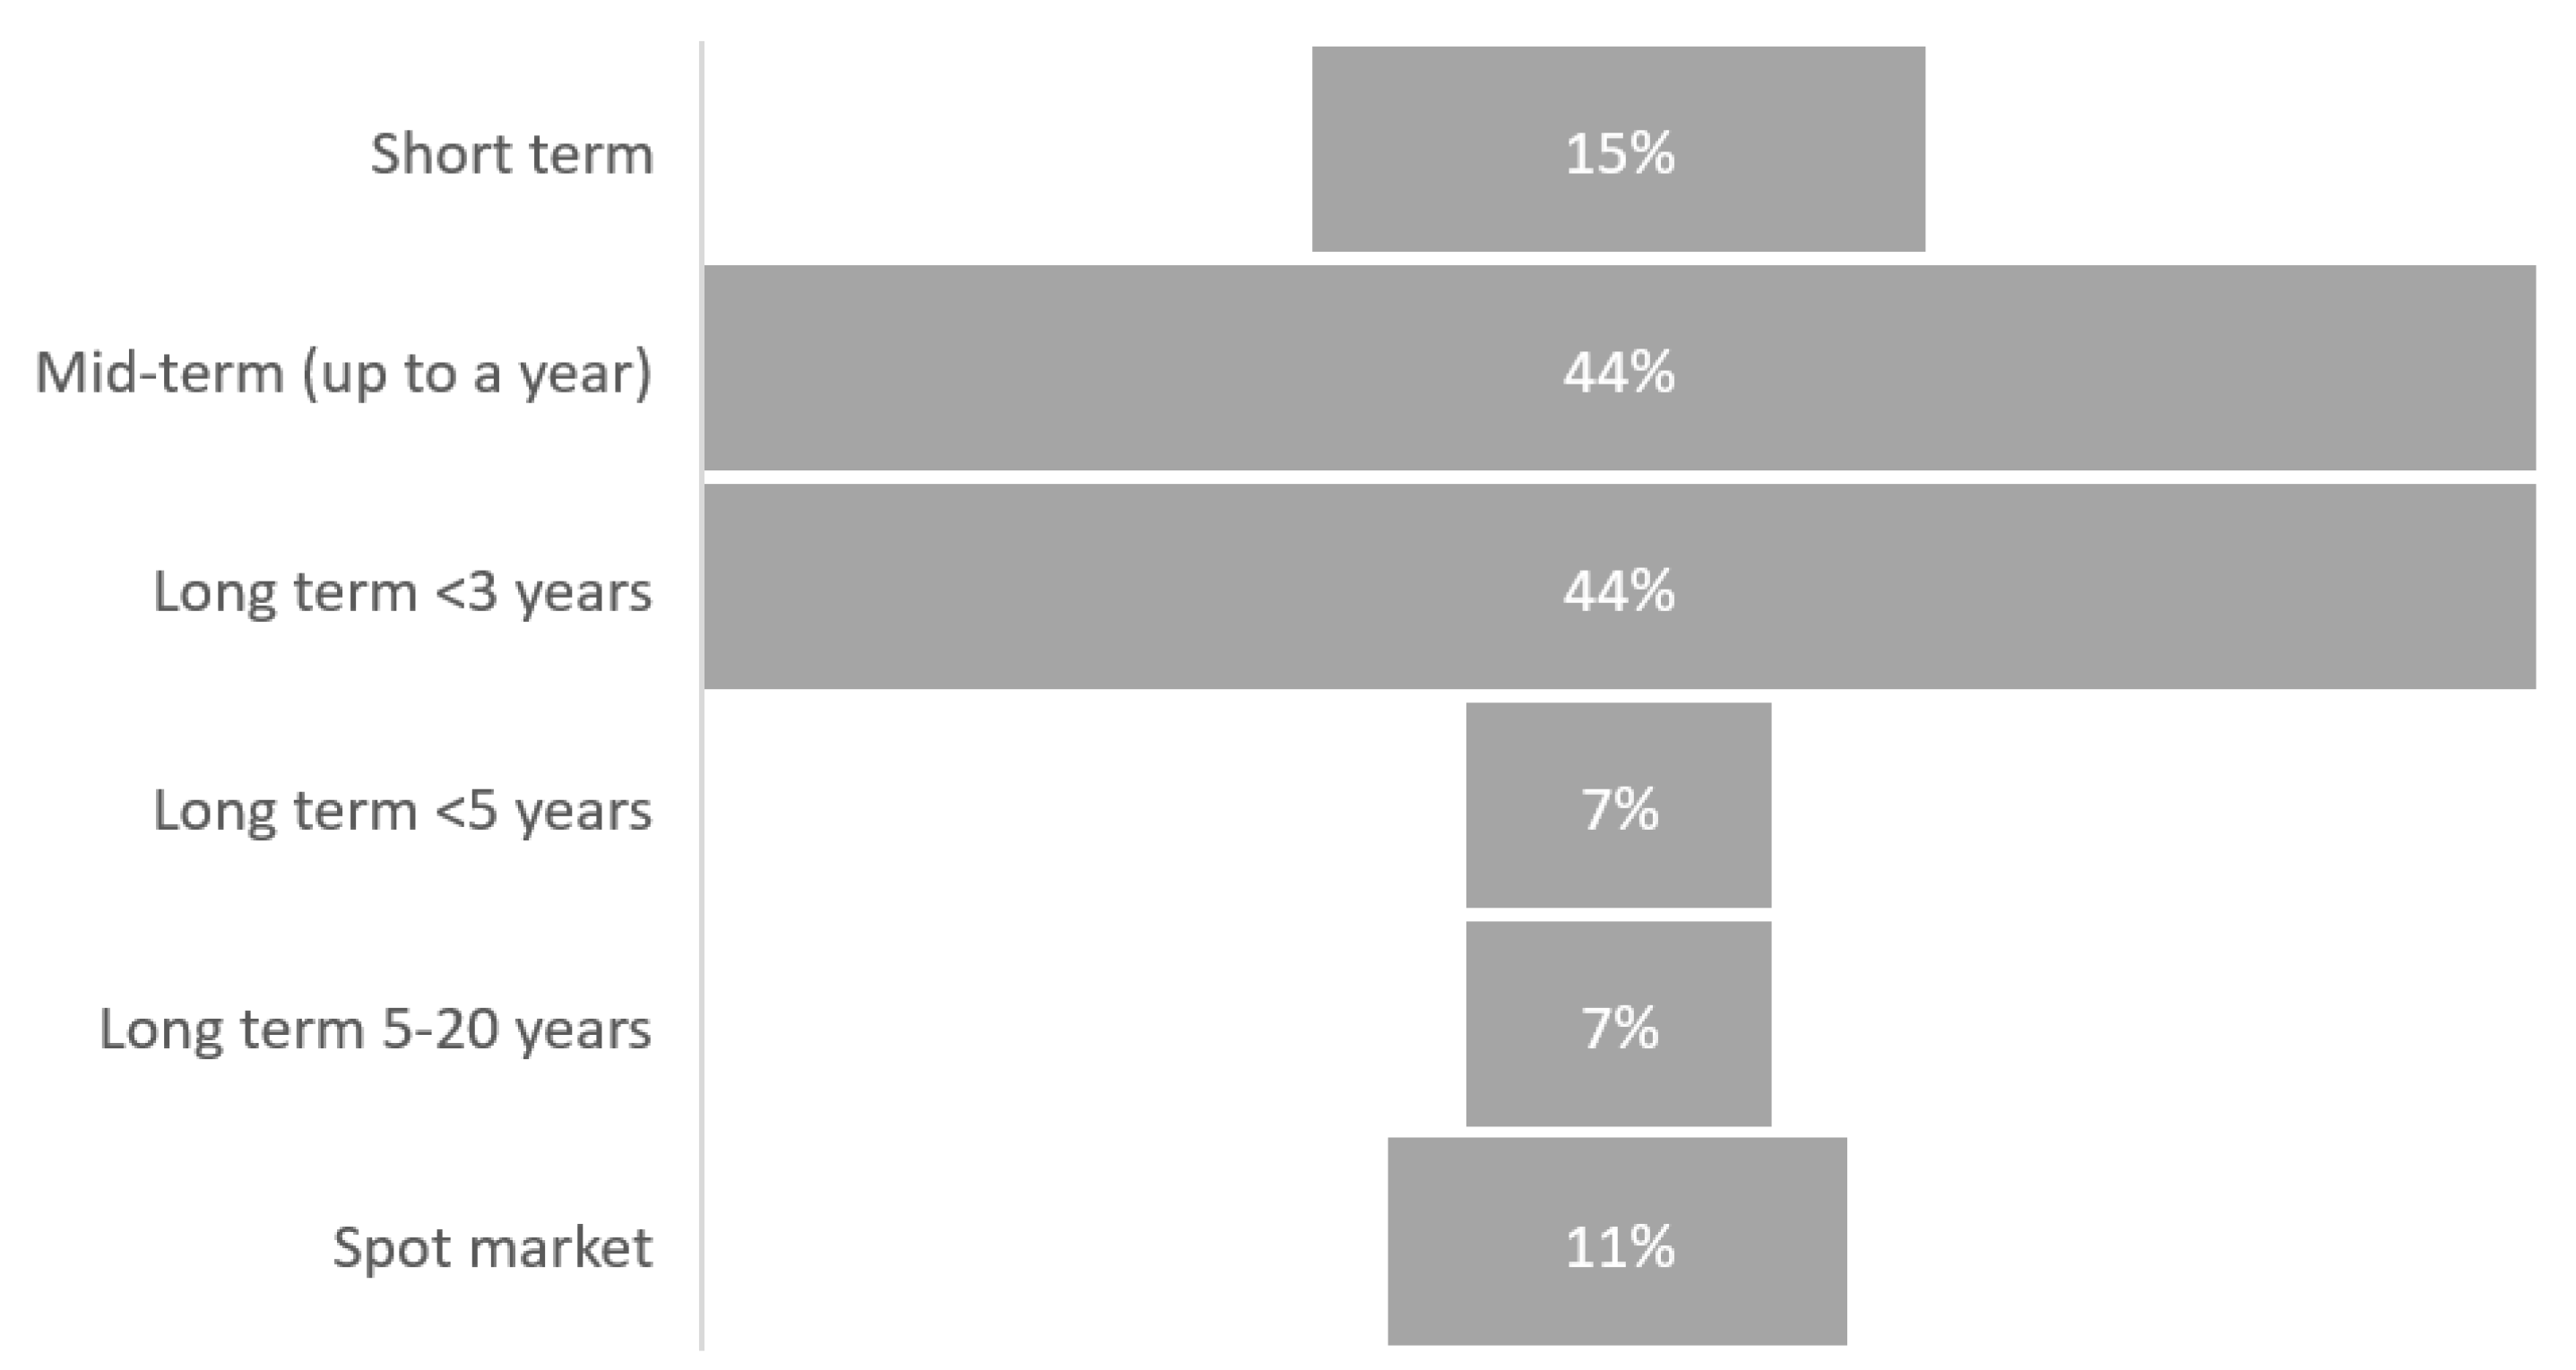
Biomass handling at suppliers’ terminals, with trusted load measurements, is an interesting area for the development of biohubs, especially in Australia and Canada, where decision makers are much more interested in sharing knowledge and risks with suppliers and are more open to digital payment and measurement services. In combination with smaller combustion and gasification facilities, there is a niche for expert biomass suppliers and smaller, more diversified biohubs. Procurement contract periods are also more diverse in Canada and Australia, where, in addition to shorter-term and mid-term contracts (up to 1 year), decision makers also show a preference for long- and very-long-term supply contracts (of up to 20 years). In contrast, facilities in Sweden and Finland mostly prefer 1-year or up to 3-year contract periods, while facilities during their start-up period and with integrated biorefineries such as gasification and pyrolysis prefer to have longer biomass supply contracts than bigger, well-established facilities. However, because of the relatively low number of responses for each country and technology used, caution must be used when generalizing the results presented here.
Finally, while there was consistent agreement among the respondents regarding many attributes such as low ash, moisture content, and particle size variation, as well as high biomass availability and supply security at a low price, there were a few other factors some respondents took into account. For example, four respondents for mid-sized combustion plants, including one with a pelletizing facility and pellet plant and a small combustion plant in Canada, preferred ash content to be at its maximum acceptable level for their processes, even though it was considered to be the least important attribute. The preferred moisture content level and particle size range also showed a wide range of preferences among facilities, conditioning the options for wood size reduction [60]. Even among the pellet factories in Sweden and Canada, one might prefer a higher moisture content while another might prefer a medium content, suggesting that some facilities also took in by-products such as bark for their drying processes, etc. Lower grades of biomass can, in fact, be used to help control the main product operations’ processes [61].
In the long run, the preferences of end-users will be subject to changes in the overall development of the sector and will have an influence on the associated supply chains. Trends already show greater competition for high-quality, homogenous, and consistent biomass, such as debarked roundwood, sawdust, and shavings, and developments on chipping processes and planning as well as additional sieving of comminuted material could help keep the competitive profile of primary residues [62,63,64,65]. These sieved, sorted, and, if needed, mixed biomass assortments could be delivered to the right end-user, at the right time and location, via biomass terminals or biohubs. In addition, biorefining processes could build in resilience to biomass heterogeneity and provide opportunities for traditional wood-based industries to make strategic partnerships, move from being secondary biomass suppliers, and transform into a biohub that is able to separate, upgrade, and optimize biomass deliveries at a central node in the supply chain (see [8,65]).

5. Conclusions

The aim of this study was to examine the decision-making processes used by end-users for biomass procurement. The results show that end-users have a good understanding of the general attributes of pre-defined forest biomass assortments, such as roundwood logs, bark, or logging residues; however, the specific properties of a particular biomass assortment, such as variation in ash content, are less well understood in the context of daily production activities.
Pre-defined biomass assortments have an expected and well-understood range of biomass properties and, from an end-user’s perspective, are the most important factor when deciding on feedstock procurment for a bioenergy facility. The results presented here help us better understand end-users’ perceptions of biomass properties for their conversion processes and supply preferences and should help existing and future biohubs create new niches in alternative business environments and position themselves for effective product development.

Author Contributions

Conceptualization, K.K.; methodology, K.K. and B.B.; software, K.K. and B.B.; validation, K.K. and B.B.; formal analysis, K.K. and B.B.; investigation, K.K. and B.B.; resources, all coauthors; data curation, K.K. and B.B.; writing—original draft preparation, K.K., B.B. and B.M.-Y.; writing—review and editing, all coauthors; visualization, K.K., B.B., B.K. and B.M.-Y.; supervision, none; project administration, D.B.; funding acquisition, D.B. All authors have read and agreed to the published version of the manuscript.

Funding

The authors gratefully acknowledge financial support from the “BioHub” project co-funded by the IEA Bioenergy Task 43 (Sustainable biomass supply integration for bioenergy within the broader bioeconomy), the project Bio4EmiCon, Bioenergy supply chain solutions and climate policy actions for emission control, funded by the Natural Resources Institute Finland (Luke), and the SNS project SYNERGIES.

Institutional Review Board Statement

Not applicable.

Informed Consent Statement

Not applicable.

Data Availability Statement

Not applicable.

Acknowledgments

The authors would like to thank the biomass and IEA Task 43 experts for valuable comments and their contribution to the study and Paul Hansen, the co-creator of 1000minds software for his generous contribution concerning software.

Conflicts of Interest

The authors declare no conflict of interest.

Appendix A

Figure A1. Examples of the layout and question formats included in the survey. Sets of alternative responses were presented to the participants, in pairwise format (a) or to be ranked (b,c) according to preference.
Energies 15 03721 g0a1
Table A1. Country of origin, biomass conversion technology, and facility capacity, as represented by the respondents to the preference survey (n = 20).
Respondent CodeCountryBioenergy Facility
DM1CanadaCombustion ≤ 5 MW
DM2SwedenCombustion ≤ 5 MW
DM3CanadaPelletizing, Torrefaction
DM4SwedenPelletizing
DM5SwedenCombustion > 50 MW
DM6SwedenCombustion 6–20 MW
DM7SwedenCombustion 6–20 MW
DM8SwedenCombustion ≤ 5 MW
DM9CanadaCombustion ≤ 5 MW
DM10CanadaCombustion ≤ 5 MW
DM11SwedenPelletizing
DM12AustraliaHydrothermal Liquefaction
DM13SwedenPelletizing, Combustion 21–50 MW
DM14SwedenCombustion 21–50 MW
DM15CanadaCombustion ≤ 5 MW
DM16CanadaPelletizing, Lignin extraction, Sugar extraction to produce ethanol
DM17FinlandCombustion > 50 MW
DM18FinlandCombustion ≤ 5 MW
DM19FinlandCombustion > 50 MW, Biorefinery
DM20FinlandCombustion > 50 MW
Table A2. Weighting of attributes by respondent, country, and group, presented as a % of all attributes. For definitions of the attributes, see Table 1.
Respondent/Facility CodeA1A2A3A4A5A6A7A8A9A10
DM1-CA34.620.613.96.681.72.46.34.51
DM3-CA24.123.7623.73.46.41.13.87.50.4
DM9-CA33.16.62.914.816.37.87.62.17.41.4
DM10-CA5.78.529.814.62.214.814.85.921.7
DM15-CA216121.17.9127.91212.47.9
DM16-CA33.725.318.37.11.62.611.96.42.2
DM2-SE30.921.96.310.997.43.90.88.60.4
DM4-SE32.910.69.27.27.27.29.21.75.59.2
DM5-SE19.213.55.85.815.45.85.87.75.815.4
DM6-SE21.89.921.38.33.610.510.25.84.44.1
DM7-SE4111.526.46.51.73.70.63.42.23.1
DM8-SE31.911.84.63.67.410.87.6122.38
DM11-SE36.514.85.86.14.25.24.518.13.21.6
DM13-SE24.821.921.914.31.81.97.30.94.60.5
DM14-SE41.316.38.76.56.52.22.26.53.36.5
DM12-AU21.76.713.36.711.7511.75513.3
DM 17-FIN50.316.15.69.91.25.61.96.81.21.2
DM 18-FIN24.815.814.97.99.97.95.04.07.92.0
DM 19-FIN24.425.26.510.66.57.36.52.48.12.4
DM 20-FIN37.410.21.98.312.13.96.81.916.51.0
Canada25.415.113.811.36.67.65.85.36.72.4
Sweden31.114.712.27.76.36.15.76.34.45.4
Australia21.76.713.36.711.7511.75513.3
Finland34.216.87.29.27.46.25.03.88.41.7
Group29.614.811.89.06.96.55.95.55.94.2
Table A3. Ranking of attributes, by respondent, country, and group. For definitions of the attributes, see Table 1.
Respondent/Facility CodeA1A2A3A4A5A6A7A8A9A10
DM1-CA12354986710
DM3-CA12–362–38597410
DM9-CA17832459610
DM10-CA751482–32–36910
DM15-CA193–51063–563–526
DM16-CA12349610857
DM2-SE12734689510
DM4-SE123–56–86–86–83–51093–5
DM5-SE146–106–102–36–106–10562–3
DM6-SE15261034789
DM7-SE13249510687
DM8-SE13897462105
DM11-SE13548672910
DM13-SE12–32–348759610
DM14-SE1234–74–7994–784–7
DM12-AU16–72–36–74–58–104–58–108–102–3
DM 17-FIN125–638–105–6748–108–10
DM 18-FIN1235–745–7895–710
DM 19-FIN216–836–856–89–1049–10
DM 20-FIN14853768210
Canada12347589610
Sweden12345785109
Australia16–72–36–74–58–104–58–108–102–3
Finland12635789410
Group1234567–897–810
Table A4. Weighting of attribute level by respondent, presented as a %. DM1–10, respondent code. For definitions of attributes and levels, see Table 1.
AttributeAttribute LevelDM1DM2DM3DM4DM5DM6DM7DM8DM9DM10
A1L100.100000003.3
L229.218.324.05.511.55.416.325.511.41.8
L311.32.46.411.016.010.841.016.116.70
L434.88.62.116.419.217.729.86.533.14.5
L533.430.916.721.97.121.531.531.916.52.5
L634.6023.727.412.621.826.720.021.70.9
L720.90.424.132.913.521.835.812.216.65.7
A2L10000000000
L26.65.97.91.45.81.92.01.02.35.6
L312.514.815.83.89.65.84.88.24.97.1
L420.621.923.710.613.59.911.511.86.68.5
A3L10000000000
L27.03.51.91.73.818.514.63.61.914.9
L313.96.36.09.25.821.326.44.62.929.8
A4L10000000000
L24.57.87.92.13.85.52.51.18.08.6
L36.610.923.77.25.88.36.53.614.814.6
A5L1000015.40001.20
L26.62.31.54.500.60.83.802.2
L38.09.03.47.211.53.61.77.416.31.3
A6L10000000000
L21.77.46.47.25.810.53.710.87.814.8
A7L10000000000
L22.43.91.19.25.810.20.67.67.614.8
A8L10000000000
L26.30.83.81.77.75.83.412.02.15.9
A9L100000001.100
L24.58.26.84.13.82.22.202.52.0
L32.48.67.55.55.84.42.02.37.41.1
A10L11.000.40000000
L200.409.215.44.13.18.01.41.7
Table A5. Weighting of attribute level by respondent, presented as a %. DM11–20, respondent code. For definitions of attributes and levels, see Table 1.
AttributeAttribute LevelDM11DM12DM13DM14DM15DM16DM17DM18DM19DM20
A1L1021.702.205.30.00.00.00.0
L29.113.222.541.310.916.550.316.821.918.7
L318.13.223.314.44.533.725.222.13.34.4
L416.61.722.323.921.08.316.818.810.227.2
L525.1022.132.620.08.741.919.824.437.4
L615.20.515.3017.28.08.410.30.733.0
L736.56.724.86.51.4033.524.817.910.2
A2L10000000.00.00.00.0
L26.53.314.96.51.59.01.97.96.56.8
L39.05.017.37.63.017.99.311.917.98.3
L414.86.721.916.36.025.316.115.825.210.2
A3L10000000.00.00.00.0
L25.56.77.42.27.97.74.310.94.11.5
L35.813.321.98.712.018.35.614.96.51.9
A4L10000000.00.00.00.0
L22.31.77.44.30.73.83.74.03.34.4
L36.16.714.36.51.17.19.97.910.68.3
A5L14.200001.60.60.04.10.0
L20.611.70.74.34.50.30.04.00.03.9
L305.01.86.57.901.29.96.512.1
A6L10000000.00.00.00.0
L25.25.01.92.212.02.65.67.97.33.9
A7L10000000.00.00.00.0
L24.511.77.32.27.91.01.95.06.56.8
A8L10000000.00.00.00.0
L218.15.00.96.512.01.96.84.02.41.9
A9L13.204.60000.00.00.00.0
L205.003.312.46.40.65.08.13.9
L31.33.32.52.24.53.51.27.96.516.5
A10L1000.56.5000.00.00.00.0
L21.613.3007.92.21.22.02.41.0

Appendix B. Description of PAPRIKA Method in 1000minds Software

The PAPRIKA method involves the respondents answering a series of simple pairwise comparison questions, based on their expert knowledge and subjective judgment. Each question is based on choosing between two hypothetical alternatives on only two attributes at a time and involving a trade-off (in effect, the other attributes are assumed to be the same). Each time a respondent answers a question, PAPRIKA adapts. Based on a respondent’s previous answers, PAPRIKA creates new question for the respondent to answer. Such simple questions are repeated with different pairs of hypothetical alternatives until enough information about a respondent’s preferences has been collected. Examples of the questions are presented in Figure A2 (https://www.1000minds.com accessed on 6 May 2022).
Figure A2. Examples of questions within the 1000minds software.
Energies 15 03721 g0a2
PAPRIKA’s questions are based on ‘partial alternatives’ beginning with just two attributes at a time in contrast to the ‘full-alternatives’ methods, which involve all attributes together at once. Choosing one alternative from two, defined on only two attributes at a time, is easier than choosing one alternative from three or more or choosing between alternatives defined on more than two attributes. Consequently, the questions in PAPRIKA are less cognitively/psychometrically demanding for respondents and, therefore, the answers have greater validity and reliability.
Each time a respondent pairwise ranks a pair of alternatives, PAPRIKA immediately identifies all other pairs of hypothetical alternatives that can be pairwise ranked and eliminates them. It does this by applying a logical property known as ‘transitivity’. This elimination procedure ensures that the number of questions is minimized (see examples in Table A6). From a respondent’s answers, mathematical methods based on linear programming are used to calculate ‘part-worth utilities’, representing the relative importance (weights) of the attributes to the respondent.
Table A6. The necessary number of pairwise rankings (https://www.1000minds.com accessed on 6 May 2022).
Decision-Making ScenarioAlternativesAll Possible Pairwise RankingsUnique Undominated Pairs (To Be Pairwise Ranked)PAPRIKA Pairwise Rankings
8 criteria, 4 levels each48 = 65,5362,147,450,880402,100,560~95
10 criteria, 4 levels each410 = 1,048,576549,755,289,60068,646,770,676~160
12 criteria, 5 levels each512 = 244,140,62529,802,322,265,625,0003,674,775,327,316,600~900
20 criteria, 4 levels each420 = 1,099,511,627,776604,462,909,806,765,000,000,0009,502,402,095,174,090,000,000~1200
In addition, more detailed and technically oriented information is available from these external sources.
  • An overview of PAPRIKA and 1000minds can be found at https://www.1000minds.com, accessed on 6 May 2022.
  • The technical details of PAPRIKA are presented in the journal article by Hansen et al. [28], 2008. P. Hansen and F. Ombler (2008), “A new method for scoring multi-attribute value models using pairwise rankings of alternatives”, in the Journal of Multi-Criteria Decision Analysis 15, 87–107.

References

  1. Hakes, J. A Declaration of Energy Independence: How Freedom from Foreign Oil Can Improve National Security, Our Economy, and the Environment; John Wiley & Sons: Hoboken, NJ, USA, 2008. [Google Scholar]
  2. Stichnothe, H.; Meier, D.; de Bari, I. Biorefineries: Industry status and economics. In Developing the Global Bioeconomy; Academic Press: Cambridge, MA, USA, 2016; pp. 41–67. [Google Scholar]
  3. Rasaq, W.A.; Golonka, M.; Scholz, M.; Białowiec, A. Opportunities and Challenges of High-Pressure Fast Pyrolysis of Biomass: A Review. Energies 2021, 14, 5426. [Google Scholar] [CrossRef]
  4. Díaz-Yáñez, O.; Mola-Yudego, B.; Anttila, P.; Röser, D.; Asikainen, A. Forest chips for energy in Europe: Current procurement methods and potentials. Renew. Sustain. Energy Rev. 2013, 21, 562–571. [Google Scholar] [CrossRef]
  5. BioHub. BioHub Model; Biohub: San Francisco, CA, USA, 2019. [Google Scholar]
  6. BioRes. European Best Practice of Biomass Logistics and Trade Centres (BLTCs); BioRes: Oreye, Belgium, 2019. [Google Scholar]
  7. Kons, K. Management of Forest Biomass Terminals; Swedish University of Agricultural Sciences: Uppsala, Sweden, 2019. [Google Scholar]
  8. Virkkunen, M.; Kari, M.; Hankalin, V.; Nummelin, J. Solid biomass fuel terminal concepts and a cost analysis of a satellite terminal concept. VTT Technol. 2015, 211, 69. [Google Scholar] [CrossRef]
  9. Frosch, M.; Thorén, P. Railroad Transport of Bio Fuels [In Swedish with English summary]. In Värmeforsk; No. 1138; Issue Systemteknik; Värmeforsk Service AB: Stockholm, Sweden, 2010. [Google Scholar]
  10. Lönner, G.; Liljeblad, H.; Hjälm, B.; Strand, H.O.; Lindqvist, L. Wood processing terminals [for fuel production]. Present state and future development. In Skogsråvaruterminaler. Nuläge Och Framtida Utveckling; Nämnden för Energiproduktionsforskning: Stockholm, Sweden, 1983. [Google Scholar]
  11. Sinclair, A.W.J.; Wellburn, G.V. A handbook for designing, building and operating a log sortyard. In A Handbook for Designing, Building and Operating a Log Sortyard; Forest Engineering Research Institute of Canada: Vancouver, BC, Canada, 1984. [Google Scholar]
  12. Windisch, J.; Röser, D.; Mola-Yudego, B.; Sikanen, L.; Asikainen, A. Business process mapping and discrete-event simulation of two forest biomass supply chains. Biomass Bioenergy 2013, 56, 370–381. [Google Scholar] [CrossRef]
  13. Jirjis, R. Optimization of Wood Chips Storage and Drying; Swedish University of Agricultural Sciences, Department of Forest Products: Upssala, Sweden, 1996; Volume 12. [Google Scholar]
  14. Hakkila, P. Forest Chips as Fuel for Heating Plants in Finland; Institutum Forestale Fenniae: Helsinki, Finland, 1984; Volume 586. [Google Scholar]
  15. Jensen, P.D.; Mattsson, J.E.; Kofman, P.D.; Klausner, A. Tendency of wood fuels from whole trees, logging residues and roundwood to bridge over openings. Biomass Bioenergy 2004, 26, 107–113. [Google Scholar] [CrossRef]
  16. Jirjis, R. Handling and Storage of Woody Biomass; Swedish University of Agricultural Sciences, Department of Forest Products: Upssala, Sweden, 1995; Volume 5. [Google Scholar]
  17. Mattsson, J.E. Basic handling characteristics of wood fuels: Angle of repose, friction against surfaces and tendency to bridge for different assortments. Scand. J. For. Res. 1990, 5, 583–597. [Google Scholar] [CrossRef]
  18. Krigstin, S.; Helmeste, C.; Wetzel, S.; Volpé, S. Managing self-heating & quality changes in forest residue wood waste piles. Biomass Bioenergy 2020, 141, 105659. [Google Scholar] [CrossRef]
  19. Anerud, E.; Krigstin, S.; Routa, J.; Brännström, H.; Arshadi, M.; Helmeste, C.; Bergström, D.; Egnell, G. Dry Matter Losses during Biomass Storage-Measures to Minimize Feedstock Degradation; IEA Bioenergy: Helsinki, Finland, 2019. [Google Scholar]
  20. Garstang, J.; Weekes, A.; Poulter, R.; Bartlett, D. Identification and characterisation of factors affecting losses in the large-scale, non ventilated bulk storage of wood chips and development of best storage practices. In DTI/Pub URN; ADAS: London, UK, 2002; Volume 2. [Google Scholar]
  21. Kristensen, E. Pressure resistance to air flow during ventilation of different types of wood fuel chip. Biomass Bioenergy 2000, 18, 175–180. [Google Scholar] [CrossRef]
  22. Nuutinen, Y.; Juha, L.; Rytkönen, E. Grinding of Stumps, Logging Residues and Small Diameter Wood Using a CBI 5800 Grinder with a Truck as a Base Machine (Brief report). Balt. For. 2014, 20, 176–188. [Google Scholar]
  23. Routa, J.; Kolström, M.; Ruotsalainen, J.; Sikanen, L. Validation of prediction models for estimating the moisture content of logging residues during storage. Biomass Bioenergy 2016, 94, 85–93. [Google Scholar] [CrossRef]
  24. Bradley, D.; Solutions, C.C. Canada-Sustainable Forest Biomass Supply Chains; Climate Change Solution: Ottawa, OT, Canada, 2007. [Google Scholar]
  25. Vandenbroek, R.; Faaij, A.; van Wijk, A. Biomass combustion for power generation. Biomass Bioenergy 1996, 11, 271–281. [Google Scholar] [CrossRef]
  26. Bond, S.D.; Carlson, K.; Keeney, R.L. Generating objectives: Can decision makers articulate what they want? Manage Sci. 2008, 54, 56–70. [Google Scholar] [CrossRef] [Green Version]
  27. Hansen, P.; Ombler, F. A new method for scoring additive multi-attribute value models using pairwise rankings of alternatives. J. Multi-Criteria Decis. Anal. 2008, 15, 87–107. [Google Scholar] [CrossRef]
  28. Green, P.E.; Srinivasan, V. Conjoint Analysis in Consumer Research: Issues and Outlook. J. Consum. Res. 1978, 5, 103–123. [Google Scholar] [CrossRef]
  29. Orme, B. Managerial overwiew of Conjoint Analysis. In Getting Started with Conjoint Analysis; Research Publishers: Madison, WI, USA, 2004. [Google Scholar]
  30. Pelkmans. IEA Bioenergy Countries’ Report—Implementation of Bioenergy in the IEA Bioenergy Member Countries; IEA Bioenergy: Helsinki, Finland, 2021; p. 28. ISBN 978-1-910154-93-9. [Google Scholar]
  31. Official Statistics of Finland (OSF). Energy Supply and Consumption; Statistics Finland: Helsinki, Finland, 2019; ISSN 1799-7976. Available online: http://www.stat.fi/til/ehk/2019/ehk_2019_2020-12-21_tie_001_en.html (accessed on 28 March 2022).
  32. Hektor, B.; Bruce, L.; Andersson, K. Country Report Sweden; Swedish Bioenergy Association: Stockholm, Sweden, 2014; p. 26. [Google Scholar]
  33. IEA (International Energy Agency). Implementation of Bioenergy in Australia—2021; IEA Bioenergy: Helsinki, Finland, 2021; p. 15. [Google Scholar]
  34. Mola-Yudego, B.; Selkimäki, M.; Olabarria, J.R.G. Spatial analysis of the wood pellet production for energy in Europe. Renew. Energy 2014, 63, 76–83. [Google Scholar] [CrossRef]
  35. IEA (International Energy Agency). Implementation of Bioenergy in Canada; IEA Bioenergy: Helsinki, Finland, 2021; p. 21. [Google Scholar]
  36. Drummond, M.F.; Sculpher, M.J.; Claxton, K.; Stoddart, G.L.; Torrance, G.W. Methods for the Economic Evaluation of Health Care Programmes; Oxford University Press: Oxford, UK, 2015. [Google Scholar]
  37. Luce, R.; Tukey, J.W. Simultaneous conjoint measurement: A new type of fundamental measurement. J. Math. Psychol. 1964, 1, 1–27. [Google Scholar] [CrossRef]
  38. Green, P.E.; Rao, V.R. Conjoint measurement-for quantifying judgmental data. J. Mark. Res. 1971, 8, 355–363. [Google Scholar]
  39. Morgan-Davies, C.; Waterhouse, T. Future of the hills of Scotland: Stakeholders’ preferences for policy priorities. Land Use Policy 2010, 27, 387–398. [Google Scholar] [CrossRef]
  40. Arifin, B.; Swallow, B.M.; Suyanto, S.; Coe, R.D. A conjoint analysis of farmer preferences for community forestry contracts in the Sumber Jaya Watershed, Indonesia. Ecol. Econ. 2009, 68, 2040–2050. [Google Scholar] [CrossRef]
  41. Kelly, M.C.; Germain, R.H.; Stehman, S.V. Family Forest Owner Preferences for Forest Conservation Programs: A New York Case Study. For. Sci. 2015, 61, 597–603. [Google Scholar] [CrossRef] [Green Version]
  42. Aguilar, F.X. Investment preferences for wood-based energy initiatives in the US. Energy Policy 2009, 37, 2292–2299. [Google Scholar] [CrossRef]
  43. Kühmaier, M.; Harrill, H.; Ghaffariyan, M.R.; Hofer, M.; Stampfer, K.; Brown, M.; Visser, R. Using Conjoint Analyses to Improve Cable Yarder Design Characteristics: An Austrian Yarder Case Study to Advance Cost-Effective Extraction. Forests 2019, 10, 165. [Google Scholar] [CrossRef] [Green Version]
  44. George, J.; Arun, P.; Muraleedharan, C. Region-specific biomass feedstock selection for gasification using multi-attribute deci-sion-making techniques. Int. J. Sustain. Eng. 2021, 14, 1101–1109. [Google Scholar] [CrossRef]
  45. Saaty, T.L. The Analytic Hierarchy Process; McGraw-Hill: New York, NY, USA, 1980. [Google Scholar]
  46. Kulisic, B.; Dimitriou, I.; Mola-Yudego, B. From preferences to concerted policy on mandated share for renewable energy in transport. Energy Policy 2021, 155, 112355. [Google Scholar] [CrossRef]
  47. Kulišić, B.; Dimitriou, I.; Mola-Yudego, B. Positioning the biofuel policy in the bioeconomy of the BioEast macro-region. Biofuels 2021, 1–10. [Google Scholar] [CrossRef]
  48. Fernández-Tirado, F.; Parra-López, C.; Romero-Gámez, M. A multi-criteria sustainability assessment for biodiesel alternatives in Spain: Life cycle assessment normalization and weighting. Renew. Energy 2021, 164, 1195–1203. [Google Scholar] [CrossRef]
  49. Schillo, R.S.; Isabelle, D.A.; Shakiba, A. Linking advanced biofuels policies with stakeholder interests: A method building on Quality Function Deployment. Energy Policy 2017, 100, 126–137. [Google Scholar] [CrossRef] [Green Version]
  50. Saaty, T.L.; Özdemir, M.S. How many judges should there be in a group? Ann Data Sci. 2014, 1, 359–368. [Google Scholar] [CrossRef] [Green Version]
  51. Palander, T.S.; Voutilainen, J.J. Modelling fuel terminals for supplying a combined heat and power (CHP) plant with forest biomass in Finland. Biosyst. Eng. 2013, 114, 135–145. [Google Scholar] [CrossRef]
  52. Söderholm, P.; Lundmark, R. Forest-based Biorefineries. For. Prod. J. 2009, 59, 7. [Google Scholar]
  53. Larsen, R.; Rich, J.; Rasmussen, T.K. Hub-based truck platooning: Potentials and profitability. Transp. Res. Part E Logist. Transp. Rev. 2019, 127, 249–264. [Google Scholar] [CrossRef]
  54. Prinz, R.; Väätäinen, K.; Laitila, J.; Sikanen, L.; Asikainen, A. Analysis of energy efficiency of forest chip supply systems using discrete-event simulation. Appl. Energy 2018, 235, 1369–1380. [Google Scholar] [CrossRef]
  55. Virkkunen, M.; Raitila, J.; Korpinen, O.-J. Cost analysis of a satellite terminal for forest fuel supply in Finland. Scand. J. For. Res. 2016, 31, 175–182. [Google Scholar] [CrossRef]
  56. Kons, K.; La Hera, P.; Bergström, D. Comparison of Alternative Pulpwood Inventory Strategies and Machine Systems at a Log-Yard Using Simulations. Forests 2020, 11, 373. [Google Scholar] [CrossRef] [Green Version]
  57. Kons, K.; La Hera, P.; Bergström, D. Modelling Dynamics of a Log-Yard through Discrete-Event Mathematics. Forests 2020, 11, 155. [Google Scholar] [CrossRef] [Green Version]
  58. Geissdoerfer, M.; Pieroni, M.P.; Pigosso, D.C.; Soufani, K. Circular business models: A review. J. Clean. Prod. 2020, 277, 123741. [Google Scholar] [CrossRef]
  59. Warguła, Ł.; Kukla, M.; Wieczorek, B.; Krawiec, P. Energy consumption of the wood size reduction processes with employment of a low-power machines with various cutting mechanisms. Renew. Energy 2020, 181, 630–639. [Google Scholar] [CrossRef]
  60. Selkimäki, M.; Mola-Yudego, B.; Röser, D.; Prinz, R.; Sikanen, L. Present and future trends in pellet markets, raw materials, and supply logistics in Sweden and Finland. Renew. Sustain. Energy Rev. 2010, 14, 3068–3075. [Google Scholar] [CrossRef]
  61. Eriksson, G.; Bergström, D.; Nordfjell, T. The state of the art in woody biomass comminution and sorting in Northern Europe. Int. J. For. Eng. 2013, 24, 194–215. [Google Scholar] [CrossRef]
  62. Hellström, L.M.; Isaksson, P.; Gradin, P.A.; Eriksson, K. An Analytical and Numerical Study of some aspects of the Wood Chipping Process. Nord. Pulp Pap. Res. J. 2009, 24, 225–230. [Google Scholar] [CrossRef] [Green Version]
  63. Kons, K.; Bergström, D.; Di Fulvio, F. Effects of sieve size and assortment on wood fuel quality during chipping operations. Int. J. For. Eng. 2015, 26, 114–123. [Google Scholar] [CrossRef]
  64. Nati, C.; Spinelli, R.; Fabbri, P. Wood chips size distribution in relation to blade wear and screen use. Biomass Bioenergy 2010, 34, 583–587. [Google Scholar] [CrossRef]
  65. BioRes. Biores-Sustainable Regional Supply Chains for Woody Bioenergy Practitioners Guidebook; BioRes: Oreye, Belgium, 2017. [Google Scholar]
Figure 1. Preferred biomass supply contract period among the surveyed bioenergy facilities (n = 27).
Energies 15 03721 g001
Figure 2. The most common problems associated with biomass storage as reported by the surveyed bioenergy facilities (n = 27).
Energies 15 03721 g002
Figure 3. Willingness to rent out extra storage space with 24/7 access among all facilities and to move some of their storage volumes to the supplier to share the risks associated with storage.
Energies 15 03721 g003
Figure 4. Country profiles for biomass feedstock preferences based on the attributes considered and the size of the facility (combustion). The estimated weights for the attributes are expressed as percentages. (Canada n = 4, n = 1, Finland n = 1, n = 3, Sweden n = 2, n = 5, values for ≤5 MW and >5 MW, respectively). For definitions of the attributes, see Table 1. (a) Canada (≤5 MW), (b) Canada (>5 MW), (c) Finland (≤5 MW), (d) Finland (>5 MW), (e) Sweden (≤5 MW), (f) Sweden (>5 MW).
Energies 15 03721 g004
Figure 5. Weighting and ranking of the preferred biomass feedstock attributes, aggregated by country and total values (n = 20; definitions of attribute codes are given in Table 1).
Energies 15 03721 g005
Table 1. Attributes of biomass feedstock and their associated levels.
AttributeAttribute Level
A1Type of biomass assortment you preferL1Agricultural residues and by-products
L2Logging residue and tree part chips
L3Bark
L4Energy wood (low-quality roundwood)
L5Stem wood chips
L6Pulpwood
L7Sawdust
A2Assortment availability in the supply regionL1Low: <25% of your facility’s production needs
L2Medium: 50% of your facility’s production needs
L3High: 75% of your facility’s production needs
L4Very high: 100% of your facility’s production needs
A3PriceL1Higher than the market average
L2Market average
L3Lower than the market average
A4Supply security/accessibility of an assortmentL1Low: access can regularly be disturbed
L2Medium: seasonal variation can affect access
L3High: access is all year round
A5Average range in particle sizeL1The higher end of your maximum acceptable range
L2The lower end of your minimum acceptable range
L3Middle of your acceptable range
A6Variation in moisture or dry content between deliveriesL1High variation
L2Low variation
A7Variation in particle size between deliveriesL1High variation
L2Low variation
A8Variation in ash content between deliveriesL1High variation
L2Low variation
A9Percentage moisture content (not dry content)L1The higher end of your maximum acceptable range
L2The lower end of your minimum acceptable range
L3Middle of your acceptable range
A10Percentage ash contentL1Your maximum accepted level
L2Your expected level or lower
Table 2. Number of facilities by country and biomass conversion technology.
Biomass Conversion TechnologyNo. of Facilities per CountryTotal
AustraliaCanadaSwedenFinland
Combustion ≤ 5 MW14218
Combustion 6–20 MW 2 2
Combustion 21–50 MW 1 1
Combustion > 50 MW, Pyrolysis, Lignin extraction 235
Combustion ≤ 5 MW, Gasification/Pyrolysis2 2
Pelletizing / Torrefaction, Lignin extraction, Sugar extraction 23 5
Pelletizing, Combustion 21–50 MW 2 2
Hydrothermal Liquefaction2 2
Total5612427
Table 3. Averaged percentage of biomass characteristics (n = 27), grouped by conversion technology and country.
Biomass Conversion TechnologyCountryPulpwoodEnergy WoodStem Wood Chips (White Chips)Logging Residue Chips (Brown/Green Chips)Logging ResiduesBarkSawdust and/or ShavingsAgricultural Residues and/or By-ProductsOther
Combustion ≤ 5 MWAustralia 100
Canada10075252525 502550
Finland10075252525 502550
Sweden50 100 50
Combustion 6–20 MWSweden 5050 50100100
Combustion 21–50 MW 100 100100100
Combustion > 50 MW, Pyrolyses, Lignin extractionFinland 10010010033100100 33
Sweden10010050 50100100
Combustion ≤ 5 MW, Gasification/PyrolysisAustralia1001001005050100100100
Pelletizing, Torrefaction, Lignin extraction, Sugar extraction to produce ethanolCanada5050 50505010050
Sweden 33 67100
Pelletizing, Combustion 21–50 MWSweden505050505050100
Hydrothermal LiquefactionAustralia 5050505010050
Table 4. The averaged percentage of facilities using a given biomass assortment, by conversion technology and country. MC: moisture content. *: max–min.
Biomass Conversion TechnologyCountry% Facilities Receiving Non-Comminuted Feedstock% Facilities Performing ComminutionParticle Characteristic Causing Most Problems, % FacilitiesRange * MC, % facilitiesDifference in Ideal MC vs. Received MC, % Facilities
OversizedToo FineParticle ShapeOther
Combustion ≤ 5 MWAustralia0010000033−9
Canada3580755000339
Finland950100000500
Sweden500100500015−2.5
Combustion 6–20 MWSweden57100100050030−6.5
Combustion 21–50 MW00100000250
Combustion > 50 MW, Pyrolysis, Lignin extractionFinland233663300Max 605/NaN
Sweden55100100500025
Combustion ≤ 5 MW, Gasification/PyrolysisAustralia35010000031NaN
Pelletizing, Torrefaction, Lignin extraction, Sugar extraction to produce ethanolCanada01005050004312
Sweden110033 334000
Pelletizing, Combustion 21–50 MWSweden51005010050019−2/NaN
Hydrothermal LiquefactionAustralia50100100000286
Table 5. Type (level) of biomass assortment (attribute A1) ranked first by the respondents (codes and descriptions of the bioenergy facilities are described in Table A1. AU: Australia, CA: Canada, FIN: Finland, SE: Sweden).
Expert/FacilityNumber (%)
L1Agricultural residues and by-productsDM12-AU1 (5%)
L2Logging residue and tree part chipsDM14-SE, DM17-FI2 (10%)
L3BarkDM7-SE, DM16-CA2 (10%)
L4Energy wood
(low-quality roundwood)
DM5-SE, DM9-CA, DM15-CA3 (15%)
L5Stem wood chipsDM2-SE, DM8-SE, DM19-FI, DM20-FI4 (20%)
L6PulpwoodDM1-CA1 (5%)
L7SawdustDM3-CA, DM4-SE, DM6-SE, DM10-CA, DM11-SE, DM13-SE, DM18-FI7 (35%)
Publisher’s Note: MDPI stays neutral with regard to jurisdictional claims in published maps and institutional affiliations.

