Article

Hydrothermal Treatment of Residual Forest Wood (Softwood) and Digestate from Anaerobic Digestion—Influence of Temperature and Holding Time on the Characteristics of the Solid and Liquid Products

1
Department of Bioenergy, University of Applied Forest Sciences Rottenburg, Schadenweilerhof, 72108 Rottenburg, Germany
2
Sustainable Catalytic Materials Group, Fraunhofer Institute for Solar Energy Systems ISE, Heidenhofstraße 2, 79110 Freiburg im Breisgau, Germany
3
Tropics and Subtropics Group, Institute of Agricultural Engineering, University of Hohenheim, Garbenstrasse 9, 70599 Stuttgart, Germany
*
Author to whom correspondence should be addressed.
These authors contributed equally to this work.
Submission received: 20 April 2022 / Revised: 16 May 2022 / Accepted: 17 May 2022 / Published: 19 May 2022

Abstract

:
Hydrothermal treatment (HTT) offers the potential to upgrade low-value biomass such as digestate (DG) or forest residue (FR) by producing solids and liquids for material use or energetic utilization. In this study, microwave-assisted HTT experiments with DG and FR as feedstocks were executed at different temperatures (130, 150, 170 °C) and with different holding times (30, 60, 90 min) to determine the influences on product properties (ash and elemental concentrations, calorific values and chemical compounds). In general, DG and FR reacted differently to HTT. For the DG solids, for instance, the ash concentration was reduced to 8.68%DM at 130 °C (initially 27.67%DM), and the higher heating value increased from 16.55 MJ/kgDM to 20.82 MJ/kgDM at 170 °C, while the FR solids were affected only marginally. Elements with importance for emissions in combustion were leached out in both HTT solids. The DG and FR liquids contained different chemical compounds, and the temperature or holding time affected their formation. Depending on the designated application of HTT, less severe conditions can deliver better results. It was demonstrated that different low-temperature HTT conditions already induce strong changes in the product qualities of DG and FR. Optimized interactions between process parameters (temperature, holding time and feedstock) might lead to better cost–benefit effects in HTT.

Graphical Abstract

1. Introduction

For the transformation towards a sustainable energy supply and an ecological economy, renewable and biogenic resources and waste streams have to be utilized [1]. For this reason, research on innovative utilization and alternative upgrading approaches or pre-treatments such as steam explosion [2] or chemical methods [3] is essential. Therefore, biogenic (waste) materials such as the organic fraction of municipal solid waste [4], sewage sludge, forest-based residues (FR) and digestate (DG) become attractive [5,6,7]. Agricultural and silvicultural residues (especially softwood-based FR) are available in large quantities and can often be obtained at low cost. According to a study by Brosowski et al. [8], the unutilized technical potential of residual material in Germany amounts to more than 30 million tons of dry matter (DM). Thereof, 95% can be attributed to FR, animal excrements and cereal straw. The availability and typical composition of agricultural and silvicultural residues were also highlighted in Di Gruttola and Borello [1]. FR (softwood and hardwood) often remains in the forest after thinning or timber harvest, and it consists of weaker wood with thus higher shares of bark, which leads to increased ash concentrations [9] and elements (heavy metals) that might be critical for further processes [10]. DG, which can be composed of several different waste materials such as manure, crop residues or municipal waste, is the final product, or a by-product, of anaerobic digestion (AD) processes. DG is usually used as a fertilizer in agriculture [11]. However, increased levels of heavy metals and other critical elements, as well as insufficiently degraded organic pollutants, may be present in DG [12]. Depending on the feedstock of the AD plant, the physicochemical characteristics of DG vary. The DG of agricultural AD plants from stirred tank reactors, for instance, is often characterized by DM concentrations below <5% [13] to remain suitable for pumping. Alternative utilization approaches for DG such as the coupling of AD with hydrothermal processes could open up new opportunities for plant operators [14,15].
Hydrothermal carbonization (HTC), as the technical process to recreate the natural coalification, could be a suitable treatment method, especially for biomass types with high contents of water [16] such as DG. In addition to solid products, HTC can be used for the production of value-added chemicals [17].
Current research refers to HTC, also called hydrous pyrolysis, as a thermochemical conversion process or pre-treatment technology for biomasses (e.g., corn straw [18]) in the vicinity of subcritical water and in the absence of oxygen [19]. Process temperatures of HTC vary drastically but are often in the range of 180–250 °C with holding times of a few minutes up to several hours, together with (autogenous) pressure levels of up to several MPa [20,21,22]. In addition to the solid hydrochar as the main component, liquid and gaseous by-products are formed [23]. The yield and characteristics of the resulting products depend on the feedstock and on the operating conditions [24,25]. The advantage of HTC in comparison to other processes is that biomasses with high water contents can also be used without energy-intensive pre-drying, while the solid suspension has a better dewaterability compared to the initial substrates [26,27]. During the HTC process, water serves as a solvent and as a reaction medium that ensures heat transfer [28]. When water is heated in a pressure-resistant system, both the density and viscosity decrease, favoring mass transfers [29]. With increasing temperature, the ion product increases and the dielectric constant decreases, giving water the properties of a non-polar solvent. Non-polar substances dissolve during biomass decomposition, while the solubility of salts decreases [30,31]. HTC includes several reaction mechanisms in which biopolymers such as hemicellulose or lignin are converted [22,32]. Some of the conversion steps during HTC are acid-catalyzed reactions. Accordingly, an acidic environment supports the conversion of biomass and carbon formation [33]. Due to by-products, HTC leads to a pH value reduction in the process water [34,35]. Karagöz et al. [36] reported that phenolic, organic and furan derivative compounds were formed during the degradation of the biomass polymers, resulting in an acidic nature.
In contrast to HTC, hydrothermal treatment (HTT) or thermal hydrolysis is often focused on the extraction of specific chemicals from the biomass, while the solid carbonaceous material is considered as a by-product [22]. For example, Vallejoy et al. [37] studied various silvicultural and agricultural residues to recover compounds such as oligo- and monosaccharides, hexoses, pentoses, acetic acid, furfural and phenolic compounds to subsequently convert them into high-value-added products, especially in the context of the bioeconomy. They noted that low liquid-to-solid ratios and low temperatures are a possible way to reduce the energy costs of HTT processes [37]. The main differences between HTT and HTC are primarily the lower reaction temperatures, and the shortened holding times [22]. Low-temperature HTT is often reported to deliver improvements in terms of methane yield in AD, which could also be a sustainable solution for the application of HTT products [38,39]. For instance, Bougrier et al. [40] noticed that the HTT pre-treatment (up to 190 °C) could increase biogas production. However, Yuan et al. [41] compared HTT temperatures ranging from 130 to 210 °C and reported an increased specific methane yield, but a total negative energy balance due to the necessary and additional energy input compared to conventional AD applications. The total energy increase seems to be strongly dependent on the reaction conditions, the feedstock and the resulting increase in specific methane potentials since other studies found overall positive energy balances [42]. In comparison to AD, previous studies observed that HTT at temperatures below 200 °C positively influences the fuel properties regarding potential emissions in combustion processes [6,43].
Studies by Cao et al. [44] and others have already investigated the effects of HTC and HTT on DG by using temperatures of 150–260 °C with holding times of 1–8 h [44,45]. Parmar and Ross [45] came to the conclusion that hydrochar from DG cannot be recommended as a solid fuel for combustion due to its ash chemistry and predicted slagging and fouling behavior. They observed that the treatment of DG at more than 150 °C provided little benefit and suggested alternative applications such as soil amendment should be considered [45]. However, the product behavior and composition are strongly dependent on the feedstock as well as on the HTC and HTT process conditions [44,45]. In addition to the influence of the temperature, the influence of the holding time was investigated in a study by Cao et al. [44], starting from 170 °C with holding times of 2–5 h.
Therefore, the aim of this study was to improve the utilization possibilities of two important biogenic residues, namely, softwood-based FR in the form of wood chips and manure- and energy-crop-based DG from an AD plant, through the application of low-temperature microwave-assisted HTT. This state-of-the-art approach has been addressed in several recent studies [46,47]. The solid and liquid HTT products were analyzed with respect to potential improvements in their fuel properties and with regard to other possible applications such as the provision of chemical compounds for material use. Thus, the main objective was to reveal the recycling opportunities of alleged low-value feedstocks through microwave-assisted HTT in terms of energetic and material utilization. For this purpose, the focus was on the discussion of the influence of different low-temperature HTT temperatures (≤170 °C) with short holding times (≤90 min) to design energy-efficient HTT processes that still upgrade the raw materials.

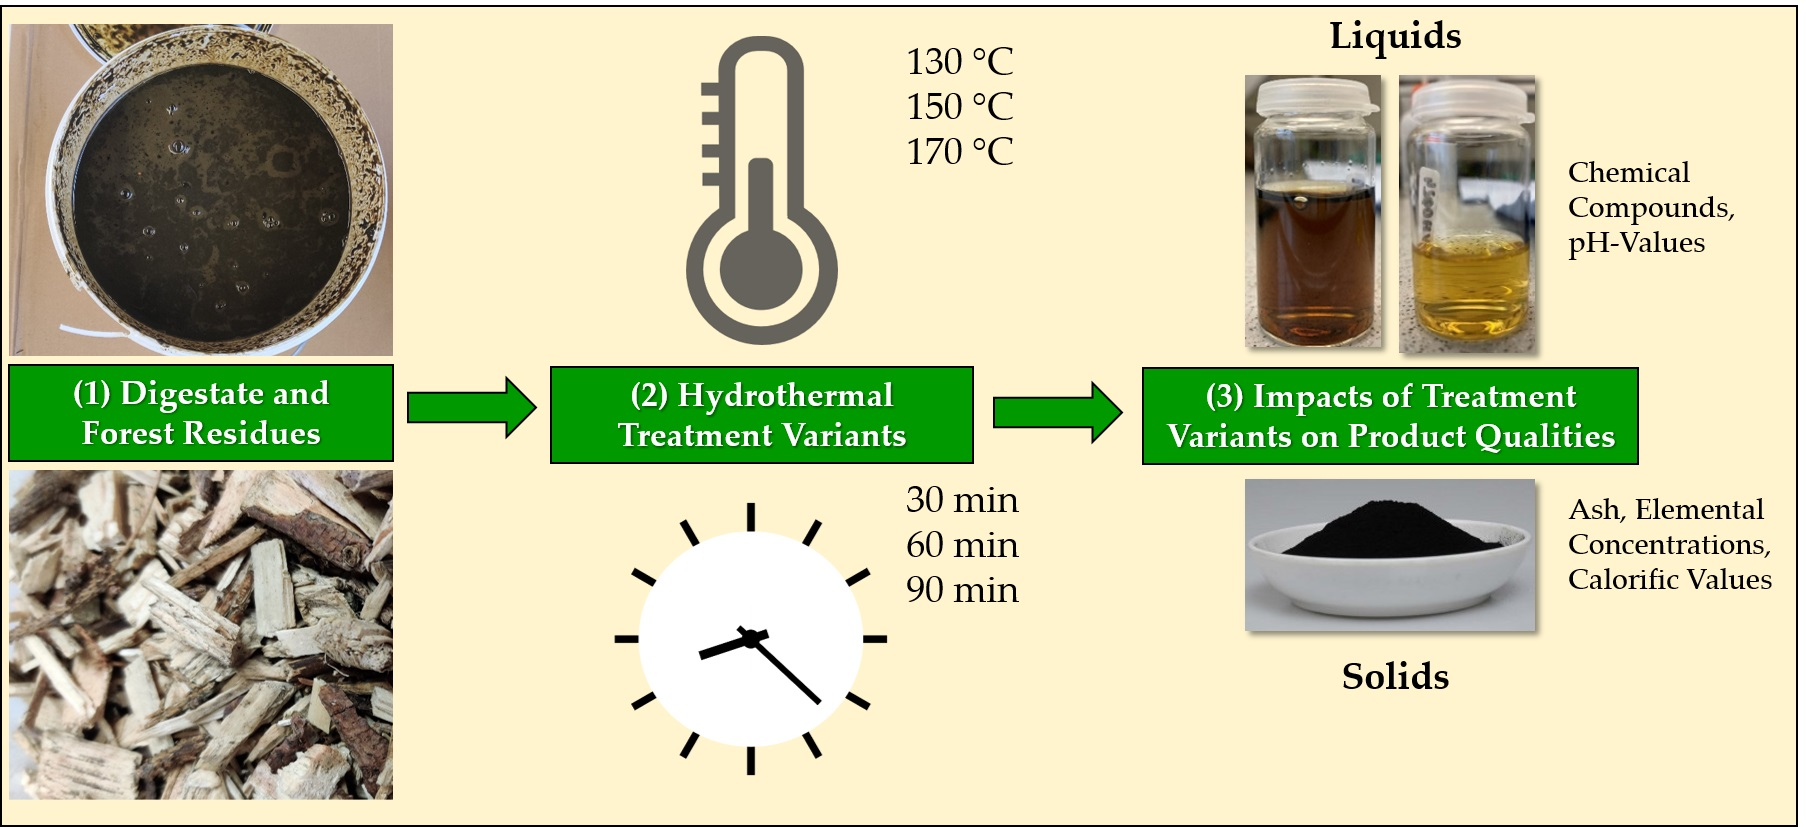
2. Materials and Methods
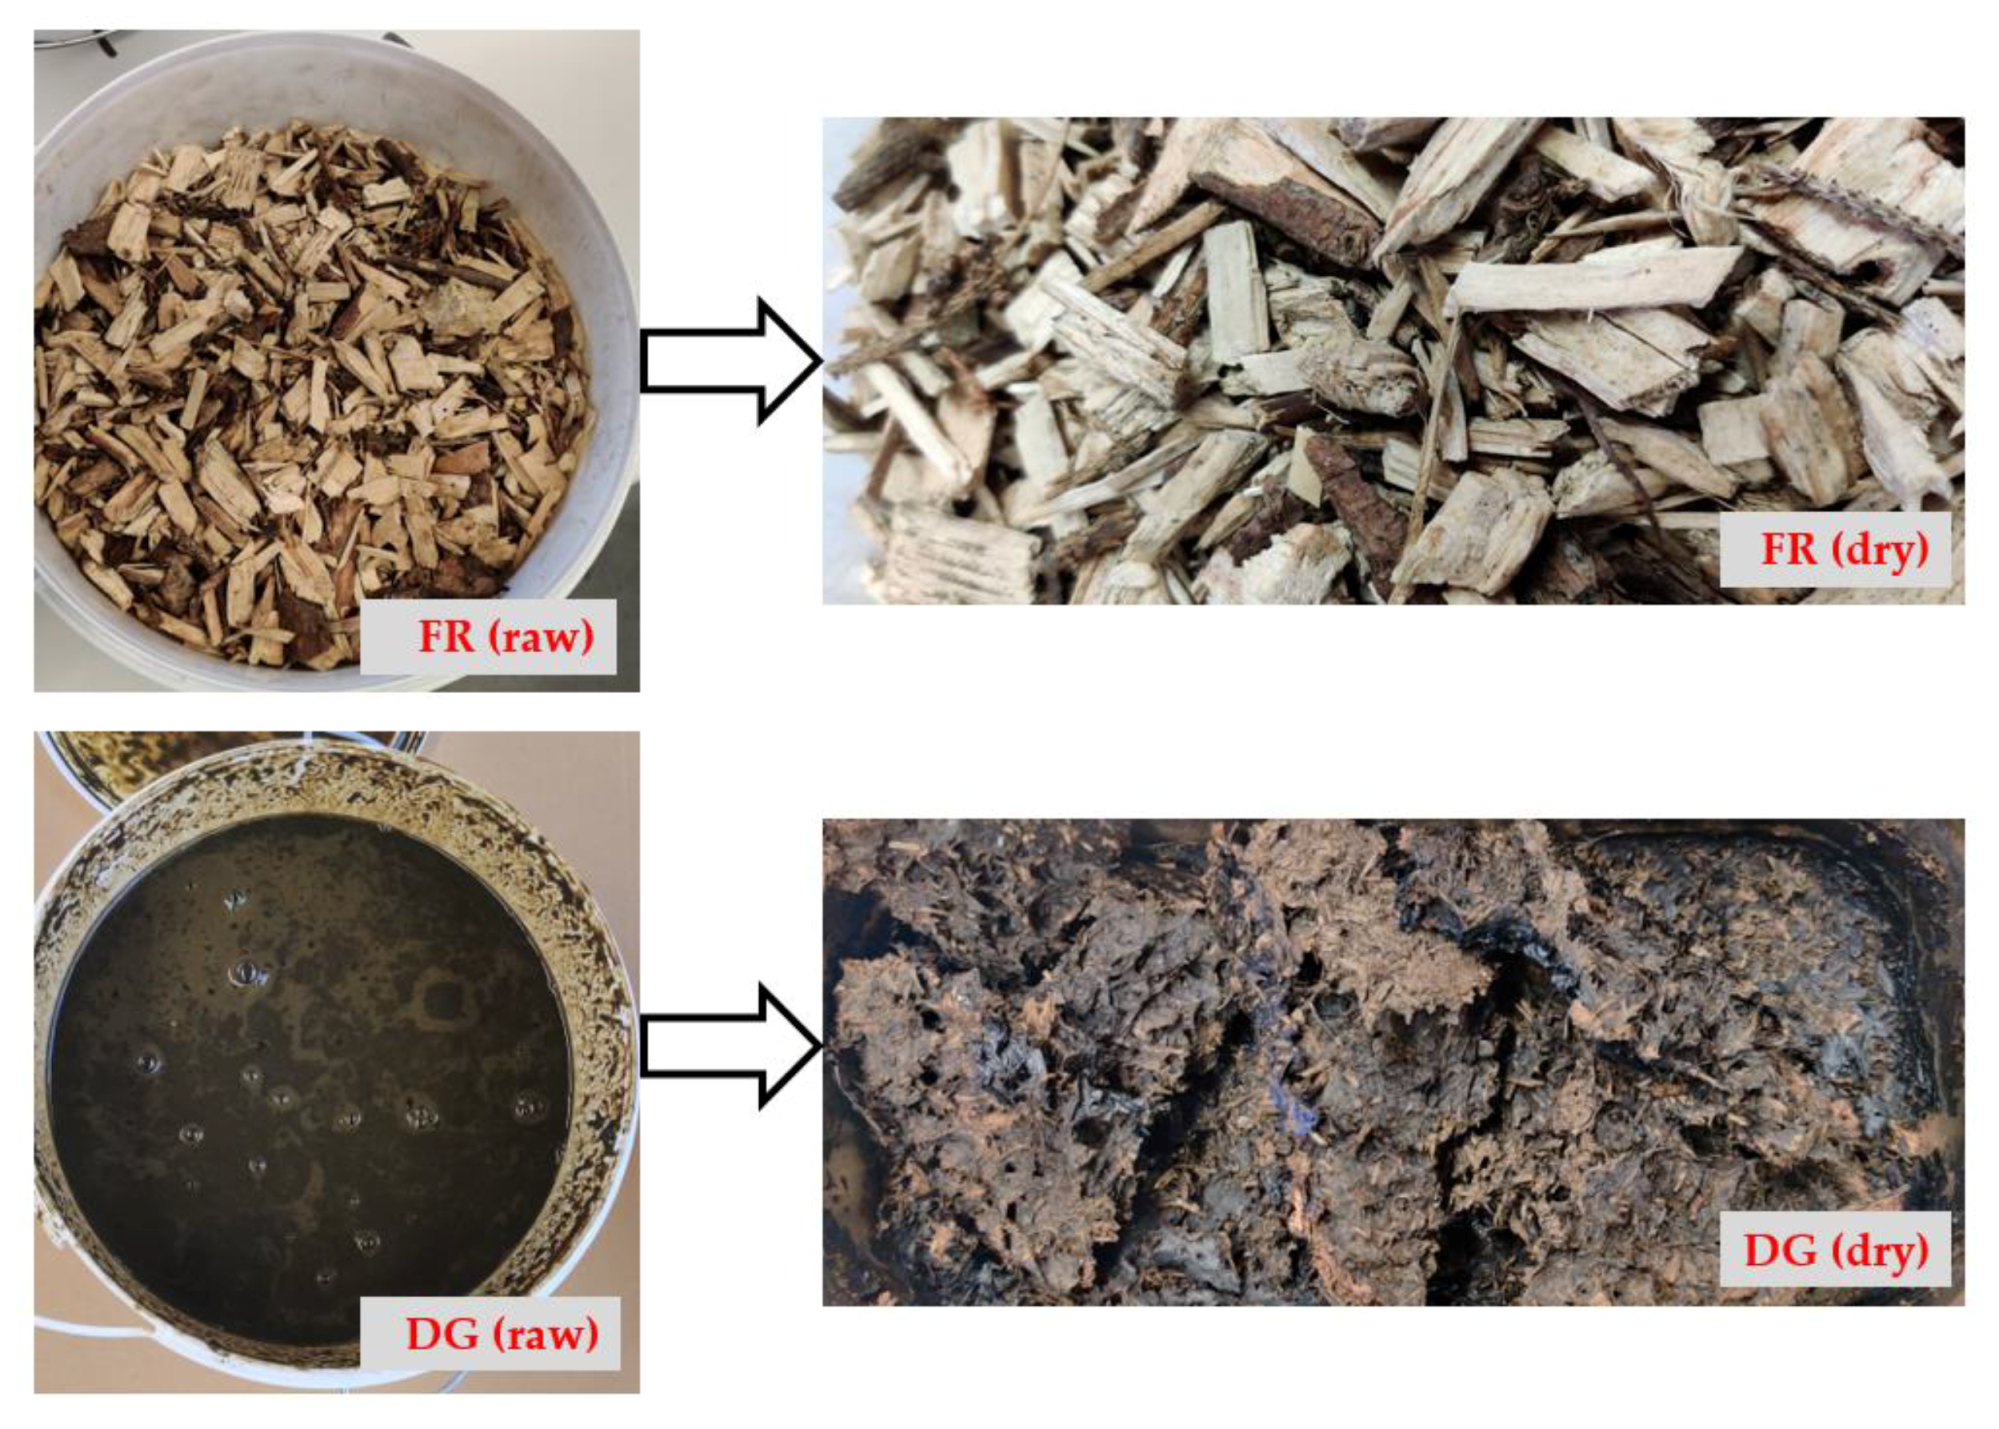
All analyses were performed at the laboratory of the University of Applied Forest Sciences Rottenburg (Rottenburg am Neckar, Germany). All experiments were executed with several repetitions as described in the following sections. The results of all analyses were evaluated based on mean values ± standard deviations. A similar procedure was executed in other studies [48,49].

2.1. Samples

The softwood-based forest residue (FR) sample used in this study consisted of wood chips (trunk wood with bark material). The sample was provided by another research project in an air-dried state and originated from the Black Forest in southern Germany. The digestate (DG) was provided by a local full-scale AD plant (Tübingen-Weilheim, Germany) and was composed of cattle slurry, corn silage and grass silage, which are typical feedstocks for AD plants in Germany. The DG was taken from the secondary digester. The first approximately 10 L of DG (taken from the extraction port) was discarded, and about 15 L was subsequently collected and further processed (drying as described in Section 2.2.) within 1 h. For both samples, pictures can be found in Appendix A.

2.2. Processing, Dry Matter and Ash Concentration

The DM concentration was determined by drying the samples in a drying oven (UNP 700, Memmert, Schwabach, Germany) for at least 24 h (105 °C) until constant weight. Dry material was used for all analyses (including the HTT treatment itself) due to the comparability between the HTT production runs. This circumstance had to be considered when evaluating the results of this study as the drying process at 105 °C influenced the sample composition (not only water but also other volatile components are lost during drying). After the drying process, all samples were manually cleared of impurities, milled to a particle size of ≤1 mm with a cutting mill (Pulverisette 19, Fritsch, Idar-Oberstein, Germany) and stored in containers. For all samples, the ash concentration was determined in at least triplicate by incinerating approximately 0.3 gDM for the HTT samples and by incinerating 1 gDM for the raw biomass in ceramic crucibles that were placed in a muffle furnace (AAF 1100, Carbolite, Neuhausen, Germany). This procedure was in accordance with EN ISO 18122:2016 [50].

2.3. Hydrothermal Treatment

The HTT of the biomasses was carried out using an 850 W microwave (Multiwave Go, Anton Paar GmbH, Graz, Austria) with a magnetron frequency of 2455 MHz. In each test series, 12 polytetrafluoroethylene (PTFE) reaction vessels, each with a volume of 50 mL, were filled with 500 mgDM of sample material, 9.9 mL of demineralized water and 0.1 mL of HNO3. Two runs were performed for each variant (in total 28 runs), as shown in Table 1, to generate a sufficient sample quantity for subsequent analysis. The mass loss through the HTT of each variant was expressed based on the mean value of both runs.
After the HTT process, 30 mL of double-distilled water was added, and the suspensions were first centrifuged at 30,000 rpm for 15 min and then separated into their liquid and solid components with the help of a water jet pump and filter paper. The solid components were dried as described in Section 2.2. For the gas chromatography-mass spectrometry (GC–MS) analysis, 10 mL of the process water was filled into sealed glass vessels, while the supernatant was stored in a frozen state at −18 °C.
For the evaluation of HTT, analysis of the mass loss through the treatment process itself as well as physicochemical analyses to describe changes in the material properties of the liquid and solid HTT products is necessary. For the solids, especially ash and elemental concentrations as well as calorific values (for the evaluation of energetic application in combustion processes) were selected. For the evaluation of the liquid HTT products, pH values and the determination of chemical compounds were chosen.
The generation of solid HTT products with reduced ash concentrations, less critical elements (e.g., with regard to ash melting) and higher calorific values while producing liquids with valuable elements and chemical compounds for material use would be in line with the aim of this study (creation of synergies).

2.4. C, H, N and O Concentration and Calorific Value Calculation

C, H and N concentrations were measured in an elemental analyzer (vario MACRO cube, elementar, Langenselbold, Germany) in three replicates per sample based on DM. Measurements were executed with 40 mgDM and 20 mgDM for untreated biomass and hydrothermally treated biomass, respectively, that were pressed into zinc-foil-coated tablets (DIN EN ISO 16948, 2015) [51]. All HTT samples were incinerated with WO3 at a ratio of 1:1 to ensure a complete combustion. Due to the measurement accuracy of C, H and N, the concentration of S was not measured simultaneously, but the results of the inductively coupled plasma-optical emission spectroscopy (ICP-OES) were used. Subsequently, the DM-based O concentration was calculated as presented in Formula (1).
O % = 100 % C % H % N % S % a s h %
The lower heating value (LHV) can be calculated based on the elemental composition. For this purpose, an approximation formula, Formula (2), according to Boie was used [52].
L H V D M = 34.8 C + 93.9 H + 10.5 S + 6.3 N 10.8 O
The corresponding correlation for the higher heating value (HHV) was derived from the following Formula (3) according to Friedl et al. [29].
H H V D M = 1.87 C 2 144 C 2820 H 63.8 C H + 129 N + 20147

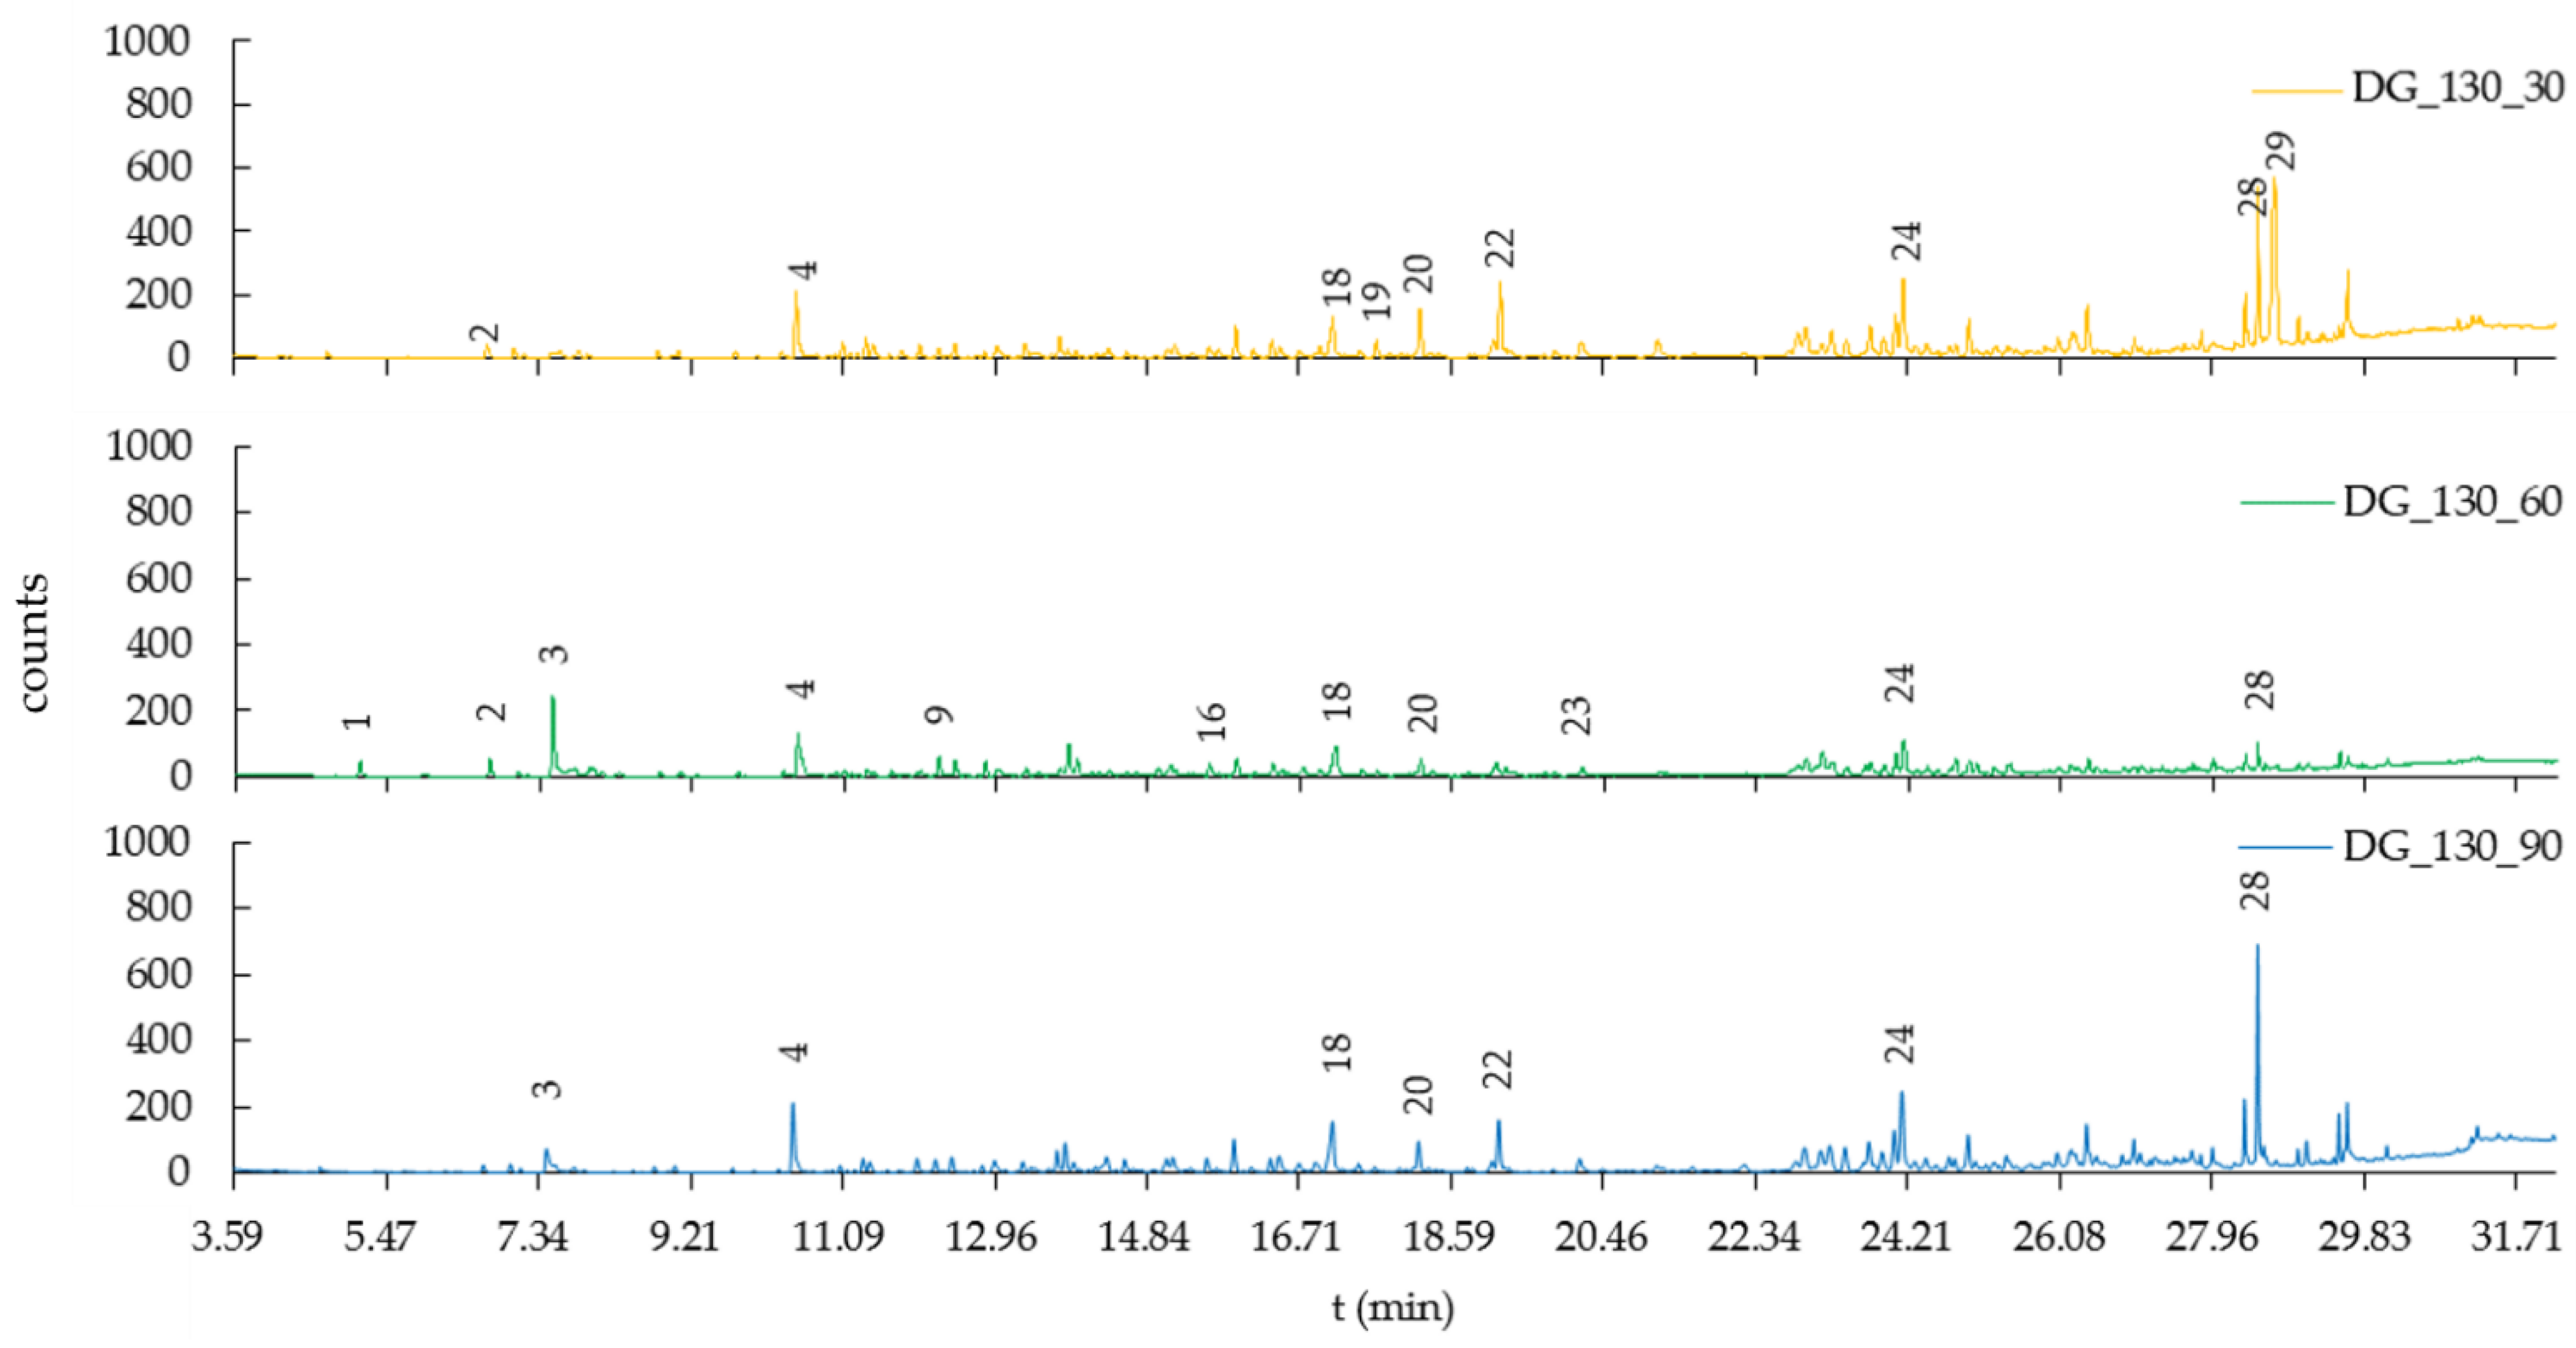
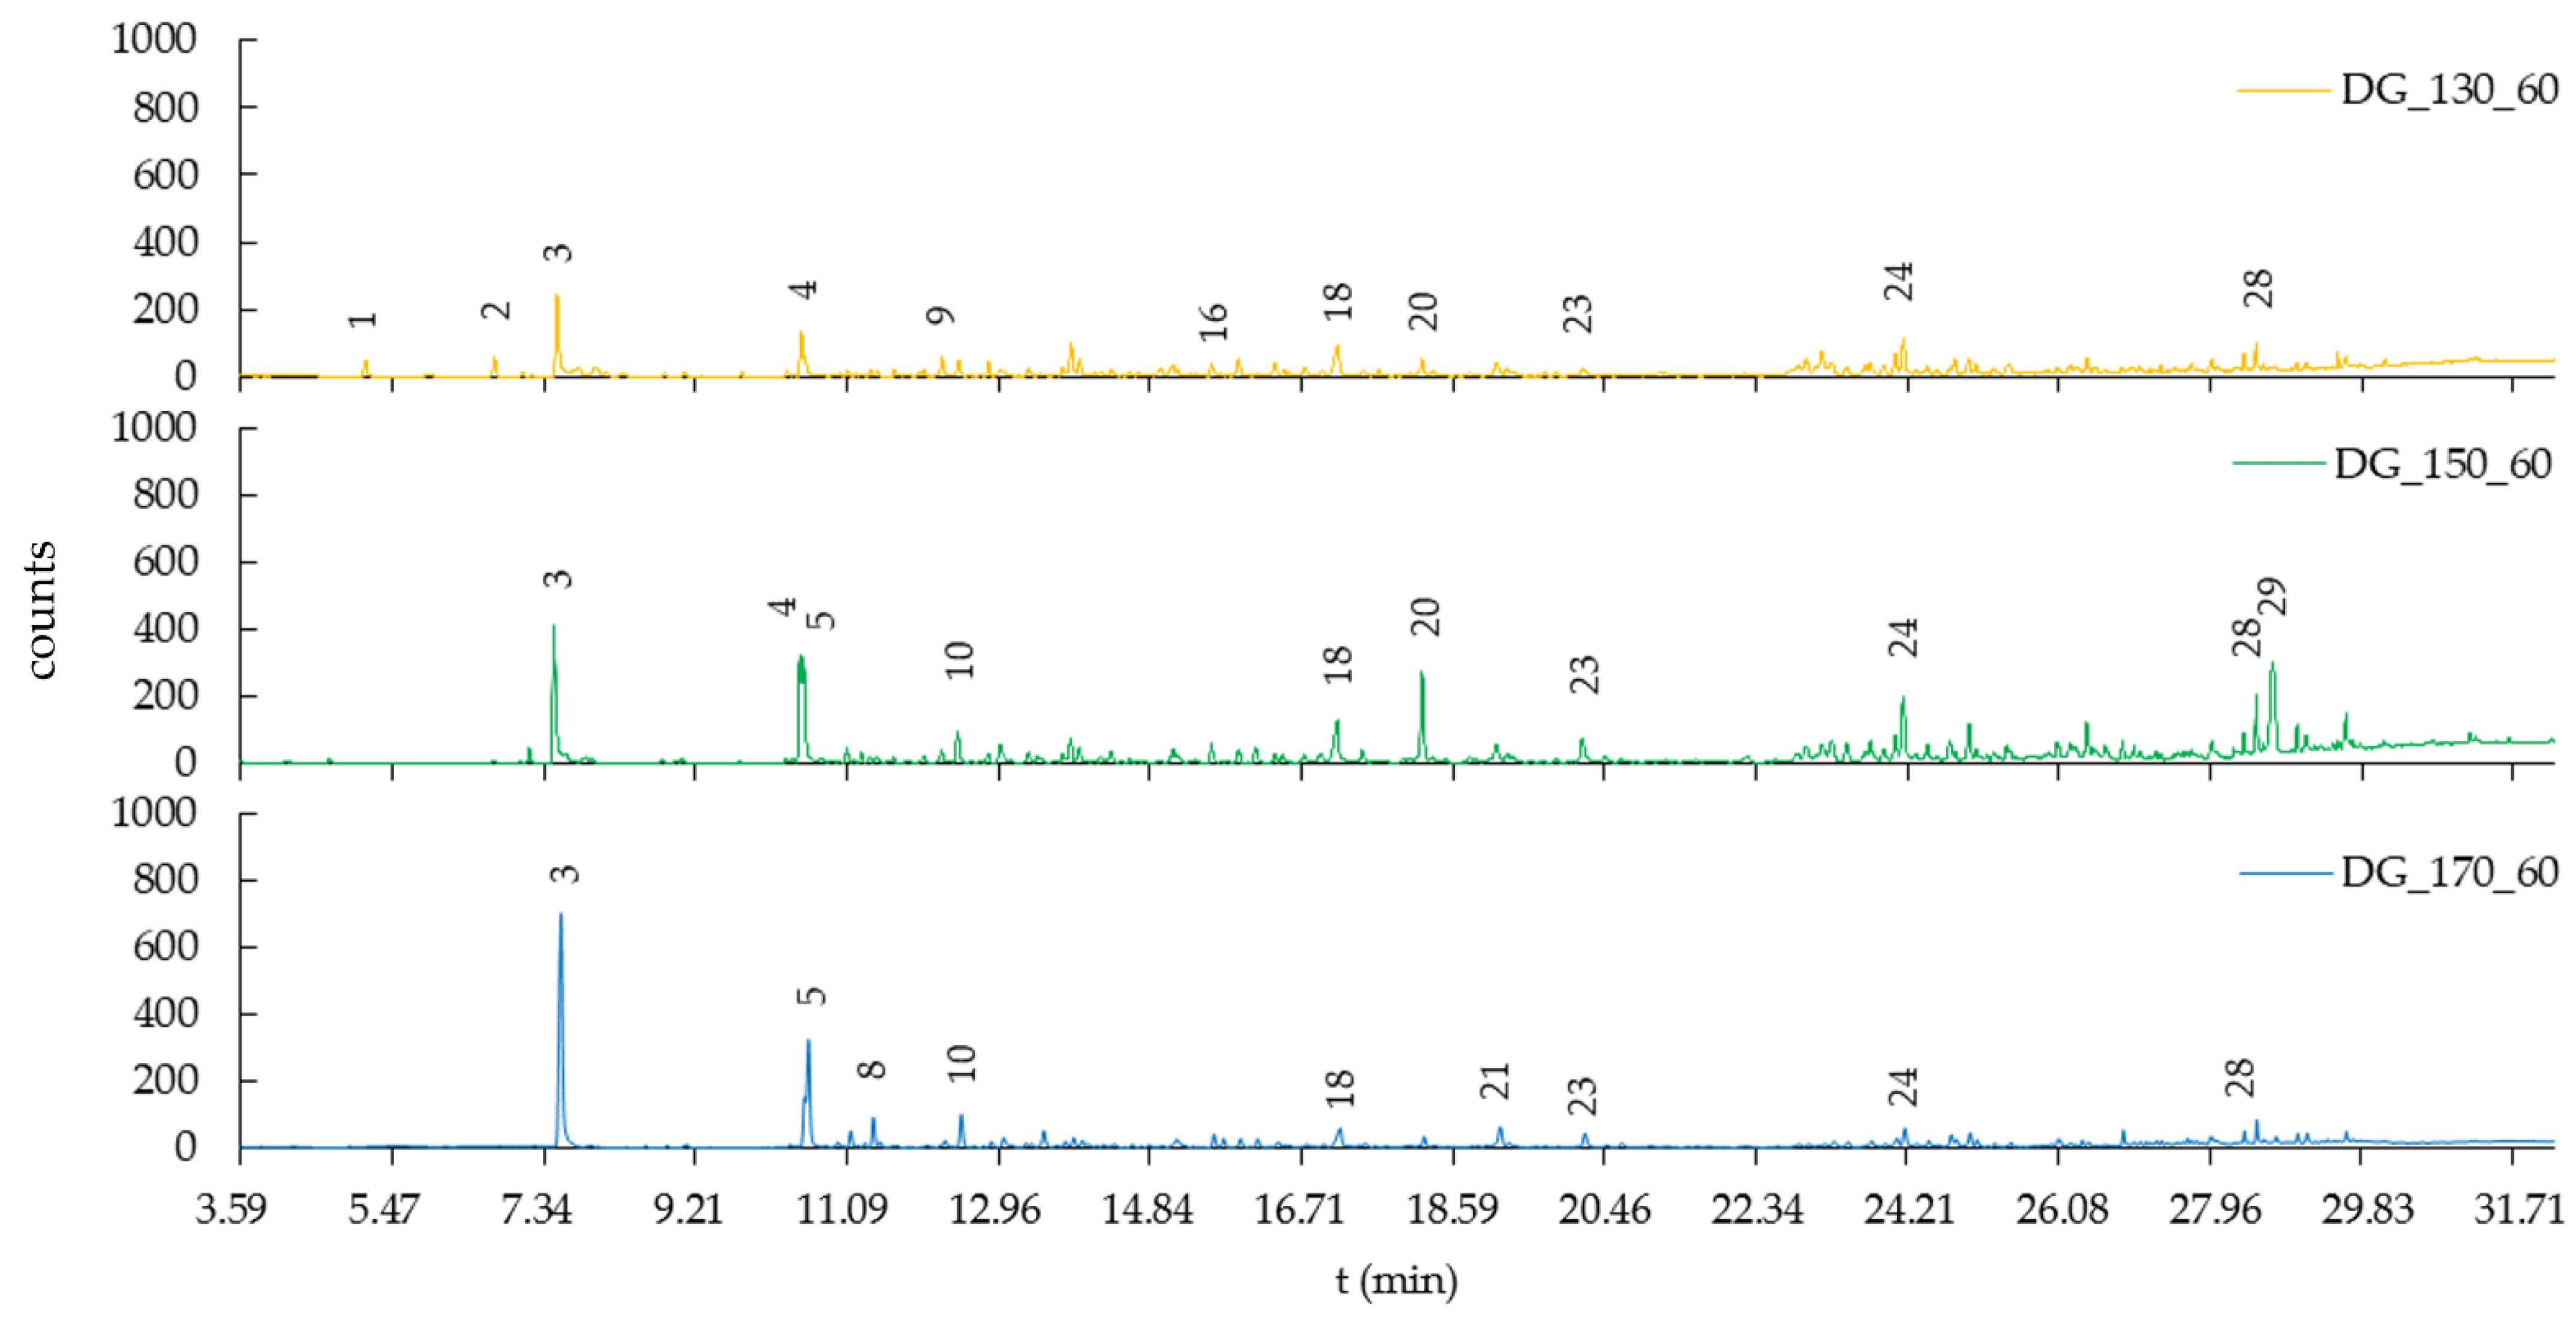
2.5. Gas Chromatography-Mass Spectrometry

In the first step, 10 mL of process water that was prepared in Section 2.3 was stirred with a polydimethylsiloxane (PDMS) Twister (Gerstel GmbH & Co. KG, Mühlheim a. d. R., Germany) for 90 min. After the addition of 20% NaCl, the blend was stirred for another 30 min. Afterwards, the PDMS Twister was removed from the vessel, dried, placed in a glass thermal desorption tube (4 mm in diameter and 187 mm in length) and measured via GC-MS. A thermal desorber 3.5+ system (Gerstel GmbH & Co. KG, Mühlheim a. d. R., Germany) was used for thermal desorption. The thermal desorption unit was mounted on an HP 7890B gas chromatograph coupled to a 5977B mass-selective detector (both Agilent Technologies, Santa Clara, CA, USA) with a cooled injection system (CIS 4) programmable temperature vaporizing (PTV) inlet. The PTV was programmed to inject the solutes, and the compounds were analyzed on a capillary column (HP-5MS with 30 m × 0.25 mm, 0.25 µm manufactured by Gerstel GmbH & Co. KG, Mühlheim a. d. R., Germany). As the carrier gas, He was used. The measuring method was programmed to hold 40 °C for two min, then heat up to 150 °C (with 6.88 °C/min). After a holding time of five min, another seven min of heating up to 300 °C (with 21.43 °C/min) followed. This temperature was held until the end of the analysis at minute 32.21.
The GC-MS results were evaluated on a qualitative basis, and only chemical compounds with a hit probability of >90% were listed in the chromatograms.

2.6. Inductively Coupled Plasma-Optical Emission Spectroscopy

Trace elements (TEs) were measured in three replications for each sample by ICP-OES (Spectroblue, Spectro Analytical Instruments GmbH, Kleve, Germany) according to standard procedures (DIN EN ISO 11885, 2009) [53]. After weighing 300 mgDM of the sample into each of the 50 mL PTFE reaction vessels, 1 mL of H2O2 was added with a reaction time of 5 min. Then, 1 mL of HNO3 (69%) supra quality (Merck, Darmstadt, Germany) and, after a short waiting time, a further 2 mL of HNO3 were added. After 30 min, 3 mL of HCL supra quality (35%) (Roth, Karlsruhe, Germany) was added. Then, the containers were closed and left for 12 h before adding another 6 mL of HCL. Afterwards, the digestion was carried out using a microwave (Multiwave Go, Anton Paar GmbH, Graz, Austria) at 175 °C with a heating ramp of 7.75 °C × min−1 and a holding time of 30 min. Afterwards, the vessels were heated to 185 °C with an additional holding time of 5 min. The residues were placed into laboratory tubes and filled up to 50 mL with double-distilled water, before being filtered and measured. Detection limits for all TEs were 0.0001 ppm, except for B (0.0112 ppm), K (0.0997 ppm), P (0.0014 ppm), Si (0.0235 ppm), S (0.0011 ppm), Se and Tl (0.001 ppm). Since all values below the detection limits were equated with these limits, some of these values might be slightly overestimated compared to the actual values. In total, 31 TEs were measured by ICP-OES (Al, Ag, As, B, Ba, Be, Bi, Ca, Cd, Co, Cr, Cu, Fe, K, Li, Mg, Mn, Mo, Na, Ni, Pb, Sb, Se, Sr, Ti, Tl, V, Zn, Si, P and S). Since Si is not completely digestible in aqua regia, the measured concentrations have to be considered as partial concentrations.

2.7. pH Value of the Process Water and Severity Factor

The frozen process water was thawed, and, subsequently, the pH values were determined using a pH meter (WTW pH 3310, Zeller, Hohenems, Austria). Further, the severity factor (SF) according to Overend et al. [54] was used to classify and evaluate the severity of the HTT process. The logarithm of the reaction ordinate (log R0) was defined as the severity of the HTT process (4).
R 0 = t   [ min ]     e x p ( T   [ ° C ] 100 ) / 14.75 )

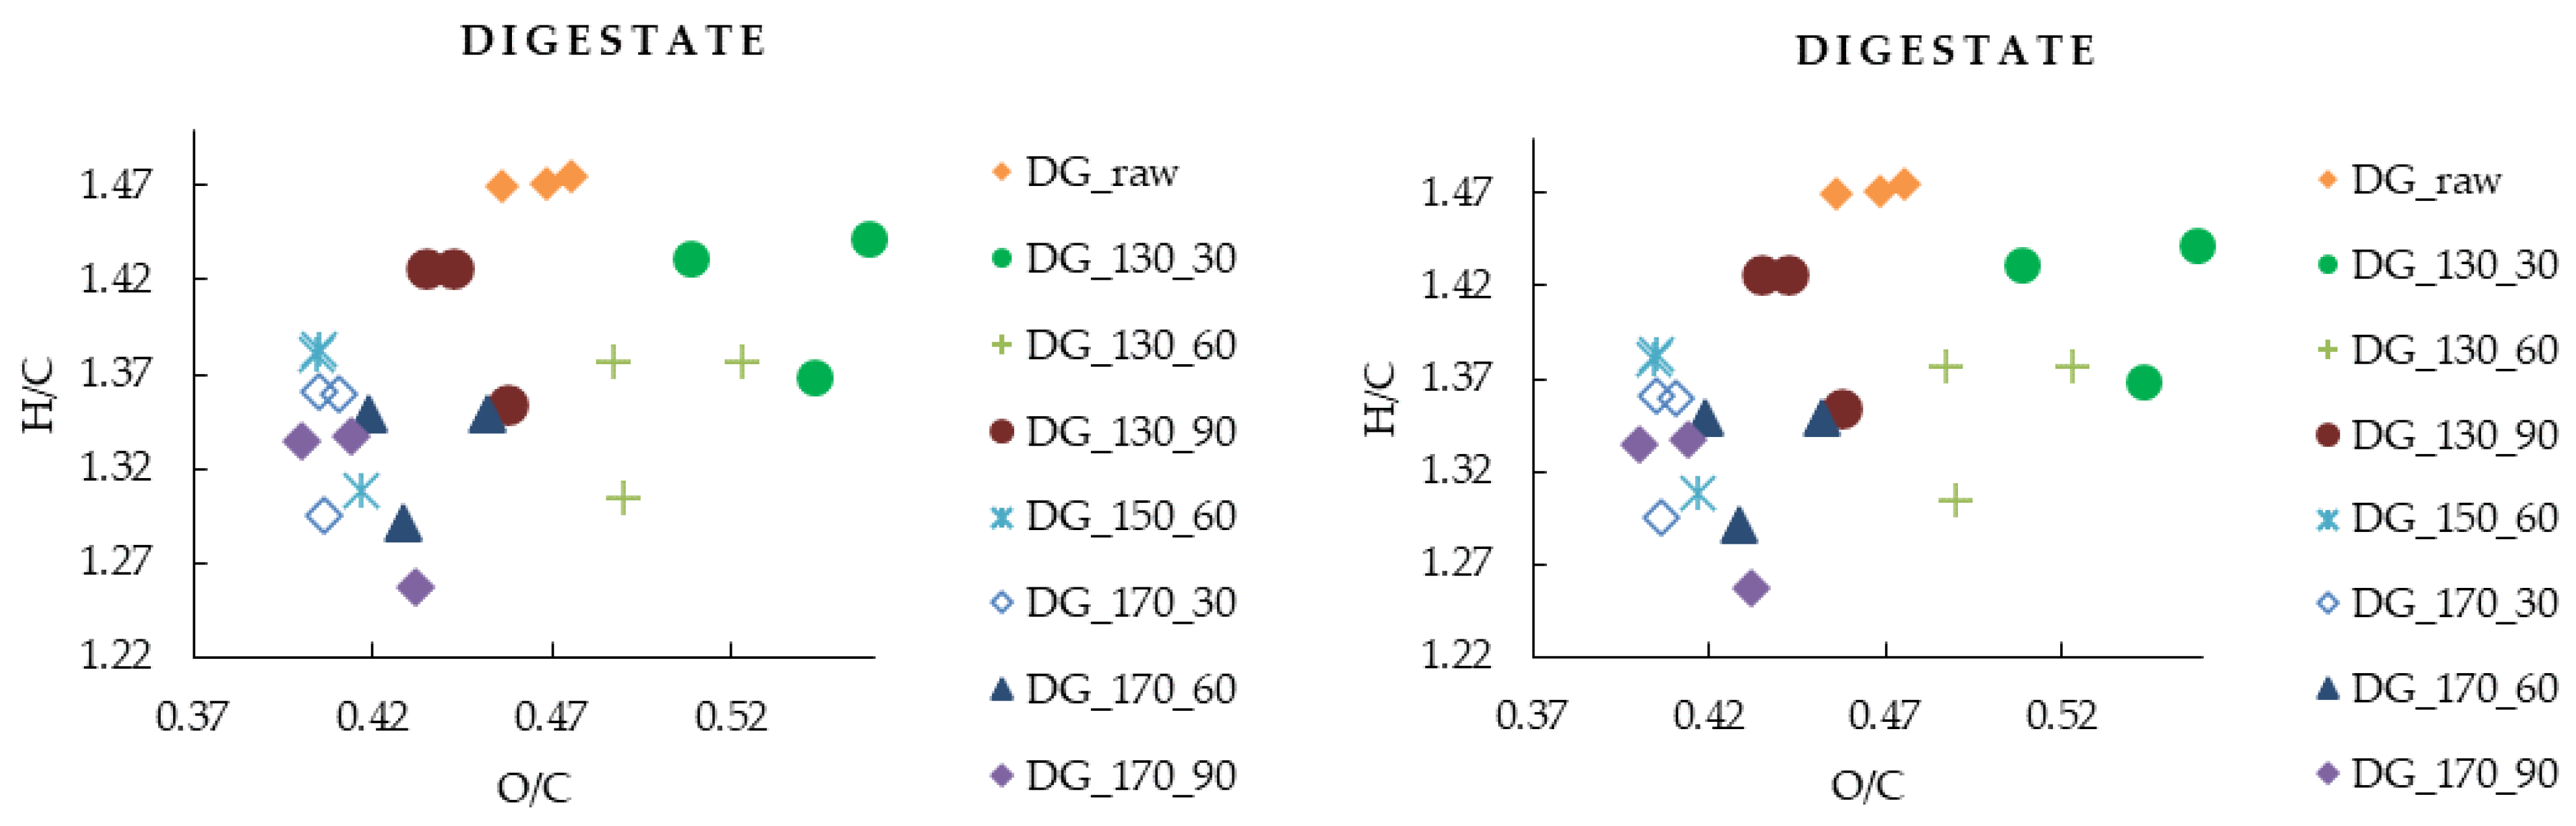
3. Results and Discussion

The HTT of DG and different forestry materials has been analyzed in several other studies, but higher temperatures and increased holding times were applied [22,44,45,55,56]. In this study, the influence of the temperature and holding time on the characteristics of the solids and liquids at low temperatures (starting at 130 °C) to near-HTC conditions (170 °C) was investigated. Since the highest temperature as applied in this study is not within the typical range of HTC temperatures, the solids produced were not defined as hydrochars, but as HTT solids or DG and FR solids.

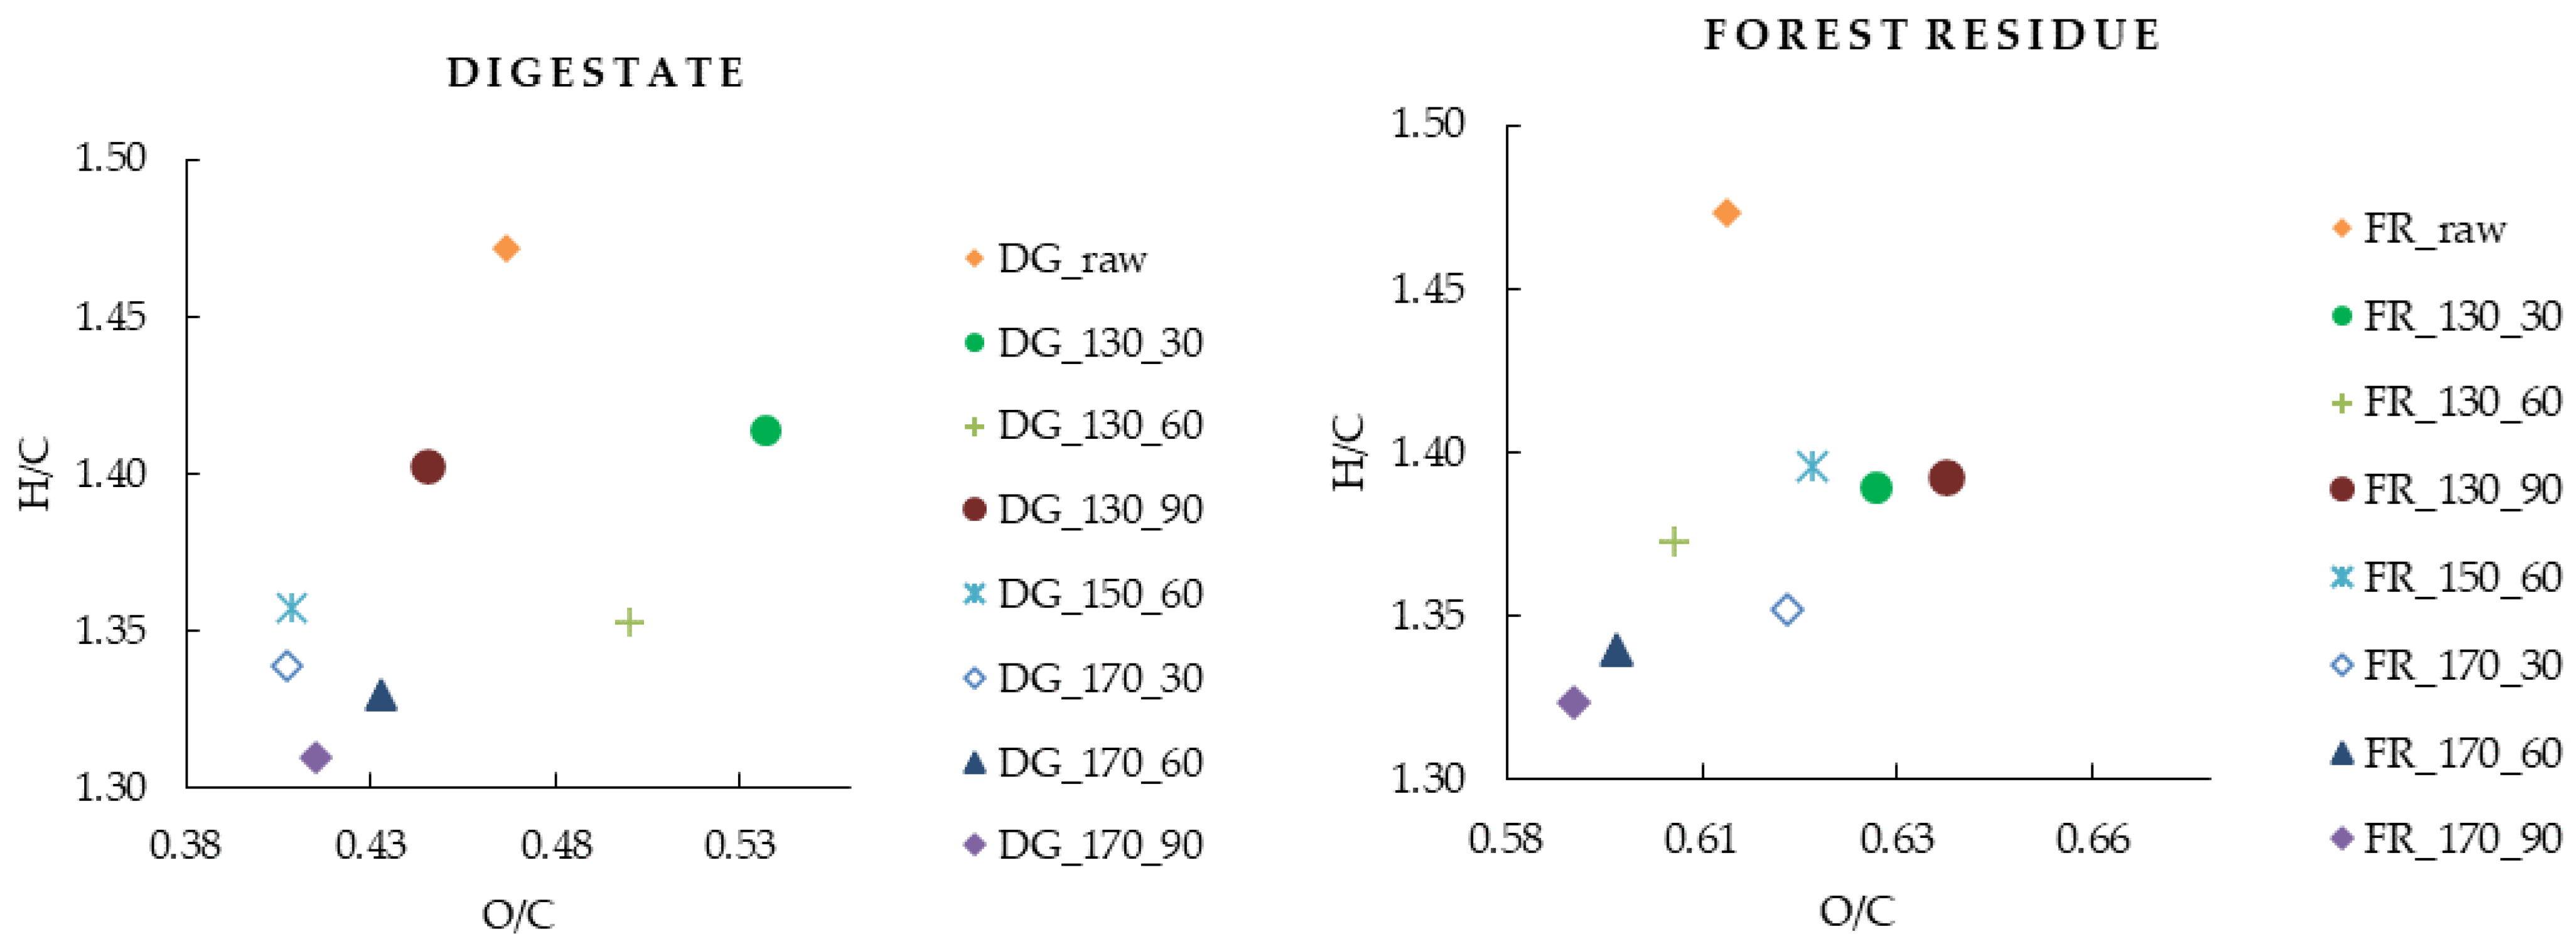
3.1. Basic Characteristics of Raw Biomasses and Hydrothermally Treated Solids

The material properties of the raw and hydrothermally treated DG and FR are shown in Table 2, Table 3 and Table 4. Mass losses and the associated ash concentrations are often critical factors in the HTC of waste or residual materials since the C concentration can even decrease as a result of C losses through transfer into the liquid and gaseous phases [57]. The SF in Table 2 indicates that no drastic increase in the energy density can be expected. As Hoekman et al. [58] stated, hardly any energy densification occurs at SF < 4, but it strongly occurs at an SF between 5 and 6. Experiments carried out with pine at an SF between 5.5 (175 °C/30 min) and 6.1 (255 °C/30 min), for example, showed an increase in the HHV of up to 8 MJ/kgDM, while at SF 3.7 (175 °C/30 min) and 4.4 (200 °C/30 min), the HHV only increased by 1.55 MJ/kgDM. In the case of DG, however, an increase in the C concentration from 40.66 to 51.53%DM was observed, with mass losses between 26 and 40%DM (with SF ≤ 4). In contrast, there was no clear change in the C concentration for FR solids, with mass losses ranging from 26 to 44%DM. As seen in numerous other studies, the loss of mass with increasing HTT intensity is accompanied by a lower solid yield [25,43,44]. The ash concentration of the DG solids was reduced by HTT from more than 26%DM to about 9%DM. While Cao et al. (170 °C/120 min) [44] and Garlapalli et al. (180 °C/60 min) [59] reported only slight reductions in the ash concentration of around 1%DM, the ash concentration in this work (at 170 °C with a holding time of 90 min) was reduced from more than 26%DM to less than 15%DM. This strong deviation can possibly be explained by the lower biomass-to-water ratio with only 5%DM (in this study) compared to 12.5%DM and 15%DM in the above studies, respectively, resulting in greater amounts of ash-forming elements being transferred into the liquid phase. The observation that the ash concentration increases with rising temperatures can be confirmed even though the ash concentration of the DG solids was still noticeably lower than that of the raw material. The ash concentration of FR was already less than 1%DM in the raw material and remained largely unchanged throughout the experimental series.
A van Krevelen diagram (Figure 1) is often used to illustrate HTC mechanisms, especially those of dehydration and decarboxylation, which carbonize biomass considerably by lowering the H/C and O/C ratios [22,60]. Other studies by Parshetti et al. [61] and Funke and Ziegler [22] found that the molar H/C and O/C ratios decreased steadily with increasing temperature. For both DG and FR, the lowest O/C ratios were found at 170 °C with 0.41 and 0.59, respectively. The O/C ratio of the DG HTT solids decreased compared to the raw material, except for the variants at 130 °C/30 min and 130 °C/60 min. In the case of the FR solids, the O/C ratio decreased only in three setups. Overall, neither the C concentration nor the O concentration of the FR solids seemed to change noticeably due to the low-temperature HTT. Furthermore, a higher O concentration was observed in all DG solids compared to the raw biomass. Since the O concentration (Formula (1)) also depends on the ash concentration, the cause could also have been the decrease in ash concentrations. However, the severity of the HTT process used in this work was probably too low for DG solids and especially for FR solids since softwood is reported to be more resistant to hydrolysis (compared to hardwood) [62]. The large spread of each single measurement of the produced solids compared to the raw materials (see Appendix A) indicates an increased inhomogeneity of the HTT solids compared to the raw materials. Overall, DG seems to be more sensitive to HTT at a mild severity (Table 2). This is in line with Falco et al. [63], who supposed that the presence of hemicellulose and xylose-based polysaccharides may allow HTC at a lower temperature range, whereas lignin acts as a support within the plant wall and stabilizes cellulose.
The H/C ratio of all setups was lower than for the raw material and reached the lowest values for both the DG and FR solids at 170 °C, with 1.31 and 1.32, respectively. While the H concentration of the DG solids was consistently above that of the raw material, the H concentrations of the FR solids were consistently slightly below those of the raw material.
The highest LHV and HHV for DG (Table 3) were found at 150 °C and 60 min, with 20.3 and 20.6 MJ/kgDM, respectively. For FR (Table 4), the largest LHV was reached for the raw material (probably due to the higher H concentration) with 19.23 MJ/kgDM, while the largest HHV was 20.63 MJ/kgDM at 170 °C and 90 min. According to Formula (2), this was caused by higher H concentrations that led to a higher LHV, whereas for the HHV (Formula (3)), a higher H concentration led to a lower calorific value. Overall, the HHV of the DG solids increased by more than 4 MJ/kgDM, while that of the FR solids remained largely unchanged. In order to be able to evaluate the suitability of HTT solids as a solid fuel, limit values (Appendix A) of the withdrawn prEN ISO 17225-8:2016 [64] standard can be used.
In the standard (Appendix A), requirements for classified pellets of thermally treated non-woody biomasses such as aquatic biomasses are listed. The maximum permissible ash concentration and minimum requirements for the LHV are set at 5%DM and 18 MJ/kg for class “TA1” and at 10%DM and 17 MJ/kg for class “TA2”. While the FR complied with these limits (both in the raw state and after HTT), the DG only partially met them (Table 3 and Table 4). In the raw state, the ash concentration of 26.67%DM was above the limit value, while the LHV of 16.31 MJ/kg was slightly below the limit value. However, hydrothermally treated DG at 130 °C for 30, 60 and 90 min fulfilled the specified requirements for the LHV and ash concentration. At 150 °C and 170 °C, the ash concentration exceeded the limit value, making the HTT of DG at more than 130 °C less beneficial for pellet production. In addition to the ash concentration and LHV, limit values of N, S, As, Cd, Cr, Cu, Pb, N and Zn are also specified in the standard (Appendix A). The FR solids were within all concentration limits except for the Pb concentration, although it could be possible that the Pb concentrations were caused through processing (e.g., through abrasion in forestry machinery in the case of FR). In comparison, several limit value violations occurred for the DG solids. N and Cu concentrations were exceeded for all solids, while requirements for Ni were only met at 130 °C. The S concentration in the raw DG was above the maximum limit but can be fulfilled through HTT. The Cl concentration was not measured for the HTT solids in this study but could be measured in further research as Cl is relevant for the evaluation of combustion processes. The concentrations of some TEs increased with the treatment temperatures. Thus, the application of higher HTT temperatures could also be disadvantageous. Depending on the feedstock and designated application, HTT temperatures could be adjusted (heightened or lowered) to generate products with the most beneficial characteristics.

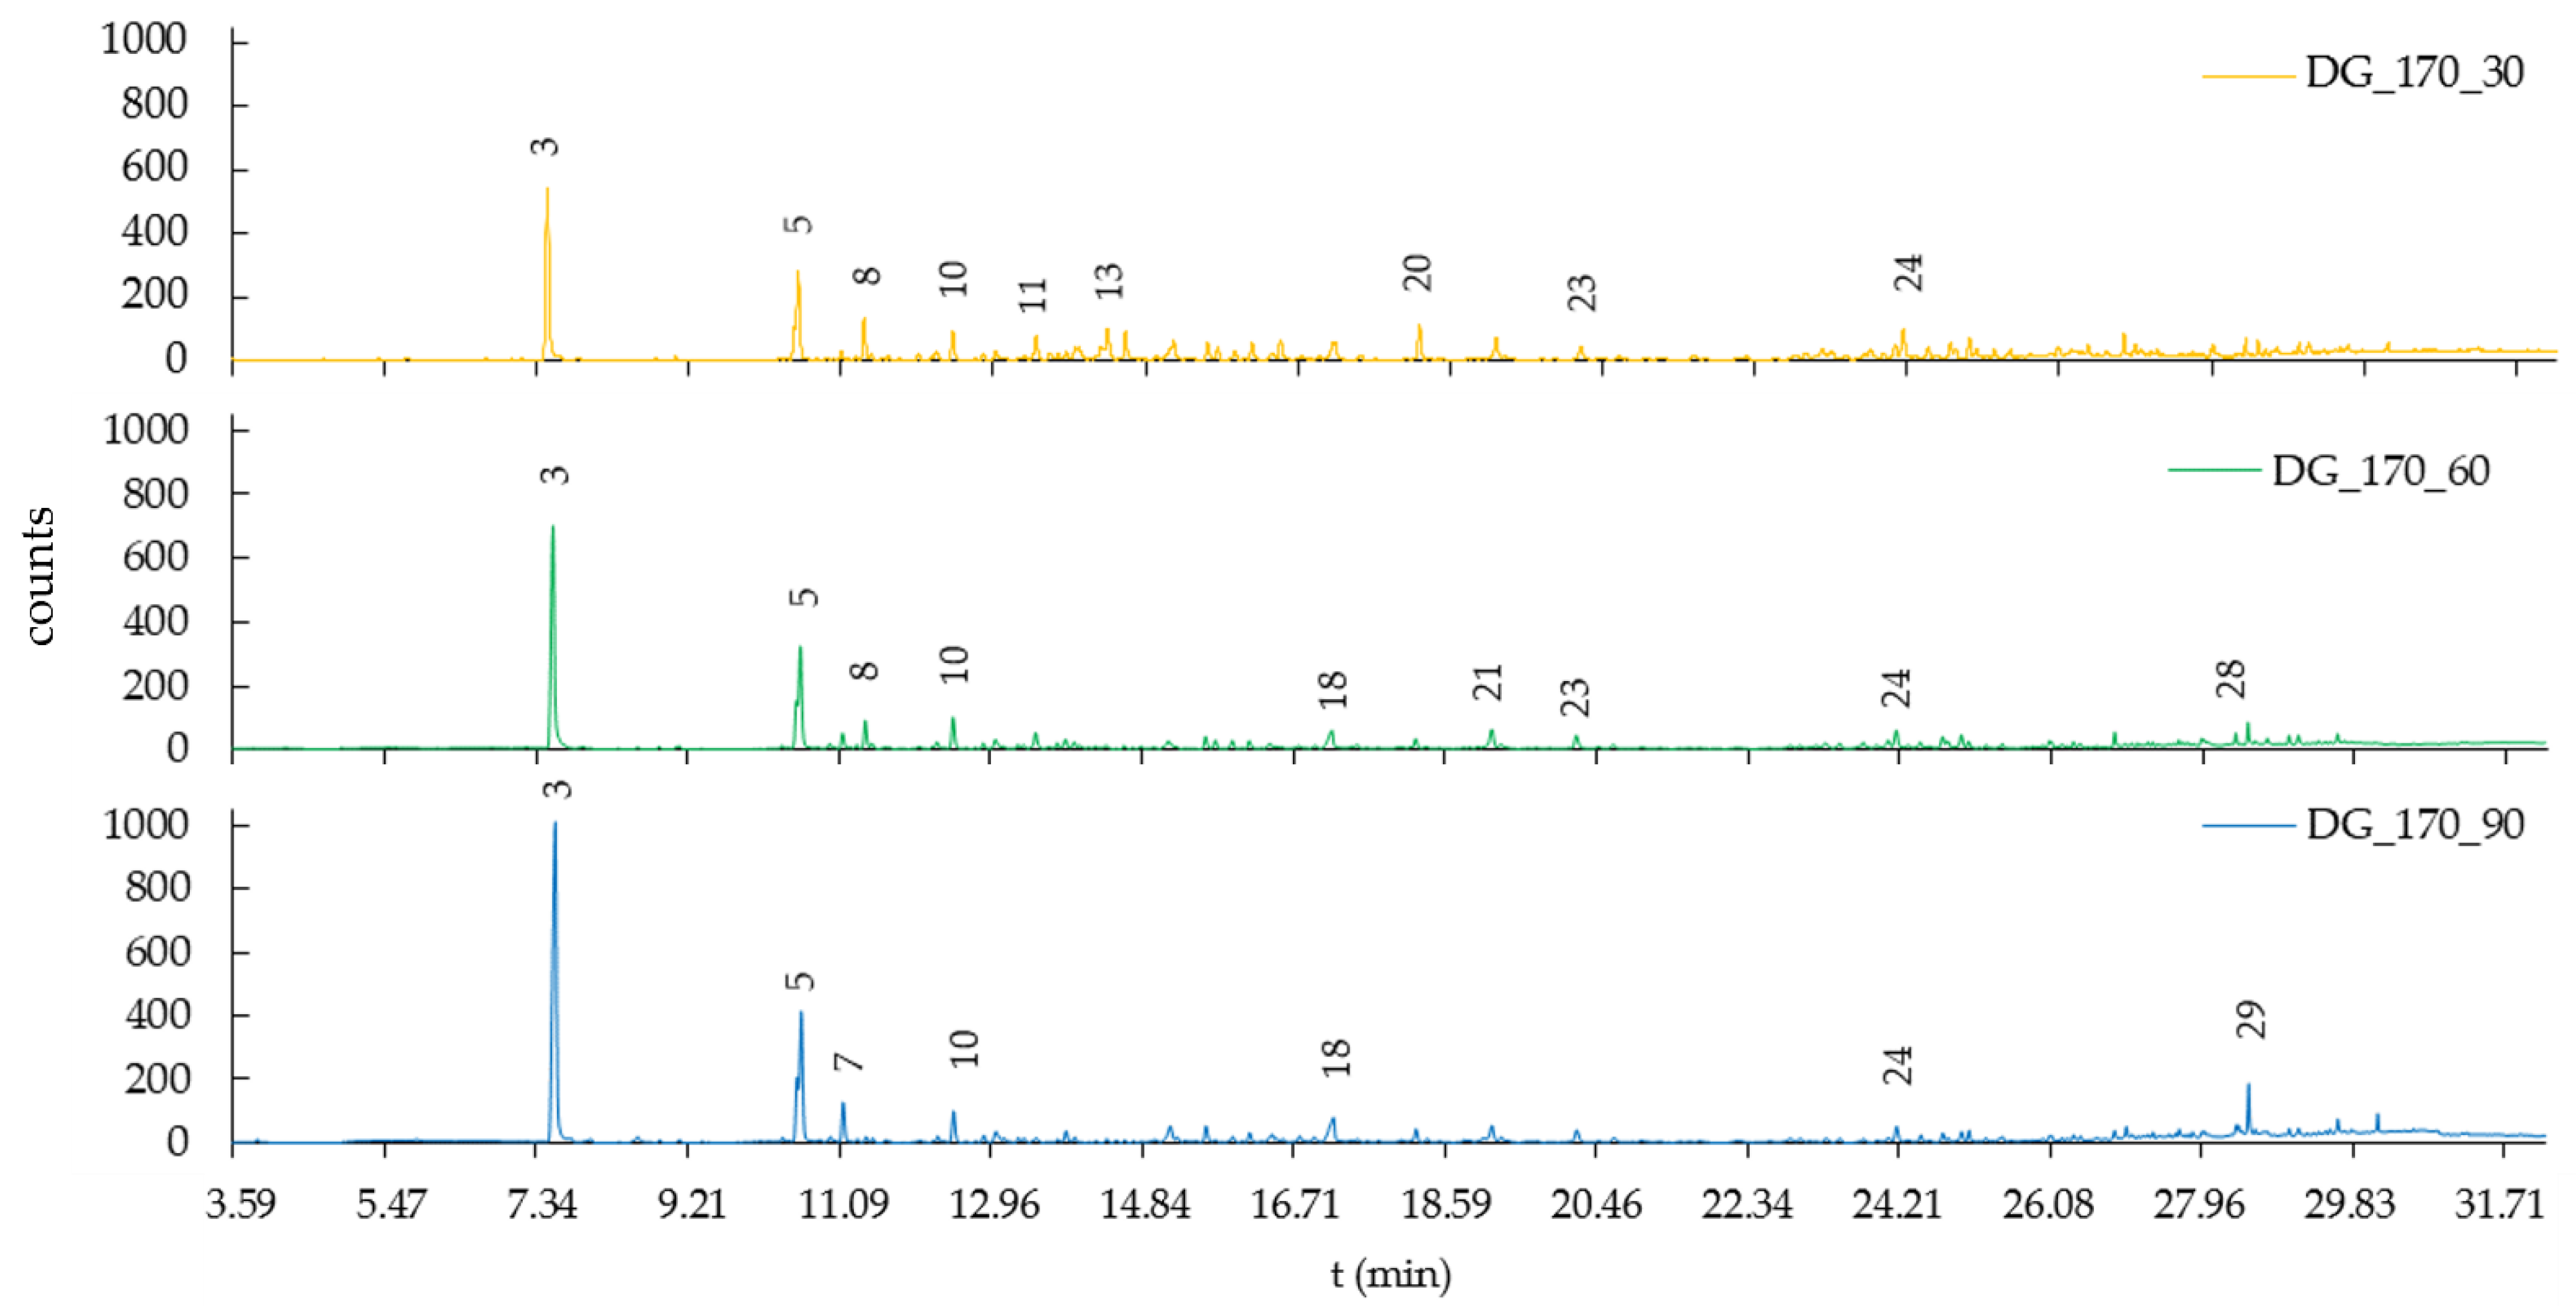
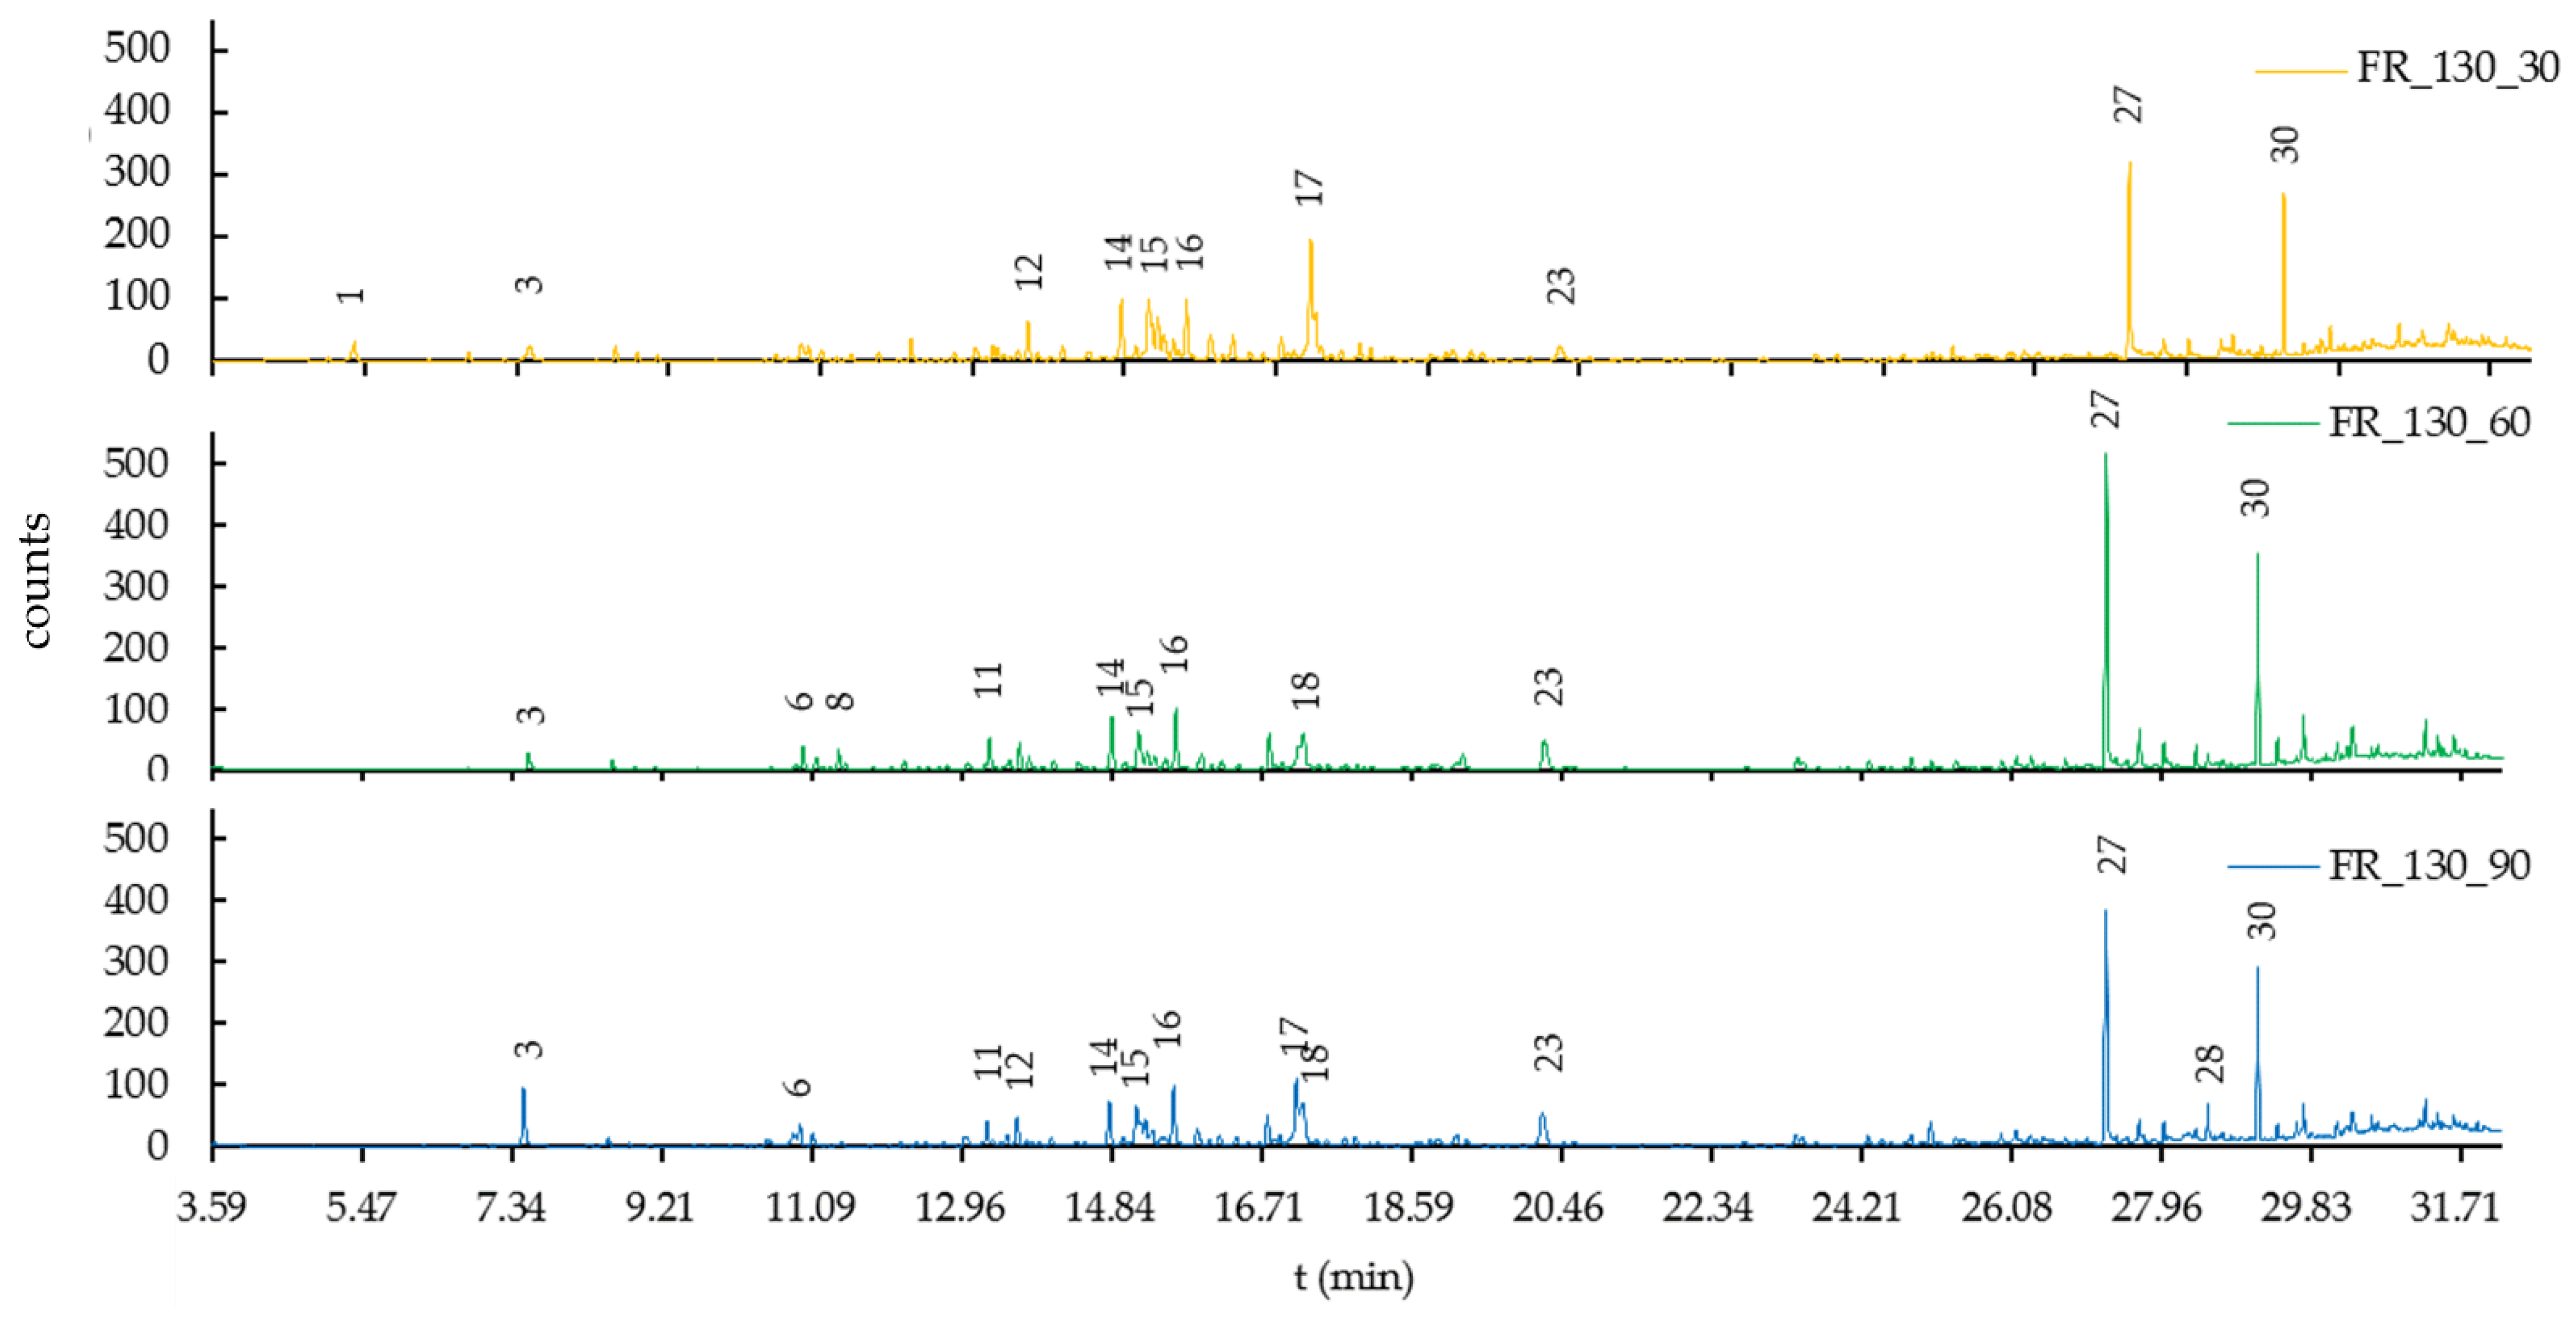
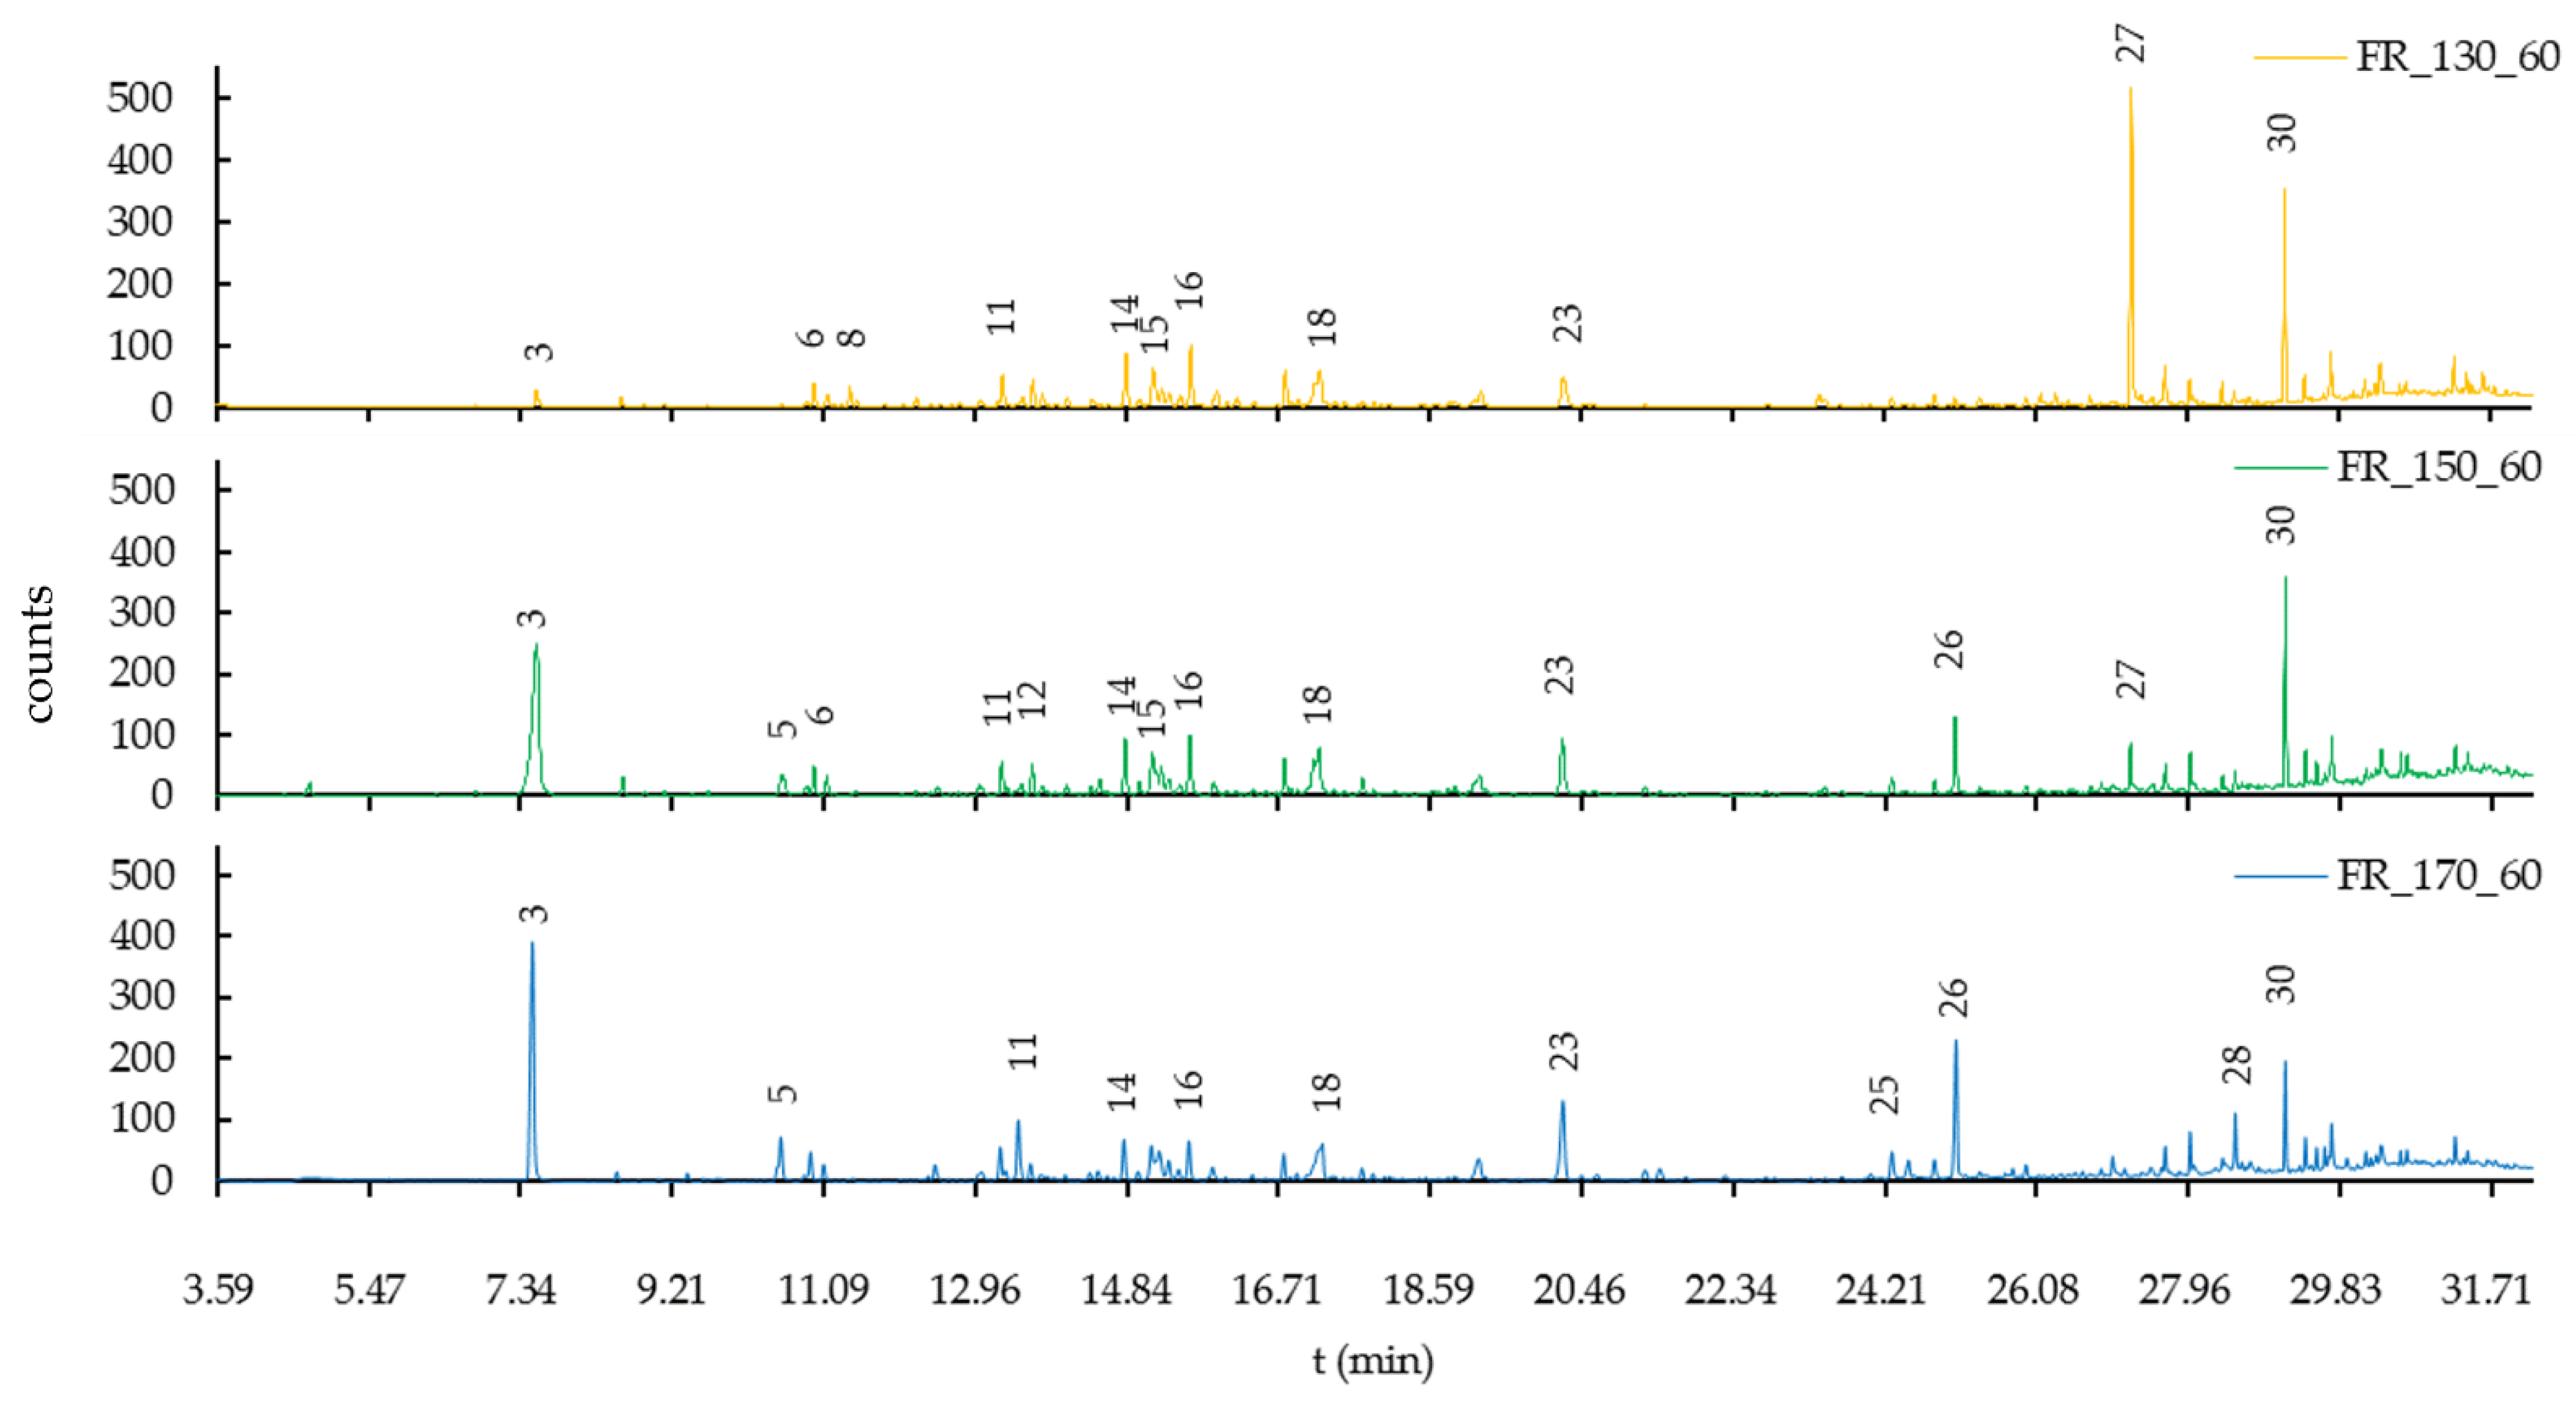
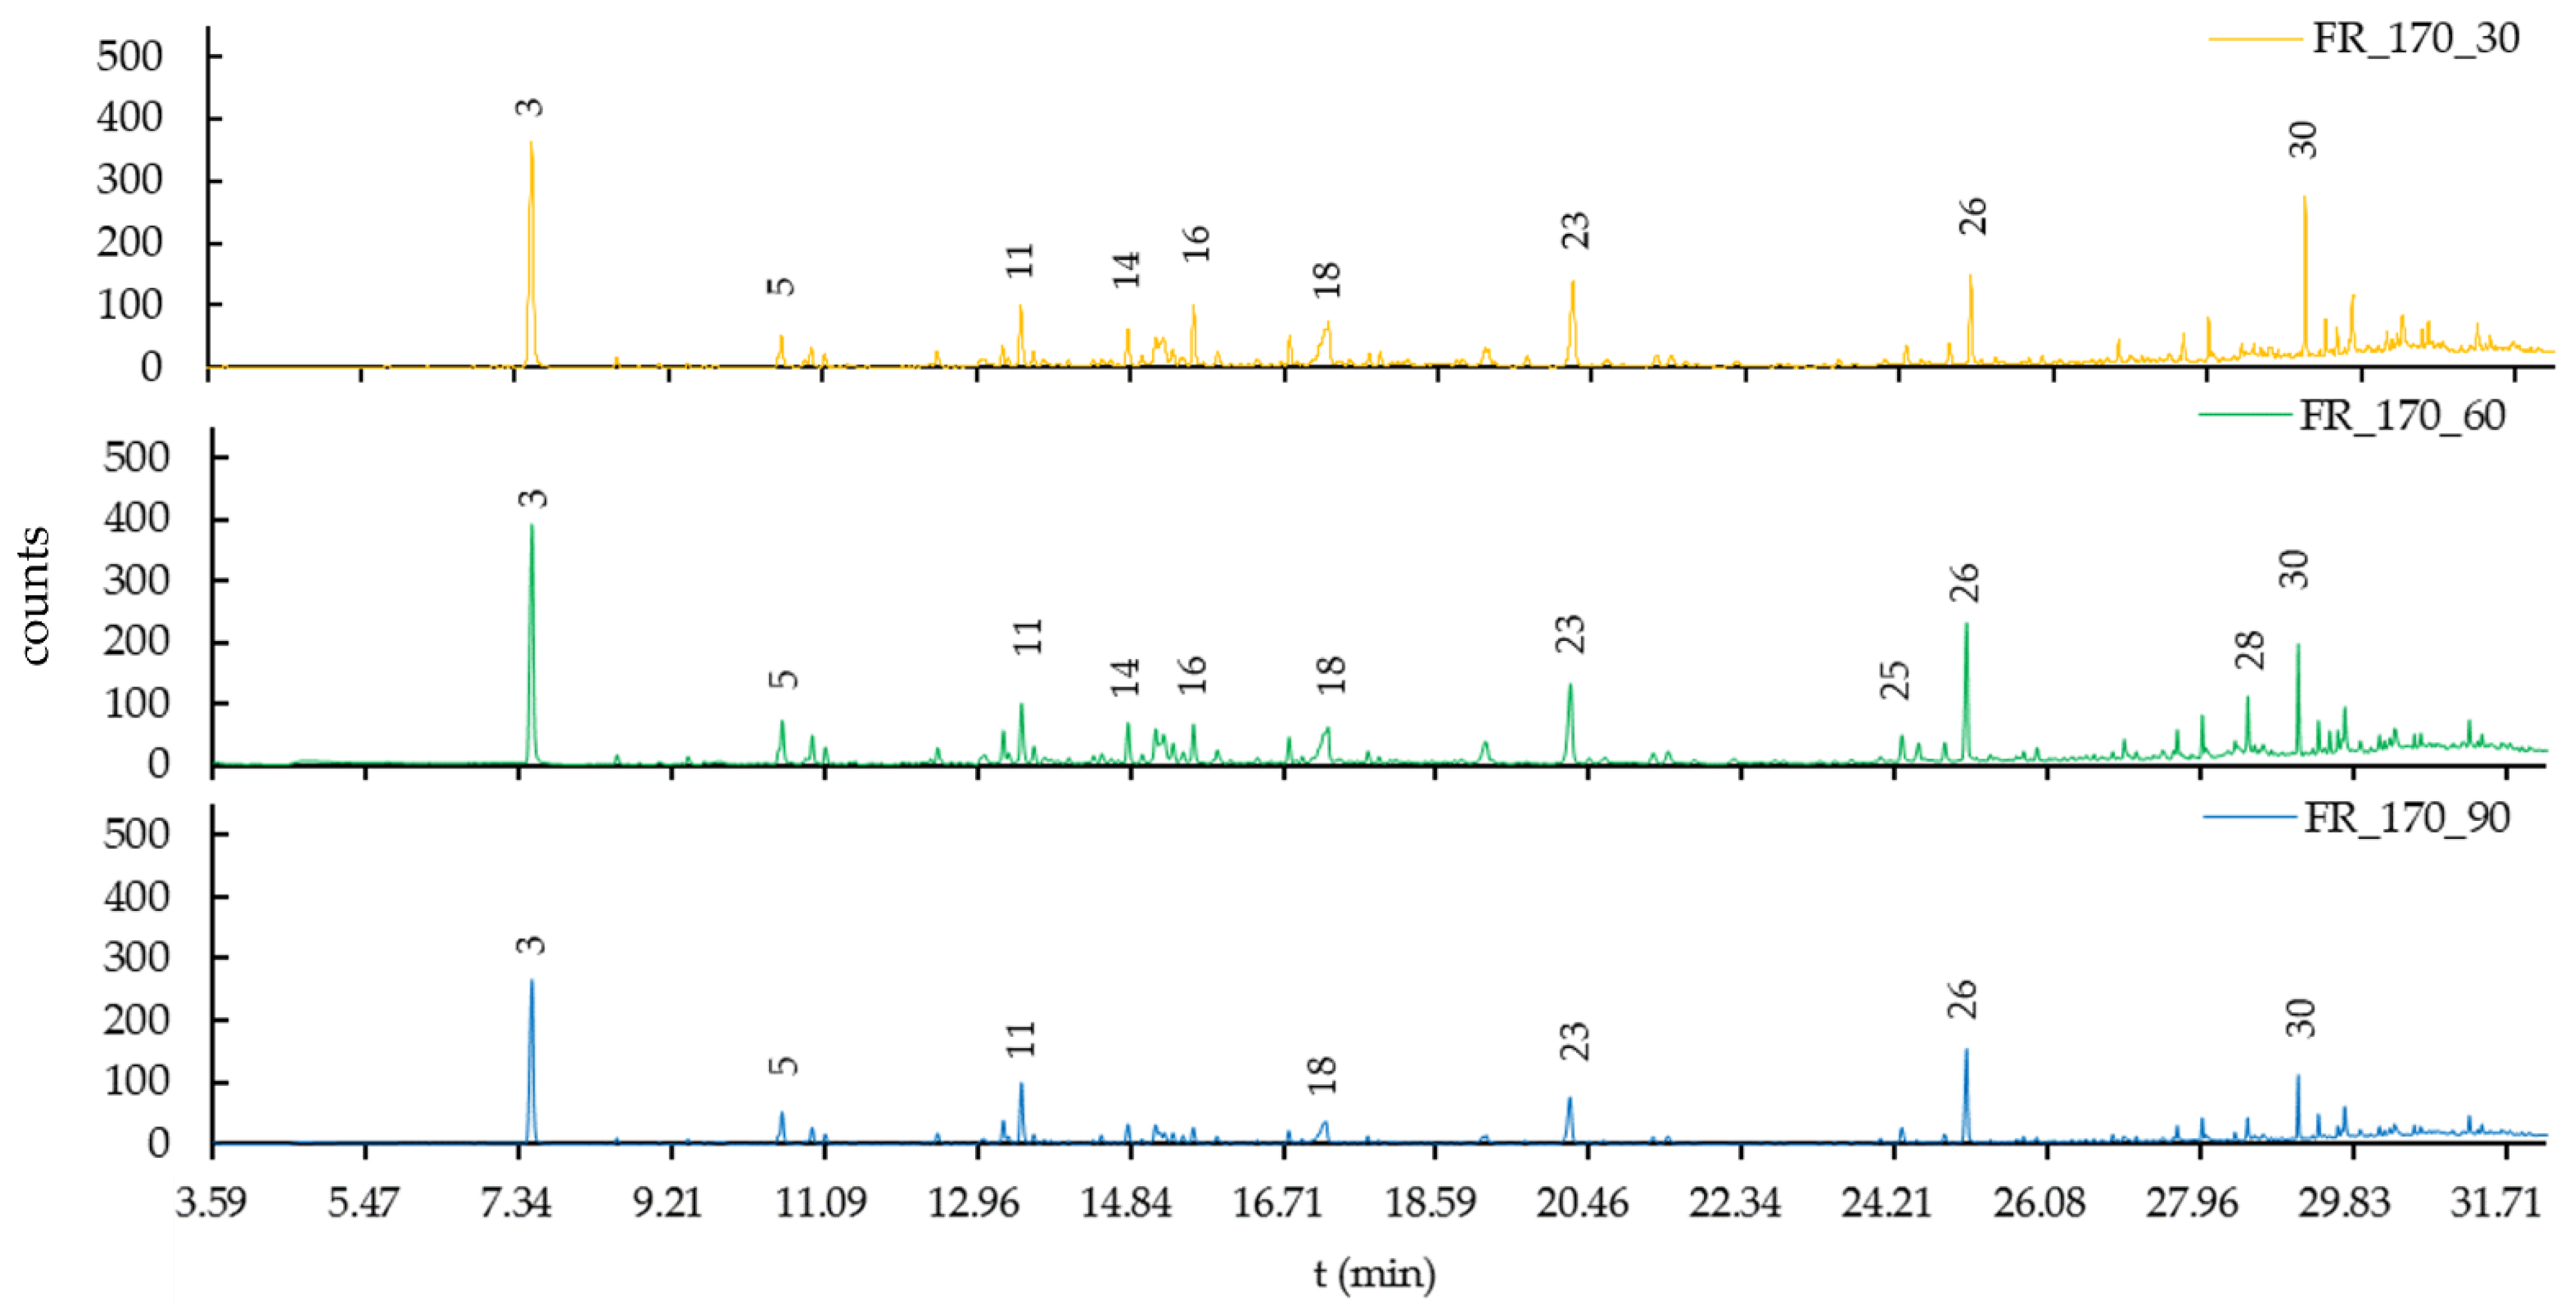
3.2. Characteristics of Liquid Products from Hydrothermal Treatment

Contrary observations can be made regarding the pH value of the DG and FR liquids (Table 5). In this case, however, the addition of a total of 1.2 mL of HNO3 to 120 mL of demineralized water has to be considered. While the pH value of the DG liquids decreased with increasing temperature and holding time, that of the FR liquids increased instead. The reason for this could likely be that HTT dissolved organic and inorganic components from the wood, which raised the pH value. Wood as untreated biomass already has an acidic pH value, which is presumably further reduced by the addition of an acid, whereas DG HTT liquids tend to be in the slightly acidic to neutral range due to the buffering components. In the literature, pH values in the range of 7.3 to 9.0 are found for DG, and values between 4.0 and 5.5 are found for most wood species [11,65].
The GC-MS spectra of the organic by-products from the HTT reactions of DG and FR at the temperature settings of 130, 150 and 170 °C and the holding times of 30, 60 and 90 min are shown in Figure 2, Figure 3, Figure 4, Figure 5, Figure 6 and Figure 7. Although more components could have been detected, only higher peaks with approximately >100 counts are shown in Figure 2, Figure 3, Figure 4, Figure 5, Figure 6 and Figure 7 and are referred to in the following as higher counts. The composition of HTC liquids consists of a wide range of phenols, alkanes, aromatic hydrocarbons and compounds such as alcohols, ketones, acids and esters [66]. Some of these compounds are classified by Werpy and Petersen [67] and Bozell and Petersen [68] as top value-added chemicals. In the analyzed process waters, compounds from the substance groups of long-chain fatty acids, short-chain fatty acids, heterocyclic aldehydes, phenols and others were found (Table 6).
Furfural is a result of the degradation of hemicellulose; therefore, the peaks and counts become higher with increasing SF. Due to the low pH value of FR liquids, it should be noted that furfural is not stable under acidic conditions (Table 5) and can react into other compounds [69]. An increase in counts (Figure 5, Figure 6 and Figure 7) can be observed with increasing pH values, and they reached a maximum between SF 3.3 and 4.0. Jeder [70] found the highest furfural yields at moderate temperatures of 180 and 190 °C with holding times of 4–6 h.
In the liquids of DG, noticeably higher counts of furfural were observed compared to those of FR. While higher counts for furfural, 5-methylfurfural (5MF) and benzaldehydes were observed for the DG liquids (Figure 2, Figure 3 and Figure 4) in the range between 3.59 and 12.96 min (retention time), furfural was the only compound detected with higher counts in this range in the FR liquids (Figure 5, Figure 6 and Figure 7). In the retention time range of 12.96 to 22.33 min, higher counts of nonanoic acid, 2-methoxyl-4-vinylphenol (or phenol,5-ethyl-,2-methoxy or 4-hydroxy-2-methylacetophenone) and ethanol, 2-(2-butoxy-ethoxy)-acetate were found in the DG liquids. In the FR liquids, higher counts of vanillin and carvenone were detected. In the last section, from retentions times of 22.34 to 31.71 min, 2-(4H)-benzofuranone,5,6,7,7a-tetrahydro-4,4,7a-trimethyl-,(R)-, squalene and n-hexadecanoic acid were found in the DG liquids, and higher counts of butyrovanillone, phenol,2-4,dinitro-6-methoxy, n-hexadecanoic acid and naphthol were found in the FR liquids. 5-MF, which is produced from hemicellulose or formed by catalyzed reactions from cellulose or secondary reactions with 5-HMF as an educt, was detected in both the DG and FR liquids [71,72,73]. However, 5-HMF, which has increasingly been the subject of scientific work in recent years, was not detected in any of the liquids presumably due to the low SF of the HTT process, indicating the origin of 5MF is from the catalyzed reaction of cellulose or hemicellulose. Among other applications, 5MF is being researched in the cosmetics industry as an ingredient in deodorants targeting malodor-causing bacteria [74]. In order to find other applications for HTT fluids besides the use in AD, and in the recovery of elements and chemical compounds, further process water analyses such as total organic carbon, biochemical oxygen demand and chemical oxygen demand should be carried out. For all HTT experiments, dry material of DG and FR was used. This is a limitation of this study as it can be expected that the drying process (at 105 °C) of the raw materials before HTT reduces the chemical compounds that can be detected via GC-MS. Thus, in further research, fresh FR and DG could be used.

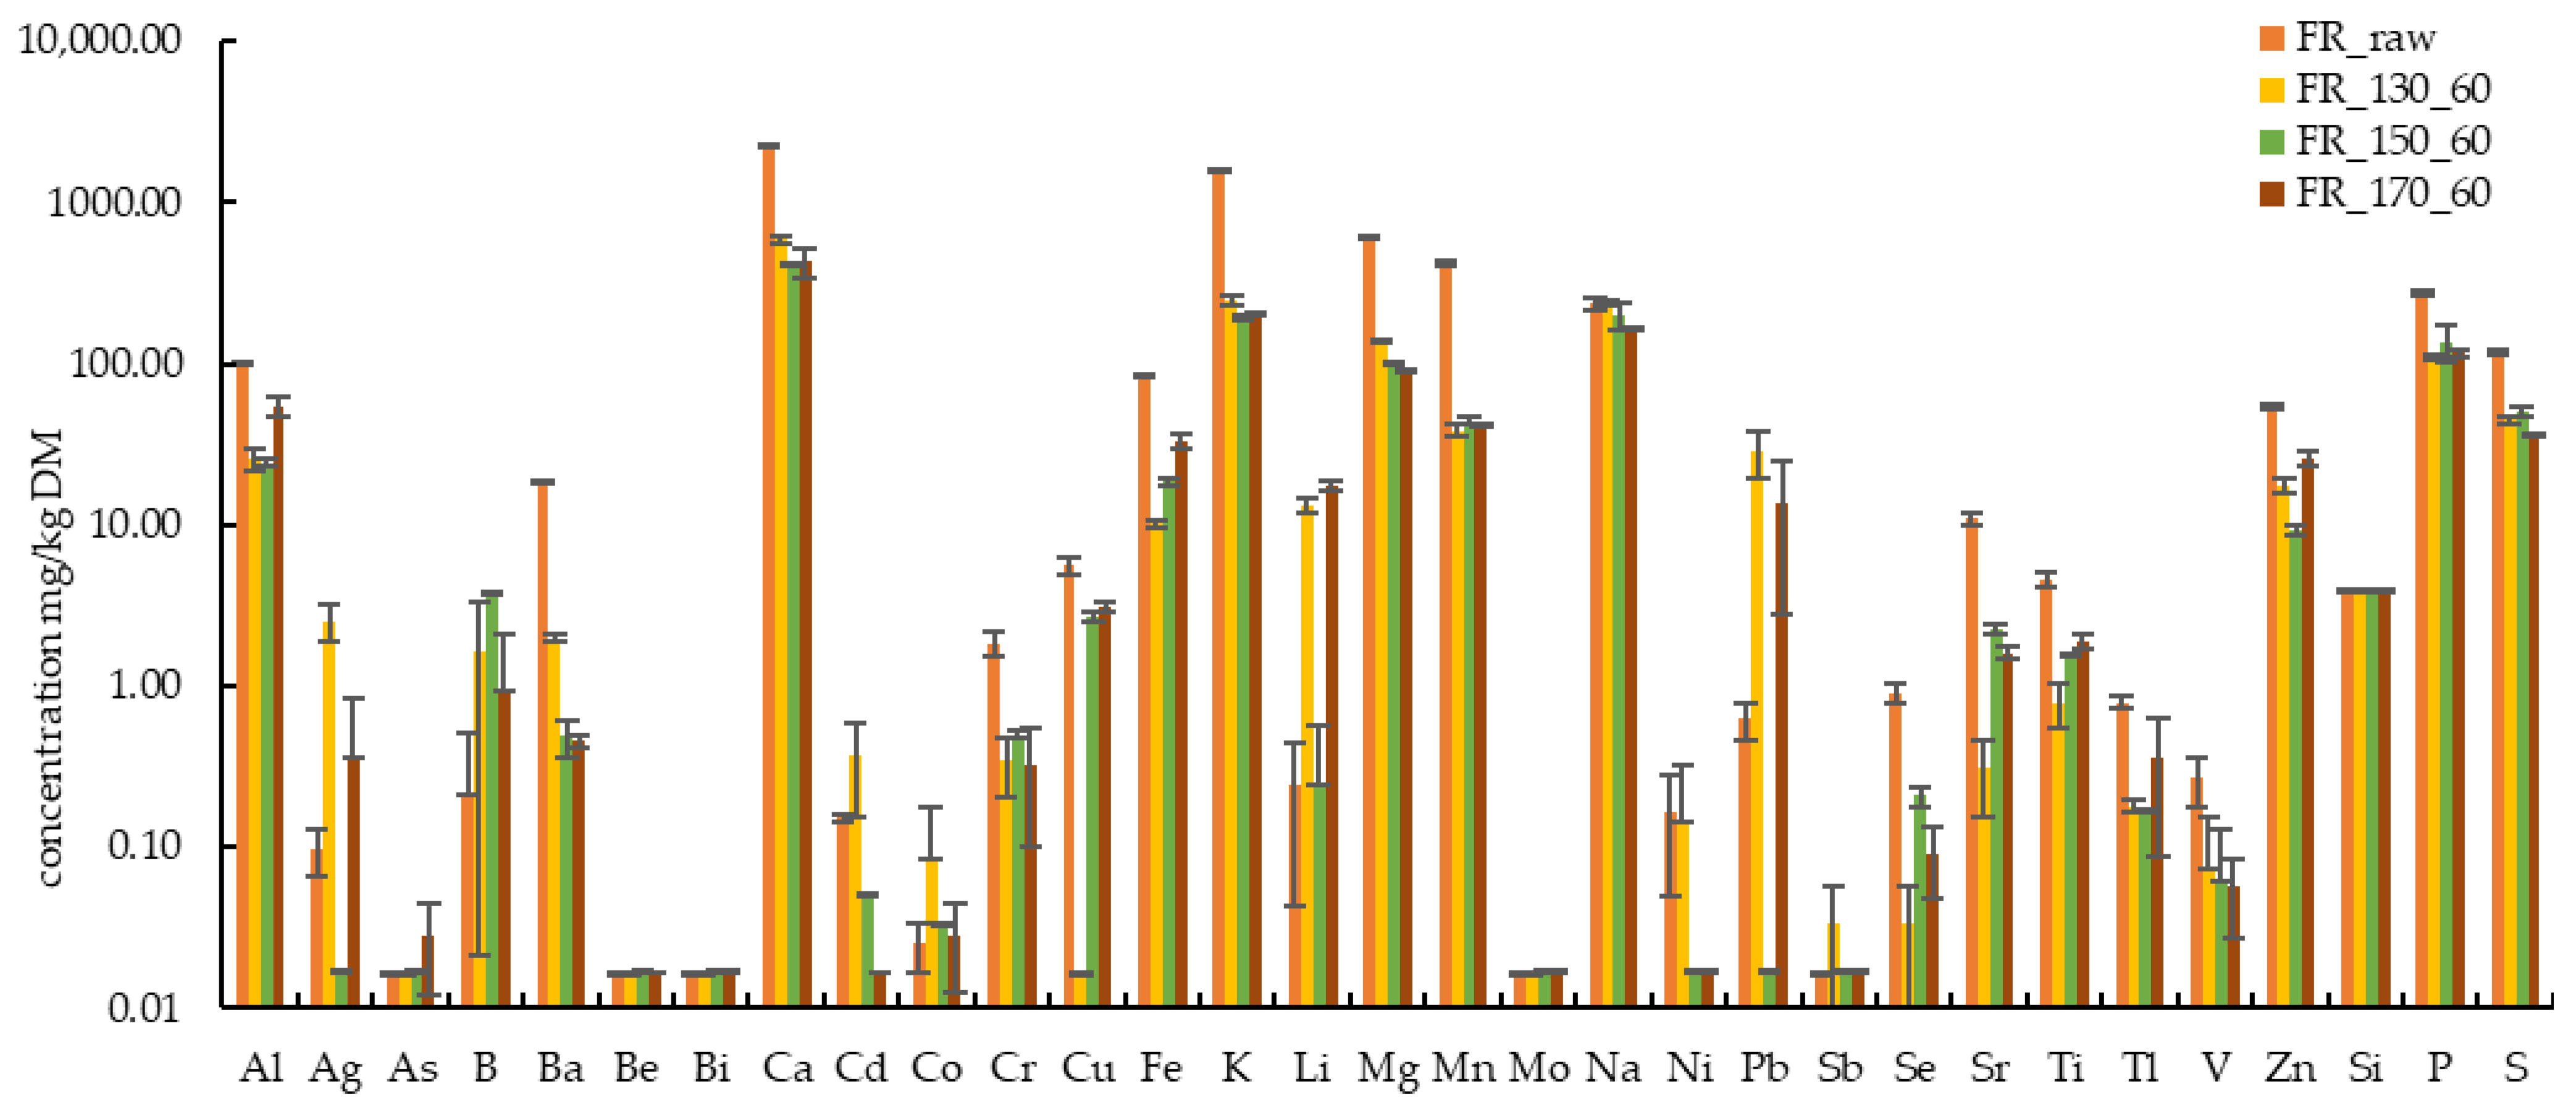
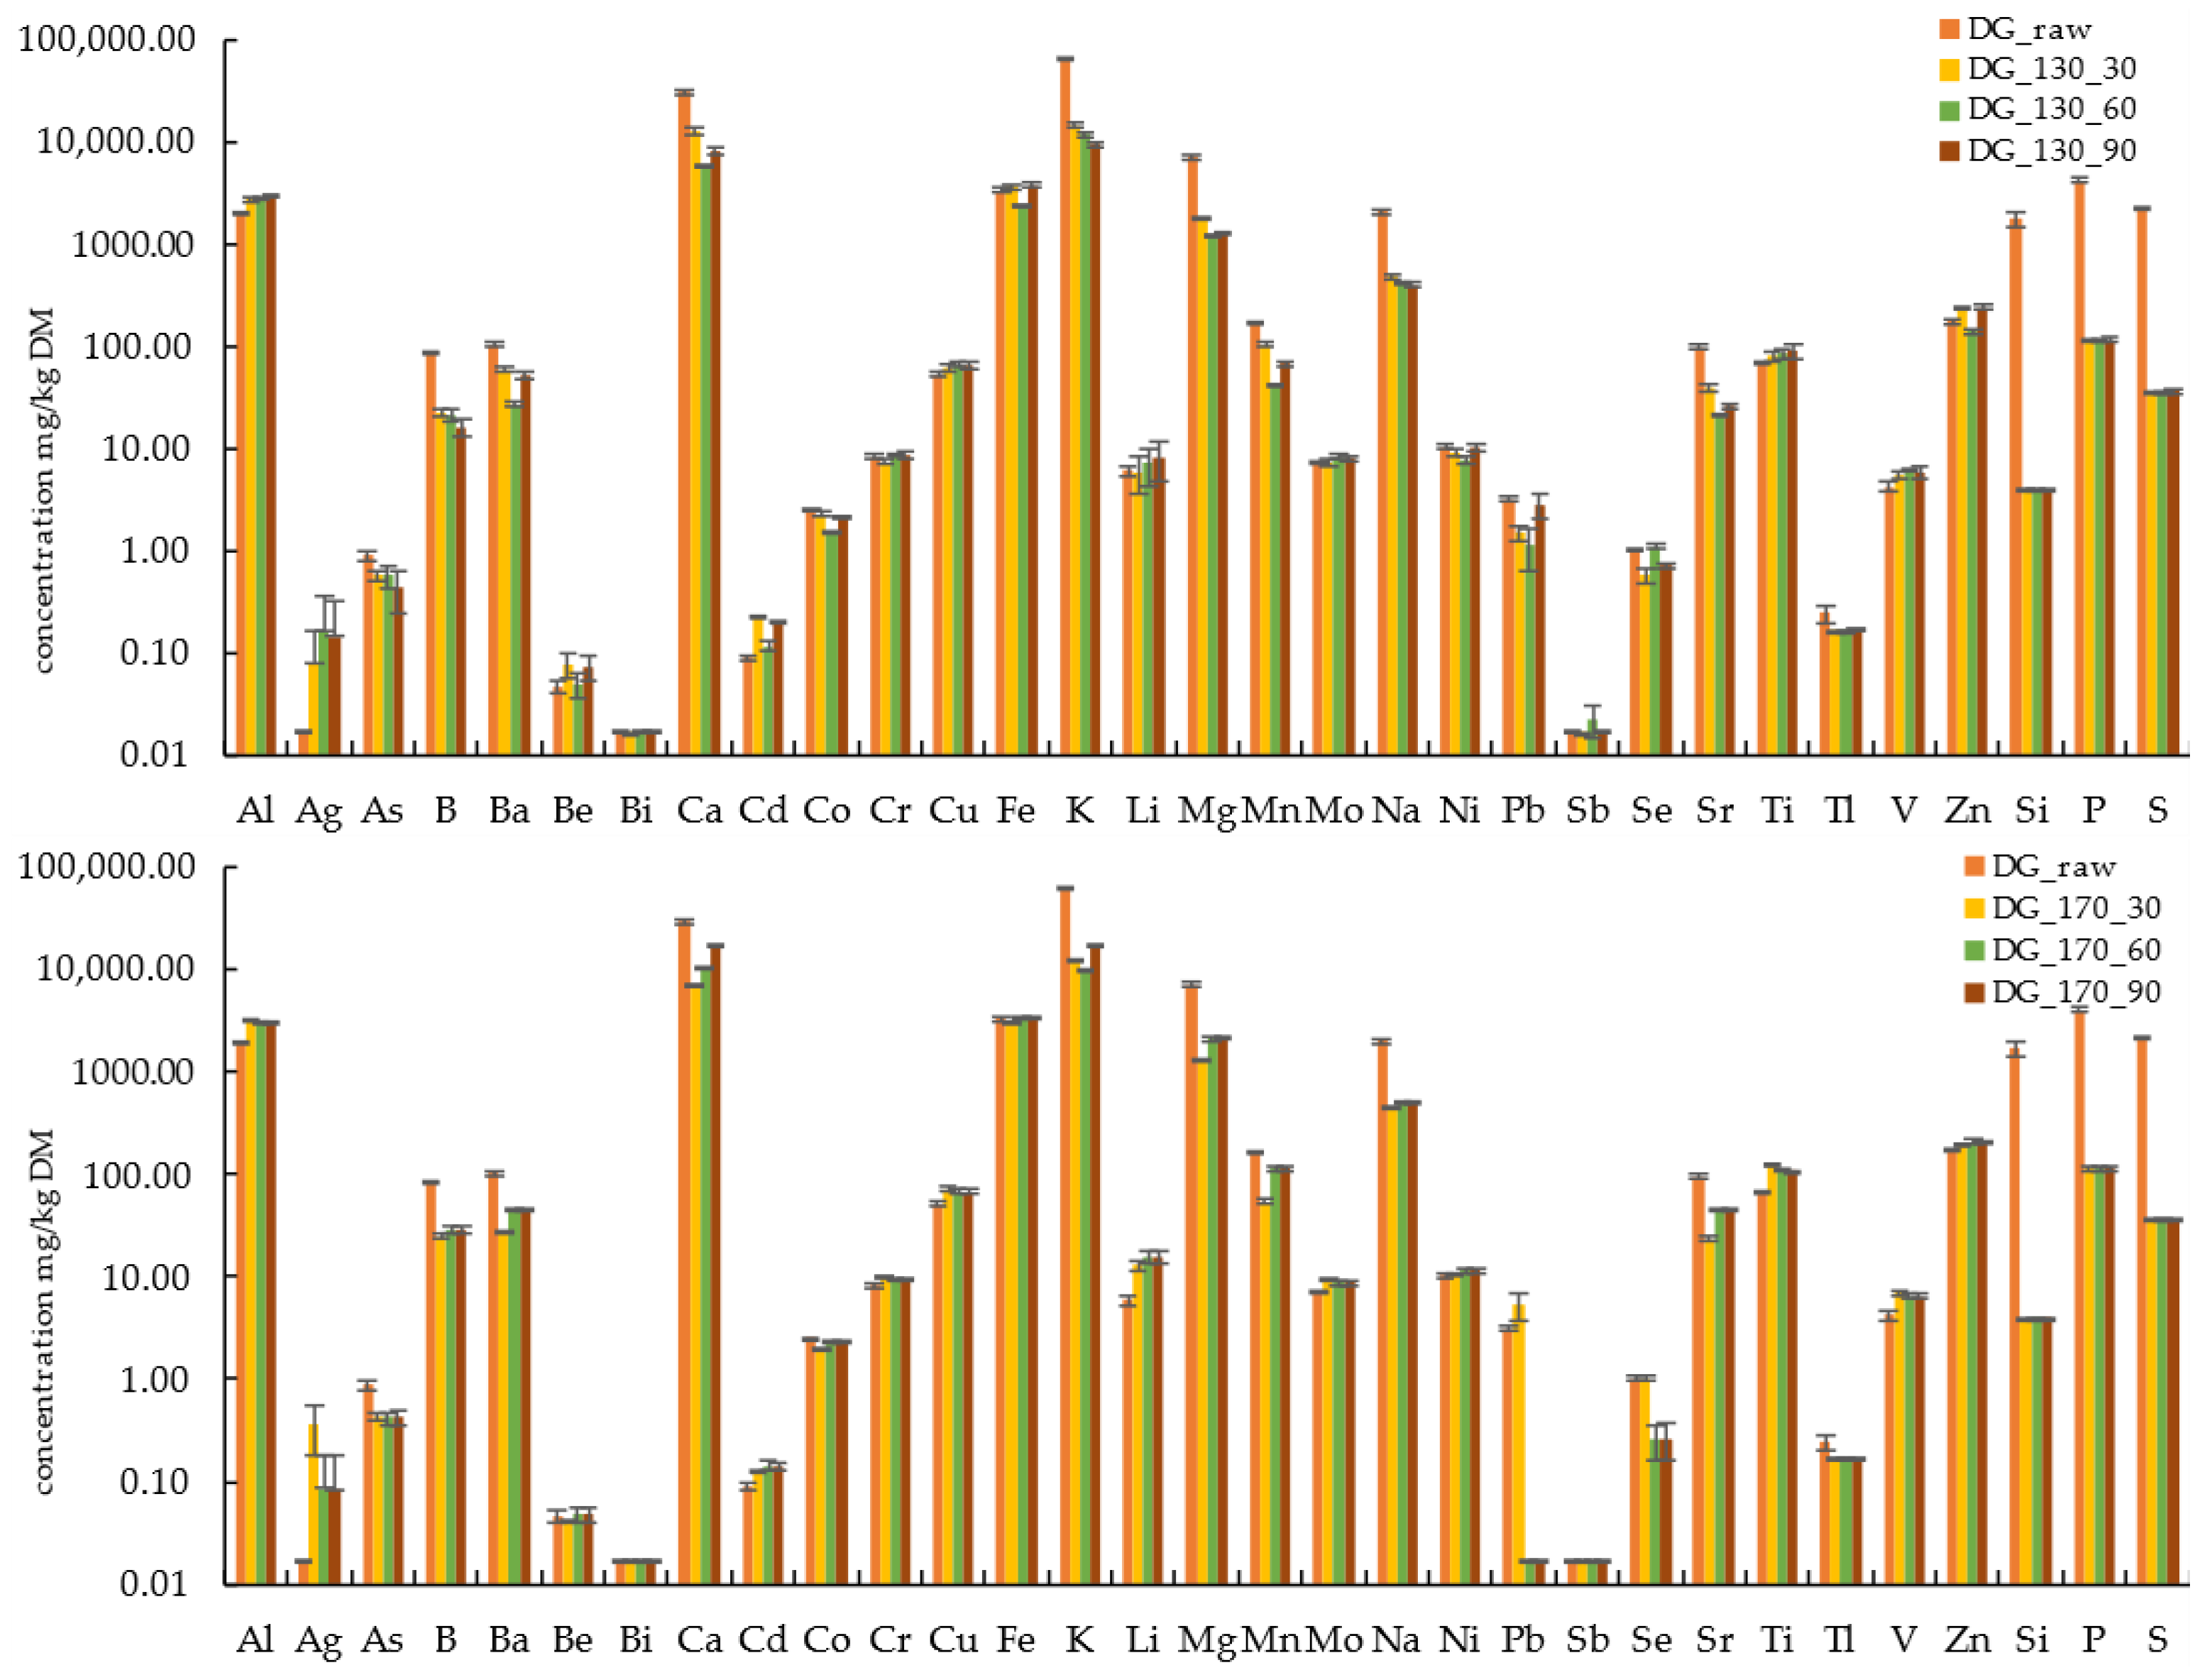
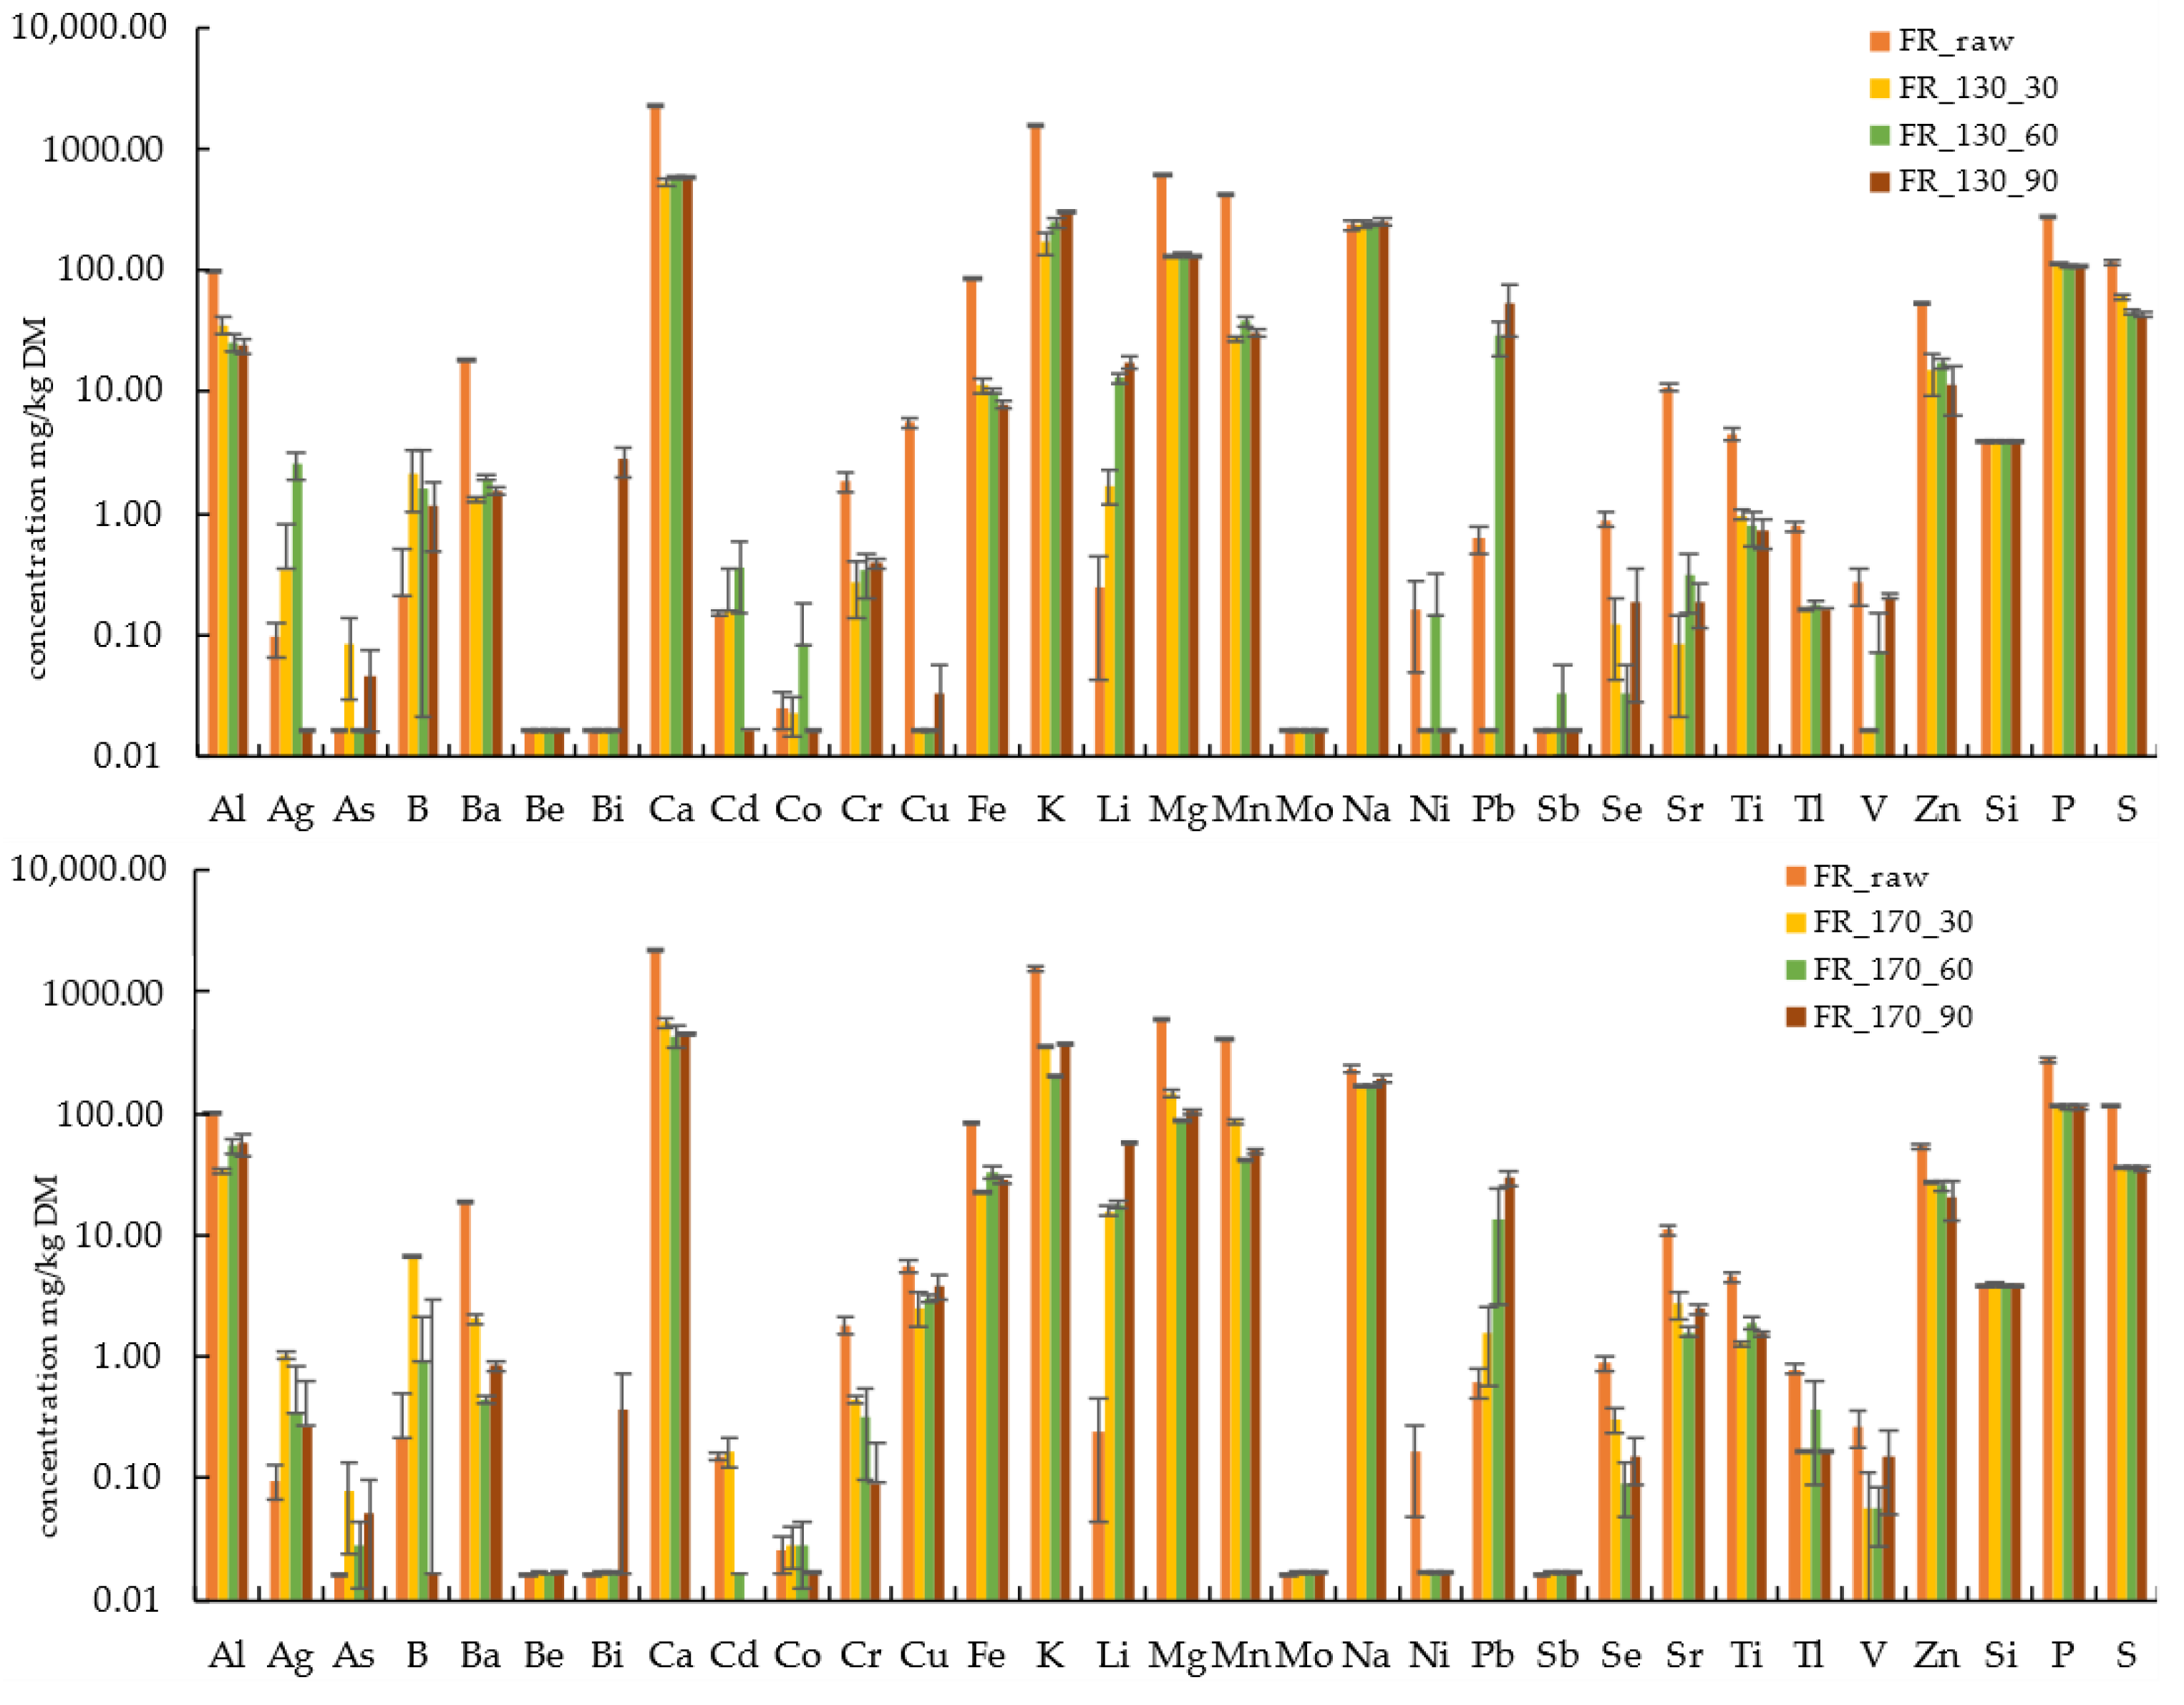
3.3. Influence of Hydrothermal Treatment Temperature on Characteristics of Solids and Liquids

The influence of the process temperature was investigated by comparing the HTT experiments at the temperature levels of 130, 150 and 170 °C with a 60 min holding time. The mass losses increased with increasing temperatures for both the DG and FR solids (Table 3 and Table 4). For the DG solids, the ash concentration increased continuously, while for the FR solids, it remained largely unchanged. Although large quantities of ash-forming elements such as Ca, Na, K and Mg (Figure 8) were washed out from the DG solids, the simultaneous loss of mass probably caused the ash concentration to increase, although it was still significantly lower than in the raw state. For the FR solids (Figure 9), on the other hand, the loss of mass and the leaching of elements presumably compensated each other, wherefore the ash concentration was reduced only slightly. Even though the differences are marginal, the C concentration and HHV were the highest for the DG solids at 150 °C and for the FR solids at 170 °C. Contrary to the observations of Cao et al. [44], the ash concentration was reduced, whereas the C concentration and the corresponding HHV of the DG solid at 170 °C increased. Si, P and S were leached out in approximately the same amounts in the DG and FR solids at 170 °C, with less S at 130 and 150 °C. Although the concentrations of P and S in the raw DG were significantly higher than in the raw FR, similarly high concentrations were found in both HTT solids, meaning higher concentrations should be found in the DG liquids. The P concentration in the DG solid was reduced from more than 4100 mg/kgDM to slightly more than 100 mg/kgDM, and the S concentration from around 2200 mg/kgDM to below 40 mg/kgDM. Due to only minor differences in leaching rates, low process temperatures are preferable from an energy efficiency standpoint for the purpose of nutrient recovery, such as P or S.
The extent to which the substances released into the process water can be extracted and reused should be further investigated. An efficient concentration and separation process will be of major importance for the material use of the detectable chemical compounds in the HTT waters. In the DG solids, other elements such as Ca, Li, Mg and Na were found to have the highest concentrations at 170 °C. However, they were still considerably less concentrated than in the raw material. Both the FR raw and FR HTT solids were subject to larger standard deviations, especially in the case of Ag, B, Cd, Co, Li, Pb and other elemental concentrations, indicating an inhomogeneous composition or impurities. Nevertheless, the concentrations were reduced for almost all elements. In general, Ca and K were measured with the overall highest concentrations in DG (>10,000 mg/kgDM) and in FR (>1000 mg/kgDM). For FR, this could be explained by the bark contents in the sample, and for DG by the feedstock of the AD plant (mainly maize and grass silage). However, the relative comparison of concentrations to evaluate the influence of the holding time and temperature on the untreated and HTT solids was in the focus.
With increasing temperature, ascending counts for furfural in the DG liquids were observed. While at 130 and 150 °C, benzaldehyde was predominantly detected, at 170 °C, it was mainly 5MF. At 130 °C (Figure 3), small peaks were detected for acetic acid and hexanal, but overall, the peaks of the other compounds were mostly below those at 150 and 170 °C. Noticeable in the FR liquids at 130 °C was the high peak of phenol,2-4,dinitro-6-methoxy, which was marginal at 150 °C and 170 °C. Starting at a retention time of approximately 16.72, the largest counts for several compounds (Table 6) were detected at 150 °C. As in the DG liquids, most counts of furfural were detected in the FR liquids (Figure 6) at 170 °C. Furthermore, the highest counts for guaiacol, vanillin, butyrovanillone and naphthol were detected at 170 °C. Vanillin and guaiacol are organic compounds that are released during lignin decomposition but are therefore only increasingly found at elevated process conditions. The extent to which valuable compounds are present and influenced by rising temperatures still needs to be investigated in greater detail for each biomass individually.

3.4. Influence of Holding Time on Characteristics of Hydrothermally Treated Solids and Liquids

The influence of the holding time was investigated by comparing the runs at the temperature levels of 130 and 170 °C with a holding time of 30, 60 and 90 min. For both the DG and FR solids (Table 3 and Table 4), the loss of mass increased with the holding time due to the organic and mineral components being leached into the liquid phase. As a result, the ash concentration of the DG solids also increased with the holding time, while that of FR remained almost unchanged. At 130 °C, the C concentration of the DG solids increased from 30 min to 90 min, while at 170 °C, it decreased slightly at elevated holding times. This was also observed for the HHV of the FR solids. A clear statement with regard to the holding time-based correlations between the samples is not possible since the C concentration at 30 min was, at first, below that of the raw material, then slightly above at 60 min and below again at 90 min. This, however, might indicate that at 130 °C and 150 °C, the severity of the process was not sufficient to achieve an increase in the C concentration of the FR solids. Knappe et al. [43] also observed that at 150 °C, the C concentration decreased slightly and was below that of the raw material until 170 °C. At 170 °C, the C concentration and HHV started to exceed those of the raw biomass. Consistent with observations from other publications, certain element concentrations increased or decreased depending on the reaction conditions. The influence of the holding time at 130 °C compared to 170 °C differed regarding the leaching of some elements (Figure 10). At 130 °C, some elements (K, Mg, Na) were increasingly washed out into the DG liquids with increasing holding time, whereas some poorly soluble/insoluble elements (e.g., Al, Ti, Zn) were concentrated due to the loss of mass, which can thus even exceed the concentration of the raw material. In the FR solids (Figure 11), the highest concentrations of Ca, K, Mg and Na were observed after 60 and 90 min. Likewise, some element concentrations increased and were even more concentrated than in the raw materials. In contrast to 130 °C, the highest concentrations in the DG solids were obtained at 170 °C (Figure 10) for Ca, K and Na at a 90 min holding time. Overall, a holding time of >30 min at 170 °C did not show any clear advantage for the DG solids, neither in terms of the leaching of elements nor in terms of fuel improvement, but even showed higher ash concentrations, higher concentrations of various TEs and a lower HHV. For the FR solids, there was also no clear advantage for the longer holding time at 170 °C (Table 3 and Figure 11), neither regarding the leaching of elements nor regarding the fuel properties.
In the DG liquids, the highest counts for compounds 22, 29 and 20 were detected at 130 °C and 30 min (Figure 2). At a 60 min holding time, the number of counts was the highest for furfural, and at 90 min for n-hexadecanoic acid. The peaks at 60 and 90 min holding times were about the same for compounds 18, 10, 24 and 20 (Table 6). At 170 °C (Figure 4), increasing counts for furfural and 5MF were observed with increasing holding time. As already observed at 130 °C, the highest number of counts for n-hexadecanoic acid at 170 °C was at a 90 min holding time. At 170 °C and a 30 min holding time, compounds 24, 20 and 8 were detected with the highest peaks. In the FR liquids, the highest number of counts for compounds 12, 14, 15 and 17 was observed at 130 °C and a 30 min holding time (Figure 5). At a 60 min holding time, the peaks were the highest for compounds 27 and 30, and at 90 min for compounds 3, 16, 18 and 28. Contrary to the observation for the DG liquids at 170 °C, the highest peaks of furfural and 5MF in the FR liquids (Figure 7) were observed at 170 °C with a 60 min holding time, and the lowest at a 90 min holding time. While the same components were present with deviating counts in the FR liquids (Figure 5 and Figure 7) at the same temperature but with different holding times, other compounds were detected in the DG liquids (Figure 2 and Figure 4) at the same temperature but with different holding times.
It can therefore be stated that different biomasses, due to their specific composition, leach different compounds into the process water. Some of the compounds detected can be acquired from chemical manufacturers and may eventually be of interest for material use. However, extraction and qualitative requirements must be evaluated. To validate these observations and to state precise correlations on the influence of the holding time during HTT, further research should be conducted. In general, further studies considering the full energy and cost balance should be carried out to determine the best possible (material) use. At first glance, the impact on practice with respect to the formation and recovery of top value-added chemicals at mild reaction conditions appears to be limited for DG and FR, as none of the listed top value-added chemicals by Bozell and Petersen [68] were discovered except for furfural. However, since other valuable compounds may be formed in addition to the listed ones, further experiments with subsequent qualitative and quantitative GC-MS analyses should be performed. If high-value-added compounds are to be discovered, the feasibility and economics of the required extraction must be considered. As expected, the highest peaks of furfural were found at 170 °C for both DG and FR. However, to obtain platform chemicals such as 5-HMF and levulinic acid, more severe reaction conditions are required. Modifying the HTT process with strong acids such as HNO3 and studying the effects on the behavior and production of certain compounds could be a field of further research.
Nevertheless, the experiments in this study showed that holding times and process temperatures are important parameters for optimizing HTT processes. Depending on the parameters, a lower HTT temperature (e.g., 130 vs. 170 °C) and a shortened holding time (e.g., 30 vs. 90 min) led to better product qualities. From a cost–benefit perspective, adjusted treatment temperatures and holding times might thus minimize HTT costs while delivering products with optimized material properties.
Further, statistical analyses with high repetition numbers for both experiments and analytics should be executed to describe the significance of the temperature- and holding-time-based influence on product qualities in HTT. This was not carried out in this study, which is a limitation.

4. Conclusions

Digestate (DG) and softwood-based forest residue (FR) were selected as feedstocks for low-temperature hydrothermal treatment (HTT) due to their high availability and their low costs in Central Europe. Based on the material properties of the raw materials and the HTT liquids as well as HTT solids, the following conclusions, especially with regard to application potentials, can be drawn:
(1)
In general, the physicochemical characteristics of alleged low-value biomasses can be strongly influenced by low-temperature HTT. Depending on the type of feedstock, the effects of the HTT process on the material properties of solid and liquid HTT products vary. Certainly, each biomass—or at least certain biomass types (e.g., lignocellulosic)—reacts differently to the HTT treatment and thus has to be considered individually.
(2)
It is possible to generate FR- and DG-based solids with optimized characteristics while simultaneously producing liquids with a variety of different chemical compounds. In this study, the influence of low-temperature HTT with various parameters as an energy-efficient process on ash and element concentrations as well as on calorific values (solids) and chemical compounds (liquids) was demonstrated.
(3)
Depending on the HTT process parameters and on the designated application (e.g., HTT solids as a fuel in combustion), HTT might lead to positive or negative impacts. Thus, a general statement on the optimum HTT conditions is not possible. Major variables for an optimized HTT process are the reaction conditions (e.g., temperature or holding time), feedstock (e.g., biomass type) and designated application (e.g., fuel).
(4)
Both the HTT temperature and holding time have major impacts on the material properties of DG and FR. The effect of HTT at 130 °C with a 30 min holding time might deliver better results than HTT at 170 °C with a 90 min holding time in terms of costs and benefits as well as the intended use. Thus, optimized HTT processes at lower temperatures with more suitable product qualities could also increase the overall efficiency of HTT.
In general, upgrading fuel properties by low-temperature HTT appears to be a viable utilization method for DG at mild reaction parameters. Especially for DG, a short (30 min) and low-temperature (130 °C) HTT seems suitable to improve the fuel properties with only a limited energy input. Element concentrations that are critical for combustion, such as S (corrosivity) or K (aerosol formation), decrease, the ash concentration is reduced and the calorific value increases. A further issue to be investigated in further research might be the evaluation of the suitability of the DG solids after HTT for processing methods such as pelletization and subsequent incineration. In addition to the mentioned fields of application, HTT products can also be used for other purposes such as for soil improvement, as activated carbon or in the chemical industry. The most suitable field of application for the respective feedstock and the most efficient process temperature or holding time have to be defined and adjusted individually for each biomass.

Author Contributions

Conceptualization, G.S., J.C. and S.P.; methodology, G.S., J.C. and M.S.; validation, G.S., F.E., V.H., M.B., S.O., S.P. and J.M.; formal analyses, G.S., J.C., M.S. and J.M.; investigation, G.S., J.C. and M.S.; writing—original draft preparation, J.C., G.S., F.E. and J.M.; writing—review and editing, J.C., G.S., F.E., M.B., S.O. and J.M.; visualization, J.C., F.E., G.S. and J.M.; supervision, S.P. and J.M.; project administration, S.P.; funding acquisition, S.P. All authors have read and agreed to the published version of the manuscript.

Funding

This study was sponsored by the project Rest2Value (full title: “Hochwertige Produkte aus forst- und landwirtschaftlichen Reststoffen durch Anwendung hydrothermaler Karbonisierung”), which was funded by the Ministry of Rural Affairs, Food and Consumer Protection of the State of Baden-Württemberg (MLR, Germany). Funding period: 01.12.2020–31.08.2021. Funding code: 54_8214.07-FP20-105/1.

Institutional Review Board Statement

Not applicable.

Informed Consent Statement

Not applicable.

Data Availability Statement

The data presented in this study are available on request from the first author.

Conflicts of Interest

The authors declare no conflict of interest. The funders had no role in the design of the study; in the collection, analyses or interpretation of data; in the writing of the manuscript; or in the decision to publish the results.

Abbreviations

ADanaerobic digestion
DGdigestate
DMdry matter
FRforest residue
GC-MSgas chromatography-mass spectrometry
HHVhigher heating value
HTChydrothermal carbonization
HTThydrothermal treatment
ICP-OESinductively coupled plasma-optical emission spectroscopy
LHVlower heating value
PTFEpolytetrafluoroethylene
SFseverity factor
TEstrace elements

Appendix A

Figure A1. Raw materials used in this study: softwood-based forest residue (FR) and digestate (DG); left pictures: samples as provided; right pictures: samples as dry material.
Energies 15 03738 g0a1
Figure A2. H/C and O/C ratios of the digestate and forest residue for raw and hydrothermally treated solids (generated with a temperature of 130, 150 or 170 °C and with a holding time of 30, 60 or 90 min).
Energies 15 03738 g0a2
Table A1. Specification of graded pellets produced from thermally treated non-woody biomass (DIN EN ISO 17225-8:2016-01).
Property ClassUnitTA1TA2
Ash, A, ISO 18122w-% dryA5.0 ≤ 5.0A10.0 ≤ 10.0
Net calorific value, Q,
ISO 18125
MJ/kg or
kWh/kg
as received
Q18 ≥ 18 or
Q5.0 ≥ 5.0
Value to be stated
Q17 ≥ 17 or
Q4.7 ≥ 4.7
Value to be stated
Nitrogen, N, ISO 16948w-% dryN1.5 ≤ 1.5N2.0 ≤ 2.0
Sulfur, S, ISO 16994w-% dryS0.05 ≤ 0.05S0.1 ≤ 0.1
Arsenic, As, ISO 16968mg/kg dry≤2≤2
Cadmium, Cd, ISO 16968mg/kg dry≤1≤1
Chromium, Cr, ISO 16968mg/kg dry≤50≤50
Copper, Cu, ISO 16968mg/kg dry≤20≤20
Lead, Pb, ISO 16968mg/kg dry≤10≤10
Nickel, Ni, ISO 16968mg/kg dry≤10≤10
Zinc, Zn, ISO 16968mg/kg dry≤200≤200
Table A2. Mean values ± standard deviations (SD) for different element concentrations in the digestate (DG) and forest residue (FR) hydrothermally treated at 130, 150 or 170 °C with a holding time of 30, 60 or 90 min. Excluded measurements are highlighted with *.
CodeAlAgAsBBaBeBiCaCd
DG Raw
± SD
1972
± 45
0.07
± 0.08
0.91
± 0.11
82.98
± 2.34
101.1
± 3.7
0.04
± 0.00
<0.02
29,564
± 1189
0.09
± 0.01
DG_130_30
± SD
2727
± 135
0.08
± 0.08
0.56
± 0.07
21.73
± 2.00
58.68
± 4.03
0.08
± 0.02
<0.02
12,596
± 981
0.22
± 0.01
DG_130_60
± SD
2762
± 126
0.16
± 0.20
0.57
± 0.14
20.56
± 2.84
26.65
± 1.09
0.05
± 0.01
<0.02
5682
± 160
0.12
± 0.01
DG_130_90
± SD
2983
± 26
0.14
± 0.18
0.44
± 0.20
16.09
± 3.02
50.91
± 3.30
0.07
± 0.02
0.02
7923
± 661
0.20
± 0.01
DG_150_60
± SD
3235
± 25
0.73
± 0.27
0.48
± 0.08
24.16
± 2.52
37.17
± 0.27
0.06
± 0.01
<0.02
8360
± 402
0.18
± 0.01
DG_170_30
± SD
3300
± 90
0.36
± 0.18
0.43
± 0.04
24.72
± 1.25
28.14
± 0.52
0.04
± 0.00
<0.02
7080
± 243
0.13
± 0.00
DG_170_60
± SD
3123
± 101
0.09
± 0.10
0.42
± 0.06
28.93
± 2.47
46.20
± 1.71
0.05
± 0.01
<0.02
10,467
± 455
0.14
± 0.01
DG_170_90
± SD
3115
± 66
0.08
± 0.10
0.42
± 0.06
28.84
± 2.09
46.09
± 1.13
0.05
± 0.01
<0.02
17,171
± 586
0.14
± 0.01
FR Raw
± SD
102.1
± 0.9
0.10
± 0.03
<0.02
0.04
± 0.04
18.65
± 0.39
<0.02
<0.02
2269
± 65
0.15
± 0.01
FR_130_30
± SD
35.99
± 6.2
0.34
± 0.46
0.08
± 0.05
2.17
± 1.14
1.31
± 0.08
<0.02
<0.02
540.2
± 33.4
0.16
± 0.18
FR_130_60
± SD
25.44
± 4.08
2.52
± 0.67
<0.02
1.64
± 1.62
1.97
± 0.1
<0.02
<0.02
585.7
± 23.1
0.37
± 0.21
FR_130_90
± SD
23.96
± 3.07
0.02
± 0.00
0.04
± 0.03
1.14
± 0.67
1.54
± 0.13
<0.02
2.77
± 0.77
581.2
± 7.80
0.02
FR_150_60
± SD
24.27
± 1.26
<0.02
<0.02
3.73
± 0.11
0.48
± 0.12
<0.02
<0.02
415.3
± 6.00
0.05
± 0.00
FR_170_30
± SD
33.98
± 1.12
1.03
± 0.09
0.08
± 0.06
6.76
± 0.18
2.03
± 0.17
<0.02
<0.02
570.2
± 53.8
0.17
± 0.05
FR_170_60
± SD
53.93
± 7.94
0.35
± 0.47
0.03
± 0.02
0.93
± 1.19
0.45
± 0.03
<0.02
<0.02
432.8
± 91.2
<0.02
FR_170_90
± SD
56.84
± 12.05
0.27
± 0.36
0.05
± 0.05
<0.02
0.84
± 0.08
<0.02
0.37
± 0.35
455.0
± 13.6
*
Table A3. Mean values ± standard deviations (SD) for different element concentrations in the digestate (DG) and forest residue (FR) hydrothermally treated at 130, 150 or 170 °C with a holding time of 30, 60 or 90 min.
CodeCoCrCuFeKLiMgMnMo
DG Raw
± SD
2.51
± 0.06
7.96
± 0.33
50.28
± 1.85
3273
± 105
62,915
± 1906
5.72
± 0.51
7053
± 438
163.1
± 5.20
6.96
± 0.05
DG_130_30
± SD
2.26
± 0.12
7.24
± 0.39
59.40
± 5.19
3602
± 241
14,447
± 879
5.83
± 2.22
1770
± 79
102.8
± 6.4
7.11
± 0.63
DG_130_60
± SD
1.47
± 0.03
8.45
± 0.36
64.30
± 3.64
2319
± 43
11,772
± 567
6.98
± 2.86
1202
± 29
42.29
± 0.38
8.13
± 0.52
DG_130_90
± SD
2.09
± 0.10
8.64
± 0.65
64.68
± 5.47
3715
± 209
9354
± 635
8.18
± 3.59
1244
± 44
66.20
± 3.64
7.85
± 0.58
DG_150_60
± SD
2.22
± 0.05
9.63
± 0.12
73.20
± 2.60
3632
± 55
10,139
± 190
14.37
± 3.45
1262
± 27
68.54
± 2.84
9.32
± 0.45
DG_170_30
± SD
1.96
± 0.03
10.16
± 0.24
72.84
± 3.47
3076
± 38
12,628
± 238
13.15
± 1.34
1327
± 15
55.07
± 1.96
9.48
± 0.10
DG_170_60
± SD
2.34
± 0.10
9.40
± 0.39
69.15
± 3.99
3449
± 145
10,501
± 86
15.74
± 2.42
2142
± 85
115.4
± 5.0
8.83
± 0.46
DG_170_90
± SD
2.33
± 0.07
9.37
± 0.25
68.98
± 3.36
3440
± 96
17,440
± 654
15.68
± 2.24
2137
± 53
115.2
± 4.00
8.83
± 0.40
FR Raw
± SD
0.02
± 0.01
1.79
± 0.35
5.76
± 0.59
84.69
± 2.61
1562
± 46
0.32
± 0.18
605.3
± 14.1
417.1
± 13.8
0.02
± 0.00
FR_130_30
± SD
<0.02
± 0.01
0.27
± 0.13
<0.02
11.36
± 1.74
170.2
± 33.7
1.72
± 0.55
128.0
± 2.90
27.54
± 1.64
<0.02
FR_130_60
± SD
0.08
± 0.09
0.34
± 0.14
<0.02
10.11
± 0.57
246.3
± 17.8
13.07
± 1.38
136.2
± 1.70
38.25
± 3.20
<0.02
FR_130_90
± SD
<0.02
0.39
± 0.04
0.03
± 0.02
7.79
± 0.57
307.1
± 10.4
17.48
± 1.78
131.4
± 3.70
30.14
± 2.15
<0.02
FR_150_60
± SD
<0.02
0.50
± 0.03
2.70
± 0.18
18.4
± 1.10
190.9
± 6.1
0.24
± 0.32
99.57
± 1.86
43.78
± 2.42
<0.02
FR_170_30
± SD
0.03
± 0.01
0.45
± 0.03
2.56
± 0.79
22.45
± 0.40
362.4
± 6.8
15.80
± 1.53
147.0
± 10.7
86.21
± 3.11
<0.02
FR_170_60
± SD
0.03
± 0.02
0.32
± 0.22
3.06
± 0.22
32.68
± 3.57
200.7
± 4.4
17.58
± 1.26
89.22
± 1.82
41.78
± 0.26
<0.02
FR_170_90
± SD
<0.02
0.09
± 0.11
3.80
± 0.86
28.78
± 2.55
376.1
± 11.8
58.23
± 1.96
104.1
± 4.30
49.36
± 2.05
<0.02
Table A4. Mean values ± standard deviations (SD) for different element concentrations in the digestate (DG) and forest residue (FR) hydrothermally treated at 130, 150 or 170 °C with a holding time of 30, 60 or 90 min.
CodeNaNiPbSbSeSrTiTlV
DG Raw
± SD
2014
± 88
10.40
± 0.66
3.23
± 0.10
<0.02
0.98
± 0.04
93.70
± 4.15
67.85
± 1.47
0.27
± 0.01
4.19
± 0.58
DG_130_30
± SD
479.5
± 23.1
8.84
± 0.71
1.46
± 0.26
<0.02
0.56
± 0.08
39.20
± 3.22
78.98
± 8.51
<0.17
5.51
± 0.42
DG_130_60
± SD
424.3
± 7.5
7.58
± 0.40
1.12
± 0.49
0.02
± 0.01
1.09
± 0.04
20.51
± 0.64
84.57
± 9.93
<0.17
6.06
± 0.31
DG_130_90
± SD
394.6
± 21.6
10.20
± 0.77
2.81
± 0.78
<0.02
0.70
± 0.02
25.75
± 1.50
89.16
± 14.91
<0.17
5.89
± 0.83
DG_150_60
± SD
422.6
± 13.7
11.5
± 0.25
4.20
± 0.86
0.03
± 0.02
0.90
± 0.12
27.31
± 1.16
98.19
± 8.19
<0.17
7.16
± 0.43
DG_170_30
± SD
448.0
± 8.4
10.48
± 0.33
5.29
± 1.51
<0.02
1.01
± 0.05
23.69
± 0.88
124.3
± 5.8
<0.17
6.95
± 0.45
DG_170_60
± SD
516.5
± 15.2
11.51
± 0.89
<0.02
<0.02
0.26
± 0.10
44.58
± 1.52
110.5
± 2.50
<0.17
6.53
± 0.41
DG_170_90
± SD
515.3
± 8.1
11.50
± 0.73
<0.02
<0.02
0.27
± 0.10
44.48
± 1.2
110.2
± 0.7
<0.17
6.52
± 0.39
FR Raw
± SD
244.7
± 16.4
0.16
± 0.13
0.60
± 0.19
<0.02
0.89
± 0.15
11.34
± 0.86
4.46
± 0.53
0.77
± 0.06
0.22
± 0.06
FR_130_30
± SD
241.0
± 13.8
<0.02 <0.02 <0.02
0.12
± 0.08
0.08
± 0.06
0.97
± 0.10
<0.17
<0.02
FR_130_60
± SD
237.5
± 7.1
0.14
± 0.18
28.59
± 9.14
0.03
± 0.02
0.03
± 0.02
0.31
± 0.15
0.79
± 0.25
0.18
± 0.02
0.07
± 0.08
FR_130_90
± SD
250.3
± 16.1
<0.02
52.96
± 24.57
<0.02
0.19
± 0.16
0.19
± 0.08
0.72
± 0.20
<0.17
0.21
± 0.01
FR_150_60
± SD
197.4
± 36.1
<0.02
<0.02
<0.02
0.21
± 0.03
2.22
± 0.16
1.56
± 0.04
<0.17
0.06
± 0.06
FR_170_30
± SD
170.2
± 5.0
<0.02
1.60
± 1.02
<0.02
0.31
± 0.07
2.72
± 0.69
1.28
± 0.04
<0.17
0.06
± 0.06
FR_170_60
± SD
166.8
± 2.7
<0.02
13.71
± 10.97
<0.02
0.09
± 0.04
1.59
± 0.14
1.89
± 0.19
0.36
± 0.27
0.06
± 0.03
FR_170_90
± SD
193.7
± 11.8
<0.02
29.35
± 3.53
<0.02
0.15
± 0.06
2.47
± 0.28
1.56
± 0.06
0.16
± 0.01
0.15
± 0.10
Table A5. Mean values ± standard deviations (SD) for different element concentrations in the digestate (DG) and forest residue (FR) hydrothermally treated at 130, 150 or 170 °C with a holding time of 30, 60 or 90 min.
CodeZnSiPS
DG Raw
± SD
169.13
± 4.88
1737
± 296
4110
± 220
2192
± 62
DG_130_30
± SD
233.9
± 6.80
<3.87
± 0.01
112.9
± 5.10
34.95
± 1.29
DG_130_60
± SD
139.0
± 8.60
<3.85
± 0.04
113.0
± 4.30
35.01
± 1.16
DG_130_90
± SD
235.0
± 13.1
3.90
± 0.10
115.5
± 4.20
35.78
± 1.28
DG_150_60
± SD
241.4
± 4.70
<3.89
± 0.05
113.9
± 5.90
35.28
± 1.42
DG_170_30
± SD
195 4
± 3.60
<3.91
± 0.01
115.2
± 3.80
35.69
± 0.85
DG_170_60
± SD
210.0
± 8.80
<3.98
± 0.03
116.3
± 4.90
36.02
± 1.13
DG_170_90
± SD
209.5
± 6.60
<3.98
± 0.03
116.1
± 5.50
35.96
± 1.46
FR Raw
± SD
53.96
± 2.32
<3.94
± 0.01
279.0
± 10.2
116.4
± 4.20
FR_130_30
± SD
15.20
± 5.73
<3.92
± 0.03
114.7
± 1.50
61.20
± 2.46
FR_130_60
± SD
17.39
± 1.67
<3.93
± 0.02
108.8
± 2.60
44.78
± 1.99
FR_130_90
± SD
11.21
± 4.78
<3.94
± 0.04
107.3
± 3.6
43.23
± 1.93
FR_150_60
± SD
9.31
± 0.59
<3.99
± 0.01
135.7
± 35.7
50.47
± 3.04
FR_170_30
± SD
27.56
± 0.11
<3.97
± 0.03
117.1
± 3.90
36.26
± 0.98
FR_170_60
± SD
25.82
± 2.69
<3.97
± 0.02
116.0
± 5.10
35.92
± 1.22
FR_170_90
± SD
20.56
± 7.50
<3.96
± 0.03
114.2
± 6.60
35.37
± 1.73

References

  1. Di Gruttola, F.; Borello, D. Analysis of the EU Secondary Biomass Availability and Conversion Processes to Produce Advanced Biofuels: Use of Existing Databases for Assessing a Metric Evaluation for the 2025 Perspective. Sustainability 2021, 13, 7882. [Google Scholar] [CrossRef]
  2. Antczak, A.; Szadkowski, J.; Szadkowska, D.; Zawadzki, J. Assessment of the effectiveness of liquid hot water and steam explosion pretreatments of fast-growing poplar (Populus trichocarpa) wood. Wood Sci. Technol. 2022, 56, 87–109. [Google Scholar] [CrossRef]
  3. Akus-Szylberg, F.; Antczak, A.; Zawadzki, J. Effects of soaking aqueous ammonia pretreatment on chemical composition and enzymatic hydrolysis of corn stover. Ann. WULS—SGGW For. Wood Technol. 2021, 115, 29–36. [Google Scholar] [CrossRef]
  4. Stobernack, N.; Mayer, F.; Malek, C.; Bhandari, R.; Himanshu, H. Hydrothermal carbonization of biowaste as an alternative treatment path to current waste management practices in Germany. Energy Convers. Manag. 2021, 244, 114433. [Google Scholar] [CrossRef]
  5. Ischia, G.; Fiori, L. Hydrothermal Carbonization of Organic Waste and Biomass: A Review on Process, Reactor, and Plant Modeling. Waste Biomass Valor. 2020, 12, 1–28. [Google Scholar] [CrossRef]
  6. Liu, Z.; Balasubramanian, R. Upgrading of waste biomass by hydrothermal carbonization (HTC) and low temperature pyrolysis (LTP): A comparative evaluation. Appl. Energy 2014, 114, 857–864. [Google Scholar] [CrossRef]
  7. Mendoza Martinez, C.L.; Sermyagina, E.; Saari, J.; Silva de Jesus, M.; Cardoso, M.; Matheus de Almeida, G.; Vakkilainen, E. Hydrothermal carbonization of lignocellulosic agro-forest based biomass residues. Biomass Bioenergy 2021, 147, 106004. [Google Scholar] [CrossRef]
  8. Brosowski, A.; Adler, P.; Erdmann, G.; Stinner, W.; Thrän, D.; Mantau, U. Biomassepotenziale von Rest—Und Abfallstoffen: Status Quo in Deutschland; Fachagentur Nachwachsende Rohstoffe e.V. (FNR): Gülzow, Germany, 2015; ISBN 9783942147293. [Google Scholar]
  9. Kaltschmitt, M.; Hartmann, H.; Hofbauer, H. (Eds.) Energie aus Biomasse: Grundlagen, Techniken und Verfahren, 3rd ed.; Springer: Berlin/Heidelberg, Germany, 2016; ISBN 978-3-662-47438-9. [Google Scholar]
  10. Krutul, D.; Szadkowski, J.A.N.; Antczak, A.; Drożdżek, M.; Radomski, A.; Karpiński, S. The concentration of selected heavy metals in poplar wood biomass and liquid fraction obtained after high temperature pretreatment. Wood Res. 2021, 66, 39–48. [Google Scholar] [CrossRef]
  11. Möller, K.; Müller, T. Effects of anaerobic digestion on digestate nutrient availability and crop growth: A review. Eng. Life Sci. 2012, 12, 242–257. [Google Scholar] [CrossRef]
  12. Yokoyama, S.M. The Asian Biomass Handbook a Guide for Biomass Production and Utilization; The Japan Institute of Energy, 2008. [Google Scholar]
  13. Zhou, L.; Hülsemann, B.; Cui, Z.; Merkle, W.; Sponagel, C.; Zhou, Y.; Guo, J.; Dong, R.; Müller, J.; Oechsner, H. Operating Performance of Full-Scale Agricultural Biogas Plants in Germany and China: Results of a Year-Round Monitoring Program. Appl. Sci. 2021, 11, 1271. [Google Scholar] [CrossRef]
  14. Parmar, K.R.; Brown, A.E.; Hammerton, J.M.; Camargo-Valero, M.A.; Fletcher, L.A.; Ross, A.B. Co-Processing Lignocellulosic Biomass and Sewage Digestate by Hydrothermal Carbonisation: Influence of Blending on Product Quality. Energies 2022, 15, 1418. [Google Scholar] [CrossRef]
  15. González, R.; Ellacuriaga, M.; Aguilar-Pesantes, A.; Carrillo-Peña, D.; García-Cascallana, J.; Smith, R.; Gómez, X. Feasibility of Coupling Anaerobic Digestion and Hydrothermal Carbonization: Analyzing Thermal Demand. Appl. Sci. 2021, 11, 11660. [Google Scholar] [CrossRef]
  16. Bergius, F. Holz und Kohle, chemische und wirtschaftliche Betrachtungen. Z. Angew. Chem. 1928, 41, 707–711. [Google Scholar] [CrossRef]
  17. Satira, A.; Paone, E.; Bressi, V.; Iannazzo, D.; Marra, F.; Calabrò, P.S.; Mauriello, F.; Espro, C. Hydrothermal Carbonization as Sustainable Process for the Complete Upgrading of Orange Peel Waste into Value-Added Chemicals and Bio-Carbon Materials. Appl. Sci. 2021, 11, 10983. [Google Scholar] [CrossRef]
  18. Han, S.; Bai, L.; Chi, M.; Xu, X.; Chen, Z.; Yu, K. Conversion of Waste Corn Straw to Value-Added Fuel via Hydrothermal Carbonization after Acid Washing. Energies 2022, 15, 1828. [Google Scholar] [CrossRef]
  19. Maniscalco, M.P.; Volpe, M.; Messineo, A. Hydrothermal Carbonization as a Valuable Tool for Energy and Environmental Applications: A Review. Energies 2020, 13, 4098. [Google Scholar] [CrossRef]
  20. Libra, J.A.; Ro, K.S.; Kammann, C.; Funke, A.; Berge, N.D.; Neubauer, Y.; Titirici, M.-M.; Fühner, C.; Bens, O.; Kern, J.; et al. Hydrothermal carbonization of biomass residuals: A comparative review of the chemistry, processes and applications of wet and dry pyrolysis. Biofuels 2011, 2, 71–106. [Google Scholar] [CrossRef] [Green Version]
  21. Miliotti, E.; Casini, D.; Rosi, L.; Lotti, G.; Rizzo, A.M.; Chiaramonti, D. Lab-scale pyrolysis and hydrothermal carbonization of biomass digestate: Characterization of solid products and compliance with biochar standards. Biomass Bioenergy 2020, 139, 105593. [Google Scholar] [CrossRef]
  22. Funke, A.; Ziegler, F. Hydrothermal carbonization of biomass: A summary and discussion of chemical mechanisms for process engineering. Biofuels Bioprod. Bioref. 2010, 4, 160–177. [Google Scholar] [CrossRef]
  23. Cao, X.; Ro, K.S.; Libra, J.A.; Kammann, C.I.; Lima, I.; Berge, N.; Li, L.; Li, Y.; Chen, N.; Yang, J.; et al. Effects of biomass types and carbonization conditions on the chemical characteristics of hydrochars. J. Agric. Food Chem. 2013, 61, 9401–9411. [Google Scholar] [CrossRef]
  24. Sun, Y.; Gao, B.; Yao, Y.; Fang, J.; Zhang, M.; Zhou, Y.; Chen, H.; Yang, L. Effects of feedstock type, production method, and pyrolysis temperature on biochar and hydrochar properties. Chem. Eng. J. 2014, 240, 574–578. [Google Scholar] [CrossRef]
  25. Wang, T.; Zhai, Y.; Zhu, Y.; Li, C.; Zeng, G. A review of the hydrothermal carbonization of biomass waste for hydrochar formation: Process conditions, fundamentals, and physicochemical properties. Renew. Sustain. Energy Rev. 2018, 90, 223–247. [Google Scholar] [CrossRef]
  26. Blöhse, D.; Echterhof, T.; Eichenauer, S.; Heger, S.; Kammann, C.; Kruse, A.; Quicker, P.; Schulten, M.-A.; Weber, K. Biokohle: Herstellung, Eigenschaften und Verwendung von Biomassekarbonisaten; Springer Fachmedien Wiesbaden: Wiesbaden, Germany, 2017; ISBN 9783658036898. [Google Scholar]
  27. Ramke, H.-G.; Blöhse, D.; Lehmann, H.-J.; Fettig, J. Hydrothermal Carbonization of Organic Waste. In Proceedings of the Sardinia 2009: Twelfth International Waste Management and Landfill Symposium, Margherita di Pula, Italy, 5–9 October 2009. [Google Scholar]
  28. Kruse, A. Supercritical water gasification. Biofuels Bioprod. Bioref. 2008, 2, 415–437. [Google Scholar] [CrossRef]
  29. Friedl, A.; Padouvas, E.; Rotter, H.; Varmuza, K. Prediction of heating values of biomass fuel from elemental composition. Anal. Chim. Acta 2005, 544, 191–198. [Google Scholar] [CrossRef]
  30. Kruse, A.; Dinjus, E. Hot compressed water as reaction medium and reactant. J. Supercrit. Fluids 2007, 39, 362–380. [Google Scholar] [CrossRef]
  31. Bandura, A.V.; Lvov, S.N. The Ionization Constant of Water over Wide Ranges of Temperature and Density. J. Phys. Chem. Ref. Data 2006, 35, 15–30. [Google Scholar] [CrossRef] [Green Version]
  32. Blöhse, L.R. Verbesserte Energetische Nutzung Organischer Industrieabfälle durch Hydrothermale Carbonsierung: Förderlinie: FHprofUnd2009 Förderkennzeichen:17290X9; Forschungsbericht; Hochschule Ostwestfalen: Höxter, Germany, 2014. [Google Scholar]
  33. Watanabe, M.; Aida, T.M.; Smith, R.L. Review of Biomass Conversion in High Pressure High Temperature Water (HHW) Including Recent Experimental Results (Isomerization and Carbonization). In Application of Hydrothermal Reactions to Biomass Conversion; Jin, F., Ed.; Springer: Berlin/Heidelberg, Germany, 2014; pp. 249–274. ISBN 978-3-642-54457-6. [Google Scholar]
  34. Funke, A. Hydrothermale Karbonisierung von Biomasse—Reaktionsmechanismen und Reaktionswärme. Ph.D. Thesis, Der Technischen Universität Berlin, Berlin, Germany, 2012. [Google Scholar]
  35. Sevilla, M.; Fuertes, A.B. Chemical and structural properties of carbonaceous products obtained by hydrothermal carbonization of saccharides. Chemistry 2009, 15, 4195–4203. [Google Scholar] [CrossRef]
  36. Karagöz, S.; Bhaskar, T.; Muto, A.; Sakata, Y.; Oshiki, T.; Kishimoto, T. Low-temperature catalytic hydrothermal treatment of wood biomass: Analysis of liquid products. Chem. Eng. J. 2005, 108, 127–137. [Google Scholar] [CrossRef]
  37. Vallejoy, M.-E.; Fernando Esteban, F.; Maria Cristina, A. Hydrothermal Treatments Applied to Agro- and Forest-Industrial Waste to Produce High Added-Value Compounds. BioResources 2017, 12, 2058–2080. [Google Scholar]
  38. Ferrentino, R.; Merzari, F.; Fiori, L.; Andreottola, G. Coupling Hydrothermal Carbonization with Anaerobic Digestion for Sewage Sludge Treatment: Influence of HTC Liquor and Hydrochar on Biomethane Production. Energies 2020, 13, 6262. [Google Scholar] [CrossRef]
  39. Mendez, L.; Mahdy, A.; Ballesteros, M.; González-Fernández, C. Biomethane production using fresh and thermally pretreated Chlorella vulgaris biomass: A comparison of batch and semi-continuous feeding mode. Ecol. Eng. 2015, 84, 273–277. [Google Scholar] [CrossRef]
  40. Bougrier, C.; Delgenès, J.P.; Carrère, H. Effects of thermal treatments on five different waste activated sludge samples solubilisation, physical properties and anaerobic digestion. Chem. Eng. J. 2008, 139, 236–244. [Google Scholar] [CrossRef]
  41. Yuan, T.; Cheng, Y.; Zhang, Z.; Lei, Z.; Shimizu, K. Comparative study on hydrothermal treatment as pre- and post-treatment of anaerobic digestion of primary sludge: Focus on energy balance, resources transformation and sludge dewaterability. Appl. Energy 2019, 239, 171–180. [Google Scholar] [CrossRef]
  42. Deng, C.; Kang, X.; Lin, R.; Murphy, J.D. Microwave assisted low-temperature hydrothermal treatment of solid anaerobic digestate for optimising hydrochar and energy recovery. Chem. Eng. J. 2020, 395, 124999. [Google Scholar] [CrossRef]
  43. Knappe, V.; Paczkowski, S.; Tejada, J.; Diaz Robles, L.A.; Gonzales, A.; Pelz, S. Low temperature microwave assisted hydrothermal carbonization (MAHC) reduces combustion emission precursors in short rotation coppice willow wood. J. Anal. Appl. Pyrolysis 2018, 134, 162–166. [Google Scholar] [CrossRef]
  44. Cao, Z.; Jung, D.; Olszewski, M.P.; Arauzo, P.J.; Kruse, A. Hydrothermal carbonization of biogas digestate: Effect of digestate origin and process conditions. Waste Manag. 2019, 100, 138–150. [Google Scholar] [CrossRef]
  45. Parmar, K.R.; Ross, A.B. Integration of Hydrothermal Carbonisation with Anaerobic Digestion; Opportunities for Valorisation of Digestate. Energies 2019, 12, 1586. [Google Scholar] [CrossRef] [Green Version]
  46. Gao, Y.; Remón, J.; Matharu, A.S. Microwave-assisted hydrothermal treatments for biomass valorisation: A critical review. Green Chem. 2021, 23, 3502–3525. [Google Scholar] [CrossRef]
  47. Paczkowski, S.; Comi, J.; Küttner, I.; Knappe, V.; Russ, M.; Robles, L.A.D.; Jaeger, D.; Pelz, S. Hydrothermal treatment (HTT) for improving the fuel properties of biomass residues. Biomass Conv. Bioref. 2022, 136, 61. [Google Scholar] [CrossRef]
  48. Sailer, G.; Empl, F.; Kuptz, D.; Silberhorn, M.; Ludewig, D.; Lesche, S.; Pelz, S.; Müller, J. Characteristics and Anaerobic Co-Digestion of Press Water from Wood Fuel Preparation and Digested Sewage Sludge. Fermentation 2022, 8, 37. [Google Scholar] [CrossRef]
  49. Sailer, G.; Knappe, V.; Poetsch, J.; Paczkowski, S.; Pelz, S.; Oechsner, H.; Bosilj, M.; Ouardi, S.; Müller, J. Upgrading the Organic Fraction of Municipal Solid Waste by Low Temperature Hydrothermal Processes. Energies 2021, 14, 3041. [Google Scholar] [CrossRef]
  50. DIN EN ISO 18122:2016-03; Biogene Festbrennstoffe—Bestimmung des Aschegehaltes (ISO 18122:2015); Deutsche Fassung EN ISO 18122:2015. Beuth Verlag GmbH: Berlin, Germany, 2016.
  51. DIN EN ISO 16948:2015-09; Biogene Festbrennstoffe—Bestimmung des Gesamtgehaltes an Kohlenstoff, Wasserstoff und Stickstoff (ISO 16948:2015), Deutsche Fassung EN ISO 16948:2015. Beuth Verlag GmbH: Berlin, Germany, 2015.
  52. Prof. Dr.-Ing.H. Netz, Verbrennung und Gasgewinnung bei Festbrennstoffen, Technischer Verlag Resch KG, Gräfelfing 1982, 196 S., DIN A 5, Preis 38.-DM. Fette Seifen Anstrichm. 1982, 84, 322. [CrossRef]
  53. DIN EN ISO 11885:2009-09; Wasserbeschaffenheit—Bestimmung von Ausgewählten Elementen durch Induktiv Gekoppelte Plasma-Atom-Emissionsspektrometrie (ICP-OES) (ISO 11885:2007). Deutsche Fassung EN ISO 11885:2009. Beuth Verlag GmbH: Berlin, Germany, 2009.
  54. Overend, R.P.; Chornet, E.; Gascoigne, J.A. Fractionation of lignocellulosics by steam-aqueous pretreatments. Philos. Trans. R. Soc. Lond. A 1987, 321, 523–536. [Google Scholar] [CrossRef]
  55. Suwelack, K.; Dostert, N.; Wüst, D.; Kruse, A. Economics of hydrothermal carbonization of biogas digestate in a hybrid AD-HTC plant. In Proceedings of the 24th European Biomass Conference and Exhibition, Amsterdam, The Netherlands, 6–9 June 2016. [Google Scholar]
  56. Fang, Z.; Sato, T.; Smith, R.L.; Inomata, H.; Arai, K.; Kozinski, J.A. Reaction chemistry and phase behavior of lignin in high-temperature and supercritical water. Bioresour. Technol. 2008, 99, 3424–3430. [Google Scholar] [CrossRef] [PubMed]
  57. Ekpo, U.; Ross, A.B.; Camargo-Valero, M.A.; Williams, P.T. A comparison of product yields and inorganic content in process streams following thermal hydrolysis and hydrothermal processing of microalgae, manure and digestate. Bioresour. Technol. 2016, 200, 951–960. [Google Scholar] [CrossRef] [PubMed]
  58. Hoekman, S.K.; Broch, A.; Felix, L.; Farthing, W. Hydrothermal carbonization (HTC) of loblolly pine using a continuous, reactive twin-screw extruder. Energy Convers. Manag. 2017, 134, 247–259. [Google Scholar] [CrossRef] [Green Version]
  59. Garlapalli, R.K.; Wirth, B.; Reza, M.T. Pyrolysis of hydrochar from digestate: Effect of hydrothermal carbonization and pyrolysis temperatures on pyrochar formation. Bioresour. Technol. 2016, 220, 168–174. [Google Scholar] [CrossRef]
  60. Ramke, H.-G.; Blöhse, D.; Lehmann, H.-J.; Antoniertti, M.; Fettig, J. Machbarkeitsstudie zur Energiegewinnung aus Organischen Siedlungsabfällen durch Hydrothermale Carbonisierung; Deutsche Bundesstiftung Umwelt (DBU): Höxter, Germany, 2010; Available online: https://www.dbu.de/OPAC/ab/DBU-Abschlussbericht-AZ-25604.pdf (accessed on 28 April 2021).
  61. Parshetti, G.K.; Kent Hoekman, S.; Balasubramanian, R. Chemical, structural and combustion characteristics of carbonaceous products obtained by hydrothermal carbonization of palm empty fruit bunches. Bioresour. Technol. 2013, 135, 683–689. [Google Scholar] [CrossRef]
  62. Reza, M.T.; Andert, J.; Wirth, B.; Busch, D.; Pielert, J.; Lynam, J.G.; Mumme, J. Hydrothermal Carbonization of Biomass for Energy and Crop Production. Appl. Bioenergy 2014, 1, 11–29. [Google Scholar] [CrossRef]
  63. Falco, C.; Baccile, N.; Titirici, M.-M. Morphological and structural differences between glucose, cellulose and lignocellulosic biomass derived hydrothermal carbons. Green Chem. 2011, 13, 3273. [Google Scholar] [CrossRef] [Green Version]
  64. prEN ISO 17225-8:2016; Biogene Festbrennstoffe—Brennstoffspezifikationen und Klassen. Teil 8 Klassifizierung von Thermisch Behandelten und Gepressten Brennstoffen aus Biomasse: Solid Biofuels—Fuel Specifications and Classes, Graded Thermally Treated and Densified Biomass Fuels. Beuth Verlag GmbH: Berlin, Germany, 2016.
  65. Geffert, A.; Geffertova, J.; Dudiak, M. Direct Method of Measuring the pH Value of Wood. Forests 2019, 10, 852. [Google Scholar] [CrossRef] [Green Version]
  66. Du, F.-L.; Du, Q.-S.; Dai, J.; Tang, P.-D.; Li, Y.-M.; Long, S.-Y.; Xie, N.-Z.; Wang, Q.-Y.; Huang, R.-B. A comparative study for the organic byproducts from hydrothermal carbonizations of sugarcane bagasse and its bio-refined components cellulose and lignin. PLoS ONE 2018, 13, e0197188. [Google Scholar] [CrossRef] [PubMed] [Green Version]
  67. Werpy, T.; Petersen, G. Top Value Added Chemicals from Biomass: Volume I—Results of Screening for Potential Candidates from Sugars and Synthesis Gas; DOE/GO-102004-1992; National Renewable Energy Laboratory: Golden, CO, USA, 2004. Available online: https://www.osti.gov/biblio/15008859-top-value-added-chemicals-from-biomass-volume-results-screening-potential-candidates-from-sugars-synthesis-gas (accessed on 28 April 2021).
  68. Bozell, J.J.; Petersen, G.R. Technology development for the production of biobased products from biorefinery carbohydrates—the US Department of Energy’s “Top 10” revisited. Green Chem. 2010, 12, 539. [Google Scholar] [CrossRef]
  69. Vanoye, L.; Fanselow, M.; Holbrey, J.D.; Atkins, M.P.; Seddon, K.R. Kinetic model for the hydrolysis of lignocellulosic biomass in the ionic liquid, 1-ethyl-3-methyl-imidazolium chloride. Green Chem. 2009, 11, 390. [Google Scholar] [CrossRef]
  70. Jeder, A. Carbon Materials Synthesis by Hydrothermal Carbonization of Olive Stones: Process and Product Characterization; Université de Lorraine Université de Gabès (Tunisie). Ph.D. Thesis, University of Lorraine, Lorraine, France, 2018. [Google Scholar]
  71. Huang, Y.-B.; Yang, Z.; Dai, J.-J.; Guo, Q.-X.; Fu, Y. Production of high quality fuels from lignocellulose-derived chemicals: A convenient C–C bond formation of furfural, 5-methylfurfural and aromatic aldehyde. RSC Adv. 2012, 2, 11211. [Google Scholar] [CrossRef]
  72. Delidovich, I.; Leonhard, K.; Palkovits, R. Cellulose and hemicellulose valorisation: An integrated challenge of catalysis and reaction engineering. Energy Environ. Sci. 2014, 7, 2803. [Google Scholar] [CrossRef]
  73. Borrero-López, A.M.; Fierro, V.; Jeder, A.; Ouederni, A.; Masson, E.; Celzard, A. High added-value products from the hydrothermal carbonisation of olive stones. Environ. Sci. Pollut. Res. 2017, 24, 9859–9869. [Google Scholar] [CrossRef]
  74. Kumar, M.; Myagmardoloonjin, B.; Keshari, S.; Negari, I.P.; Huang, C.-M. 5-methyl Furfural Reduces the Production of Malodors by Inhibiting Sodium l-lactate Fermentation of Staphylococcus epidermidis: Implication for Deodorants Targeting the Fermenting Skin Microbiome. Microorganisms 2019, 7, 239. [Google Scholar] [CrossRef] [Green Version]
Figure 1. H/C and O/C ratios based on mean values for the digestate (DG) and forest residue (FR) of raw and hydrothermally treated solids at different temperatures (130–170 °C) and holding times (30–90 min). Single measurements can be found in Appendix A.
Energies 15 03738 g001
Figure 2. GC-MS diagram of the digestate (DG) hydrothermally treated at 130 °C with 30, 60 and 90 min holding times, see peak numbers in Table 6.
Energies 15 03738 g002
Figure 3. GC-MS diagram of the digestate (DG) hydrothermally treated at 130, 150 and 170 °C with a 60 min holding time, see peak numbers in Table 6.
Energies 15 03738 g003
Figure 4. GC-MS diagram of the digestate (DG) hydrothermally treated at 170 °C with 30, 60 and 90 min holding times, see peak numbers in Table 6.
Energies 15 03738 g004
Figure 5. GC-MS diagram of the forest residue (FR) hydrothermally treated at 130 °C with 30, 60 and 90 min holding times, see peak numbers in Table 6.
Energies 15 03738 g005
Figure 6. GC-MS diagram of the forest residue (FR) hydrothermally treated at 130, 150 and 170 °C with a 60 min holding time, see peak numbers in Table 6.
Energies 15 03738 g006
Figure 7. GC-MS diagram of the forest residue (FR) hydrothermally treated at 170 °C with 30, 60 and 90 min holding times, see peak numbers in Table 6.
Energies 15 03738 g007
Figure 8. Dry matter (DM) based on mean values ± standard deviations of different elements for the raw and hydrothermally treated digestate (DG) at 130, 150 and 170 °C with a holding time of 60 min. Numerical values can be found in Appendix A.
Energies 15 03738 g008
Figure 9. Dry matter (DM) based on mean values ± standard deviations of different elements for the raw and hydrothermally treated forest residue (FR) at 130, 150 and 170 °C with a holding time of 60 min. Numerical values can be found in Appendix A.
Energies 15 03738 g009
Figure 10. Dry matter (DM) based on mean values ± standard deviations of different elements for raw materials and solids provided by hydrothermal treatment of the digestate (DG) at 130 and 170 °C with 30, 60 and 90 min holding times. Numerical values can be found in Appendix A.
Energies 15 03738 g010
Figure 11. Dry matter (DM) based on mean values ± standard deviations of different elements for raw materials and solids provided by hydrothermal treatment of the forest residue (FR) at 130 and 170 °C with 30, 60 and 90 min holding times. Numerical values can be found in Appendix A.
Energies 15 03738 g011
Table 1. Experimental setup with different treatment temperatures and different holding time variants for the hydrothermal treatment of forest residues and digestate.
Temperature (°C)Variant 1
Ramp/Holding Time
Variant 2
Ramp/Holding Time
Variant 3
Ramp/Holding Time
1705.00 °C × min−1/30 min5.00 °C × min−1/60 min5 °C × min−1/90 min
150-4.33 °C × min−1/60 min-
1303.67 °C × min−1/30 min3.67 °C × min−1/60 min3.67 °C × min−1/90 min
Table 2. Severity factors (SFs) that were reached with different treatment temperatures and holding times during the hydrothermal treatment experiments as shown in Table 1.
Temperature (°C)Holding Time (min)SF
130302.4
130602.7
130902.8
150603.3
170303.5
170603.8
170904.0
Table 3. Material properties of raw and hydrothermally treated digestate (DG) at 130, 150 and 170 °C with a holding time of 30, 60 and 90 min. The dry matter (DM), higher heating value (HHV) and lower heating value (LHV) are shown. Mean values ± standard deviations.
Parameter, unit DG
Raw
DG
130 °C|30 min
DG
130 °C|60 min
DG
130 °C|90 min
DG
150 °C|60 min
DG
170 °C|30 min
DG
170 °C|60 min
DG
170 °C|90 min
mass loss, %DM-26.14 ± 0.1830.69 ± 0.5731.46 ± 0.3535.70 ± 1.4435.84 ± 0.0638.49 ± 0.0139.32 ± 0.96
ash, %DM26.67 ± 0.048.68 ± 0.028.86 ± 0.039.82 ± 0.0611.48 ± 0.0211.80 ± 0.0412.17 ± 0.0114.64 ± 0.02
C, %DM40.66 ± 0.2748.16 ± 0.7149.31 ± 0.7150.98 ± 0.2951.49 ± 0.2051.53 ± 0.1450.34 ± 0.5849.50 ± 0.44
H, %DM5.02 ± 0.035.72 ± 0.165.60 ± 0.136.00 ± 0.185.87 ± 0.175.79 ± 0.135.62 ± 0.115.44 ± 0.20
O, %DM c25.28 ± 0.2634.41 ± 0.8532.82 ± 0.6030.22 ± 0.4728.03 ± 0.2927.96 ± 0.0829.03 ± 0.6027.39 ± 0.61
N, %DM2.37 ± 0.043.03 ± 0.123.41 ± 0.162.98 ± 0.033.13 ± 0.092.92 ± 0.062.84 ± 0.043.03 ± 0.04
S, %DM0.22 ± 0.01<0.01<0.01<0.01<0.01<0.01<0.01<0.01
H/C1.471.411.351.401.361.341.331.31
O/C0.470.540.500.450.410.410.430.42
HHV, MJ/kgDM a16.5519.3819.8620.6420.8220.7720.2019.83
LHV, MJ/kgDM b16.3118.6019.0820.3020.6020.5319.8419.57
a Calculated according to Equation (3); b calculated according to Equation (2); c calculated according to Equation (1).
Table 4. Material properties of raw and hydrothermally treated forest residue (FR) at 130, 150 and 170 °C with a holding time of 30, 60 and 90 min. The dry matter (DM), higher heating value (HHV) and lower heating value (LHV) are shown. Mean values ± standard deviations.
ParameterFr
Raw
FR
130 °C|30 min
FR
130 °C|60 min
FR
130 °C|90 min
FR
150 °C|60 min
FR
170 °C|30 min
FR
170 °C|60 min
FR
170 °C|90 min
mass loss, %DM 26.94 ± 3.1934.65 ± 0.7235.43 ± 2.5037.44 ± 0.8438.00 ± 1.4541.29 ± 0.8043.80 ± 0.81
ash, %DM0.95 ± 0.020.68 ± 0.020.65 ± 0.030.64 ± 0.020.58 ± 0.010.65 ± 0.030.62 ± 0.030.74 ± 0.04
C, %DM51.00 ± 0.0750.57 ± 0.2251.44 ± 0.4850.12 ± 0.3850.70 ± 0.0950.85 ± 0.2651.68 ± 0.2551.78 ± 0.30
H, %DM6.31 ± 0.015.90 ± 0.065.93 ± 0.205.86 ± 0.115.94 ± 0.065.77 ± 0.175.81 ± 0.075.75 ± 0.21
O, %DM c41.32 ± 0.0842.25 ± 0.2441.21 ± 0.7242.47 ± 0.4041.82 ± 0.1441.71 ± 0.2240.90 ± 0.2940.59 ± 0.46
N, %DM0.43 ± 0.010.61 ± 0.080.76 ± 0.060.91 ± 0.070.97 ± 0.041.02 ± 0.040.98 ± 0.021.13 ± 0.03
S, %DM0.012<0.01<0.01<0.01<0.01<0.01<0.01<0.01
H/C1.471.391.371.391.401.351.341.32
O/C0.610.630.600.640.620.620.590.59
HHV, MJ/kgDM a20.4620.1220.5220.1020.2420.2420.6020.63
LHV, MJ/kgDM b19.2318.6119.0618.5618.7618.6719.0919.11
a Calculated according to Equation (3); b calculated according to Equation (2); c calculated according to Equation (1).
Table 5. pH values of the liquid products originating from the hydrothermal treatment of the digestate (DG) and forest residue (FR) at different temperatures and holding times.
130 °C
30 min
130 °C
60 min
130 °C
90 min
150 °C
60 min
170 °C
30 min
170 °C
60 min
170 °C
90 min
DG4.563.563.543.563.293.372.96
FR1.412.061.982.492.622.552.51
Table 6. Summary of selected compounds detected by GC-MS in the digestate (DG) and forest residue (FR) liquids that were generated by hydrothermal treatment. The peak numbers (Peak No.) are connected to Figure 2, Figure 3, Figure 4, Figure 5, Figure 6 and Figure 7.
Peak No.CompoundMean Retention Time
1Acetic acid5.23
2Hexanal6.73
3Furfural7.51
4Benzaldehyde10.52
55-Methylfurfural10.58
6Heptanonitrile10.97
7Benzonitrile11.16
82-Octanol, (R)-11.40
9Cyclohexanone,2,2,6-trimethyl12.27
10Benzeneacetaldehyde12.49
11Guaiacol13.50
12.alpha.-Campholenal13.66
131-Nonanol or 1-Heptanol,6-methyl14.36
14Camphor14.81
15Bicyclo[3.1.1]heptan-3-one,2,6,6-trimethyl(1.alpha.,2.alpha.,5.alpha)-15.16
16Ethanone, 1-(4-methylphenyl) or Ethanone, 1-(2-methylphenyl) or Ethanone, 1-(3-methylphenyl) 15.61
17Carvenone17.15
18Nonanoic acid17.20
19Octanenitrile17.68
202-Methoxy-4-vinylphenol or Phenol,5-ethyl-,2-methoxy or 4-hydroxy-2-methylacetophenone18.20
21Phenol, 2-methoxy-3(2-propenyl) or Eugenol or trans-isoeugenol or 3-Allyl-6-methoxyphenol19.16
22Ethanol, 2-(2-butoxyethoxy)-acetate 19.19
23Vanillin 20.22
242(4H)-Benzofuranone,5,6,7,7a-tetrahydro-4,4,7a-trimethyl-,(R)-24.18
254-Nitroguajacol or 5-Nitroguajacol24.28
26Butyrovanillone25.08
27Phenol,2-4,dinitro-6-methoxy27.25
28n-Hexadecanoic acid28.53
29Squalene28.67
30Naphthol[2.1-b]furan-2(1H)-one,decahydro-3a,6,6,9a-tetramethyl-[3as-(3a.alpha.,5a.alpha.,9a.beta.,9b.alpha)]29.15
Publisher’s Note: MDPI stays neutral with regard to jurisdictional claims in published maps and institutional affiliations.

