
The Fouling Effect on Commercial Ceramic Membranes during Filtration of Microalgae Chlorella vulgaris and Monoraphidium contortum


1
Department of Aquatic Bioengineering and Aquaculture, Faculty of Food Sciences and Fisheries, West Pomeranian University of Technology Szczecin, 70-310 Szczecin, Poland
2
Faculty of Chemical Technology, Poznań University of Technology, 60-965 Poznań, Poland
*
Author to whom correspondence should be addressed.
Energies 2022, 15(10), 3745; https://0-doi-org.brum.beds.ac.uk/10.3390/en15103745
Submission received: 18 April 2022
/
Revised: 12 May 2022
/
Accepted: 18 May 2022
/
Published: 19 May 2022
(This article belongs to the Special Issue Practical and Scientific Aspects of Multiphase Systems)
Abstract
:Although interest in the use of membranes for the concentration of microalgal biomass has steadily been growing, little is known regarding the phenomena of membrane fouling. In addition, more attention has been given to polymeric membranes compared to ceramic membranes, which have a longer life that is associated with a higher resistance to aggressive chemical cleaning. In this study, microfiltration (MF) and ultrafiltration (UF) of two microalgae species, Chlorella vulgaris and Monoraphidium contortum, were carried out using tubular crossflow ceramic membranes. Permeate flux was measured, resistance was calculated, and dissolved organic carbon (DOC) was determined. The flux reduction during the first 10 min of filtration was higher for MF than UF (>70% and <50%), and steady-state permeate fluxes were <5% (for MF) and <25% (for UF) of initial (in m3 m−2 s−1) 6.2 × 10⁻⁴ (for MF) and 1.7 × 10⁻⁴ (for UF). Total resistances (in m−1) were in the ranges of 4.2–5.4 × 10¹² (UF) and 2.6–3.1 × 10¹² (MF) for M. contortum and C. vulgaris, respectively. DOC reduction was higher for UF membrane (>80%) than for MF (<66%) and DOC concentrations (mg C L−1) in permeates following MF and UF were about five and two, respectively. In conclusion, we demonstrated: (i) higher irreversible resistance for UF and reversible resistance for MF; (ii) permeate flux higher for UF and for M. contortum; (iii) the significant role of dissolved organic compounds in the formation of reversible resistance for MF and irreversible resistance for UF.
1. Introduction
Microalgae are an excellent source of valuable organic compounds and biomass for renewable energy (oil and carbohydrates that can be converted to bioethanol by fermentation). Microalgae biomass is rich in protein and low in lignin, so it can be used to produce dietary supplements, cosmetics, pharmaceuticals, etc. [1,2,3]. At the same time, microalgae can be grown without competing for arable land, and in harsh conditions (e.g., salt water) and recirculating systems as an additional component of the water purification system. Such purification systems (photobioreactors producing microalgae biomass) can be successfully used, for example, during intensive fish farming in recirculating aquaculture systems (RAS) where the water is abundant in nutrients necessary for microalgae [4,5,6].
Despite the high advantages of microalgae, there is a major challenge of obtaining adequately concentrated biomass before the further drying, extraction, conversion and subsequent stages of processing [7,8]. It has been estimated that about 90% of expenditures for microalgal biomass production are associated with harvesting and dewatering [9]. Flocculation, flotation, sedimentation and electro-flocculation are primary harvesting operations, but display operational issues as the microalgal suspension has a similar density to water, and some of the procedures can be energy intensive. Significant disadvantages also include contamination of the biomass with precipitants [5,10]. The quality of biofuel may also be adversely affected by the use of chemicals, resulting in the need for additional treatment [11].
Promising alternatives are processes based on the use of membranes, such as in microfiltration (MF) and ultrafiltration (UF), widely used in the separation, recovery and fractionation of biomolecules from various types of streams, such as wastewaters, by-products and natural sources [3,6,12,13].
Membrane technology is limited by inevitable membrane fouling and still not completely explained mass transport mechanisms [3]. Usually, in ultrafiltration, the permeate flux is higher than in microfiltration [14,15] but the opposite situation has also been reported [16]. The discrepancies may result from the hydrodynamic conditions and microalgae culture characteristics, and consequently on concentration polarization, pore blocking and cake formation, which can be explained by the resistance-in-series model [11,17].
One of the basic parameters in membrane processes is the material, from which the membranes are made. The most widely used are organic (polymeric) membranes, while inorganic (e.g., ceramic) membranes are much less popular [17]. Ceramic membranes, although more expensive, are characterized by a higher resistance to chemical washing, which allows for their longer use in the technological process. Furthermore, the higher hydrophilicity of ceramic membranes results in their higher permeability and better resistance to fouling [7,8,17,18]. For example, Elcik et al. [15] studied polymeric membranes and noted severe membrane fouling in microalgae harvesting. One of the effects of the higher membrane fouling of polymeric membranes compared to ceramic membranes is the lower permeate flux in filtration [17]. A comparison of the flux variation depending on the membranes tested is presented in the Supplementary Material (Table S1).
As a variety of parameters (such as membrane material, pore size, transmembrane pressure, filtration mode: dead-end or cross-flow mode, feed composition) shape the complex separation processes, membrane technologies for microalgal dewatering are being systematically reviewed and discussed [19,20,21]. In addition, laboratory membranes are more frequently tested than commercial membranes, especially in regard to ceramic membranes [22]. For example, Purnima et al. [22] found that a kaolin-based tubular ceramic membrane they developed for cross-flow microfiltration of a microalgae solution provided high microalgae biomass recovery, but had a poor resistance to fouling. It has been suggested that the performance of commercial ceramic membranes is better than laboratory ceramic membranes in terms of steady-state maintenance, which is important to ensure the sustainability of the filtration process.
The objective of this study therefore was: (i) to investigate the resistance; (ii) to compare the permeate flux; (iii) to determine the effect of dissolved organic matter on fouling, during microfiltration and ultrafiltration through crossflow ceramic membranes of the microalgae Chlorella vulgaris and Monoraphidium contortum.
2. Methods
2.1. Cultivation of the Microalgae
Chlorella vulgaris (strain BA0166) and Monoraphidium contortum (strain BA0005) used in this study were purchased from the Culture Collection of Baltic Algae, maintained by the Institute of Oceanography, University of Gdańsk, Poland. C. vulgaris cells are spherical, with diameters ranging from 2–7 µm, whereas M. controtum cells have an elongated shape and are 1.3–4.5 µm in diameter and 7.5–12 µm long [4,15]. Microalgae were cultured in 100 L photobioreactors at 25 °C using F-2 medium (Sigma Aldrich, Darmstadt, Germany), and continuously aerated with filtered atmospheric air (flow rate 2 L min−1). A 16/8 h light/dark cycle was used to simulate natural light conditions with a light intensity of approximately 50,000 lux. The source of electromagnetic radiation was a 400 W HPS quartz lamp. Algal cultures were harvested on the 20th day (steady-state phase) of growth.
2.2. Determination of Algae Biomass Concentration
The concentration of dried microalgae biomass was determined gravimetrically. A sample was filtered through a pre-washed glass fiber filter (Whatman GF/F) and dried to a constant weight for 24 h at 105 °C. Analyses were performed in triplicate for each experiment, and the results (in g L−1) were reported as the average of the three measurements.
2.3. Dissolved Organic Carbon (DOC) Measurement
DOC (in mg C L−1) was measured in the feed, retentate and permeate. The filtrate and retentate were pre-centrifuged (2000× g for 10 min) and the resulting supernatant was then filtered through a glass filter (Whatman GF/F). DOC determination was performed in infrared using a VarioTOC SELECT high-temperature combustion analyzer from ELEMENTAR (Germany). The measurement comprised oxidation of carbon to CO2 at 850 °C. The carrier gas was pure oxygen and the sample was acidified with 1% H3PO4.
2.4. Membranes
Single-channel tubular ceramic membranes made of Al2O3/TiO2/ZrO2 (CeRamTM INSIDE TAMI Industries, Nyons, France) with a nominal pore size of 1.4 μm (microfiltration, MF) and 50 kDa (ultrafiltration UF) were used in this study. The inner diameter of the membrane was 6 mm and the length was 600 mm. The effective area of the membranes was 0.011 m2. The surface in contact with the fluid has an active layer that defines the porosity (cut-off) of the filter. The membranes were rinsed with deionized water before filtration. After each experiment, to achieve complete restoration of hydraulic permeability, the membranes were chemically cleaned with: (i) sodium hydroxide (10 g L−1) at 70 °C for 30 min; (ii) then nitric acid (V) (5 mL L−1) at 50 °C for 30 min; (iii) and a final rinse with deionized water to remove the nitric acid from the membrane, at a trans-membrane pressure of 60 kPa for MF and 160 kPa for UF. After the chemical washing process, the deionized water flux was approx. 2020 L h−1 m−2 for the MF membrane and approx. 600 L h−1 m−2 for the UF membrane.
2.5. Membrane Test Unit
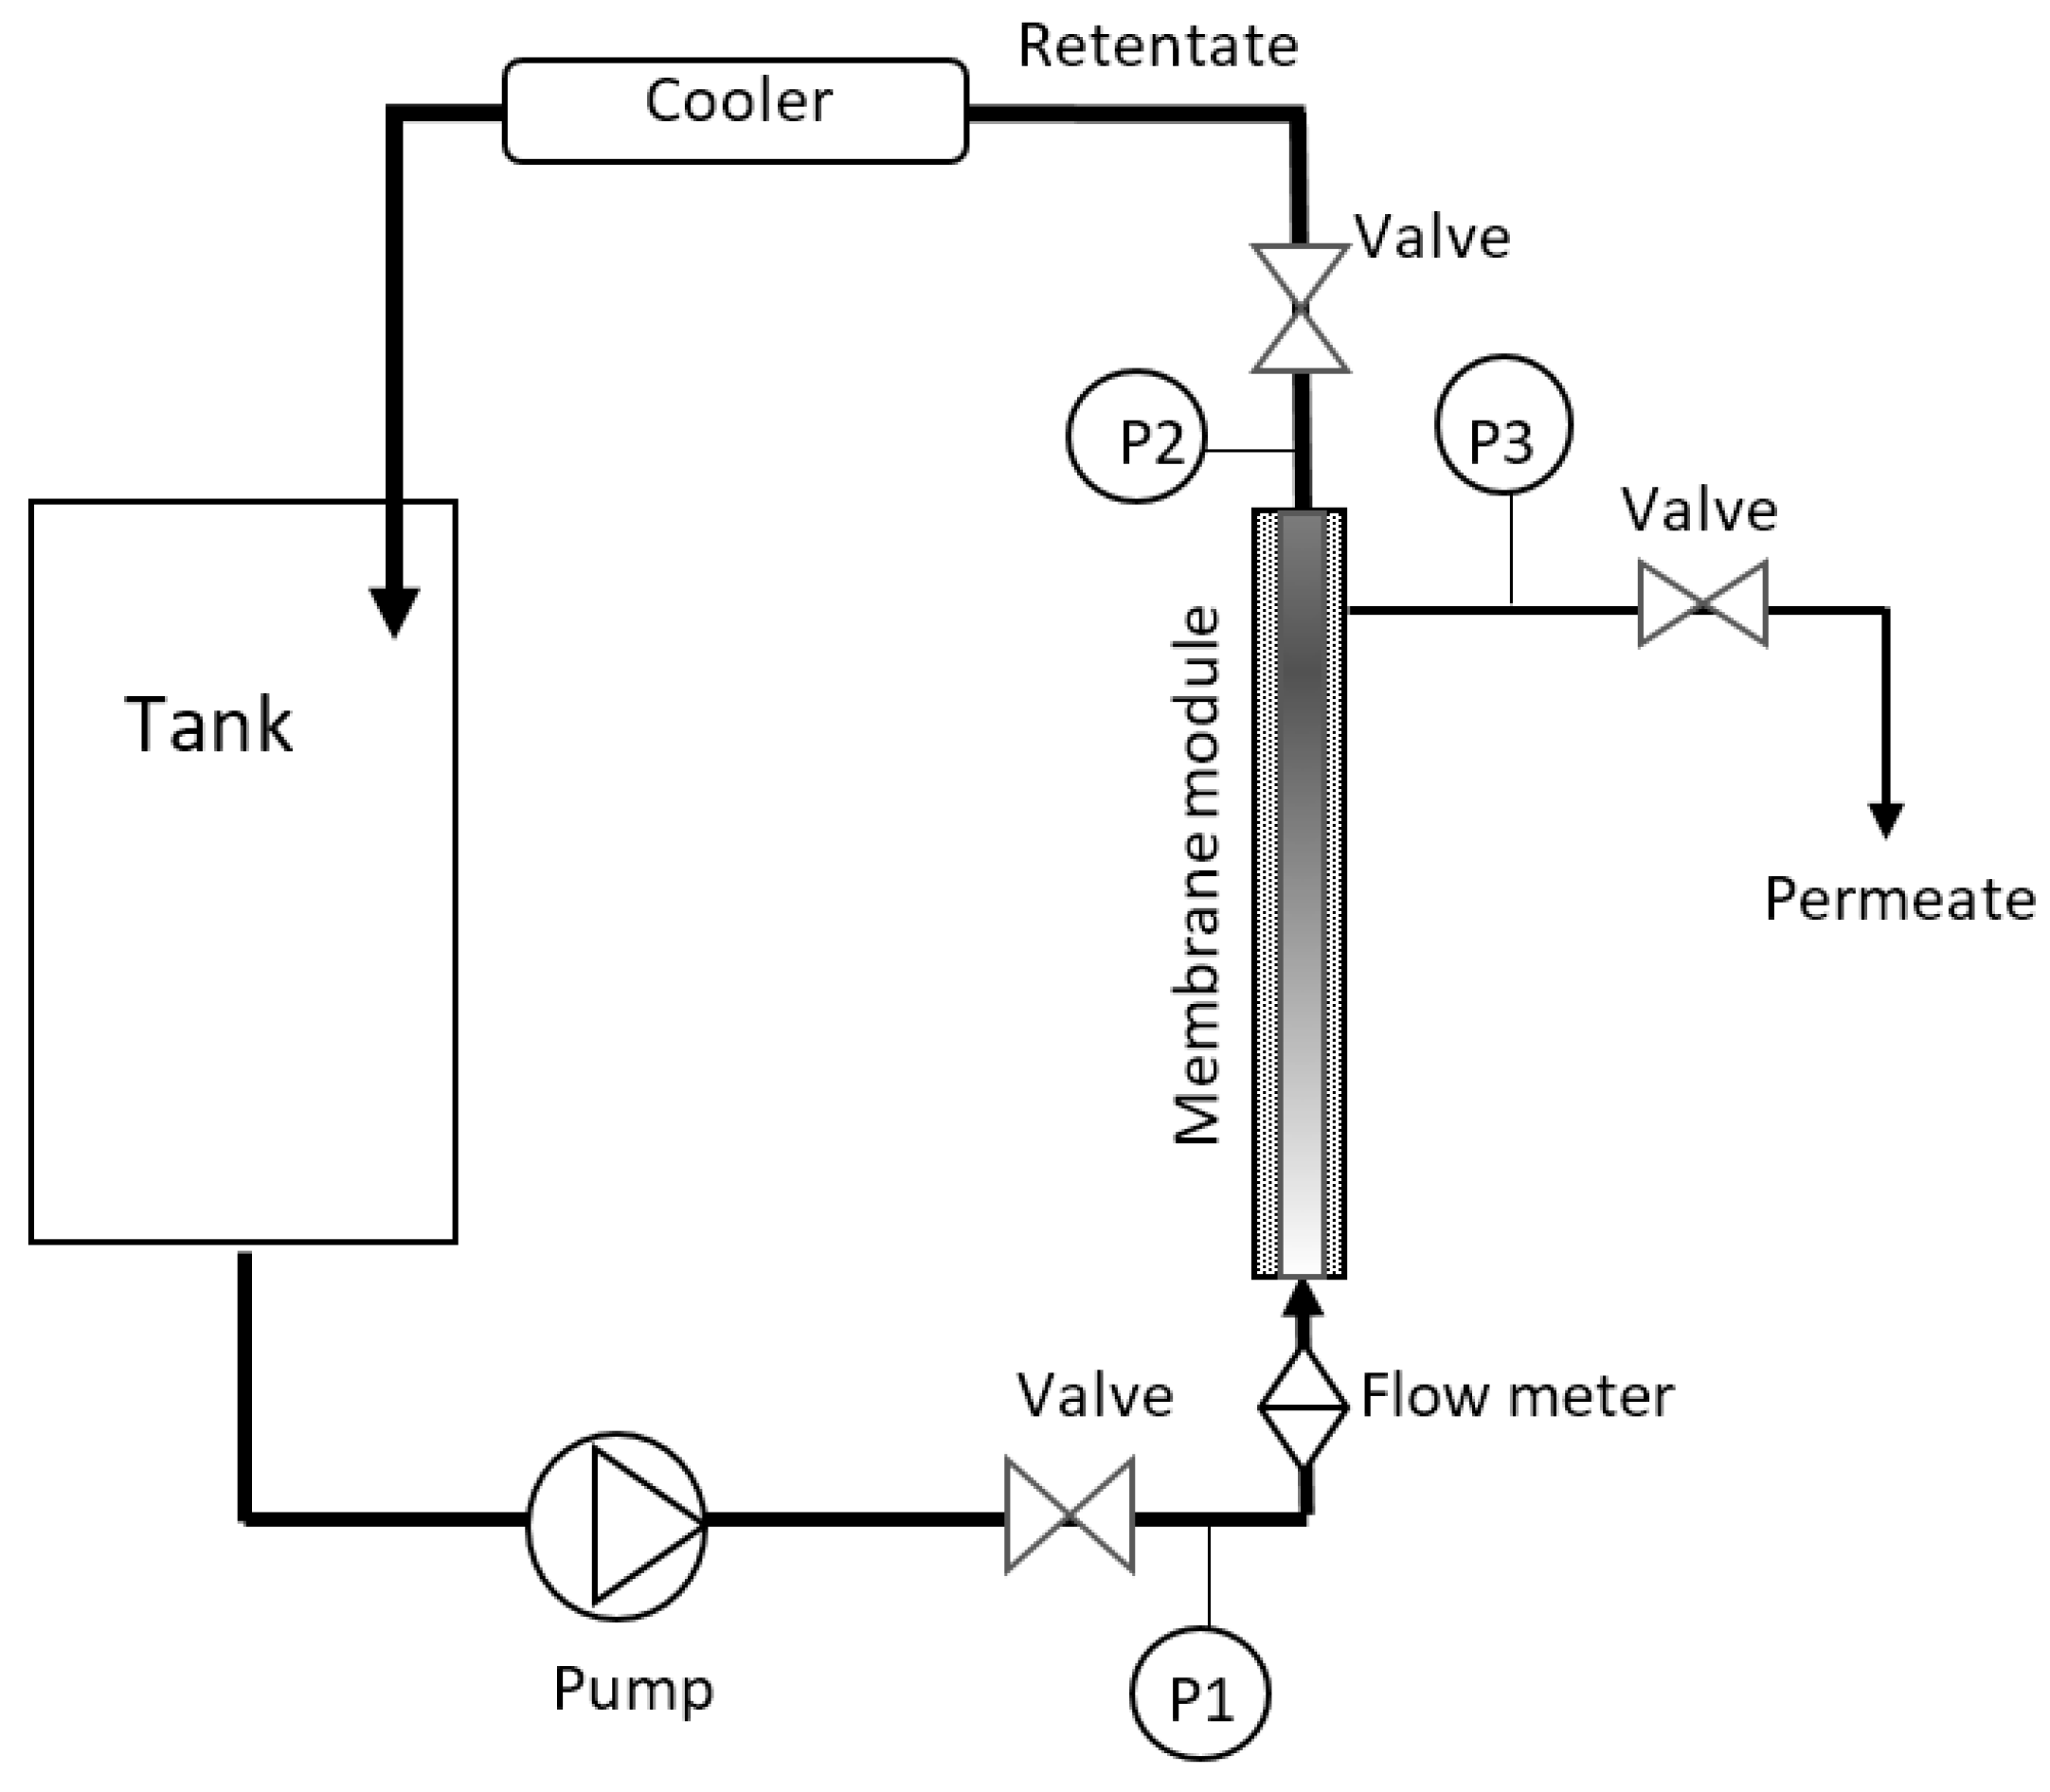
A laboratory crossflow membrane unit was used (Figure 1). The concentrate was returned to the feed tank and the permeate was collected in a beaker. All experiments were performed at 25 ± 2 °C, and maintained using a heat exchanger. The transmembrane pressure (TMP) was controlled by needle valves, and was calculated according to the equation: TMP = [(P1 + P2)/2] − P3; where P1, P2 and P3 are the pressures at the pressure gauges as in Figure 1.
2.6. Experimental Procedures
To evaluate the fouling effect of the microalgae C. vulgaris and M. contortum on the microfiltration (1.4 μm) and ultrafiltration (50 kDa) membranes, four experiments were conducted in triplicate. The transmembrane pressure was 60 kPa for MF and 160 kPa for UF. The filtration was performed for 2 h until the filtration flux reached a steady-state.
2.7. Measurement of Resistance
The following resistances [15,17] occur in the microalgae filtration process: clean membrane resistance (Rm); irreversible resistance (Rir); reversible resistance (Rr); and total hydraulic resistance (Rt)–the sum of all resistances. Rm is the resistance that occurs when water flows through a clean membrane. Rir is due to adsorption of microalgae debris and extracellular organic matters on the membrane (which might be removed by the chemical cleaning process). Rr is the resistance created by the deposition of microalgae cells on the membrane (which might be removed by washing the membrane with clean water). To estimate these resistances, permeate fluxes (in m3 m−2 s−1) were measured with clean water (at a TMP of 60 kPa for MF and 160 kPa for UF), immediately after microalgae filtration (Jf), after rinsing the membrane with clean distilled water to remove microalgae cells from the membrane surface (Jr), and after the chemical cleaning procedure of the membrane (Jc). The resistances were calculated as follows according to Darcy’s law [23]:
where TMP (Pa) and ηp (Pa s) represent the transmembrane pressure and dynamic viscosity of the permeate, respectively.
Jf = TMP/(ηp × Rt)
Rt = Rm + Rir + Rr
Rm = TMP/(ηp × Jc)
Rm + Rir = TMP/(ηp × Jr)
Rir = TMP/(ηp × Jr) − Rm
Rr = TMP/(ηp × Jf) − Rir − Rm
2.8. Statistical Analysis
The significance of differences was analyzed by Tukey’s HSD test (ANOVA) using Statistica v13.3 software from TIBCO Software Inc. (Palo Alto, CA, USA). The differences were considered significant at p < 0.05.
3. Results
3.1. Assessment of Flux
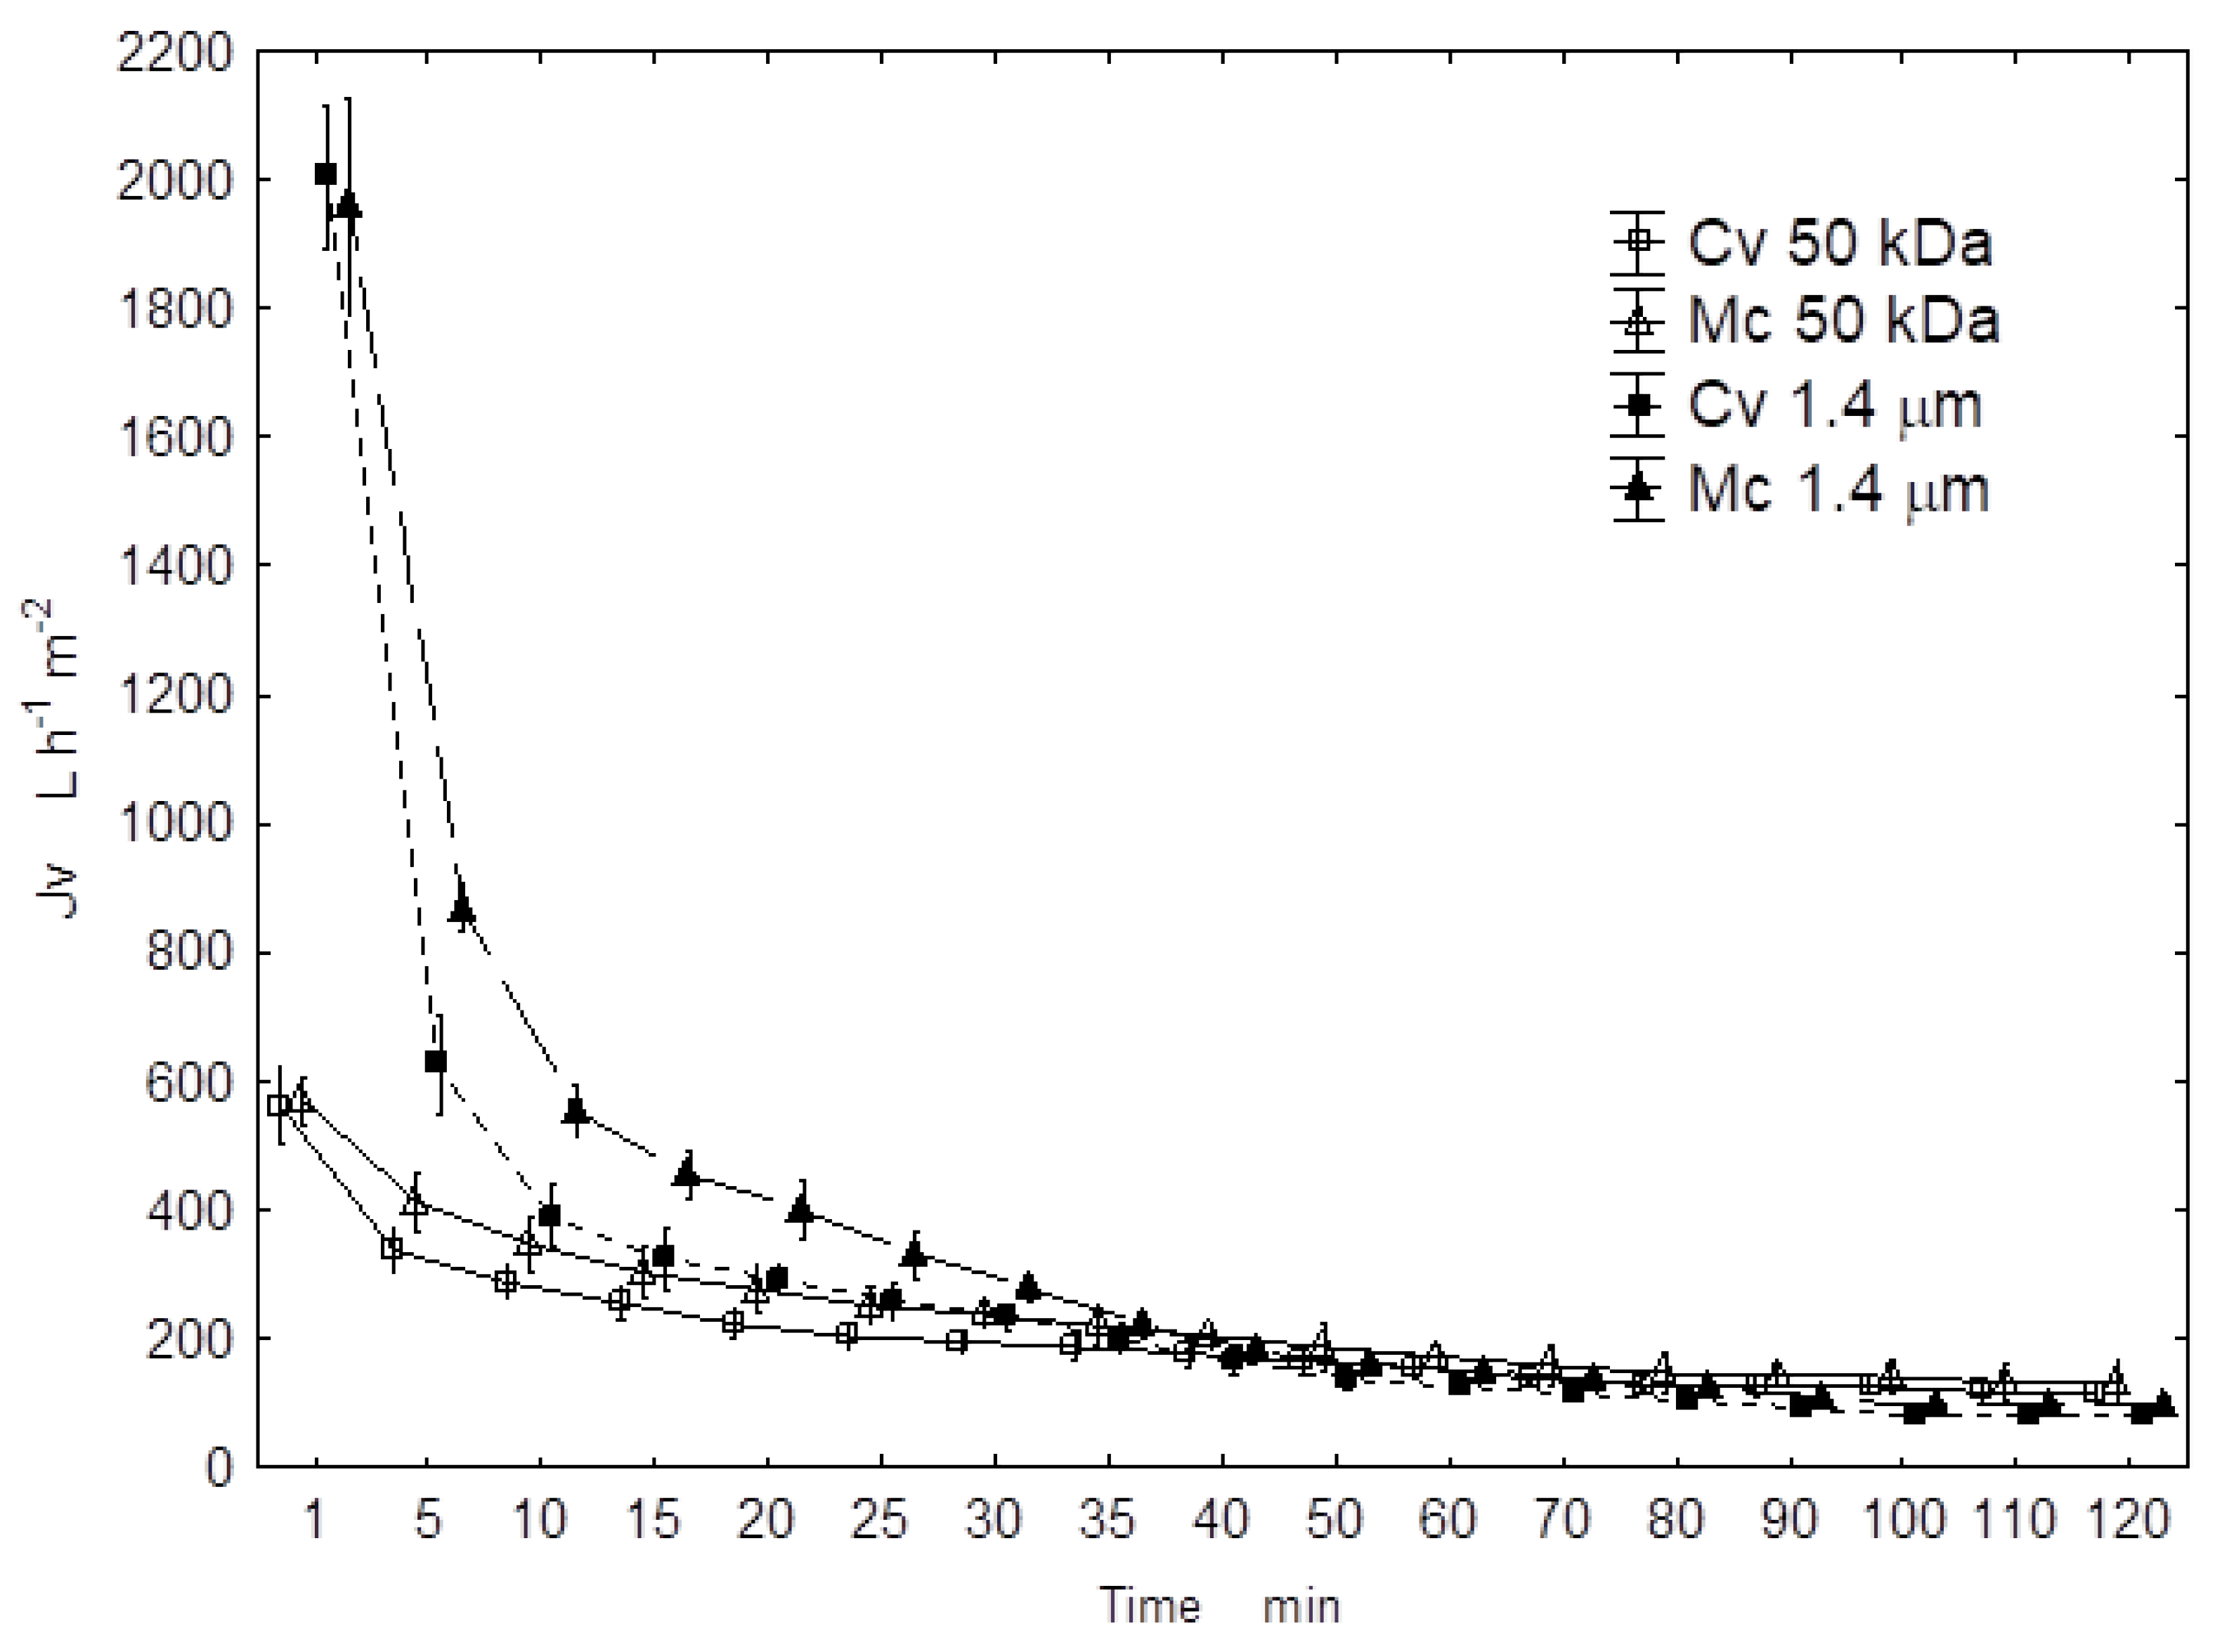
Initial and steady-state permeate fluxes in crossflow filtration are shown in Table 1. The highest initial fluxes were recorded for microalgae solutions filtered through a 1.4 μm pore size membrane (approximately 2000 L m−2 h−1) and were approximately 3.5× higher compared to the 50 kDa membrane.
Permeate fluxes reduced rapidly over the first 10 min of filtration (Figure 2). The flux reductions were 81% and 72% for MF, and 49% and 39% for UF (for C. vulgaris and M. contortum, respectively). In contrast, steady-state fluxes after 80 min of filtration were 4.4% and 5.3% of the initial flux in MF and 22% and 24% of the initial flux in UF (for C. vulgaris and M. contortum, respectively).
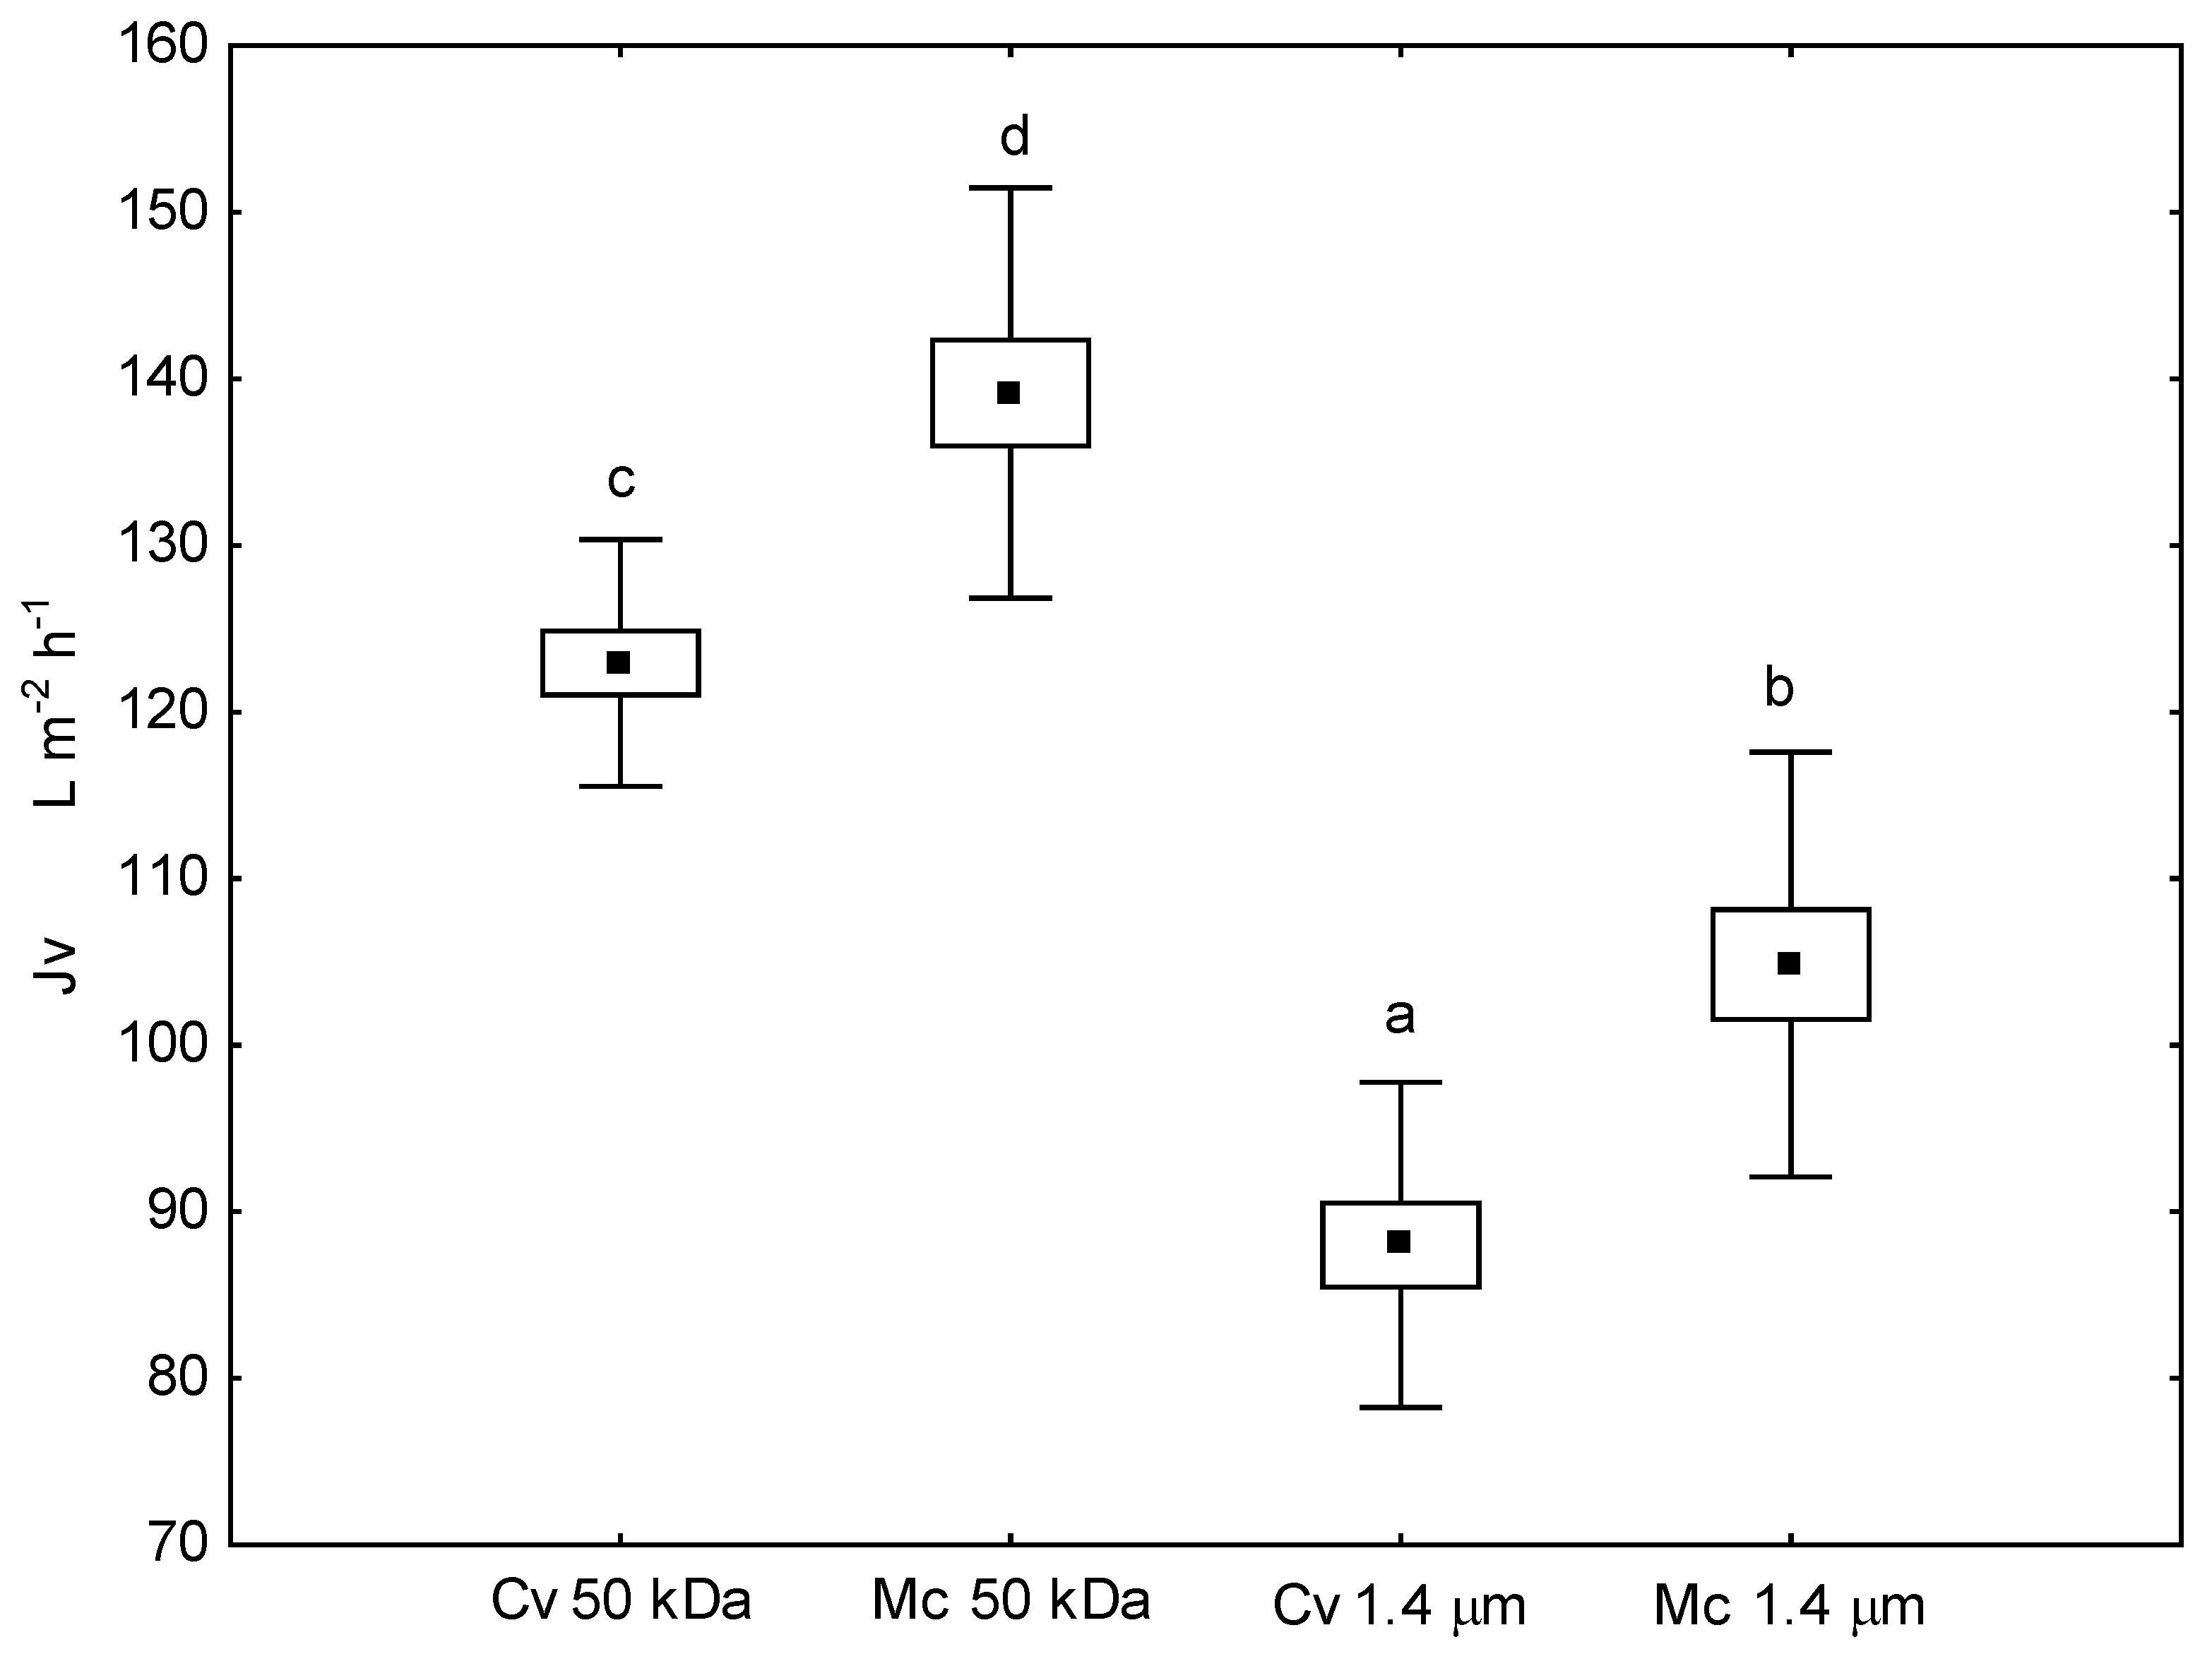
The steady-state permeate flux for the 1.4 μm membrane and 60 kPa TMP were lower (88 and 105 L m−2 h−1 for C. vulgaris and M. contortum, respectively) compared to the fluxes recorded for the 50 kDa membrane and 160 kPa TMP (123 and 139 L m−2 h−1 for C. vulgaris and M. contortum, respectively). At the same time, all steady-state fluxes were significantly (p < 0.05) different from one another (Figure 3).
3.2. Analysis of Fouling Resistance
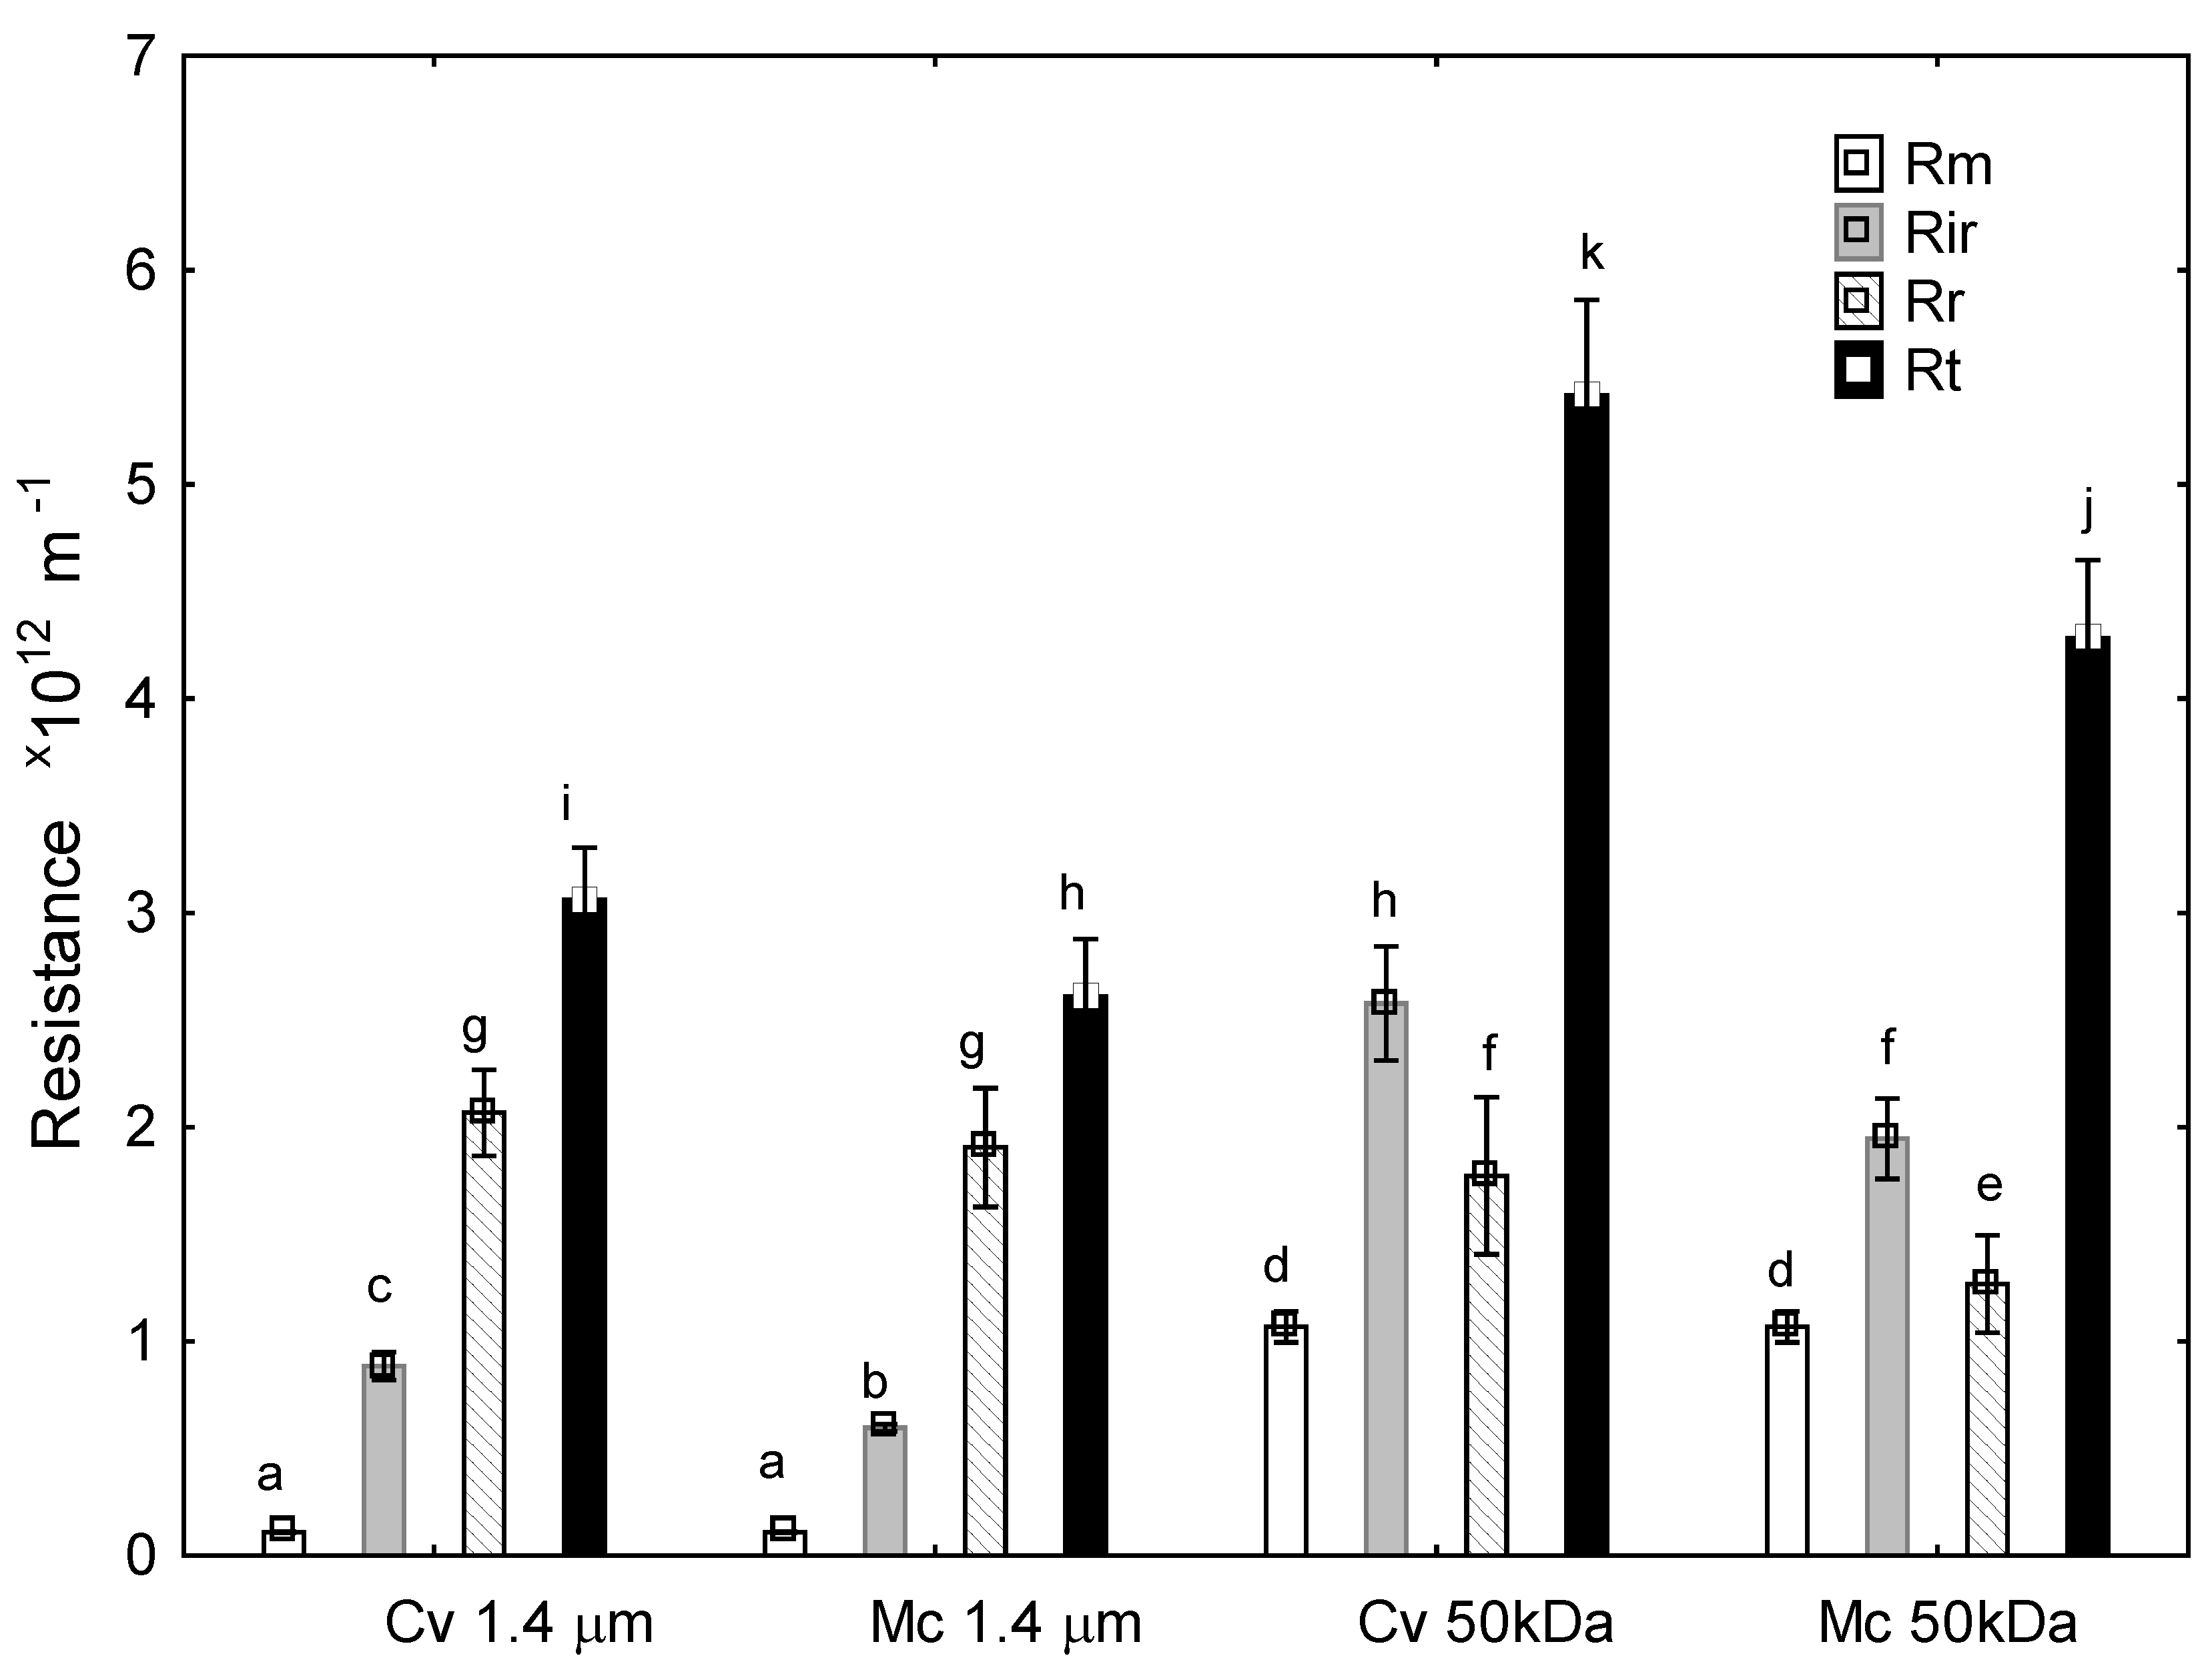
The fouling resistance obtained by microalgae filtration is shown in Figure 4. Rt significantly (p < 0.05) differed between the filtration tests. Higher Rt (as well as Rir and Rm) was recorded for the 50 kDa membrane than for the 1.4 μm membrane. On the other hand, Rr was significantly (p < 0.05) higher for the 1.4 μm membrane than for the 50 kDa membrane (Figure 4).
The resistance also differed depending on the filtered microalgae. Higher Rir, Rr, and Rt were recorded for C. vulgaris than for M. contortum through both the 1.4 μm and 50 kDa membranes (Figure 4).
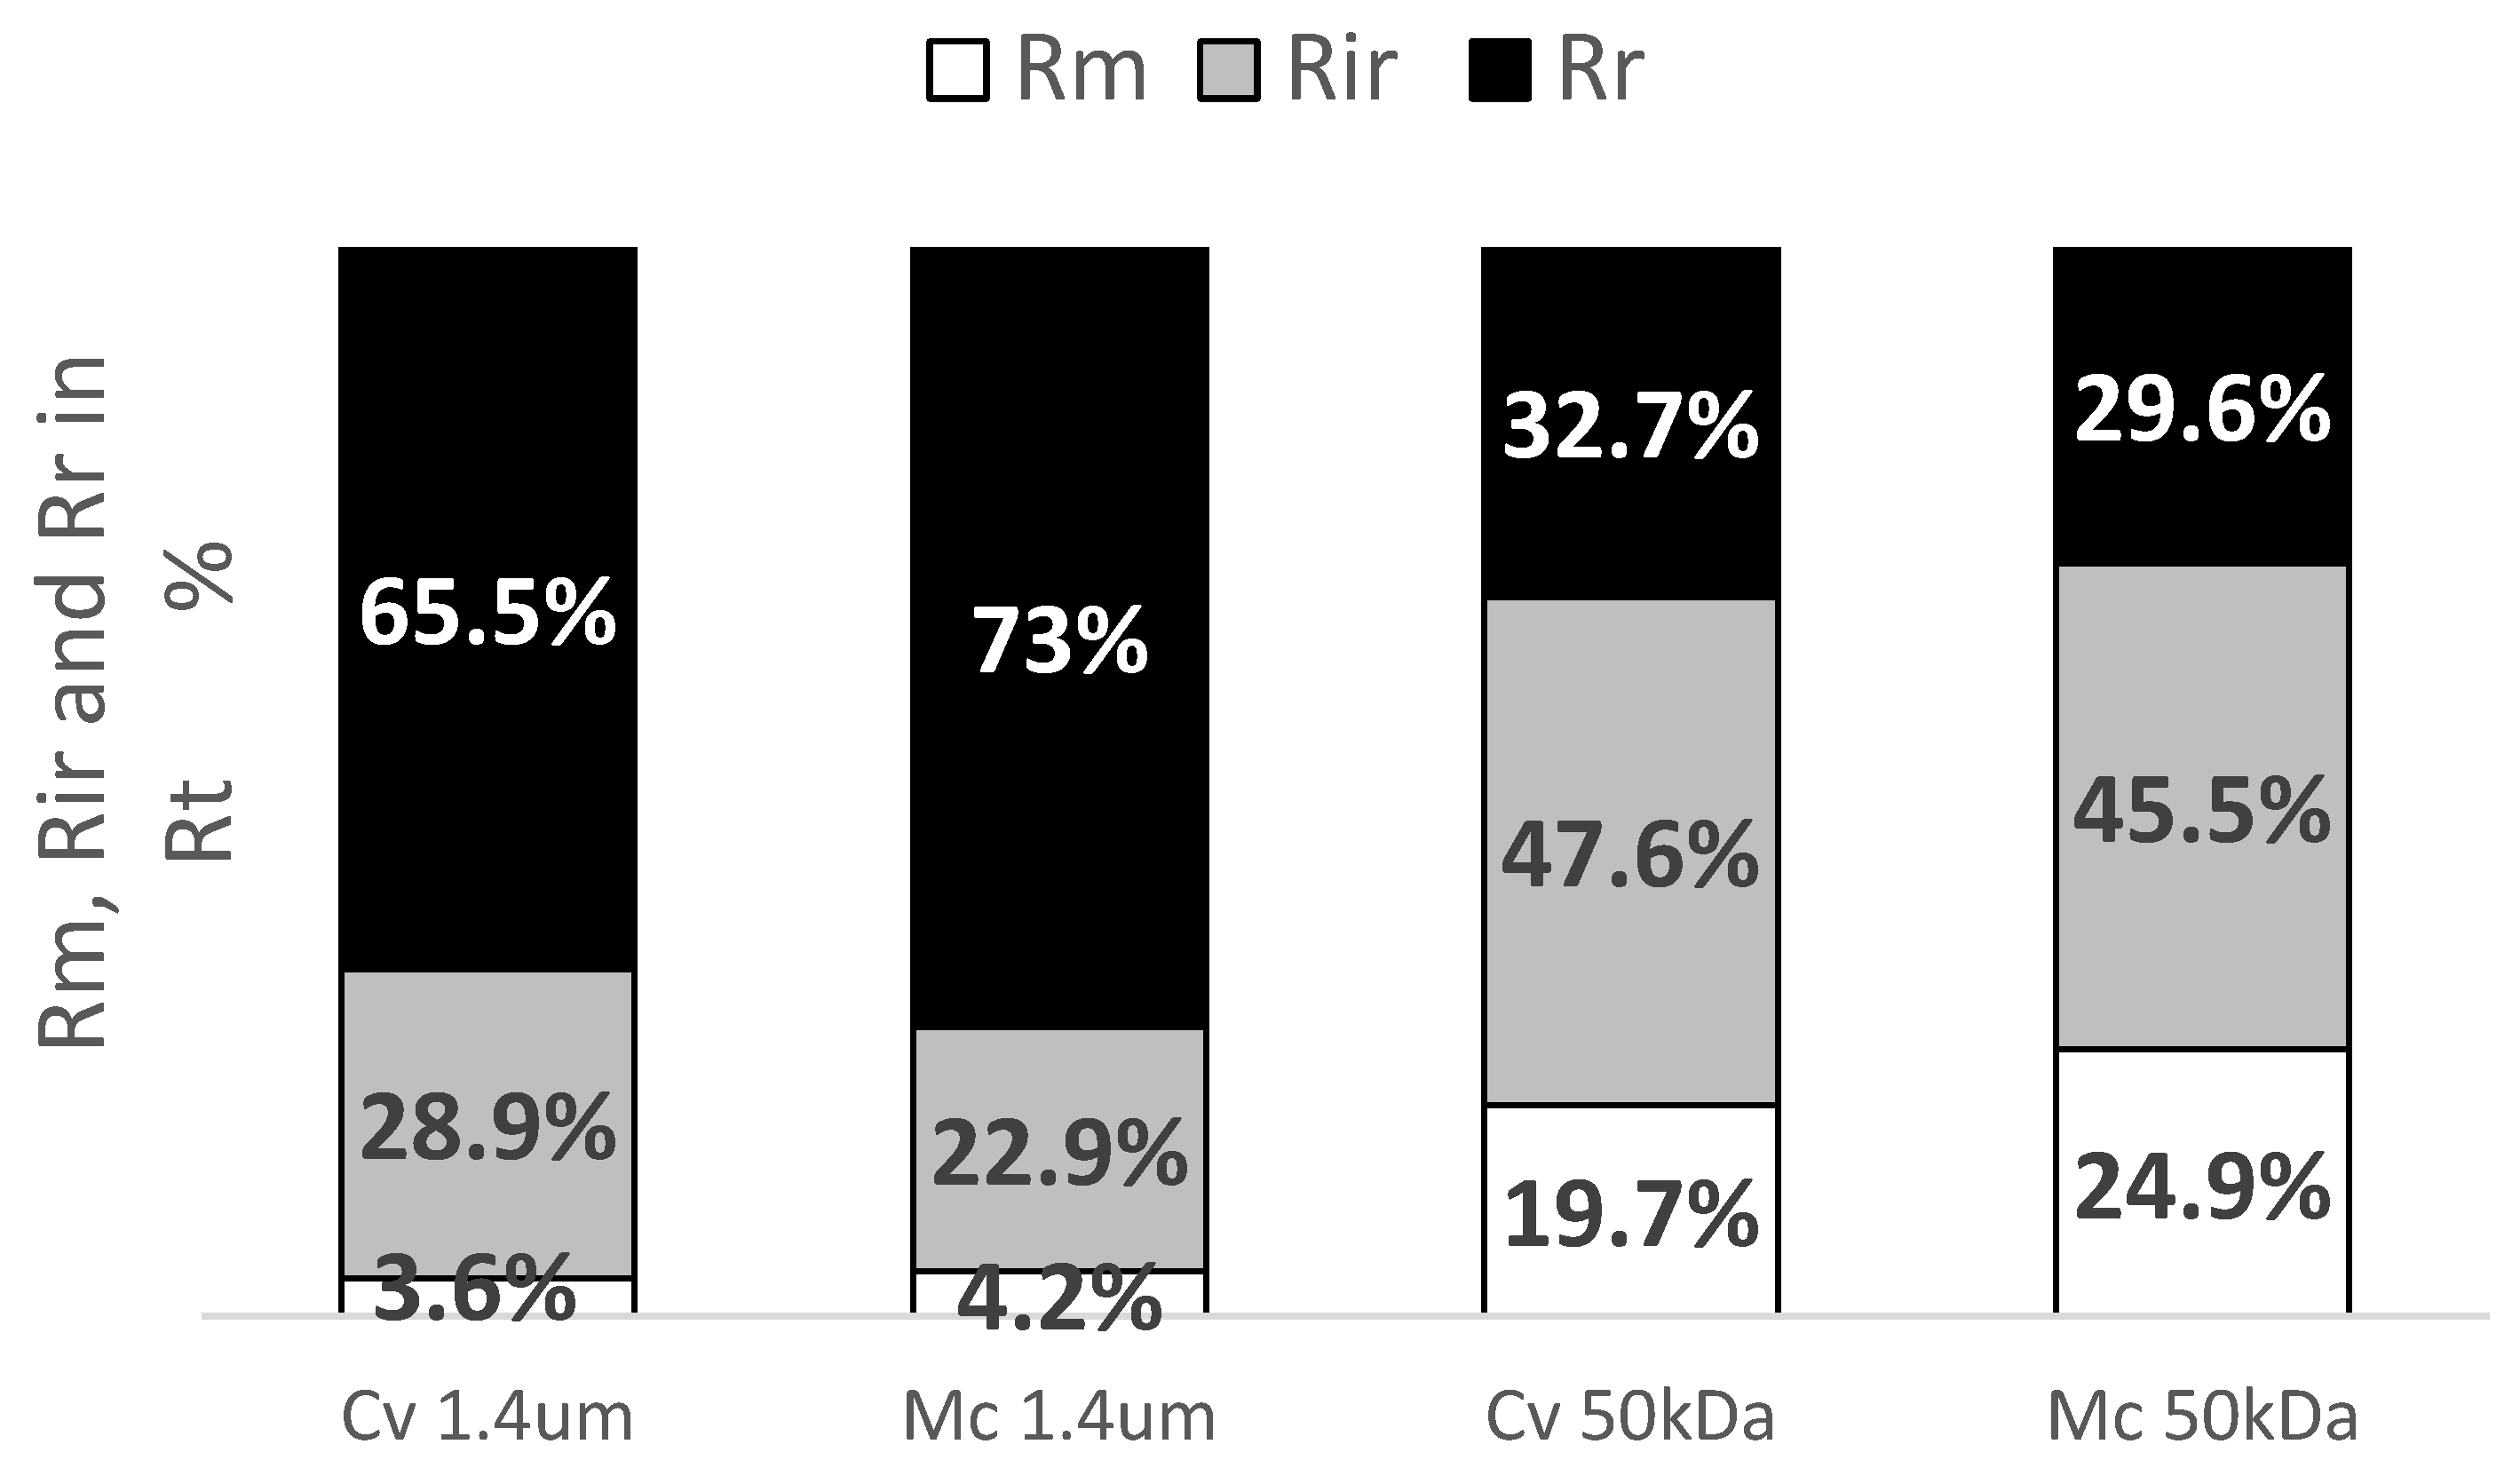
There was also a variation in the share of each type of resistance in Rt (Figure 5). In filtration through the 1.4 μm membrane, the share of Rr was dominant, whereas in filtration through a 50 kDa membrane, the role of Rir was dominant. Compared to the 1.4 μm membrane, the 50 kDa membrane had a higher share of Rm in Rt.
3.3. Mass Balance of DOC
Filtration of the microalgae solution concentrated the dissolved organic matter, expressed in DOC, from a filtrate level of 12–14 mg C L−1 to a retentate level of 25–38 mg C L−1. At the same time, DOC concentrations were lower in the retentate using MF than in the retentate using UF (Table 1). With respect to the total dissolved organic matter, it was about 40% DOC for MF and about 49% DOC for UF. Furthermore, more dissolved organic matter fouled in UF (about 39% DOC) than in MF (about 29% DOC) (Figure 6). In contrast, the DOC concentration was higher in the permeate obtained in microfiltration than in ultrafiltration (about 5 and 2 mg C L−1, respectively) (Table 1). This represented about 30% DOC for MF and about 11% DOC for UF (Figure 6).
4. Discussion
4.1. Flux
During membrane filtration, a rapid reduction in flux is recorded during the initial phase (often less than 10 min), and its duration depends on the filtered medium, the size of the TMP, and the membrane type [11,17]. The pore size of the membrane is particularly important. Much higher fluxes in the first minutes of filtration, with simultaneous high flux reduction, are observed for MF than UF (which was also confirmed by our study) [15,24,25].
As filtration continues, a further decrease in flux is observed, but it is already much smaller and is referred to as “steady-state flux”. This phase is often determined approximately 60 min after the start of filtration [4,17,25]. In our study we determined the steady-state flux 80 min after the start of filtration through both membranes tested. During this phase of filtration, the flux differences between MF and UF were consistent with the results presented by Soydemir et al. [11] and Bamba et al. [17], who also showed higher flux for microalgae filtration through a membrane with smaller pores and at higher TMP.
As shown by studies reported in earlier literature [15,17,24,25,26,27], the decrease in flux is due to the blocking of the membrane pores by microalgae cells and chemical compounds dissolved in water (e.g., metabolic products, proteins, exopolysaccharides, extracellular organic matter–EOM). These factors influence a flux decline in different ways. At the beginning of filtration, microalgae cells clog the membrane pores causing a rapid decrease in flux during this phase of filtration, and the higher flux decrease for MF than for UF is due to the fact that MF membranes are more susceptible to pore blockage and constriction [15,24,26].
During filtration, a cake layer develops on the membrane surface, in which microalgae cells accumulate. Parallel to this process, chemical compounds are observed to block and reduce the pore size of the membrane. These compounds are also accumulated in the outer layer of the cake. These processes result in the stabilized steady-state flux. At the same time, a flux reduction is related to the pore size [15,24,25]. For example, in the study of Soydemir et al. [11], steady-state fluxes accounted for 14%, 21%, and 56% of the initial flux during filtration through 0.1 μm, 0.03 μm, and 30 kDa membranes, respectively. Similar trends in the dependence of flux magnitude on membrane type were shown in our study (approximately 5% for MF and >20% for UF). This is usually explained by the higher susceptibility to fouling of membranes with larger pores than those with smaller pores. Indeed, the pores of microfiltration membranes are more susceptible to direct interaction with EOM [14,15,24]. Finally, Ahmad et al. [26] showed that higher shear rates and turbulence in UF make it more difficult for microalgae to settle on the membrane, so that the layer moving on the membrane surface is thinner, inducing higher flux. This mechanism also may explain the higher steady-state permeate fluxes shown for UF than MF in our study (see Figure 3).
4.2. Resistance
The resistances that occur in membrane processes are the result of various entrainment mechanisms such as concentration polarization, cake formation, and pore blocking [26]. A constant and individual resistance is the pure membrane resistance (Rm), the value of which (similarly to what we have shown for the membranes tested) increases with decreasing membrane pores [24,26]. Other resistances are caused by fouling of membranes by filtered algae and substances dissolved in the water [17,28]. The amount of fouling increases intensively in the first phase of filtration and then reaches a constant level in the steady-state flux phase [15].
The reported higher total hydraulic resistance (Rt) for filtration through a 50 kDa membrane than through a 1.4 μm membrane should be considered as a typical phenomenon [26]. It is the higher TMP used in UF, compared to that used in MF, that promotes an increase in the fouling density on the membrane surface [15,25]. This simultaneously leads to higher irreversible resistance (Rir) in UF than in MF, also noted in our study (see Figure 5). This resistance is caused, as shown by Qu et al. [24], by the irreversible adhesion of contaminants, including organic substances. An adsorption fouling test showed that EOM adhered more to 30 kDa and 10 kDa membranes and suffered more irreversible fouling than to the 100 kDa membrane.
In contrast, the reversible resistance (Rr) is higher in MF than in UF [26]. This can be explained by the lower TMP, at which microalgae form a thicker but less dense cake layer on the membrane surface. However, the resistance of this layer is high (besides microalgae cells, e.g., extracellular polymeric substances accumulate in it) making Rr the dominant resistance and, combined with blocking the larger pores of the microfiltration membrane, exerts a strong influence on the higher flux reduction during MF [14,25,26,29].
4.3. Effect of Microalgae Biomass and DOC
The retention of microalgae by the tested membranes was an expected effect, as the cell size of microalgae is larger than the pores of the tested microfiltration membrane [14]. Furthermore, the demonstrated higher retention of organic matter in UF than MF is often observed in filtration, as retention depends on the membrane pore size and the size of the filtered substances, among other factors [24,27,30]. However, the retention mechanism is more complicated as the influence of membrane fouling is also important. It leads to an increase in membrane selectivity by blocking and constricting the pores, especially in MF membranes, forming a cake layer on the membrane surface. In our study (similar to what has been shown by, e.g., Qu et al. [24]), it is likely that membrane retention contributed more to the removal of dissolved organic compounds by the UF membrane, whereas in MF an important retention factor was the interception of these compounds by the cake. It can also be speculated (based on DOC balance and varied resistances) that the solution contained organic compounds with molecular weight lower than 50 kDa. Their presence may have accounted for the much higher irreversible resistance in UF than MF. In contrast, the cake on the ultrafiltration membrane could capture polymeric compounds (e.g., exopolysaccharides, peptides), and as a result, the selectivity also increased (this may be indicated by the relatively low DOC concentration in the permeate after MF).
The demonstrated differences in filtration due to microalgae species (e.g., higher steady-state phase fluxes for M. contortum than C. vulgaris) may have been the result of differences in their morphology, especially differences in the composition of the compounds they release. For example, Morineau-Thomas et al. [30] found that Porphyridium purpureum released more EOM than Chlorella sp. cells, leading to a more compact cake and higher resistance. Extracellular materials can cause connections between microalgae cells and induce more compact deposition, which ultimately leads to higher selectivity and lower flux [14].
5. Conclusions
Microalgae filtration showed a more rapid decrease in flux in MF than UF during the first 10 min. In contrast, higher permeate flux in the steady-state phase was shown for UF than MF.
Microalgae cells and dissolved organic matter (as determined by DOC) caused both reversible and irreversible membrane fouling, with the MF membrane being more sensitive to reversible fouling and the UF membrane to irreversible fouling. An important retention factor in MF was the interception of organic compounds by the cake, while in UF it was membrane retention.
Highlights
- UF membrane showed higher permeate flux than MF membrane.
- Cake formation was the main fouling mechanism of the MF membrane.
- Irreversible fouling was higher in UF than MF.
- Higher fluxes in the steady-state phase were shown for M. contortum than C. vulgaris.
Supplementary Materials
The following supporting information can be downloaded at: https://0-www-mdpi-com.brum.beds.ac.uk/article/10.3390/en15103745/s1. Table S1. Comparison of permeate flux variation between membrane materials used in microalgae filtration. References [31,32,33,34,35] are cited in the Supplementary Materials.
Author Contributions
Conceptualization, A.N. and P.T.M.; Formal analysis, A.N.; Methodology, A.N. and P.T.M.; Visualization, A.N.; Writing—original draft, A.N.; Writing—review & editing, P.T.M. All authors have read and agreed to the published version of the manuscript.
Funding
A.N. is grateful for the financial support given from the Polish Ministry of Science in Poland through subsidy for West Pomeranian University of Technology Szczecin, Faculty of Food Sciences and Fisheries. P.T.M. is grateful for the financial support given from the Polish Ministry of Science in Poland through subsidy for Poznań University of Technology, Faculty of Chemical Technology.
Institutional Review Board Statement
Not applicable.
Informed Consent Statement
Not applicable.
Data Availability Statement
The data presented in this study are available on request from the corresponding author.
Conflicts of Interest
The authors declare no conflict of interest.
References
- Hallenbeck, P.C.; Grogger, M.; Mraz, M.; Veverka, D. Solar biofuels production with microalgae. Appl. Energy 2016, 179, 136–145. [Google Scholar] [CrossRef] [Green Version]
- Vermuë, M.; Eppink, M.; Wijffels, R.; Van-Den, B.C. Multi-product microalgae biorefineries: From concept towards reality. Trends Biotechnol. 2018, 36, 216–227. [Google Scholar] [CrossRef]
- Castro-Muñoz, R.; García-Depraect, O. Membrane-based harvesting processes for microalgae and their valuable-related molecules: A Review. Membranes 2021, 11, 585. [Google Scholar] [CrossRef] [PubMed]
- Nędzarek, A.; Drost, A.; Harasimiuk, F.; Tórz, A.; Bonisławska, M. Application of ceramic membranes for microalgal biomass accumulation and recovery of the permeate to be reused in algae cultivation. J. Photochem. Photobiol. B Biol. 2015, 153, 367–372. [Google Scholar] [CrossRef] [PubMed]
- Laraib, N.; Hussain, A.; Javid, A.; Noor, T.; Ahmad, Q.; Chaudhary, A.; Manzoor, M.; Akmal, M.; Bukhari, S.M.; Ali, W.; et al. Recent trends in microalgal harvesting: An overview. Environ. Dev. Sustain. 2021, 24, 8691–8721. [Google Scholar] [CrossRef]
- Bonisławska, M.; Nędzarek, A.; Rybczyk, A. Assessment of the use of precipitating agents and ceramic membranes for treatment of effluents with high concentrations of nitrogen and phosphorus from recirculating aquaculture systems. Aquac. Res. 2019, 50, 1248–1256. [Google Scholar] [CrossRef]
- Bilad, M.R.; Arafat, H.A.; Vankelecom, I.F.J. Membrane technology in microalgae cultivation and harvesting: A review. Biotechnol. Adv. 2014, 32, 1283–1300. [Google Scholar] [CrossRef] [PubMed]
- Liao, Y.; Bokhary, A.; Maleki, E.; Liao, B. A review of membrane fouling and its control in algal-related membrane processes. Bioresour. Technol. 2018, 264, 343–358. [Google Scholar] [CrossRef] [PubMed]
- Yang, L.; Wang, L.; Zhang, H.; Li, C.; Zhang, X.; Hu, Q. A novel low cost microalgal harvesting technique with coagulant recovery and recycling. Bioresour. Technol. 2018, 266, 343–348. [Google Scholar] [CrossRef] [PubMed]
- Sharma, K.K.; Garg, S.; Li, Y.; Malekizadeh, A.; Schenk, P.M. Critical analysis of current microalgae dewatering techniques. Biofuels 2013, 4, 397–407. [Google Scholar] [CrossRef]
- Soydemir, G.; Gurol, M.D.; Hocaogīu, S.M.; Karagündüz, A. Fouling mechanisms of membrane filtration of mixed microalgal biomass grown in wastewater. Water Sci. Technol. 2020, 81, 2127–2139. [Google Scholar] [CrossRef] [PubMed]
- Nędzarek, A.; Drost, A.; Tórz, A.; Bogusławska-Wąs, E. The use of a micro- and ultrafiltration cascade system for the recovery of protein, fat, and purified brine from brine used for herring marination. Food Bioprod. Process. 2017, 106, 82–90. [Google Scholar] [CrossRef]
- Marecka-Migacz, A.; Mitkowski, P.T.; Nędzarek, A.; Różański, J.; Szaferski, W. Effect of pH on total volume membrane charge density in the nanofiltration of aqueous solutions of nitrate salts of heavy metals. Membranes 2020, 10, 235. [Google Scholar] [CrossRef]
- Babel, S.; Takizawa, S. Microfiltration membrane fouling and cake behavior during algae filtration. Desalination 2010, 261, 46–51. [Google Scholar] [CrossRef]
- Elcik, H.; Cakmakci, M.; Ozkaya, B. The fouling effects of microalgal cells on crossflow membrane filtration. J. Membr. Sci. 2016, 499, 116–125. [Google Scholar] [CrossRef]
- Monte, J.; Sá, M.; Galinha, C.F.; Costa, L.; Hoekstra, H.; Brazinha, C.; Crespo, J.G. Harvesting of Dunaliella salina by membrane filtration at pilot scale. Sep. Purif. Technol. 2018, 190, 252–260. [Google Scholar] [CrossRef]
- Bamba, B.S.B.; Lozano, P.; Ouattarac, A.; Elcik, H. Pilot-scale microalgae harvesting with ceramic microfiltration modules: Evaluating the effect of operational parameters and membrane configuration on filtration performance and membrane fouling. J. Chem. Technol. Biotechnol. 2021, 96, 603–612. [Google Scholar] [CrossRef]
- Bilad, M.R.; Azizo, A.S.; Wirzal, M.D.H.; Jia Jia, L.; Putra, Z.A.; Nordin, N.A.H.M.; Mavukkandy, M.O.; Jasni, M.J.F.; Yusoff, A.R.M. Tackling membrane fouling in microalgae filtration using nylon 6,6 nanofiber membrane. J. Environ. Manag. 2018, 223, 23–28. [Google Scholar] [CrossRef] [PubMed]
- Osman, W.N.A.W.; Nawi, N.I.M.; Samsuri, S.; Bilad, M.R.; Khan, A.L.; Hunaepi, H.; Jaafar, J.; Lam, M.K. Ultra low-pressure filtration system for energy efficient microalgae filtration. Heliyon 2021, 7, e07367. [Google Scholar] [CrossRef]
- Ortiz Tena, F.; Ranglová, K.; Kubač, D.; Steinweg, C.; Steinweg, C.; Thomson, C.; Masojidek, J.; Posten, C. Characterization of an aerated submerged hollow fiber ultrafiltration device for efficient microalgae harvesting. Eng. Life Sci. 2021, 21, 607–622. [Google Scholar] [CrossRef]
- Zhang, M.; Yao, L.; Maleki, E.; Liao, B.-Q.; Lin, H. Membrane technologies for microalgal cultivation and dewatering: Recent progress and challenges. Algal Res. 2019, 44, 101686. [Google Scholar] [CrossRef]
- Purnima, M.; Arul Manikandan, N.; Pakshirajan, K.; Pugazhenthi, G. Recovery of microalgae from its broth solution using kaolin based tubular ceramic membranes prepared with different binders. Sep. Purif. Technol. 2020, 250, 117212. [Google Scholar] [CrossRef]
- Cheryan, M. Ultrafiltration and Microfiltration Handbook, 2nd ed.; CRC Press: Boca Raton, FL, USA, 1998; p. 552. [Google Scholar] [CrossRef]
- Qu, F.; Liang, H.; Zhou, J.; Nan, J.; Shao, S.; Zhang, J.; Li, G. Ultrafiltration membrane fouling caused by extracellular organic matter (EOM) from Microcystis aeruginosa: Effects of membrane pore size and surface hydrophobicity. J. Membr. Sci. 2014, 449, 58–66. [Google Scholar] [CrossRef]
- Yu, Z.; Chu, H.; Xiao, S.; Jiang, S.; Yang, L.; Zhang, Y.; Zhou, X. Simulation of cake layer topography in heterotrophic microalgae harvesting based on interface modified diffusion-limited-aggregation (IMDLA) and its implications for membrane fouling control. J. Membr. Sci. 2021, 620, 118837. [Google Scholar] [CrossRef]
- Ahmad, A.L.; Mat Yasin, N.H.; Derek, C.J.C.; Lim, J.K. Crossflow microfiltration of microalgae biomass for biofuel production. Desalination 2012, 302, 65–70. [Google Scholar] [CrossRef]
- Liu, B.; Qu, F.; Liangz, H.; Van der Bruggen, B.; Cheng, X.; Yu, H.; Xu, G.; Li, G. Microcystis aeruginosa-laden surface water treatment using ultrafiltration: Membrane fouling, cell integrity and extracellular organic matter rejection. Water Res. 2017, 112, 83–92. [Google Scholar] [CrossRef] [PubMed]
- Drexler, I.L.C.; Yeh, D.H. Membrane applications for microalgae cultivation and harvesting: A review. Rev. Environ. Sci. Biotechnol. 2014, 13, 487–504. [Google Scholar] [CrossRef]
- Zhang, X.; Fan, L.; Roddick, F.A. Influence of the characteristics of soluble algal organic matter released from Microcystis aeruginosa on the fouling of a ceramic microfiltration membrane. J. Membr. Sci. 2013, 425–426, 23–29. [Google Scholar] [CrossRef] [Green Version]
- Morineau-Thomas, O.; Jaouen, P.; Legentilhomme, P. The role of exopolysaccharides in fouling phenomenon during ultrafiltration of microalgae (Chlorella sp. and Porphyridium purpureum): Advantage of a swirling decaying flow. Bioprocess Biosyst. Eng. 2002, 25, 35–42. [Google Scholar] [CrossRef] [PubMed]
- Hua, L.; Cao, H.; Ma, Q.; Shi, X.; Zhang, X.; Zhang, W. Microalgae filtration using electrochemically reactive ceramic membrane: Filtration performances, fouling kinetics and foulant layer characteristics. Environ. Sci. Technol. 2020, 54, 2012–2021. [Google Scholar] [CrossRef] [PubMed]
- Jana, A.; Ghosh, S.; Majumdar, S. Energy efficient harvesting of Arthrospira sp. using ceramic membranes: Analyzing the effect of membrane pore size and incorporation of flocculant as fouling control strategy. J. Chem. Technol. Biotechnol. 2018, 93, 1085–1096. [Google Scholar] [CrossRef]
- Jiang, S.; Zhang, Y.; Zhao, F.; Yu, Z.; Zhou, X.; Chu, H. Impact of transmembrane pressure (TMP) on membrane fouling in microalgae harvesting with a uniform shearing vibration membrane system. Algal Res. 2018, 35, 613–623. [Google Scholar] [CrossRef]
- Sun, X.; Wang, C.; Tong, Y.; Wang, W.; Wei, J. A comparative study of microfiltration and ultrafiltration for algae harvesting. Algal Res. 2013, 2, 437–444. [Google Scholar] [CrossRef]
- Wang, L.; Pan, B.; Gao, Y.; Li, C.; Ye, J.; Yang, L.; Chen, Y.; Hu, Q.; Zhang, X. Efficient membrane microalgal harvesting: Pilot-scale performance and techno-economic analysis. J. Clean. Prod. 2019, 21, 83–95. [Google Scholar] [CrossRef]
Figure 1.
Schematic diagram of the ceramic membrane filtration system (P1, P2, P3-manometers).

Figure 2.
Permeate flux variation (Jv) during 120 min filtration as a function of algal species (Cv–C. vulgaris; Mc–M. contortum) and membrane cut-off (50 kDa and 1.4 μm).
Figure 2.
Permeate flux variation (Jv) during 120 min filtration as a function of algal species (Cv–C. vulgaris; Mc–M. contortum) and membrane cut-off (50 kDa and 1.4 μm).

Figure 3.
Permeate flow variation (Jv) in the steady-state phase (from 80 min filtration) as a function of algal species (Cv–C. vulgaris; Mc–M. contortum) and cut-off membrane (50 kDa and 1.4 μm) (black point-mean; rectangle-mean ± standard error; whiskers-mean ± standard deviation; a, b, c, d—different symbols indicate significant differences; ANOVA Tukey HSD test, p < 0.05).

Figure 4.
Resistances (Rm-membrane resistance; Rir-irreversible resistance; Rr-reversible resistance; Rt total hydraulic resistance) measured during filtration of microalgal solution (Cv–C. vulgaris; Mc–M. contortum) through 1.4 μm and 50 kDa ceramic membranes (mean value; whiskers-mean ± 2 standard error; a-k-different subscripts indicate significant differences, ANOVA, Tukey HSD test, p < 0.05).

Figure 5.
Percentage of resistance (-membrane resistance; -irreversible resistance; -reversible resistance) to total hydraulic resistance.
Figure 5.
Percentage of resistance (-membrane resistance; -irreversible resistance; -reversible resistance) to total hydraulic resistance.

Figure 6.
Effects of pore size of membranes on the mass balance of dissolved organic carbon during MF (1.4 μm) and UF (50 kDa) of the microalgal solution (Cv–C.vulgaris; Mc–M. contortum). The error bar indicates the standard error of triplicate measurements.
Figure 6.
Effects of pore size of membranes on the mass balance of dissolved organic carbon during MF (1.4 μm) and UF (50 kDa) of the microalgal solution (Cv–C.vulgaris; Mc–M. contortum). The error bar indicates the standard error of triplicate measurements.


Table 1.
Initial and steady-state flux, concentration of dissolved organic carbon in the feed (DOCF), retentate (DOCR) and permeate (DOCP), microalgae biomass in feed (MBF) and retentate (MBR); (±standard deviation; Cv–C. vulgaris; Mc–M. contortum).
Table 1.
Initial and steady-state flux, concentration of dissolved organic carbon in the feed (DOCF), retentate (DOCR) and permeate (DOCP), microalgae biomass in feed (MBF) and retentate (MBR); (±standard deviation; Cv–C. vulgaris; Mc–M. contortum).
| Membrane Type | Microalgae | Initial Flux | Steady State Flux * | DOCF | DOCR | DOCP | MBF | MBR |
|---|---|---|---|---|---|---|---|---|
| L m−2 h−1 | mg L−1 | mg L−1 | ||||||
| 1.4 μm | Cv | 2004 (±49) | 88 (±2) | 14.1 (±1.2) | 29.5 (±2.4) | 4.8 (±0.5) | 161 (±8) | 490 (±14) |
| Mc | 1960 (±73) | 105 (±7) | 12.7 (±0.8) | 25.0 (±3.0) | 5.3 (±0.8) | 157 (±10) | 505 (±18) | |
| 50 kDa | Cv | 561 (±26) | 123 (±5) | 14.4 (±1.1) | 38.3 (±3.8) | 1.9 (±0.1) | 164 (±6) | 522 (±10) |
| Mc | 573 (±16) | 139 (±15) | 12.8 (±0.9) | 33.4 (±2.8) | 2.0 (±0.2) | 160 (±9) | 527 (±12) | |
* Steady-state flow from 80 min of filtration.
Publisher’s Note: MDPI stays neutral with regard to jurisdictional claims in published maps and institutional affiliations. |
© 2022 by the authors. Licensee MDPI, Basel, Switzerland. This article is an open access article distributed under the terms and conditions of the Creative Commons Attribution (CC BY) license (https://creativecommons.org/licenses/by/4.0/).
Share and Cite
MDPI and ACS Style
Nędzarek, A.; Mitkowski, P.T. The Fouling Effect on Commercial Ceramic Membranes during Filtration of Microalgae Chlorella vulgaris and Monoraphidium contortum. Energies 2022, 15, 3745. https://0-doi-org.brum.beds.ac.uk/10.3390/en15103745
AMA Style
Nędzarek A, Mitkowski PT. The Fouling Effect on Commercial Ceramic Membranes during Filtration of Microalgae Chlorella vulgaris and Monoraphidium contortum. Energies. 2022; 15(10):3745. https://0-doi-org.brum.beds.ac.uk/10.3390/en15103745
Chicago/Turabian StyleNędzarek, Arkadiusz, and Piotr Tomasz Mitkowski. 2022. "The Fouling Effect on Commercial Ceramic Membranes during Filtration of Microalgae Chlorella vulgaris and Monoraphidium contortum" Energies 15, no. 10: 3745. https://0-doi-org.brum.beds.ac.uk/10.3390/en15103745
Note that from the first issue of 2016, this journal uses article numbers instead of page numbers. See further details here.