
An External Ocean Thermal Energy Power Generation Modular Device for Powering Smart Float


Key Laboratory of Mechanism Theory and Equipment Design of Ministry of Education, School of Mechanical Engineering, Tianjin University, Tianjin 300350, China
*
Author to whom correspondence should be addressed.
Energies 2022, 15(10), 3747; https://0-doi-org.brum.beds.ac.uk/10.3390/en15103747
Submission received: 18 April 2022
/
Revised: 12 May 2022
/
Accepted: 18 May 2022
/
Published: 19 May 2022
(This article belongs to the Special Issue Heat and Mass Transfer)
Abstract
:Smart Float is a new multi-modal underwater vehicle, a tool for ocean observation and detection, whose performance is limited by its underwater voyage distance and endurance like most underwater vehicles. The utilization of marine energy provides an ideal way to overcome these limitations. In this paper, an external ocean thermal energy power generation module is developed for Smart Float, which can be used for multiple times of energy storage and power generation and is expected to be further applied to small and medium-sized underwater vehicles. The integration of the proposed device will cause changes in the counterweight characteristic, hydrodynamic characteristic, and heat transfer characteristic of the vehicle, which are deeply analyzed in this study, and adaptive modification solutions are proposed according to the analysis results. Finally, a prototype of Smart Float integrating the proposed device was deployed in the South China Sea to perform a sea trial, to test its performance in thermal energy utilization. According to the results, the device generates 1.341 Wh in a profile diving to 700 m, with the maximum single-profile generation of 1.487 Wh, the average electrical energy of 1.368 Wh, and the hydraulic-to-electric efficiency of about 60% in the power generation stage, which verifies its excellent performance in thermal energy utilization. This study realizes the integration of thermal energy power generation modules into an underwater vehicle for the first time, exploring a new way to improve the endurance and self-sustainability of commercial underwater vehicles.
1. Introduction
The ocean covers 71% of the Earth’s surface, with a total area of about 3.6 × 10⁹ km2 that contains rich water and natural resources. Currently, the development and utilization of the ocean have become an emerging field of strategic significance [1,2,3]. Unmanned underwater vehicles are important platforms for ocean observation and detection, which are generally divided into autonomous underwater vehicle, autonomous underwater glider, remotely operated vehicle, or Argo float. An autonomous underwater glider is an autonomous observation platform powered by buoyancy and sails in a zigzag trajectory underwater, which can be used for continuous observation of a wide range. Argo float mainly operates below the sea surface to realize long-term, fixed-point, continuous, multi-level, and synchronous observation of the marine environment, which has good concealability.
Smart Float, a novel multi-modal underwater vehicle developed by the Ocean University of China, combines the mechanisms of the conventional Argo float and underwater glider, which adopts a buoyancy regulation system covering a large range and the ingenious modal switch mechanism. It can carry various sensors, such as CTD, chlorophyll, CDOM, and hydrophone, and is expected to complete more than 110 profiles at a depth of 4000 m, cover a continuous operating range of 1000 km, and achieve a design life of more than 3 years [4].
At present, the Smart Float, as well as most of the existing small and medium-sized underwater vehicles, relies on batteries onboard to power the navigation unit, propulsion unit, and sensor unit. The limited electrical energy of the batteries is a decisive factor restricting endurance, self-sustainability, and in-position ability of these vehicles [5,6], while higher requirements on energy supply are put forward due to the diversified sampling and observation tasks in marine surveys that require multiple sensors onboard. In the meantime, the insufficient energy provided by the batteries causes poor sampling results, and environmental pollution can happen when the batteries are damaged.
To solve this problem, in 1881, French physicist D’Aronval first proposed the idea of ocean thermal energy conversion [7]. Ocean thermal energy refers to the thermal energy formed by the temperature difference between ocean surface seawater and deep seawater [8,9,10]. When an underwater vehicle is traveling through the water column, the solar radiation intensity weakens gradually with the increase of depth, and the seawater temperature decreases gradually, thereby forming a vertical ocean temperature gradient [11]. Thus, ocean thermal energy is more suitable for driving underwater vehicles than other renewable energies (tidal energy, wave energy, and ocean current energy) [12,13,14]. Therefore, the utilization of ocean thermal energy is of practical significance and application value for solving the limited energy supply of Smart Float.
The Webb Research Corporation proposed the world’s first thermal glider prototype named Slocum Thermal, which can convert ocean thermal energy into buoyancy-driven energy with phase change material (PCM) in 1988 [15]. So far, four generations of Slocum Thermal Glider have been developed [16,17]. Since 2005, Tianjin University developed buoyancy-driven technology based on PCM [18,19]. Then, the team developed Petrel II thermal glider which continuously operated for 667 km, completed 112 diving profiles, and sailed for 29 days in 2013 [20]. In 2009, the Jet Propulsion Laboratory designed a profiling float named SOLO-TREC, including an ocean thermal-electricity system with 10 thermal engines to collect thermal energy.
As introduced above, multiple prototypes of thermal floats and gliders based on phase change materials have been successfully developed. However, these prototypes generally integrate the PCM-based thermal generation system into the vehicle body to realize power generation, which results in the complexity of the whole system. Kim et al. proposed a method to combine TREC with small thrusters to achieve position correction, and obtained an optimal energy distribution by numerical analysis of the nonlinear relationship between energy acquisition and energy consumption [21]. However, the application of small thrusters increases energy consumption. He et al. analyzed and optimized the component layout of a thermal-powered glider and reduced the overall moving distance of the glider by optimizing the layout [22]. Yet, they made little research on the attitude adjustment ability of gliders. Li et al. established a general energy consumption model and a sailing distance equation suitable for electric, thermal and hybrid underwater gliders, and analyzed the effects of configuration parameters and navigation parameters on the endurance of underwater gliders [23]. Still, the energy matching problem has not been solved.
Based on the above investigations and research, the integration of a thermal energy power generation system based on PCM has significantly changed the internal structure of the vehicle, resulting in increased technical difficulty, cost, and period of research and development, as well as poor reliability of the prototype. The performance of such vehicles still needs to be improved, and there is still a significant gap in technology maturity between them and similar battery-powered vehicles.
This paper aims to develop an external ocean thermal energy power generation module is developed for Smart Float, which can be used for multiple times of energy storage and power generation and is expected to be further applied to small and medium-sized underwater vehicles. For the key problems of the integrated vehicle, this paper deeply analyzes the changes brought by integration on counterweight characteristics, hydrodynamic characteristics, and heat transformation process and puts forward adaptive modification solutions. A sea trial was successfully carried out in the South China Sea, which verifies that the Smart Float can achieve energy self-sufficiency by integrating the proposed device. The modular device can be integrated into Smart Float, underwater glider, profile float, and other platforms. At the same time, this work is also important for various areas, such as medicine [24], chemistry [25], microbiology, and nanofluidics [26,27,28].
2. Working Principle and Modular Design
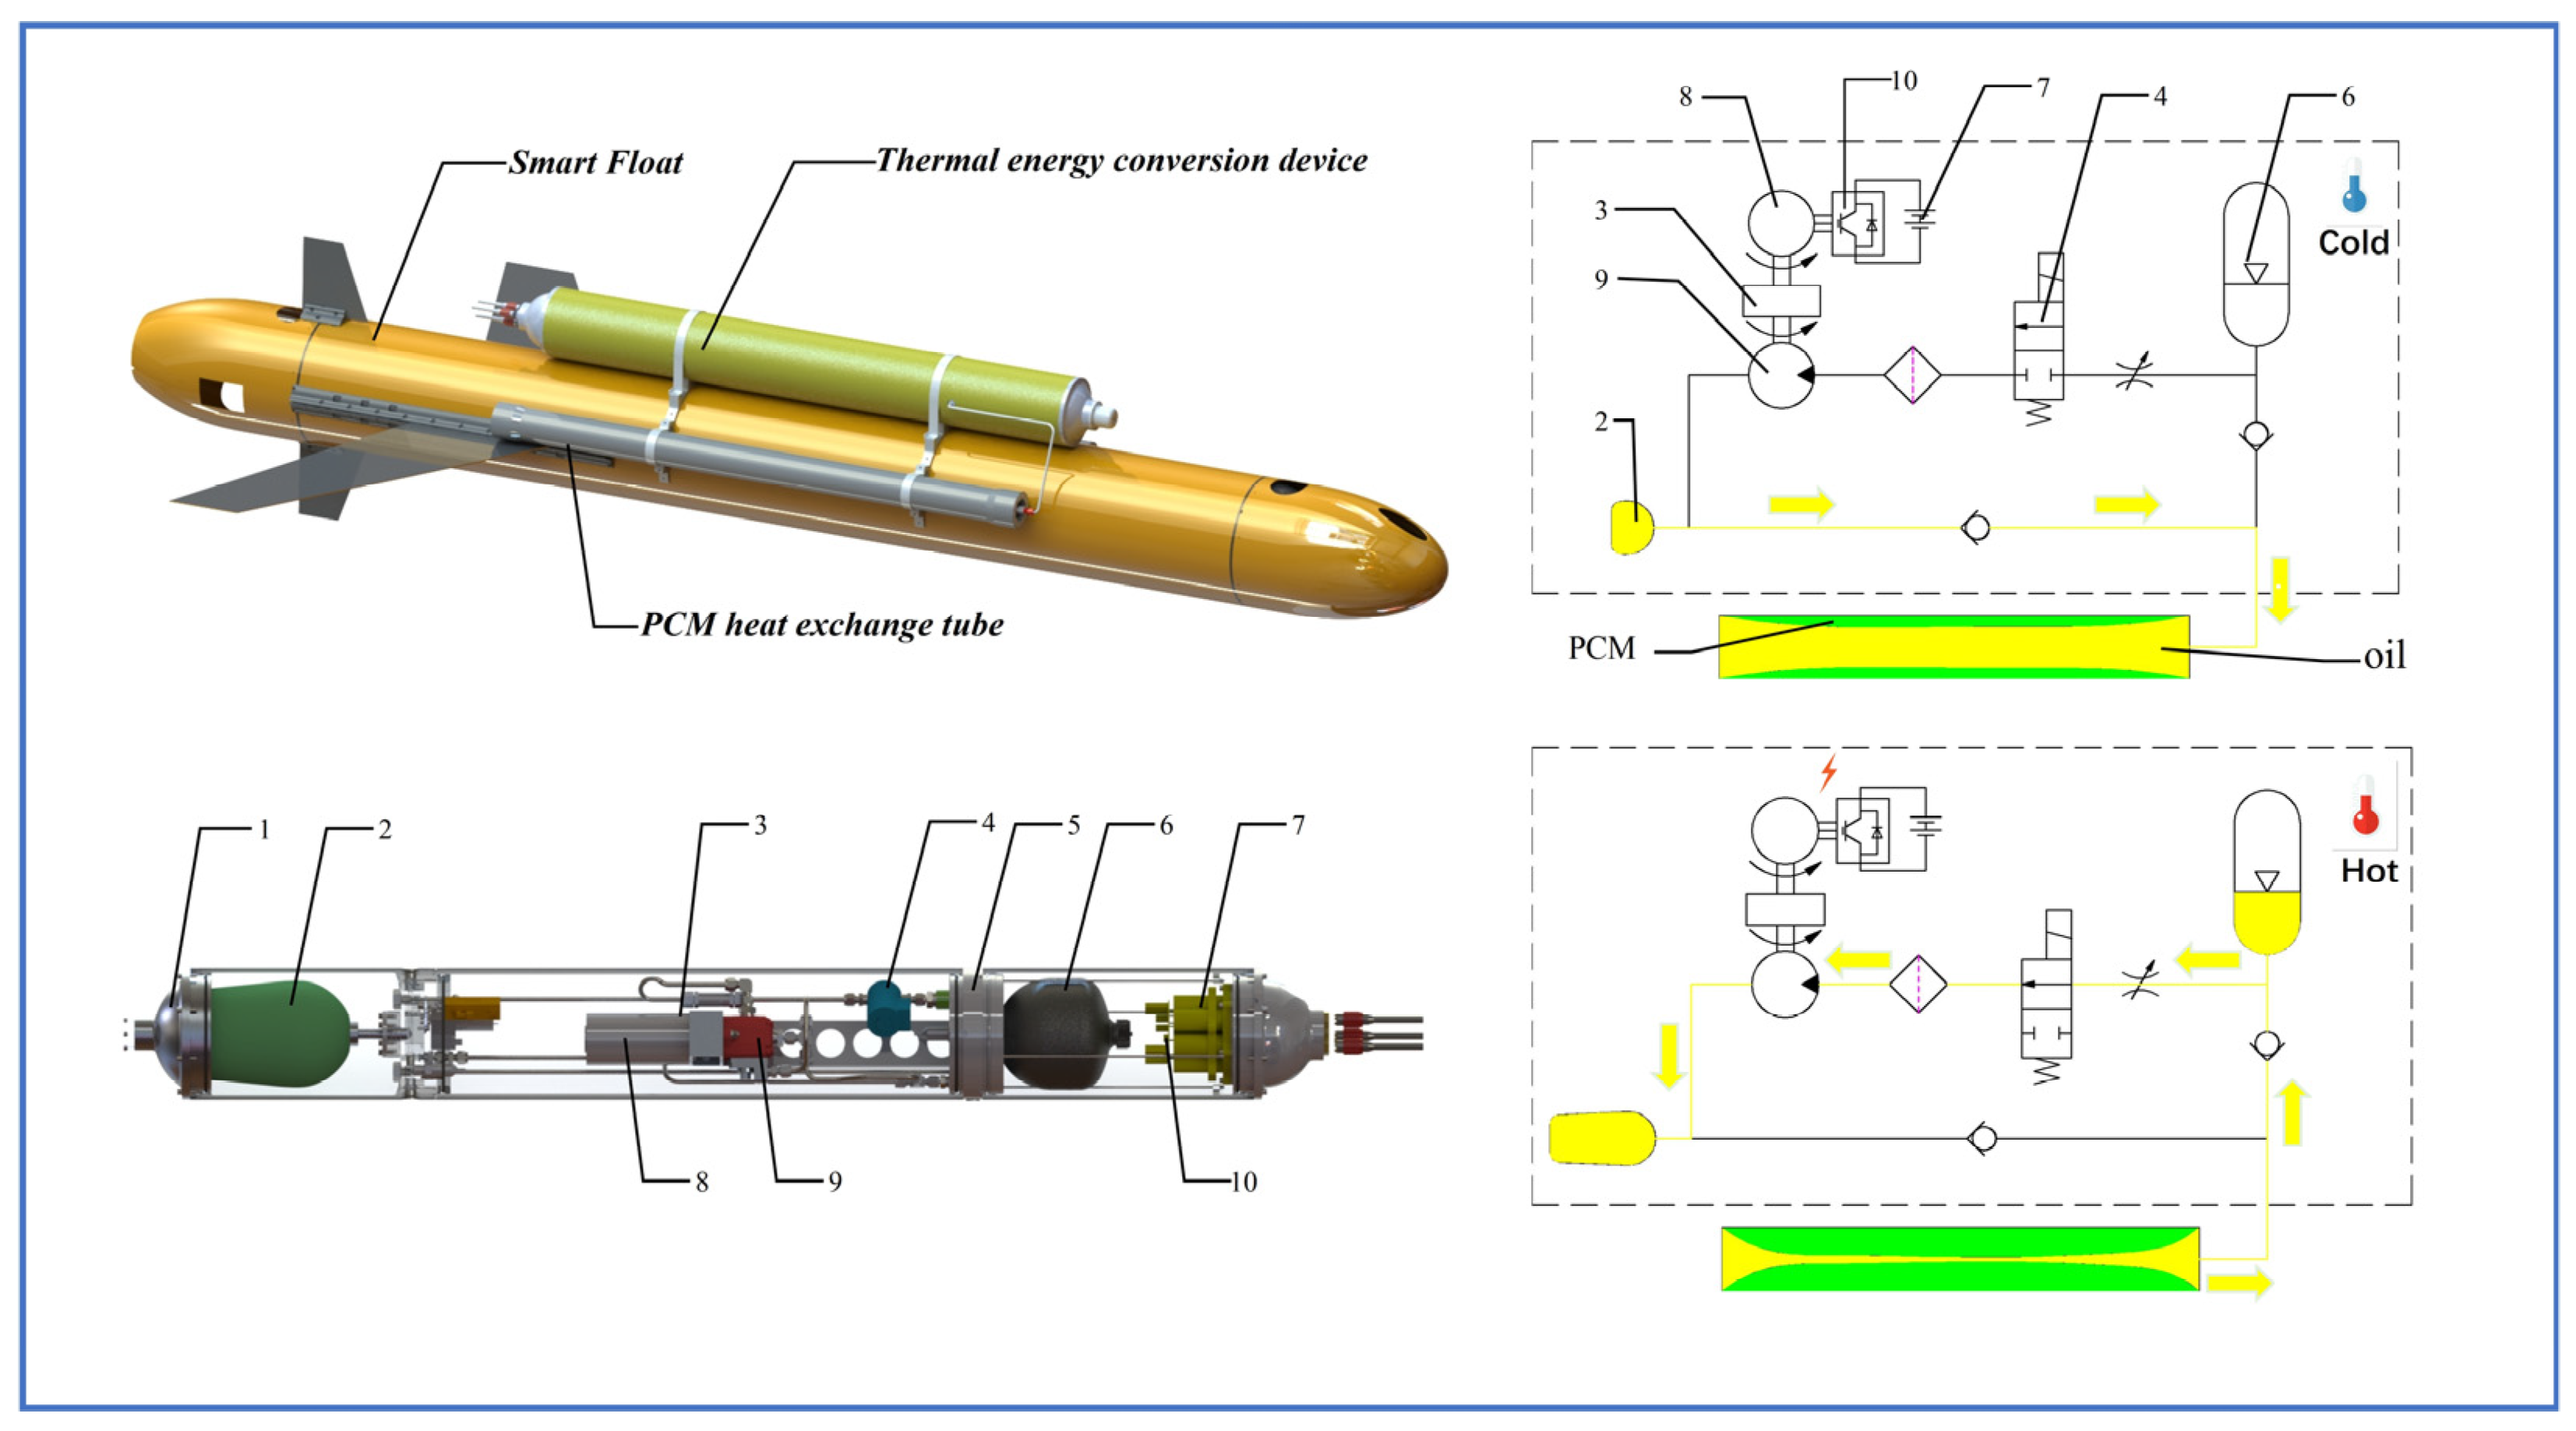
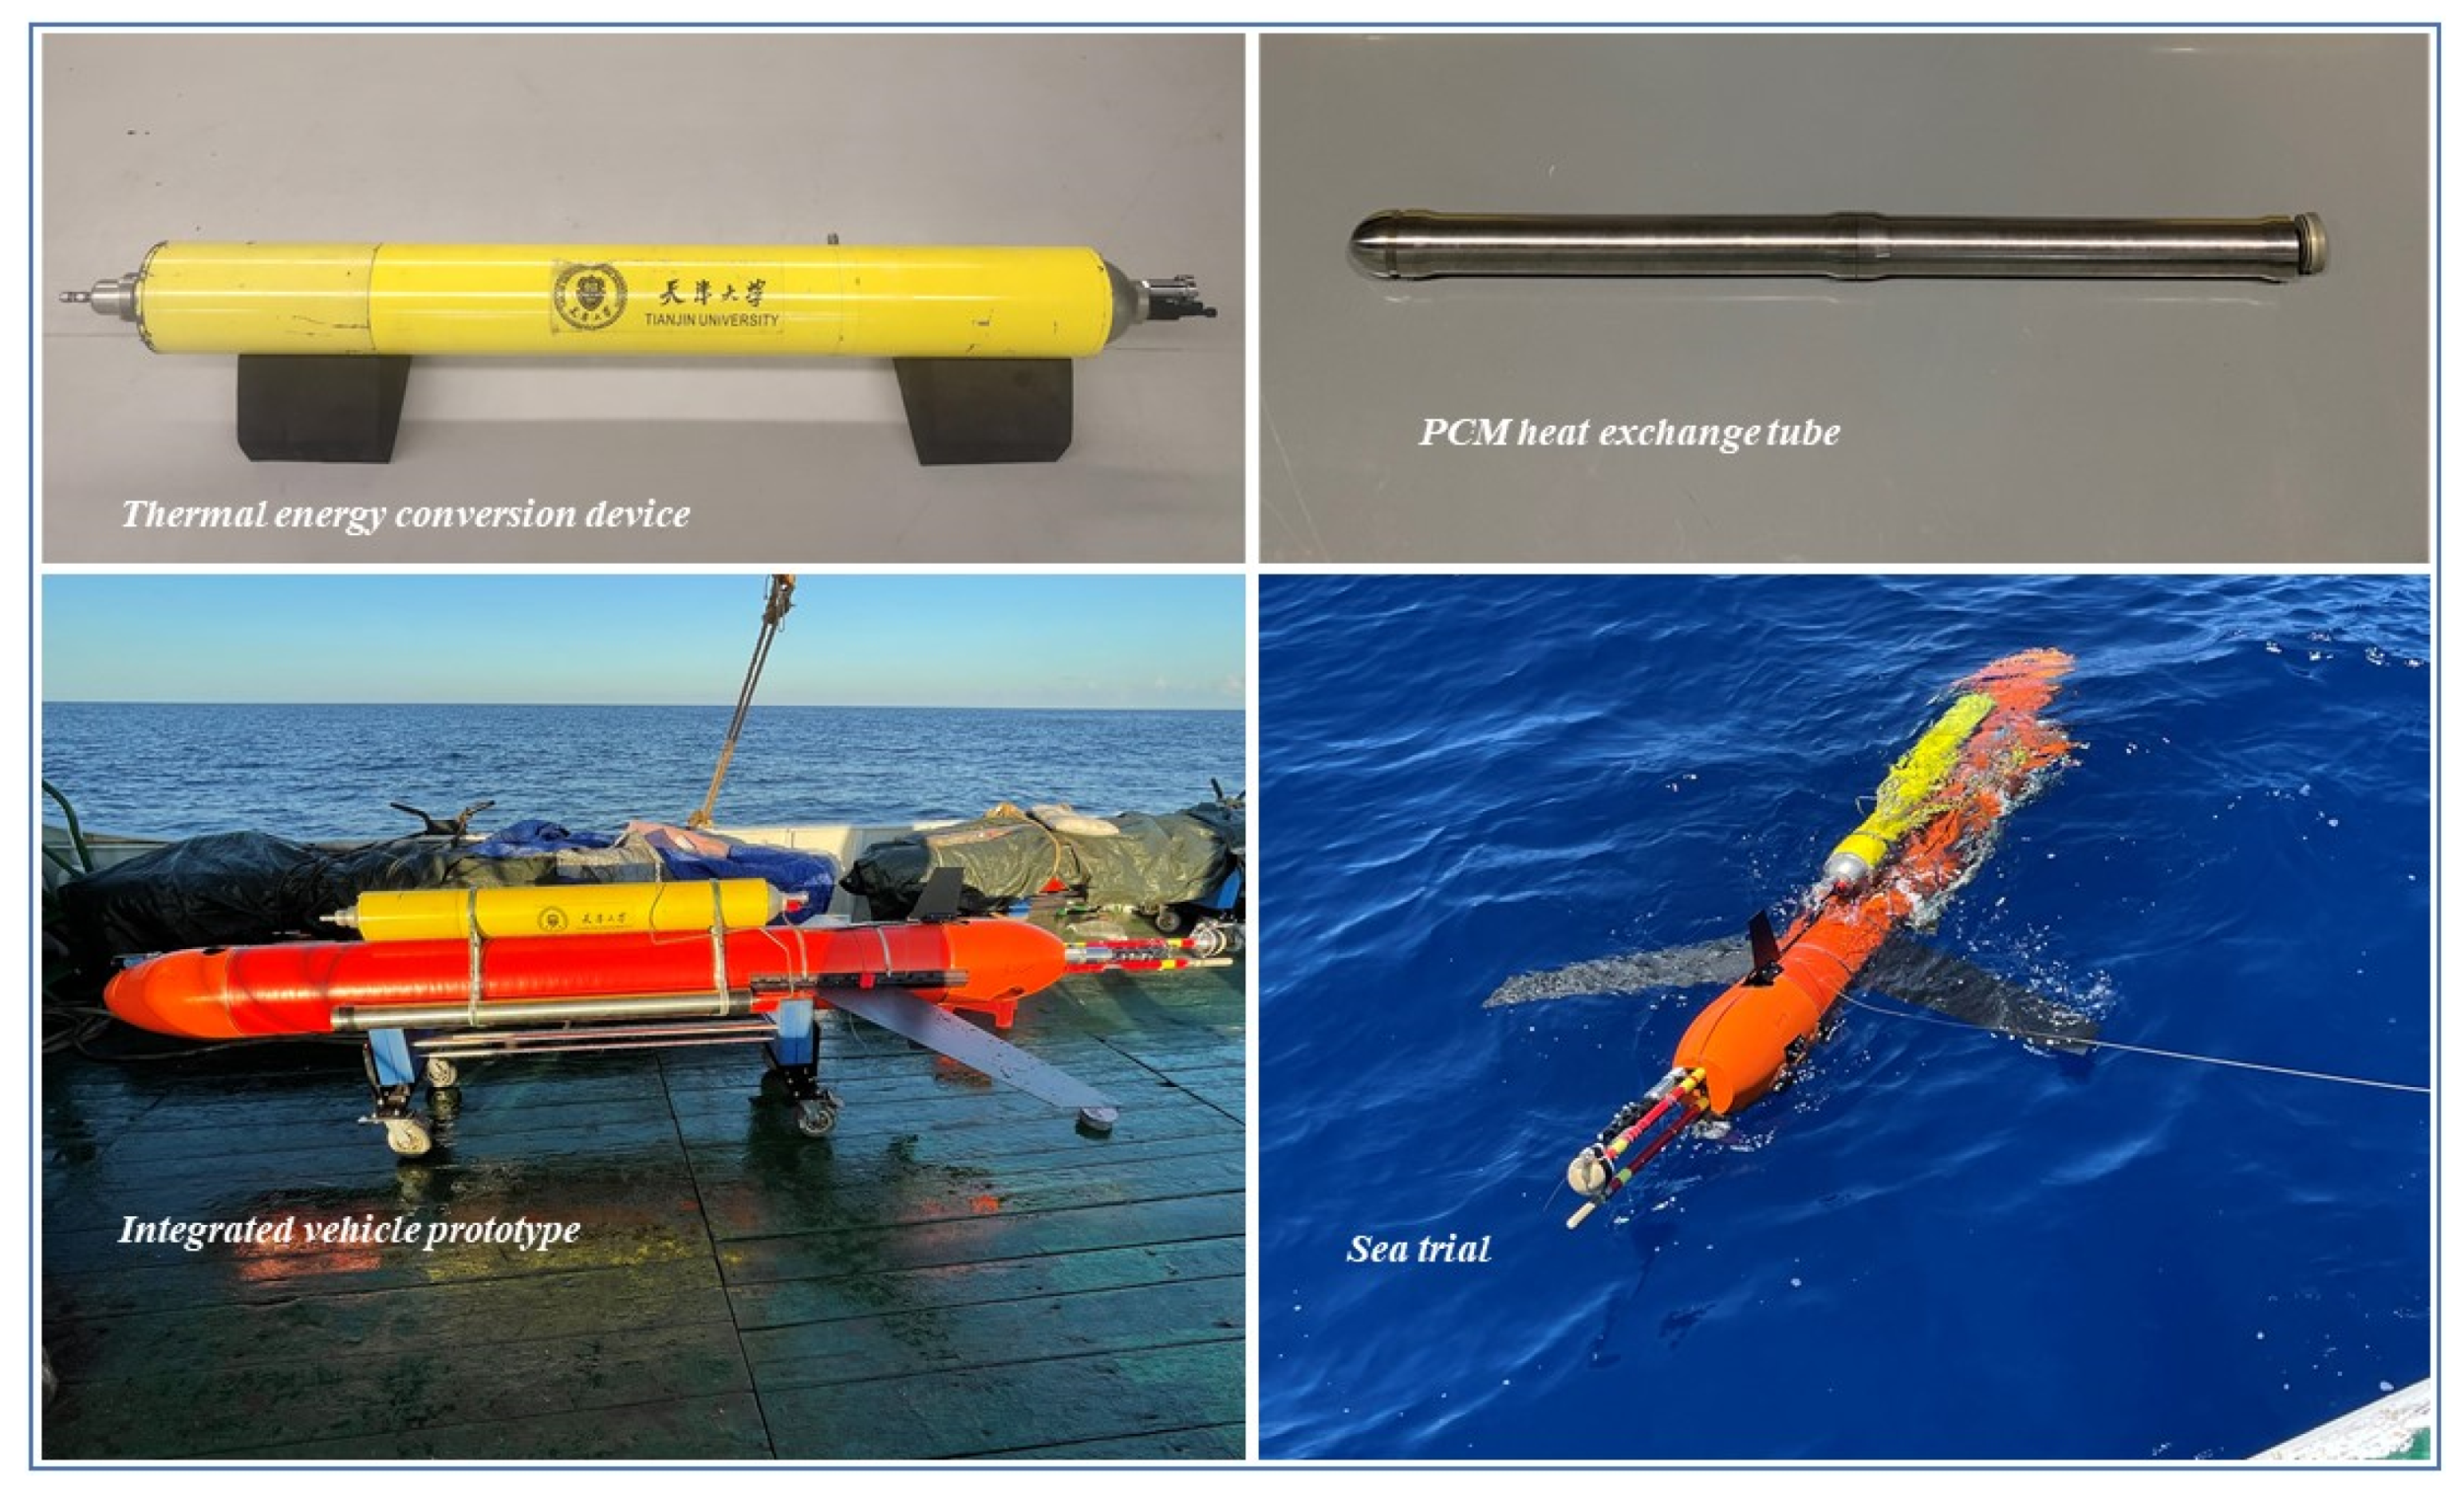
In this study, an external ocean thermal energy power generation module is proposed to be integrated into Smart Float, which is designed to collect the ocean thermal energy and convert it into electrical energy, thus improving the endurance and self-sustainability of the vehicle. The components of the external thermal energy power generation module and the specific schematics are illustrated in detail in Figure 1. The proposed power generation module consists of a thermal energy conversion device and two heat exchange tubes. In detail, the thermal energy conversion device is composed of three parts, namely the oil tank section, hydraulic conversion section, and energy storage section, which is designed to be compact with a greatly reduced radial size.
The oil tank section consists of an end cover, a leather bag, a pressure casing, and a gas circuit system (including an air pump, reversing valve, and check valve). The gas circuit system assists the pressurization of the oil tank and supplies oil to the heat exchange tubes when the PCM solidifies and shrinks.
The hydraulic conversion section includes the main components of the accumulator, stiffening ring, solenoid valve, hydraulic motor, and generator, which are arranged in sequence along the axis of the conversion device. The diaphragm accumulator (148 mm in diameter, 1.2 L in volume) acts as the storage carrier of the potential energy and is concentric with the stiffening ring. There is a hydraulic oil channel inside the stiffening ring, and the throttle valve and check valve are installed inside the channel to realize a compact structure. The self-locking solenoid valve can be started by zero power consumption and realize power-off retention after being started. The gear hydraulic motor (speed 1350 rpm and displacement 0.19 mL/r at pressure 20 MPa) converts potential energy into kinetic energy. Then, the permanent magnet generator converts kinetic energy into electrical energy. The speed increaser with a ratio of 5.8 matches the motor and the generator in terms of speed and torque.
The energy storage section contains a circuit board, a 12VDC battery pack, and other components. A rectifier filter voltage regulator is installed on the circuit board, which can convert the alternating current generated by the generator into a stable direct current and charge the battery pack.
In general, the thermal energy power generation module has a diving depth of 1000 m. A miniaturization design is adopted to assist the installation of the module on the vehicle. The thermal energy conversion device is 1.5 m in length, 160 mm in diameter, and 25 kg in weight. Each heat exchange tube has a length of 1.31 m, a diameter of 89 mm, and a weight of 10.25 kg, containing 4.5 L N-hexadecane, the PCM selected.
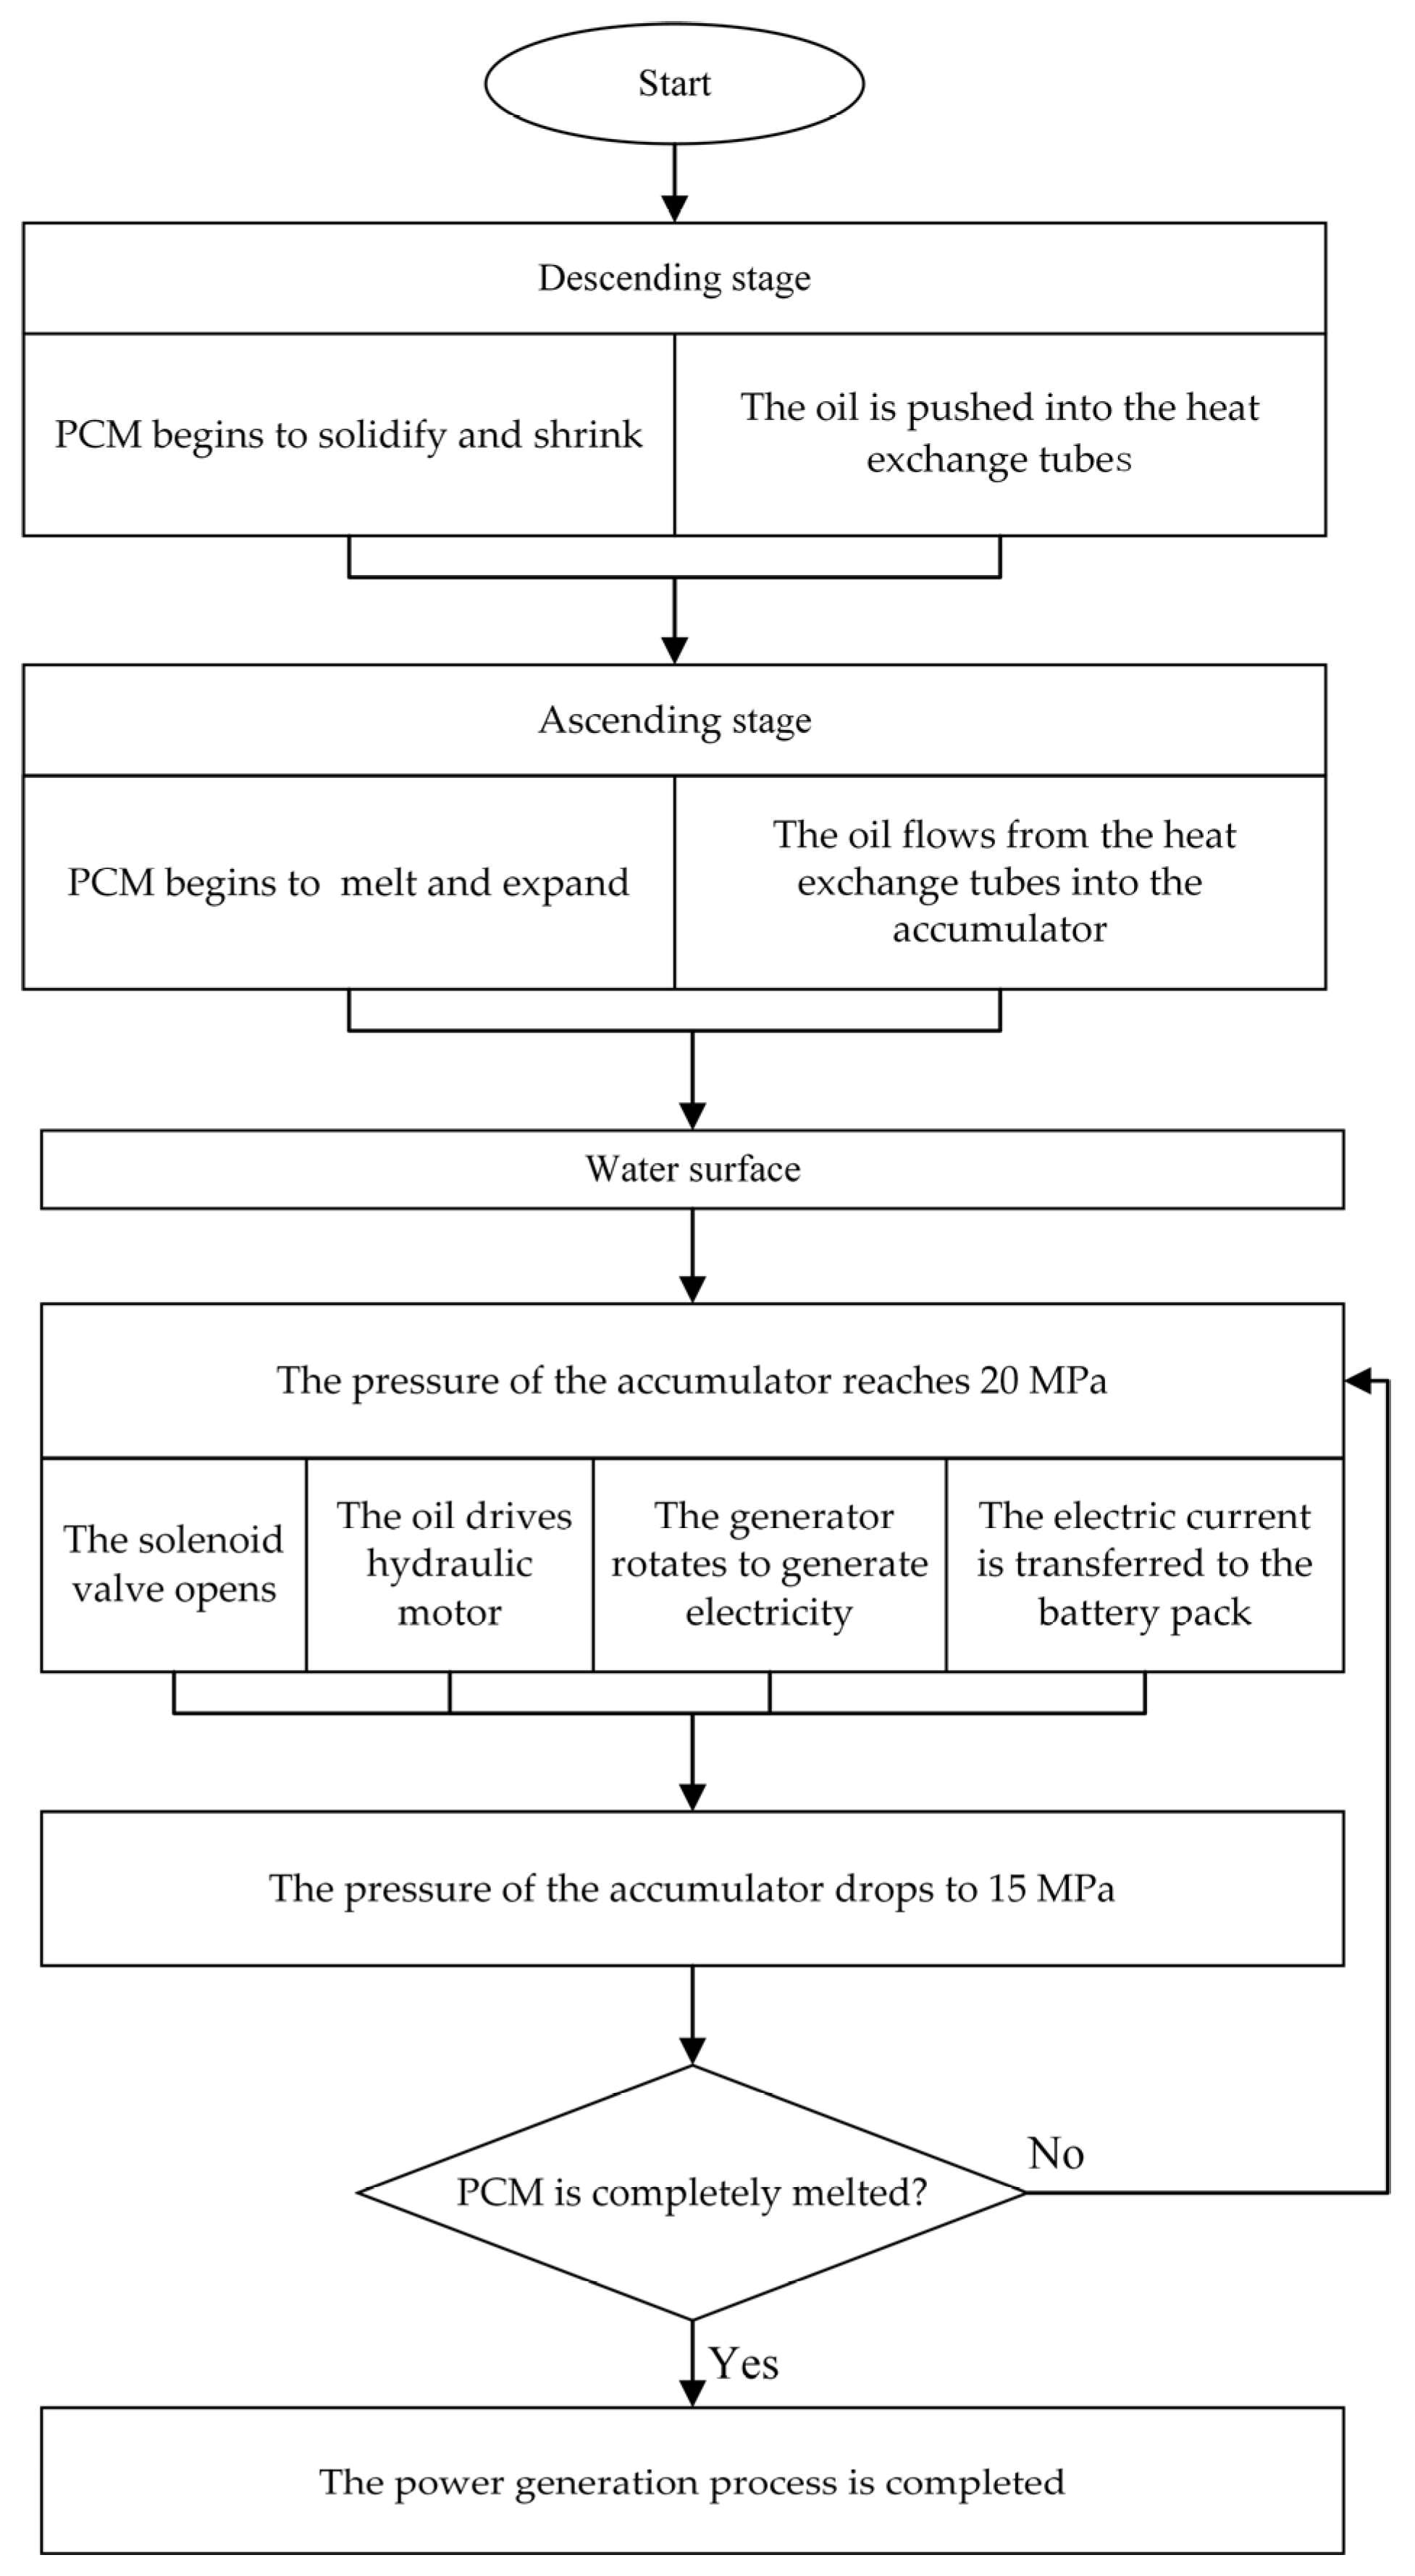
During each profile, the power generation module will perform the power generation process multiple times, for the reduction of average theoretical power in the whole power generation process. That is, the heat exchange tubes finish the hydraulic energy collection for one time in the profile, which is then used to drive the hydraulic motor and generator for separate times to obtain electrical energy. The working principle of the components is shown in Figure 2.
In the ascending stage, the seawater temperature gradually rises with the decrease of depth. When the temperature is higher than 18 °C, the PCM inside the heat exchange tubes gradually melts and expands, pushing the oil to flow from the heat exchange tubes into the accumulator and increasing the pressure there.
The power generation stage starts when the vehicle is floating on the surface, during which the hydraulic energy stored in the accumulator is used as the source of power. When the pressure of the accumulator reaches the set value (20 MPa), the solenoid valve opens, allowing the oil inside to flow out through the throttle valve and drive the hydraulic motor, and then the generator rotates to generate electricity. The electric current is transferred to the battery pack through the rectifier filter voltage regulator on the circuit board. When the pressure of the accumulator drops to a certain value (15 MPa), the power generation process is completed. Then the accumulator gets pressurized by the oil repeatedly and releases energy to generate electricity until all PCM is completely melted.
In the descending stage, the seawater temperature gradually decreases with the increase of depth. When the temperature is lower than 18 °C, the PCM contained in the heat exchange tube begins to solidify and shrink, and the hydraulic oil in the oil tank is pushed into the heat exchange tubes until the PCM is completely solidified. At this point, the thermal energy power generation module has completed a power generation cycle and started a new one.
3. Modular Integration
The integration of the thermal energy power generation module has a direct impact on the performance of the Smart Float, mainly involving counterweight characteristics, hydrodynamic characteristics, and heat transfer characteristics, which are analyzed in detail in this section. Adaptive modification solutions are proposed to deal with these impacts.
3.1. Counterweight Characteristic
The counterweight characteristic of Smart Float concerns its mass, buoyancy, the relationship between the center of mass and center of buoyancy, and the variation of both centers during the whole voyage [29]. Since the values of mass and buoyancy are fixed when the Smart Float and the power generation module are determined, the height difference between the center of mass and buoyancy of the integrated vehicle is analyzed as a key indicator of counterweight characteristics. In the current study, the total weight of Smart Float before integration is 190.6 kg, with a height difference of 3 mm, and the mass of its movable battery pack is 20 kg. Moreover, the total weight of the thermal energy power generation module is 45.5 kg.
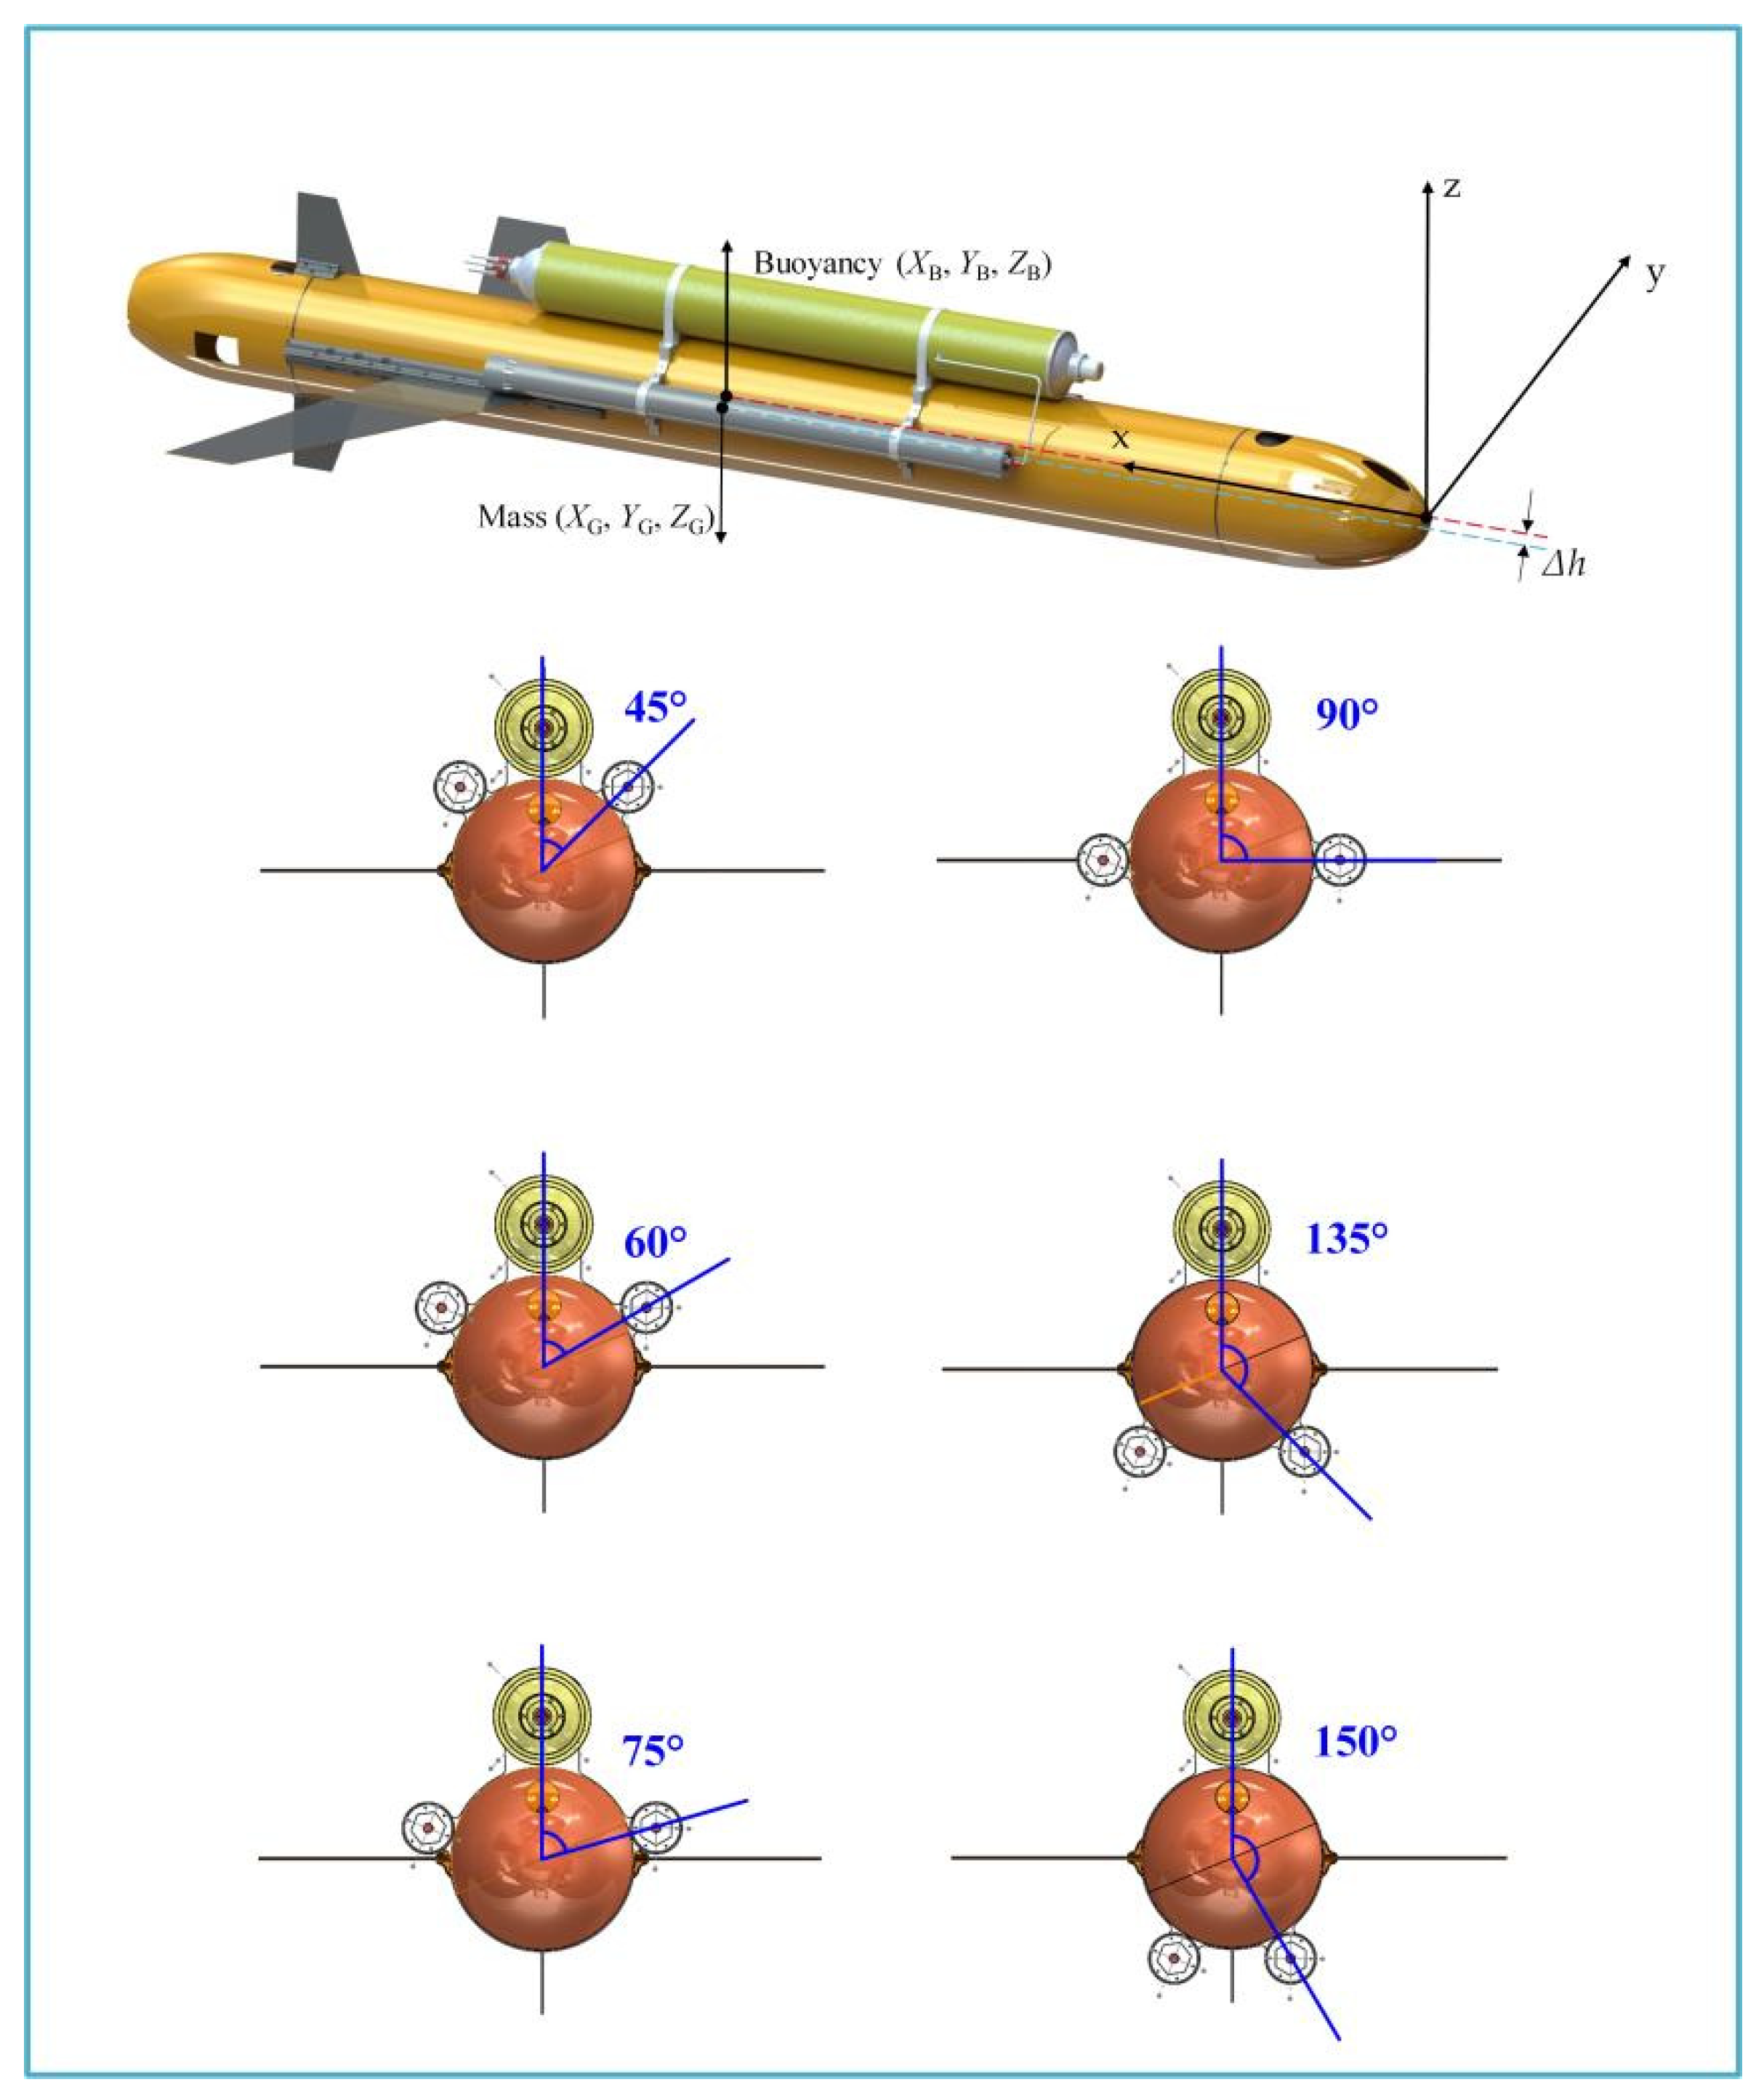
The thermal energy conversion device is horizontally mounted on the top of the Smart Float, and the heat exchange tubes are symmetrically arranged on both sides of the Smart Float, as shown in Figure 3. Six installation angles between the device and tubes (45°, 60°, 75°, 90°, 135°, and 150°) are analyzed to determine the best layout of the module, and the mass and buoyancy of each part are obtained by precise modeling, as listed in Table 1. The height difference between the two centers of integrated vehicle and the three reference planes in the general layout are calibrated, and the center of mass and buoyancy are also calculated, as can be found in the list.
The Smart Float equipped with the thermal energy power generation module is considered to comprise three major components, namely Smart Float, thermal energy conversion device, and heat exchange tubes. The mass of the integrated vehicle is supposed to be M. The weight of each component is mi, and the center of mass in the reference coordinate system is denoted by (xi, yi, zi). Then, the center of mass (XG, YG, ZG) of the integrated vehicle in the reference coordinate system can be calculated by Equation (1).
The center of buoyancy of each component in the reference coordinate system is (xiB, yiB, ziB). Then, the center of buoyancy (XB, YB, ZB) of the integrated vehicle in the reference coordinate system can be calculated by Equation (2).
Through the analysis of the counterweight characteristic, Δh of the whole system shows the smallest difference from that of the original Smart Float (3 mm) at the installation angle of 75° (2.44 mm), as shown in Table 1. Therefore, such an installation angle helps to better alleviate the influence of the power generation module on the course and attitude adjustment of the Smart Float.
3.2. Hydrodynamic Characteristic
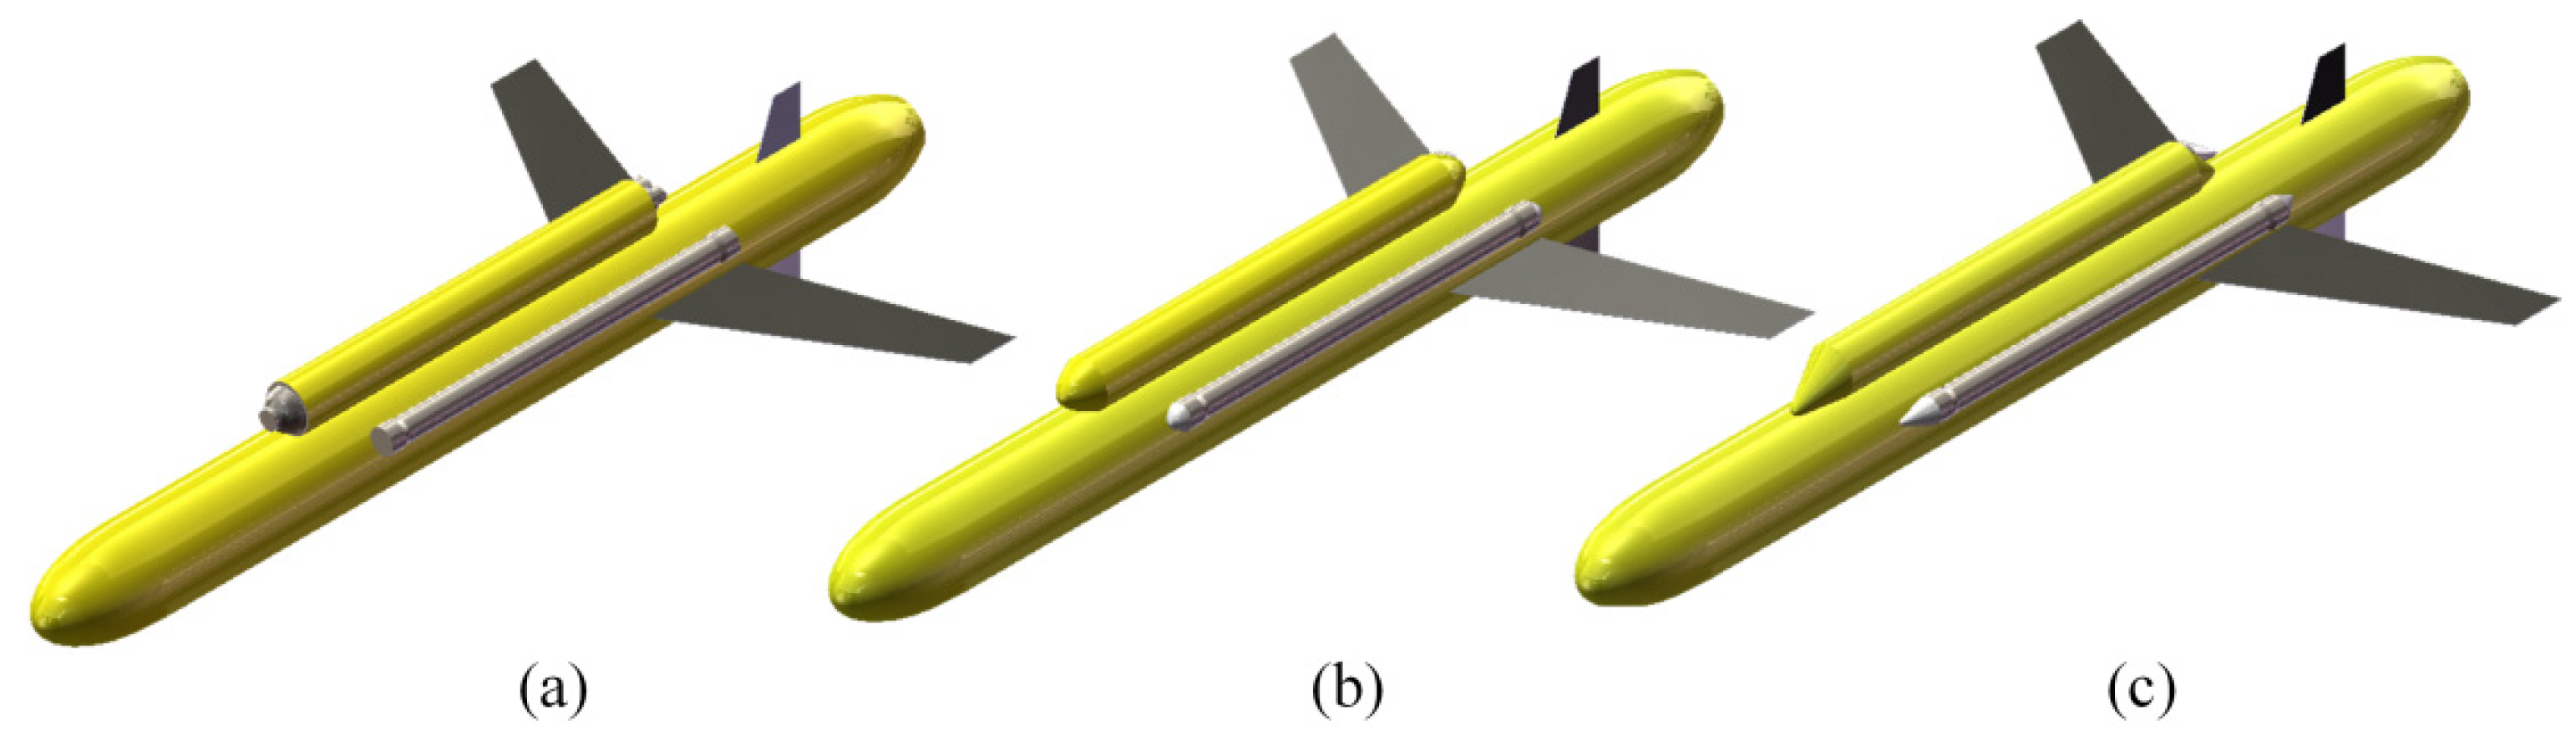
As mentioned above, the thermal energy power generation module is installed outside the vehicle, which not only brings additional resistance but also changes the hydrodynamic characteristic of the original vehicle. Therefore, three types of fairings are designed for the module, including flat fairing, conical fairing, and inclined conical fairing, thus assessing and reducing the influence caused by the integration of the module as much as possible, as shown in Figure 4. In the three schemes, the fuselage, horizontal wings, and other structures of the vehicle share the same size, and the length and volume of the heat exchange tubes remain the same. The CFD method is used to study the hydrodynamic characteristic of the vehicle equipped with different fairings.
This section defines the angle of attack α of the integrated vehicle as negative in the ascending stage and positive in the descending stage. The surface mesh type of the vehicle in the computational domain is triangular, and the mesh size is set to 4 mm. The mesh type of the other position is tetrahedral, and the mesh size is set to 512 mm. In addition, the RANS equation and the k-ω SST turbulence model are used for calculation and solution. This study applies the ANSYS Fluent solver to calculate the hydrodynamic forces of three different fairings. The range of the vehicle’s linear velocity vm is set to 0.1~0.4 m/s, and the angle of attack α is 0°, 2°, 4°, 6°, 8°, 10°, and 12° for CFD modeling and simulation.
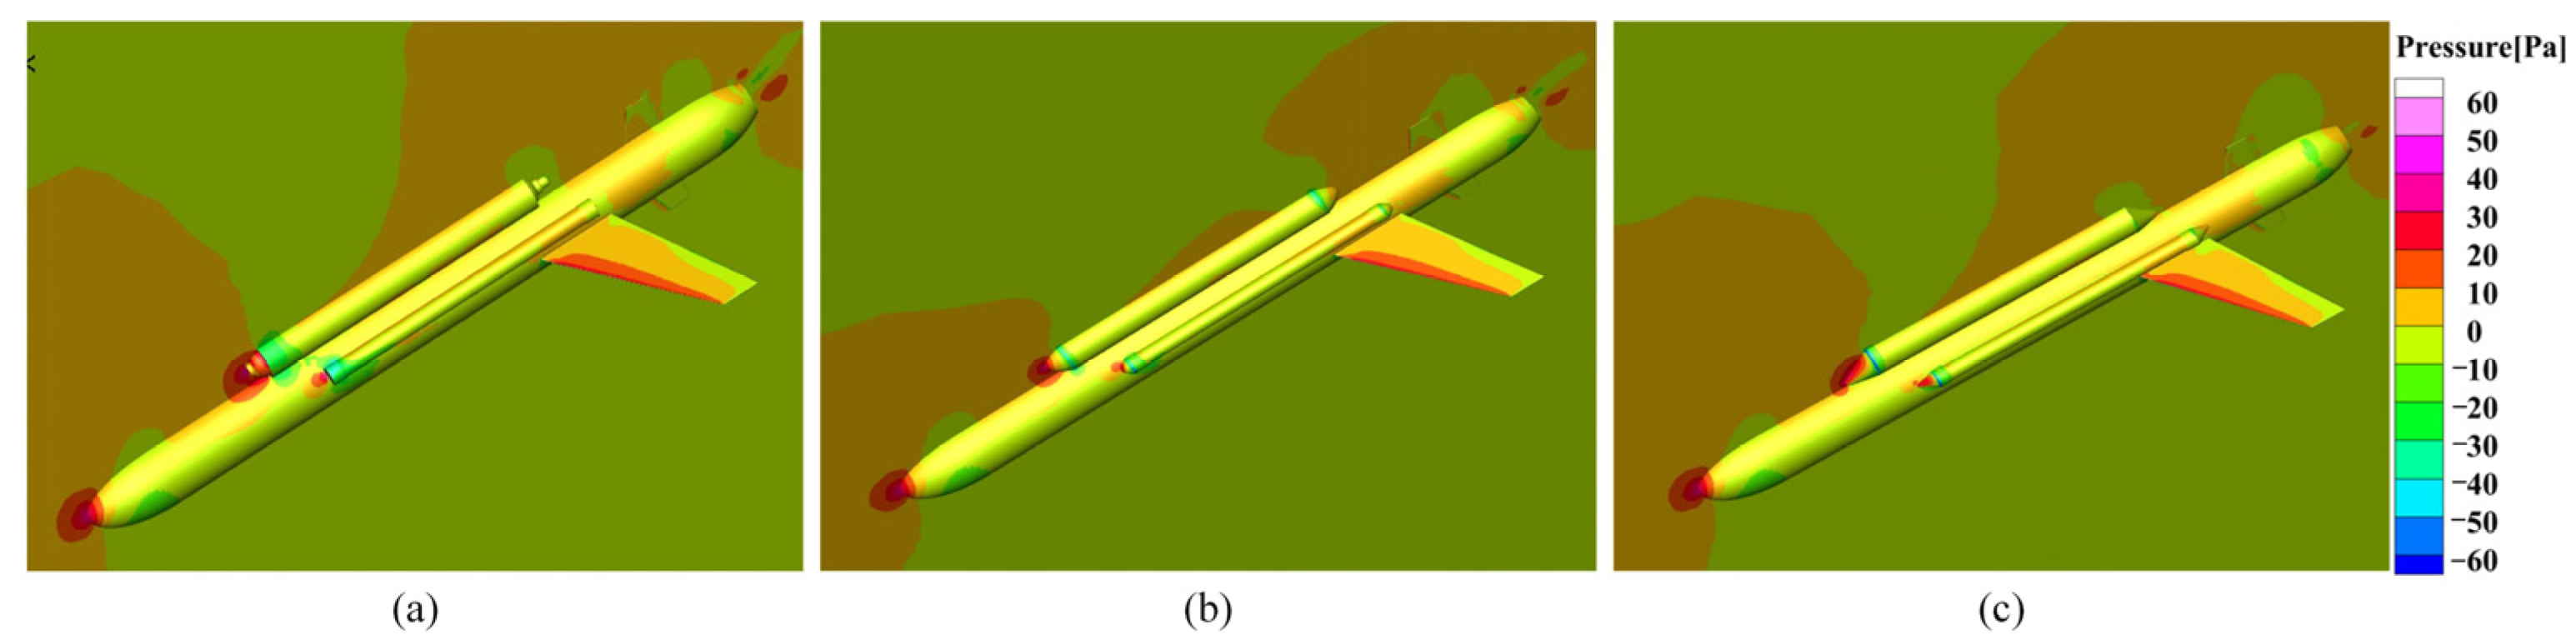
The pressure distribution on the surface and the symmetry planes of the three models are analyzed with vm = 0.3 m/s and α = 8°, as shown in Figure 5. The three models share the same surface pressure distribution, and the high-pressure area of the thermal power generation module appears at the head of the thermal energy conversion device and the heat exchange tubes. Among the three models, the third model shows the most uniform surface pressure distribution, with no obvious pressure concentration, and the second model shows a slightly worse performance. For the first model, there is a relatively obvious pressure concentration at the head of the thermal energy conversion device and the heat exchange tubes. Under the same conditions, a more uniform surface pressure distribution means a greater lift and resistance of the underwater vehicle. Therefore, the inclined conical fairing of the thermal energy power generation module is more conducive to reducing the resistance of the Smart Float.
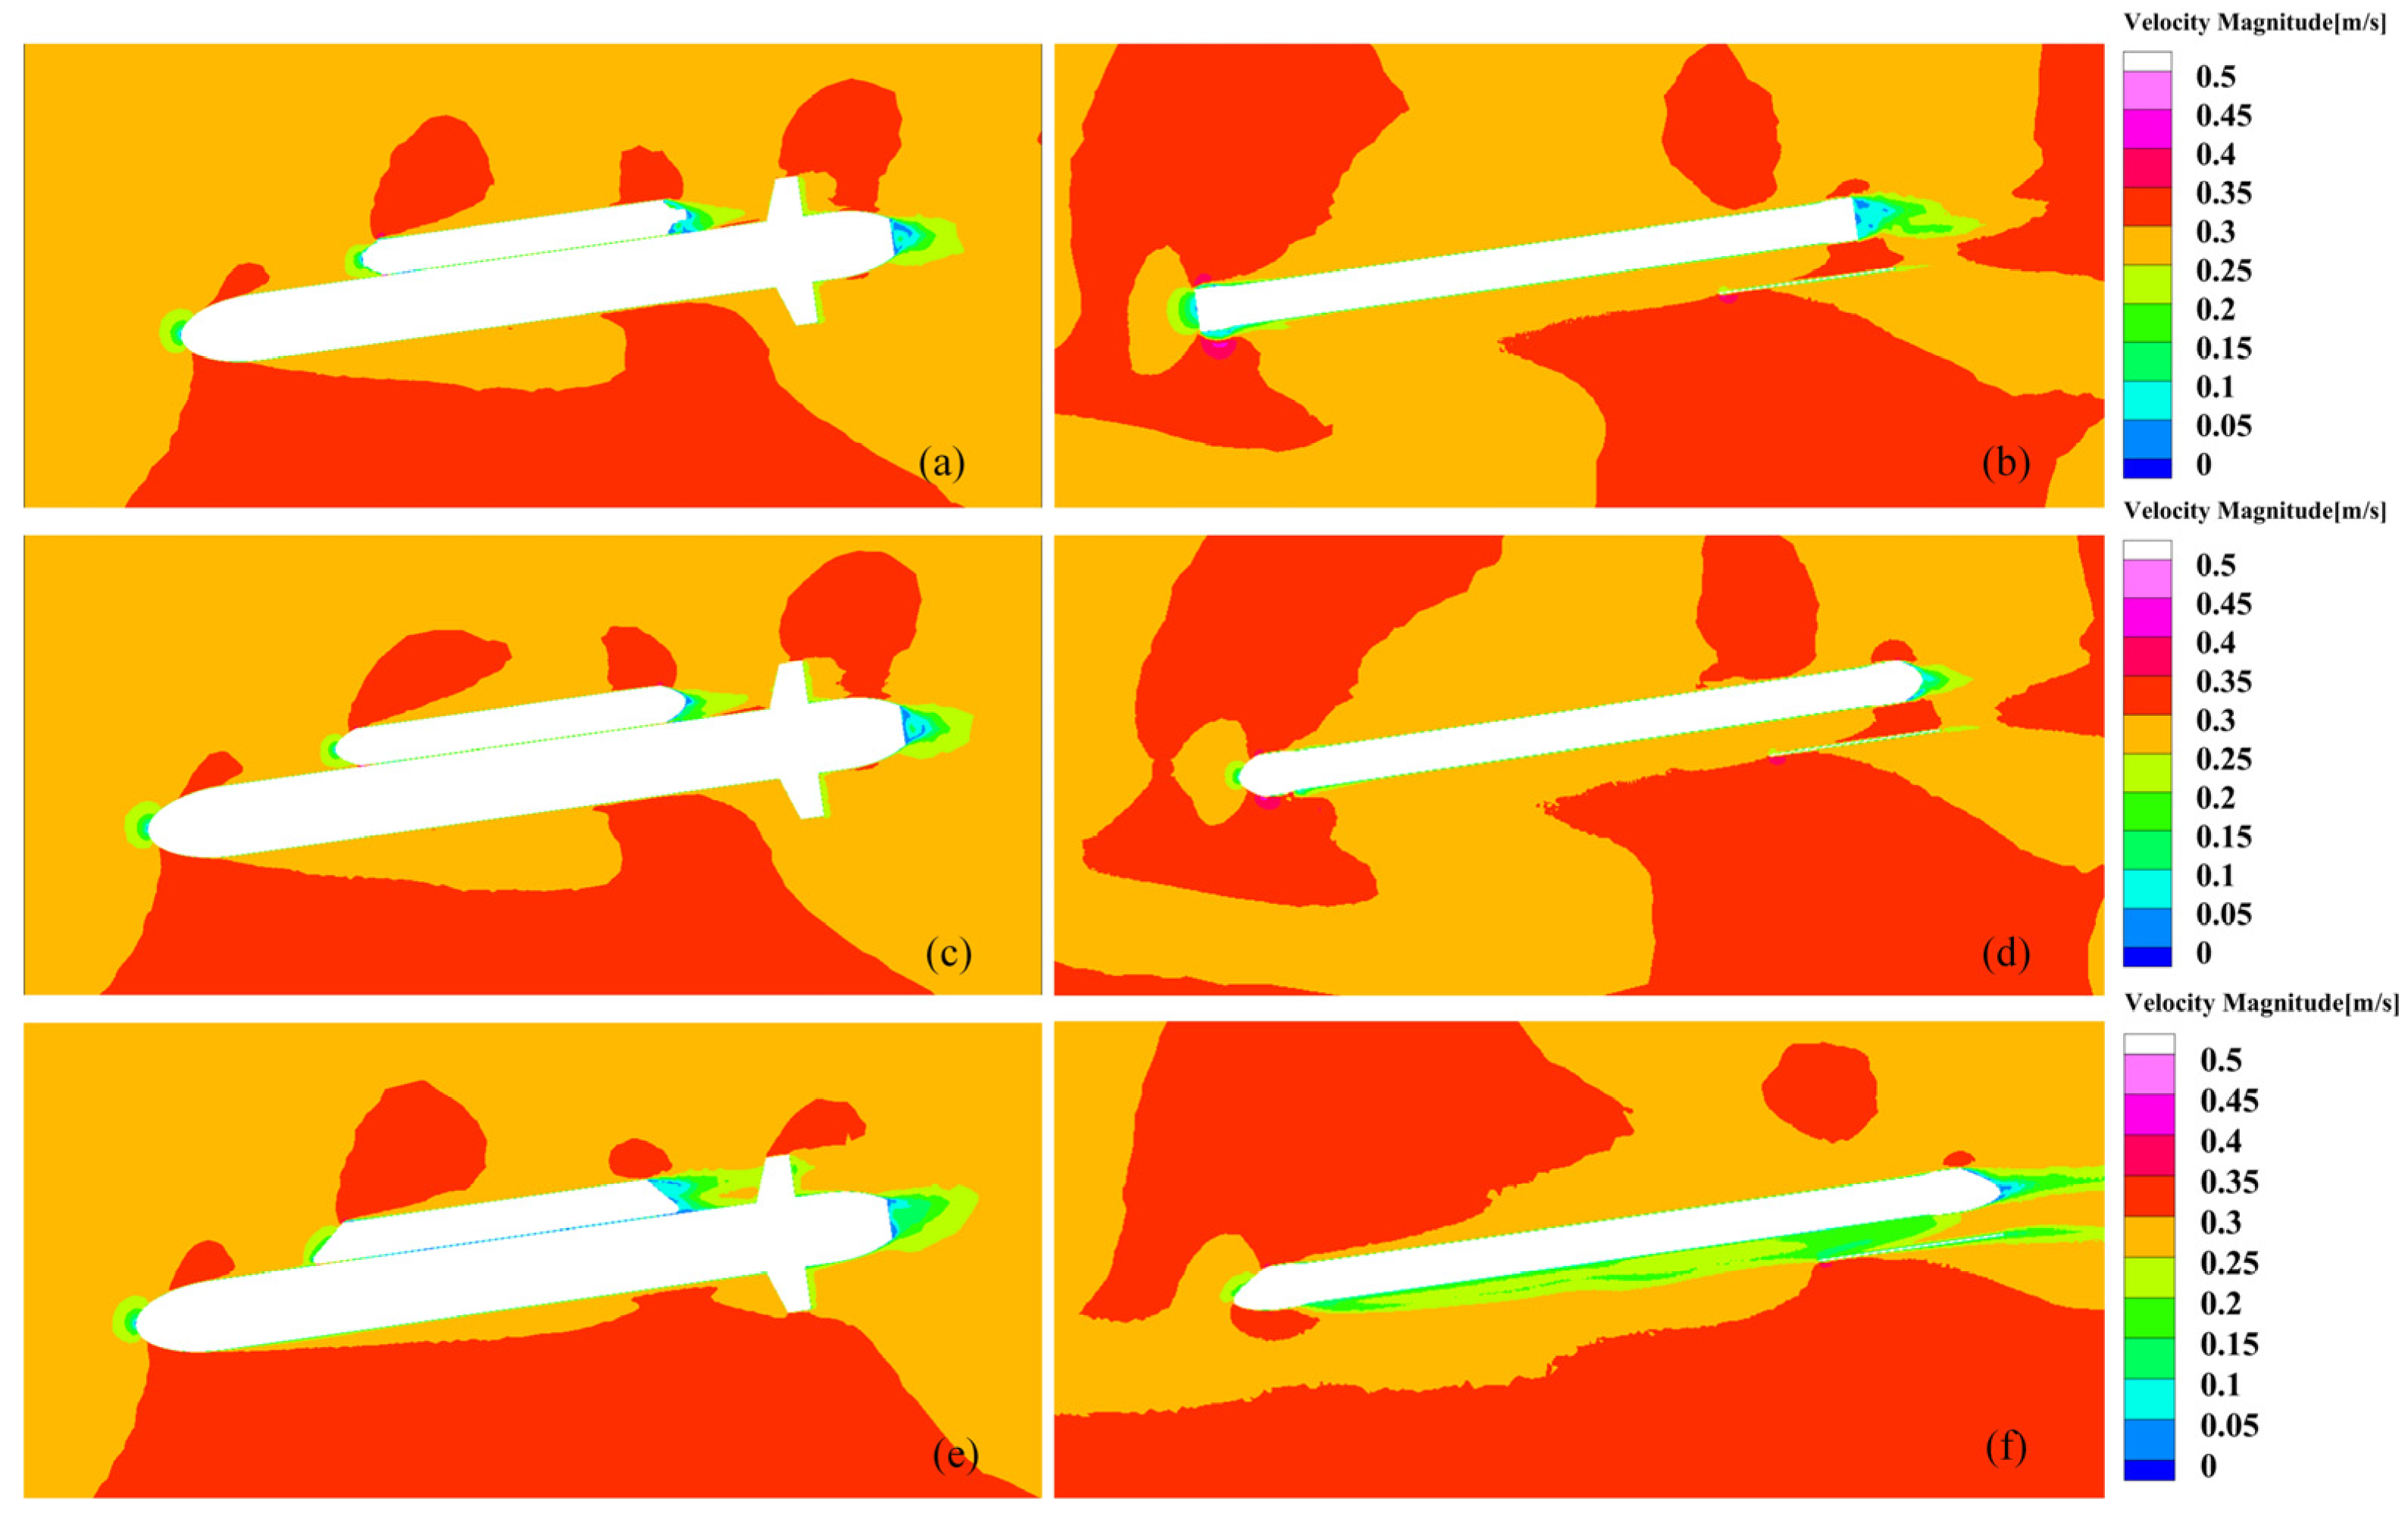
The flow velocity distribution on the surface of the thermal power generation device and the heat exchange tubes of the three models are analyzed with vm = 0.3 m/s and α = 8°, as shown in Figure 6.
The flow velocity distribution on the surface of the thermal power generation device and the heat exchange tubes of the three models are analyzed with vm = 0.3 m/s and α = 8°, as shown in Figure 6.
- According to Figure 6a,c,e, a relatively large wake is produced at the tail when the water flow is separated from the thermal power generation device. The thermal energy conversion device with a flat fairing shows the largest wake and flow velocity loss, which has a great interference with the flow field at the tail. In comparison, the flow velocity loss of the device with an inclined conical fairing is slightly less. The device with a conical fairing has the smallest wake and flow velocity loss, showing the smallest interference to the flow field at the tail;
- Based on Figure 6b,d,f, the heat exchange tube with a flat fairing shows the most serious turbulent dissipation at the head, the tube with a conical fairing shows slightly less turbulent dissipation, while the tube with an inclined conical fairing has the least turbulence dissipation, almost negligible;
- The wake and flow velocity loss of heat exchange tubes with different fairings can also be found in Figure 6b,d,f. The tube with a flat fairing has the largest wake and flow velocity loss at the tail when the water flow is separated from the tube at the tail, causing an obvious flow velocity loss on the upper surface of the wing. By contrast, the tube with a conical fairing has a smaller flow velocity loss at the tail, with a weaker influence on the flow velocity of the upper surface of the wing. The tube with an inclined conical fairing shows optimal performance in the wake and flow velocity loss at the tail, bringing the least influence on the flow velocity of the upper surface of the wing.
In summary, the inclined conical fairing has the least influence on the flow velocity of the vehicle.
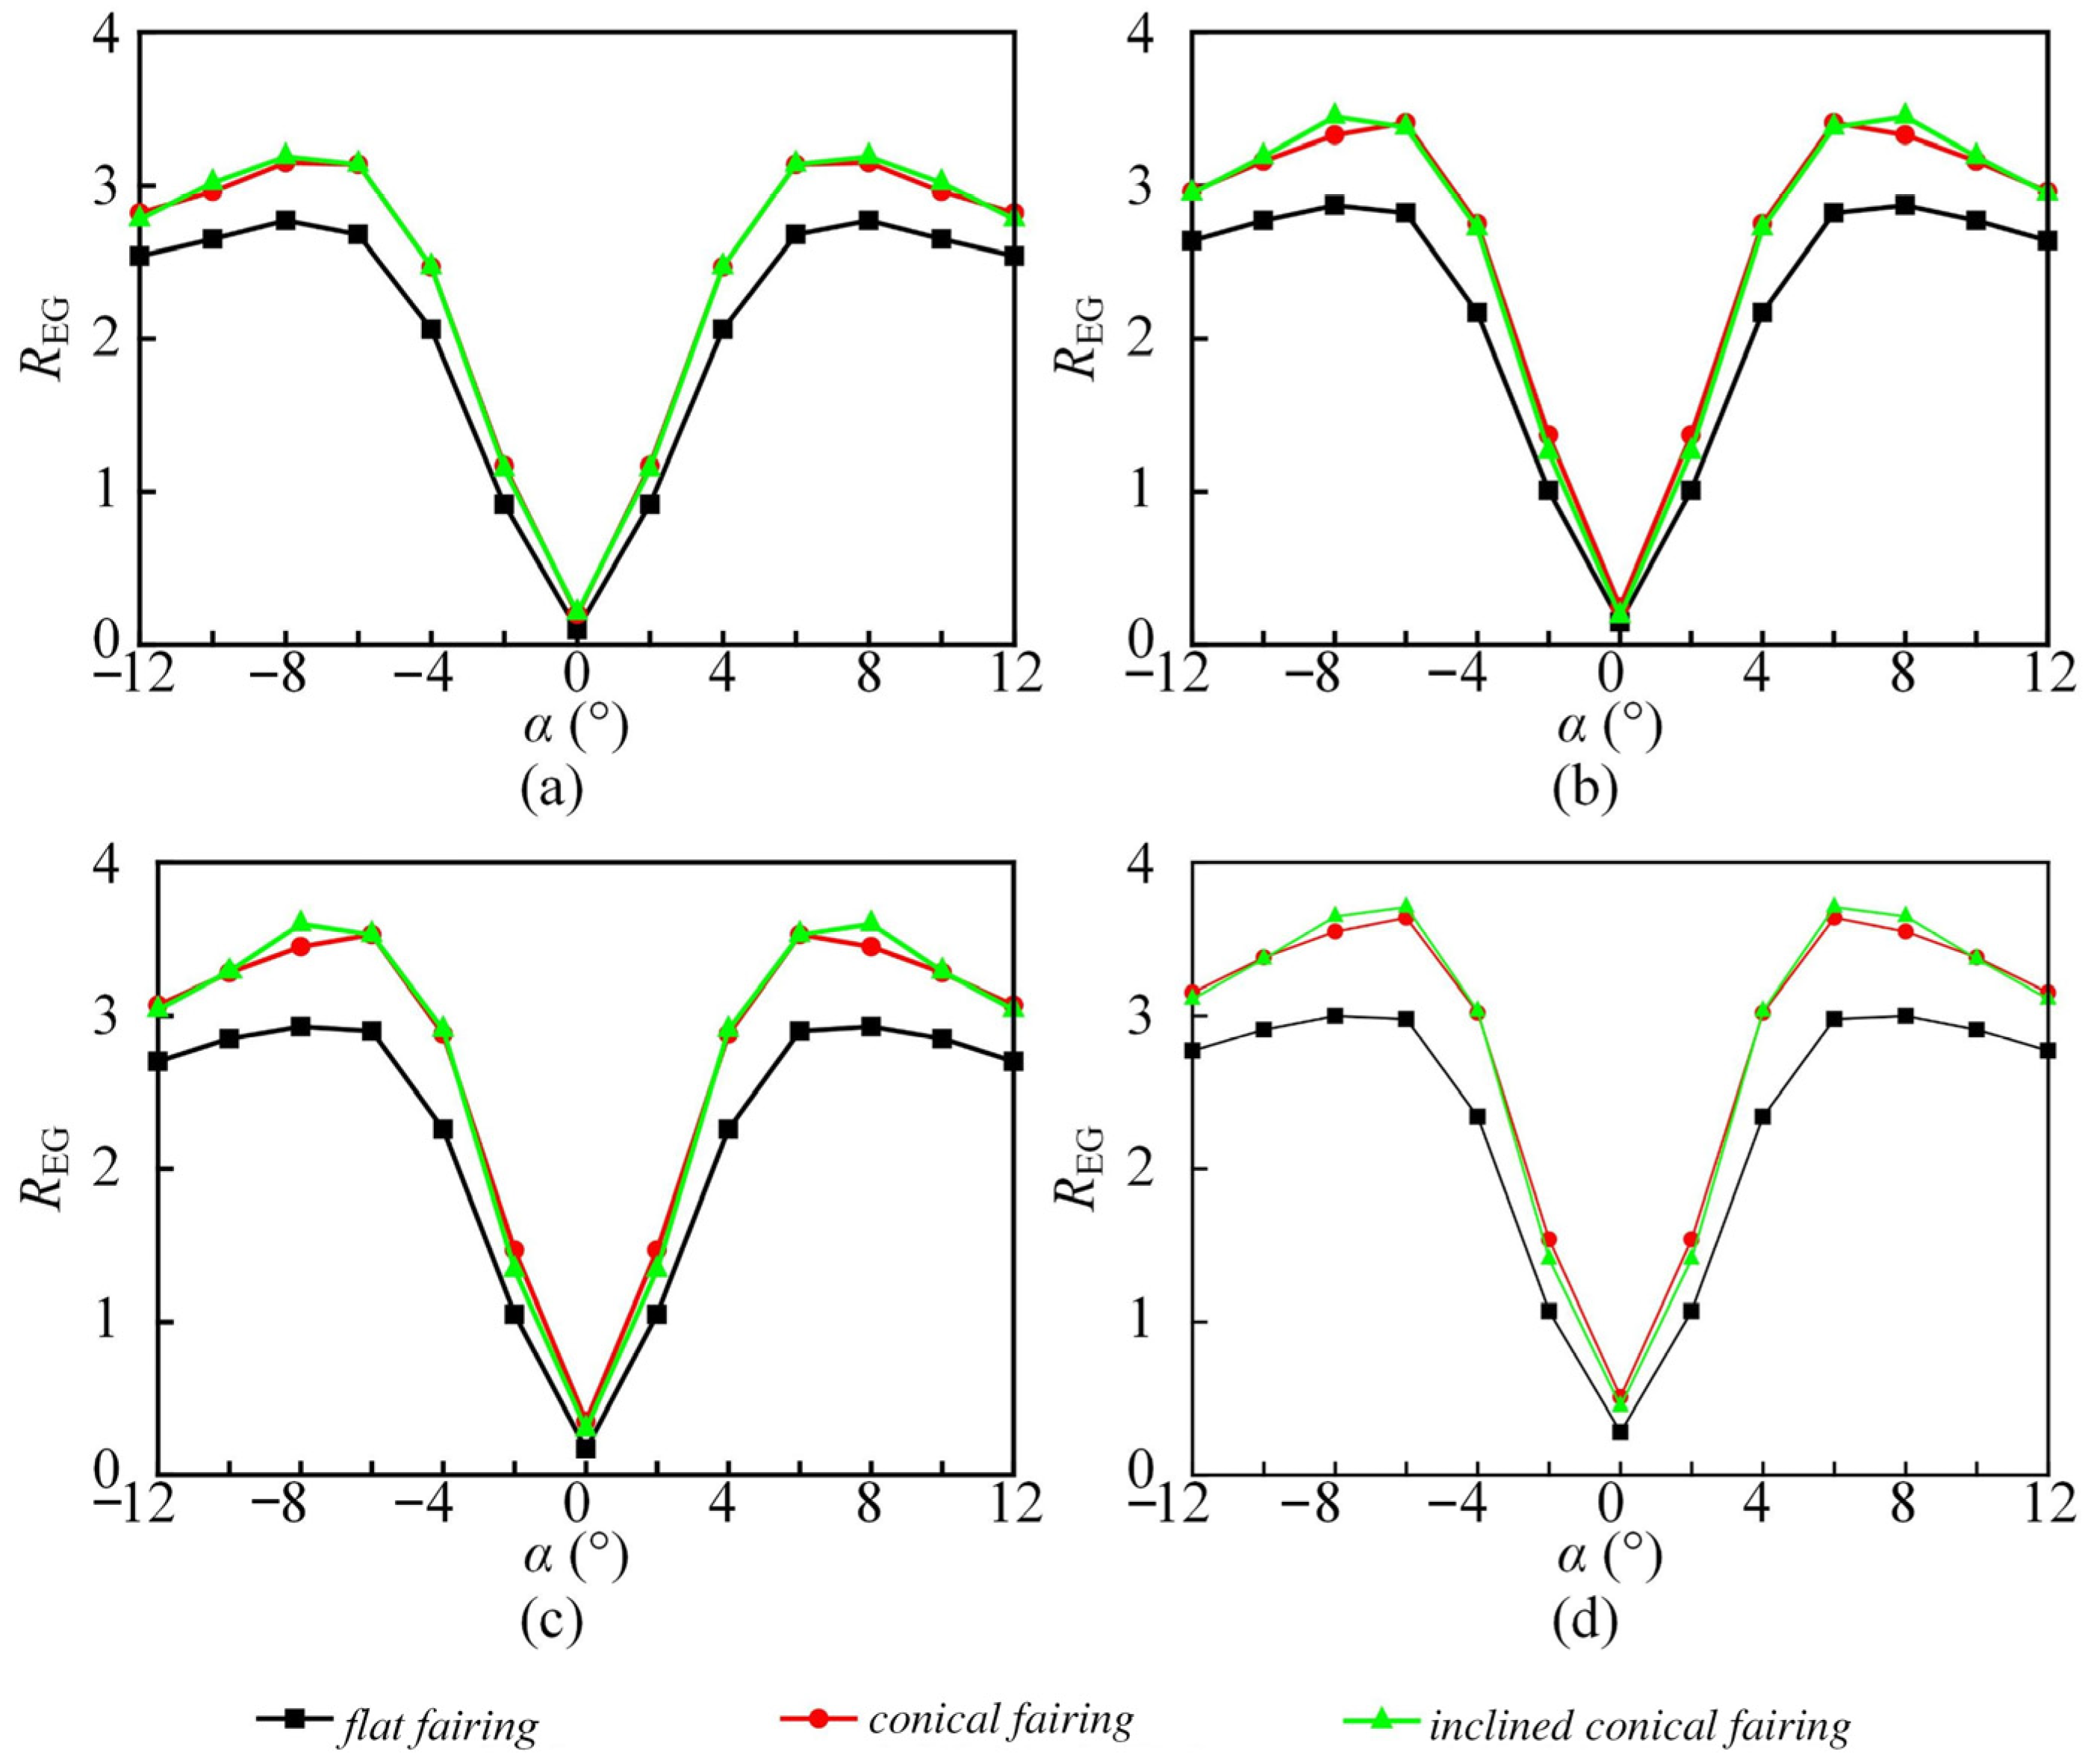
In addition, this study takes the lift-drag ratio as the indicator for evaluating the underwater navigation economy of Smart Float integrating the thermal energy power generation module with different fairings. The larger the lift-drag ratio means the better the navigation economy. Here, we use CFD to calculate how the lift-drag ratio of the three models varies with the angle of attack under different speed conditions, and the results are shown in Figure 7. The following can be concluded according to Figure 7.
- The lift-drag ratio of Smart Float has a small correlation with the speed vm, experiencing smaller variations under different speed conditions;
- At a small angle of attack (0° ≤ α ≤ 8°), the increase in the lift flow surface of the vehicle outweighs that in the resistance flow surface, and therefore the lift-drag ratio increases with the angle of attack. At a large angle of attack (α > 8°), the increase in the lift flow surface is less than that of the resistance flow surface, and thus the lift-drag ratio decreases with the increase of the angle of attack. This changing trend of the lift-drag ratio is related to the flow surface of the model;
- The wake and flow velocity loss of heat exchange tubes with different fairings can also be found in Figure 6b,d,f. The tube with a flat fairing has the largest wake and flow velocity loss at the tail when the water flow is separated from the tube at the tail, causing an obvious flow velocity loss on the upper surface of the wing. By contrast, the tube with a conical fairing has a smaller flow velocity loss at the tail, with a weaker influence on the flow velocity of the upper surface of the wing. The tube with an inclined conical fairing shows optimal performance in the wake and flow velocity loss at the tail, bringing the least influence on the flow velocity of the upper surface of the wing.
Considering the underwater navigation economy of Smart Float, the inclined conical fairing is selected for the thermal energy power generation module in this study.
3.3. Heat Transfer Characteristic
To evaluate the heat transfer characteristic of the Smart Float integrating the proposed module is typical profiles, here we analyze the influence of various temperature boundary conditions on volume change and conversion performance of the PCM onboard, based on the model of ocean thermal energy utilization system previously established by our team [30]. To guarantee the authenticity and accuracy of the mathematical model, our model considers the functional relationship between the thermal physical parameters (density and thermal conductivity) of PCM and the environment (pressure and temperature), and the physical properties of the material will change with the temperature and pressure conditions during the phase transformation.
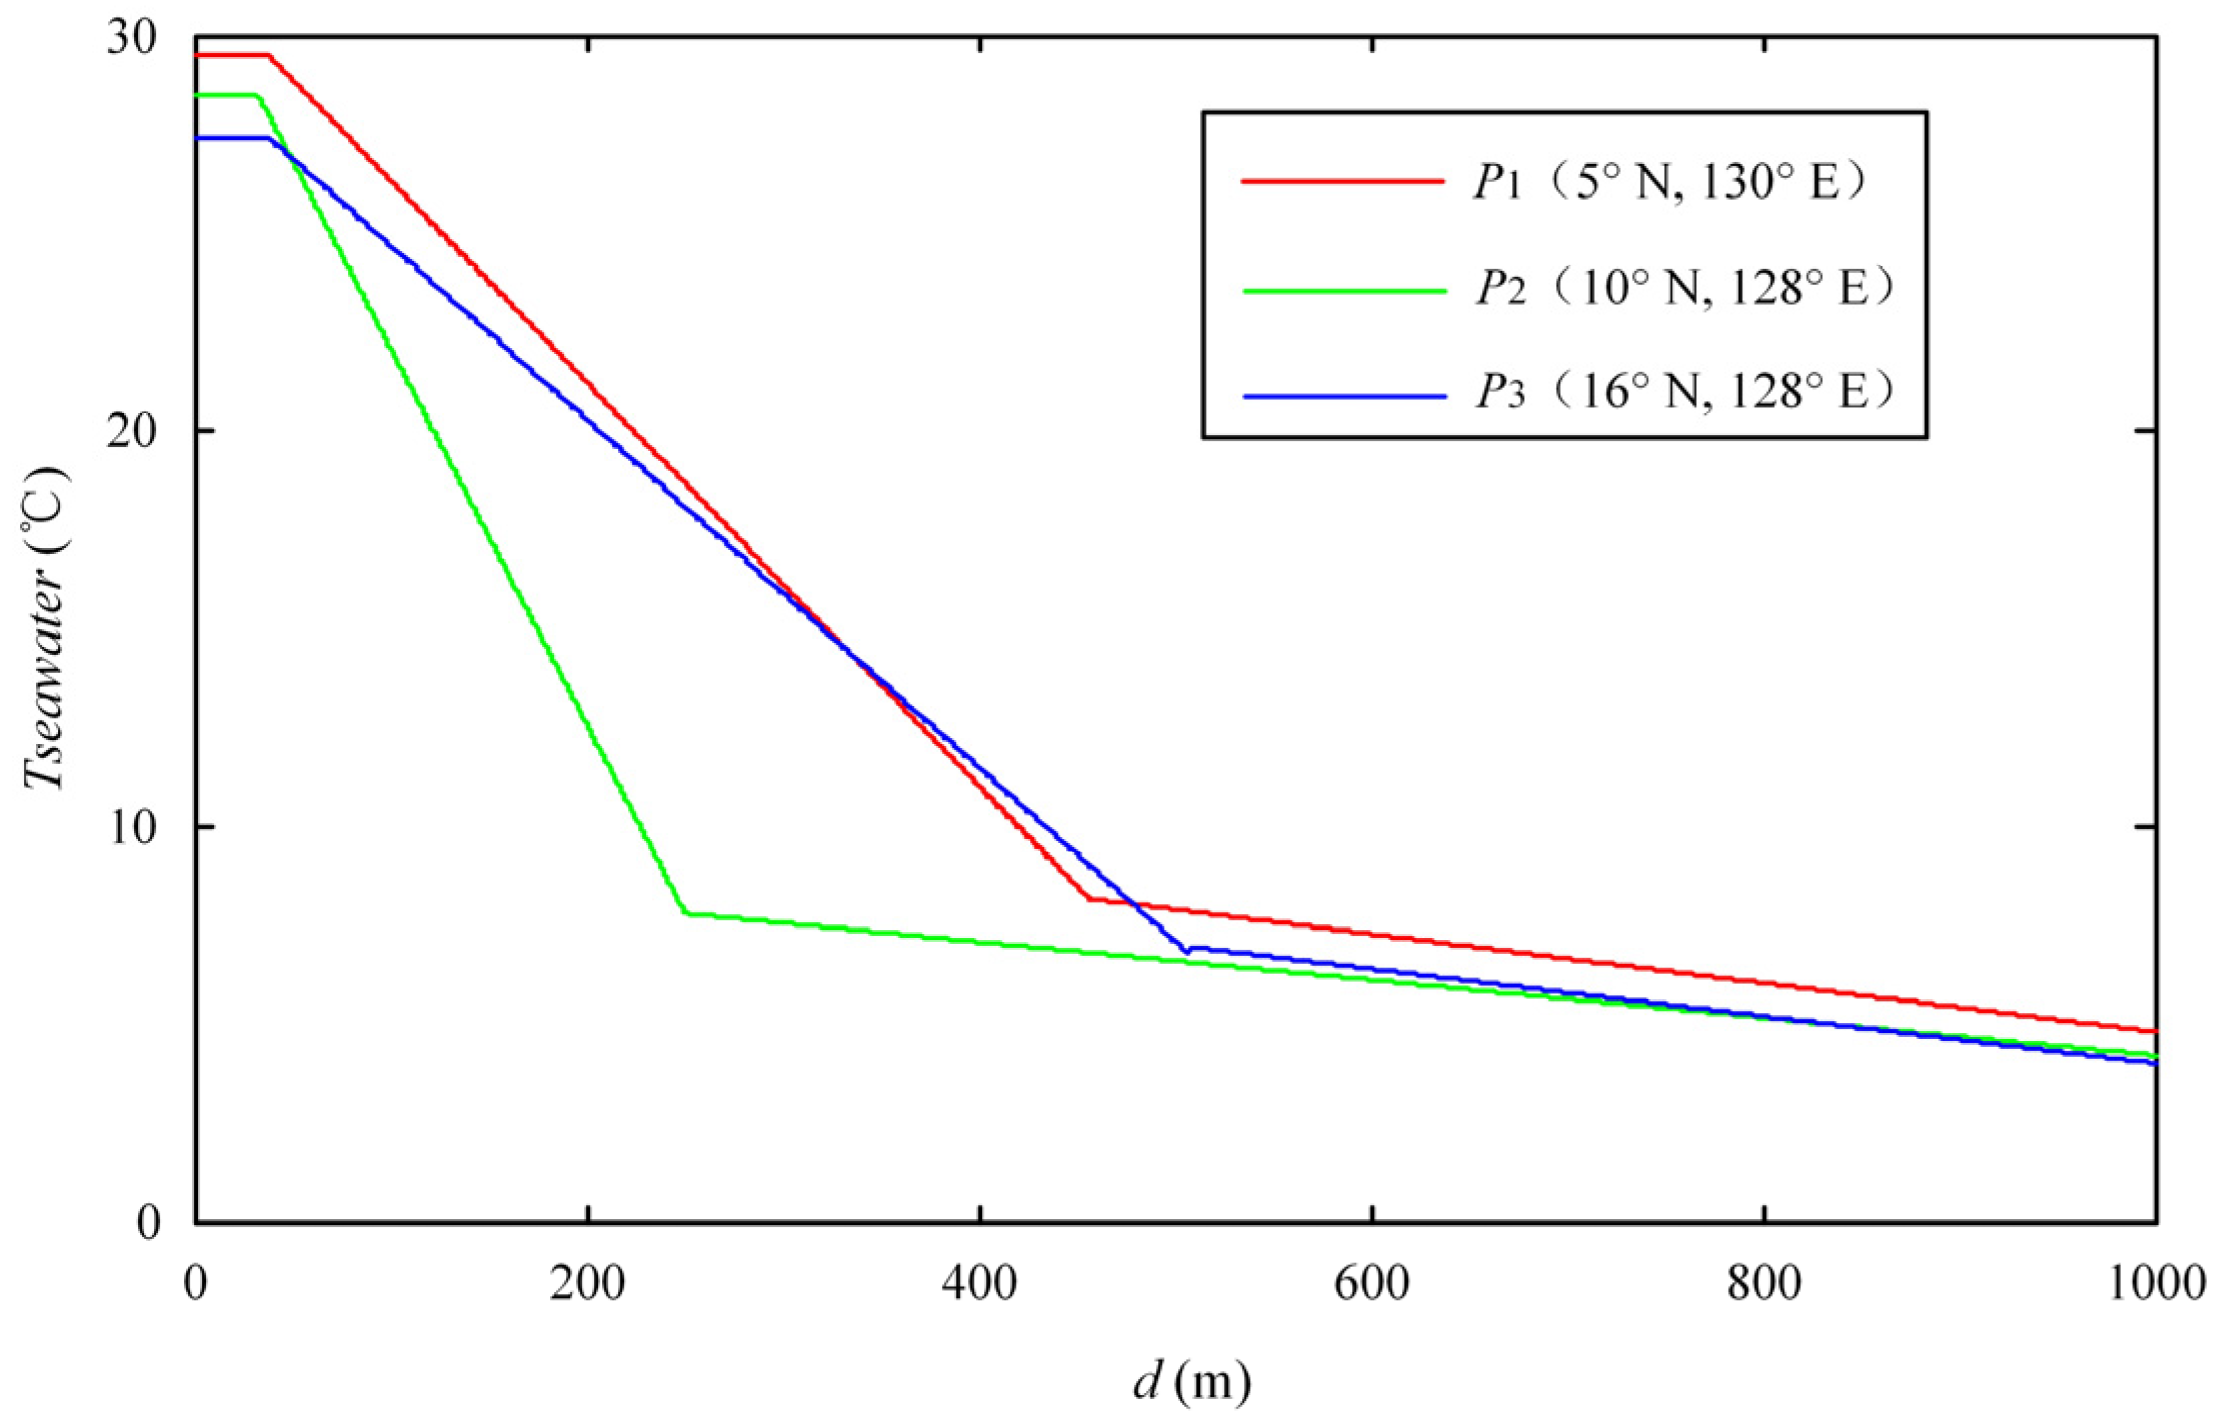
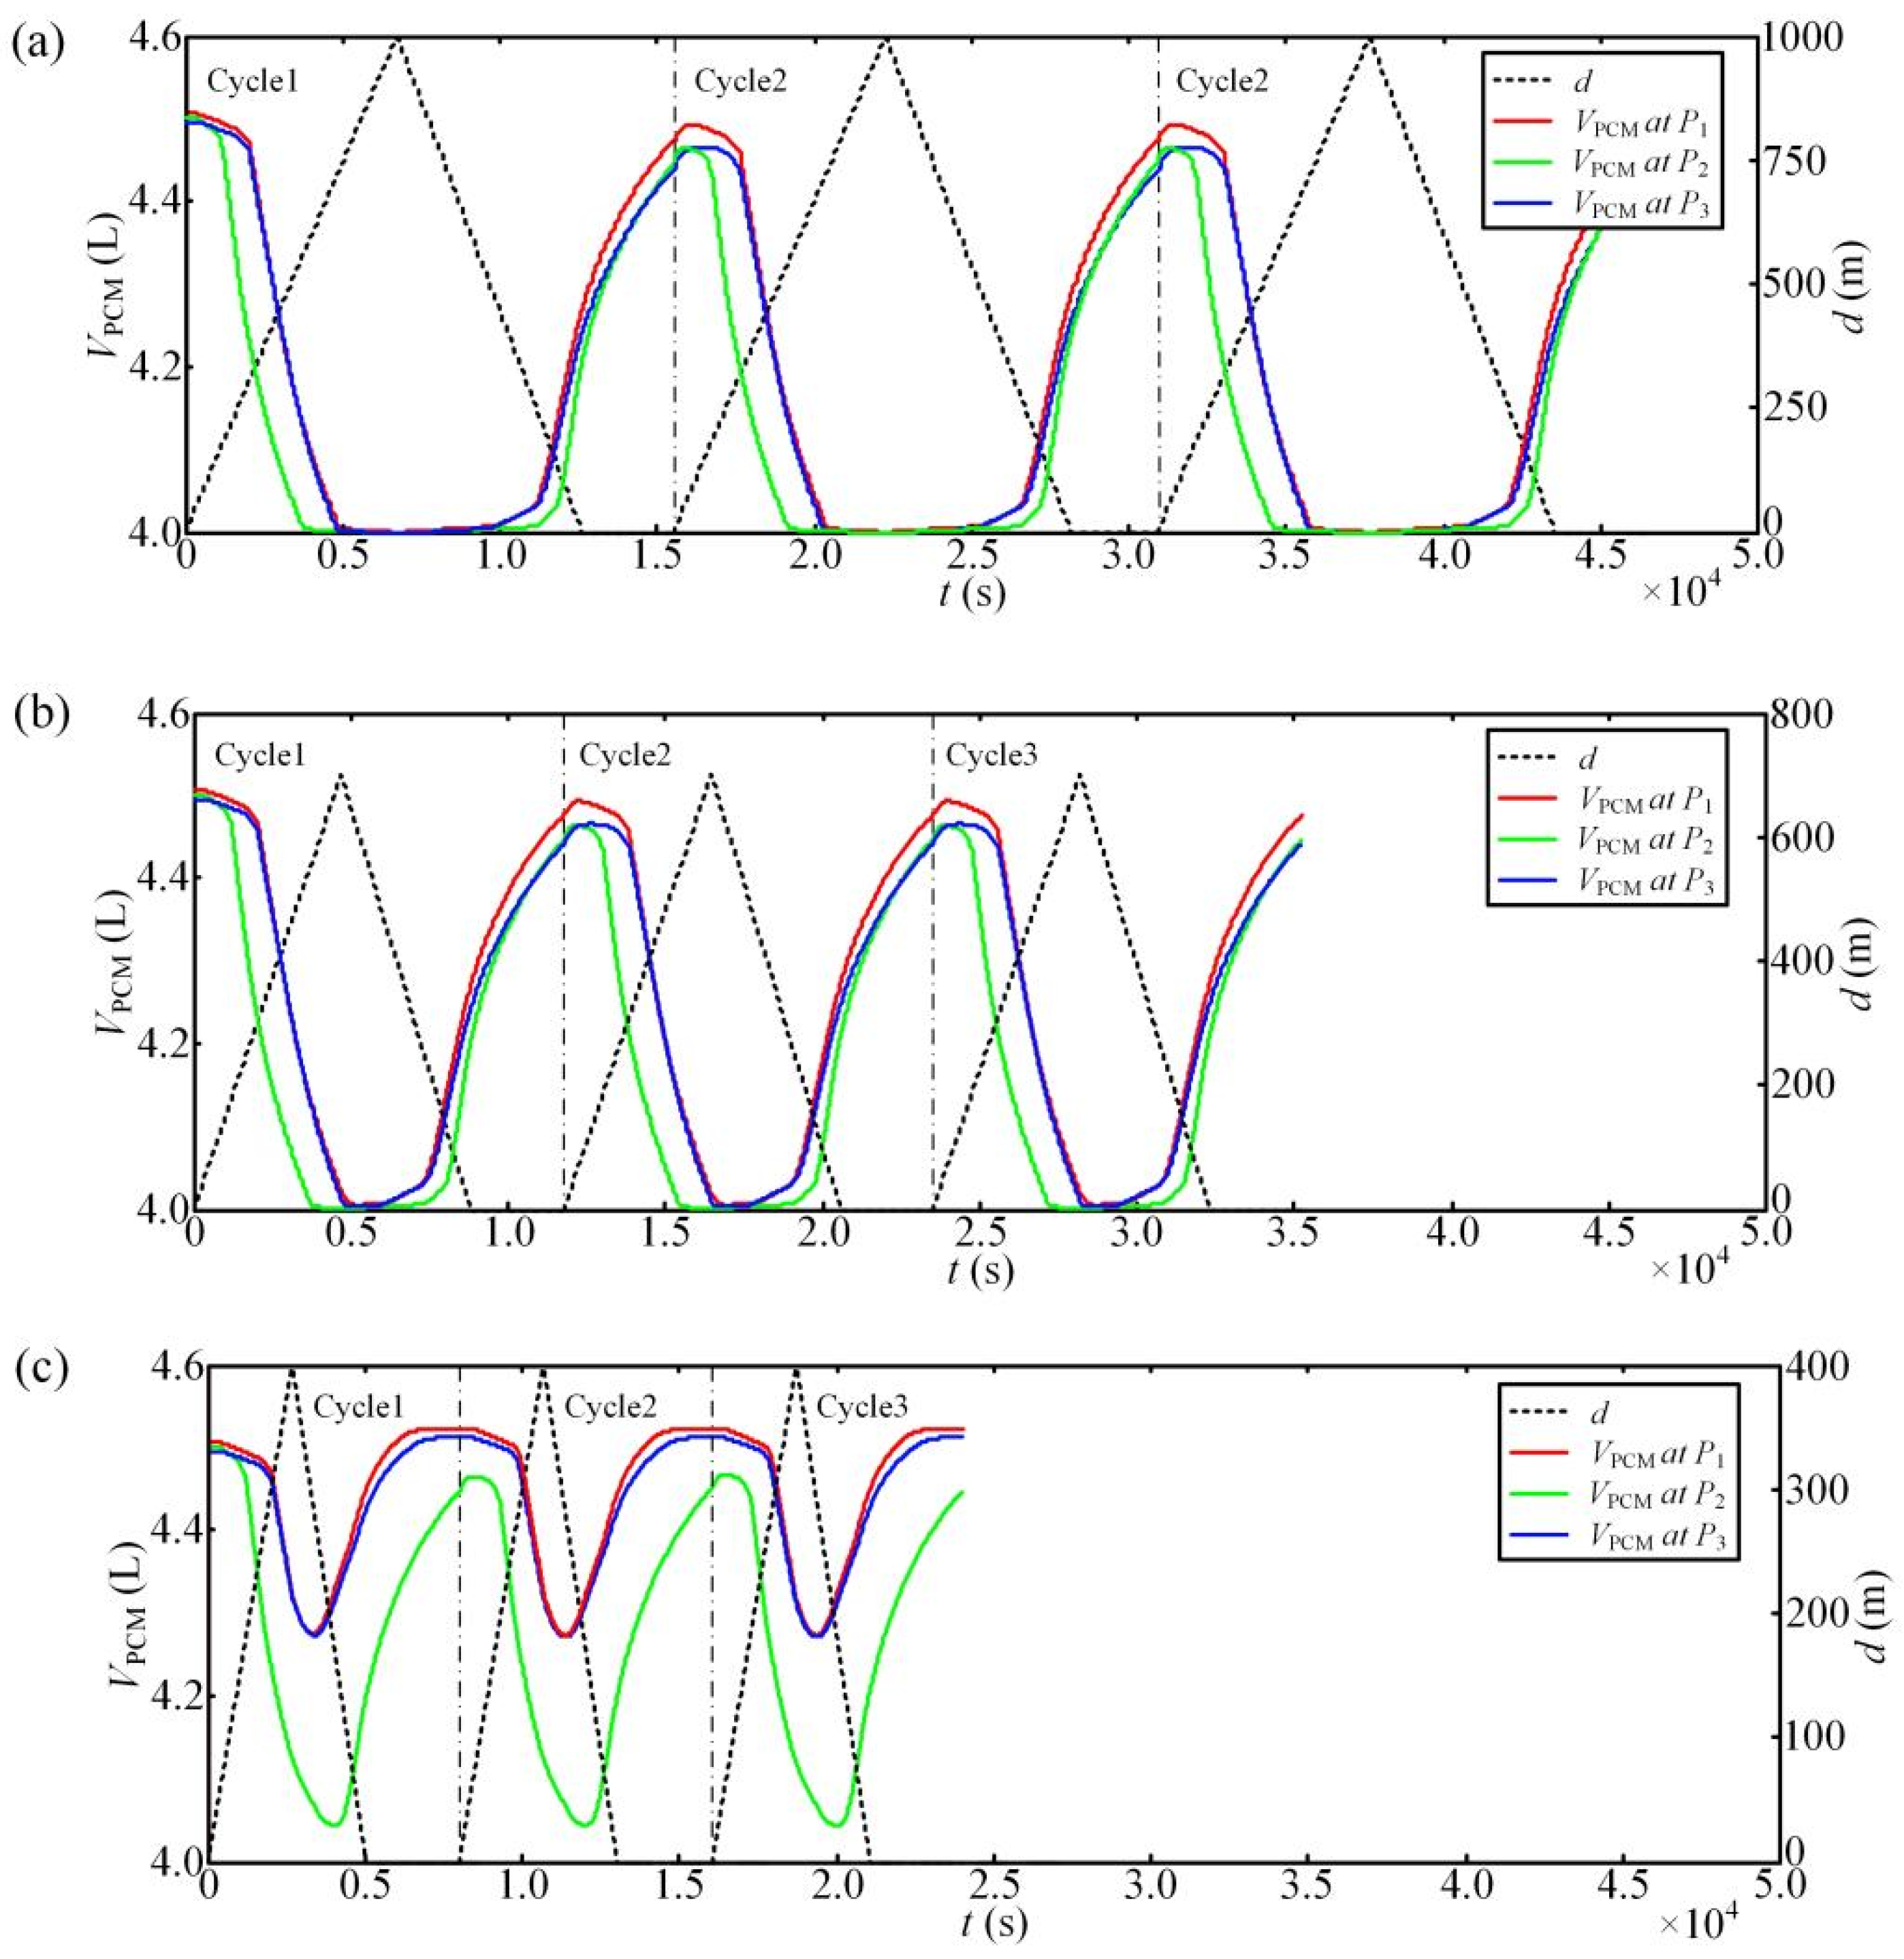
Figure 8 presents the variation of seawater temperature at three different positions depicted according to the profile data obtained previously, where there are three variable temperature boundaries, corresponding to three feature positions in the ocean [31]. The variation of seawater temperature with depth at P1, P2, and P3 is fitted with the following equations respectively.
Moreover, the variation of PCM volume of Smart Float with diving depth at the three positions is simulated and the results are given in Figure 9. When the vehicle dives to 400 m under the same navigation control parameters, the three positions witness different variations of PCM volume, as is observed in Figure 9a. During the descending stage, the solidification time of PCM at P2 is shorter than that at P1 and P3. In particular, the volume reduction rate of the PCM at P2 is about twice that at P1 and P3 within the diving depth range from 0 m to 200 m, when the volume variation curves of P1 and P3 are almost coincident. At the maximum diving depth (400 m), the volume of the remaining PCM is almost equal at the three positions. In the ascending stage, the volume growth rate of the PCM at P1 and P3 is higher than that at P2. When Smart Float returns to the sea surface and starts to float, the volume growth rate at P1 is the highest, and that at P3 is the lowest. The volume expansion of a single tube at three positions during this cycle is 0.555 L, 0.526 L, and 0.527 L respectively.
Also according to Figure 8, the temperature gradient at P2 in the depth range of 33 m to 250 m (thermocline) is 1.86 times and 2.16 times that at P1 and P3. In the thermocline, the temperature at P2 decreases fastest with the increase of depth. The volume shrinkage rate of the PCM in the diving stage increases with the seawater temperature gradient. Among the three points, P1 has the lowest latitude and the highest sea surface temperature, while P3 has the highest latitude and the lowest sea surface temperature. When Smart Float is on the sea surface, the volume expansion rate of the PCM is related to the surface seawater temperature, and the volume expansion rate of the PCM at P1 is the highest in this stage. The complete phase change of the PCM can be realized during a power generation process at all three positions. The volume change rate of the material will slightly attenuate because the innermost layer of the material cannot reach the surrounding water temperature.
By analyzing the data in Figure 9, the diving depth of the Smart Float has a significant influence on the variation of PCM volume. At the diving depth of 1000 m, the variation of PCM volume is generally similar at all three positions. At the diving depth of 700 m, the remaining volume of PCM at P1 and P3 is slightly higher than that at P2. The reason is that although the PCM at P1 and P3 can be completely solidified, the innermost layer still has a relatively high temperature when entering the melting stage. At the diving depth of 400 m, the volume change rate of materials decreases obviously at all three positions, since the solidification time of PCM is shortened in a smaller diving depth, and the complete phase of the PCM cannot be realized. The innermost layer still keeps a liquid phase when the melting stage is started. Because of the large temperature gradient, the PCM P2 can undergo relatively sufficient solidification in a limited time compared with the materials at P1 and P3, thus showing the smallest remaining volume of the PCM and the largest volume change rate. In addition, the ratio of the time for the PCM to shrink to the minimum volume value and the time for the complete profile gradually increases with the decrease of diving depth. For example, with the diving depth of 1000 m, 700 m, and 400 m, the ratios at P1 are 37%, 54%, and 64% respectively.
Based on the above simulation analysis of various sea areas and the heat transfer process at different depths, it can be concluded that the proposed module can realize a complete phase change cycle with a diving depth of 700 m, providing a reconstituted phase change volume for subsequent power generation.
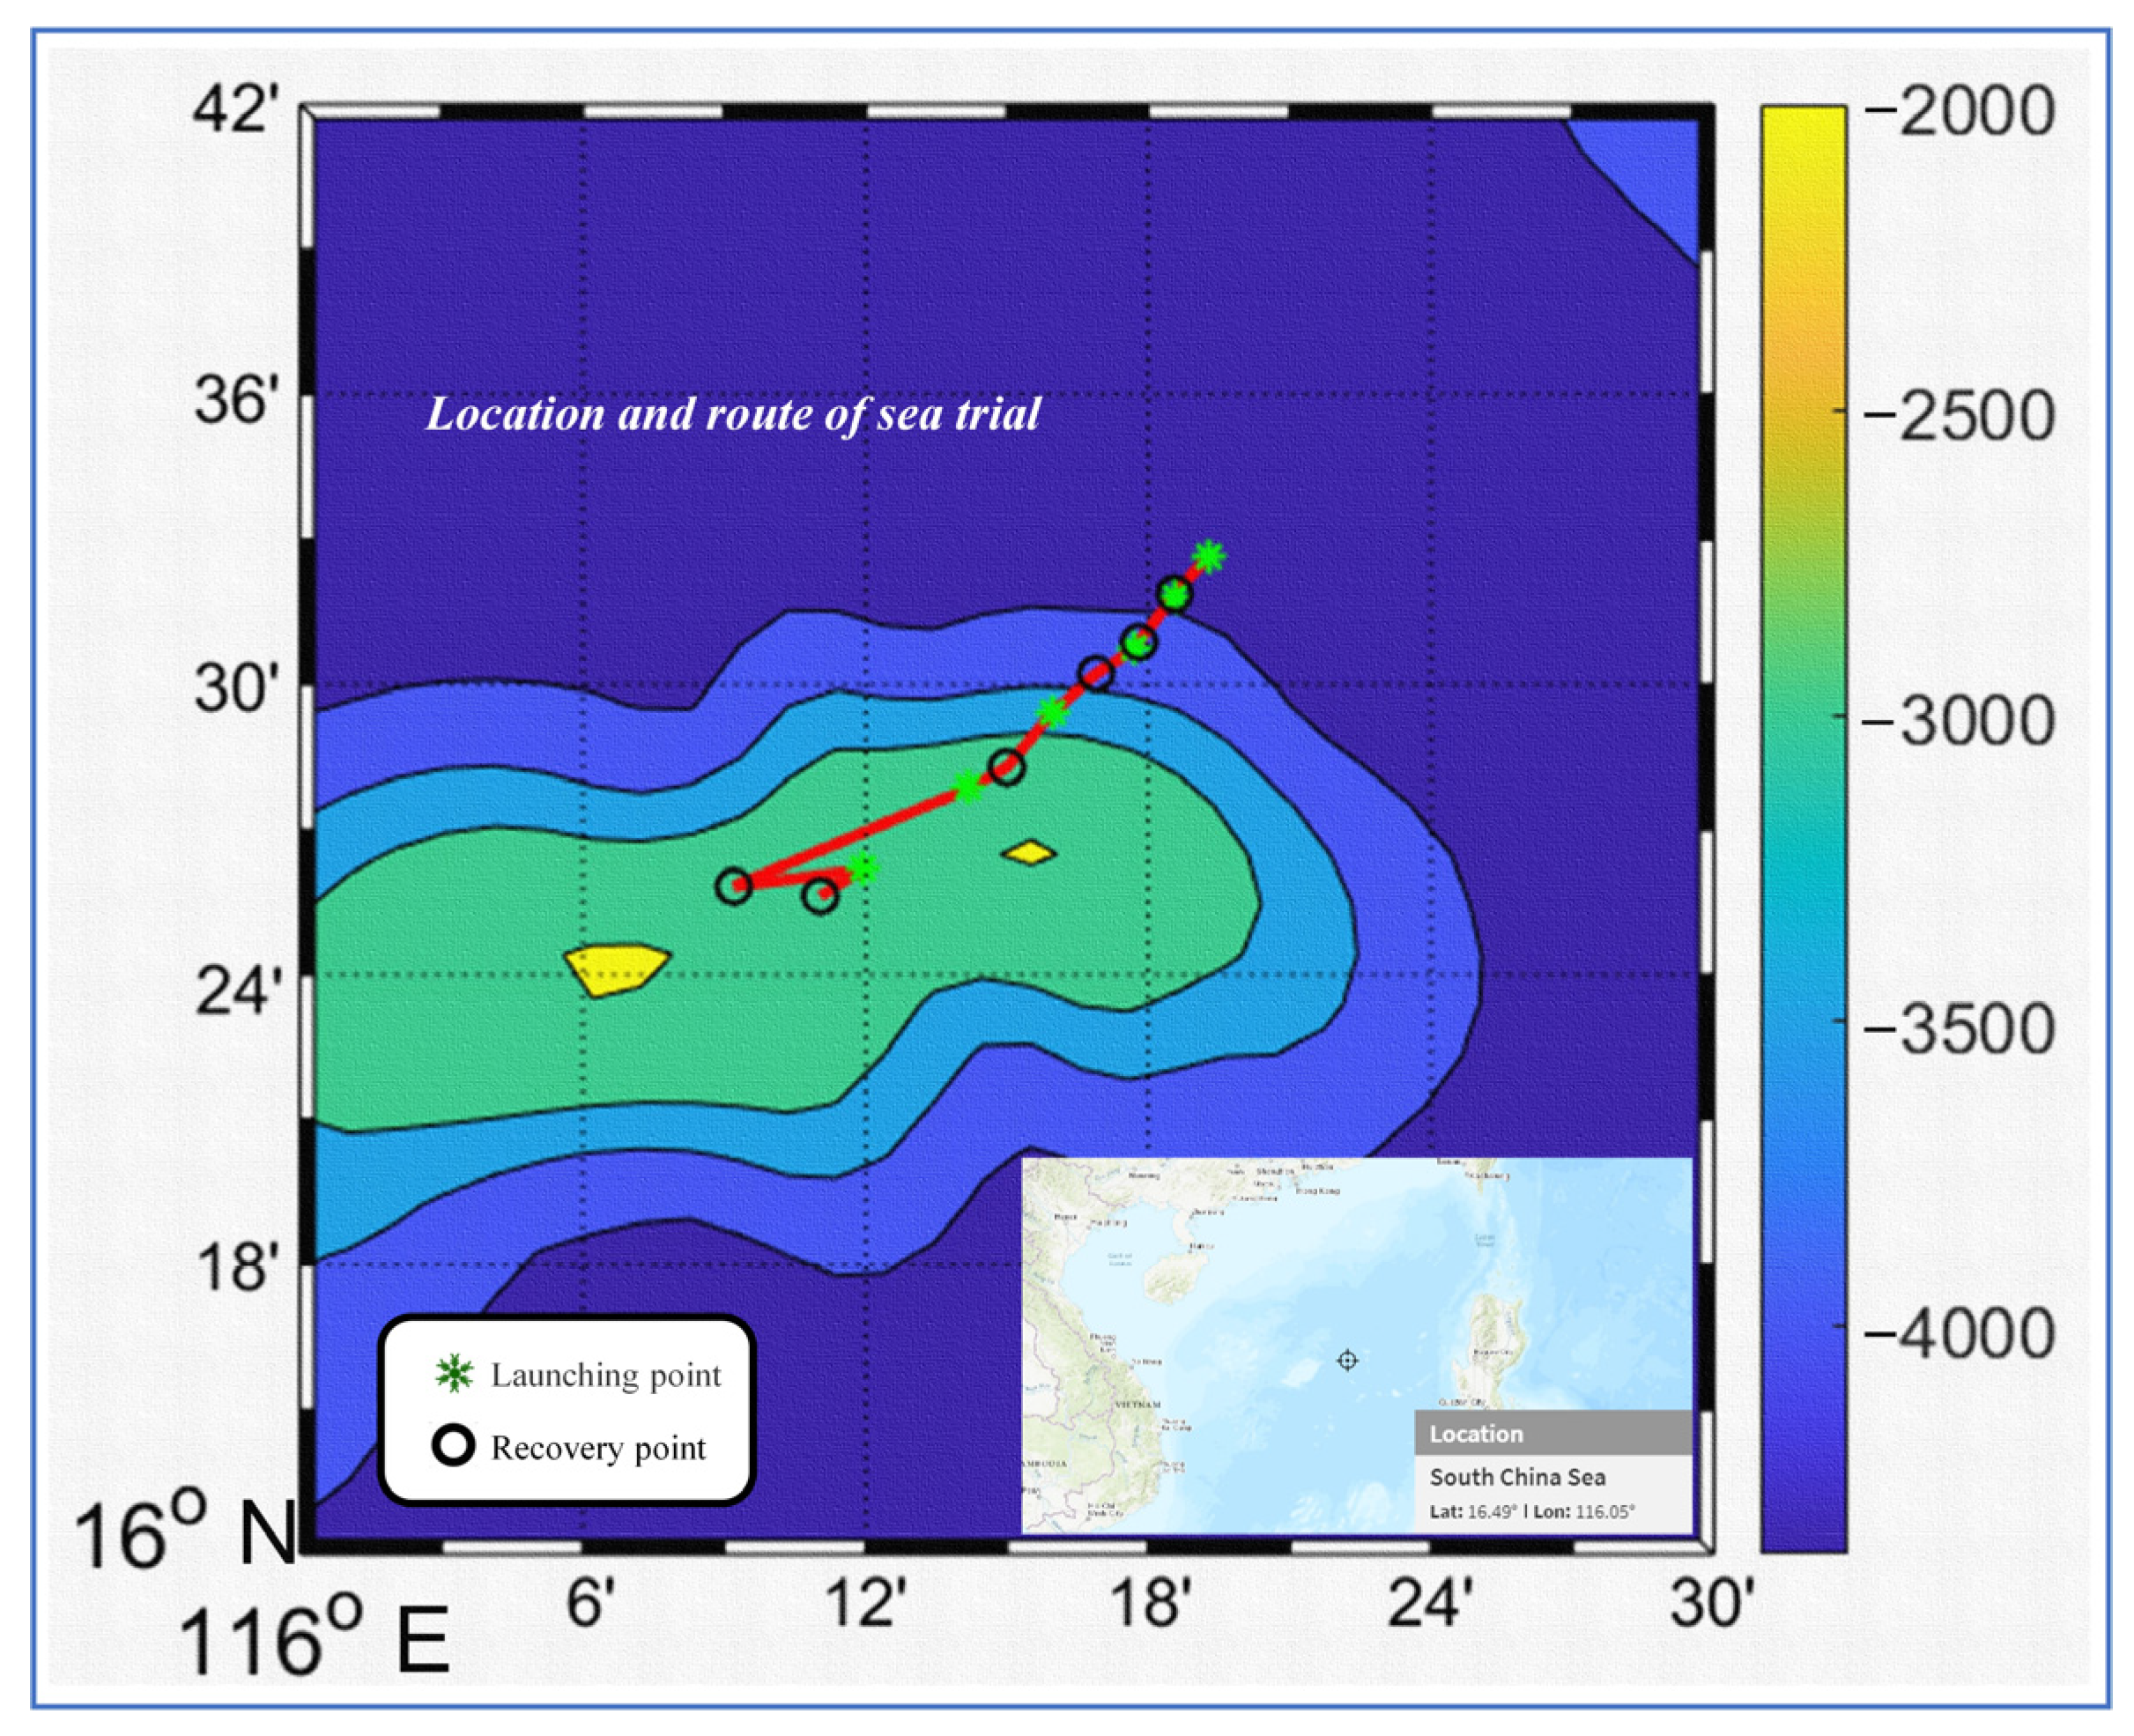
4. Sea Trial and Model Test
The scientific goal of this sea trial was to test the operating performance of the Smart Float integrating the ocean thermal energy power generation module in the real marine environment, and the operating stability of the ocean thermal energy power generation module in a long time sailing as well. On 14 May 2021, Tianjin University deployed a Smart Float in the South China Sea (116.15° E, 16.40° N) with a maximum depth of 4000 m to test the performance of the thermal energy power generation module onboard, as shown in Figure 10.
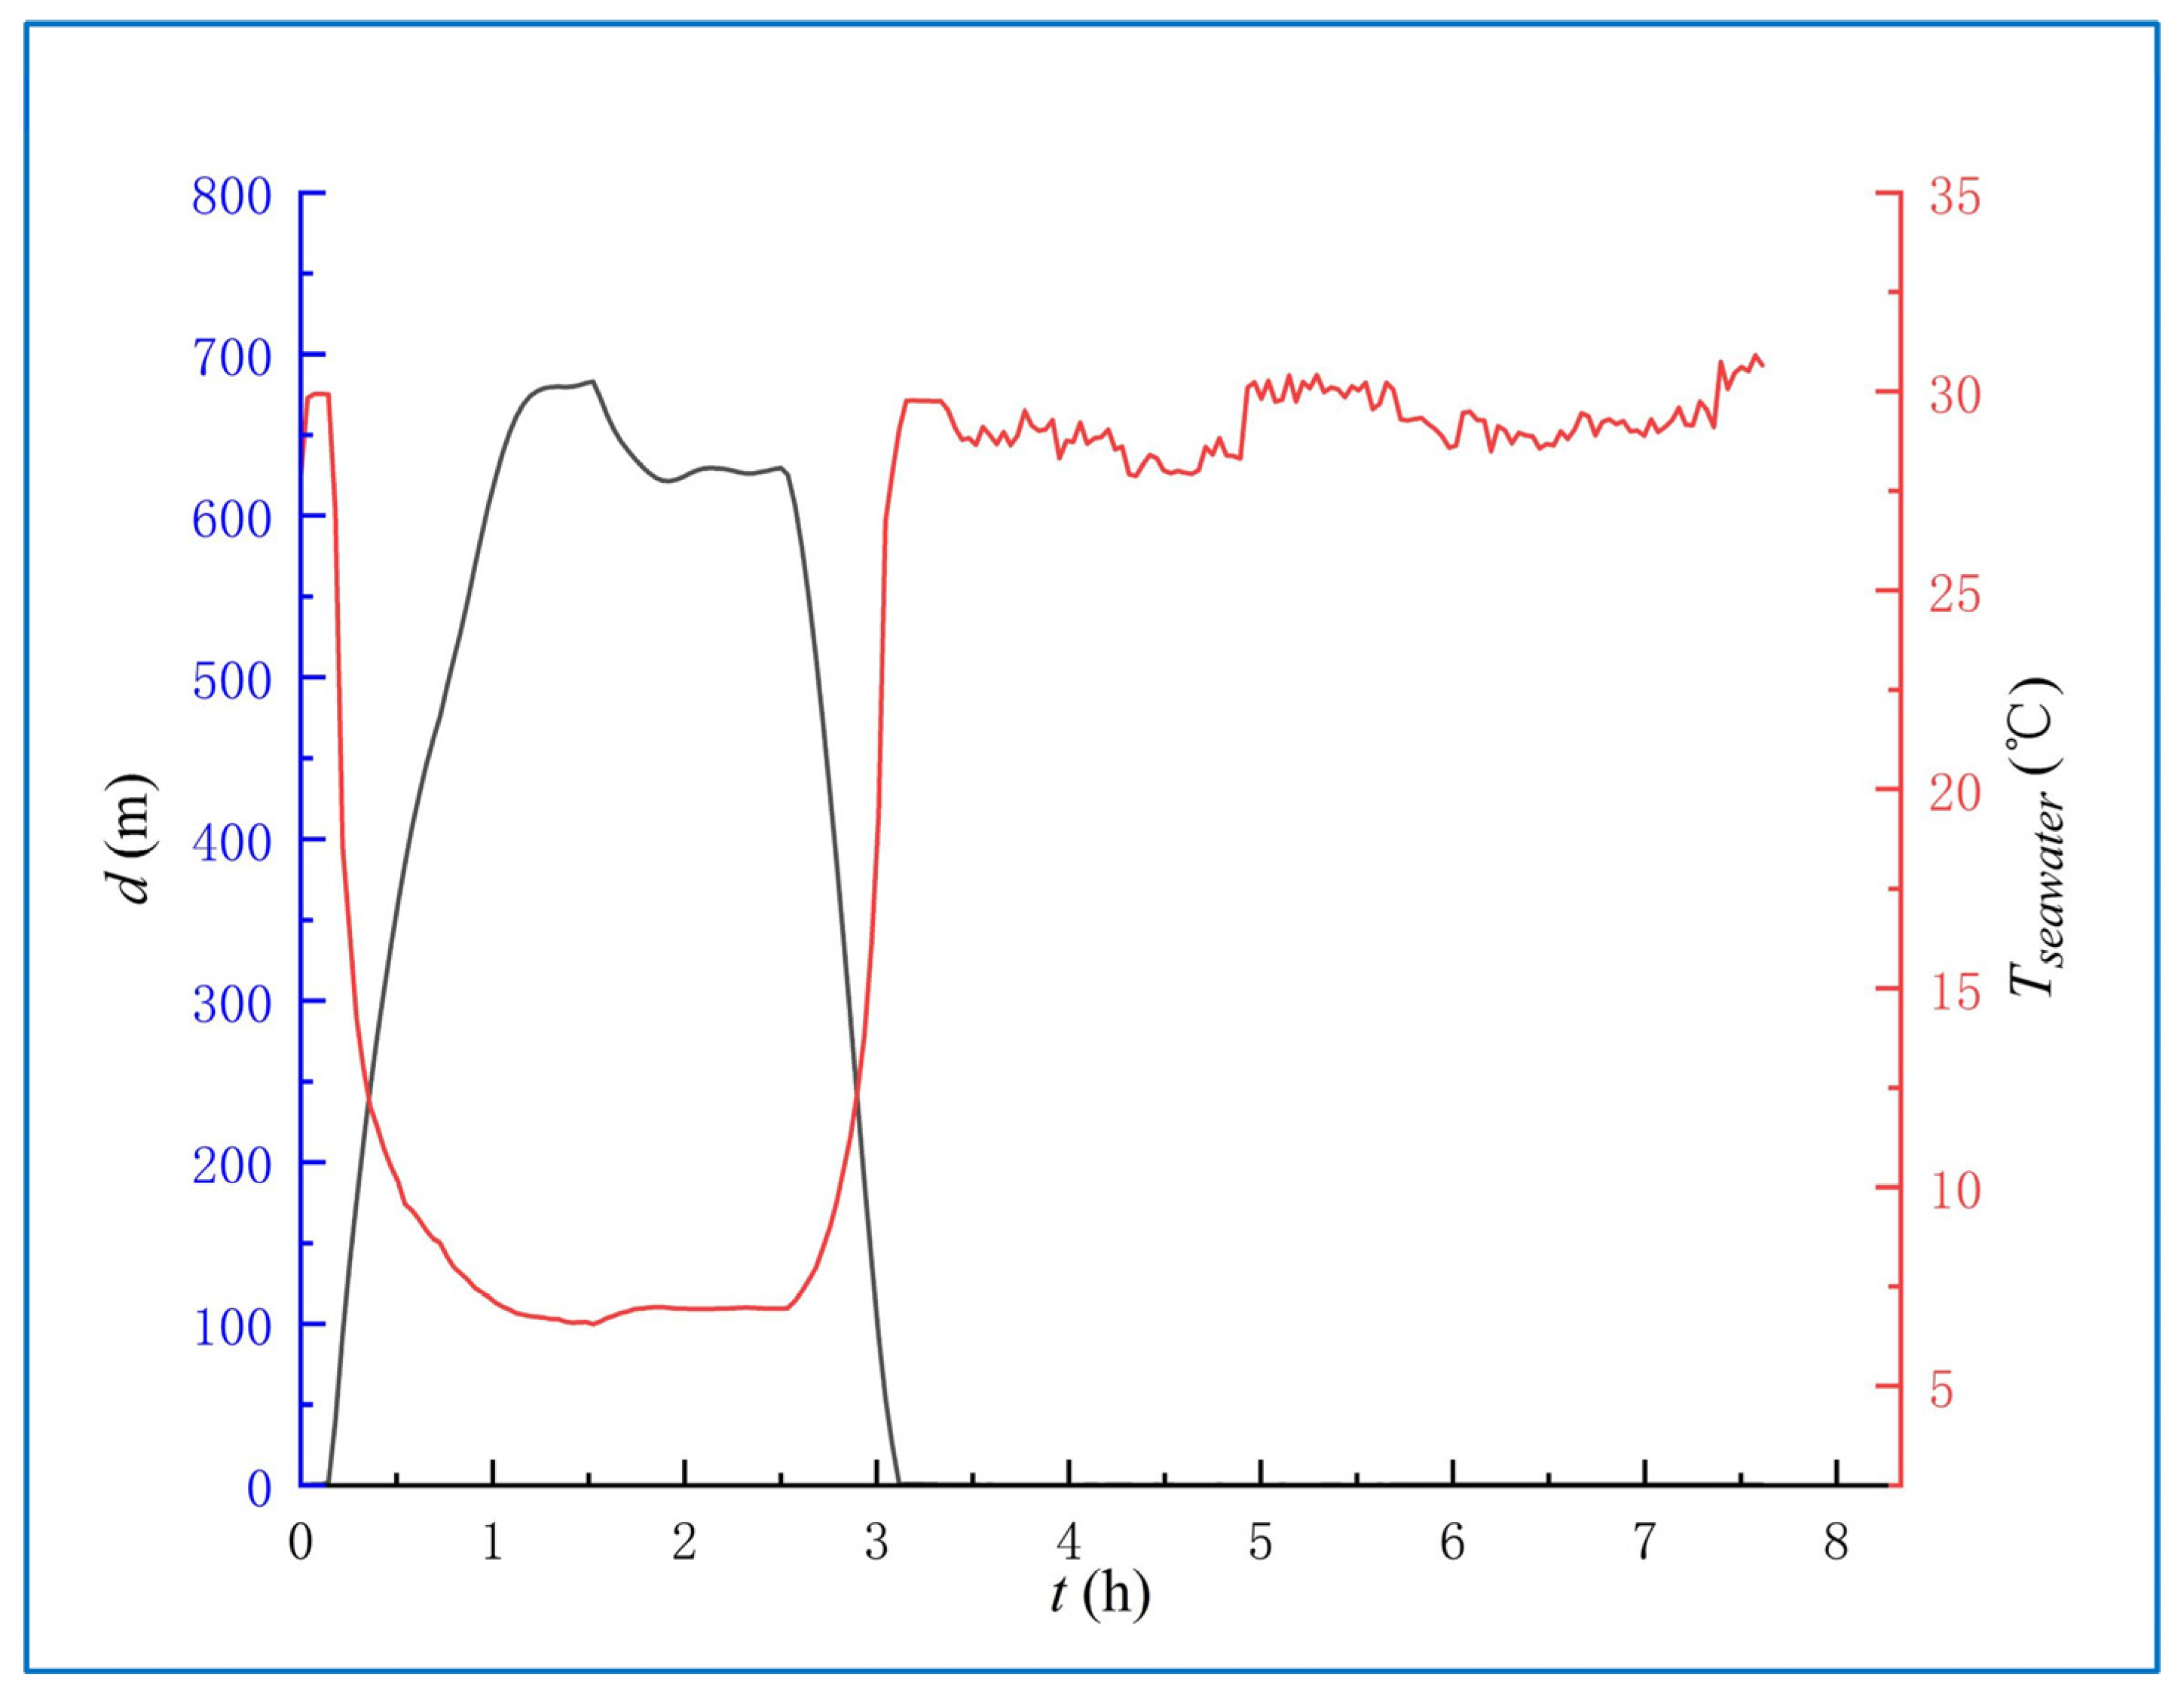
As shown in Figure 11, the Smart Float accomplished six profiles during the test, with a maximum diving depth of 709 m. The temperature data of a profile is measured by the Seabird GPCTD sensor carried by the Smart Float, as shown in Figure 12. The sea surface temperature was about 30.6 °C, and the temperature at 720 m was 6.3 °C, with a temperature difference of 24.3 °C. The water temperature below the depth of 132 m was lower than the melting point of PCM (18 °C). The Smart Float completed a whole profile in 219 min, during which the PCM solidification stage took 128 min.
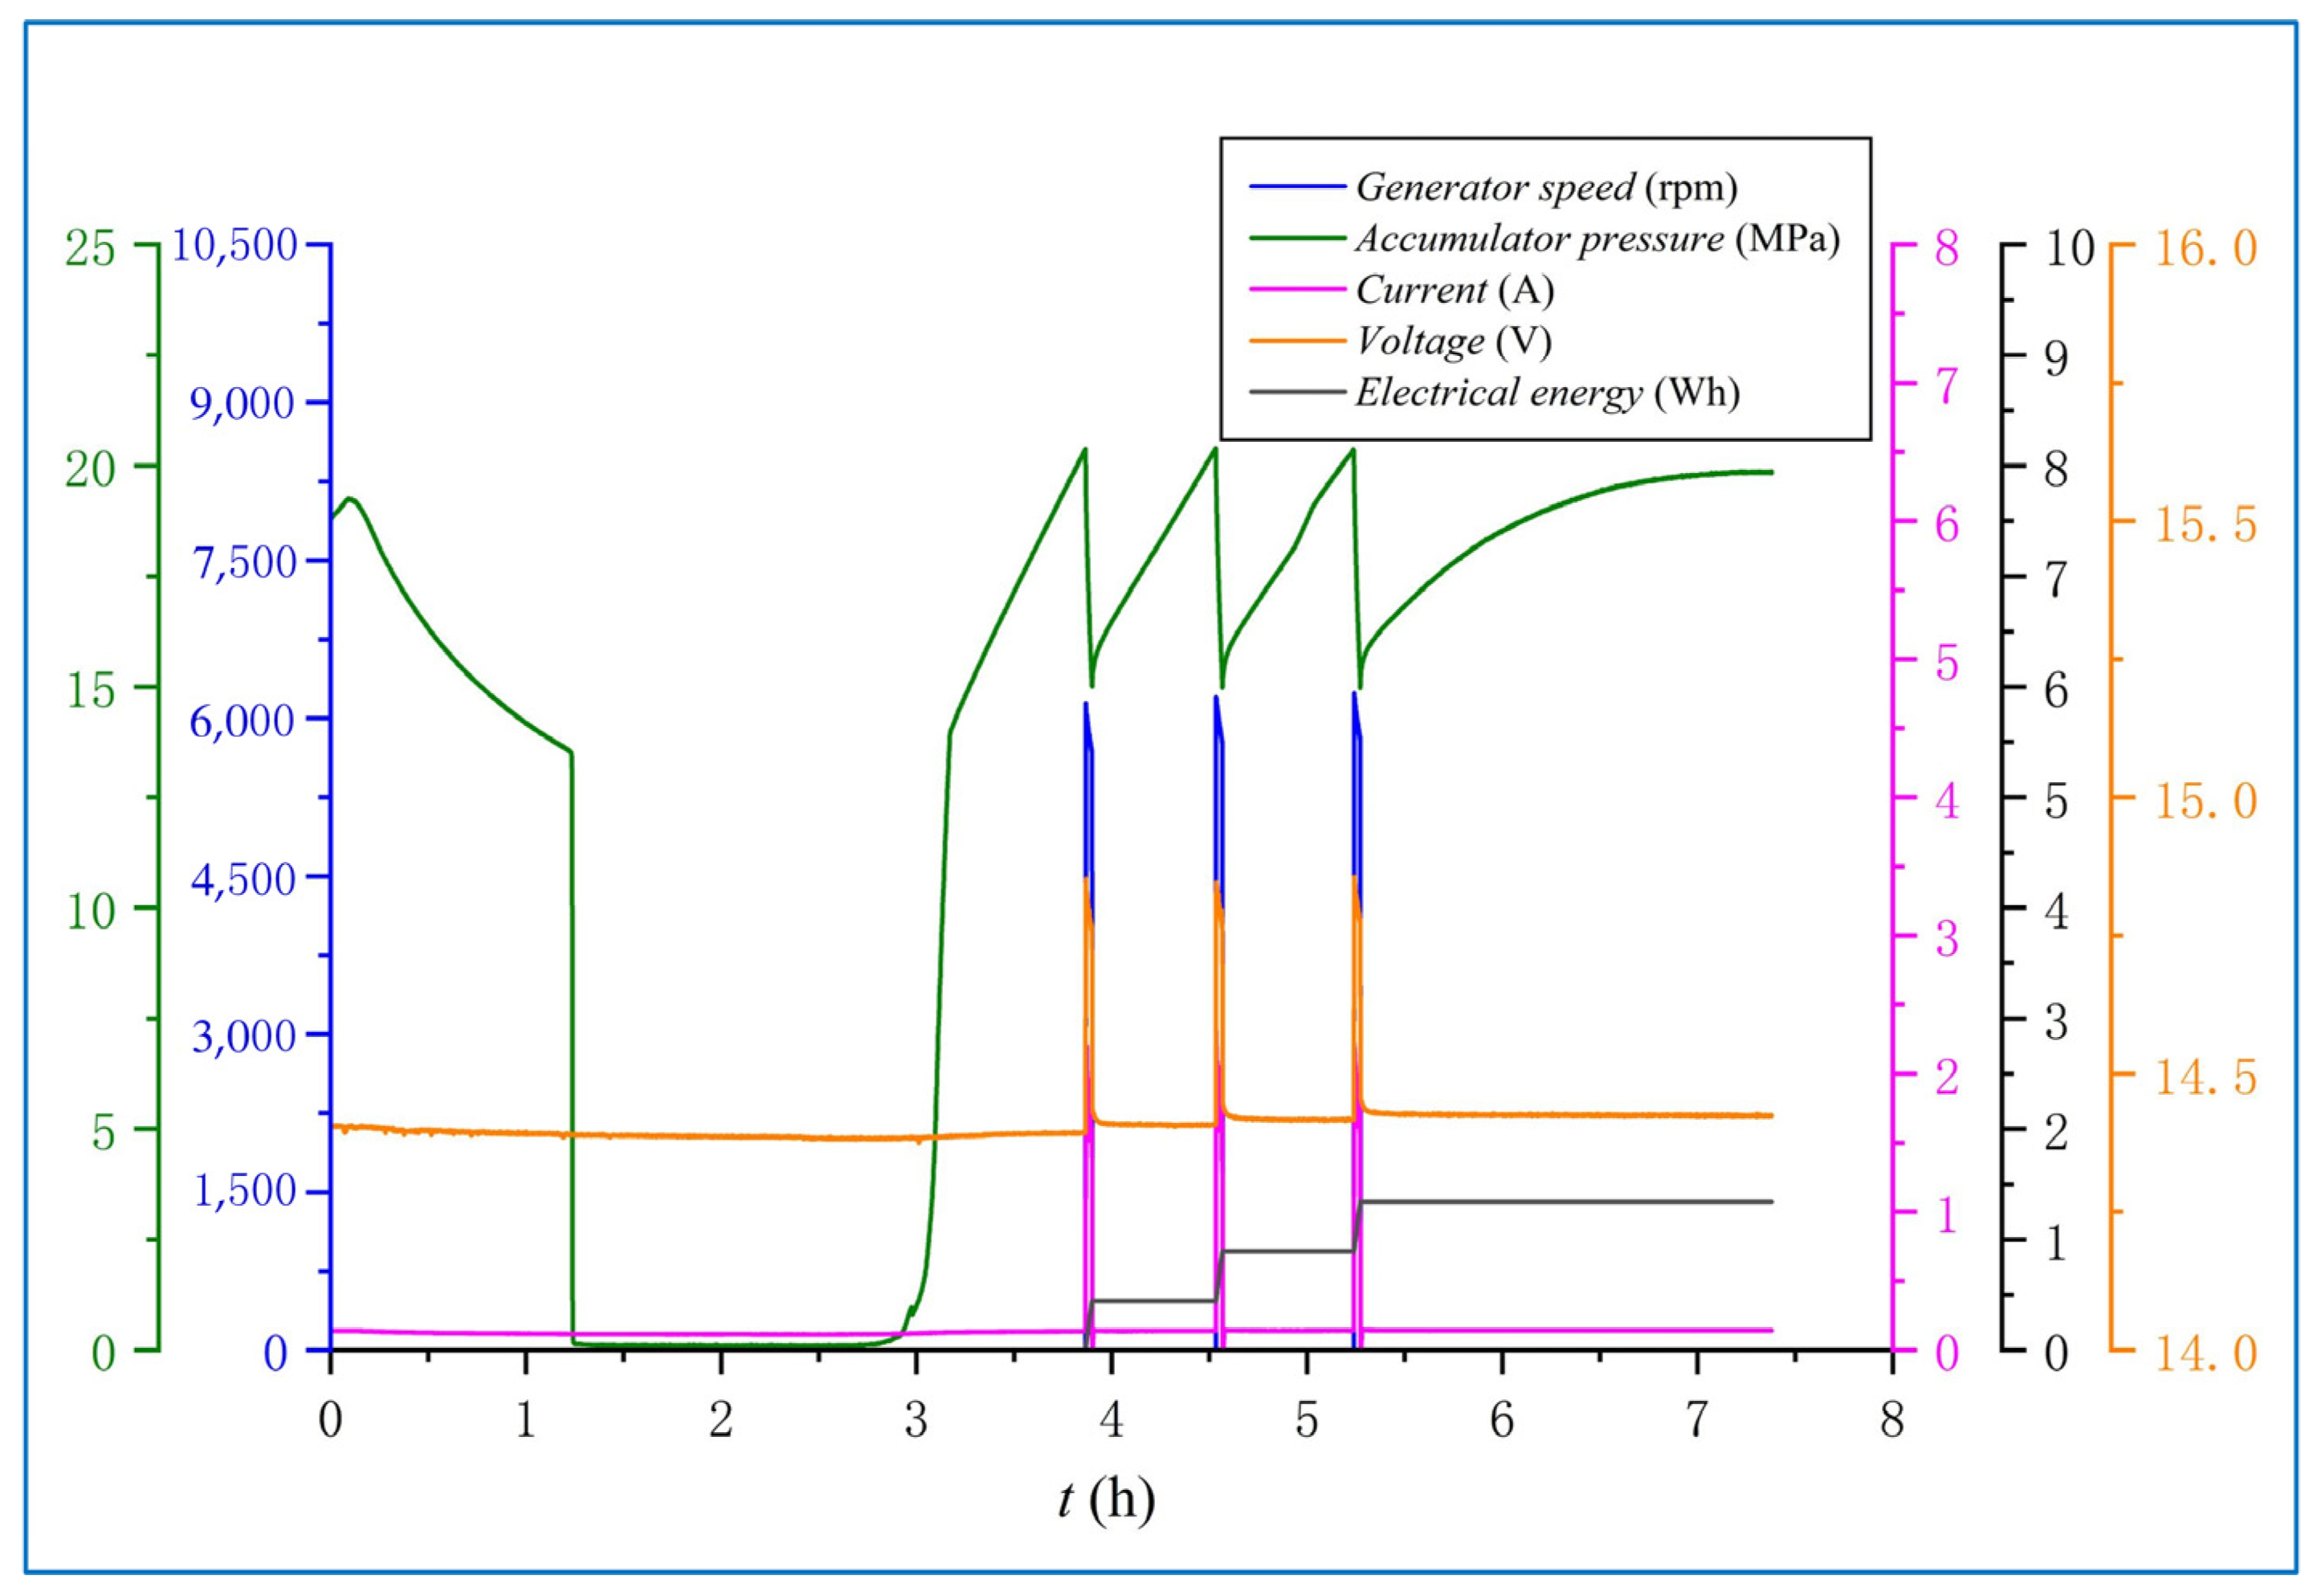
The device performance of the thermal energy power generation module is evaluated with operation data, as shown in Figure 13. In addition, an enlarged view of the power generation stage is shown in Figure 14. Figure 13 shows the pressure of the accumulator (green line) remains 0 MPa during the solidification stage. When the Smart Float ascends to the sea surface, the PCM in the heat exchange tubes melts and expands as the water temperature rises, and the accumulator pressure gradually increases. When the accumulator pressure reaches 20 MPa and drives the generator to operate, the generator speed (blue line) increases from 0 rpm to 6176 rpm, the current (pink line) increases from 0.14 A to 2.31 A, and the voltage (orange line) increases from 14.40 V to 14.86 V. It takes 80 s to complete this power generation cycle, which stops when the accumulator pressure drops to 15 MPa. The energy storage and power generation process are repeated three times when the accumulator pressure fluctuates between 15 MPa and 20 MPa, and this process lasts for 180 s in total.
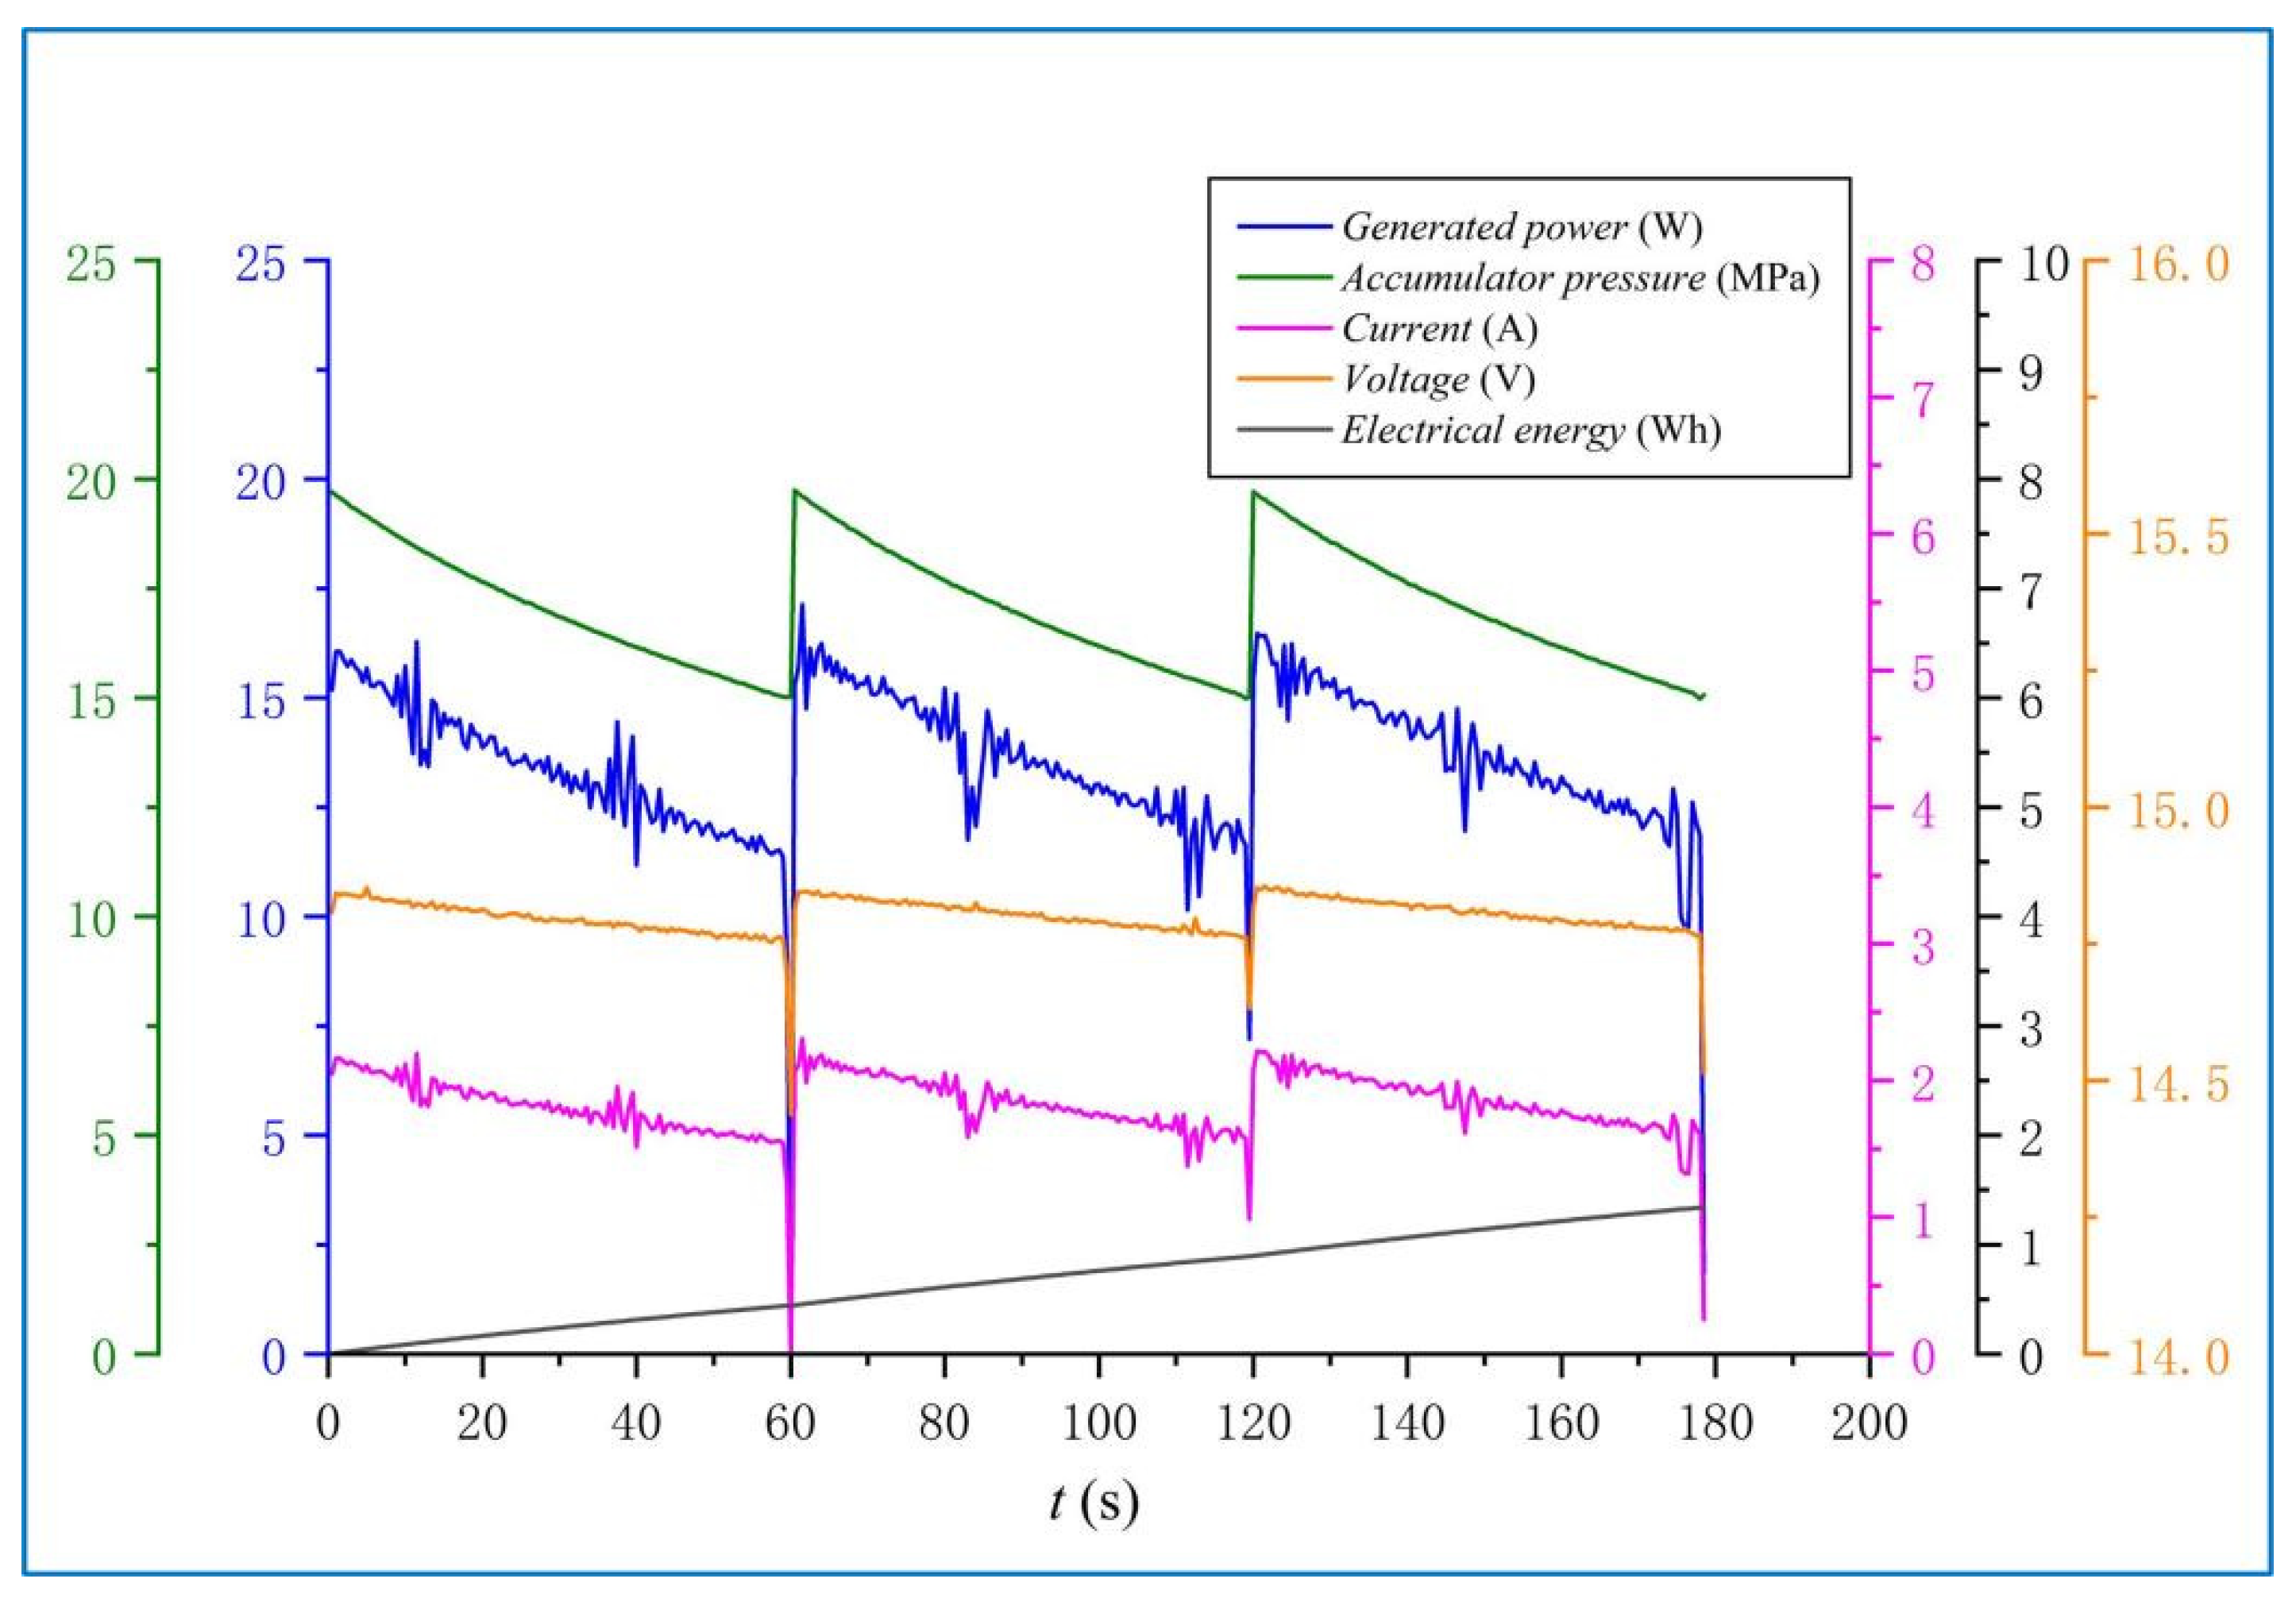
Figure 14 shows the power data in each of the three power generation cycles, which show good consistency. The generated power by each cycle is between 16 W and 10 W, with an average time of about 60 s, which meets the designed requirement. The electrical energy accumulated in this diving profile is 1.341 Wh. This diving profile takes 7.4 h and the average power supply is 182 mW. In addition, the Smart Float is still in the development stage, whose power consumption level needs to be further optimized.
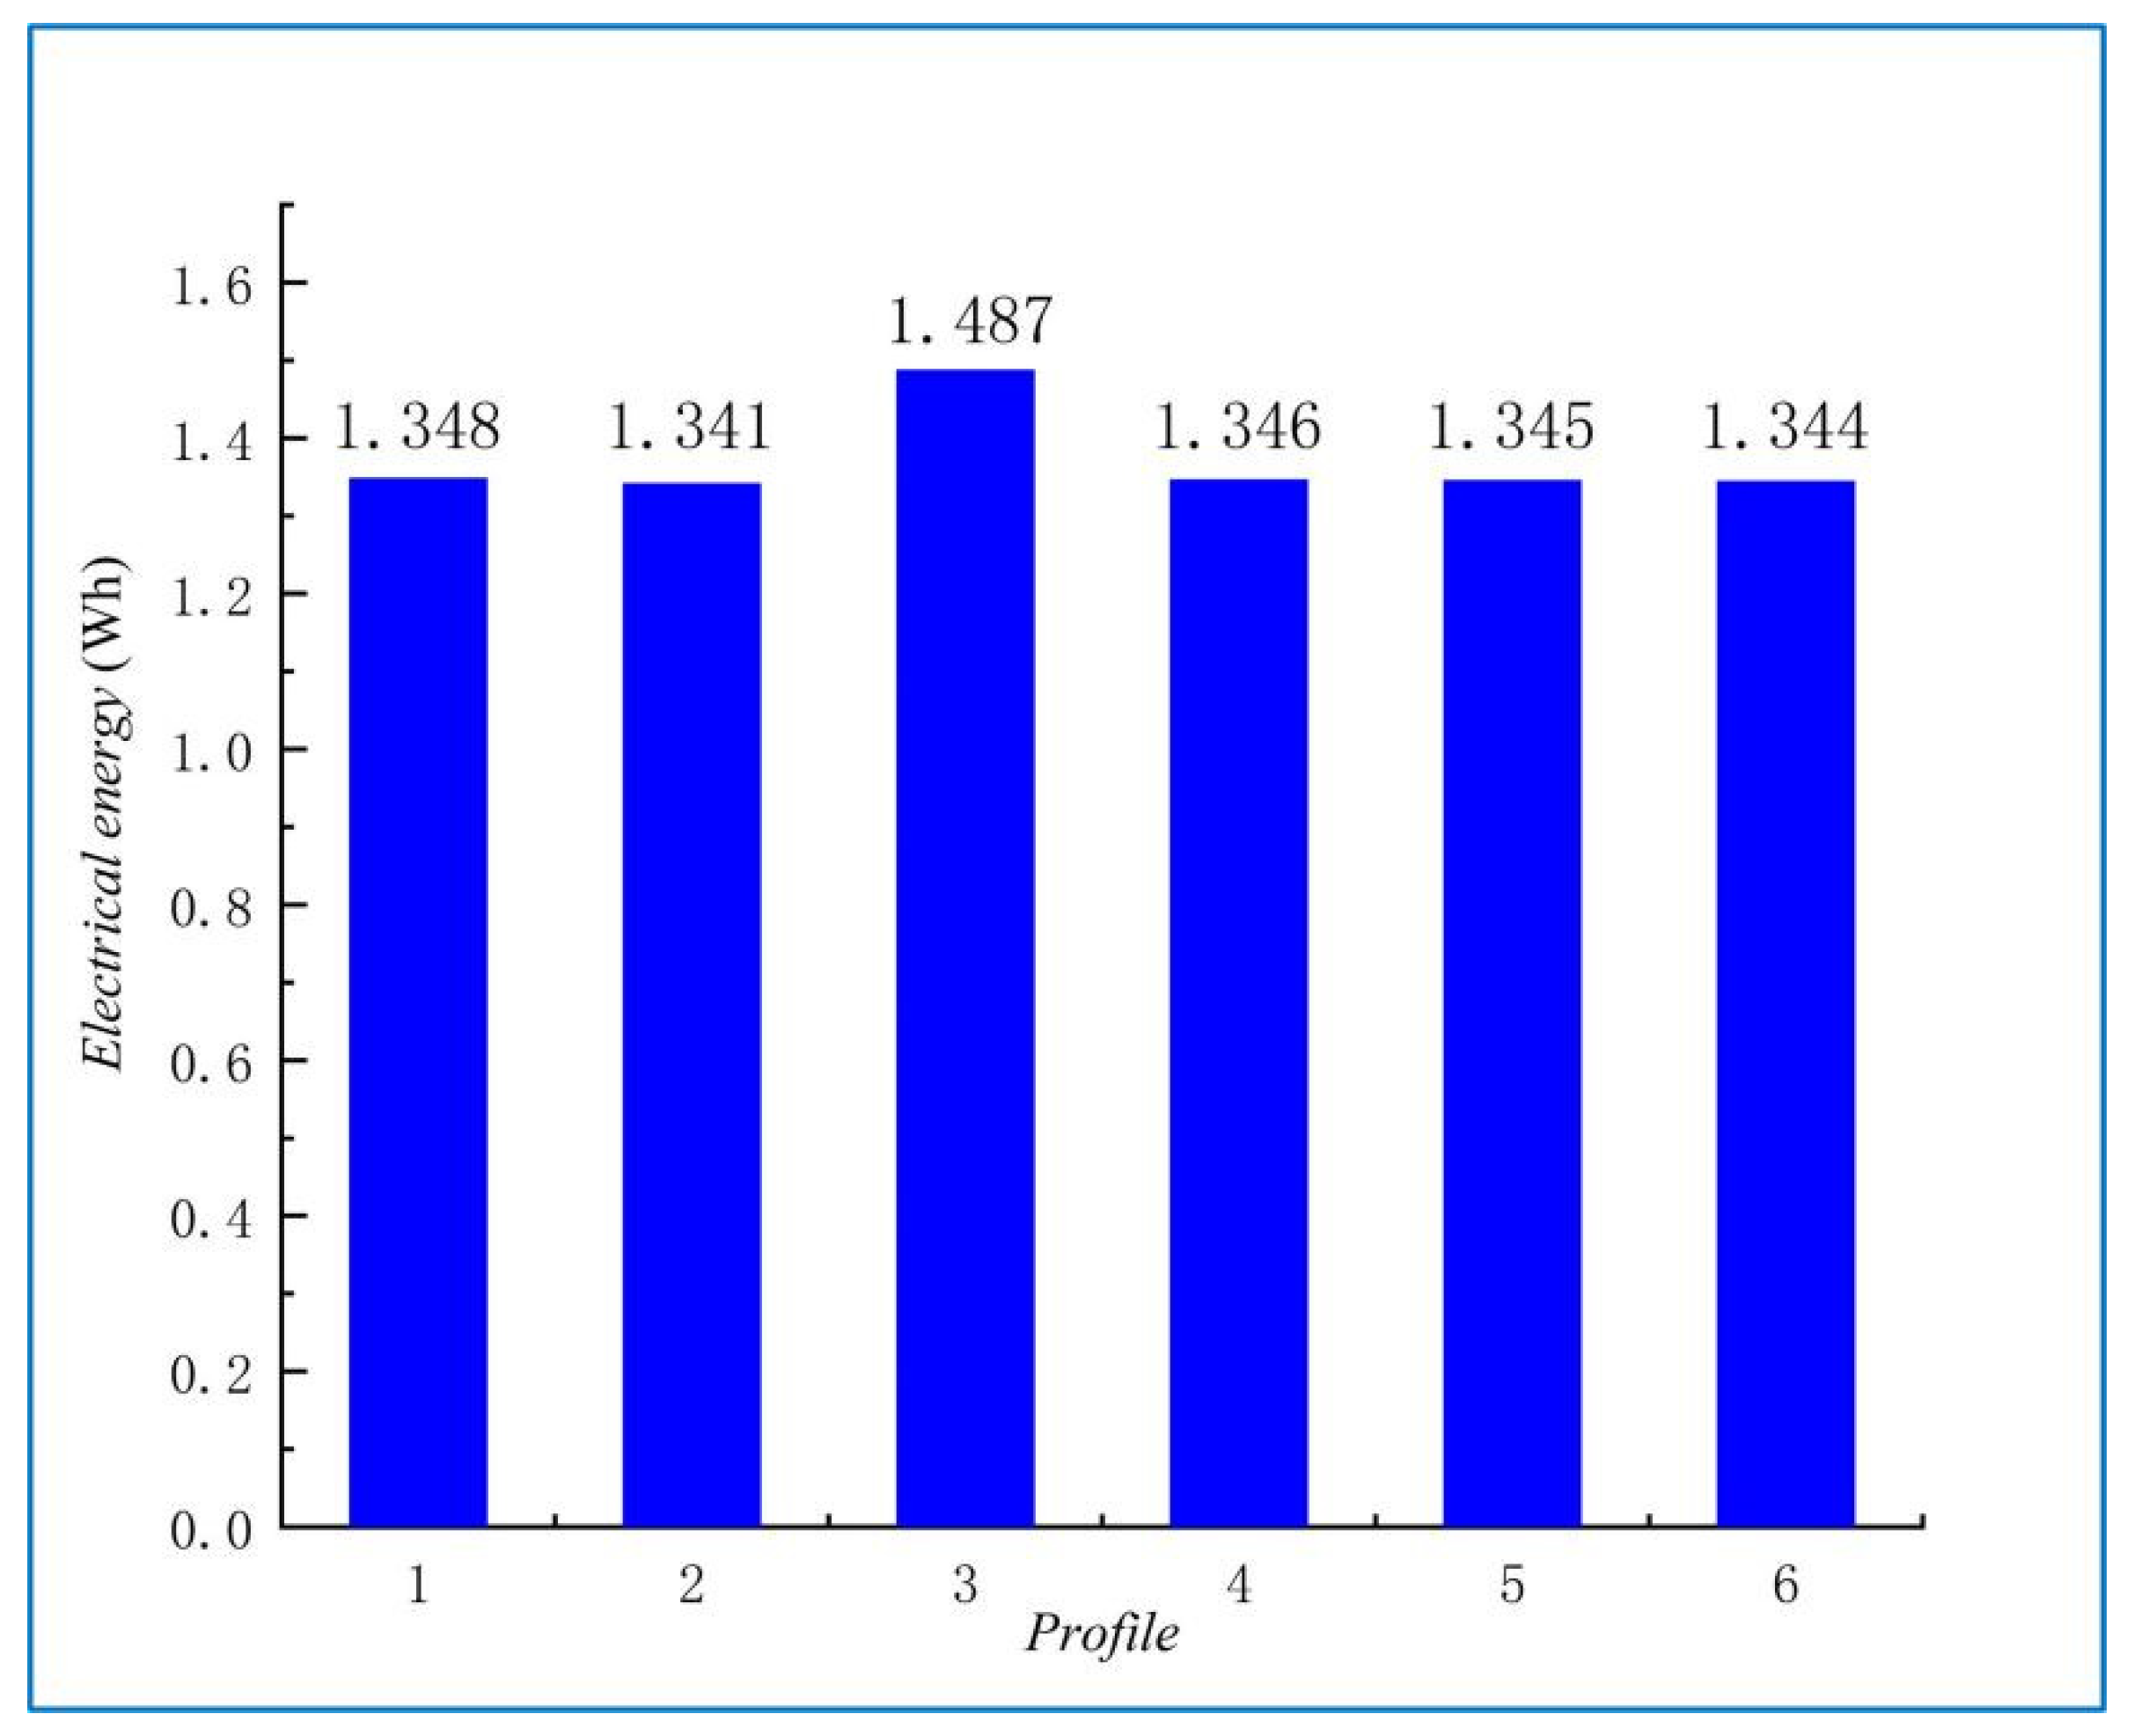
During the test, the Smart Float accomplished six diving profiles, with the maximum single-profile generating 1.487 Wh, the average electrical energy of 1.368 Wh, and the hydraulic-to-electric efficiency of about 60% in the power generation stage, as shown in Figure 15. In conclusion, the thermal energy power generation module carried by Smart Float works stably during the continuous underwater voyage, and the fluctuation of generation capacity in each profile is less than 5%. The performance parameters of the PCM-based electrical energy storage vehicles are shown in Table 2.
5. Conclusions
Tianjin University has successfully developed a modular thermal energy power generation device. A sea trial was performed in the South China Sea in May 2021, which validates the good performance of the designed module. The following conclusions can be drawn.
- The external integrated ocean thermal energy power generation module does not influence the attitude adjustment ability of the Smart Float by analyzing the counterweight characteristic and selecting the optimal installation angle of 75°;
- According to the analysis of the hydrodynamic characteristic, it is more conducive to choose an inclined conical fairing of the ocean thermal energy power generation module for improving the lift-drag ratio of the vehicle, and the underwater navigation economy of the thermal energy power generation device;
- Based on the simulation analysis of the heat transfer characteristic, the complete phase change cycle can be realized at a depth equal to or larger than 700 m;
- The sea trial results show that energy generation of 1.368 Wh can be generated in a single profile, with the hydraulic-to-electric efficiency of about 60% in the power generation stage, which verifies the performance of thermal energy power generation module is integrated into Smart Float under real ocean conditions.
This study has realized the integration of thermal energy power generation modules in an underwater mobile platform for the first time, exploring a new way to improve the endurance and self-sustainability of commercial underwater vehicles. The development of the generation module and its integration in an underwater vehicle make a very promising new step in the development of commercial autonomous long-endurance underwater vehicles.
Author Contributions
Conceptualization, H.Z. and X.M.; methodology, Y.Y.; software, H.Z.; validation, H.Z., X.M. and Y.Y.; formal analysis, X.M.; investigation, Y.Y.; resources, X.M.; data curation, X.M.; writing—original draft preparation, X.M.; writing—review and editing, H.Z., X.M. and Y.Y. All authors have read and agreed to the published version of the manuscript.
Funding
This research was funded by the National Natural Science Foundation of China (Grant Nos. 52006155) and Major consulting project of academy-local cooperation of Chinese Academy of Engineering (Grant Nos. 2021DFZD2).
Institutional Review Board Statement
Not applicable.
Informed Consent Statement
Not applicable.
Data Availability Statement
The data presented in this study are available on request from the corresponding author.
Conflicts of Interest
The authors declare no conflict of interest.
Abbreviations
The following abbreviations are used in this manuscript:
| d | diving depth |
| Pbuoyancy (x, y, z) | center of buoyancy position |
| Pmass (x, y, z) | center of mass position |
| Pbatteryl (x, y, z) | the limit center of mass position when the battery pack is on the left |
| Pbatteryr (x, y, z) | the limit center of mass position when the battery pack is on the right |
| Tseawater | seawater temperature |
| Δh | height difference between center of mass and buoyancy |
| θInst | installation angle |
References
- Feng, S.; Li, F.; Li, S. Introduction to Marine Science; Higher Education Press: Beijing, China, 2010. [Google Scholar]
- Mahan, A.T. Interest of America in Sea Power, Present and Future; Waldo Specthrie Press: New York, NY, USA, 2014. [Google Scholar]
- Wright, D.J. Ocean Solutions, Earth Solutions; Esri Press: New York, NY, USA, 2015. [Google Scholar]
- Cao, J.; Lu, D.; Li, D.; Zeng, Z.; Yao, B.; Lian, L. Smartfloat: A Multimodal Underwater Vehicle Combining Float and Glider Capabilities. IEEE Access 2019, 7, 77825–77838. [Google Scholar] [CrossRef]
- Aintablian, H.; Valdez, T.; Jones, J. A Hydraulic Motor-Alternator System for Ocean-Submersible Vehicles. In Proceedings of the 10th International Energy Conversion Engineering Conference, Atlanta, GA, USA, 30 July–1 August 2012. [Google Scholar]
- Chao, Y. Autonomous Underwater Vehicles and Sensors Powered by Ocean Thermal Energy. In Proceedings of the OCEANS Conference, Shanghai, China, 10–13 April 2016. [Google Scholar]
- D’Arsonval, J.A. Utilization des Forces Naturelles, Avenir de L’electricite. Revenue Sci. 1881, 17, 370–372. [Google Scholar]
- Woods, T.; Rottman, G.; Harder, J.; Lawrence, G.; McClintock, B.; Kopp, G.; Pankratz, C. Overview of the EOS SORCE Mission. In Proceedings of the Conference on Earth Observing Systems V, San Diego, CA, USA, 2–4 August 2000. [Google Scholar]
- Lutgens, F. Essentials of Geology; Pearson Education: London, UK, 2004. [Google Scholar]
- Wang, X.; Li, H.; Gu, L. Economic and environmental benefits of ocean thermal energy conversion. Mar. Sci. 2008, 32, 84–87. [Google Scholar]
- Yi, C. Thermal Recharging Battery for Underwater Instrumentations. In Proceedings of the Ocean Bottom Seismograph (OBS) Workshop, Redondo Beach, CA, USA, 21–22 October 2013. [Google Scholar]
- Esteban, M.; Leary, D. Current developments and future prospects of offshore wind and ocean energy. Appl. Energy 2012, 90, 128–136. [Google Scholar] [CrossRef]
- Tang, R.; Li, X.; Lai, J. A novel optimal energy-management strategy for a maritime hybrid energy system based on large-scale global optimization. Appl. Energy 2018, 228, 254–264. [Google Scholar] [CrossRef]
- Parwal, A.; Fregelius, M.; Temiz, I.; Goteman, M.; de Oliveira, J.G.; Bostrom, C.; Leijon, M. Energy management for a grid-connected wave energy park through a hybrid energy storage system. Appl. Energy 2018, 231, 399–411. [Google Scholar] [CrossRef]
- Webb, D.C.; Simonetti, P.J.; Jones, C.P. SLOCUM: An underwater glider propelled by environmental energy. IEEE J. Ocean. Eng. 2001, 26, 447–452. [Google Scholar] [CrossRef]
- Jones, C.; Webb, D.; Glenn, S.; Schofield, O.; Kerfoot, J.; Kohut, J.; Roarty, H.; Aragon, D.; Haldeman, C.; Haskin, T. Slocum Glider Extending the Endurance. In Proceedings of the 16th International Symposium on Unmanned Untethered Submersible Technology, Durham, NH, USA, 23–26 August 2009. [Google Scholar]
- Jones, C.; Allsup, B.; DeCollibus, C. Slocum Glider Expanding our Understanding of the Oceans. In Proceedings of the Oceans Conference, St. Johns, NL, Canada, 14–19 September 2014. [Google Scholar]
- Zhang, H.; Wang, Y.; Lian, Z. Application and Improvement of the Interlayer Thermal Engine Powered by Ocean Thermal Energy in an Underwater Glider. In Proceedings of the Asia-Pacific Power and Energy Engineering Conference (APPEEC), Wuhan, China, 28–31 March 2009. [Google Scholar]
- Yanhui, W.; Shuxin, W.; Chungang, X.I.E. Dynamic Analysis and System Design on an Underwater Glider Propelled by Temperature Difference Energy. J. Tianjin Univ. 2007, 40, 133–138. [Google Scholar]
- Yang, Y.; Wang, Y.; Ma, Z.; Wang, S. A thermal engine for underwater glider driven by ocean thermal energy. Appl. Therm. Eng. 2016, 99, 455–464. [Google Scholar] [CrossRef]
- Kim, H.; Choi, J.-Y.; Park, J.; Ruda, M.; Prasad, R.; Chao, Y.; Curtin, T.; Choi, S. Towards the optimal operation of a thermal-recharging float in the ocean. Ocean Eng. 2018, 156, 381–395. [Google Scholar] [CrossRef]
- He, Z.; Yang, Y.; Niu, W.; Wang, Y.; Zhang, H.; Liu, Y.; Wu, Z. Component Layout Optimization of Thermal Engine Used by Underwater Gliders. In Proceedings of the MTS/IEEE Oceans Conference, Hampton Roads, VA, USA, 14–19 October 2012. [Google Scholar]
- Li, B.; Yang, Y.; Zhang, L.; Wang, S. Research on sailing range of thermal-electric hybrid propulsion underwater glider and comparative sea trial based on energy consumption. Appl. Ocean Res. 2021, 114, 102807. [Google Scholar] [CrossRef]
- Rasouli, M.; Phee, L.J.S. Energy sources and their development for application in medical devices. Expert Rev. Med. Devices 2010, 7, 693–709. [Google Scholar] [CrossRef] [PubMed]
- Zhao, T.; Jiang, W.; Niu, D.; Liu, H.; Chen, B.; Shi, Y.; Yin, L.; Lu, B. Flexible pyroelectric device for scavenging thermal energy from chemical process and as self-powered temperature monitor. Appl. Energy 2017, 195, 754–760. [Google Scholar] [CrossRef]
- Li, Z.Q.; Wu, Z.Q.; Ding, X.L.; Wu, M.Y.; Xia, X.H. A Solar-Thermoelectric Nanofluidic Device for Solar-Thermal Energy Harvesting. CCS Chem. 2020, 3, 2174–2182. [Google Scholar] [CrossRef]
- Lim, C.Y.; Lim, A.E.; Lam, Y.C. pH Change in Electroosmotic Flow Hysteresis. Anal. Chem. 2017, 89, 9394–9399. [Google Scholar] [CrossRef] [PubMed]
- Lim, A.E.; Lam, Y.C. Vertical Squeezing Route Taylor Flow with Angled Microchannel Junctions. Ind. Eng. Chem. Res. 2021, 60, 14307–14317. [Google Scholar] [CrossRef]
- Liu, K.; Sun, J.; Wen, G. Analysis of the influence of torpedo counterweight characteristics on initial ballistics. J. Nav. Eng. Univ. 2009, 21, 4. [Google Scholar]
- Zhang, H.; Liu, C.; Yang, Y.; Wang, S. Ocean thermal energy utilization process in underwater vehicles: Modelling, temperature boundary analysis, and sea trail. Int. J. Energy Res. 2020, 44, 2966–2983. [Google Scholar] [CrossRef]
- Kong, Q.; Ma, J.; Xia, D. Numerical and experimental study of the phase change process for underwater glider propelled by ocean thermal energy. Renew. Energy 2010, 35, 771–779. [Google Scholar] [CrossRef]
- Haldeman, C.D.; Schofield, O.; Webb, D.C.; Valdez, T.I.; Jones, J.A. Implementation of Energy Harvesting System for Powering Thermal Gliders for Long Duration Ocean Research. In Proceedings of the OCEANS 2015—MTS/IEEE, Washington, DC, USA, 19–22 October 2015. [Google Scholar]
Figure 1.
Structure and main parameters of the thermal energy power generation module. The module mainly includes a thermal energy conversion device and PCM heat exchange tube. Schematics of the thermal conversion device: (1) end cover, (2) leather bag, (3) speed increaser, (4) solenoid valve, (5) stiffening ring, (6) accumulator, (7) battery pack, (8) generator, (9) hydraulic motor, and (10) circuit board.

Figure 2.
The working principle of the components.

Figure 3.
Six installation angles of the thermal energy power generation module.

Figure 4.
Three types of fairings for the thermal energy power generation module (a) flat fairing; (b) conical fairing; (c) inclined conical fairing.
Figure 4.
Three types of fairings for the thermal energy power generation module (a) flat fairing; (b) conical fairing; (c) inclined conical fairing.

Figure 5.
The pressure distribution on the surface and the symmetry planes of the three models are (a) flat fairing; (b) conical fairing; (c) inclined conical fairing.
Figure 5.
The pressure distribution on the surface and the symmetry planes of the three models are (a) flat fairing; (b) conical fairing; (c) inclined conical fairing.

Figure 6.
The cross-sectional flow velocity distribution of the thermal energy conversion device and the heat exchange tubes (a) The flow velocity of the thermal energy conversion device with a flat fairing; (b) The flow velocity of heat exchange tubes with a flat fairing; (c) The flow velocity of the thermal energy conversion device with a conical fairing; (d) The flow velocity of the central section of the heat exchange tubes with a conical fairing; (e) The flow velocity of the thermal energy conversion device with an inclined conical fairing; (f) The flow velocity of the central section of the heat exchange tubes with an inclined conical fairing.

Figure 7.
The lift-resistance ratio and angle of attack of the vehicle with different fairings of the thermal energy power generation module under different speed conditions (a) vm = 0.1 m/s; (b) vm = 0.2 m/s; (c) vm = 0.3 m/s; (d) vm = 0.4 m/s.
Figure 7.
The lift-resistance ratio and angle of attack of the vehicle with different fairings of the thermal energy power generation module under different speed conditions (a) vm = 0.1 m/s; (b) vm = 0.2 m/s; (c) vm = 0.3 m/s; (d) vm = 0.4 m/s.

Figure 8.
Variation of seawater temperature with depth at different positions.

Figure 9.
The variation of PCM volume with diving depth at different positions. (a) At the diving depth of 1000 m; (b) At the diving depth of 700 m; (c) At the diving depth of 400 m.
Figure 9.
The variation of PCM volume with diving depth at different positions. (a) At the diving depth of 1000 m; (b) At the diving depth of 700 m; (c) At the diving depth of 400 m.

Figure 10.
The prototype of Smart Float was tested in the sea trial.

Figure 11.
The trajectory of the thermal energy power generation module in sea trial.

Figure 12.
The depth and temperature curves in the sea trial.

Figure 13.
Power generation performance of thermal energy power generation module during the sea trial.
Figure 13.
Power generation performance of thermal energy power generation module during the sea trial.

Figure 14.
The power data in each of the three power generation cycles.

Figure 15.
The power generation in the six profiles during the sea trial.


Table 1.
Between center of mass and buoyancy of the integrated vehicle at different installation angles.
Table 1.
Between center of mass and buoyancy of the integrated vehicle at different installation angles.
| θInst/° | Pbuoyancy (x, y, z) | Pmass (x, y, z) | Δh/mm | Pbatteryl (x, y, z) | Pbatteryr (x, y, z) |
|---|---|---|---|---|---|
| Not integrated | x = 1180 | x = 1179.945 | 3.000 | x = 1168.068 | x = 1192.742 |
| y = 0 | y = 0 | y = 0 | y = 0 | ||
| z = 0 | z = −3 | z = −3 | z = −3 | ||
| 45 | x = 1172.420 | x = 1180.047 | 5.088 | x = 1170.568 | x = 1190.255 |
| y = 0.012 | y = 0.203 | y = 0.203 | y = 0.203 | ||
| z = −36.569 | z = −41.657 | z = −41.657 | z = −41.657 | ||
| 60 | x = 1172.420 | x = 1180.047 | 3.865 | x = 1170.568 | x = 1190.255 |
| y = 0.011 | y = 0.201 | y = 0.201 | y = 0.201 | ||
| z = −34.342 | z = −38.207 | z = −38.207 | z = −38.207 | ||
| 75 | x = 1172.420 | x = 1180.047 | 2.442 | x = 1170.567 | x = 1190.255 |
| y = 0.010 | y = 0.200 | y = 0.200 | y = 0.200 | ||
| z = −31.748 | z = −34.190 | z = −34.190 | z = −34.190 | ||
| 90 | x = 1172.420 | x = 1180.047 | 0.914 | x = 1170.568 | x = 1190.255 |
| y = 0.010 | y = 0.199 | y = 0.199 | y = 0.199 | ||
| z = −28.965 | z = −29.879 | z = −29.879 | z = −29.879 | ||
| 135 | x = 1172.420 | x = 1180.047 | −3.261 | x = 1170.568 | x = 1190.255 |
| y = 0.007 | y = 0.195 | y = 0.195 | y = 0.195 | ||
| z = −21.362 | z = −18.101 | z = −18.101 | z = −18.101 | ||
| 150 | x = 1172.420 | x = 1180.047 | −4.199 | x = 1170.568 | x = 1190.255 |
| y = 0.006 | y = 0.194 | y = 0.194 | y = 0.194 | ||
| z = −18.653 | z = −15.454 | z = −15.454 | z = −15.454 |
Table 2.
The performance parameters of the PCM-based electrical energy storage vehicles.
| Performance Parameters | Tianjin University | SOLO-TREC [21] | Slocum Thermal Glider [32] |
|---|---|---|---|
| Single profile power generation | 1.34 Wh | 1 Wh | 1.8 Wh |
| Phase change material volume | 950 mL | 1300 mL | / |
| Phase change material quality | 7 kg | 10 kg | 10 kg (Includes buoyancy driving) |
| Dive depth | 700 m | 500 m | 1200 m |
Publisher’s Note: MDPI stays neutral with regard to jurisdictional claims in published maps and institutional affiliations. |
© 2022 by the authors. Licensee MDPI, Basel, Switzerland. This article is an open access article distributed under the terms and conditions of the Creative Commons Attribution (CC BY) license (https://creativecommons.org/licenses/by/4.0/).
Share and Cite
MDPI and ACS Style
Zhang, H.; Ma, X.; Yang, Y. An External Ocean Thermal Energy Power Generation Modular Device for Powering Smart Float. Energies 2022, 15, 3747. https://0-doi-org.brum.beds.ac.uk/10.3390/en15103747
AMA Style
Zhang H, Ma X, Yang Y. An External Ocean Thermal Energy Power Generation Modular Device for Powering Smart Float. Energies. 2022; 15(10):3747. https://0-doi-org.brum.beds.ac.uk/10.3390/en15103747
Chicago/Turabian StyleZhang, Hongwei, Xinghai Ma, and Yanan Yang. 2022. "An External Ocean Thermal Energy Power Generation Modular Device for Powering Smart Float" Energies 15, no. 10: 3747. https://0-doi-org.brum.beds.ac.uk/10.3390/en15103747
Note that from the first issue of 2016, this journal uses article numbers instead of page numbers. See further details here.