
A Review on Solar Energy Utilization and Projects: Development in and around the UAE


1
Mechanical and Aerospace Engineering Department, College of Engineering, United Arab Emirates University, Al Ain P.O. Box 15551, United Arab Emirates
2
National Water and Energy Center, United Arab Emirates University, Al Ain P.O. Box 15551, United Arab Emirates
3
Mechanical Design Department, Faculty of Engineering, Helwan University, Cairo 11795, Egypt
4
Department of Physics, College of Science, United Arab Emirates University, Al Ain P.O. Box 15551, United Arab Emirates
*
Author to whom correspondence should be addressed.
Energies 2022, 15(10), 3754; https://0-doi-org.brum.beds.ac.uk/10.3390/en15103754
Submission received: 29 March 2022
/
Revised: 21 April 2022
/
Accepted: 22 April 2022
/
Published: 19 May 2022
(This article belongs to the Section A2: Solar Energy and Photovoltaic Systems)
Abstract
:Demand on the energy sector has increased significantly due to the incredible evolution of the industry and urbanization. Photovoltaic (PV) technology is rapidly evolving to meet the demands of people in the United Arab Emirates (UAE) by generating more electricity. The UAE has demonstrated that it has the world’s highest rates of sun exposure, indicating a significant efficiency in solar energy development. This might be a way to cut down on fossil fuel consumption and greenhouse gas emissions even further. In this review, we discuss five major aspects of solar energy utilization and projects within the framework of the UAE starting with (i) recent advances in solar scenario and development trends, (ii) electricity production, consumption, and tariffs, (iii) focus on various key aspects of photovoltaic solar installation projects inside the Dubai, Abu Dhabi emirates and other smaller projects in the UAE, (iv) different solar projects outside the UAE, and (v) the solar energy industry, including trading, assembly, manufacturing, installation, and other activities in the UAE. The review finishes with a summary of problems, current developments, and future outlooks.
1. Introduction
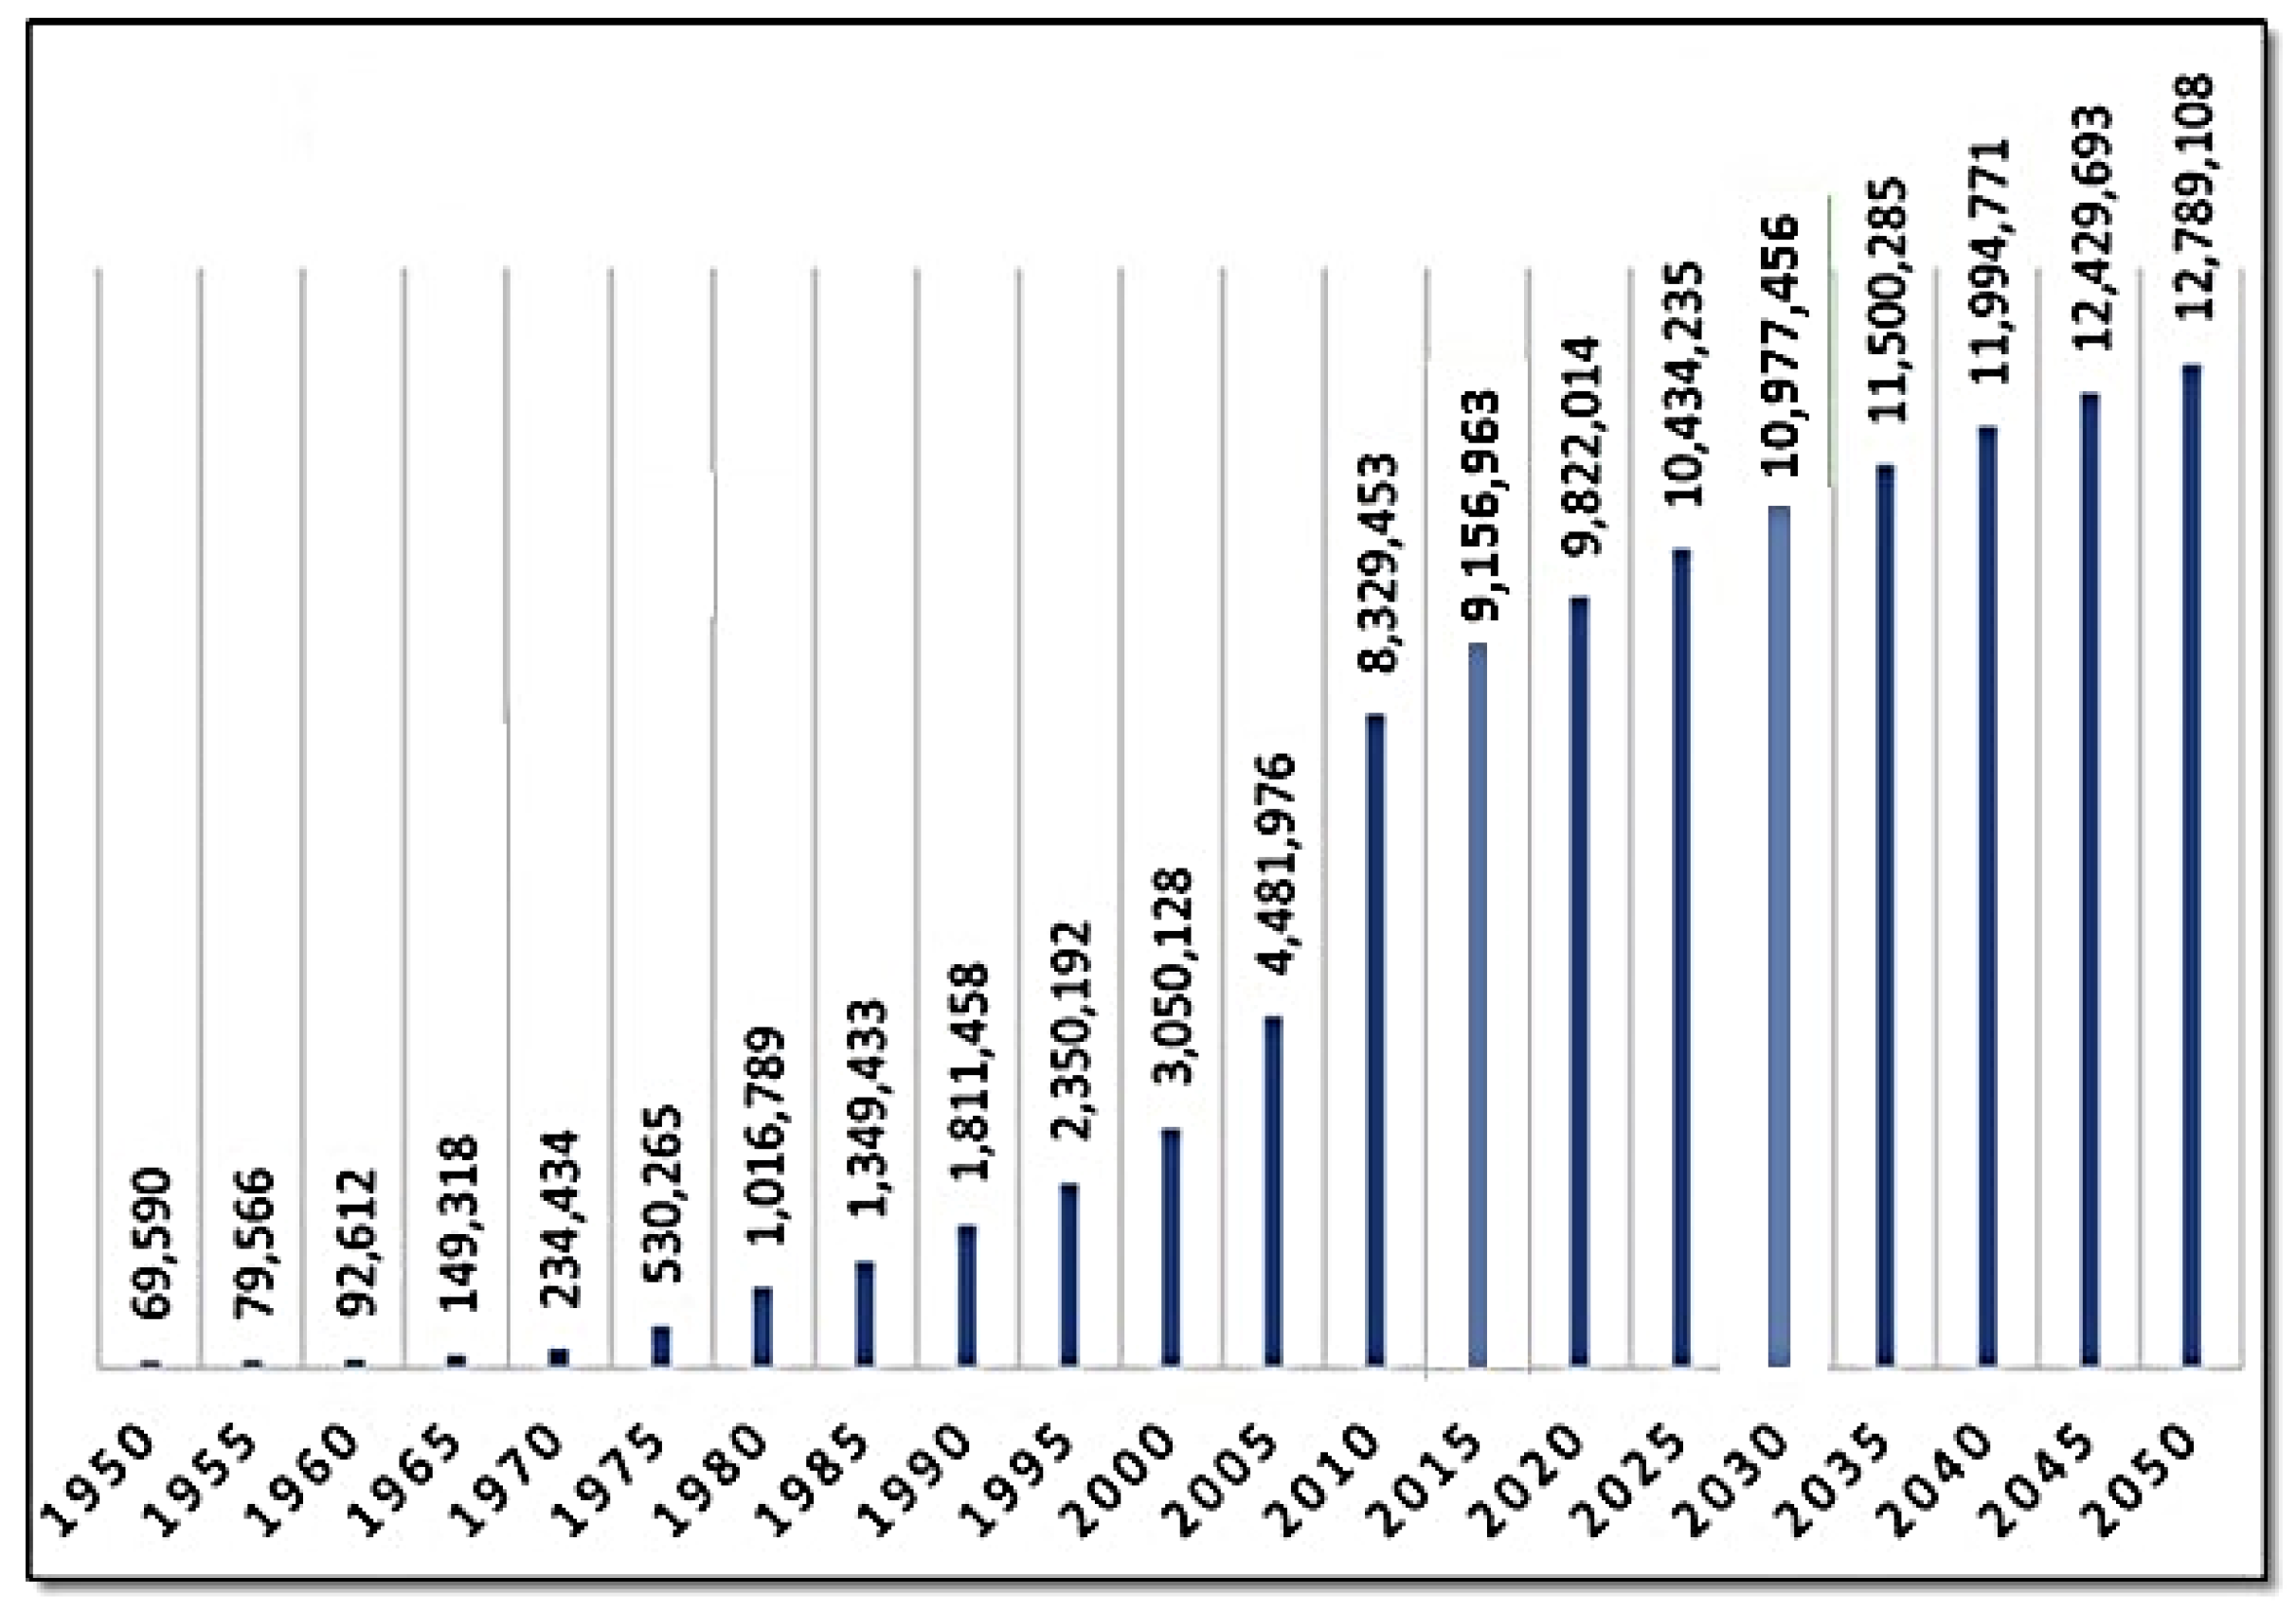
In the UAE, demand on the energy sector has increased significantly because of the incredible evolution in the industry and population growth [1,2]. Figure 1 depicts the progressive rise in the population of the UAE. As a result, energy consumption in the UAE is rapidly expanding to satisfy the needs of a growing population [3]. One of the most pressing concerns of the twenty-first century is averting an energy catastrophe. Consideration of energy sources is so vital because they play a crucial role in addressing the demands of the world and the people of the UAE [4]. The UAE is composed of seven emirates: Dubai, Abu Dhabi, Fujairah, Ajman, Ras Al Khaimah, Umm Al Quwain, and Sharjah. Each emirate has its own set of goals, plans, controls, and regulations in place to help develop itself in the UAE. Accessible energy is insufficient for people for a variety of reasons, including a country’s developmental profile, people’s economic position, and the nature of the country’s technical developments. Renewable energy resources, which rely on natural resources to offer an unending supply of sustainable and non-polluting energy, are a feasible alternative to conventional energy resources, which have grown in prominence in recent centuries as a means of alleviating energy shortages [5,6,7,8,9]. Solar energy may be the greatest alternative for the future globe for several reasons. First, solar energy is the most abundant, inexhaustible, and ecologically beneficial renewable energy source accessible today. Second, the power intercepted by the earth from the sun is around 1.8 × 10¹¹ MW, which is several orders of magnitude greater than the current rate of total energy use [10]. Third, it has received the most attention in a wide range of engineering and industrial applications, including electricity generation [11], solar refrigeration [12], water desalination [13], domestic space heating [14,15,16], and solar chimneys [17]. The dispersion and intensity of solar radiation are two critical elements in determining the efficiency of the solar PV sector. These two criteria vary greatly between countries. Furthermore, solar energy gadgets can help develop a country’s economy and contribute to a sustainable environment.
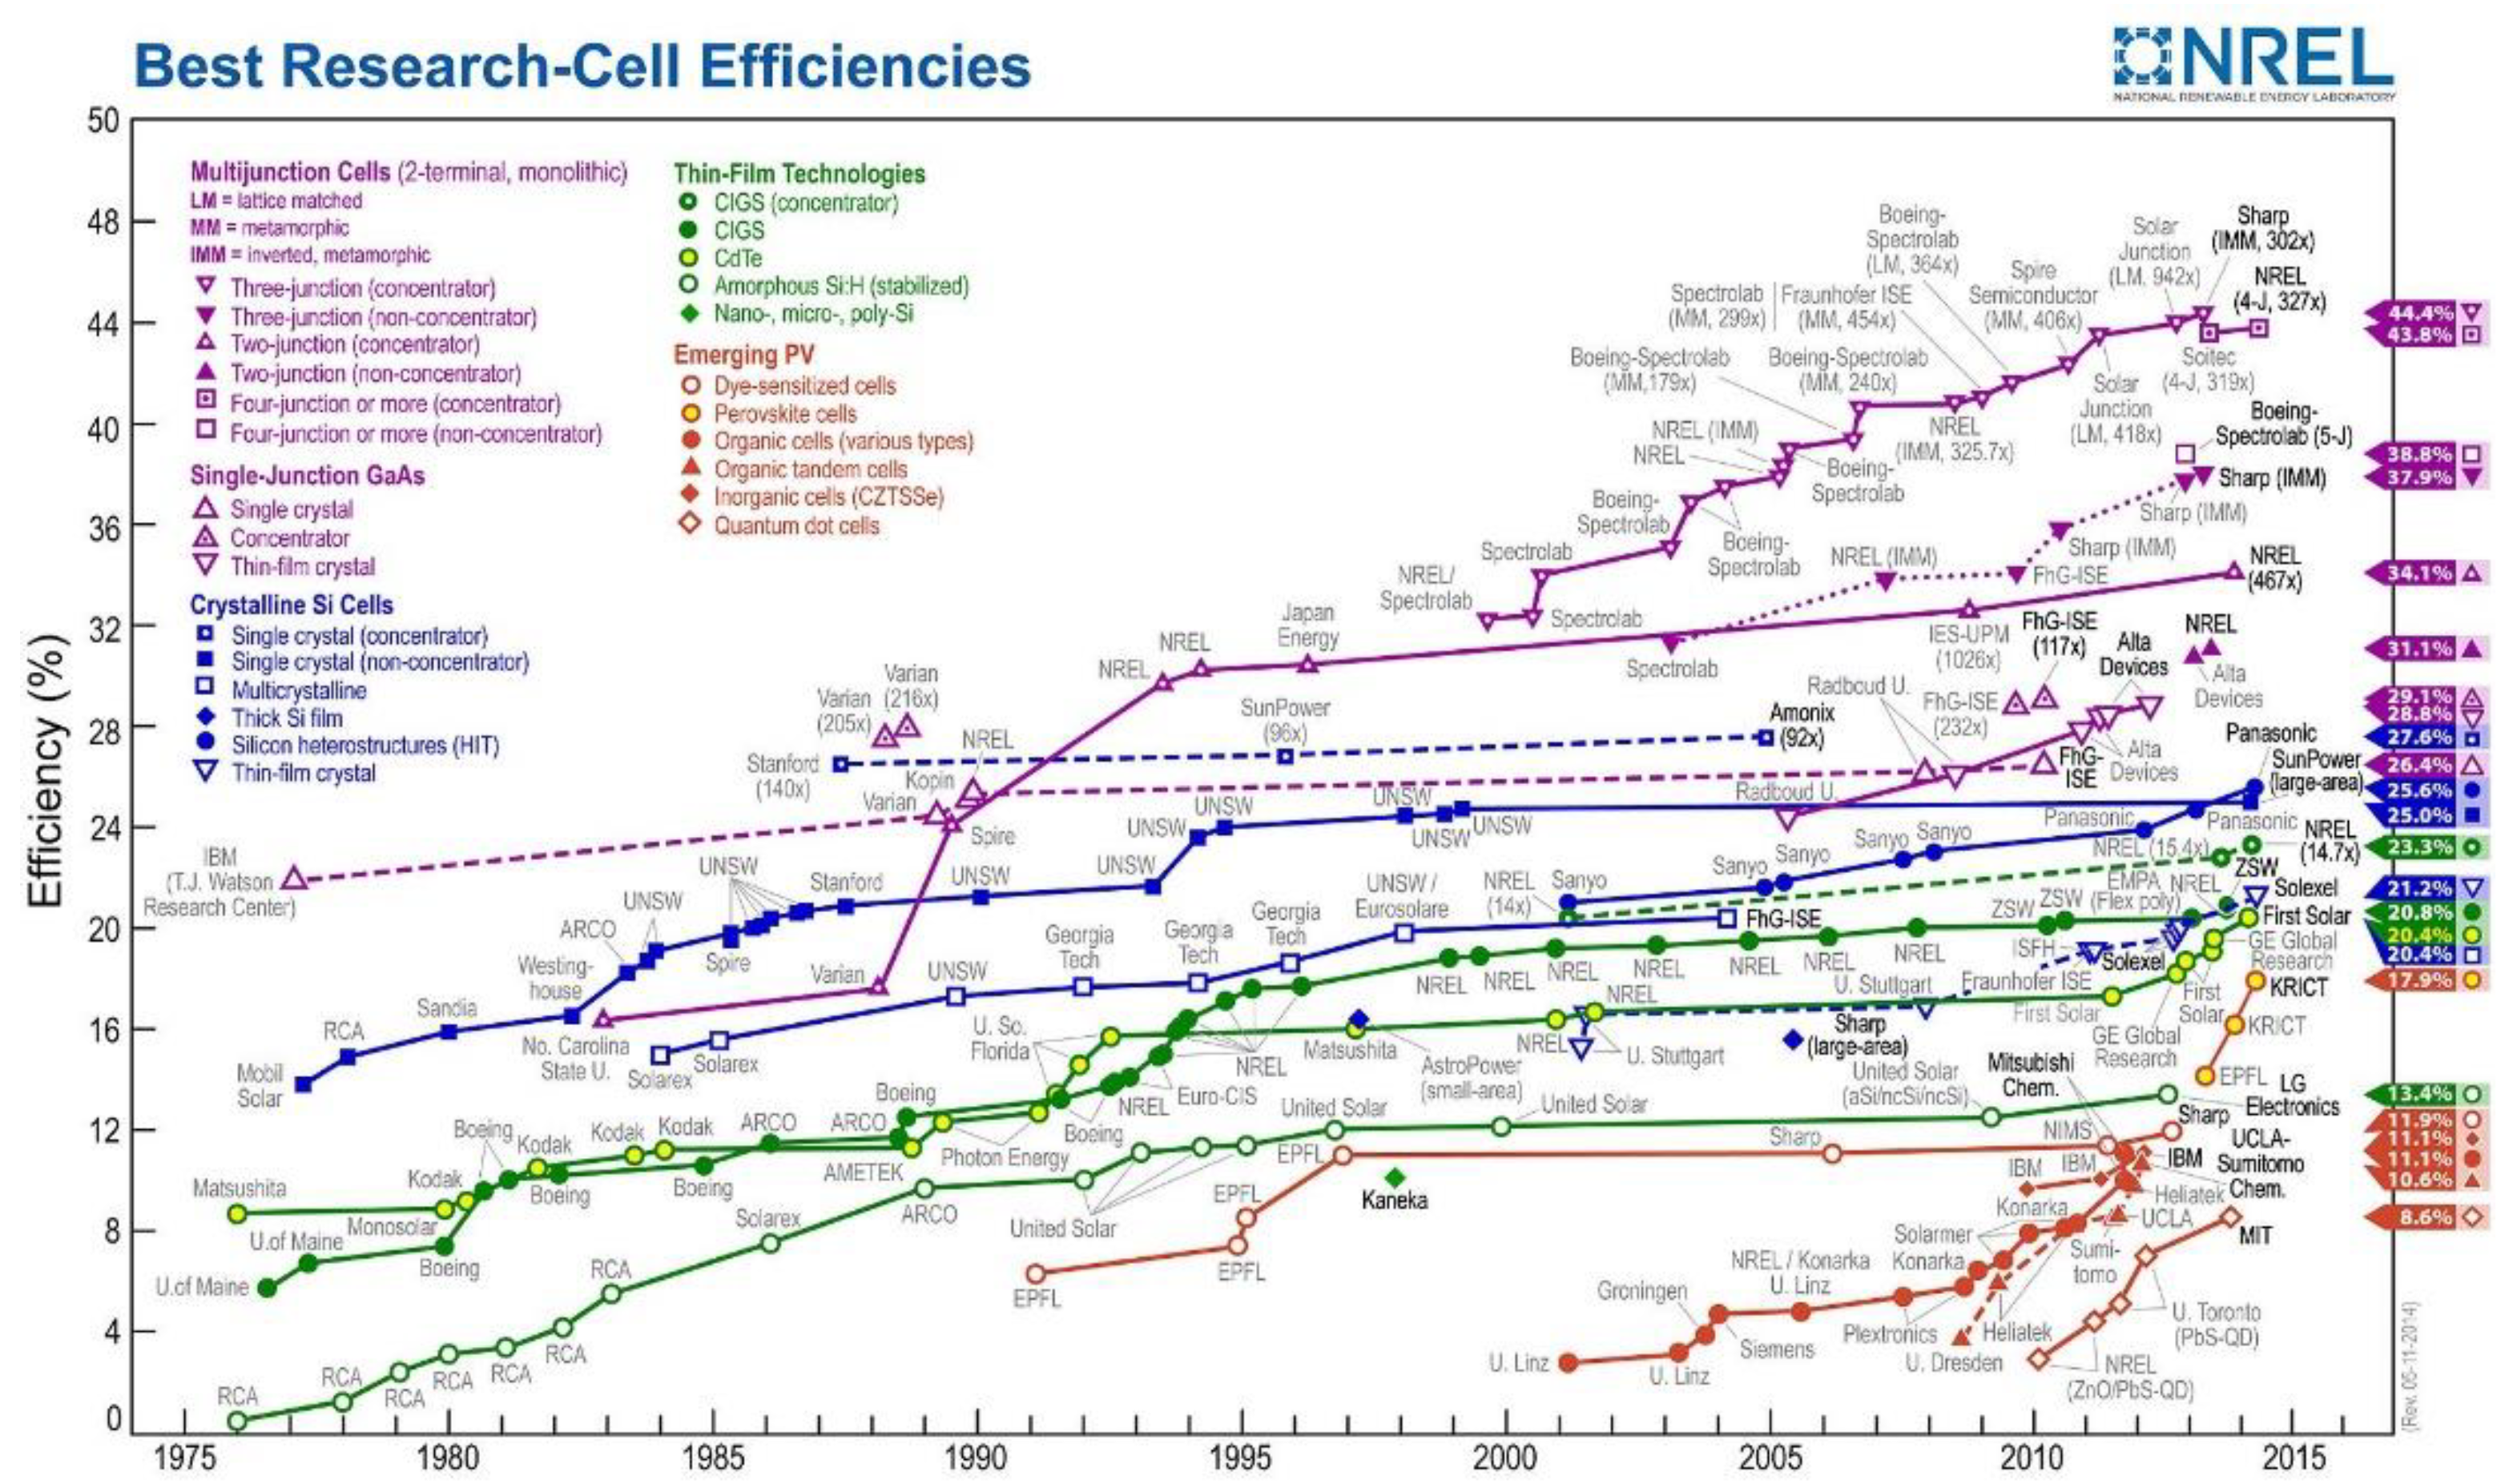
Based on solar photovoltaic technologies, PV technology is the direct conversion of sunlight into electricity with no intervening factors [19]. Photovoltaic devices are designed to be simple and need little maintenance. The main benefit of this system is that it is a stand-alone system with outputs ranging from microwatts to megawatts. As a result, they can be utilized in a wide range of practical applications, including home systems, power sources, distant buildings, water pumps, space vehicles, satellites, communications, reverse osmosis facilities, and even megawatt-scale solar power plants. As a result, with such a diverse range of applications, the demand for PVs grows year after year. Furthermore, solar energy may be turned into electrical energy using a variety of technologies such as PV panels, concentrating photovoltaics (CVT), and concentrating solar thermal power (CSP). Solar PV modules are semiconductor solid-state devices that convert sunlight into direct-current power [20]. Materials used on PV panels are amorphous silicon [21], crystalline silicon [22,23,24,25,26], organic and polymer cells, copper indium selenide (CuInSe), cadmium sulfide (CdS), and cadmium telluride (CdTe) [27,28,29]. PV systems are made up of numerous components, such as cells, modules, and arrays for generating electricity, and structures for regulating and controlling power, as well as electronic devices, mechanical devices, and electrical connections for improved operating efficiency. Peak kilowatts (kW) is the amount of electrical power supplied by a PV system when it is directly overheated by the sun. Figure 2 shows several materials that have been worked out to increase efficiency in PV devices over the past 5 decades, which reaches 46% in four-junction concentrated solar cells [30,31]. Efficiency is not constant since it is impacted by various external conditions, most notably the intensity of sunshine [32,33,34].
PV panels are often inefficient at absorbing all available energy from sunlight due to design, geographic position, and varying solar intensity throughout the day. In terms of the geographic position of the installation location, the UAE is situated between 22°30″ and 26°10″ north latitude and 51° to 56°25″ east longitude, suggesting that it receives a significant amount of solar energy [36].
Solar tracking system (ST) technologies have been established in recent years to improve the quantity of solar energy captured from the sun. ST is currently classified into two basic varieties based on their movements: single-axis trackers (those that rotate around one-axis) and double-axis trackers (those that spin around two-axes). These devices have lately demonstrated a significant improvement in efficiency on both clear and overcast days, as well as being more environmentally friendly and economically feasible [36]. When compared to fixed traditional PV systems, a single-axis tracker’s energy return commonly approaches 25%, while a double-axis tracker’s energy return often exceeds 40%. Furthermore, while many people still question the efficacy of single-axis trackers, Huang and Sun [37] have shown that they may achieve substantial energy gains, gathering up to 56% more if particular design and control approaches are implemented. When compared to optimally tilted panels, double-axis trackers yielded an energy gain of 20.4% annually [38], whereas incomparable research [39] yielded a yearly energy gain of 43.9%. Meanwhile, while evaluating the performance and economic advantages vs. environmental circumstances of a double axis ST, Enpinar and Cebeci [40] reported a 13.25% improvement in energy gain over an equal size-fixed PV system. Several other researchers have investigated the performance of single and double-axis trackers, showing a 35% energy increase for double-axis trackers over single-axis trackers [35,41,42].
In the past, several other reviews have been published, including Adel Juaidi et al. [3] who deals with energy production, consumption, and greenhouse gas emissions in the UAE. The nuclear and solar energy sources in the UAE were studied by Mehmet F. Orhan et al. [43], in which integrated hydrogen production and thermodynamic analysis were details analyzed based on these sources, and Valerie Eveloy and Tesfaldet Gebreegziabher [44] investigated future power production options for the UAE, focusing on concentrated solar power (CSP) with thermal energy storage and solar photovoltaic (PV). An overview of greenhouse gas emissions from the energy sector in the UAE was studied by A.N. Khondaker et al. [45]. Steven Griffiths and Robin Mills [46] investigated the possibilities of rooftop solar PV in the growth of the UAE’s energy grid. Zafar Said et al. [18] investigated predictions of the UAE’s renewable energy mix in 2030.
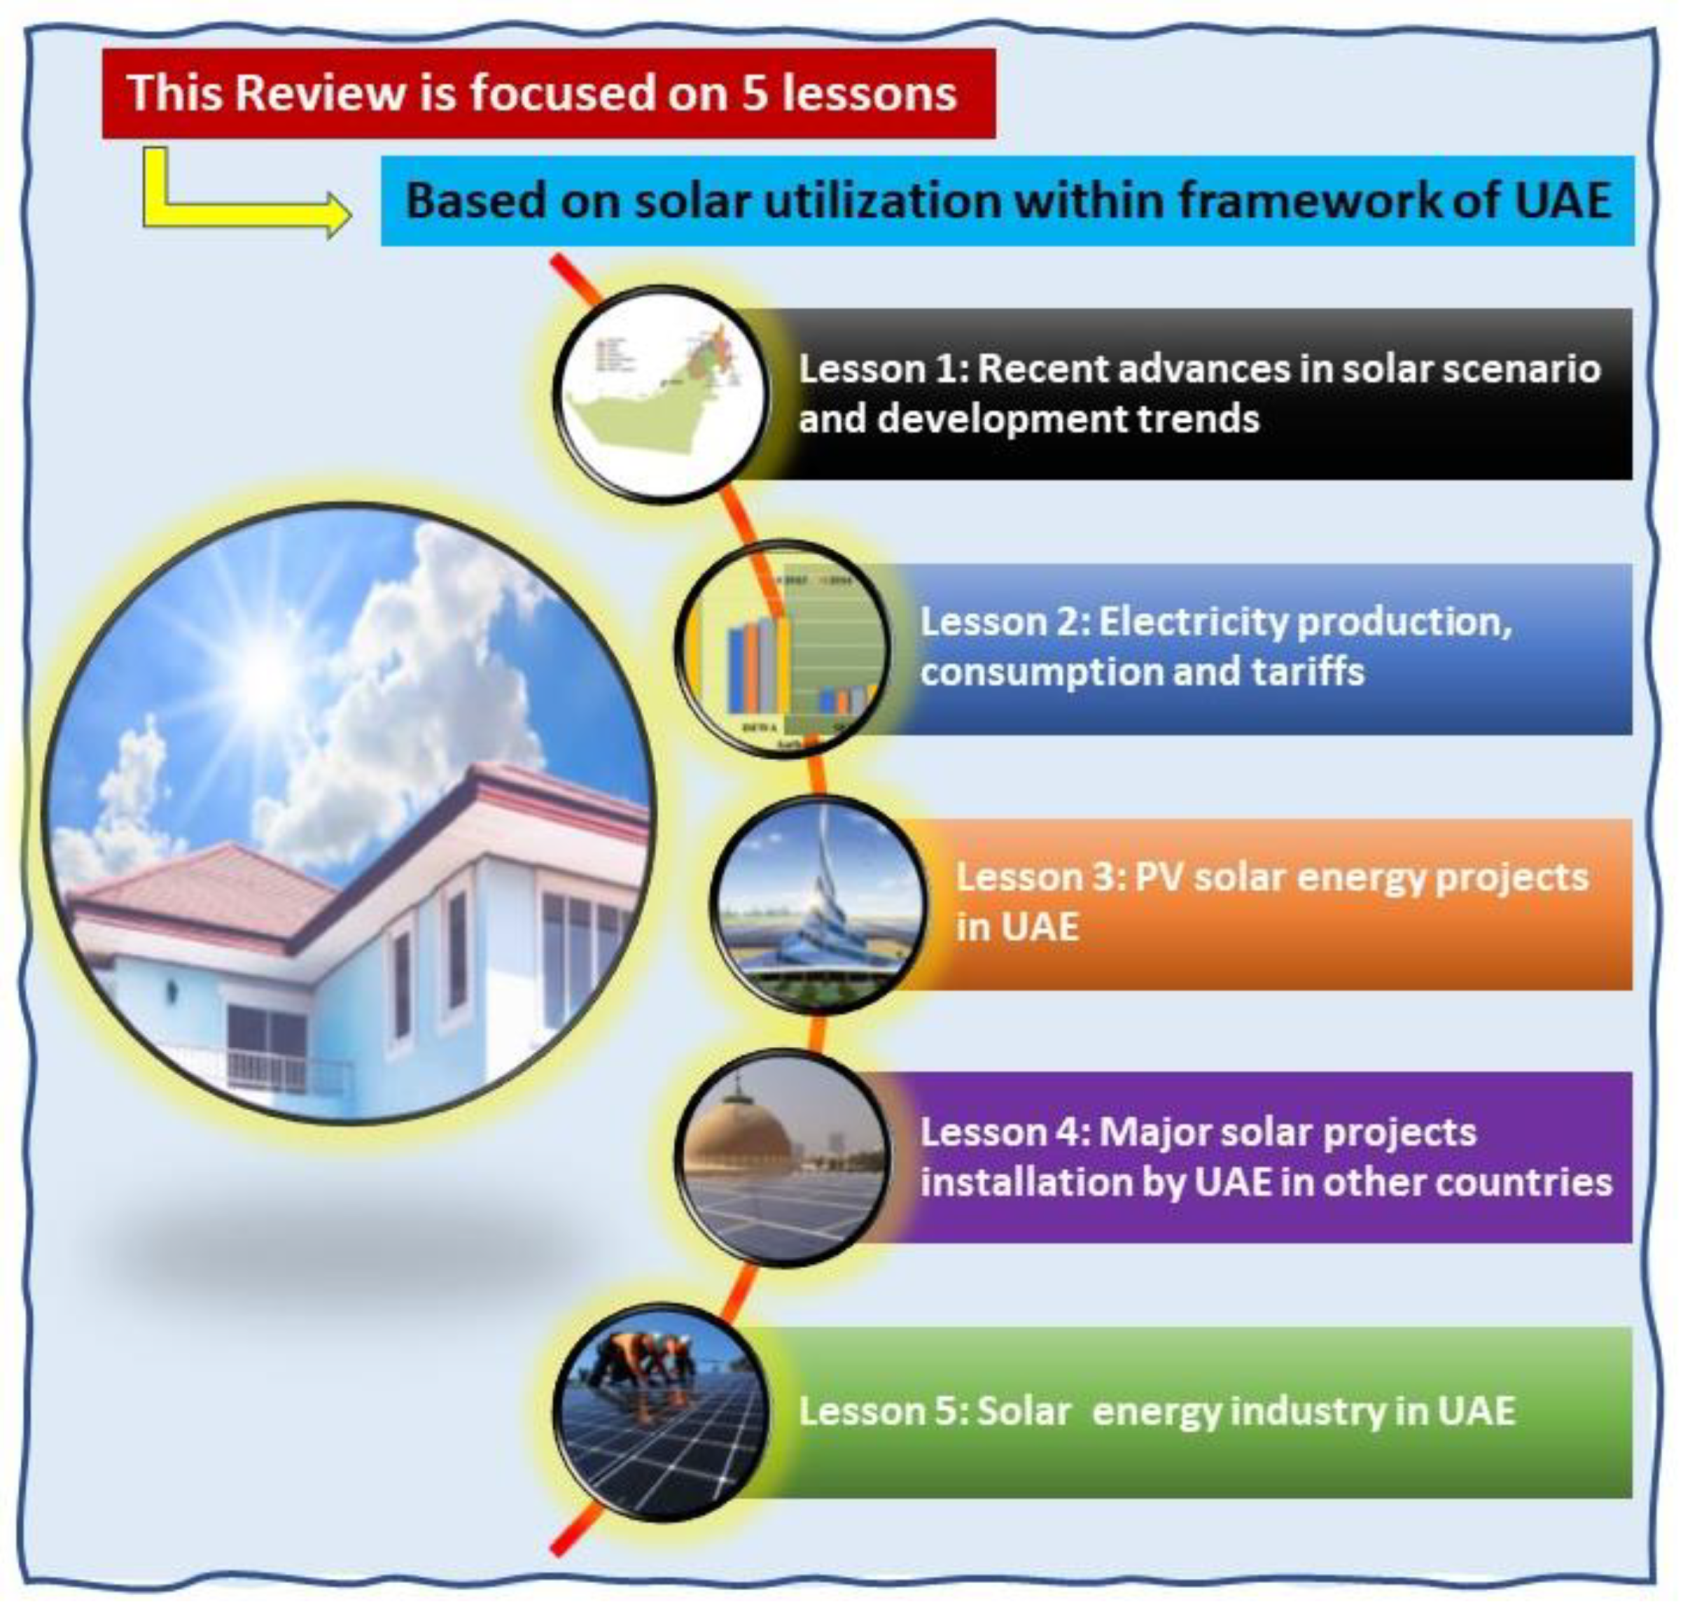
To the best of our knowledge, no detailed evaluations of solar energy resources have been published throughout the United Arab Emirates’ seven emirates. The goal of this article is to provide an in-depth examination of current solar energy research and operations in the UAE. As a result, the primary goal of this study is to expand on such basic work by addressing the following issues: 1. an outlook on the UAE, 2. the UAE’s energy portfolio, 3. electricity production, consumption, and pricing in the UAE’s seven emirates, 4. focus on the many features of PV solar installation projects within the context of the Dubai and Abu Dhabi emirates, UAE, 5. various solar projects outside of the UAE, and 6. the solar energy industry in the UAE. Finally, the review includes a summary, difficulties, current developments, and prospects. Because of higher solar exposure in the UAE, electricity can be produced (rather than coal sources) to meet the demand for population growth while also reducing environmental pollution, particularly CO2 emissions and other greenhouse gases. This review provides a great opportunity for readers who work in solar energy research in the UAE. The outline of this review is shown in Figure 3.
2. An Outlook on the UAE
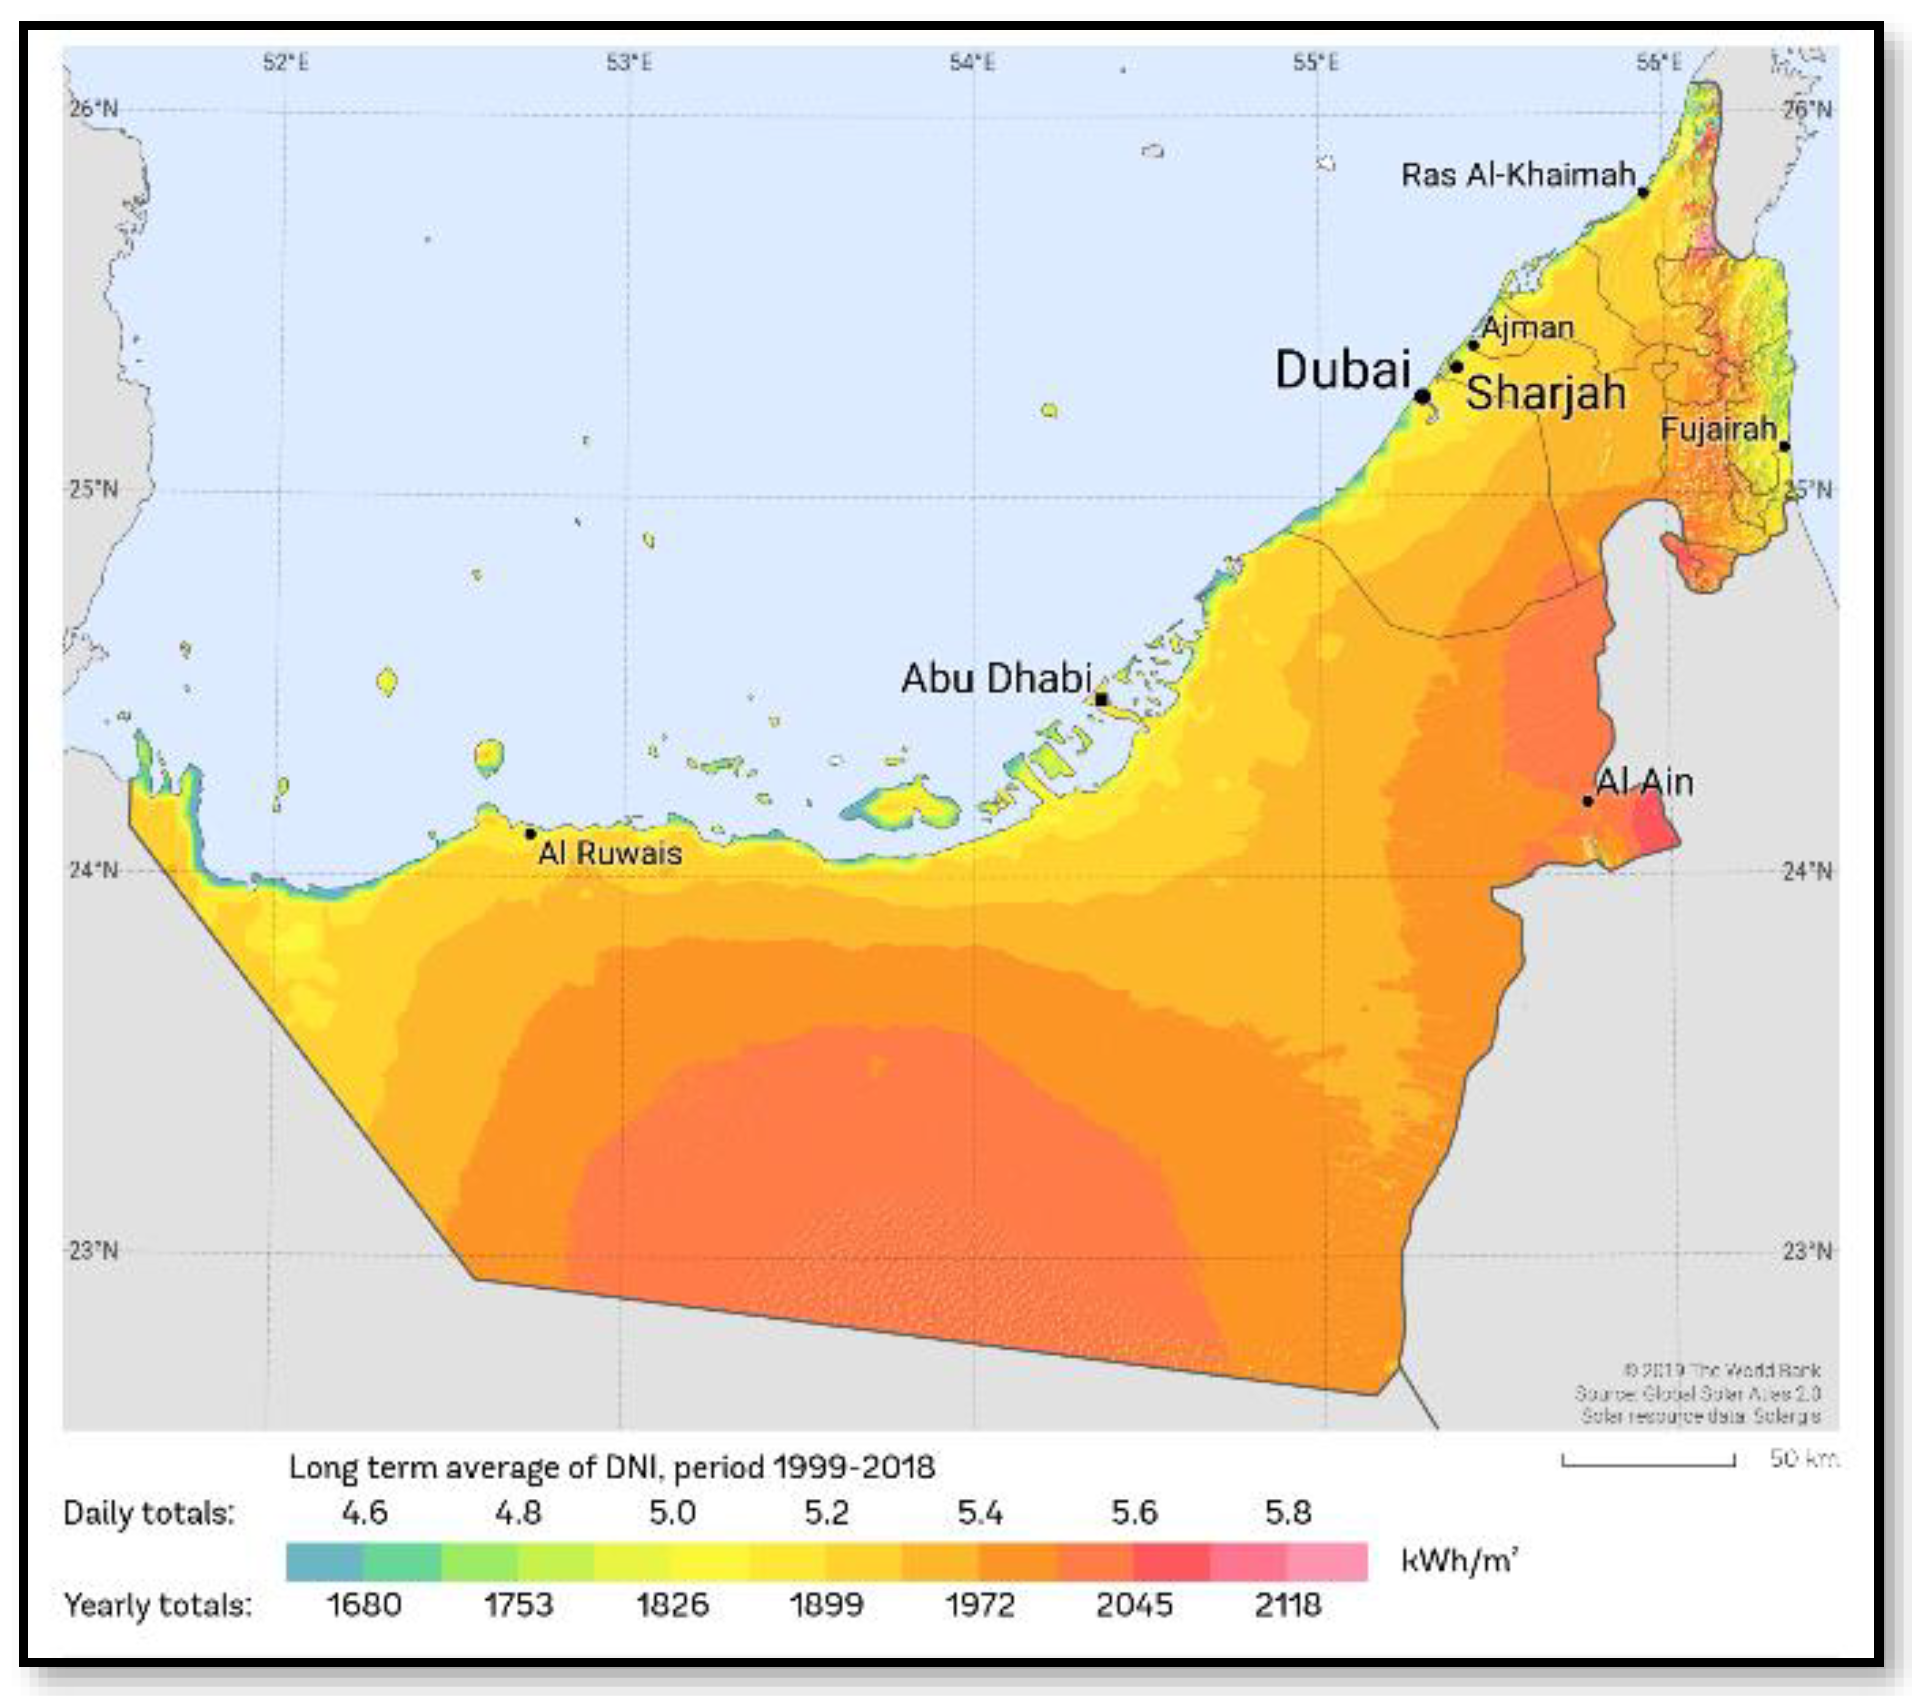
The UAE has the highest solar exposure rates recorded in the world, as illustrated in Figure 4, showing huge potential for solar development. The UAE is located in the Middle East, in the southwest part of Asia, and is surrounded on four sides by the Arabian Gulf, Saudi Arabia, Qatar, and the Sultanate of Oman [47].
The entire area of the UAE is 83,600 km2, with desert covering 74% and mountains covering 2.6% [47]. As illustrated in Figure 5, the nation contains over 200 islands and a total population of 10 million as of 2021 [50].
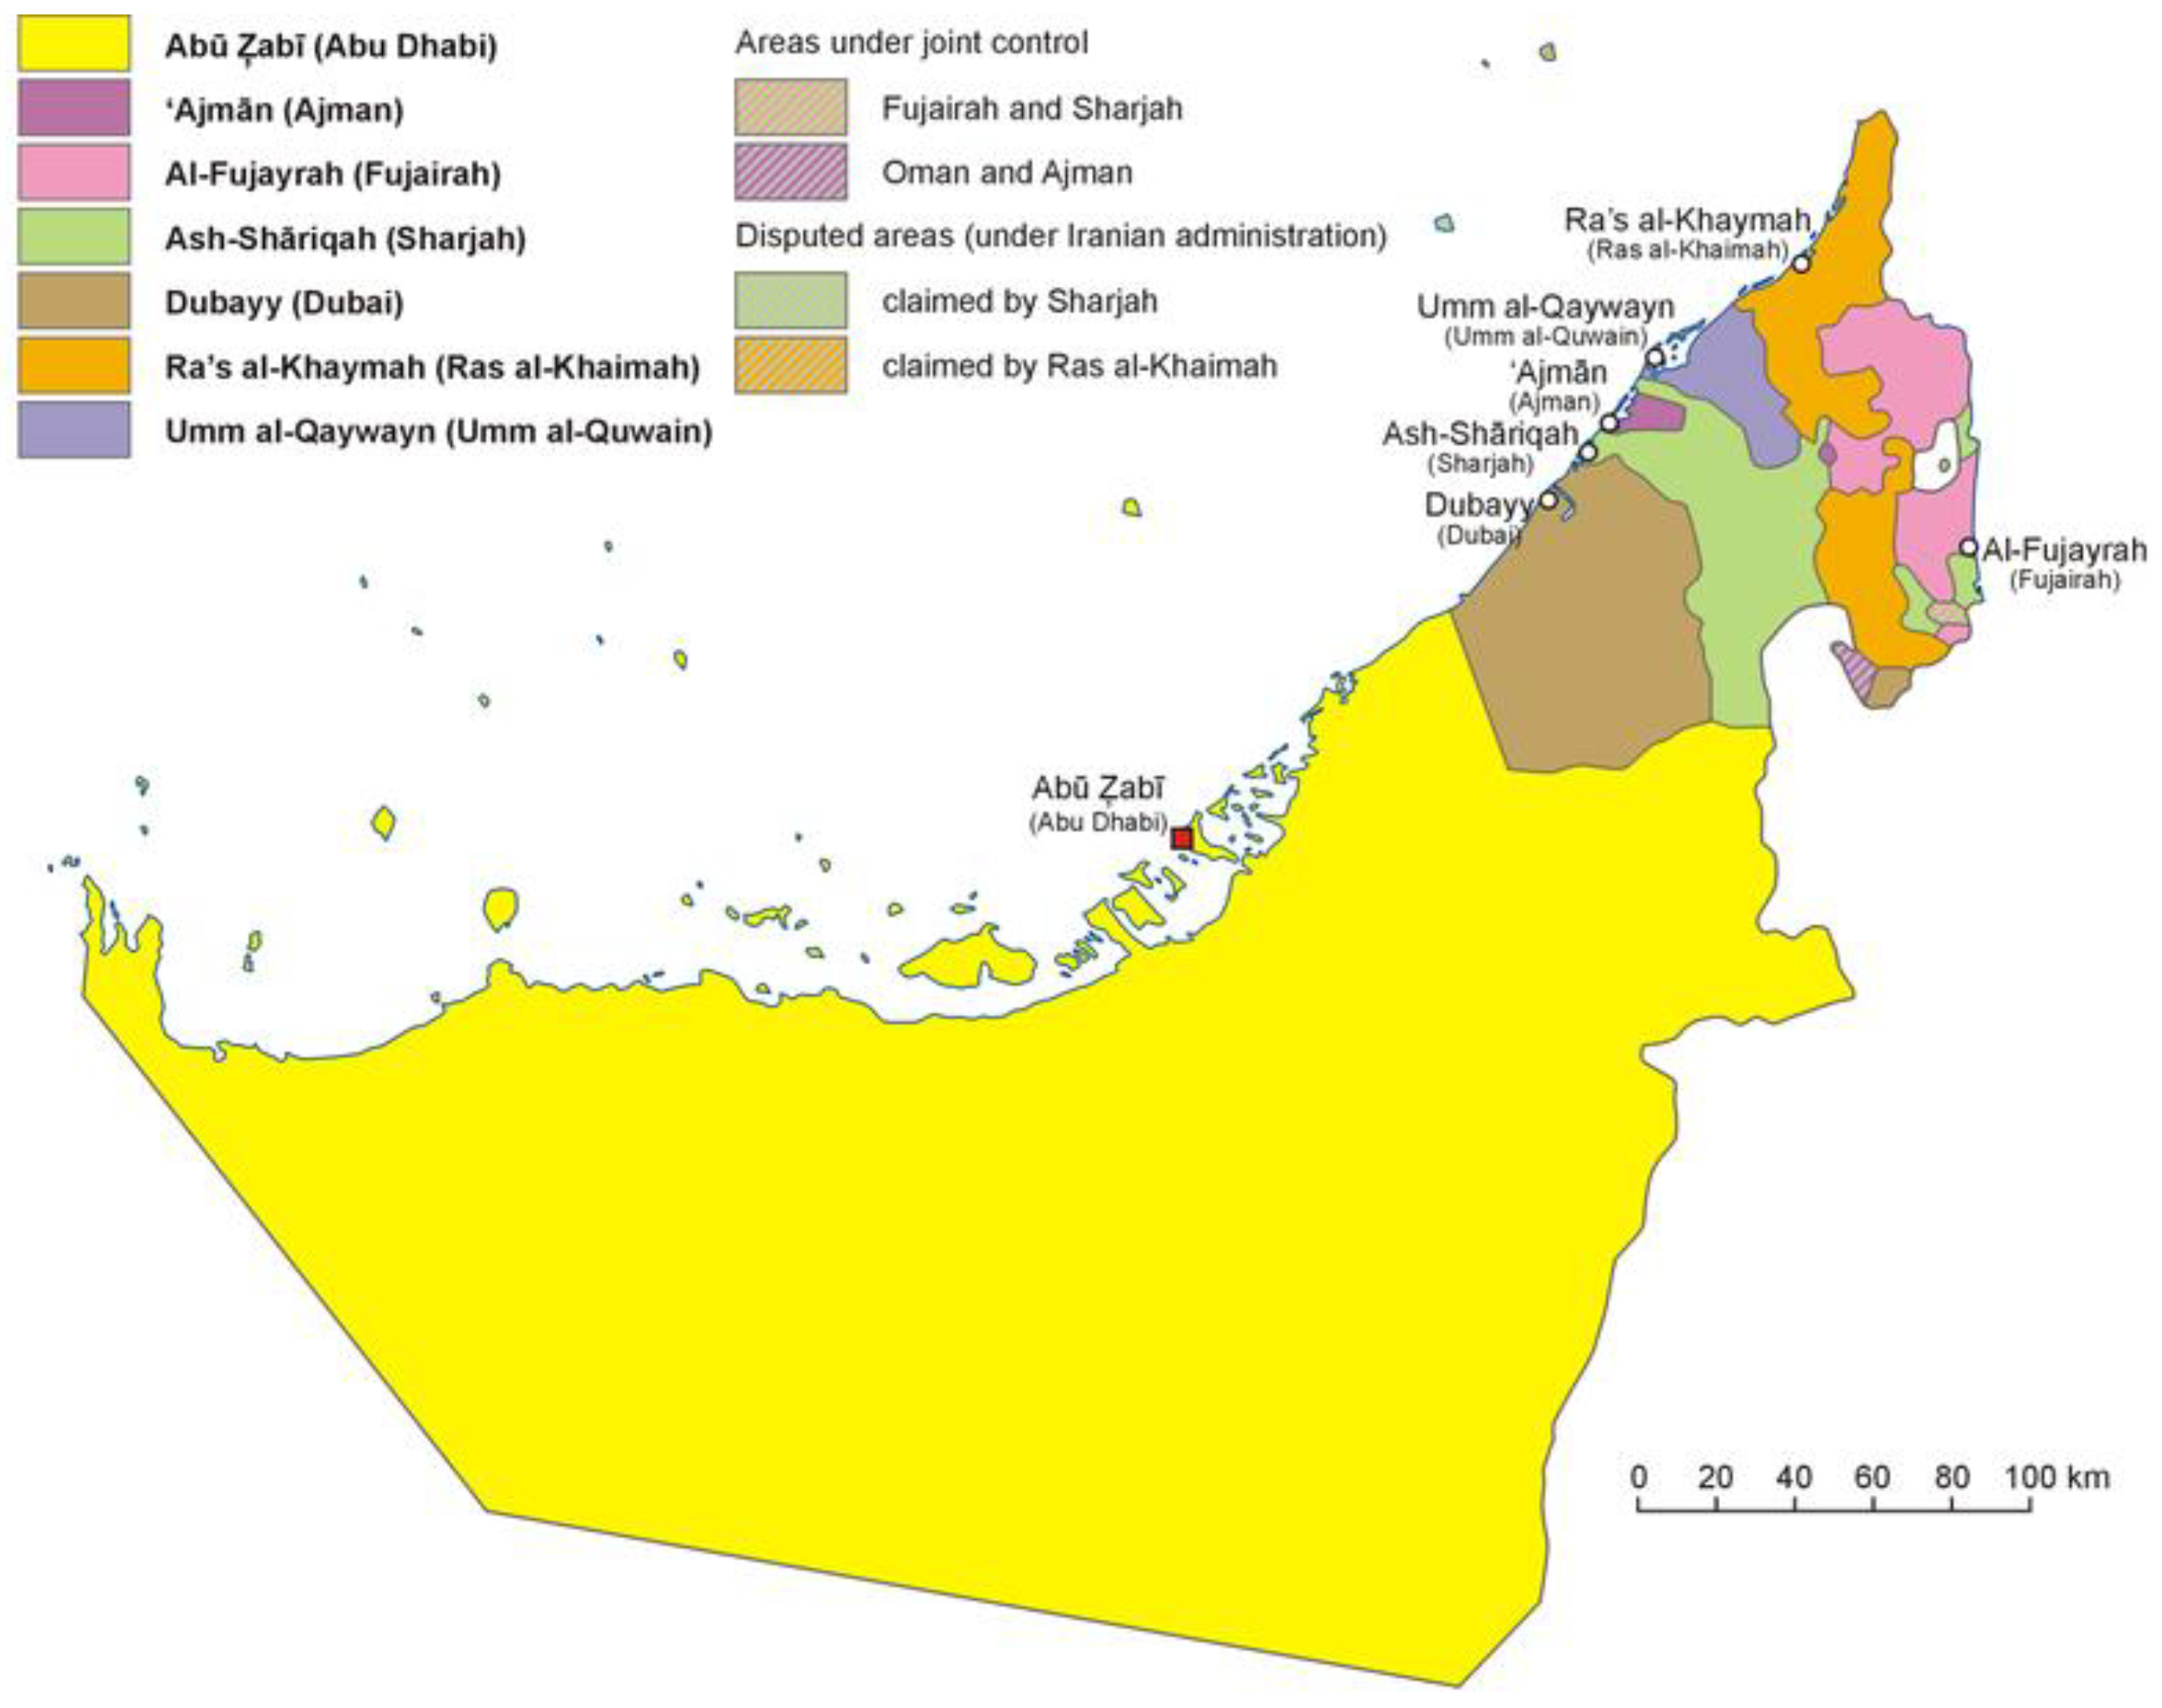
The figure below is a map of the UAE’s administrative divisions (Figure 6). Abu Dhabi is the biggest emirate in the UAE, accounting for 84% of landmass territory with a total area of 67,340 km2 (13% of the total area of the UAE).
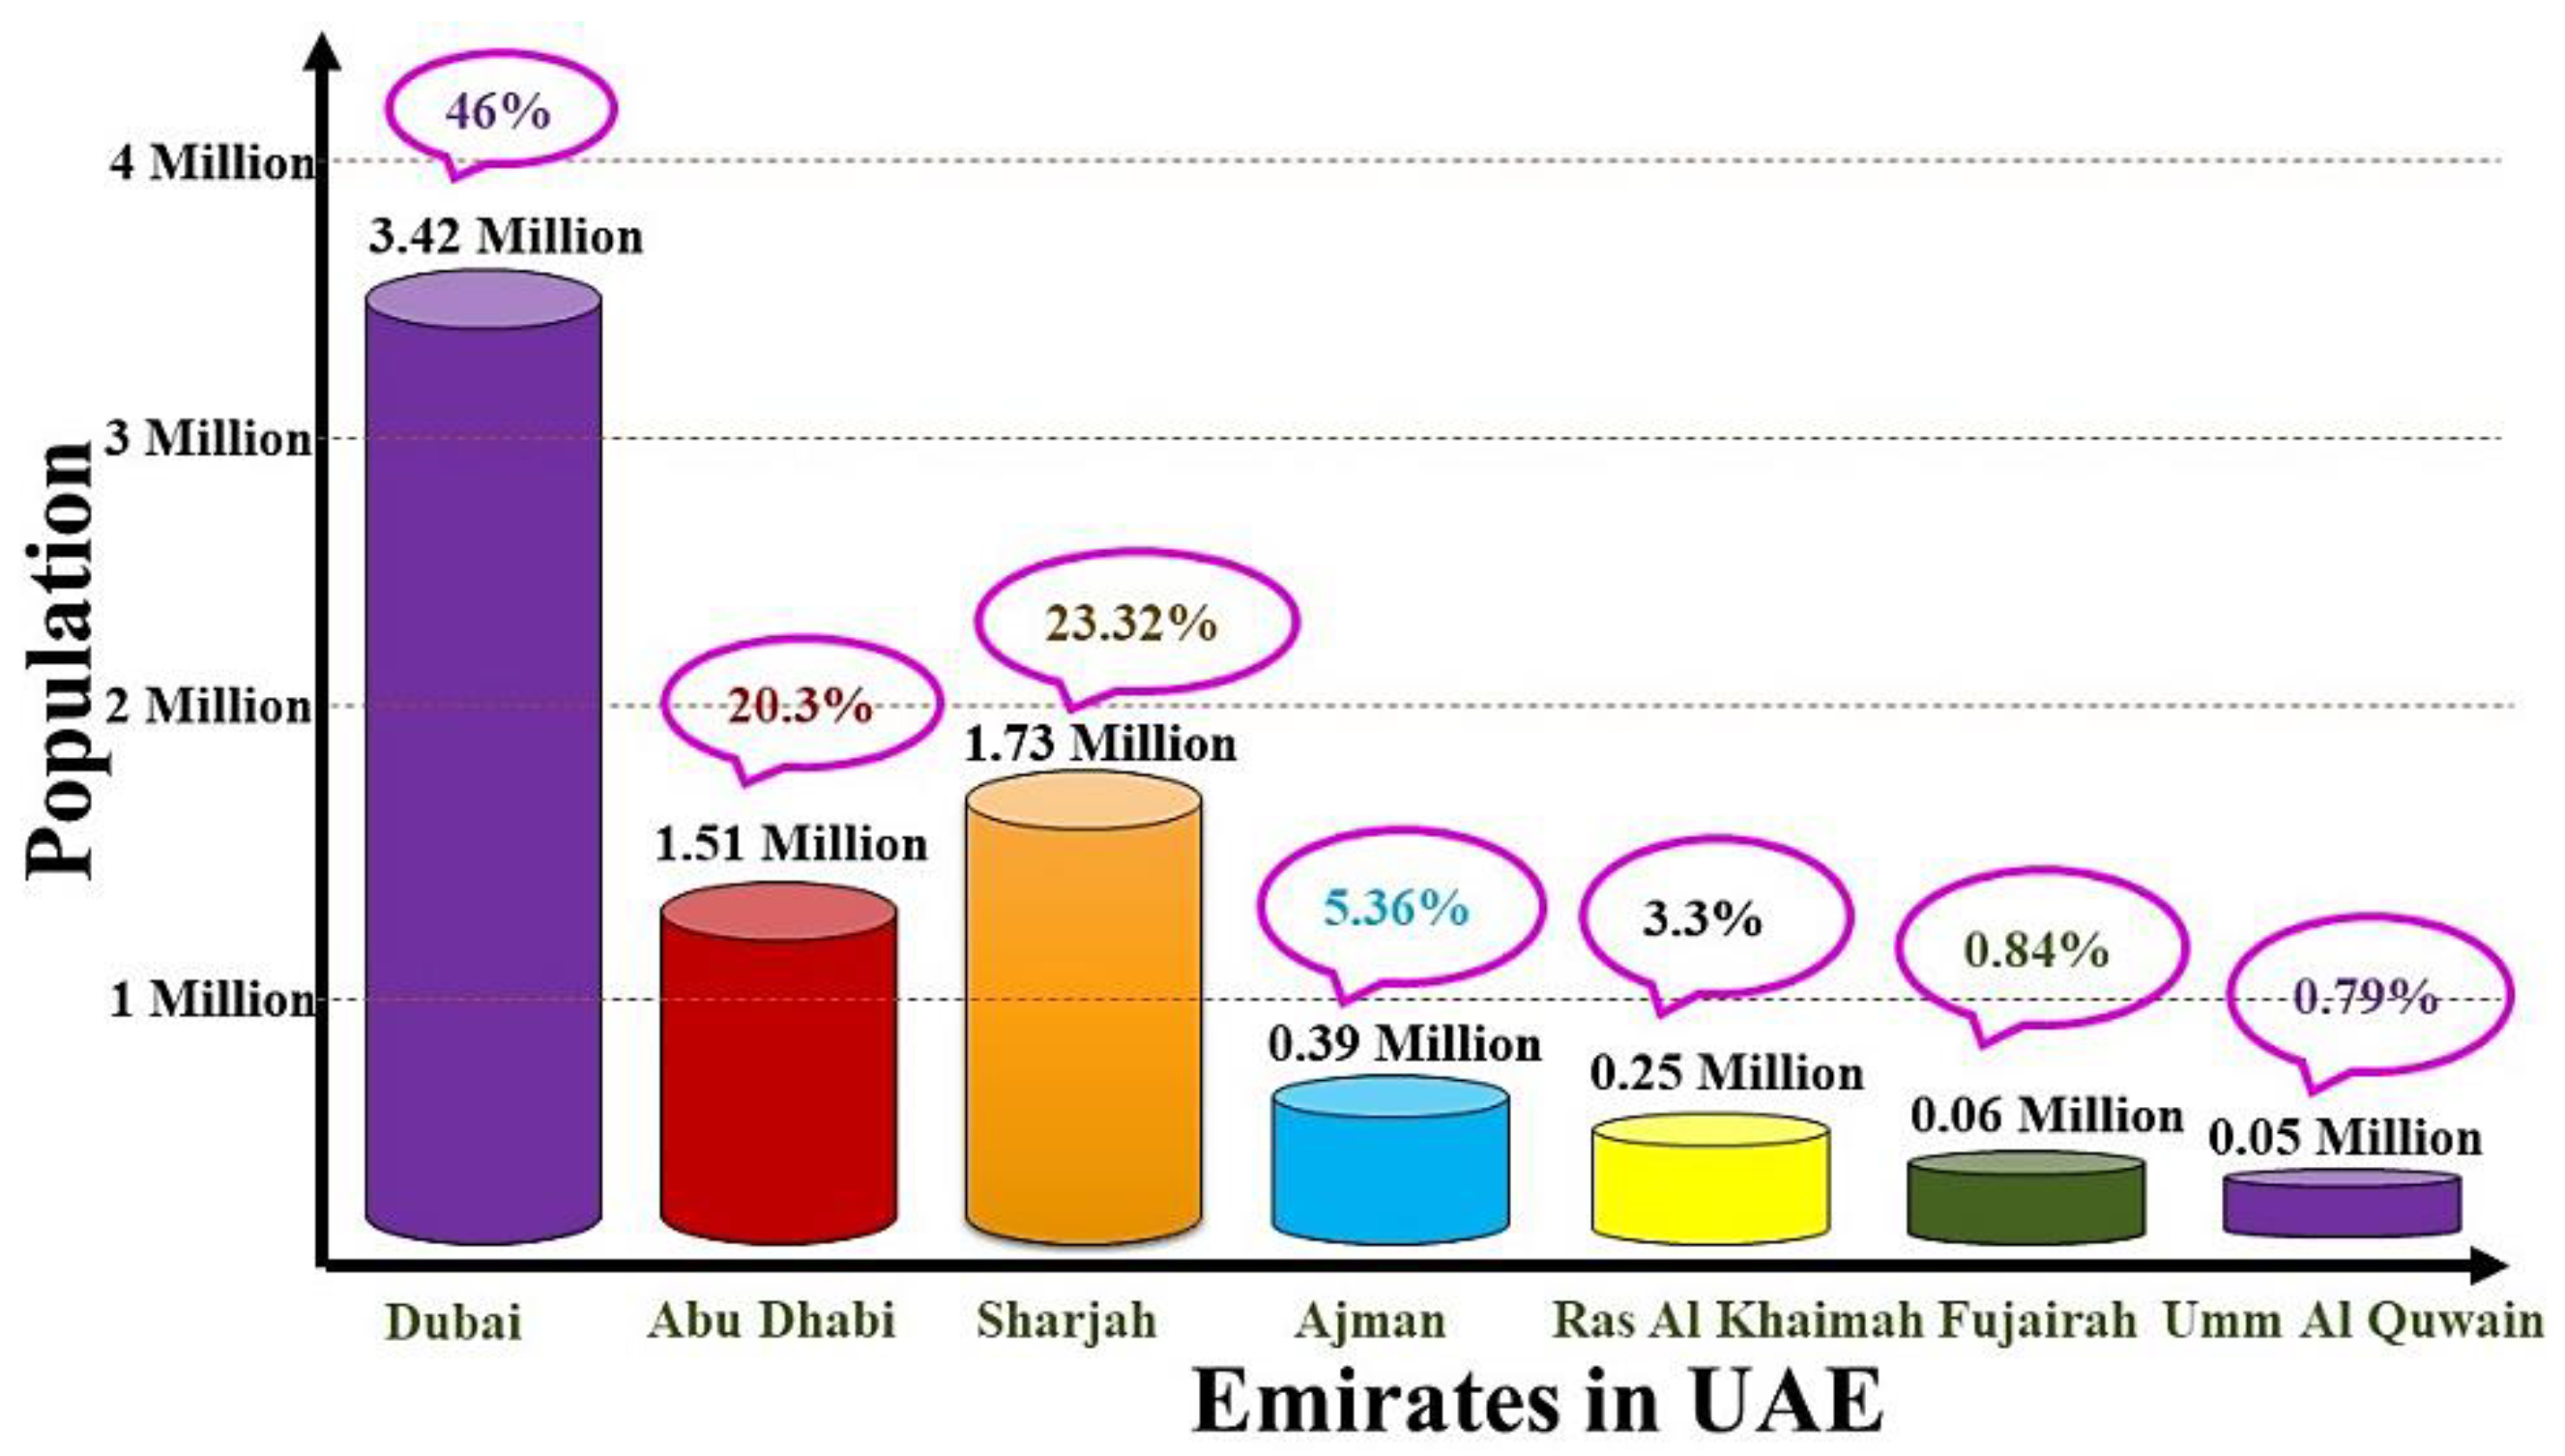
Abu Dhabi has the highest power consumption, owing to its bigger geographic area, followed by Dubai, which has a relatively high energy demand compared to its geographic size. Usually, Dubai has more population, followed by Abu Dhabi, Sharjah, and other emirates in the UAE. As reported in 2021, Dubai has 3.42 million (46%) followed Sharjah, 1.73 million (23.32%), Abu Dhabi, 1.51 million (20.3%), Ajman, 0.39 million (5.36%), Ras Al Khaimah, 0.25 million (3.3%), Fujairah, 0.06 million (0.84%), and Umm Al Quwain, 0.05 million (0.79%). The Sharjah has the second-most population followed by the other emirates. The COVID-19 pandemic has an effect on the people’s lives within the UAE’s emirates.
3. Energy Scenario and Development Trends in the UAE
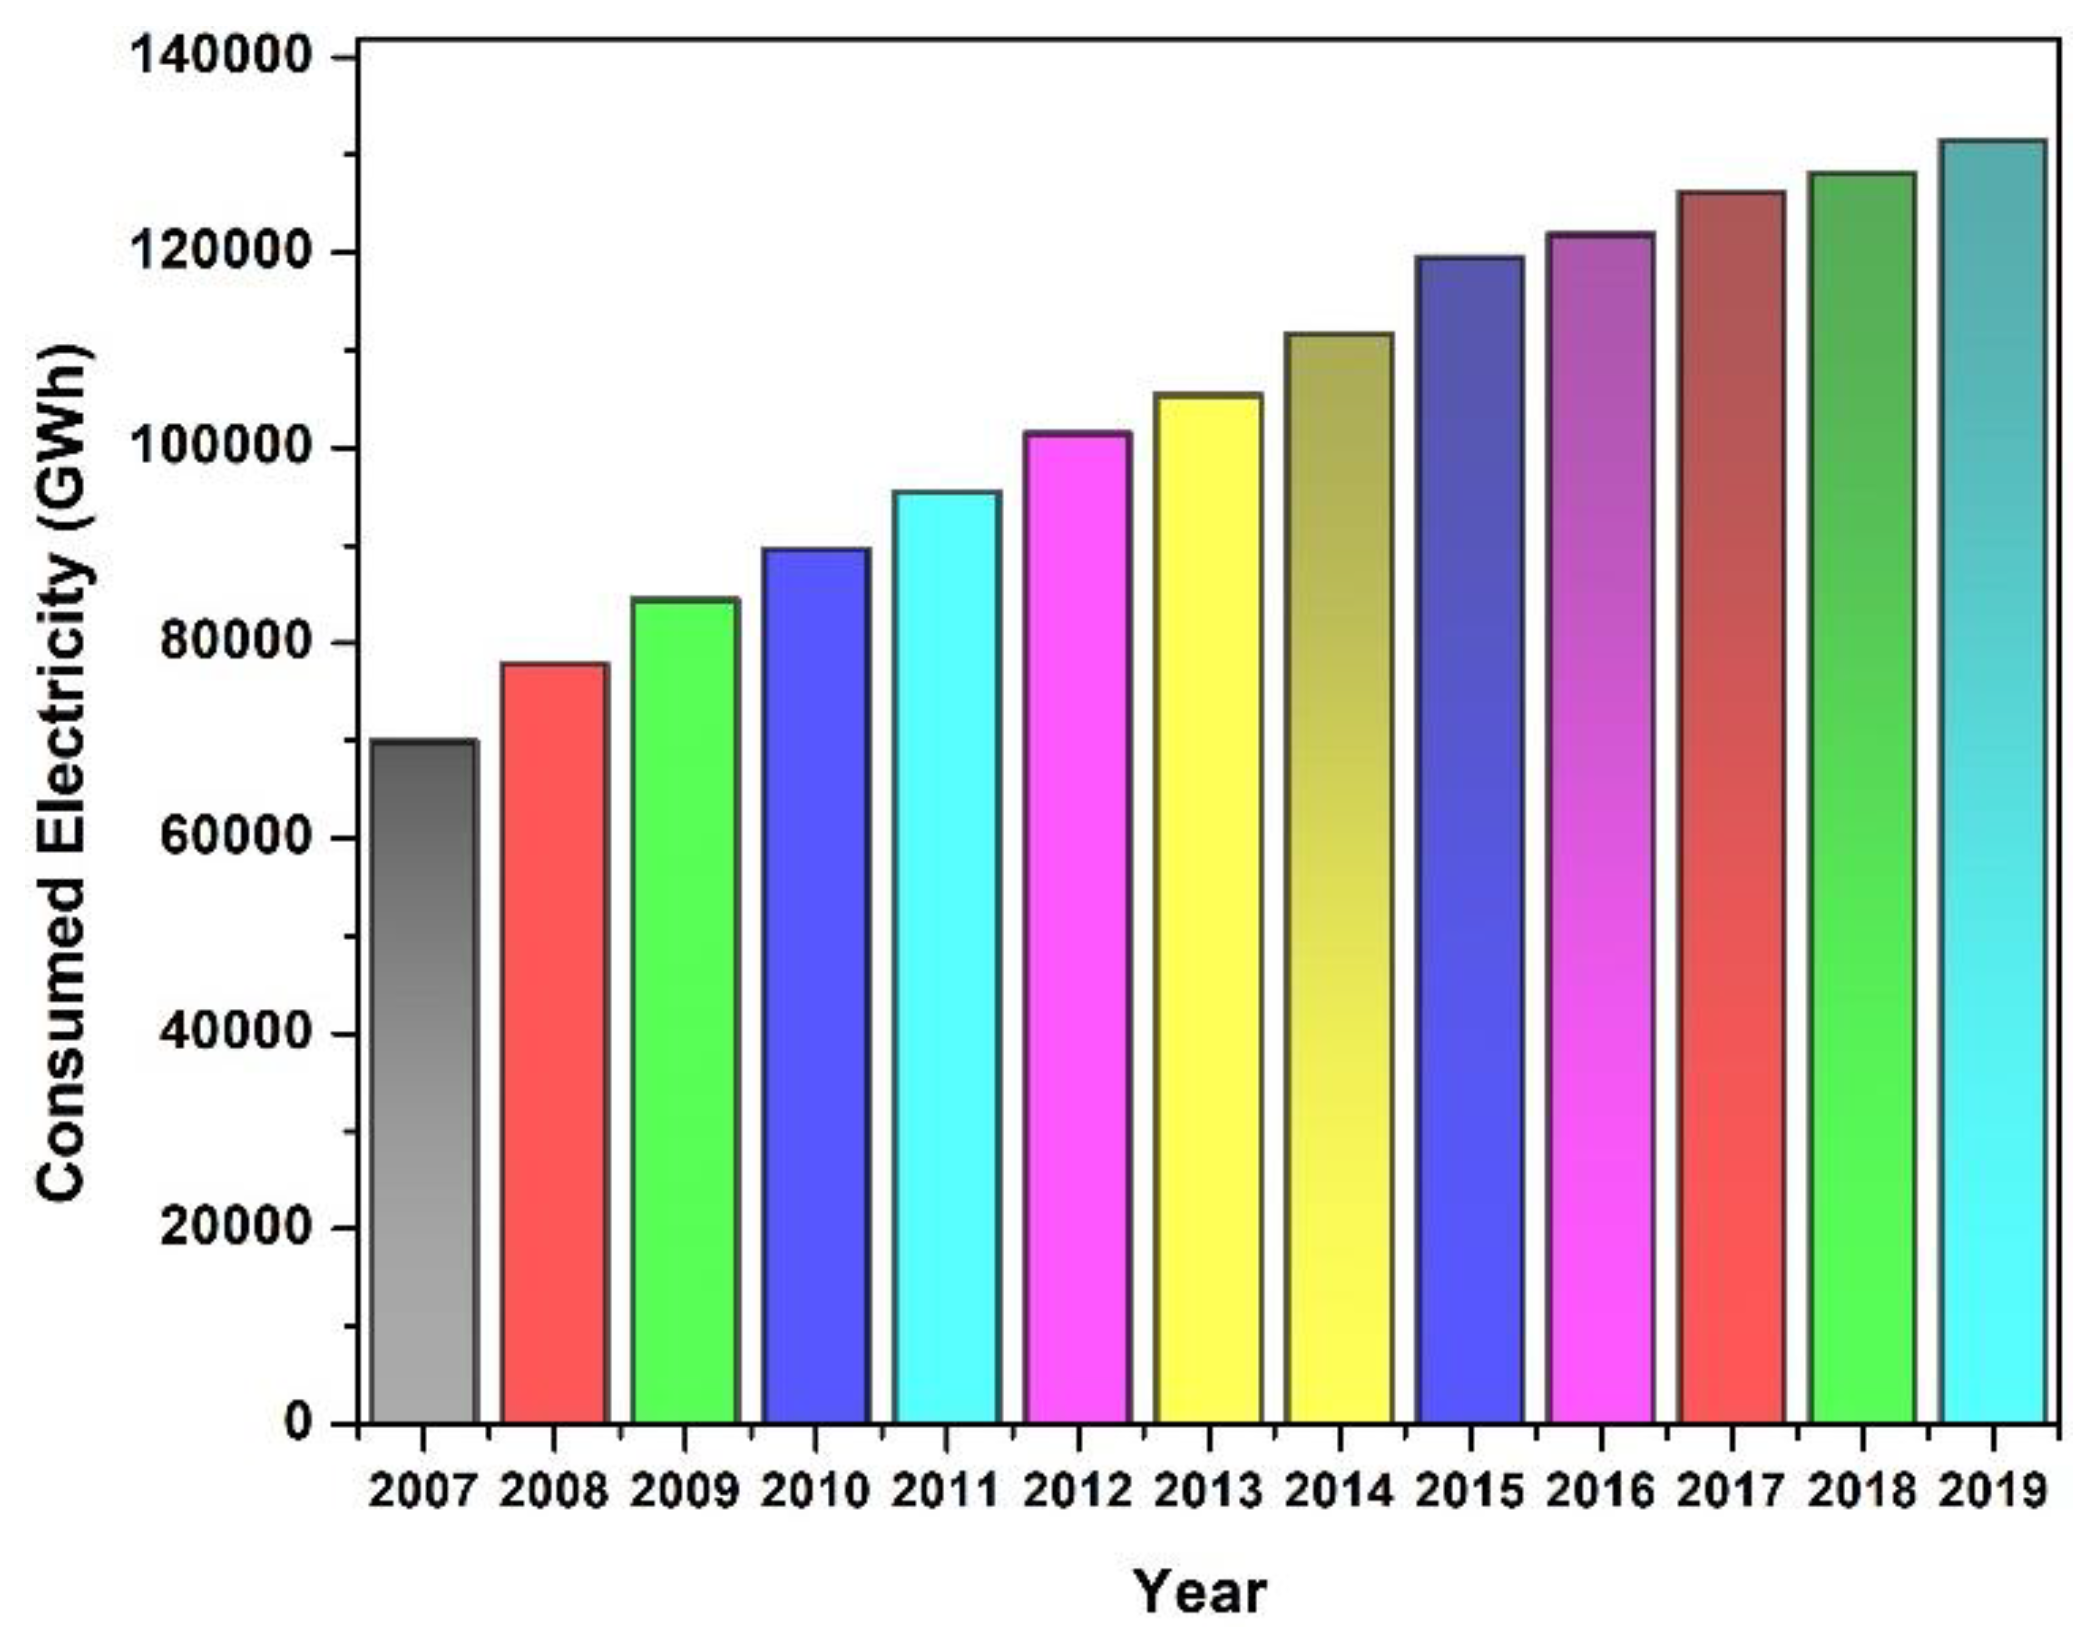
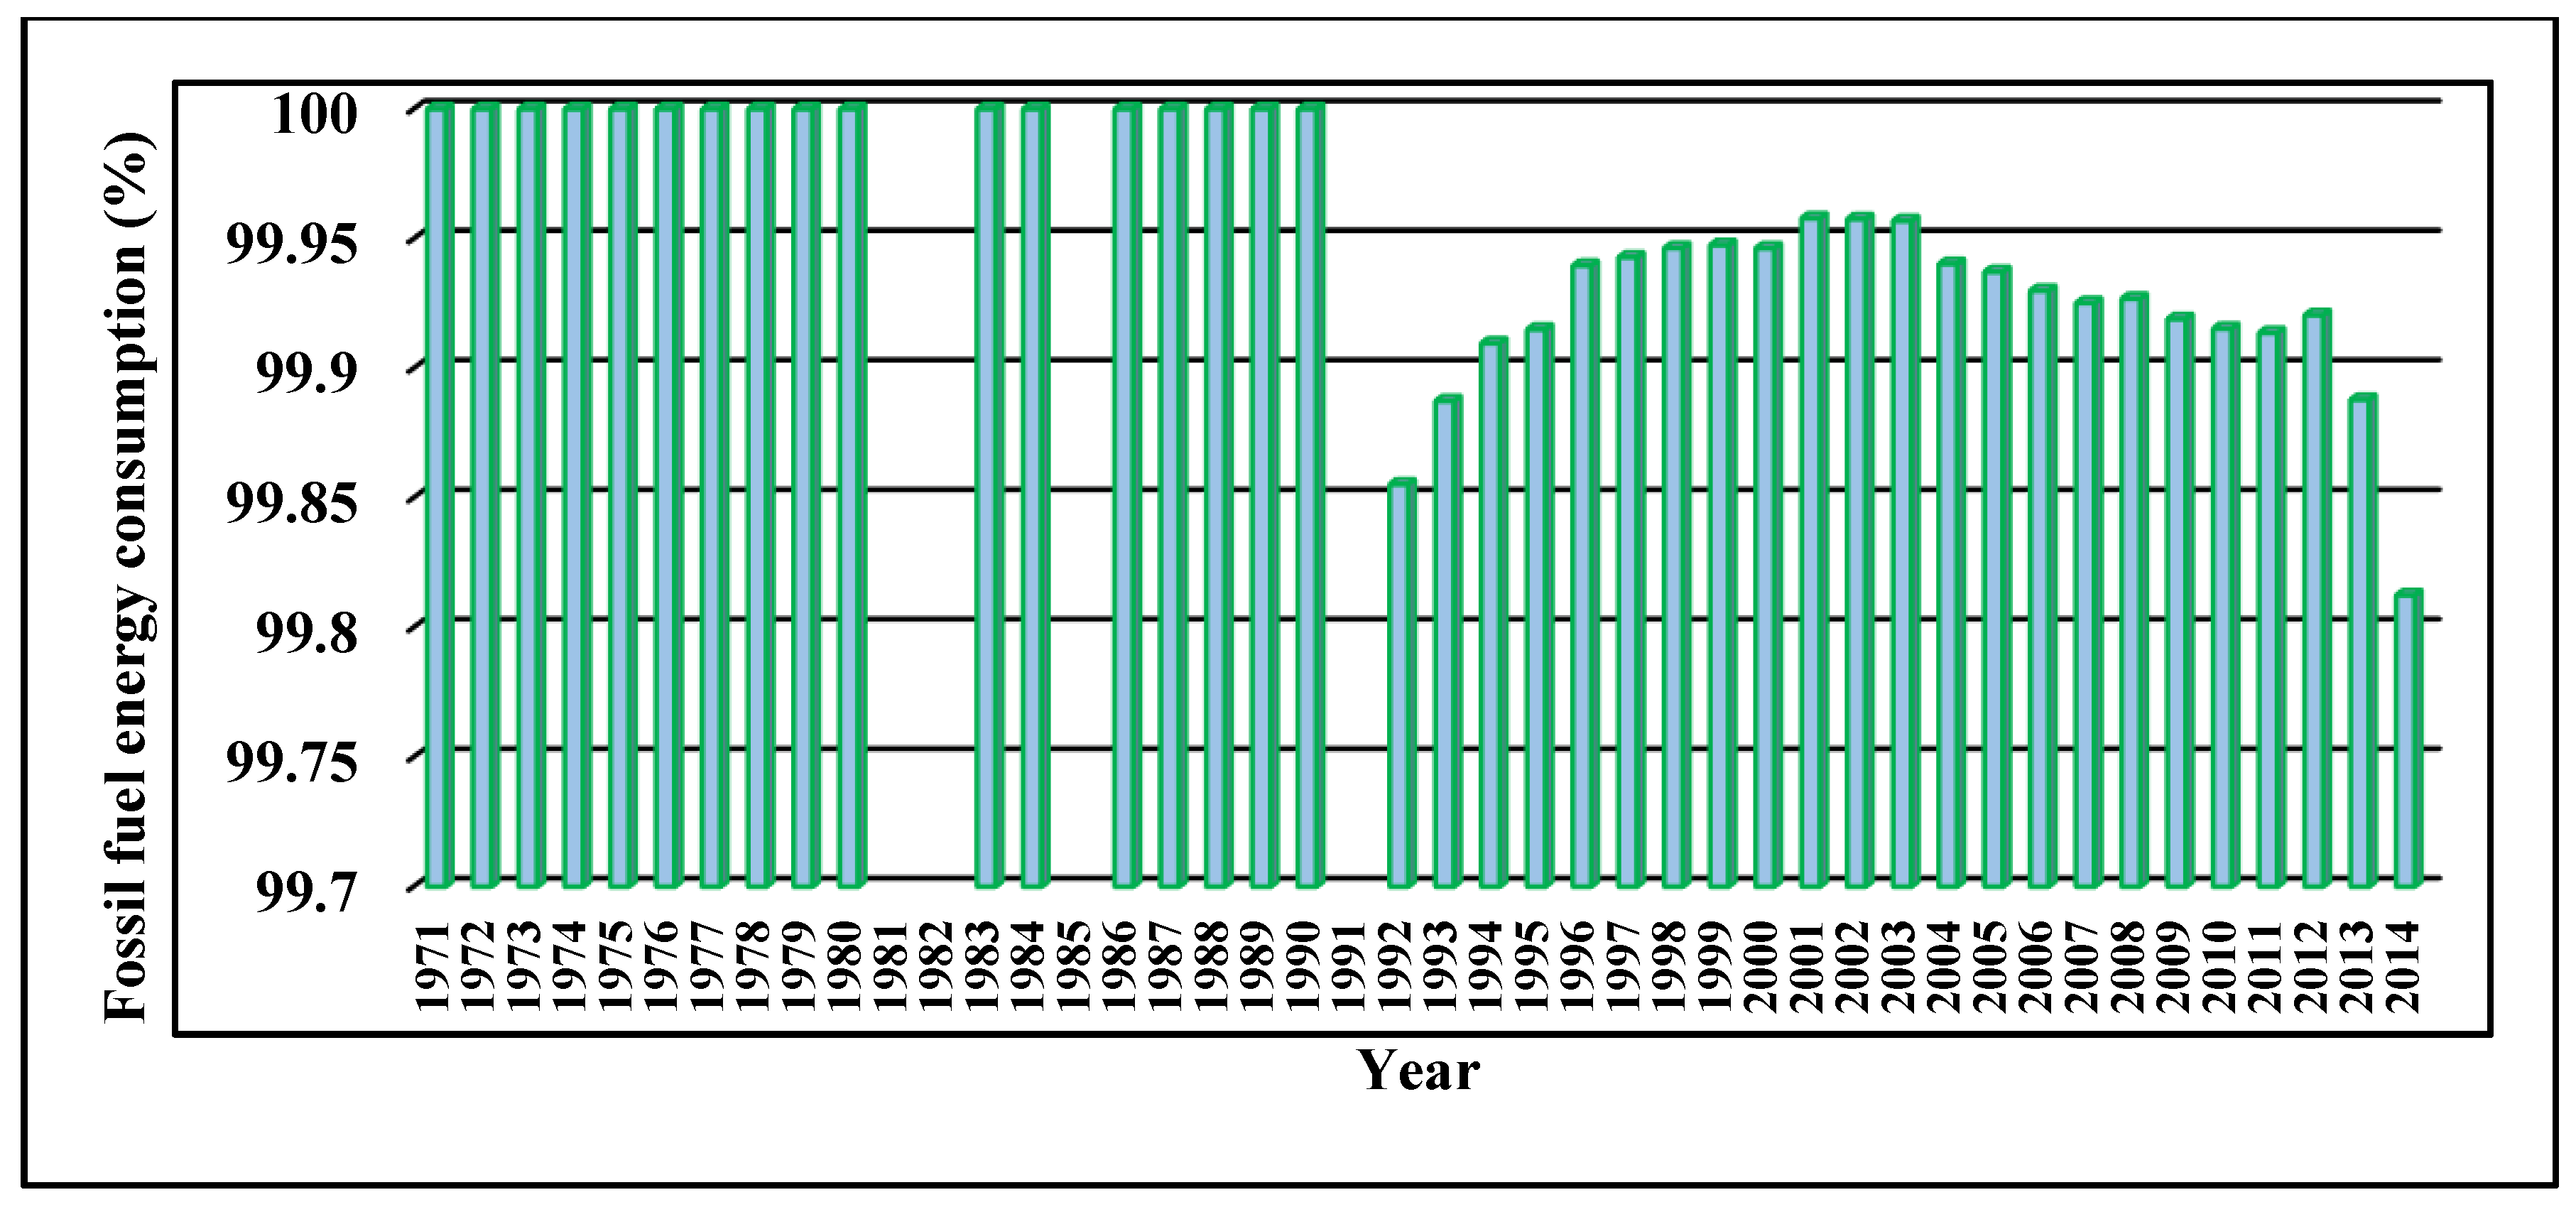
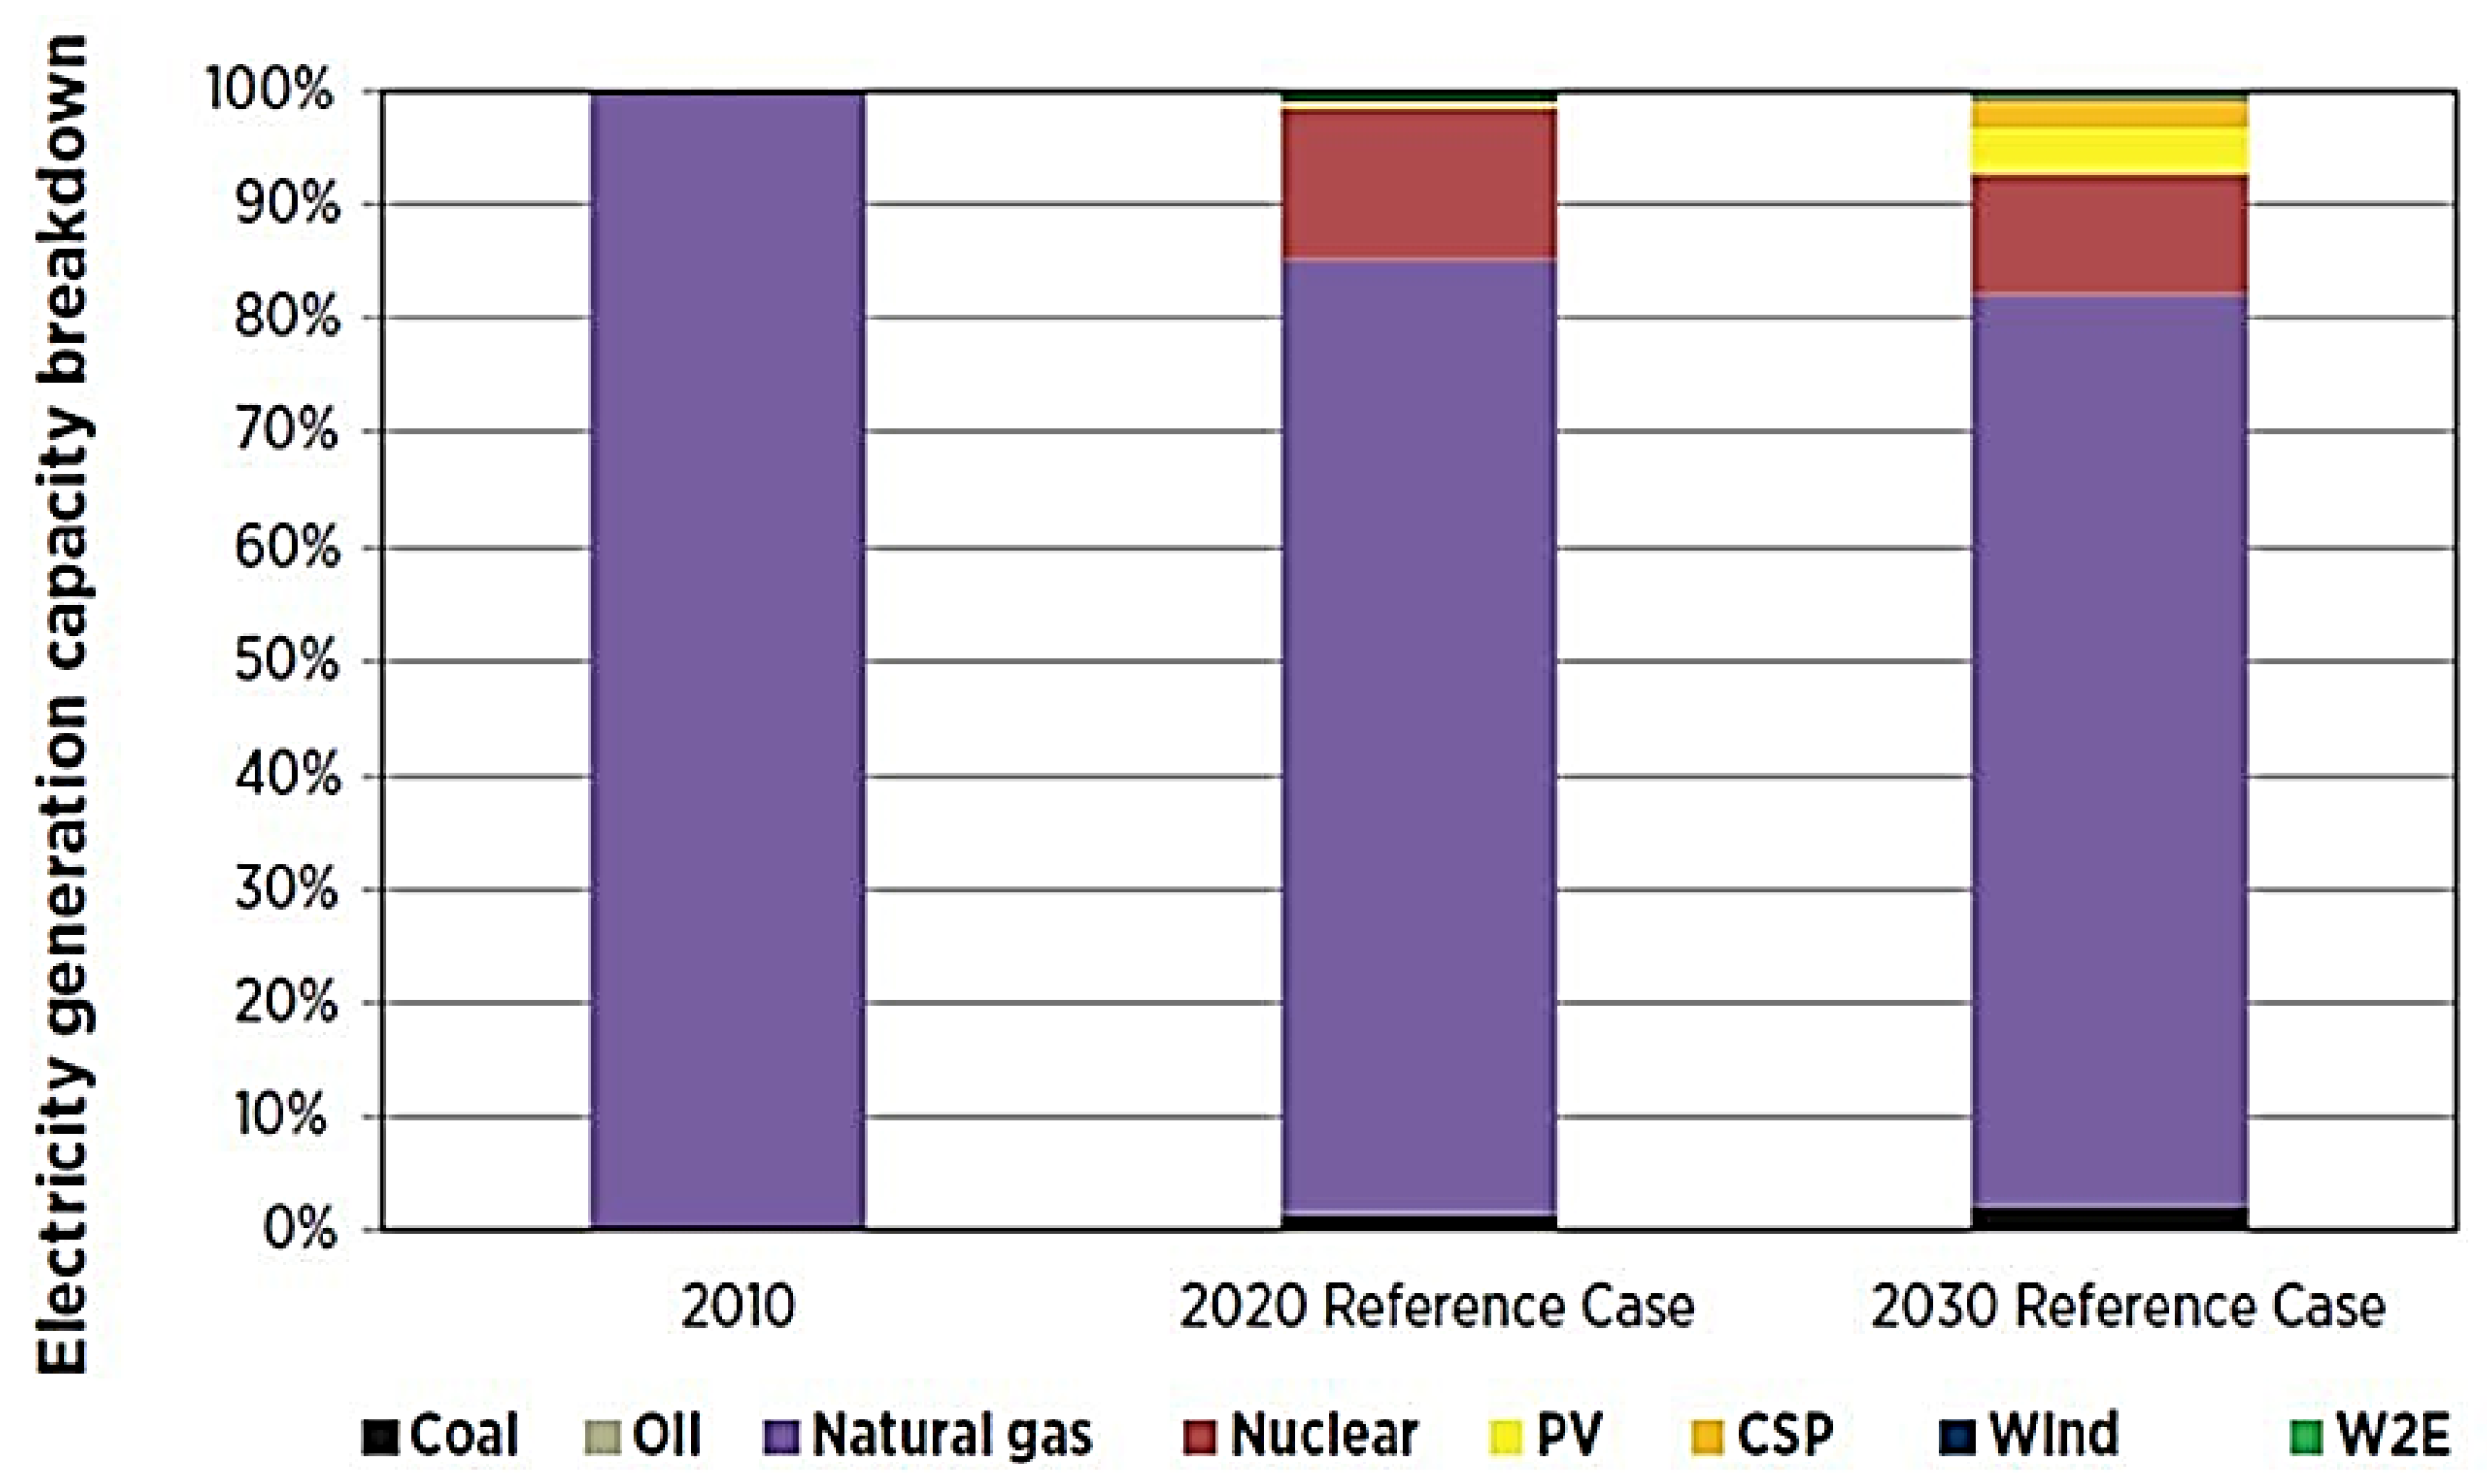
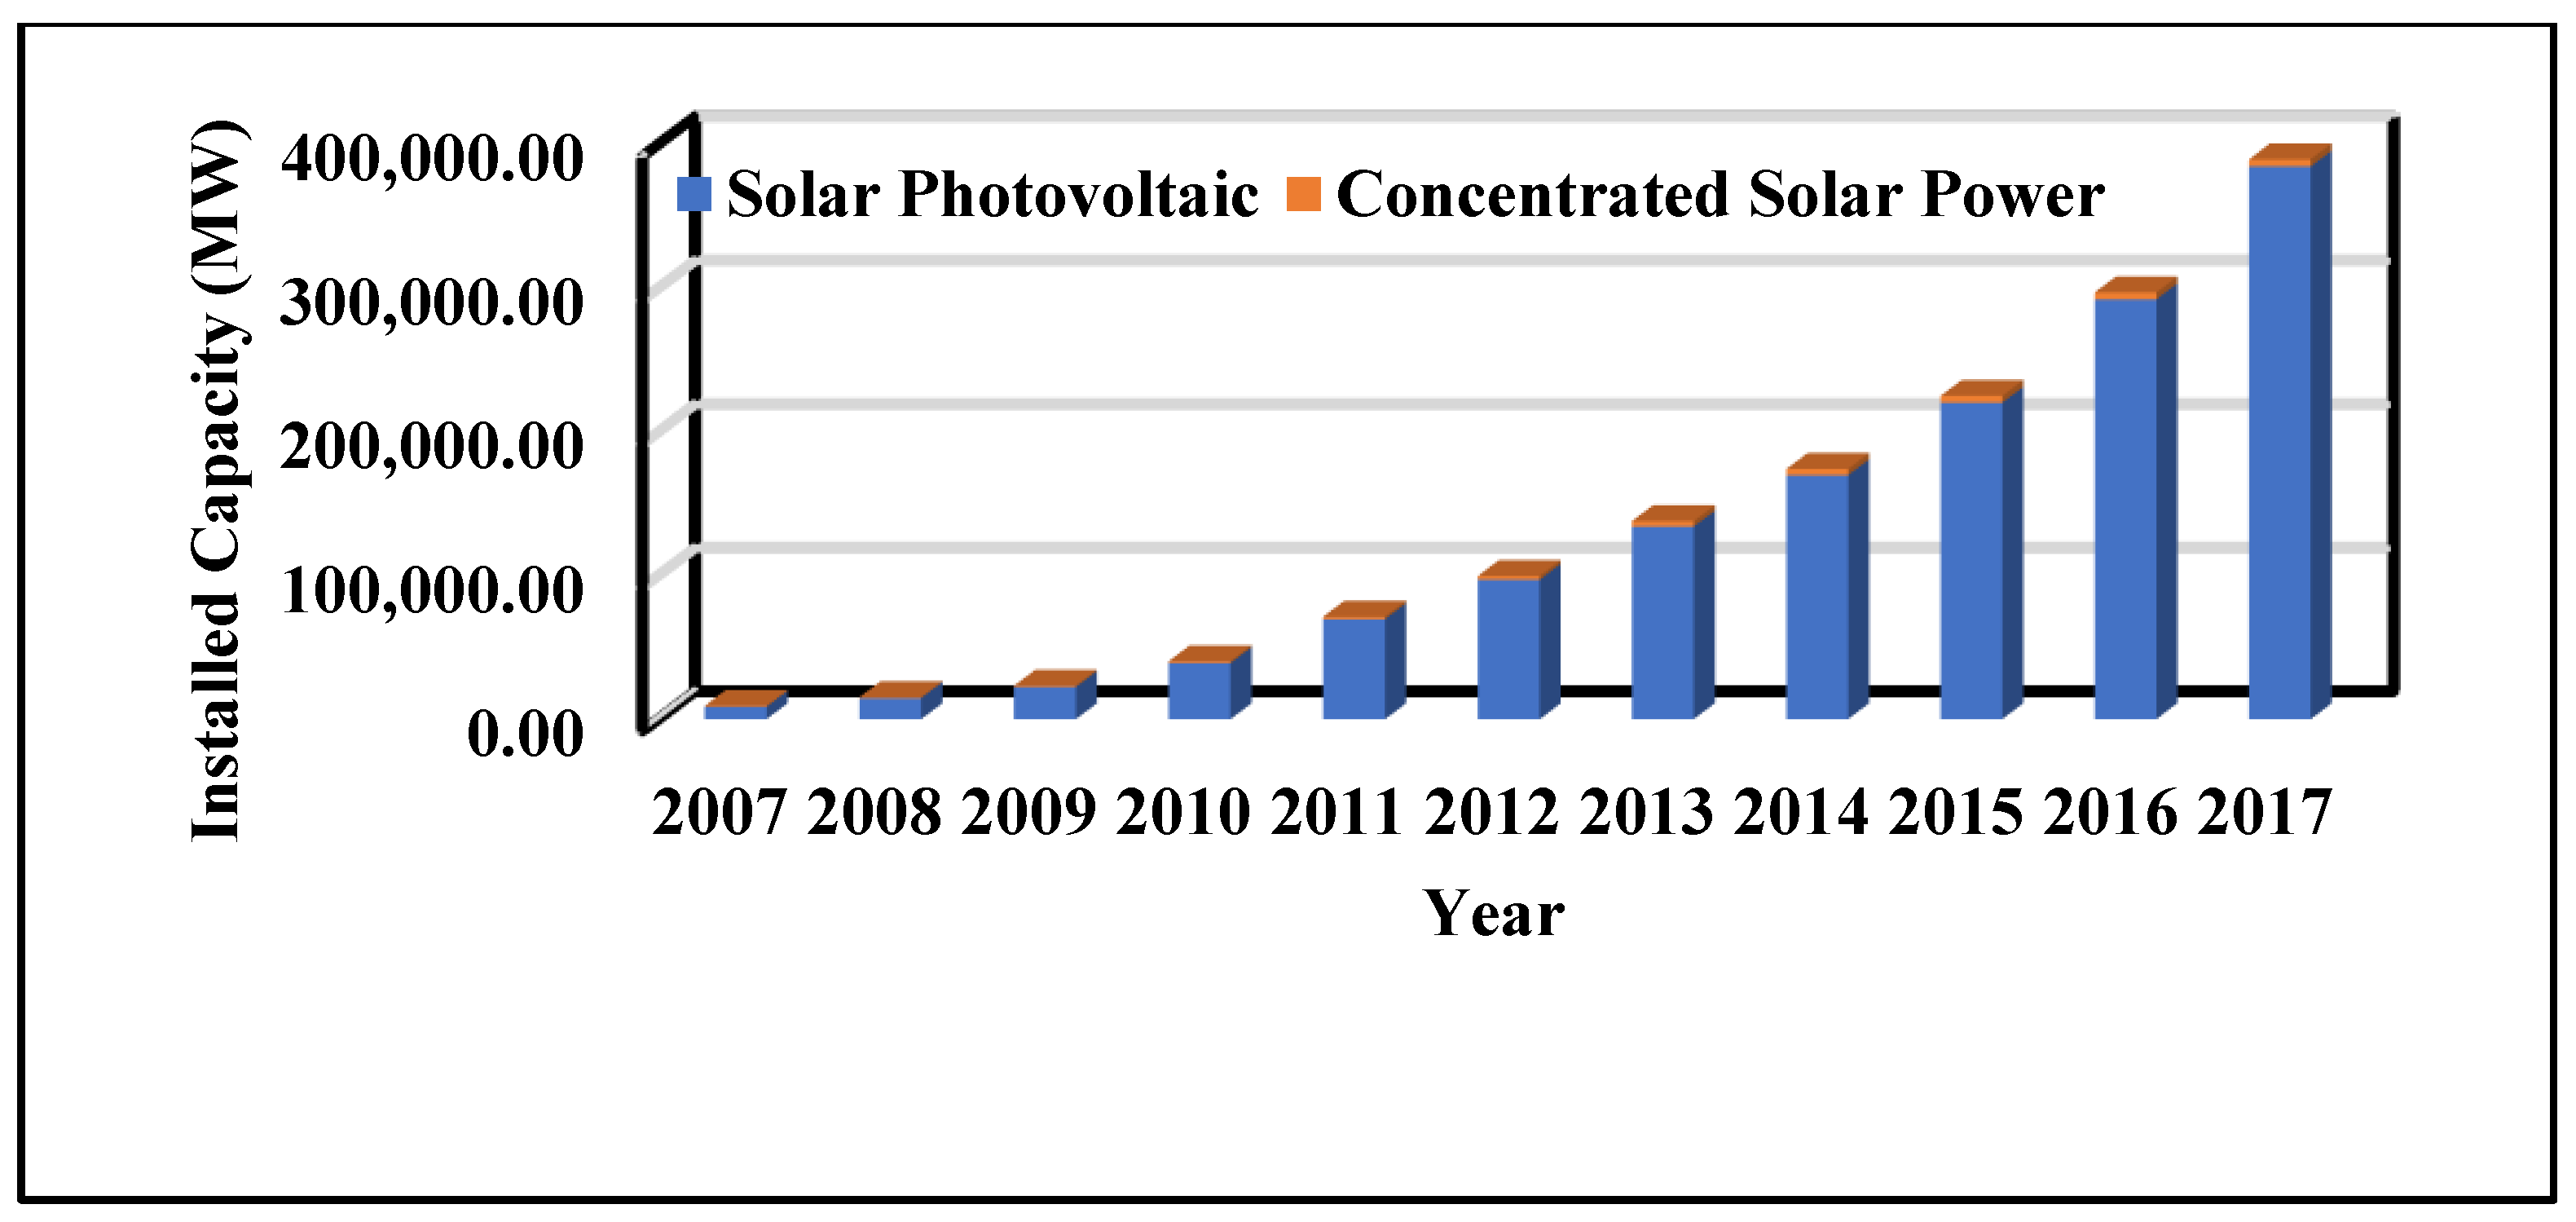
The UAE’s energy consumption is rapidly growing. Figure 7 depicts that a total electrical energy consumption in GWh of around 131,442 was consumed by the year 2019. This is mainly due to an increase in population growth, demand for water desalination facilities, rapid industrialization, and economic diversification from an oil-based economy. As shown in Figure 1, around 9,541,615 people are living in the country in the year 2018. To meet such energy requirements in the UAE, two primary sources are used: fossil fuels, such as oil and natural gas, as well as alternatives, such as coal and renewable solar power energy [53,54,55]. The UAE has generated electricity in the amount of 98 TWh. However, 99% and 1% of electricity has been produced from natural gas and oil resources, which are cost-effective but lead to polluting the environment, particularly through CO2 generation and other greenhouse gases [55]. In the UAE, more than 90% of total greenhouse emissions (GHG) are attributed to the energy sector [56,57]. Figure 8 depicts the total CO2 emissions from energy use. In 2017, about 267.35 million metric tons of CO2 have been produced [58]. As a result, this causes several environmental concerns, including global warming and climate change, as well as melting ice and sea-level rising. In Figure 9, it is clear that fossil fuel consumption was reduced to 99.81% in 2014 from 100% in 1971, and it may be further reduced in coming years. As a result, the UAE government is taking many initiatives to expand the usage of renewable energy sources. Figure 10 depicts the referred growth rate of renewable energy capacity in the UAE. In the year 2030 reference scenario, a considerable rise in solar power was observed from solar PV, demonstrating its potential trend toward meeting renewable energy demands [59]. PV technology is continually advancing to generate more electricity to suit the needs of UAE residents. Figure 11 depicts developments in renewable energy in the UAE (installed capacity). The development of innovative technologies, such as evacuated tube collectors, focusing, and traction, resulted in significant growth: 389,572 MW in 2017 from 9191 MW in 2007 [60,61].
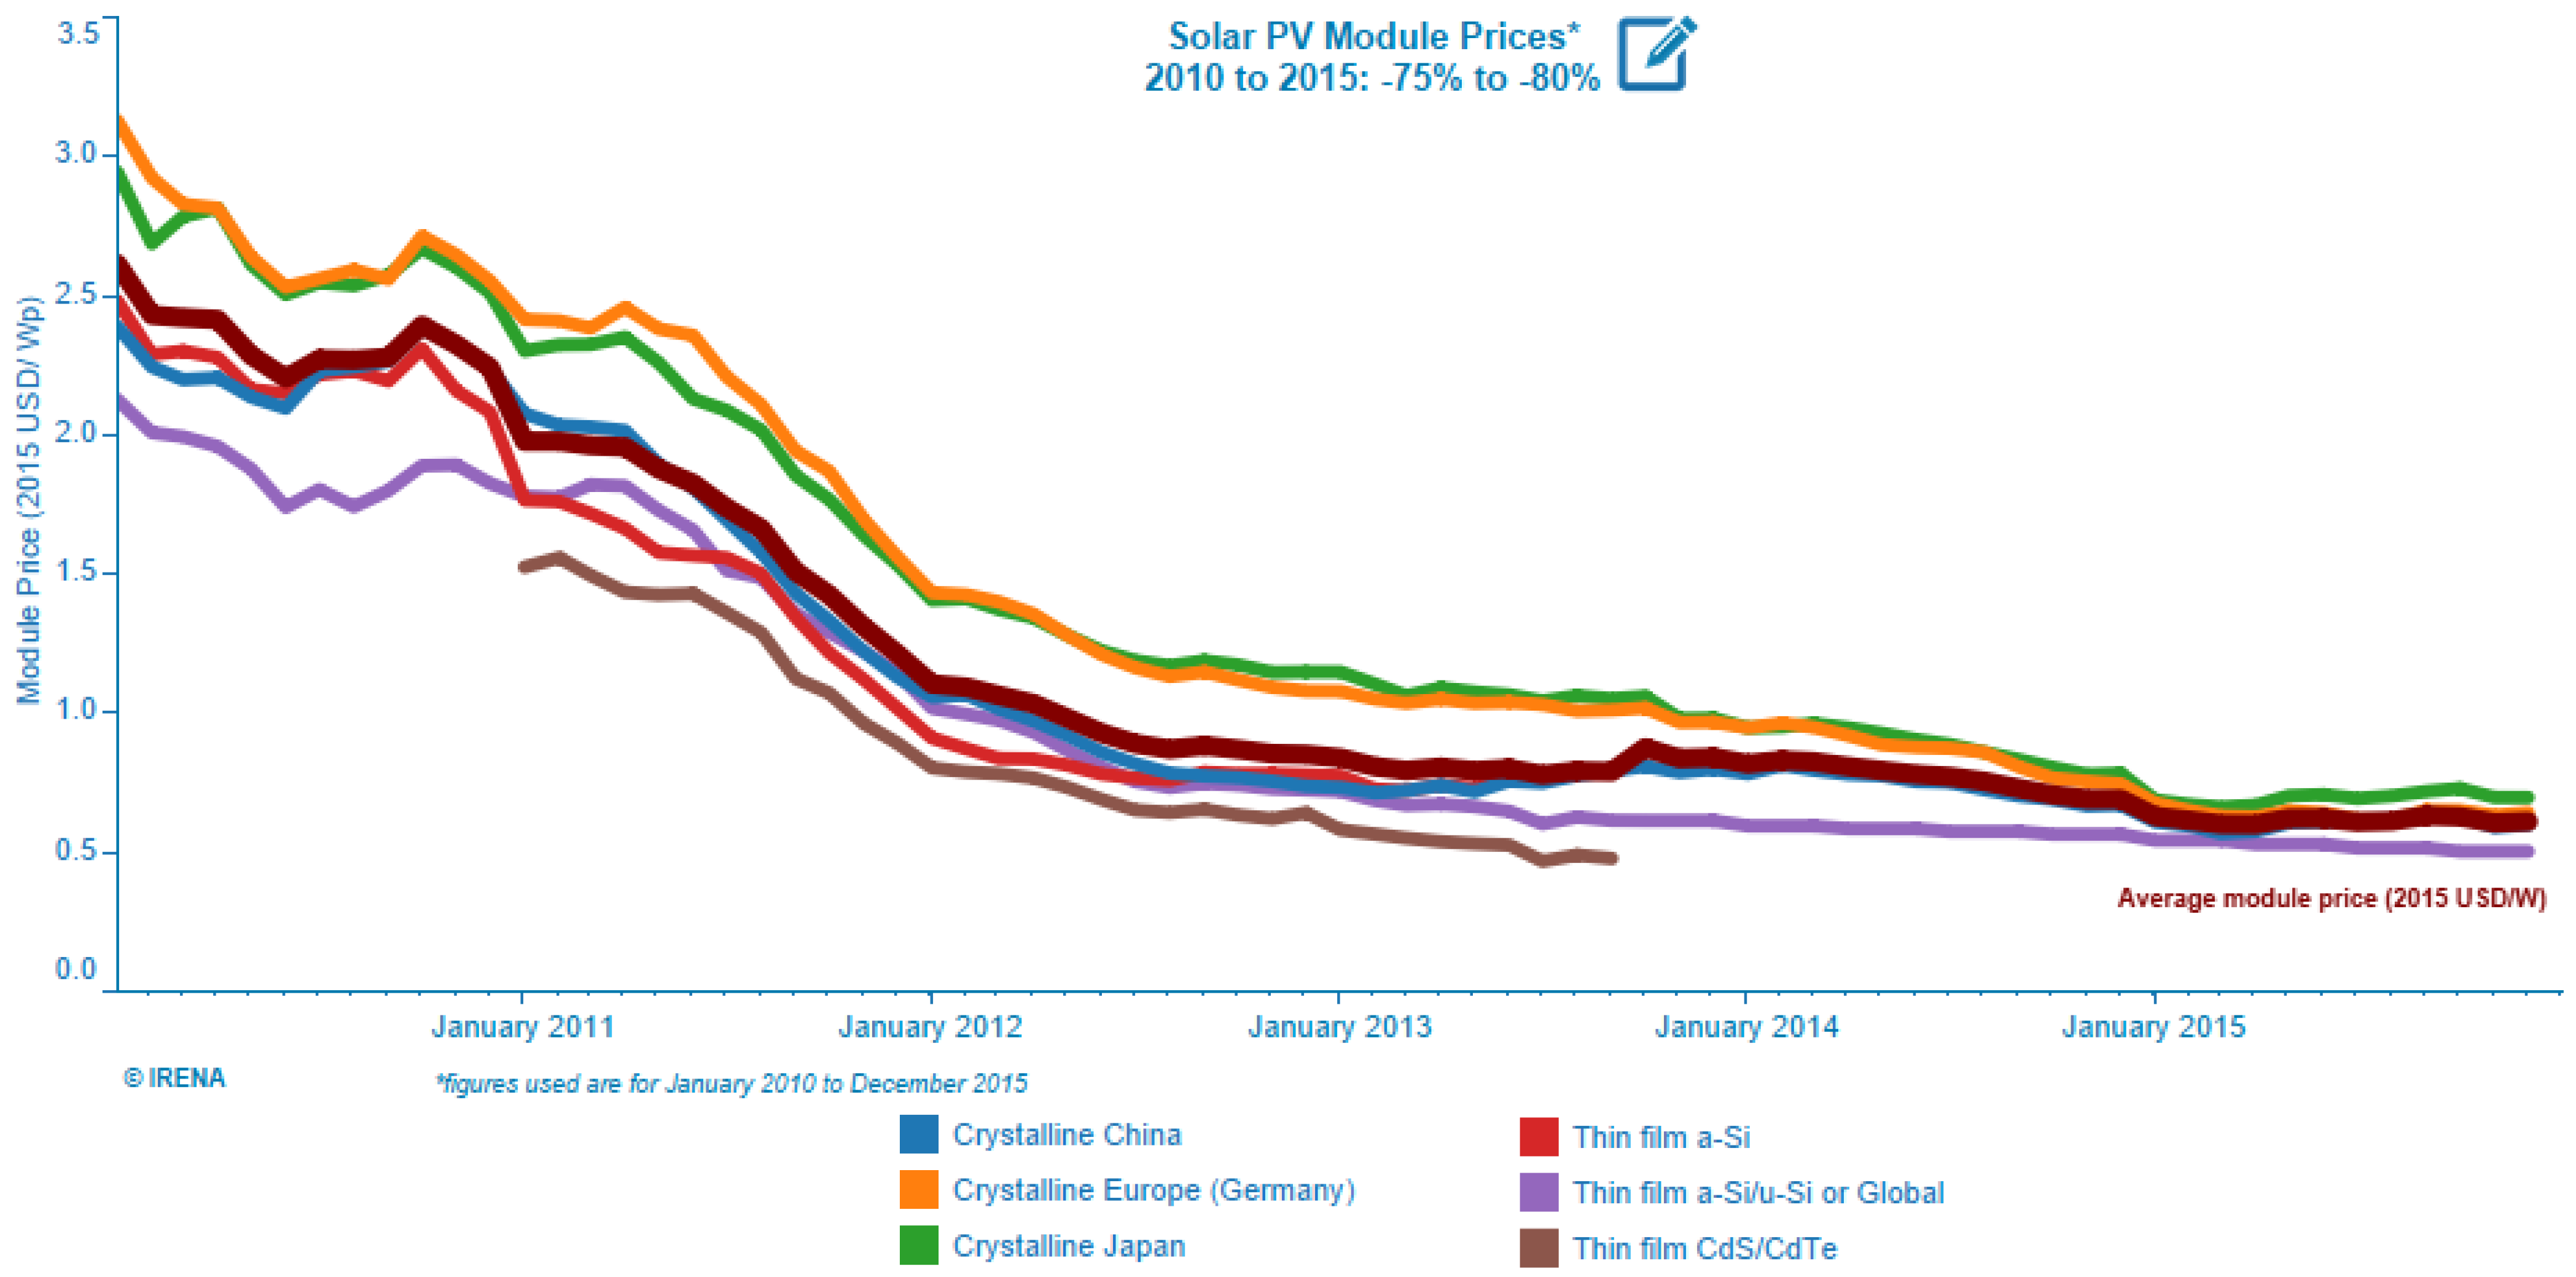
Solar cell production used to be a challenge, owing to its low cost-effectiveness. Many studies have been conducted to minimize such production costs to produce better PV systems [66]. Figure 12 depicts the pricing of solar PV modules in USD per watt from 2010 to 2015. Silicon technology is popular in solar cell design due to its efficiency and suitability. The cost for solar cell manufacturing was reduced from 1.525 USD/Wp in the year 2011 to 0.478 USD/Wp in the year 2013 for thin-film CdS/CdTe; the price of crystalline material (manufactured from Japan) was reduced to 0.697 USD/Wp in the year 2015 from 2.944 USD/Wp in the year 2010; the price of the thin-film a-Si/u-Si module was reduced from 2.127 to 0.503 USD/Wp between 2010–2015; the price of crystalline material (manufactured from Germany) was reduced from 3.129–0.643 USD/Wp between 2010–2015; and the price of crystalline material (sourced from China) was reduced to 0.599 from 2.389 USD/Wp between 2010–2015. All of this is attributable to the PV sector’s implementation of cutting-edge technologies. Furthermore, the solar thermal sector is rapidly expanding. Various collectors are used to capture sunlight in order to create heat with the least amount of loss, which makes them ideal for creating job opportunities in the renewable energy sector. This shows that it is critical to identify the future roles of various energy sources and to explain the actions necessary to transition to a sustainable future energy system.
4. Electricity Production and Consumption from Seven Emirates of the UAE
- DoE: Department of Energy (previously known as ADWEA-Abu Dhabi Water and Electricity Authority), under the Emirate of Abu Dhabi;
- DEWA: Dubai Electricity and Water Authority, under the Emirate of Dubai;
- SEWGA: Sharjah Electricity Water & Gas Authority, under the Emirate of Sharjah;
- EWE: Etihad Water and Electricity Authority (previously known as the Federal Electricity and Water Authority, FEWA), under the Emirates of Ajman, Fujairah, Ras Al Khaimah, and Umm Al Quwain.
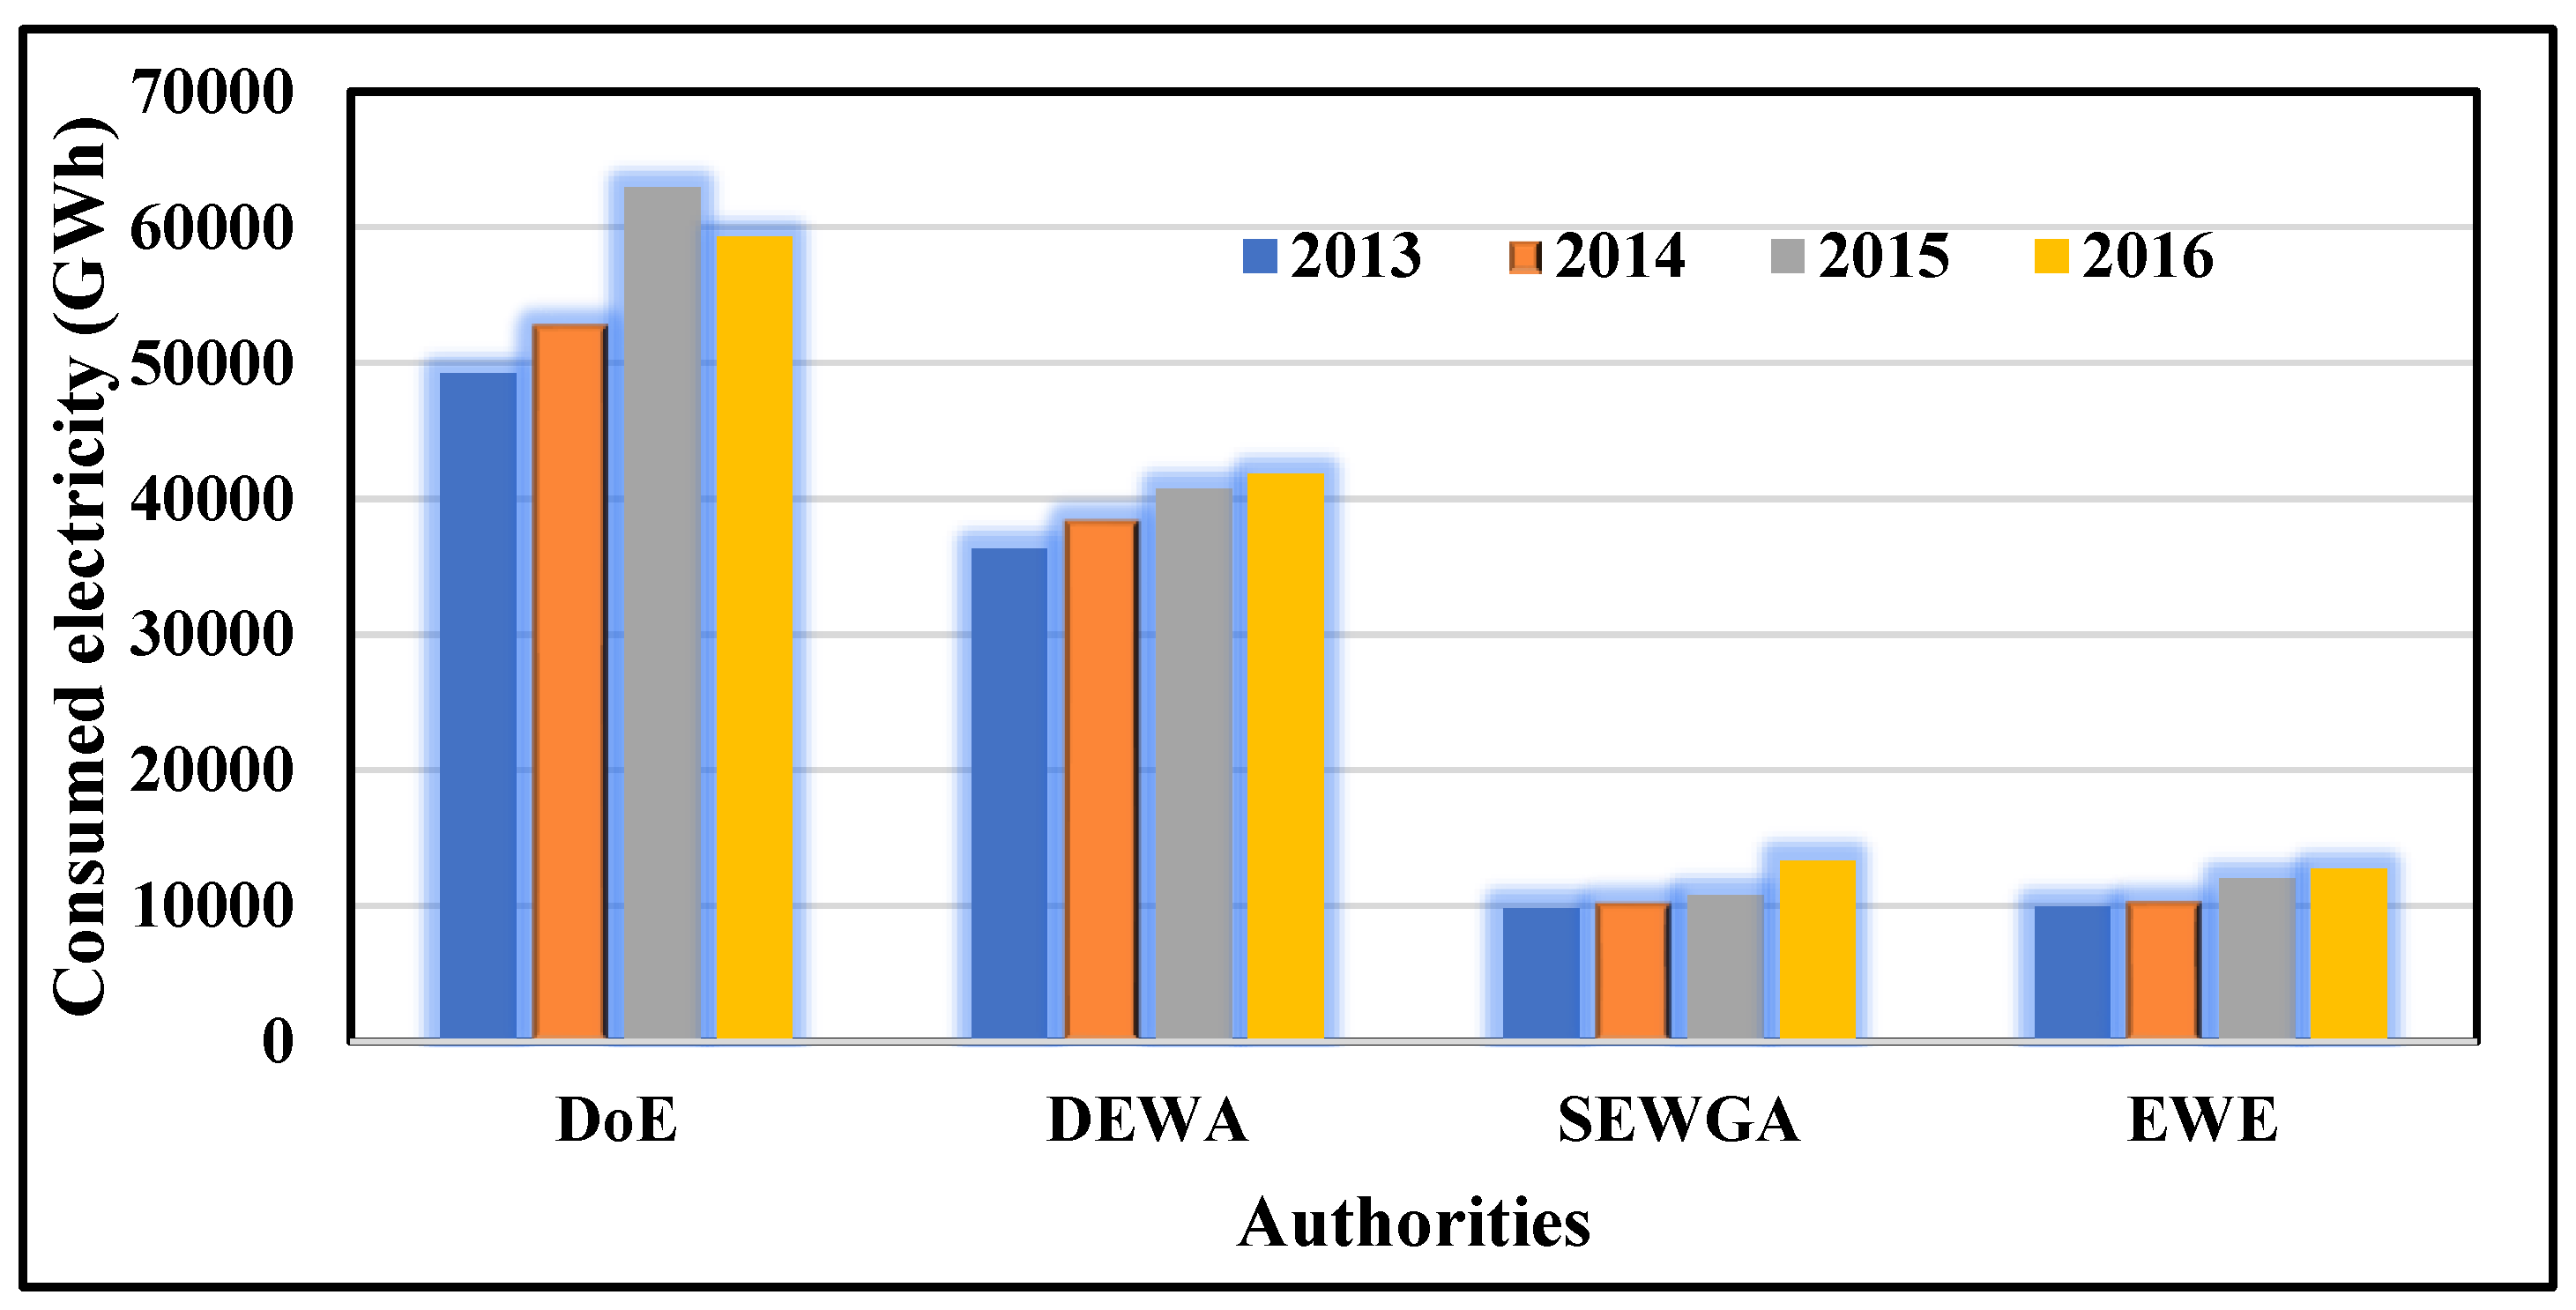
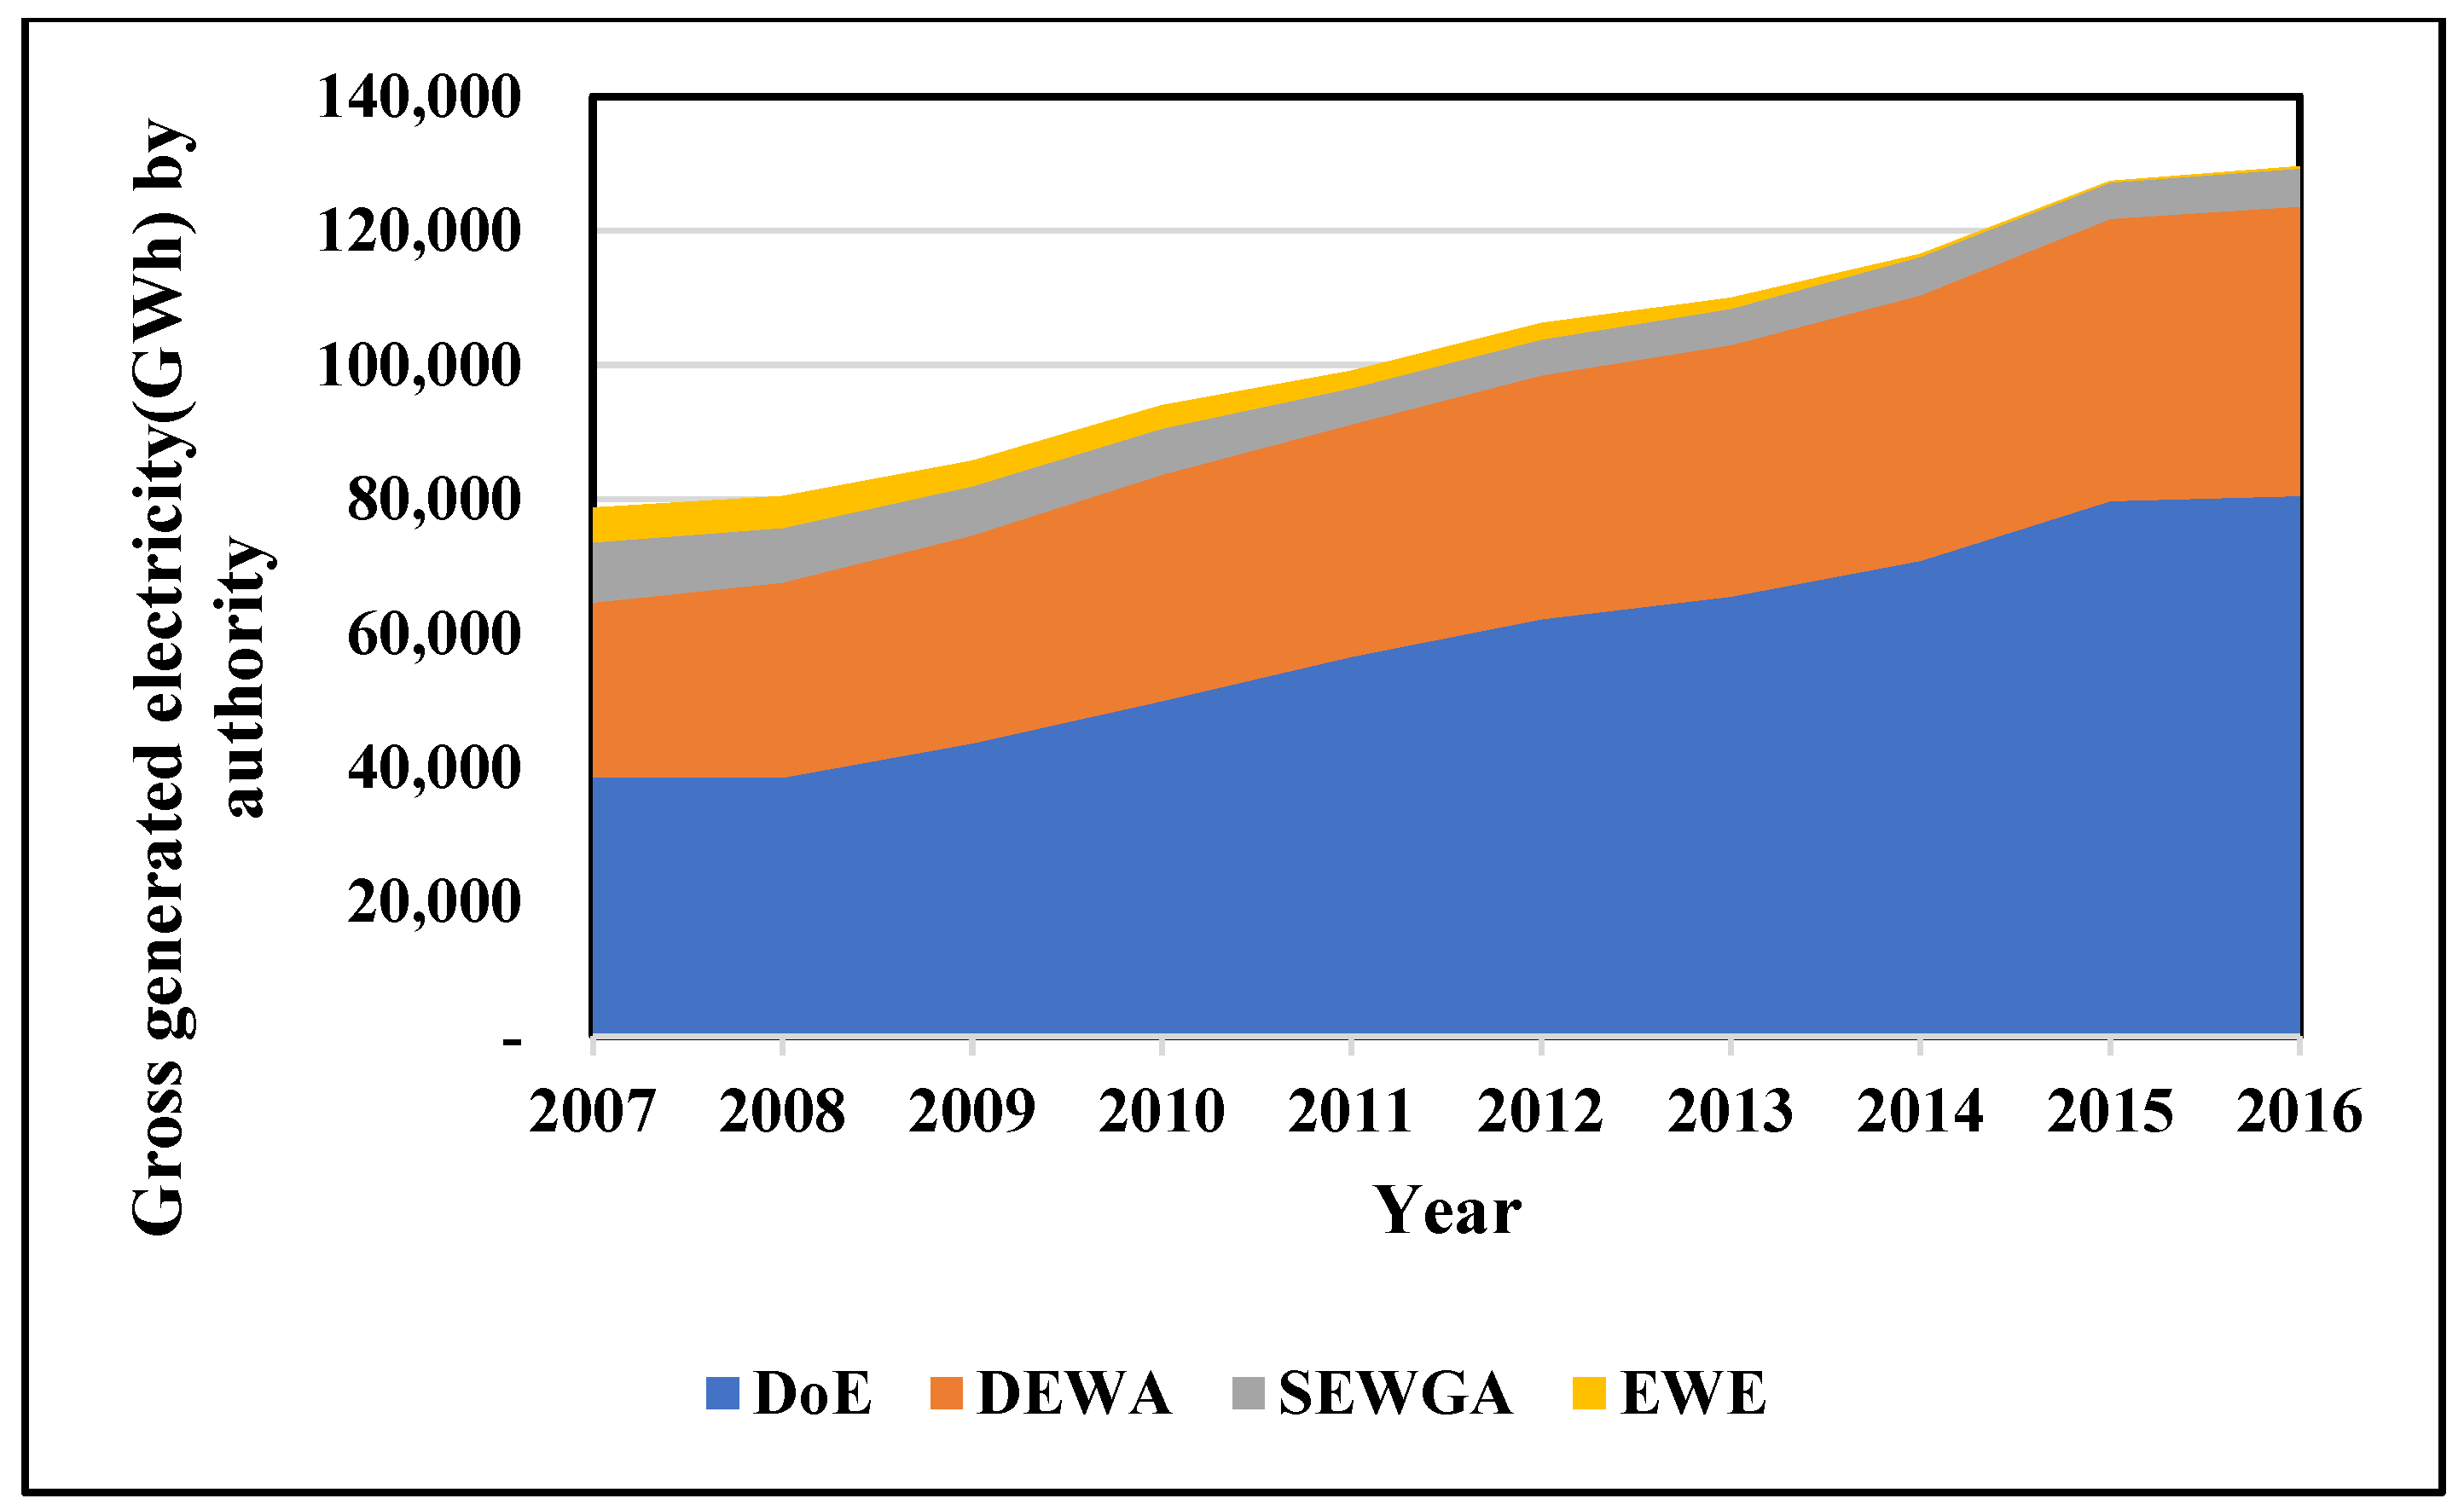
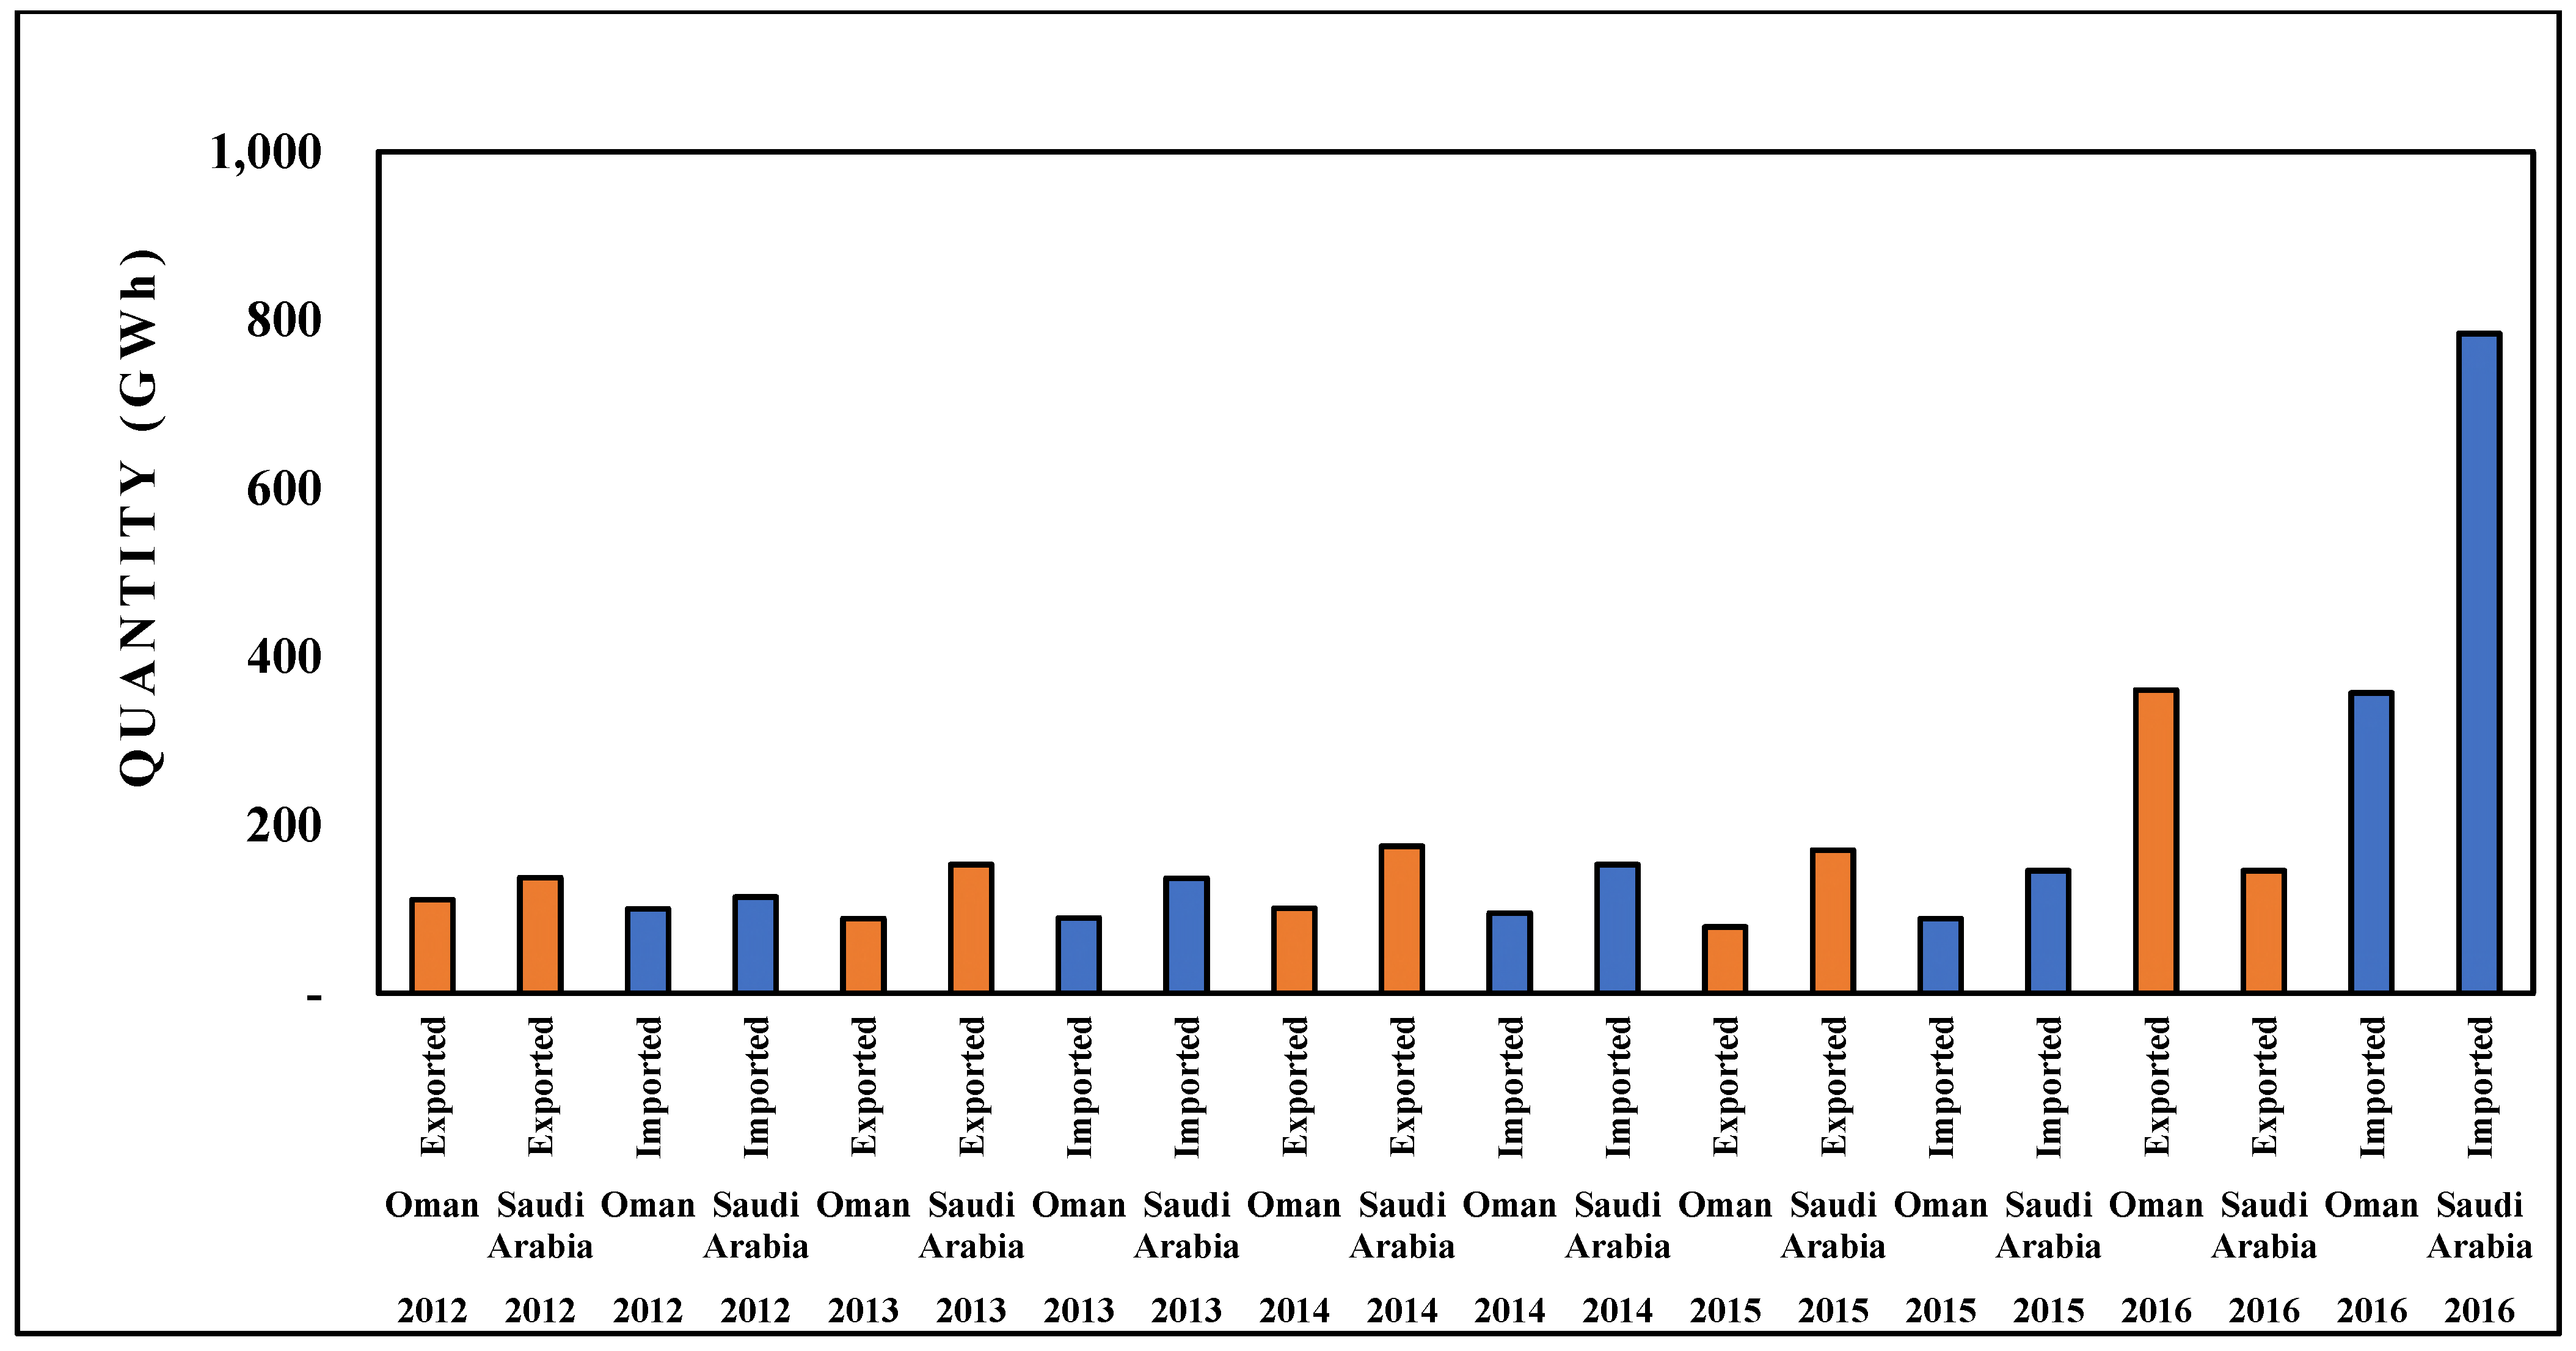
Each utility has its own rate structure, planning, and investment processes [72,73,74,75]. Electricity consumption for each authority from 2013 to 2016 is shown in Figure 13. The DoE authority has the highest consumption of electricity with around 224,372 GWh, i.e., 47.6%, followed by 157,244 GWh for DEWA (33.4%), 44,153 GWh for SEWGA (9.4%), and 45,063 GWh for EWE (9.6%) [76,77]. Figure 14 shows the electricity capacity (MW) of these four authorities from 2007 to 2016. It is clearly shown that electricity capacity increased from 2007 to 2016 due to an increase in demand for electricity. DoE has a 129,056 MW capacity, i.e., 51.8%, followed by 83,817 MW for DEWA (33.7%), 26,451 MW for SEWGA (10.6%), and 9411 MW for EWE (3.8%). Moreover, these four emirates authorities have increased their capacity to 28,761 MW in 2016 from 17,700 MW in 2007. Figure 15 shows the gross generated electricity by each authority from 2007–2016 [78]. Only the DoE and DEWA authorities have increased their gross generated electricity, from 38,592 GWh (2007) to 80,527 GWh (2016) and 26,030 GWh (2007) to 43,091 GWh (2016), respectively, whereas SEWGA and EWE have reduced gross electricity generation from 8968 GWh (2007) to GWh 5684 (2016) and 5171 GWh (2007) to 292.54 GWh (2016), respectively, which is due to less investment in the electricity sector. DoE has a gross generated electricity of 586,099 GWh, i.e., 57.1%, followed by 352,951.95 GWh for DEWA (34.4%), 64,241.86 GWh for SEWGA (6.3%), and 24,405.14 GWh for EWE (2.4%) [79,80]. Figure 16 shows the import–export electricity quantity by country from 2012 to 2016.
Hence, in the recent decade, the UAE’s energy power generation and consumption from these authorities have expanded considerably. This electricity has mostly been produced by natural gas-fired power stations in the UAE, which pollute the environment, particularly in terms of CO2 emissions and other greenhouse gases. This situation is projected to improve in the next few years. To avoid this, governments, businesses, and the general public must acknowledge that the prioritization of climate change problems as a top priority in economic and social growth processes is inescapable. As a result, the UAE government must encourage a diverse energy mix in which electricity may be generated from all traditional energy sources, including sustainable energy, nuclear, and coal power.
Electricity Tariffs from Authorities
Electricity pricing ranges greatly among the administrations of these four emirates, including within sectors such as residential, commercial, industrial, agriculture, and between UAE residents and expats. For example, in the Abu Dhabi emirate, the rate of electricity in fils/kWh (1 fil = 0.027 USD) increased slightly from 2016 to 2017. For residential customers-expats it is 21–26.8 fils, for residential customers-UAE nationals it is 5.5–6.7 fils, for the agriculture class, including ranches, it is 3–4.5 fils, for fisheries and livestock it is 16–20 fils, and for industrial consumers it is 16–28.6 fils (below 1 MW) [82,83,84]. In general, the formula below is used to calculate electricity consumption based on the authorities provided below,
where E refers to the kilowatt per hour (kWh) or measured joules, P refers to power used per unit in watts, and t refers to the time over which the power is consumed.
E = P × (t/100)
Table 1 represents the DoE electricity tariff by slab rate sector in 2016. It shows that electricity tariffs vary based on sector, nationality, unit type, slab rate, and category. Table 2 lists the electricity tariffs of the DEWA, SEWGA, and EWE authorities’ slab rate sectors in 2016. It shows that electricity tariffs vary concerning authority, sector, nationality, and slab rate.
Power pricing in Dubai and the northern emirates is based on a slab system (i.e., higher rates for higher consumption levels). The minimum consumption category (<2000 kWh/month) for residential and business customers in Dubai is 23 fils/kWh, while the maximum (>6000 kWh/month) is 38 fils per kWh. In some cases, Liquefied Natural Gas (LNG) tax (5%) is also applied. The UAE is an LNG importer. LNG imports in the GCC states began in 2009 as a stopgap measure to help meet seasonal demand peaks, but have since become a more consistent feature of yearly demand. Using the identical usage categories, residential and business prices in the northern emirates begin at 20 fils per kWh and peak at 33 fils per kWh. For industrial customers, the northern emirates pay a fixed rate of 40 fils per kWh; however, Dubai offers two categories (below and above 10,000 kWh/month) at 23 and 38 fils per kWh. In early 2015, the northern emirates’ tariffs were raised by 5 fils per kWh. In Sharjah, regardless of consumption, residential users pay 30 fils/kWh and industrial consumers pay 40 fils/kWh. Commercial customers using less than 10,000 kWh/month are charged 30 fils per kWh, while those using more than 10,000 fils/kWh are charged 35 fils/kWh (Ministry of Energy-UAE, MOENR, 2013).
Electricity pricing is affected by governmental incentive schemes and regulations, domestic economic fuel prices, and local weather. The price of electricity in the UAE varies between emirates as well as between expatriates and citizens. Electricity prices in the UAE have been reformed numerous times. Their impact on the country’s citizens has been limited, but they have had a greater impact on expatriates. While the distribution of electricity prices for Dubai and Sharjah is based on monthly consumption slabs, the prices in Abu Dhabi vary depending on housing type (villa or apartment), with the segments based on daily levels of consumption. The emirates of Dubai and Abu Dhabi have relatively high commercial and industrial activity [86,87,88]. To satisfy demand, DoE also exports power to neighboring emirates [89]. These four organizations work to fulfill a need that is increasing at the same rate as the population. Electricity consumption is related to the high cooling load required to maintain thermal comfort in the UAE [90].
5. Solar Energy Projects in the UAE
In this section of the study, we focused on major and minor solar energy projects in all emirates of the UAE. Then, we covered sponsored solar energy projects outside of the UAE. The main aim of all solar energy projects in the UAE is to reduce CO2 emissions and promote a greener environment and to provide electricity and cost-competitive tariffs for households.
5.1. Solar Energy Projects in the Dubai Emirate
This section investigates solar energy projects inside the Dubai emirate, UAE. For this, we found that some of the solar projects were already installed elsewhere and are expected to be complete by 2030. In this view, we presented the world’s biggest solar park in Dubai, i.e., the Sheikh Mohammed bin Rashid Al Maktoum project, which is compressed into five phases, depending on the electricity capacities that are produced. Then, we covered various rooftop solar projects inside the Dubai emirate, which include Etihad ESCO, Dubai’s mountainous Hatta region, the Mall of the Emirates, and the Dubai Solar Schools Program.
5.1.1. Sheikh Mohammed Bin Rashid Al Maktoum Solar Project
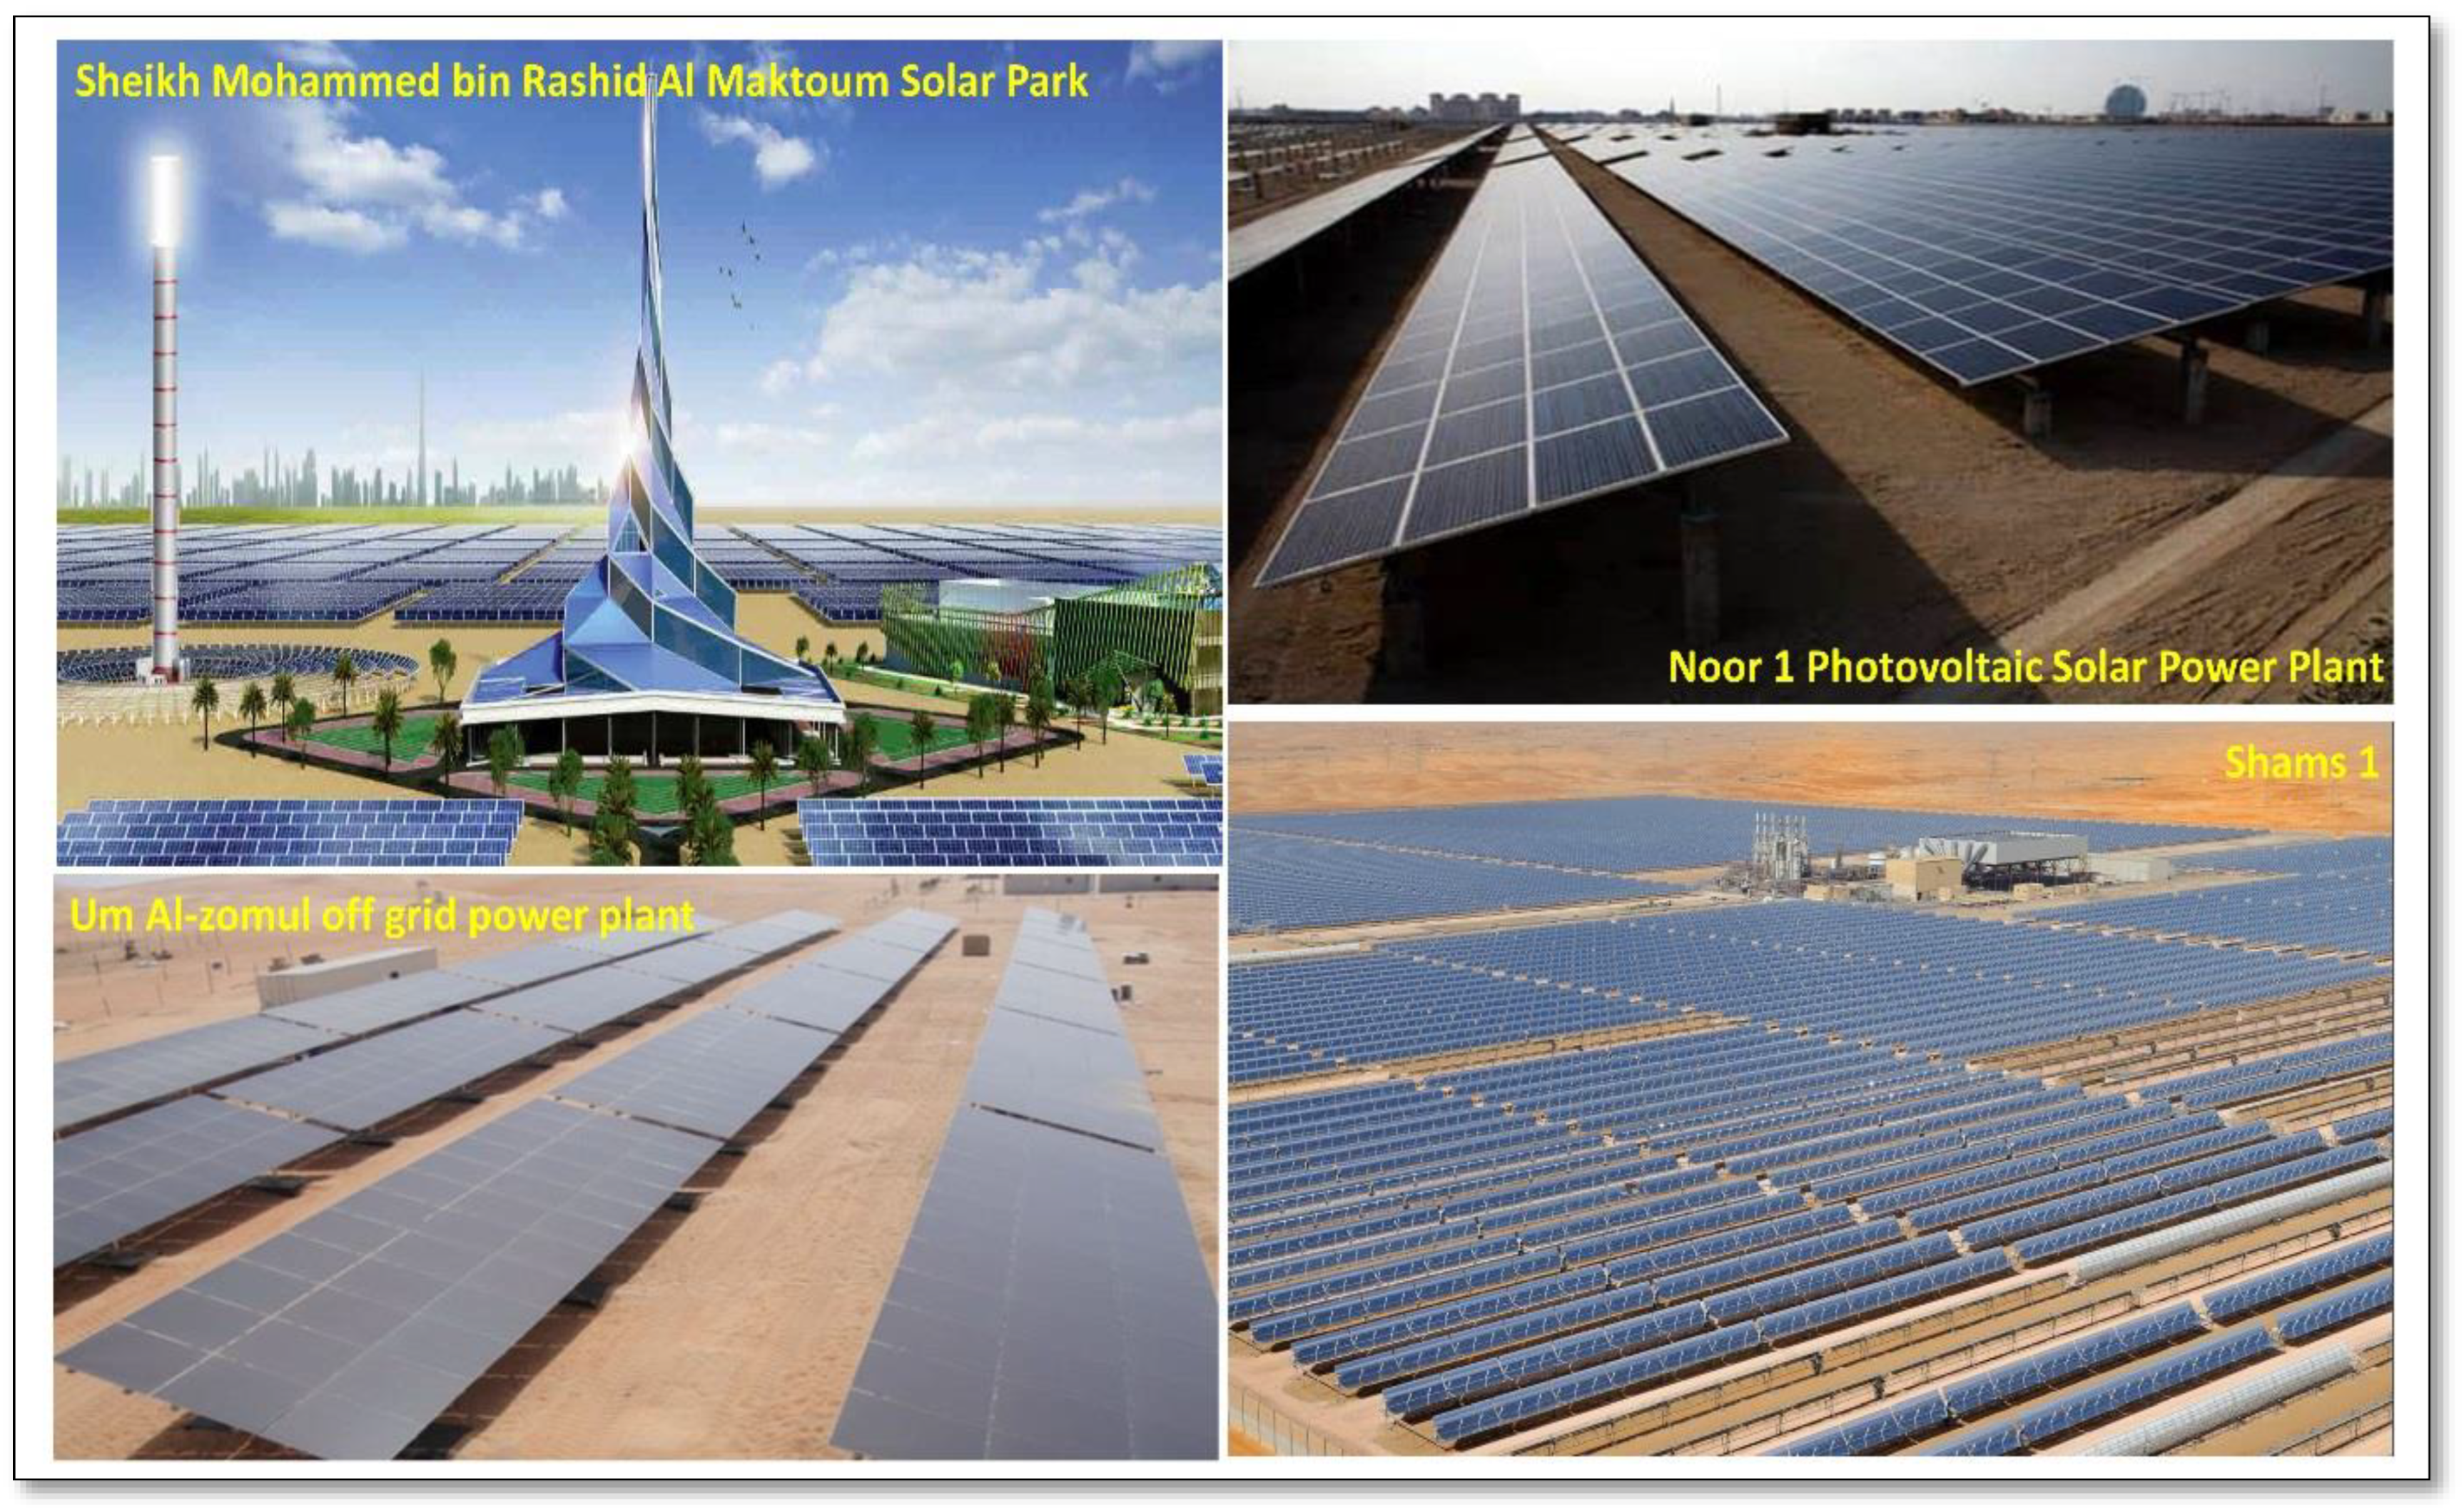
As seen in Figure 17, the Sheikh Mohammed bin Rashid Al Maktoum solar project is the world’s biggest solar park, with a total area of 77 km2 in Seih Al-Dahal, some 50 km2 south of Dubai. The project was constructed by the Dubai Electricity and Water Authority (DEWA). It has a planned production capacity of 5000 MW by 2030, with total contributions worth up to AED 50 billion (USD 13.6 bn). When completed, the solar project will save more than 6.5 M tones of CO2 each year [91]. To offer sustainable energy to Dubai’s people and residents, the solar park will employ a variety of PV and CSP technologies. It has an innovation center, testing facilities, a research and development center, and a solar-powered water desalination system. There are five stages of solar energy generation, as illustrated in Table 3.
Hence, these five phases of the Sheikh Mohammed bin Rashid Al Maktoum solar project make them useful and promising in supplying electricity to homes, schools, and public buildings, as well as to the industry/company needs of the project. The plant also reduces CO2 emissions in the UAE significantly. In addition, it concentrates on the solar thermal power (CSP) and photovoltaic (PV) technologies that are used to convert solar energy into electricity for this project.
5.1.2. Rooftop Solar Energy, Dubai
Recently, the Dubai emirate has announced the largest rooftop solar project in the UAE, which includes Etihad ESCO, with a capacity of 60 MW peak that will see photovoltaic (PV) panels installed on 640 villas in Dubai’s mountainous Hatta region. DP World is constructing the country’s largest distributed plant, with a total capacity of +20 MW peak with 51 rooftops and 4 parking garages. ALEC Energy Company is now constructing a 6.4 MW peak for Nabooda and a 6.5 MW peak rooftop for Emaar on the Dubai Hills, and Alsa Solar Systems has completed a 2 MW peak for the Mall of the Emirates, with four more MW pending in the MAF group in the UAE. Aramex, Pepsi, ABB, and the Al Tayer company have all declared rooftop ambitions as part of the Dubai Solar Schools Program [93,94,95].
The Sheikh Mohammed bin Rashid Al Maktoum solar project has generated more electricity than other projects. Additionally, the deployment of solar energy plants is impacted by the global market’s rising oil prices and lowering solar module prices. Furthermore, it was discovered that processes powered by solar parks have a lesser environmental effect in terms of CO2 emissions. The rooftop electricity power generation has been used successfully in the residential and commercial sectors, making building-integrated PV an appealing choice for widespread solar energy adoption. PV panels are currently planned to be installed directly on the exteriors of houses in order to save money on construction.
5.2. Solar Energy Projects in the Abu Dhabi Emirate
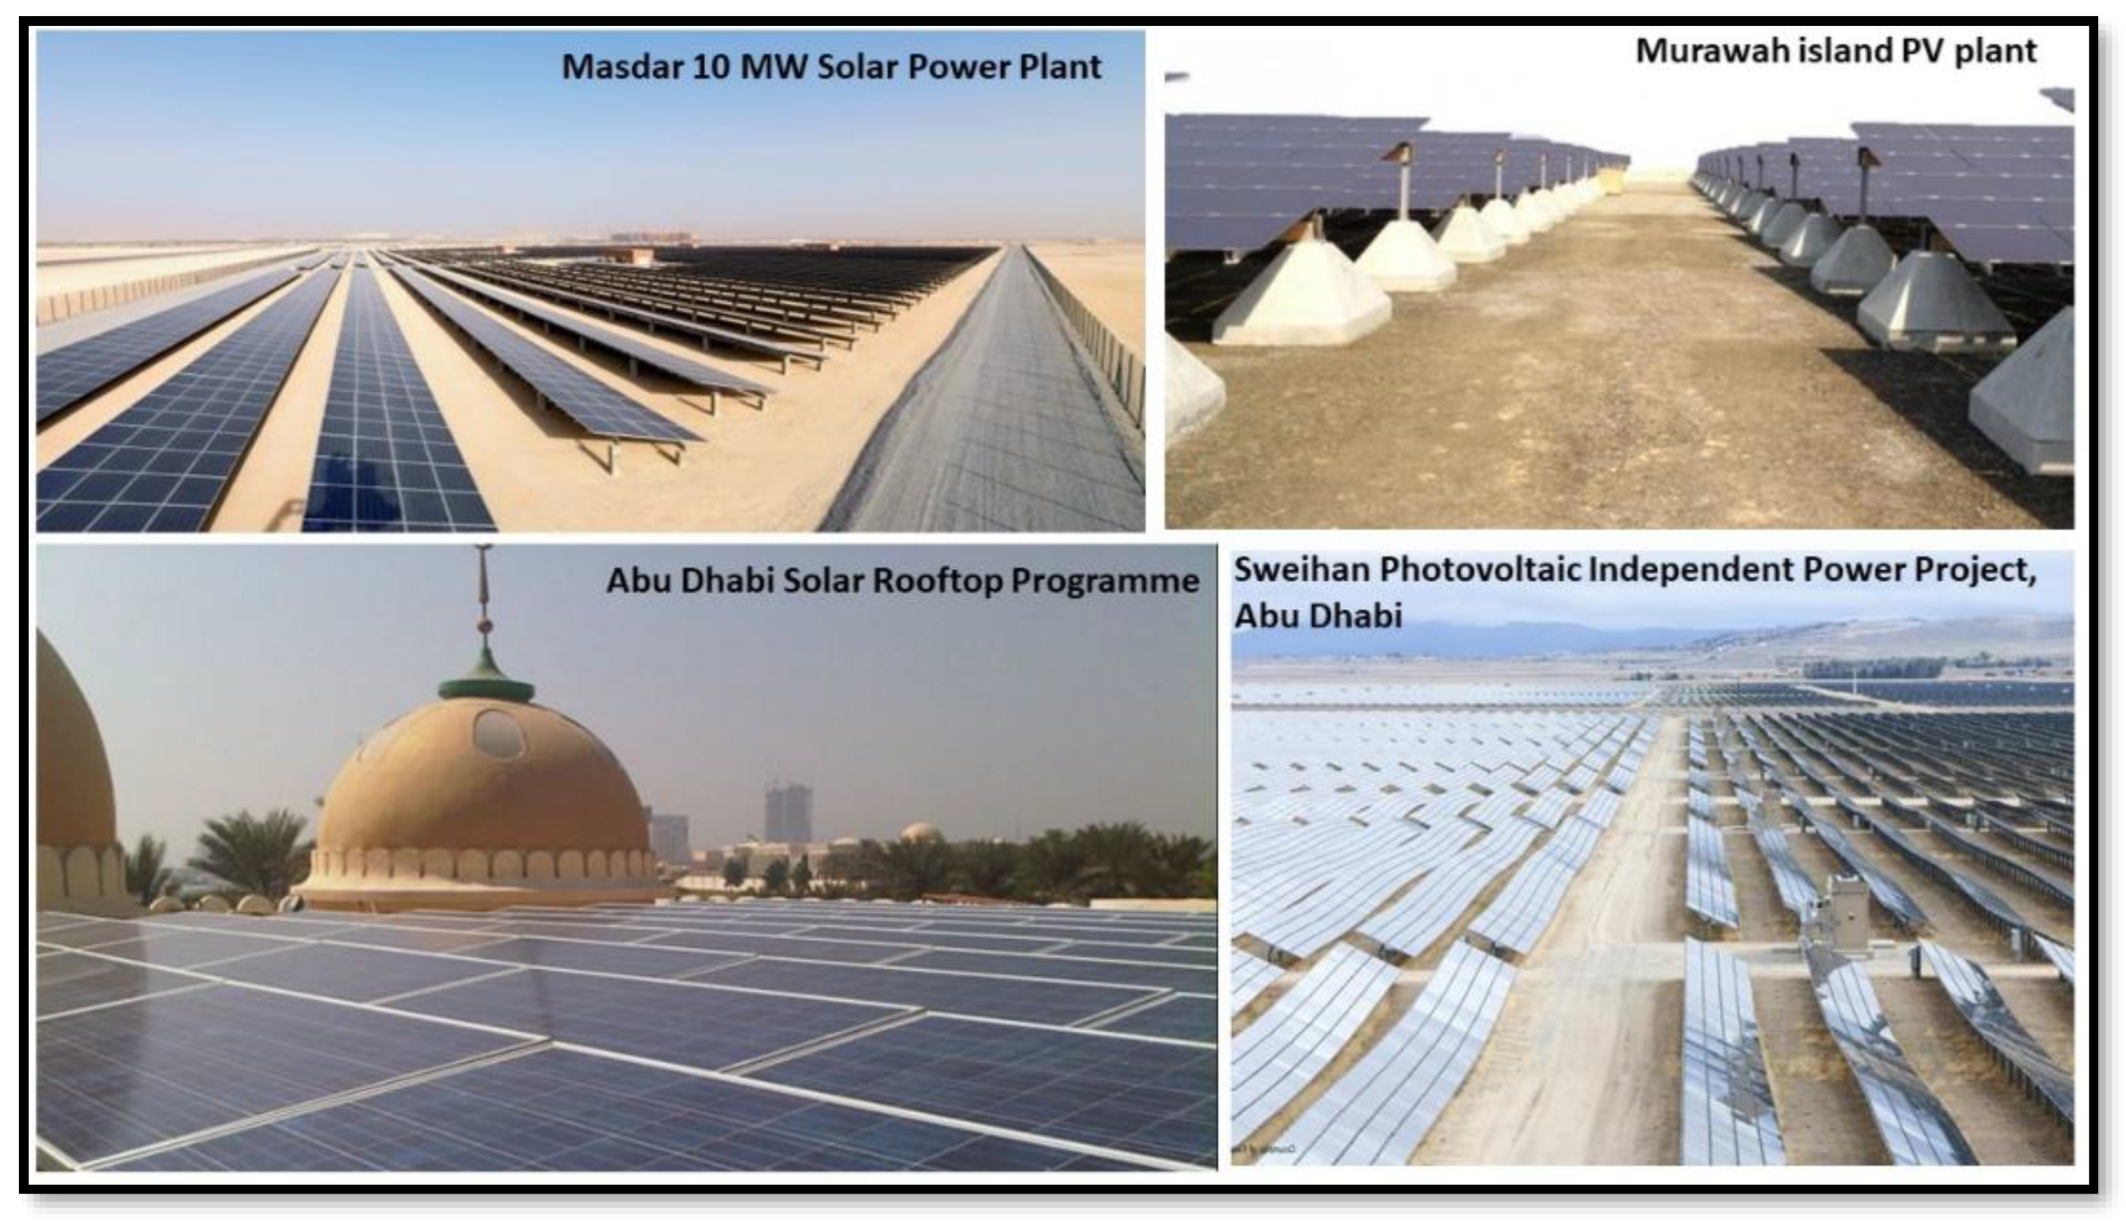
In this study, we focused on several solar energy projects installed inside the Abu Dhabi emirate, UAE. We investigated the projects in the following order: Solar PV Farm in Masdar City, Shams 1, Noor 1, Um Al Zomul off-grid, Murawah Island, Sweihan, and the Abu Dhabi solar rooftop project [65,96,97]. Each project has a different capacity of electricity that is produced, as illustrated in Figure 17 and Figure 18. The ultimate aim is to reduce CO2 emissions significantly when solar facilities are erected instead of gas-powered plants.
According to this study, when solar facilities are erected instead of gas-powered plants, CO2 emissions significantly decrease, and PV/CSP may play an important part in satisfying Abu Dhabi’s energy needs beyond 2020.
6. Other Small Solar Projects Inside the UAE
Masdar’s portfolio includes a variety of minor projects in addition to big projects, such as the Masdar City solar power and Shams 1 facilities. Solar-powered water wells, island grids, lighting, and sustainable agriculture are among them.
Here are some specifics regarding such projects:
- Al-Ain Diwan lighting efficiency: Replacing lights in Al Ain, UAE;
- Al Hayl Island, UAE: Fifteen hybrid systems with a peak capacity of 200 kW, powered by a battery, diesel generator, and a reverse osmosis package;
- Al-Jarnain: A solar power grid with a peak capacity of 750 kW on Al Jarnain Island in the United Arab Emirates;
- Al Wathba stables: A 120-kW on-grid solar photovoltaic plant;
- Omran hospital in Ras Al-Khaimah has a rooftop photovoltaic with a 450-kW peak and PV-powered streetlights;
- Sea Palace: A 200-kW on-grid photovoltaic electricity;
- Sustainable farm: Al Ain, UAE has an eight-acre sustainable farm;
- Concentrated PV pilot: Masdar City, UAE, 600-kilowatt peak grid.
As a result, these projects are currently concentrating on additional power generation to meet the rising electricity demand in these areas. They also help transform the UAE’s energy mix, leading to decreases in the nation’s carbon impact and supplying enough energy to residential houses. Furthermore, with such a large amount of PV energy, the UAE is believed to have the highest potential of any Gulf Cooperation Council member country (GCC).
7. International Solar Projects: Sponsored by the UAE
In this study, we also focused on 16 solar energy projects installed outside of the UAE. The UAE is largely involved in the PV sector, mainly through Abu Dhabi’s Masdar Program, by investing in solar projects [98]. Below are a few examples.
7.1. Masdar Special Projects, Egypt
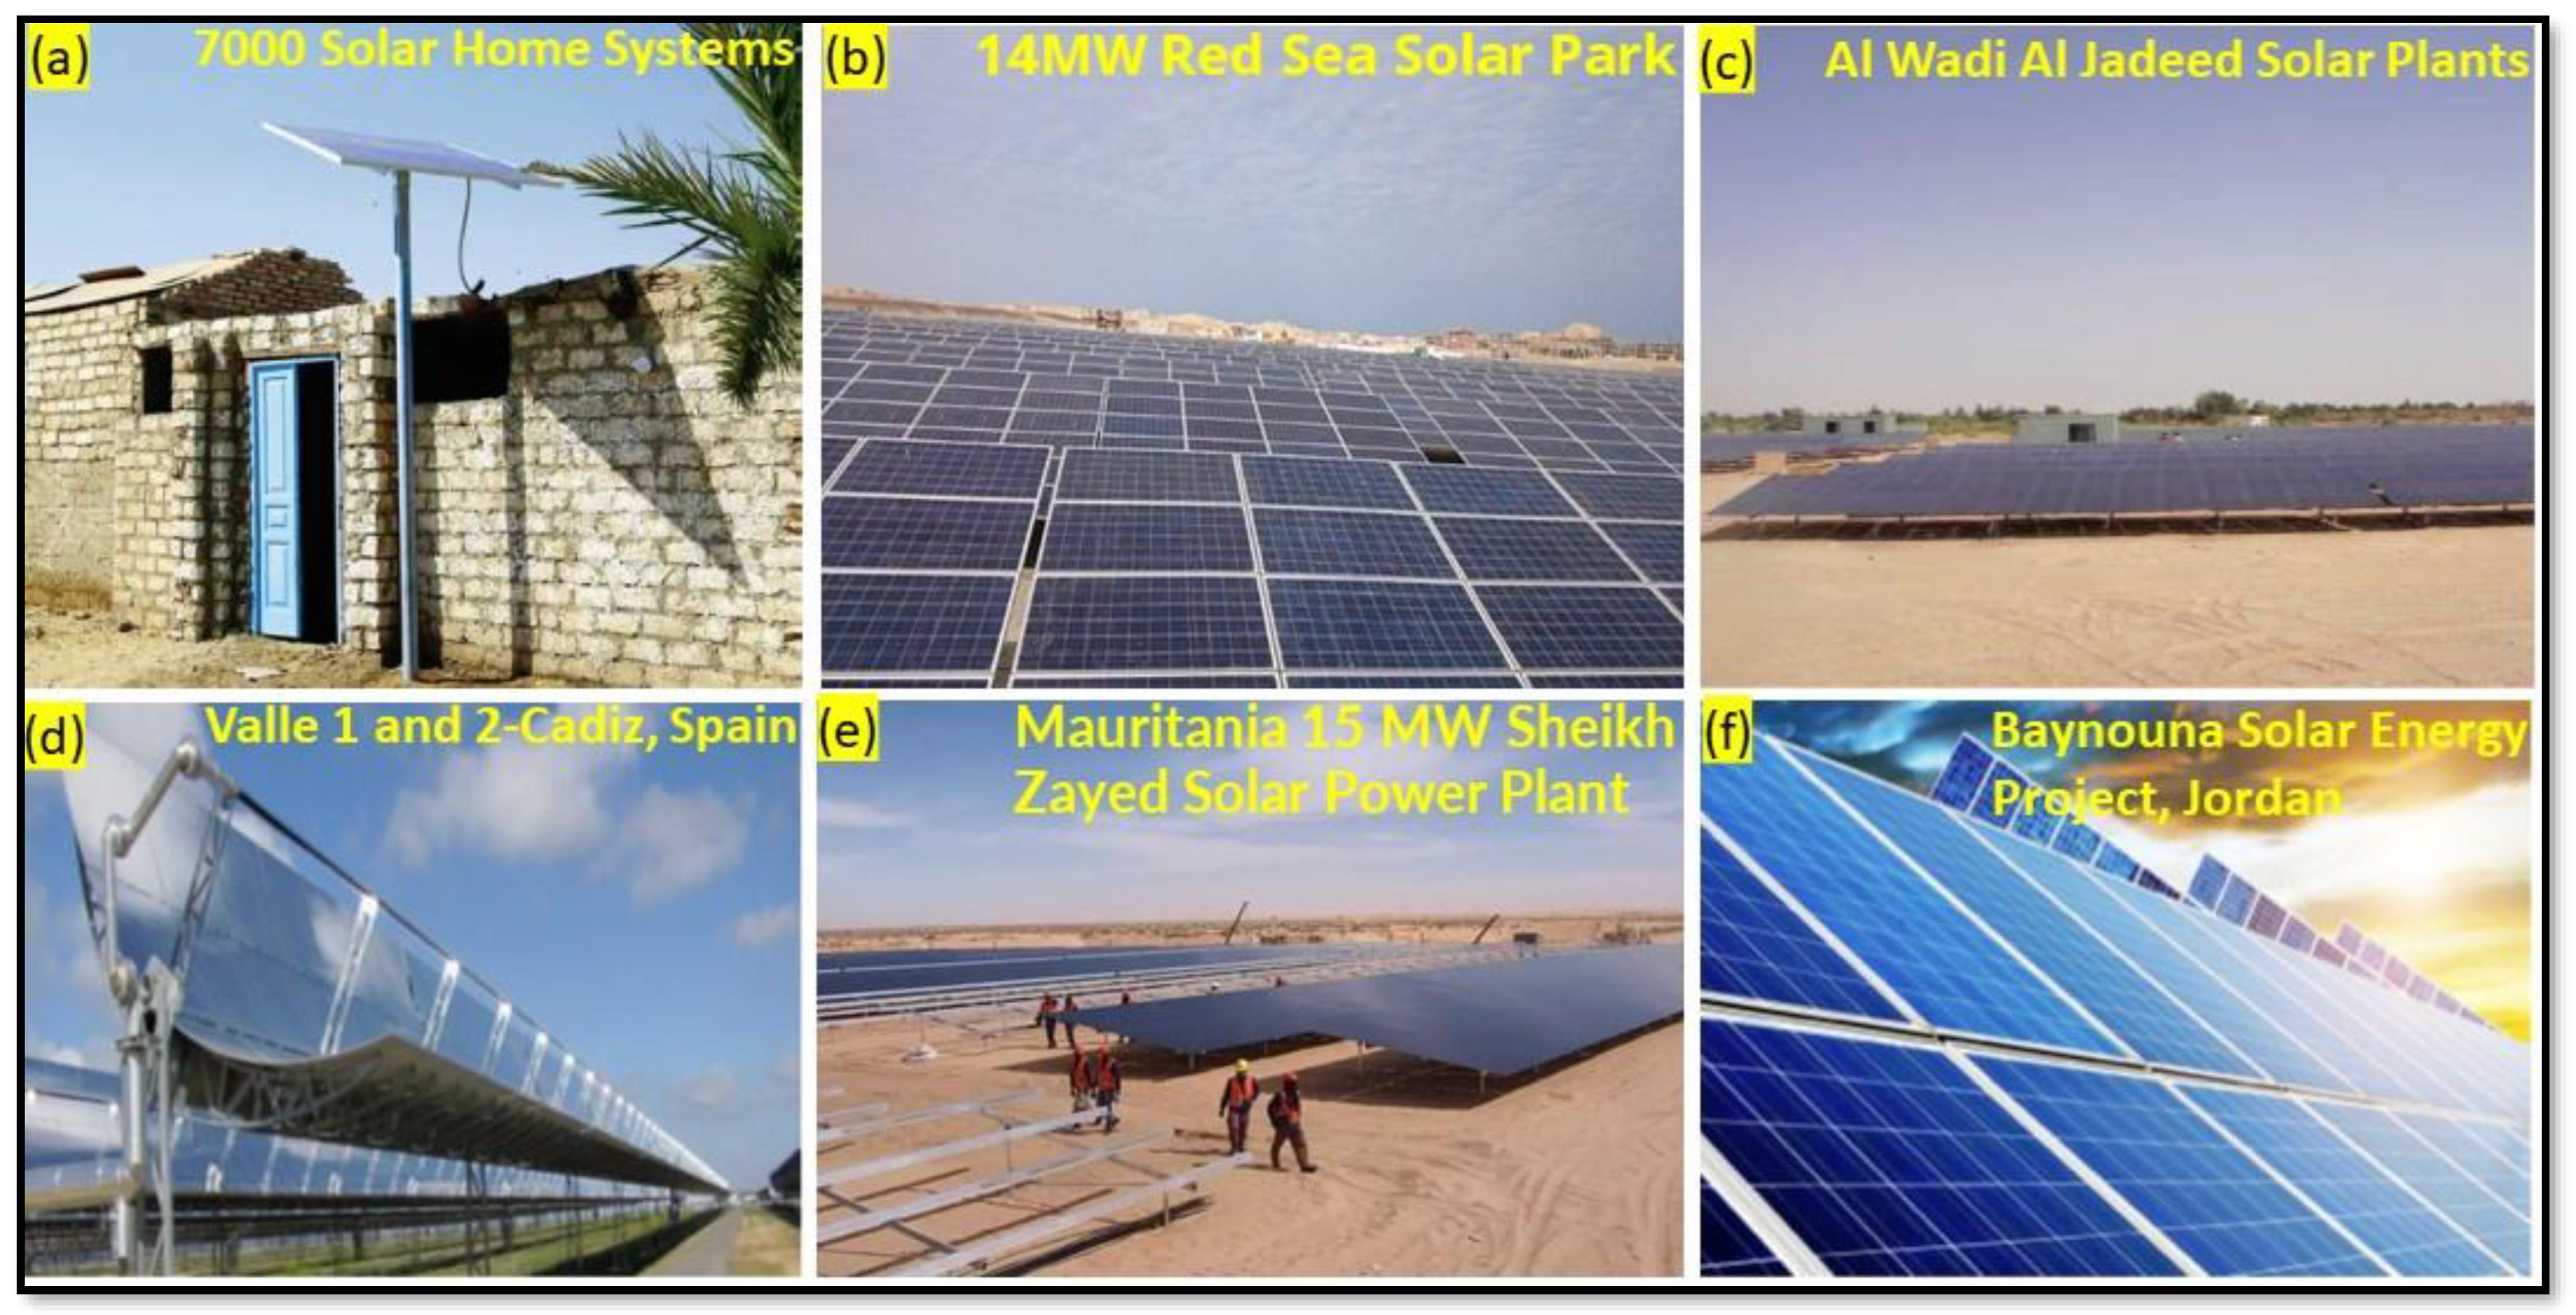
As illustrated in Figure 19a, Masdar has built and installed 7000 off-grid solar household PV systems in houses and commercial buildings in six distant regions, namely Qina, Sohag, Aswan, Matrouh, Al Wadi Al Jadeed, and Luxor. Between December 2015 and April 2016, Masdar installed seven solar–diesel plants totaling 20 MW at 5 MW from Shalateen, 2 MW from Abu Ramad, 6 MW from Marsa Alam, 1 MW from Halayeb, 500 kW from Darb Al Arbaeen, 500 kW from Abu Minqar, and 5 MW from Al Farafra in the governorate of the Red Sea and the Al Wadi Al Jadeed Governorate, Egypt, as shown in Figure 19b,c. This project was financially funded by the Abu Dhabi government, UAE, for rural electrification in Egypt, and it was completed in March 2014. The UAE–Egypt Commission is sponsoring Egypt’s New and Renewable Energy Authority (NREA). These four projects, each tailored to the requirements of a unique community, offer solar power to medical clinics/hospitals, mosques, educational institutes/schools, and many houses that previously lacked dependable access to power or were not linked to the national grid.
7.2. Baynouna Solar Plant, Jordan
As illustrated in Figure 19f, this project began as a Power Purchase Agreement (PPA) between Masdar and Jordan’s state energy supplier, the National Electric Power Company. This USD 240 million projects will create 563.3 GWh of electricity per year, which is equal to 4% of Jordan’s annual energy consumption. Construction is set to commence in the first quarter of 2018, with Masdar serving as the project’s primary stakeholder. Jordan will be able to meet its objective of producing 10% of its domestic electricity needs from renewable sources thanks to the 200 MW solar power plant and Masdar’s 117 MW Tafila windfarm. Jordan aims to build 1.8 gigatonnes of renewable energy by 2020, and the two projects will account for roughly 18% of that total.
7.3. Valle 1 and 2 in Cadiz, Spain
Valle 1 and 2 are two solar facilities in Cadiz, Spain, that employ parabolic trough solar technology as well as molten salt storage. The plants were constructed between late 2009 and 2011, as seen in Figure 19d. Torresol Energy, a joint venture between the Spanish engineering firm Sener (60%) and Masdar, developed the newest parabolic trough technology for both projects (40%).
Here are the other solar projects initiated under Abu Dhabi’s Masdar Program:
- 15 MW Sheikh Zayed Solar Project in Nouakchott, Mauritania: Masdar manufactured roughly 30,000 micromorph solar panels and installed 10,000 solar household PV systems, as shown in Figure 19e;
- Solar Home Systems, Afghanistan: The Masdar project has built 600 solar household systems in 27 communities near Camp Robinson;
- LaKaRo 525 kW Solar PV, Fiji: Solar panels were installed in the residential area of Fijian islands, such as Lakeba, Rotuma, and Kadevu;
- 500 kW Rooftop Solar PV, Tuvalu: Roofs and buildings in Tuvalu under the UAE-PPF (Pacific Partnership Fund) project;
- Micro-grid connected PV plant in Tonga: Solar photovoltaic power measuring 512 kW has been generated through the UAE-PPF;
- Solar PV Plant in Honiara, Solomon Islands: A 600 kW solar plant;
- Solar PV and Water Protection, Kiribati: Solar photovoltaic power measuring 500 kW has beem generated through the UAE-PPF;
- Port Vila 767 kW Solar PV, Vanuatu: One hundred and twelve parking spaces and three solar photovoltaic plants;
- Solar Water Collection in Majuro, Marshall Islands: A 600 kW PV plant;
- Solar Penetration and Water Access, Palau: On Peleliu island, a 100 kW PV/150 kW low-load diesel hybrid generation project, on Angaur island, a 100 kW PV/100 kW diesel hybrid plant, and on Koror Island, 1001.7 kW solar home systems;
- Solar House Systems, Morocco: Delivers 19,438 solar household systems in over 1000 rural communities. Masdar’s effort in collaboration with ONEE;
- Nauru Solar, the Republic of Nauru: A 500 kW solar PV facility;
- FSM Solar, Pohnpei: A 600 kW solar facility.
As a result, significant solar projects in renewable energy were intended to be built outside of the country to assist its energy demands. Among these projects, the Masdar company (under the Abu Dhabi emirate, UAE) is the renewable energy pioneer and arm of the UAE. To enable such a quick scale-up of solar energy technology, the UAE government must be given the authority to adopt comprehensive, comparative views of energy prices and to act on those views in power-sector regulation and tendering.
8. Limitations and Strategy in the Development of Solar Energy: UAE
By receiving solar radiation in the open atmosphere, PV cells and CSP technologies are both essentially current sources. However, achieving the lowest-cost energy mix with inexpensive PV requires flexible generation assets or low-cost storage to supply electricity demand 24 h a day. Combining CSP with thermal energy storage and/or hydropower, depending on availability, is one way to accomplish this flexibility via renewables. There are many ways to affect the performance of PV and CSP technologies in the development of solar energy in the UAE. First, one of the major disadvantages is that their working temperature increases linearly with irradiation in the desert region. It is a generally known fact that solar cell temperature is directly reliant on the electrical conversion efficiency of a PV module. The excess heat generated by a PV module due to the absorption of incoming solar irradiation is considered an electrical loss towards the overall output of the system and also leads to thermal strains being generated. To address the issue of PV systems overheating, researchers have used active and passive cooling techniques, such as a hybrid solar PV/T system, phase transition materials, enhanced heat exchanger channel design, heat sinks, jet impingement cooling, thermoelectric cooling, and other technologies [99]. CSP technology challenges require land resources and are expensive for installation.
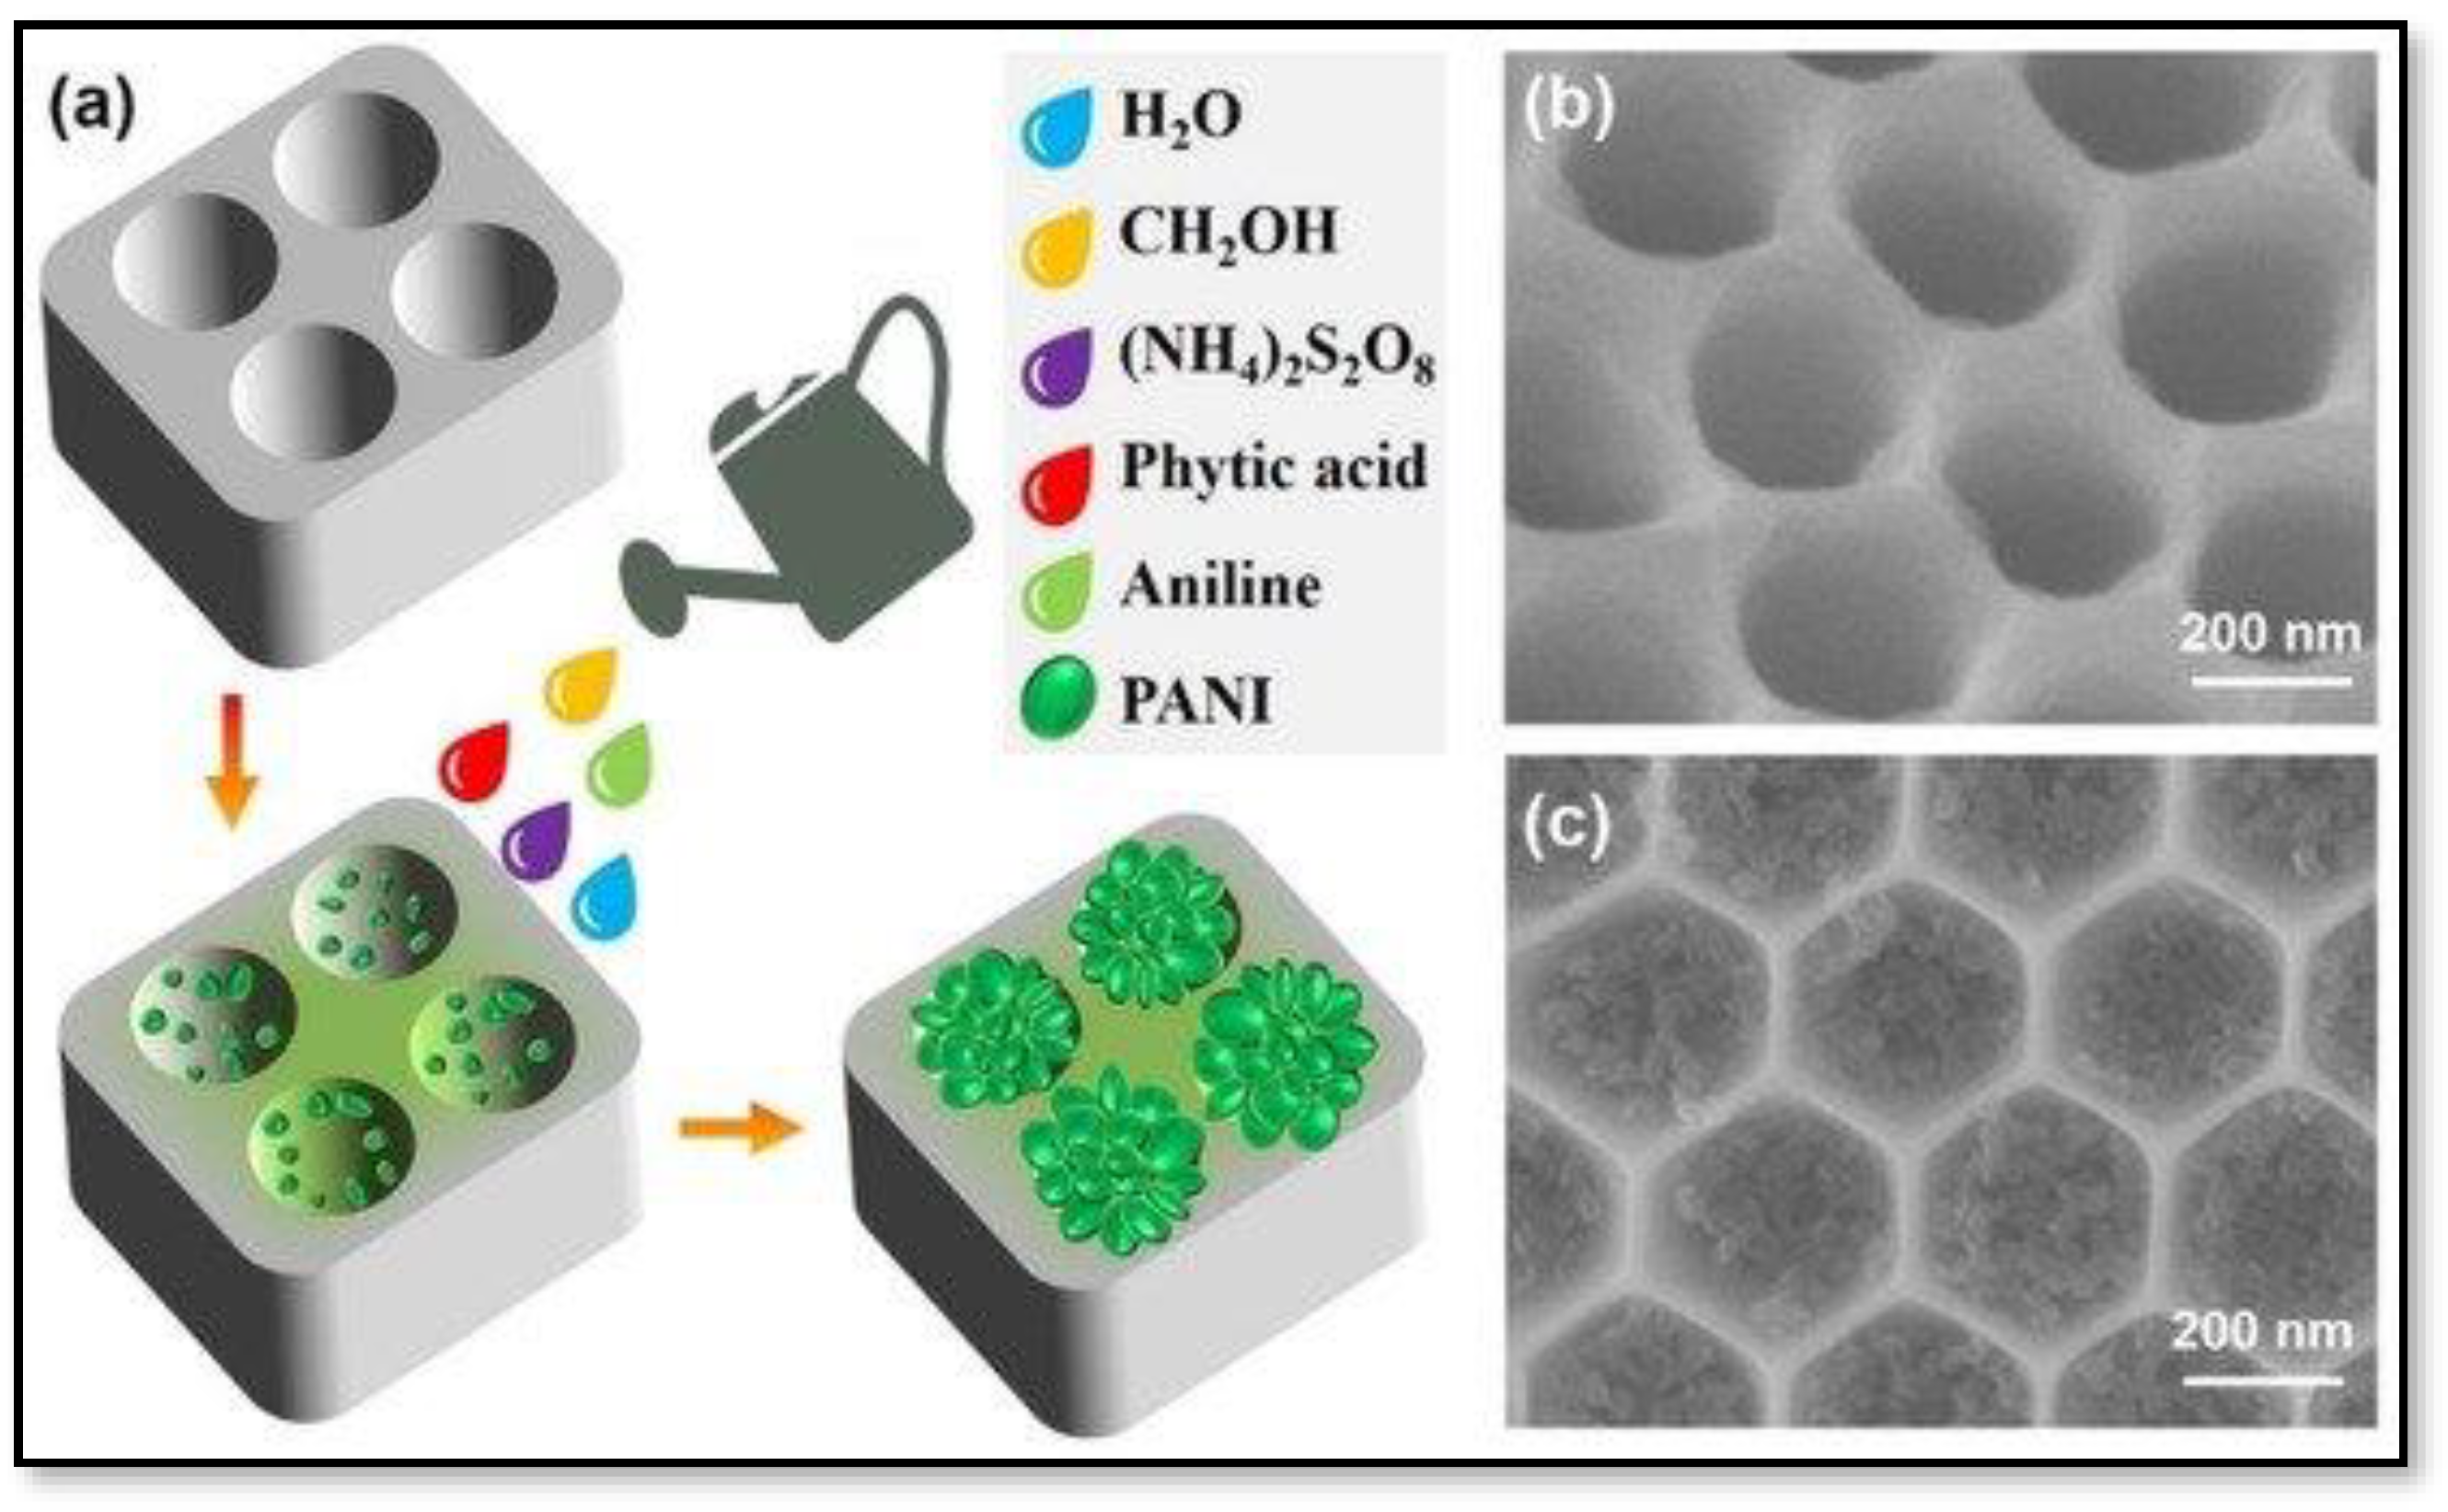
Secondly, shadows from atmospheric dust and particulates from industrial sources can never be avoided in the UAE region. Upon deposition and accumulation onto the surfaces of solar cells, they lead to the formation of darker cells and batteries discharging through the solar panel [100]. The dust is mainly made up of silicon dioxide (SiO2) followed by calcium oxide (CaO) and other oxides/elements, such as SrO, K2O, MnO2, NiO, SiO3, Cr2O3, Al2O3, Fe2O3, TiO2, P2O3, MgO, and Cl [101,102,103]. Gypseous soils, i.e., those that contain gypsum (CaSO4.2H2O), are the most common mineral found in the desert environment of the Abu Dhabi emirate [104]. More recently conducting polymers, such as polystyrene, poly dimethyl siloxane–siloxane, polymethyl hydroxy siloxane, polyurethane acrylic colloidal suspension, fluorinated polymers, silane-based polymers, and PANI (Figure 20) are also used to enhance the efficiency of solar cells [105,106]. In addition to dust accumulation, i.e., soiling by cementation, capillary aging, or caking/dust herding, two other crucial characteristics, namely, reflectivity and coating durability, play a significant role in lowering solar energy conversion efficiency in the UAE’s desert region. As a result, self-cleaning solar cell panels are just as important as capturing solar energy for optimal use. The outcomes of this study can help researchers, designers, and engineers to analyze and come up with a practical solution for the development of PV and CSP systems.
9. Solar Energy Industry
According to a 2011 study by Vidican et al. [108] on the solar energy industry in the UAE, there are 77 private companies available in the UAE; among them are 28 in trading, 1 in assembly, 4 in manufacturing PV panels, thermal-collectors, and mirrors, and 44 in installation and other activities, including design, consulting, installation, maintenance, system integration, and turnkey. In the Fujairah emirate (eastern region of the UAE), Microsol International Co, formerly Solon International, is the sole manufacturer of solar cells in Fujairah, UAE, as noted in Table 4. This factory was originally located in India before being relocated to Fujairah, UAE, in 2003. The facility has a total size of 30,000 square feet. The firm can produce 2.5 M solar cells of various sizes. The facility cost USD 3 million to build. It has an annual production capacity of 200 MW. Wet and chemical processing, diffusion, screen printing, silicon nitride coating, and solar-cell testing are among the production procedures handled by the factory’s divisions. The product development process includes laser cutting, drawing wafers, diffusion furnaces, wafer preparation, printing and firing lines, and cell testing.
Orders totaling USD 10 million have been placed for shipping to China and Germany. Given the existing demand and supply for solar cells, as well as significant orders in the pipeline, the company has increased the plant’s installed capacity from 2.5 M to six million solar cells/year by the first quarter of 2005. In the emirate of Dubai (northern region of the UAE), Maysun Solar FZCO, the first solar module manufacturer, was founded in 2013 in Jabel Ali, Dubai, UAE. This company specializes in the production of solar panels. This plant produced mono and poly modules from 150 W to 370 W—36, 60, 72 cells. It has a nameplate capacity of 40 MW to be expanded to 100 MW in the future. Moreover, its factory capacity is up to 500 MW/year. To provide the highest quality, this plant may use high-quality raw resources from manufacturers around the world, including Iran, Saudi Arabia, Turkey, India, South Africa, Canada, and the EU. Testing, production, raw material acquisition, and quality inspection are all part of the plant production process, including EL and flash tests. Its solar projects were installed in various parts of the UAE, as mentioned in Table 5.
Almaden MENA FZE is one of the UAE’s solar panel manufacturing companies, based in the Dubai Silicon Oasis, Dubai, UAE, established in 2017. It is the largest ARC solar double-glass manufacturer in UAE. The plant’s capacity was initially set at 150 MW (first phase); however, it may be increased in the future. This plant has a total area of 15,000 m2, comprised of 3000 m2 manufacturing space and 3000 m2 warehousing space. This plant is mainly focused on raw material supply in the solar industry, solar panel manufacturing, and solar project development. This plant produces modules of both mono and polycrystalline solar panels from 325 W to 340 W—40, 50, 60, 72 cells. Its solar projects were installed in various parts of the UAE, for example, swimming pools, rooftop solutions, petrol stations, villas, shading solutions, and agriculture [109].
DuSol Industries is the first solar module manufacturer in Dubai, United Arab Emirates. This plant produces modules of monocrystalline, polycrystalline, thin-film, and flexible types. DuSol, in collaboration with Japanese and German equipment manufacturers, has a 50 MW annual capacity automated line for off-grid and on-grid modules. DuSol manufactures all modules, including off-grid modules, in an automated line with little human participation. This ensures that the modules are of the greatest quality and are of constant quality. This line is unique in that it was designed expressly to generate different-sized modules for off-grid development, including 40–150 Wp, as well as developing high-frequency panels of 240–260 Wp, utilizing 60 polycrystalline solar cells for grid markets [110].
‘Enviromena’ is the largest solar panel installer company in the UAE in terms of capacity, which is installed in the Dubai World Trade Center, the Masdar Solar PV plant, remote islands, Mamoura parking, the Al Bateen school, the Sheik Zayed Learning Center, Masdar SAF II, the Formula 1–Etihad Airways Grand Prix, and the Abu Dhabi Distribution Company (ADDC) parking and private stables. The Masdar Institute for Science and Technology is the premier academic institution focusing on renewable energy and sustainability in terms of research and development activities to assist the solar sector, followed by United Arab Emirates University, renewable energy center, and Ajman University, Ajman. Several additional UAE institutes are also conducting research and development activities, sustainable environmental evaluations in different UAE buildings, and solar–hydrogen energy consumption. Renewable energy conferences and workshops (such as Solar Decathlon Middle East) are also held at these universities [111].
In this regard, we note that the UAE has a desert covering 74% of its landmass, i.e., a lot of sand. A detailed geological and chemical analysis of sand from several locations indicates that it has a high SiO2 concentration under certain areas, which may make it appropriate for the production of silicon-based solar cells. [112,113].
10. Conclusions
10.1. Perspective and Outcomes
This review paper aimed to examine recent advances in solar scenarios and development trends within the framework of seven emirates in the UAE. In this regard, the UAE has been a pioneer in renewable energy production, particularly solar, within the GCC countries. According to the present work, the solar sources available for the UAE include photovoltaic, concentrated solar power (CSP), etc. Using these available resources, the four main authorities have generated electricity production and consumption in the UAE. However, electricity tariffs are varied corresponding to residential, commercial, industrial, and agriculture sectors. The UAE government also sponsors various solar projects outside of the UAE. Finally, this review paper deals with various private solar companies, including those concerned with the trading, assembly, manufacturing of PV panels thermal collectors and mirrors, installation, and other activities available inside the UAE. These solar companies can be used for present or future solar projects in the UAE, helping to increase solar power capacity and to promote a better environment. The UAE is particularly interested in adopting and implementing such RE technologies because of their main advantages, such as the vital role of solar resources in lowering carbon dioxide and other pollutants that contribute to global warming.
10.2. Applications
As a result, the UAE has an abundance of solar energy; passive and active solar energy utilization might be a technique for lowering fossil energy consumption and CO2 emissions. It is also critical to identify the future responsibilities for the generation of power and to explain the actions necessary for transition to a future sustainable energy system. These have been demonstrated to be policies that are required for the UAE to open the sustainable energy sector and to begin development within the energy sector. It will promote long-term, medium-term, and short-term economic development, and reductions in carbon dioxide emissions will effectively protect the global environment. This may also lead to ecologically friendly electricity growth in the UAE.
10.3. Challenges
PV technology is rapidly evolving to generate more power to meet the requirements of people in the UAE. The UAE government has made numerous measures to expand the usage of renewable sources, including solar, and power has been marked for PV in the year 2030. Nonetheless, many challenges face solar energy growth in the UAE. These include challenges with standby capacity, land usage, and storage inside the emirates. Furthermore, there is a lack of consistency in solar radiation, as well as issues with dust and sand collection on PV panels. Even though sophisticated automation and remote monitoring are required due to the magnitude of PV system implementation, obstacles and opportunities still exist. These monitoring systems, in particular, can reliably indicate when a PV system is not performing to its full potential, but they rarely provide precise actionable information that a solar system owner can take to improve solar performance. There is also a need for more manufacturer companies in all the emirates in the UAE. As a result, there is a need for local content with regard to the research and development of materials, technology, and applications. Another major task is to raise awareness, share expertise through seminars/workshops, and provide scientific guidance to the UAE’s colleges/universities and research institutions. There is a need to alter curricula in engineering programs to incorporate lessons on solar energy resources. Furthermore, the solar–thermal sector is rapidly expanding. Various solar collectors are used to capture sunlight and convert it into heat with the least amount of loss, making them excellent for producing jobs in the renewable energy industry. As a result, the UAE government must encourage a diverse energy mix in which electricity may be generated from all traditional energy sources, including sustainable energy, nuclear, and coal power.
Author Contributions
Conceptualization, T.R.; methodology, T.R. and A.-H.I.M.; software, T.R.; validation, T.R., A.-H.I.M. and F.H.; formal analysis, T.R. and A.-H.I.M.; investigation, T.R. and A.-H.I.M.; resources, T.R.; data curation, T.R. and A.-H.I.M.; writing—original draft preparation, T.R. and A.-H.I.M.; writing—review and editing, T.R. and A.-H.I.M.; visualization, T.R. and A.-H.I.M.; supervision, A.-H.I.M.; project administration, A.-H.I.M.; funding acquisition, A.-H.I.M. All authors have read and agreed to the published version of the manuscript.
Funding
This research was supported under grants 12R015 and 31R238, UAE University, Al Ain-15551, United Arab Emirates in collaboration with the University of California, Berkeley, USA and University of Malaya, Malaysia.
Data Availability Statement
Not applicable.
Acknowledgments
Thanks to the research support of United Arab Emirates University, Al-Ain.
Conflicts of Interest
The authors declare no conflict of interest.
Acronyms
| ADDC | Abu Dhabi Distribution Company |
| ADFD | Abu Dhabi Fund for Development |
| ADWEA | Abu Dhabi Water and Electricity Authority |
| CDM | Clean Development Mechanism |
| CSP | Concentrated solar power |
| CVT | Concentrating photovoltaics |
| DoE | Department of Energy |
| DEWA | Dubai Electricity and Water Authority |
| EWE | Etihad Water and Electricity Authority |
| FEWA | Federal Electricity and Water Authority |
| GHI | Global Horizontal Irradiation |
| GHG | Greenhouse Gas Emissions |
| IPP | Independent Power Producer |
| MOENR | Ministry of Energy |
| NREA | New and Renewable Energy Authority |
| ONEE | Office National de L’electricite et de L’eau Potable |
| PV | Photovoltaic |
| PPA | Power Purchase Agreement |
| RFQ | Request for Qualification |
| SEWGA | Sharjah Electricity, Water and Gas Authority |
| SOMELEC | Societe Mauritanienne del Electricite |
| SHS | Solar Home Systems |
| ST | Solar Tracking System |
| UAE | United Arab Emirates |
References
- A United Nations, Population Division. World Population Prospects: The 2015 Revision. Available online: https://www.un.org/en/development/desa/publications/world-population-prospects-2015-revision.html (accessed on 21 April 2022).
- BP. Energy Outlook 2030; BP Publishers: London, UK, 2012. [Google Scholar]
- Juaidi, A.; Montoya, F.G.; Gázquez, J.A.; Manzano-Agugliaro, F. An overview of energy balance compared to sustainable energy in United Arab Emirates. Renew. Sustain. Energy Rev. 2016, 55, 1195–1209. [Google Scholar] [CrossRef]
- Kazim, A. Assessments of primary energy consumption and its environmental consequences in the United Arab Emirates. Renew. Sustain. Energy Rev. 2007, 11, 426–446. [Google Scholar] [CrossRef]
- Jamil, M.; Farzana, A.; Jeon, Y.J. Renewable energy technologies adopted by the UAE: Prospects and challenges—A comprehensive overview. Renew. Sustain. Energ. Rev. 2016, 55, 1181–1194. [Google Scholar] [CrossRef] [Green Version]
- Mondal, M.A.H.; Kennedy, S.; Mezher, T. Long-term optimization of United Arab Emirates energy future: Policy implications. Appl. Energy 2014, 114, 466–474. [Google Scholar] [CrossRef]
- Sims, R. Renewable energy: A response to climate change. Sol. Energy 2004, 76, 9–17. [Google Scholar] [CrossRef]
- Nahorski, Z.; Horabik, J. Greenhouse gas emission permit trading with different uncertainties in emission sources. J. Energy Eng. 2008, 134, 47–52. [Google Scholar] [CrossRef]
- Bartels, M.; Müsgens, F. Is a cap-and-trade system always efficient the case of new entrants in the emissions trading system of the EU. J. Energy Eng. 2008, 134, 33–39. [Google Scholar] [CrossRef]
- Panwar, N.; Kaushik, S.; Kothari, S. Role of renewable energy sources in environmental protection: A review. Renew. Sustain. Energy Rev. 2011, 15, 1513–1524. [Google Scholar] [CrossRef]
- Jain, S.; Jain, N.K.; Vaughn, W.J. Challenges in meeting all of India’s electricity from solar: An energetic approach. Renew. Sustain. Energy Rev. 2018, 82, 1006–1013. [Google Scholar] [CrossRef]
- Chen, Q.F.; Du, S.W.; Yuan, Z.X.; Sun, T.B.; Li, Y.X. Experimental study on performance change with time of solar adsorption refrigeration system. Appl. Therm. Eng. 2018, 138, 386–393. [Google Scholar] [CrossRef]
- Sharshir, S.W.; Yang, N.; Peng, G.; Kabeel, A.E. Factors affecting solar stills productivity and improvement techniques: A detailed review. Appl. Therm. Eng. 2016, 100, 267–284. [Google Scholar] [CrossRef]
- Mas’ud, A.A.; Wirba, A.V.; Alshammari, S.J.; Muhammad-Sukki, F.; Abdullahi, M.A.M.; Albarracin, R.; Hoq, M.Z. Solar Energy Potentials and Benefits in the Gulf Cooperation Council Countries: A Review of Substantial Issues. Energies 2018, 11, 372. [Google Scholar] [CrossRef] [Green Version]
- Asif, M. Growth and sustainability trends in the buildings sector in the GCC region with particular reference to the KSA and UAE. Renew. Sust. Energ. Rev. 2016, 55, 1267–1273. [Google Scholar] [CrossRef]
- Kasaeian, A.; Ghalamchi, M.; Ahmadi, M.H.; Ghalamchi, M. GMDH algorithm for modeling the outlet temperatures of a solar chimney based on the ambient temperature. Mech. Ind. 2017, 18, 216. [Google Scholar] [CrossRef]
- Sharma, A.K.; Sharma, C.; Mullick, S.C.; Kandpal, T.C. Solar industrial process heating: A review. Renew. Sustain. Energy Rev. 2017, 78, 124–137. [Google Scholar] [CrossRef]
- Said, Z.; Alshehhi, A.A.; Mehmood, A. Predictions of UAE’s renewable energy mix in 2030. Renew. Energy 2018, 118, 779–789. [Google Scholar] [CrossRef]
- Barker, P.P.; Bing, J.M. Advances in solar photovoltaic technology: An applications perspective. In Proceedings of the Power Engineering Society General Meeting, San Francisco, CA, USA, 16 June 2005; pp. 1955–1960. [Google Scholar]
- Green, M.A. Photovoltaic principles. Phys. E Low-Dimens. Syst. Nanostructures 2002, 14, 11–17. [Google Scholar] [CrossRef]
- Singh, G. Solar power generation by PV (photovoltaic) technology: A review. Energy 2013, 53, 1–13. [Google Scholar] [CrossRef]
- Akhmad, K.; Kitamura, A.; Yamamoto, F.; Okamoto, H.; Takakura, H.; Hamakawa, Y. Outdoor performance of amorphous silicon and polycrystalline silicon PV modules. Sol. Energy Mat. Sol. Cells 1997, 46, 209–218. [Google Scholar] [CrossRef]
- Rehman, S.; El-Amin, I. Performance evaluation of an off-grid photovoltaic system in Saudi Arabia. Energy 2012, 46, 451–458. [Google Scholar] [CrossRef]
- Fu, Y.; Liu, X.; Yuan, Z. Life-cycle assessment of multi-crystalline photovoltaic (PV) systems in China. J. Clean. Prod. 2015, 86, 180–190. [Google Scholar] [CrossRef]
- Yang, D.; Liu, J.; Yang, J.; Ding, N. Life-cycle assessment of China’s multi-crystalline silicon photovoltaic modules considering international trade. J. Clean. Prod. 2015, 94, 35–45. [Google Scholar] [CrossRef]
- Chen, W.; Hong, J.; Yuan, X.; Liu, J. Environmental impact assessment of monocrystalline silicon solar photovoltaic cell production: A case study in China. J. Clean. Prod. 2016, 112, 1025–1032. [Google Scholar] [CrossRef]
- Parida, B.; Iniyan, S.; Goic, R. A review of solar photovoltaic technologies. Renew. Sustain. Energy Rev. 2011, 15, 1625–1636. [Google Scholar] [CrossRef]
- Razykov, T.M.; Ferekides, C.S.; Morel, D.; Stefanakos, E.; Ullal, H.S.; Upadhyaya, H.M. Solar photovoltaic electricity: Current status and future prospects. Sol. Energy 2011, 85, 1580–1608. [Google Scholar] [CrossRef]
- Raugei, M.; Bargigli, S.; Ulgiati, S. Life cycle assessment and energy pay-back time of advanced photovoltaic modules: CdTe and CIS compared to poly-Si. Energy 2007, 32, 1310–1318. [Google Scholar] [CrossRef]
- National Renewable Energy Laboratory (NREL). Best Research-Cell Efficiencies. Available online: https://commons.wikimedia.org/wiki/File:Best_Research-Cell_Efficiencies.png (accessed on 14 April 2022).
- Kropp, R. Solar Expected to Maintain Its Status as the World’s Fastest-Growing Energy Technology. Available online: http://www.energybc.ca/cache/solarpv/www.socialfunds.com/news/article.cgi/2639.html (accessed on 14 April 2022).
- Schlaich Bergermann Solar GmbH. Solar Updraft Tower. Available online: https://architecture.mit.edu/sites/architecture.mit.edu/files/attachments/lecture/SolarUpdraftTower_Project.pdf (accessed on 14 April 2022).
- Jacobson, M.Z. Review of solutions to global warming, air pollution, and energy security. Energy Environ. Sci. 2009, 2, 148–173. [Google Scholar] [CrossRef]
- Devabhaktuni, V.; Alam, M.; Depuru, S.S.S.R.; Green, R.C., II; Nims, D.; Near, C. Solar energy: Trends and enabling technologies. Renew. Sustain. Energy Rev. 2013, 19, 555–564. [Google Scholar] [CrossRef]
- Mozumder, M.S.; Mourad, A.I.; Pervez, H.; Surkatti, R. Recent developments in multifunctional coatings for solar panel applications: A review. Sol. Energy Mater. Sol. Cells 2019, 189, 75–102. [Google Scholar] [CrossRef]
- Mohamad, A.A. Efficiency improvements of photo-voltaic panels using a Sun tracking system. Appl. Energy 2004, 79, 345–354. [Google Scholar] [CrossRef]
- Huang, B.J.; Huang, Y.C.; Chen, G.Y.; Hsu, P.C.; Li, K. Improving solar PV system efficiency using one-axis 3-position Sun tracking. Energy Procedia 2013, 33, 280–287. [Google Scholar] [CrossRef] [Green Version]
- Ismail, M.; Moghavvemi, M.; Mahlia, T. Analysis and evaluation of various aspects of solar radiation in the Palestinian territories. Energy Convers. Manag. 2013, 73, 57–68. [Google Scholar] [CrossRef]
- Abdallah, S. The effect of using sun tracking systems on the voltage-current characteristics and power generation of flat plate PV. Energy Convers. Manag. 2004, 45, 1671–1679. [Google Scholar] [CrossRef]
- Senpinar, A.; Cebeci, M. Evaluation of power output for fixed and two-axis tracking PV arrays. Appl. Energy 2012, 92, 677–685. [Google Scholar] [CrossRef]
- Koussa, M.; Cheknane, A.; Hadji, S.; Haddadi, M.; Noureddine, S. Measured and modelled improvement in solar energy yield from flat plate photovoltaic systems utilizing different tracking systems and under a range of environmental conditions. Appl. Energy 2011, 88, 1756–1771. [Google Scholar] [CrossRef]
- Cherupurakal, N.; Mozumder, M.S.; Mourad, A.I.; Lalwani, S. Recent advances in superhydrophobic polymers for antireflective self-cleaning solar panels. Renew. Sustain. Energy Rev. 2021, 151, 111538. [Google Scholar] [CrossRef]
- Orhan, M.F.; Kahraman, H.; Babu, B.S. Approaches for integrated hydrogen production based on nuclear and renewable energy sources: Energy and exergy assessments of nuclear and solar energy sources in the United Arab Emirates. Int. J. Hydrog. Energy 2017, 42, 2601–2616. [Google Scholar] [CrossRef]
- Eveloy, V.; Gebreegziabher, T. Excess electricity and power-to-gas storage potential in the future renewable-based power generation sector in the United Arab Emirates. Energy 2019, 166, 426–450. [Google Scholar] [CrossRef]
- Khondaker, A.N.; Hasan, M.A.; Rahman, S.M.; Malik, K.; Shafiullah, M.; Muhyedeen, M.A. Greenhouse gas emissions from energy sector in the United Arab Emirates—An overview. Renew. Sustain. Energy Rev. 2016, 59, 1317–1325. [Google Scholar] [CrossRef]
- Griffiths, S.; Mills, R. Potential of rooftop solar photovoltaics in the energy system evolution of the United Arab Emirates. Energy Strategy Rev. 2016, 9, 1–7. [Google Scholar] [CrossRef]
- El Chaar, L.; Lamont, L. Global solar radiation:multiple on Site assessments in Abu Dhabi, UAE. Renew. Energy 2010, 35, 1596–1601. [Google Scholar] [CrossRef]
- Solargis. Solar resource maps of United Arab Emirates. Available online: https://solargis.com/maps-and-gis-data/download/united-arab-emirates (accessed on 14 April 2022).
- Fowler, S.W. Pollution in the Gulf: Monitoring the marine environment. IAEA Bull. 1993, 35, 9–13. [Google Scholar]
- Ontheworldmap. UAE Emirates Map. Available online: https://ontheworldmap.com/uae/administrative-divisions-map-of-uae.html (accessed on 14 April 2022).
- World Population Review. United Arab Emirates Population 2021. Available online: http://worldpopulationreview.com/countries/united-arab-emirates-population/ (accessed on 14 April 2022).
- UAE Map of Global Horizontal Irradiation. Available online: https://creativecommons.org/licenses/by/4.0/ (accessed on 14 April 2022).
- BP. Statistical Review of World Energy. Available online: http://www.bp.com/content/dam/bp/pdf/Energy-economics/statistical-review-2014/BP-statistical-review-of-world-energy-2014-full-report.pdf (accessed on 14 April 2022).
- U.S.E.I. Administration. Country Analysis Overview for UAE. Available online: https://www.eia.gov/international/content/analysis/countries_long/United_Arab_Emirates/uae_2020.pdf (accessed on 14 April 2022).
- World Bank Group. Energy and Mining. Available online: http://data.worldbank.org/topic/energy-and-mining (accessed on 14 April 2022).
- IRENA. RE Prospects UAE, Remap 2030. Available online: https://www.irena.org/-/media/Files/IRENA/Agency/Publication/2015/Apr/IRENA_REmap_UAE_summary_2015.pdf?la=en&hash=666715BD3725552C23FA8EF3DDD7C46E1CF7BEA3 (accessed on 6 April 2022).
- NREL. 2014 Renewable Energy Data Book. Available online: https://www.nrel.gov/docs/fy16osti/64720.pdf (accessed on 14 April 2022).
- United Arab Emirates Ministry of Energy. Statistical Annual Report Electricity and Water 2011–2013. Available online: https://www.moenr.gov.ae/assets/download/b7c51f4d/annual-report-2011-2013.aspx (accessed on 14 April 2022).
- IRENA. Map UAE Report 2015. Available online: http://www.irena.org/-/media/Files/IRENA/Agency/Publication/2015/IRENAREmapUAEreport2015 (accessed on 14 April 2022).
- IRENA. Solar Energy. Available online: https://www.irena.org/en/solar (accessed on 14 April 2022).
- US Energy Information Administration (EIA). Country Analysis Brief: United Arab Emirates. Available online: https://www.eia.gov/beta/international/analysis_includes/countries_long/United_Arab_Emirates/uae.pdf (accessed on 14 April 2022).
- CEIC Data, an ISI Emerging Markets Group Company. United Arab Emirates Electricity Consumption. Available online: https://www.ceicdata.com/en/united-arab-emirates/electricity-consumption/electricity-consumption (accessed on 14 April 2022).
- Trading Economics. Fossil Fuel Energy Consumption in UAE. Available online: https://tradingeconomics.com/ (accessed on 10 February 2022).
- IRENA. Renewable Energy Prospects: United Arab Emirates. Available online: https://www.irena.org/publications/2015/Apr/Renewable-Energy-Prospects-United-Arab-Emirates (accessed on 15 April 2022).
- Ferroukhi, R.; Ghazal-Aswad, N.; Androulaki, S.; Hawila, D.; Mezher, T. Renewable energy in the GCC:Status and challenges. Int. J. Energy Sect. Manag. 2013, 7, 84–112. [Google Scholar] [CrossRef]
- Harder, E.; Gibson, J. The costs and benefits of large-scale solar photovoltaic power production in Abu Dhabi, United Arab Emiates. Renew. Energy 2011, 36, 789–796. [Google Scholar] [CrossRef]
- World Resources Institute. CO2 Emission in UAE Source: Climate Watch; World Resources Institute: Washington, DC, USA, 2020. [Google Scholar]
- United Arab Emirates Ministry of Energy. Annual Statistic Report Electricity and Water 2012. Available online: http://www.moenr.gov.ae/assets/779e2a52/annual-report-2011-a.aspx (accessed on 11 March 2022).
- United Arab Emirates Ministry of Energy. Statistical Data for Electricity and Water 2004–2014. Available online: https://www.moenr.gov.ae/en/home.aspx (accessed on 15 April 2022).
- United Arab Emirates Ministry of Energy. Annual Statistical Report 2016. Available online: https://www.moenr.gov.ae/en/open-data.aspx (accessed on 15 April 2022).
- Mondol, J.D.; Carr, C. Techno-economic assessments of advanced Combined Cycle Gas Turbine (CCGT) technology for the new electricity market in the United Arab Emirates. Sustain. Energy Technol. Assess. 2017, 19, 160–172. [Google Scholar] [CrossRef]
- Tholkappiyan, R.; Hamed, F. The effect of fuel to nitrates ratio on the properties of FeCr2O4 nanopowders. Mater. Res. Bull. 2017, 95, 104–114. [Google Scholar]
- Fathalla, H.; Tholkappiyan, R.; Vishista, K. The effect of induced strains on the optical band gaps in lanthanum doped zinc ferrite nanocrystalline powders. Mod. Phys. Lett. B 2016, 30, 1650230. [Google Scholar]
- Sgouridis, S.; Griffiths, S.; Kennedy, S.; Khalid, A.; Zurita, N. A sustainable energy transition strategy for the United Arab Emirates: Evaluation of options using an integrated energy model. Energy Strategy Rev. 2013, 2, 8–18. [Google Scholar] [CrossRef]
- MEED. GCC Power & Desalination Projects 2012. Available online: https://www.meed.com/gcc-power-desalination-projects-2012/ (accessed on 12 January 2022).
- Klett, T.R.; Gautier, D.L.; Ahlbrandt, T.S. An evaluation of the us geological survey world petroleum assessment 2000. AAPGBull 2005, 89, 1033–1042. [Google Scholar]
- Jacobs, D.; Sovacool, B.K. Feed-in tariffs and other support mechanisms for solar PV promotion. In Comprehensive Renewable Energy; van Sark, W., Ed.; Elsevier: Amsterdam, The Netherlands, 2012; pp. 73–109. [Google Scholar]
- World Bank Group. World Data Base Bank. Available online: http://databank.worldbank.org/data/views/reports/ (accessed on 15 April 2022).
- World Bank. Exploring the Potential for Electricity Trade and Interconnection among Yemen and GCC Countries; World Bank: Washington, DC, USA, 2009. [Google Scholar]
- Tholkappiyan, R.; Vishista, K. Synthesis and characterization of barium zinc ferrite nanoparticles: Working electrode for dye sensitized solar cell applications. Sol. Energy 2014, 106, 118–128. [Google Scholar] [CrossRef]
- Bayanat. Consumed Electricity (GWh) by Authority, Electricity Capacity in DWEA, ADWEA, SEHA, FEWA (MW), Gross Generated Electricity (GWh) by Authority, Export and Import Quantity (GWh) to Oman and Saudi Arabia. Available online: http://data.bayanat.ae/ (accessed on 15 April 2022).
- Shawon, M.; El Chaar, L.; Lamont, L. Overview of wind energy and its cost in the middle east. Sustain. Energy Technol. Assess. 2013, 2, 1–11. [Google Scholar] [CrossRef]
- Sgouridis, S.; Abdullah, A.; Griffiths, S.; Saygin, D.; Wagner, N.; Gielen, D.; McQueen, D. RE-mapping the UAE’s energy transition: An economy-wide assessment of RE options and their policy implications. Renew. Sustain. Energy Rev. 2016, 55, 1166–1180. [Google Scholar] [CrossRef]
- Luckow, P.; Elizabeth, A.S.; Biewald, B.; Fisher, J.; Ackerman, F.; Hausman, E. Carbon Dioxide Price Forecast, Synapse Energy Economics, 2013. Available online: https://www.synapse-energy.com/sites/default/files/SynapseReport.2013-11.0.2013-Carbon-Forecast.13-098.pdf (accessed on 15 April 2022).
- DoE Electricity Tariff by Slab Rate Sector in 2016. Available online: http://www.moenr.gov.ae/ (accessed on 19 March 2022).
- International Renewable Energy Agency (IRENA). Pan-Arab Renewable Energy Strategy 2030. Available online: https://www.irena.org/DocumentDownloads/Publications/IRENA_Pan-Arab_Strategy_June%202014.pdf (accessed on 13 December 2014).
- Masdar Institute and International Renewable Energy Agency (IRENA). Renewable Energy Prospects: United Arab Emirates, REmap 2030 Analysis. 2015. Available online: http://www.irena.org/remap/irena_remap_uae_report_2015.pdf (accessed on 15 April 2022).
- IRENA. Renewable Energy Market Analysis. The GCC Region. 2016. Available online: http://www.irena.org/DocumentDownloads/Publications/IRENA_Market_GCC_2016.pdf (accessed on 15 April 2022).
- Tholkappiyan, R.; Mohamed Azarudeen, L.; Anandkumar, G.; Vishista, K. Characterization of Sm doped CaO Phosphor prepared by co-precipitation method. Adv. Sci. Eng. Med. 2016, 8, 57–61. [Google Scholar] [CrossRef]
- Afshari, A.; Nikolopoulou, C.; Martin, M. Life-Cycle Analysis of Building Retrofits at the Urban Scale—A Case Study in United Arab Emirates. Sustainability 2014, 6, 453–473. [Google Scholar] [CrossRef] [Green Version]
- Dubai Electricity and Water Authority. Available online: https://www.dewa.gov.ae/en/ (accessed on 15 April 2022).
- Masdar. Solar Projects. Available online: https://www.masdar.ae/ (accessed on 21 February 2022).
- Dubai Supreme Council of Energy (SCE). Available online: http://www.dubaisce.gov.ae/ (accessed on 11 March 2022).
- Alnaser, W.; Alnaser, N. Solar and wind energy potential in GCC countries and some related projects. J. Renew. Sustain. Energy 2009, 1, 022301. [Google Scholar] [CrossRef]
- Enviromena. Masdar City’s 10MW Solar PV Plant. Available online: http://enviromena.com/casestudies/masdar-city-abu-dhabi-uae-and-quweira-jordan/ (accessed on 15 April 2022).
- Shams, U.A.E. Available online: https://shamspower.ae/en/ (accessed on 15 April 2022).
- Gevorgyan, S.A.; Jorgensen, M.; Krebs, F.C.; Sylvester-Hvid, K.O. A compact multichamber setup for degradation and lifetime studies of organic solar cells. Sol. Energy Mater. Sol. Cells 2011, 95, 1389–1397. [Google Scholar] [CrossRef]
- Masdar, P.V. Available online: www.masdarpv.com (accessed on 15 April 2022).
- Subhan, A.; Mourad, A.-H.I. Manufacturing and Performance Assessment of Solar Photo-Voltaic Modules by Adopting Various Heat Dissipation Techniques: A Review. In Proceedings of the ASME 2021 International Mechanical Engineering Congress and Exposition, Online, 1–5 November 2021. [Google Scholar] [CrossRef]
- El-Shobokshy, M.S.; Hussein, F.M. Degradation of photovoltaic cell performance due to dust deposition on to its surface. Renew. Energy 1993, 3, 585–590. [Google Scholar] [CrossRef]
- Darwish, Z.A.; Kazem, H.A.; Sopian, K.; Al-Goul, M.A.; Alawadhi, H. Effect of dust pollutant type on photovoltaic performance. Renew. Sustain. Energy Rev. 2015, 41, 735–744. [Google Scholar] [CrossRef]
- Krishnapriya, R.; Nizamudeen, C.; Saini, B.; Mozumder, M.S.; Sharma, R.K.; Mourad, A.-H. MOF-derived Co2+-doped TiO2 nanoparticles as photoanodes for dye-sensitized solar cells. Sci. Rep. 2021, 11, 1–12. [Google Scholar] [CrossRef] [PubMed]
- Shahid, S.A.; Abdelfattah, M.A. Gypsum Polymorphism in the Desert Environment of Abu Dhabi Emirate. Eur. J. Sci. Res. 2009, 29, 237–248. [Google Scholar]
- Zhang, S.; Wu, Z.; Liu, Z.; Lv, Y.; Hu, Z. Nanostructured Broadband Solar Absorber for Effective Photothermal Conversion and Electricity Generation. Energies 2022, 15, 1354. [Google Scholar] [CrossRef]
- Alnaser, W.; Alnaser, N. The impact of the rise of using solar energy in GCC countries. In Renewable Energy and Sustainable Buildings; Springer: Cham, Switzerland, 2020; pp. 167–183. [Google Scholar]
- Abdelazeez, A.A.A.; Hadia, N.M.A.; Alzaid, M.; Shaban, M.; Mourad, A.-H.I.; Fernández, S.; Rabia, M. Development of CuO nanoporous material as a highly efficient optoelectronic device. Appl. Phys. A 2022, 128, 1–10. [Google Scholar] [CrossRef]
- Maysun Solar. Available online: http://www.maysunsolar.com/index.aspx (accessed on 15 April 2022).
- Vidican, G.; McElvaney, L.; Samulewicz, D.; Al-Saleh, Y. An empirical examination of the development of a solar innovation system in the United Arab Emirates. Energy Sustain. Dev. 2012, 16, 179–188. [Google Scholar] [CrossRef]
- Almadenmena. Available online: http://www.almadenmena.com/ (accessed on 15 April 2022).
- Dusol. Available online: http://www.dusol.ae/index.php (accessed on 15 April 2022).
- MENA. Renewables Status Report 2013. Available online: http://www.ren21.net/Portals/0/documents/activities/Regional%20Reports/MENA_2013_lowres.pdf (accessed on 15 April 2022).
- El-Sayed, M.I. Sedimentological characteristics and morphology of the aeolian sand dunes in the eastern part of the UAE: A case study from Ar Rub Al Khali. Sediment. Geol. 1999, 123, 219–238. [Google Scholar] [CrossRef]
- Ismail, A.M.; Ramirez-Iniguez, R.; Asif, M.; Munir, A.B.; Muhammad-Sukki, F. Progress of solar photovoltaic in ASEAN countries: A review. Renew. Sustain. Energy Rev. 2015, 48, 399–412. [Google Scholar] [CrossRef]
Figure 1.
Population status by year in UAE. Reprinted from Ref. [18] with permission from Elsevier (Copyright 2018).
Figure 1.
Population status by year in UAE. Reprinted from Ref. [18] with permission from Elsevier (Copyright 2018).

Figure 2.
Efficiency of solar cell materials. Source: National Renewable Energy Laboratory. Reprinted with permission from Ref. [35] (CC BY-SA 3.0).
Figure 2.
Efficiency of solar cell materials. Source: National Renewable Energy Laboratory. Reprinted with permission from Ref. [35] (CC BY-SA 3.0).

Figure 3.
The layout of this review.


Figure 5.
Population growth of the seven emirates of the UAE in 2021 based on the last known official population estimate and growth rate [51,52].

Figure 6.
Administrative division map of the UAE. Reprinted from Ref. [18] with permission from Elsevier (Copyright 2018).
Figure 6.
Administrative division map of the UAE. Reprinted from Ref. [18] with permission from Elsevier (Copyright 2018).

Figure 7.
Consumed electricity (GWh) per year in the UAE [62].
Figure 7.
Consumed electricity (GWh) per year in the UAE [62].

Figure 8.
CO2 emission in the UAE [63].
Figure 8.
CO2 emission in the UAE [63].

Figure 9.
Fossil fuel energy consumption in the UAE [63].
Figure 9.
Fossil fuel energy consumption in the UAE [63].

Figure 10.
Referred growth rate of renewable energy capacity in the UAE. Reprinted with permission from Ref. [64].
Figure 10.
Referred growth rate of renewable energy capacity in the UAE. Reprinted with permission from Ref. [64].

Figure 11.
Renewable energy trends in the UAE (installed capacity in MW) [65].
Figure 11.
Renewable energy trends in the UAE (installed capacity in MW) [65].

Figure 12.
Price history of PV modules. Reprinted with permission from Ref. [67].
Figure 12.
Price history of PV modules. Reprinted with permission from Ref. [67].

Figure 13.
Consumed electricity (GWh) by authority [81].
Figure 13.
Consumed electricity (GWh) by authority [81].

Figure 14.
Electricity capacity in DEWA, DoE, SEHA, EWE (MW) [81].
Figure 14.
Electricity capacity in DEWA, DoE, SEHA, EWE (MW) [81].

Figure 15.
Gross generated electricity (GWh) by authority [81].
Figure 15.
Gross generated electricity (GWh) by authority [81].

Figure 16.
Export and import quantity (GWh) to Oman and Saudi Arabia [81].
Figure 16.
Export and import quantity (GWh) to Oman and Saudi Arabia [81].

Figure 17.
Solar projects in the Sheikh Mohammed bin Rashid Al Maktoum Solar Park, Noor 1 Photovoltaic Solar Power Project, Um Al-Zomul off-grid power project, and Shams 1 [92].
Figure 17.
Solar projects in the Sheikh Mohammed bin Rashid Al Maktoum Solar Park, Noor 1 Photovoltaic Solar Power Project, Um Al-Zomul off-grid power project, and Shams 1 [92].

Figure 18.
Solar projects in Masdar 10 MW Solar Power Plant, the Murawah Island PV plant, Abu Dhabi solar rooftop program, and the Sweihan Photovoltaic Independent Power Project, Abu Dhabi.
Figure 18.
Solar projects in Masdar 10 MW Solar Power Plant, the Murawah Island PV plant, Abu Dhabi solar rooftop program, and the Sweihan Photovoltaic Independent Power Project, Abu Dhabi.

Figure 19.
Solar projects in (a–e) Egypt and (f) in Jordan.

Figure 20.
(a) Schematic illustration of the preparation of photothermal materials PANI on a porous anodic aluminum oxide (AAO) membrane. The SEM images of (b) AAO and (c) PANI-AAO. Reprinted with permission from Ref. [107].
Figure 20.
(a) Schematic illustration of the preparation of photothermal materials PANI on a porous anodic aluminum oxide (AAO) membrane. The SEM images of (b) AAO and (c) PANI-AAO. Reprinted with permission from Ref. [107].


Table 1.
DoE electricity tariff by slab rate sector in 2016 [85].
Table 1.
DoE electricity tariff by slab rate sector in 2016 [85].
| Sector | Nationality | Unit Type | Slab Rate | Category | Tariff (fils/kWh) |
|---|---|---|---|---|---|
| Residential | National | Flat | Less than or equal 30 | 5 | |
| Residential | National | Flat | More than 30 | 5.50 | |
| Residential | National | Villa | Less than or equal 400 | 5.00 | |
| Residential | National | Villa | More than 400 | 5.50 | |
| Residential | Expat | Flat | Less than or equal 20 | 21.00 | |
| Residential | Expat | Flat | More than 20 | 31.80 | |
| Residential | Expat | Villa | Less than or equal 200 | 21.00 | |
| Residential | Expat | Villa | More than 200 | 31.80 | |
| Commercial | Fixed | 16.00 | |||
| Industrial | Load < 1 MW | 16.00 | |||
| Industrial | Load > 1 MW | Out of Peak | 16.00 | ||
| Industrial | Load > 1 MW | During Peak | 30.00 | ||
| Agriculture | Fixed | 3.00 | |||
| Livestock and Fisheries | Fixed | 16.00 | |||
| Governmental | Fixed | 29.70 |
Table 2.
Electricity tariffs of DEWA, SEWGA, and EWE authorities’ slab rate sector in 2016 [85].
Table 2.
Electricity tariffs of DEWA, SEWGA, and EWE authorities’ slab rate sector in 2016 [85].
| Authority | Sector | Nationality | Slab Rate | Tariff (fils/kWh) |
|---|---|---|---|---|
| DEWA | Residential | National | 2000 to 2001 | 7.5 |
| Residential | National | 4000 to 2001 | 9.0 | |
| Residential | National | 6000 to 4001 | 10.5 | |
| Residential | National | 6001+ | 12.5 | |
| Residential | Expat | 2000 to 2001 | 23.0 | |
| Residential | Expat | 4000 to 2001 | 28.0 | |
| Residential | Expat | 6000 to 4001 | 32.0 | |
| Residential | Expat | 6001+ | 38.0 | |
| Commercial | 2000 to 2001 | 23.0 | ||
| Commercial | 4000 to 2001 | 28.0 | ||
| Commercial | 6000 to 4001 | 32.0 | ||
| Commercial | 6001+ | 38.0 | ||
| Industrial | 10,000 to 10,001 | 23.0 | ||
| Industrial | 10,001+ | 38.0 | ||
| Agriculture | ||||
| Governmental | 10,000 to 10,001 | 23.0 | ||
| Governmental | 100,001+ | 38.0 | ||
| SEWGA | Residential | National | 2000 to 2001 | 7.5 |
| Residential | National | 4000 to 2001 | 7.5 | |
| Residential | National | 6000 to 4001 | 7.5 | |
| Residential | National | 6001+ | 7.5 | |
| Residential | Expat | 2000 to 2001 | 30.0 | |
| Residential | Expat | 4000 to 2001 | 33.0 | |
| Residential | Expat | 6000 to 4001 | 37.0 | |
| Residential | Expat | 6001+ | 43.0 | |
| Commercial | 2000 to 2001 | 28.0 | ||
| Commercial | 4000 to 2001 | 33.0 | ||
| Commercial | 6000 to 4001 | 37.0 | ||
| Commercial | 6001+ | 43.0 | ||
| Industrial | 10,000 to 10,001 | 44.0 | ||
| Industrial | 10,001+ | 44.0 | ||
| Agriculture | 7.5 | |||
| Governmental | 10,000 to 10,001 | 40.0 | ||
| Governmental | 100,001+ | 40.0 | ||
| EWE | Residential | National | 2000 to 2001 | 7. |
| Residential | National | 4000 to 2001 | 7.5 | |
| Residential | National | 6000 to 4001 | 7.5 | |
| Residential | National | 6001+ | 7.5 | |
| Residential | Expat | 2000 to 2001 | 28.0 | |
| Residential | Expat | 4000 to 2001 | 33.0 | |
| Residential | Expat | 6000 to 4001 | 37.0 | |
| Residential | Expat | 6001+ | 43.0 | |
| Commercial | 2000 to 2001 | 28.0 | ||
| Commercial | 4000 to 2001 | 33.0 | ||
| Commercial | 6000 to 4001 | 37.0 | ||
| Commercial | 6001+ | 43.0 | ||
| Industrial | 10,000 to 10,001 | 44.0 | ||
| Industrial | 10,001+ | 44.0 | ||
| Agriculture | 7.5 | |||
| Governmental | 10,000 to 10,001 | 28.0 | ||
| Governmental | 100,001+ | 43.0 |
Table 3.
List of the five phases of the Sheikh Mohammed bin Rashid Al Maktoum solar project with main characteristics.
Table 3.
List of the five phases of the Sheikh Mohammed bin Rashid Al Maktoum solar project with main characteristics.
| Phases | Capacity (MW) | Panel Type | Area | Reduction of CO2 Emissions/Annually | Main Characteristics |
|---|---|---|---|---|---|
| First | 13 | PV | 280 km2 | 15,000 tonnes | This phase consists of around 152,000 PV solar panels linked to 13 transformers in inverter buildings. The output is converted to 33 kV and annually generates about 28 million kilowatt-hours (kWh) of electricity. |
| Second | 200 | PV | 4.5 km2 | 214,000 tonnes | Based on Independent Power Producer (IPP) model. This phase installed 2.3 million PV solar panels with a total investment of AED 1.2 billion with a consortium of Saudi Arabia’s ACWA Power and Spain’s TSK. |
| Third | 800 | PV | 4.48 km2 | Based on the IPP model. This project makes use of 806,992 PV polycrystalline panels. DEWA controls 60% of the enterprise, while the consortium owns the other 40%, with Masdar owning 24% and EDF Energies Nouvelles owning 16%. | |
| Fourth | 950 | CSP and PV | Largest single-site CSP solar project in the world situated on the IPP model. The project will cost AED 14.2 billion. It is being carried out by a consortium that includes the Silk Road Fund, ACWA Power–Saudi Arabia, and Shanghai Electric–China. | ||
| Fifth | 900 | PV | This phase, starting in Quarter 2 of 2021, will be commissioned in stages. |
Table 4.
List of solar energy projects in Abu Dhabi emirate with main characteristics.
| Solar Projects in Abu Dhabi | Capacity | Panel Type | Area | Reduction of CO2 Emissions/Annually | Main Characteristics |
|---|---|---|---|---|---|
| Solar PV Farm-Masdar City | 10 MW | PV | 220 km2 | 15,000 tonnes | This facility generates 17,500 MWh of renewable power/year. Suntech and First Solar Company use a total of 87,777 polycrystalline (silicon) and 69,048 thin-film modules (CdTe). |
| Shams 1 plant | 100 MW | CSP | 2.5 km2 | 175,000 tonnes | The world’s first and biggest operational CSP plant in North Africa and the Middle East. The project will cost USD 600 million. It is the first CSP plant to be recognized by the United Nations as a Clean Development Mechanism (CDM) project. This project also incorporates a dry-cooling system. |
| Noor 1 solar plant | 100 MW | PV | This plant is located in Al Ain, Abu Dhabi. The first will consist of around 50 MW of crystalline PV modules, while the second will consist of approximately 50 MW thin-film modules east of Al Ain city, with an annual output projection of 170 GWh. | ||
| Um Al Zomul off-grid PV plant | 100 kW | PV | 130 tonnes | The desert off-grid installation plant. This plant’s solar energy penetration is based on 100% of the farm’s power demand. | |
| Murawah Island | 500 kW | PV | 710 tonnes | On Murawah Island, Masdar built a grid-connected solar PV facility off the coastline of the UAE. | |
| Abu Dhabi-Rooftop solar program | 2.3 MW | PV | 3220 tonnes | Installed in 11 municipality engineering houses. Eleven rooftop systems were installed due to this program. The initiative is intended to encourage private individuals, businesses, and other entities to install solar panels. | |
| Sweihan independent power project | 1177 MW | PV | 780-hectare | 7 million tonnes | Based on the IPP model. The project’s anticipated investment is USD 870 million. The project is being carried out by the DoE in collaboration with the Japanese firm Marubeni and the Chinese manufacturer JinkoSolar. JinkoSolar will supply high-efficiency monocrystalline PV modules for the solar power plant. DoE owns 60% of the joint venture, while Marubeni and Jinko Solar share the remaining 40%. |
Table 5.
List of major solar energy industries in the UAE’s seven emirates.
| Sl. No. | Emirates | The Major Solar Energy Companies in UAE |
|---|---|---|
| 1 | Fujairah | Micro-sol International Co., |
| 2 | Dubai | Maysun Solar FZCO |
| 3 | Dubai | Almaden MENA FZE |
| 4 | Dubai | DuSol |
| 5 | Abu Dhabi | Enviromena |
Publisher’s Note: MDPI stays neutral with regard to jurisdictional claims in published maps and institutional affiliations. |
© 2022 by the authors. Licensee MDPI, Basel, Switzerland. This article is an open access article distributed under the terms and conditions of the Creative Commons Attribution (CC BY) license (https://creativecommons.org/licenses/by/4.0/).
Share and Cite
MDPI and ACS Style
Ramachandran, T.; Mourad, A.-H.I.; Hamed, F. A Review on Solar Energy Utilization and Projects: Development in and around the UAE. Energies 2022, 15, 3754. https://0-doi-org.brum.beds.ac.uk/10.3390/en15103754
AMA Style
Ramachandran T, Mourad A-HI, Hamed F. A Review on Solar Energy Utilization and Projects: Development in and around the UAE. Energies. 2022; 15(10):3754. https://0-doi-org.brum.beds.ac.uk/10.3390/en15103754
Chicago/Turabian StyleRamachandran, Tholkappiyan, Abdel-Hamid I. Mourad, and Fathalla Hamed. 2022. "A Review on Solar Energy Utilization and Projects: Development in and around the UAE" Energies 15, no. 10: 3754. https://0-doi-org.brum.beds.ac.uk/10.3390/en15103754
Note that from the first issue of 2016, this journal uses article numbers instead of page numbers. See further details here.