
Energy Transition Pathways for Deep Decarbonization of the Greater Montreal Region: An Energy Optimization Framework

 ,
,  , ,
, ,
Abstract
:1. Introduction
2. Literature Review
3. Methodology
3.1. ETEM Model Description
3.2. Adapting the ETEM to the Greater Montreal Region
4. Scenarios
- Business as usual (BAU): This scenario is a reference scenario that includes all current provincial policies, such as governmental financial incentives for a large adoption of electric vehicles. However, this scenario imposes no limitation on GHG emissions. In other words, this scenario is a disengagement from the state targets in the sense that no further climate measures are enforced beyond those already in place.
- GHG1: A GHG emission reduction scenario with a 37.5% reduction target by 2030, and a 53% reduction target by 2050 (relative to 1990).
- GHG2: A more stringent reduction scenario with a 37.5% GHG-reduction target by 2030, and continuing the same reduction trend until 2050, which yields a 73% emission reduction (relative to 1990).
- GHG3: A deep decarbonization scenario which assumes a linear GHG reduction to achieve a 44% reduction by 2030 and a 93% reduction by 2050 (relative to 1990).
5. Results
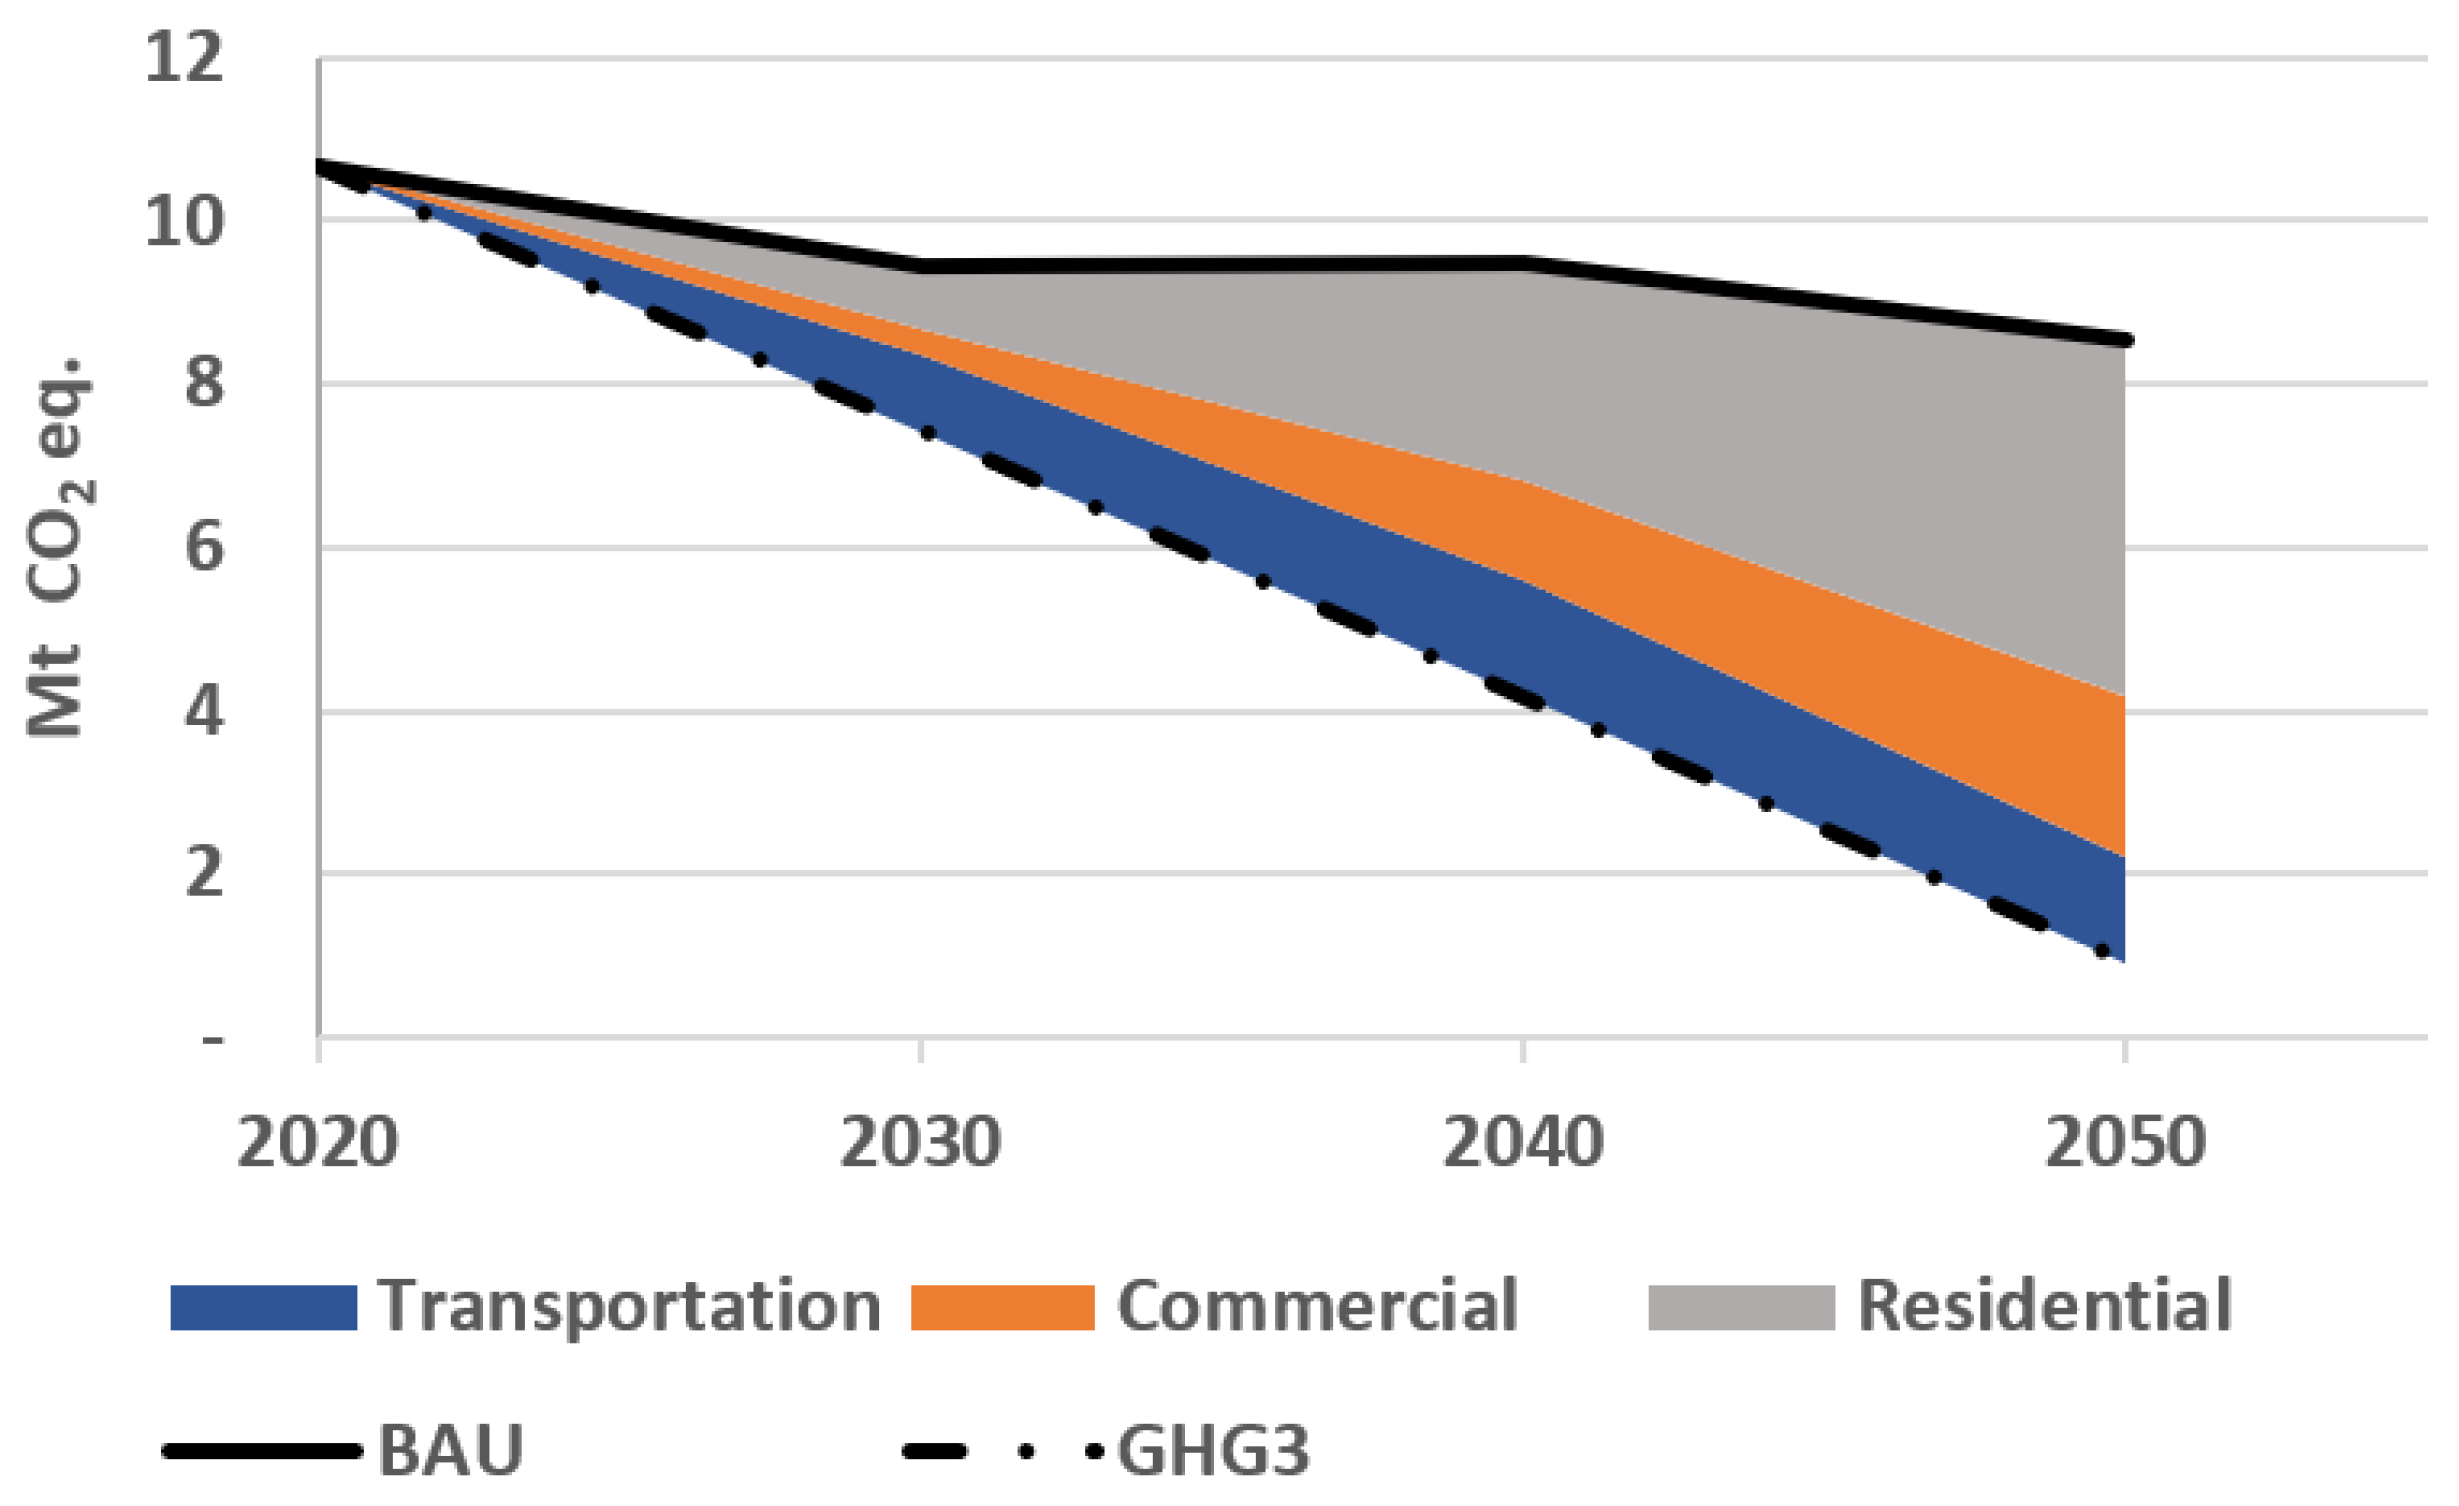
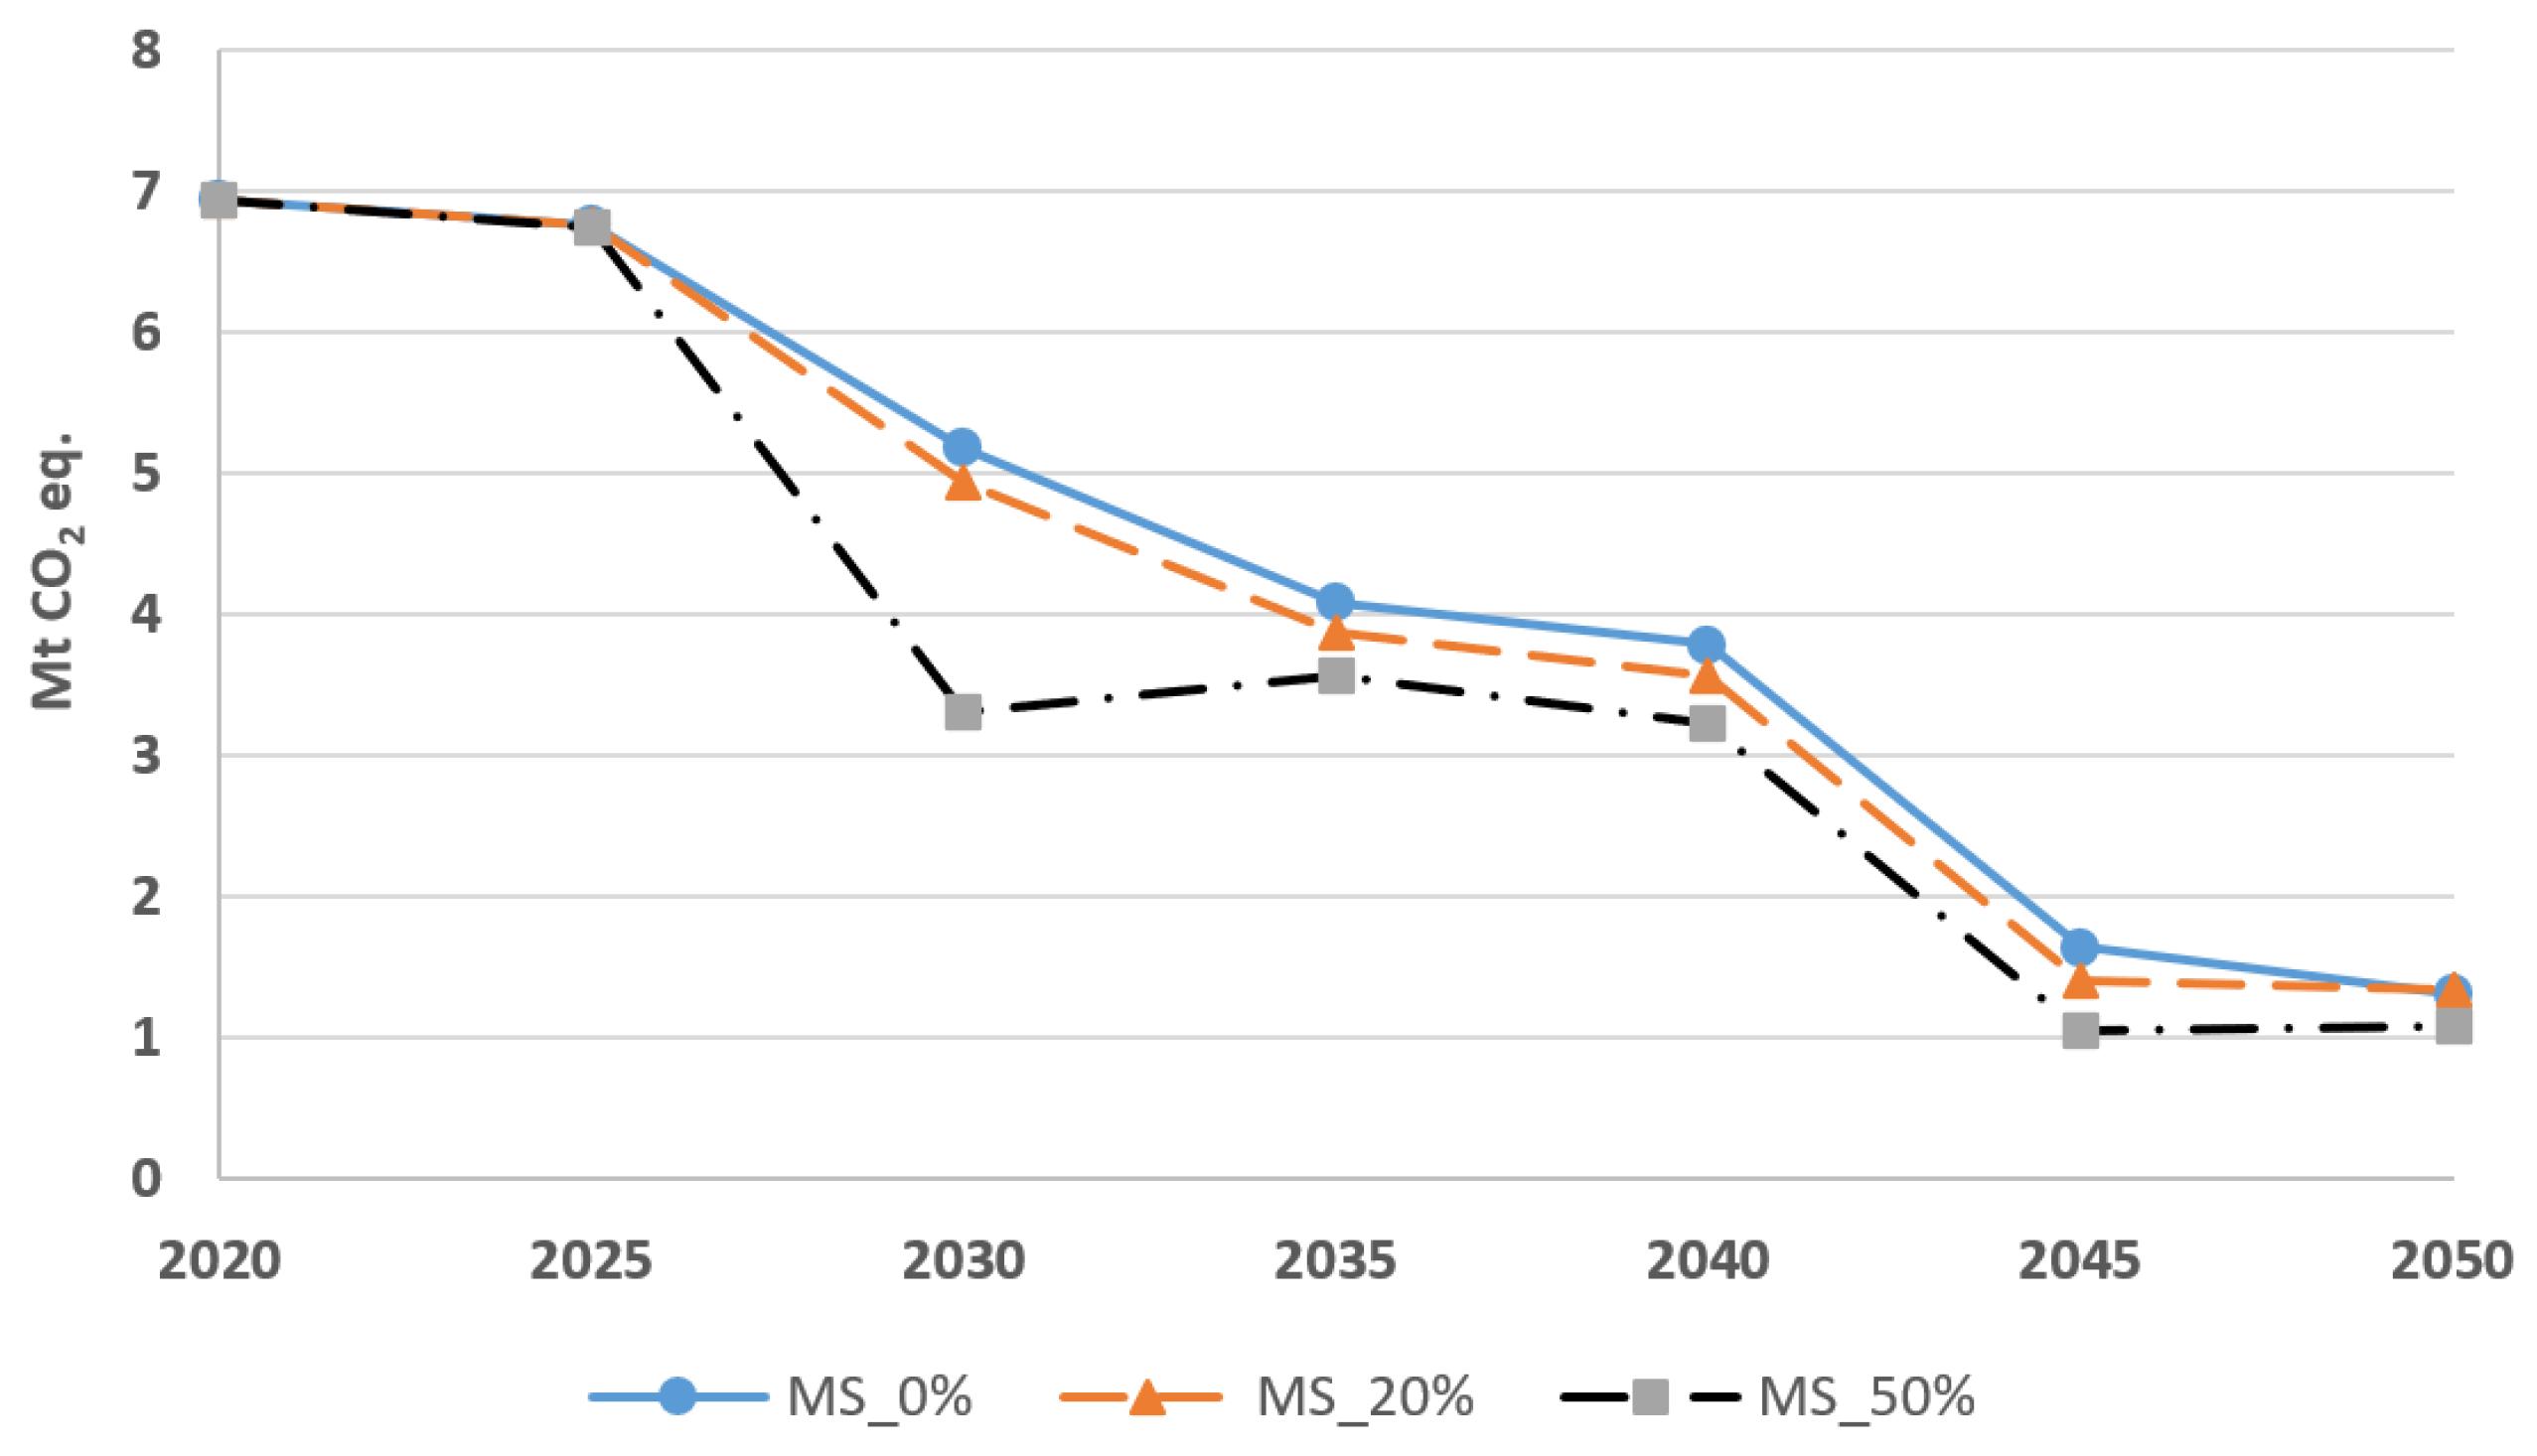
5.1. GHG Emissions
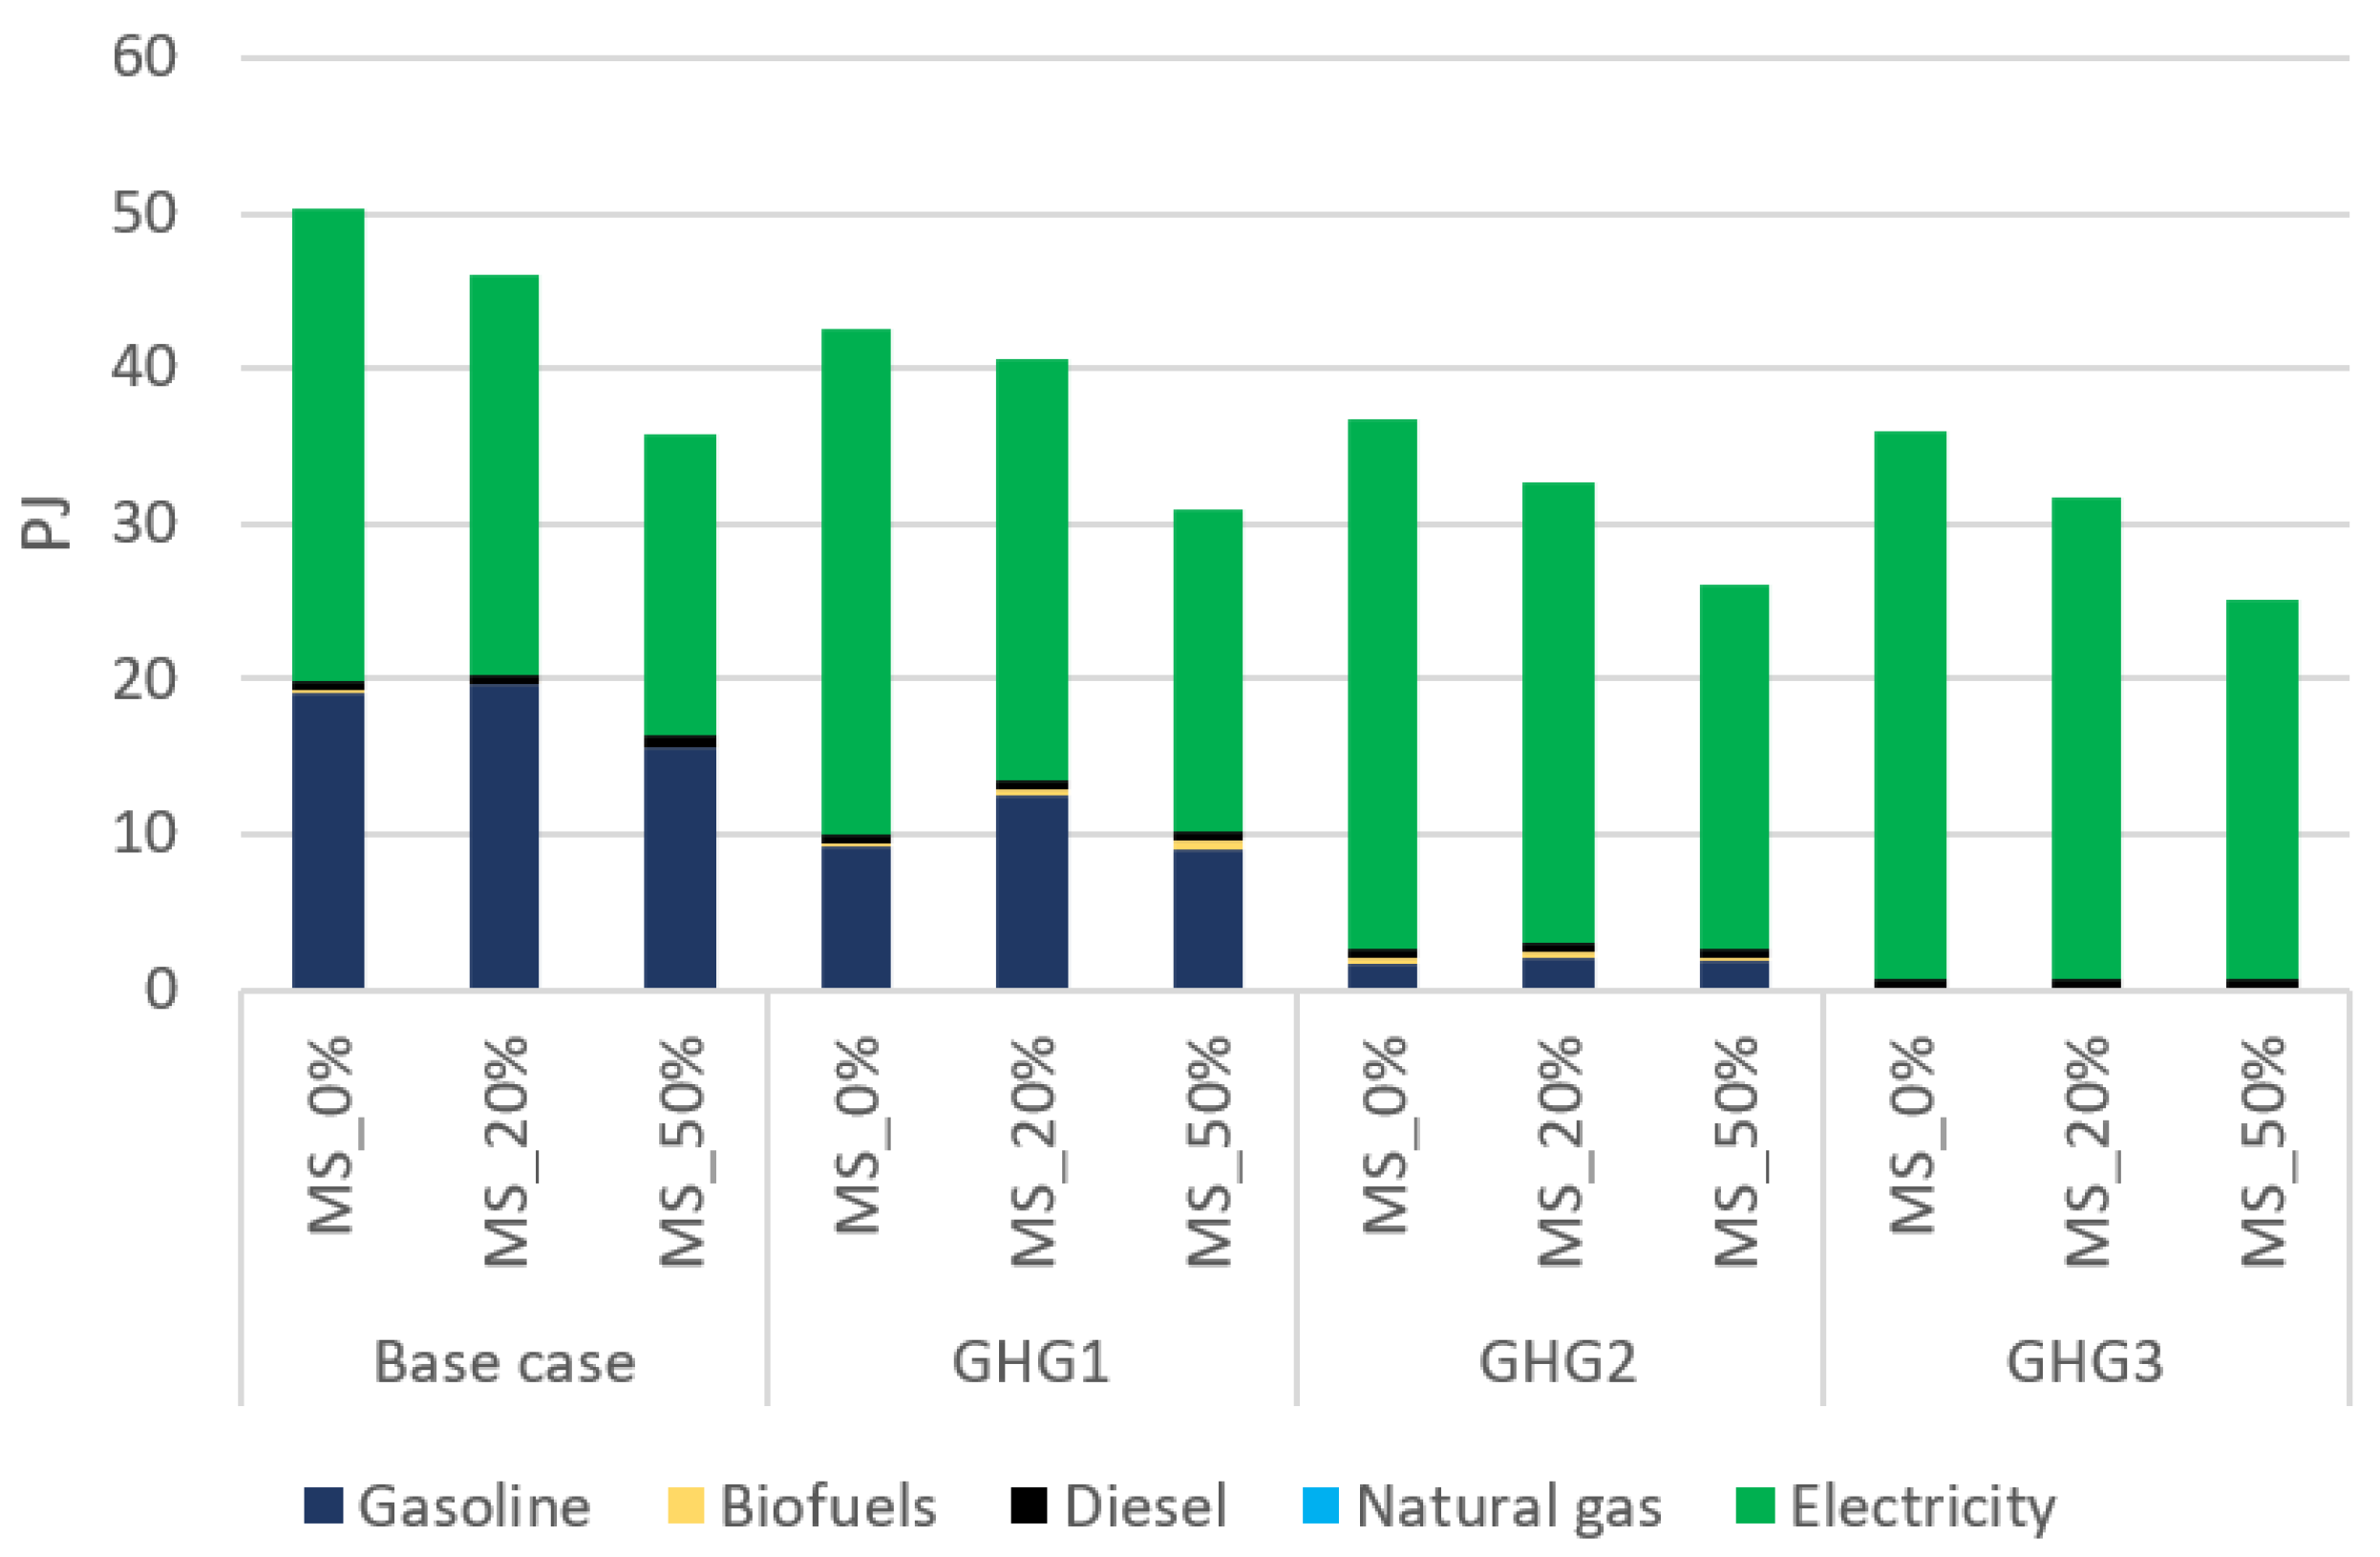
5.2. Final Energy Consumption
5.3. Sensitivity Analysis
6. Discussion
7. Conclusions
Author Contributions
Funding
Institutional Review Board Statement
Informed Consent Statement
Data Availability Statement
Conflicts of Interest
Nomenclatures
| Index for time period | Capacity factor | ||
| Index for time slices | Network efficiency | ||
| Index for technologies | Technology efficiency | ||
| Index for energy commodities | Transmission cost | ||
| Index for energy storage | Export cost | ||
| Index for energy flows | Import cost | ||
| Index for buses (geographical zones) | Maximum deviation from | ||
| Index for seasons | nominal demand response | ||
| Index for period-seasons | Variable cost | ||
| Set of technologies consuming c | Available capacity of technology p | ||
| Set of technologies producing c | Fixed production cost | ||
| Set of intermittent technologies | Discount factor | ||
| Set of imported commodities | Proportion of output c from technology | ||
| Set of useful demands | p that can be used in peak period | ||
| Set of exported commodities | Life duration of technology p | ||
| Set of transmitted commodities | Annual final demand | ||
| Set of commodities linked to flow f | Nominal demand response | ||
| Set of commodities with margin reserve | Required reserve for commodity | ||
| Set of time slices s in season j | Variable for new capacity addition | ||
| Set of successive time slices of s | Total installed capacity | ||
| Set of time slices in peak period | Variable for activity of technology p | ||
| Set of inputs to technology p | Variable for import | ||
| Set of outputs from technology p | Variable for export | ||
| Investment cost | Variable for regional transmission | ||
| Variable for demand response |
Appendix A. ETEM Formulation
Appendix B. GM Energy Database

| Sector | Demand Type | Unit | Number of Technologies | Fuels 1 |
|---|---|---|---|---|
| residential | Heating | TJ | 17 | NGA, ELC, LFO, PRO, BIO |
| Cooling | TJ | 6 | ELC | |
| Other | TJ | 2 | NGA, ELC, LFO, PRO, BIO | |
| Commercial | Heating | TJ | 21 | NGA, ELC, HET, LFO, HFO, PRO |
| Cooling | TJ | 9 | NGA, ELC | |
| Other | TJ | 10 | NGA, ELC, HET, LFO, HFO, PRO | |
| Trnasportation | Light-duty vehicles | tkmv/d | 7 | GSL, ETH, ELC, DST, BSL |
| Public transportation | tkmv/d | 10 | GSL, ETH, ELC, DST, BSL, NGA | |
| Metro | tkmv/d | 2 | ELC | |
| Train | tkmv/d | 2 | DST, BSL | |
| Other | tkmv/d | 1 | GSL, ETH, ELC, DST, BSL, NGA, LFO, HFO, ATR |
References
- Pörtner, H.O.; Roberts, D.; Tignor, M.; Poloczanska, E.; Mintenbeck, K.; Alegría, A.; Craig, M.; Langsdorf, S.; Löschke, S.; Möller, V.; et al. (Eds.) Climate Change 2022: Impacts, Adaptation, and Vulnerability. Contribution of Working Group II to the Sixth Assessment Report of the Intergovernmental Panel on Climate Change; Technical Report; IPCC: Geneva, Switzerland; Cambridge University Press: Cambridge, UK, 2022; in press. [Google Scholar]
- IEA. Empowering Cities for a Net Zero Future; Technical Report; IEA: Paris, France, 2021. [Google Scholar]
- 68% of the World Population Projected to Live in Urban Areas by 2050, Says UN. Available online: https://www.un.org/development/desa/en/news/population/2018-revision-of-world-urbanization-prospects.html (accessed on 26 April 2022).
- Dias, L.; Simões, S.; Gouveia, J.; Seixas, J. City energy modelling-Optimising local low carbon transitions with household budget constraints. Energy Strategy Rev. 2019, 26, 100387. [Google Scholar] [CrossRef]
- CFUT. Climate Emergency Urban Opportunity, How National Governments Can Secure Economic Prosperity and Avert Climate Catastrophe by Transforming Cities; Technical Report; Coalition For Urban Transitions (CFUT): Washington, DC, USA, 2019. [Google Scholar]
- Coelho, S.; Russo, M.; Oliveira, R.; Monteiro, A.; Lopes, M.; Borrego, C. Sustainable energy action plans at city level: A Portuguese experience and perception. J. Clean. Prod. 2018, 176, 1223–1230. [Google Scholar] [CrossRef] [Green Version]
- Albana, K.; Giulia, M.; Paolo, Z.; Andreea, I.; Greet, J.M.; Brigitte, K.; Rivas, C.S.; Fabio, M.F.; Paolo, B. Covenant of Mayors: Greenhouse Gas Emissions Achievements and Projections; Technical Report; Publications Office of the European Union: Luxembourg, 2016. [Google Scholar]
- Municipalities for Climate Innovation Program. Available online: https://fcm.ca/en/programs/municipalities-climate-innovation-program (accessed on 26 April 2022).
- Municipal, M. Plan Climat 2020–2030, Pour une Ville Inclusive, Résiliente et Carboneutre; Technical Report; Montreal Municipal: Montreal, QC, Canada, 2020. [Google Scholar]
- Whitmore, J.; Pineau, P.O. The State Of Energy in Quebec-2019; Technical Report; Chair of Energy Sector Management, HEC Montreal: Montreal, QC, Canada, 2019. [Google Scholar]
- Babonneau, F.; Caramanis, M.; Haurie, A. ETEM-SG: Optimizing Regional Smart Energy System with Power Distribution Constraints and Options. Environ. Model. Assess. 2017, 22, 411–430. [Google Scholar] [CrossRef] [Green Version]
- Forsberg, J. Energy Transition in Transportation: Applying TIMES-Based Energy System Optimisation Models to Sub-National Levels. Ph.D. Thesis, Luleå University of Technology, Luleå, Sweden, 2021. [Google Scholar]
- Acha, S.; Mariaud, A.; Shah, N.; Markides, C.N. Optimal design and operation of distributed low-carbon energy technologies in commercial buildings. Energy 2018, 142, 578–591. [Google Scholar] [CrossRef]
- Mehleri, E.; Sarimveis, H.; Markatos, N.; Papageorgiou, L. Optimal design and operation of distributed energy systems: Application to Greek residential sector. Renew. Energy 2013, 51, 331–342. [Google Scholar] [CrossRef]
- Forsberg, J.; Krook-Riekkola, A. Recoupling Climate Change and Air Quality: Exploring Low-Emission Options in Urban Transportation Using the TIMES-City Model. Energies 2021, 14, 3220. [Google Scholar] [CrossRef]
- Yuan, X.C.; Lyu, Y.J.; Wang, B.; Liu, Q.H.; Wu, Q. China’s energy transition strategy at the city level: The role of renewable energy. J. Clean. Prod. 2018, 205, 980–986. [Google Scholar] [CrossRef]
- Heinisch, V.; Göransson, L.; Odenberg, M.; Johnsson, F. Interconnection of the electricity and heating sectors to support the energy transition in cities. Int. J. Sustain. Energy Plan. Manag. 2019, 24, 57–66. [Google Scholar]
- Maroufmashat, A.; Sattari, S.; Roshandel, R.; Fowler, M.; Elkamel, A. Multi-objective Optimization for Design and Operation of Distributed Energy Systems through the Multi-energy Hub Network Approach. Ind. Eng. Chem. Res. 2016, 55, 8950–8966. [Google Scholar] [CrossRef]
- Maroufmashat, A.; Elkamel, A.; Fowler, M.; Sattari, S.; Roshandel, R.; Hajimiragha, A.; Walker, S.; Entchev, E. Modeling and optimization of a network of energy hubs to improve economic and emission considerations. Energy 2015, 93, 2546–2558. [Google Scholar] [CrossRef]
- Vaillancourt, K.; Bahn, O.; Sigvaldason, O. The Canadian Contribution to Limiting Global Warming Below 2 °C: An Analysis of Technological Options and Regional Cooperation. In Limiting Global Warming to Well below 2 °C: Energy System Modelling and Policy Development; Giannakidis, G., Karlsson, K., Labriet, M., Gallachóir, B.Ó., Eds.; Springer International Publishing: Cham, Switzerland, 2018; pp. 227–244. [Google Scholar]
- Shakouri, H.; Aliakbarisani, S. At what valuation of sustainability can we abandon fossil fuels? A comprehensive multistage decision support model for electricity planning. Energy 2016, 107, 60–77. [Google Scholar] [CrossRef]
- Mirakyan, A.; De Guio, R. Integrated energy planning in cities and territories: A review of methods and tools. Renew. Sustain. Energy Rev. 2013, 22, 289–297. [Google Scholar] [CrossRef]
- Scheller, F.; Bruckner, T. Energy system optimization at the municipal level: An analysis of modeling approaches and challenges. Renew. Sustain. Energy Rev. 2019, 105, 444–461. [Google Scholar] [CrossRef]
- Dagoumas, A. Modelling socio-economic and energy aspects of urban systems. Sustain. Cities Soc. 2014, 13, 192–206. [Google Scholar] [CrossRef]
- Xydis, G. Development of an integrated methodology for the energy needs of a major urban city: The case study of Athens, Greece. Renew. Sustain. Energy Rev. 2012, 16, 6705–6716. [Google Scholar] [CrossRef]
- Elizondo, A.; Pérez-Cirera, V.; Strapasson, A.; Fernández, J.C.; Cruz-Cano, D. Mexico’s low carbon futures: An integrated assessment for energy planning and climate change mitigation by 2050. Futures 2017, 93, 14–26. [Google Scholar] [CrossRef]
- Lind, A.; Espegren, K. The use of energy system models for analysing the transition to low-carbon cities—The case of Oslo. Energy Strategy Rev. 2017, 15, 44–56. [Google Scholar] [CrossRef]
- Andrey, C.; Babonneau, F.; Haurie, A.; Labriet, M. Modélisation stochastique et robuste de l’atténuation et de l’adaptation dans un système énergétique régional. Application à la région Midi-Pyrénées. Nat. Sci. Soc. 2015, 23, 133–149. [Google Scholar] [CrossRef] [Green Version]
- Babonneau, F.; Haurie, A.; Tarel, G.; Thénié, J. Assessing the Future of Renewable and Smart Grid Technologies in Regional Energy Systems. Swiss Econ. Stat. 2012, 148, 229–273. [Google Scholar] [CrossRef] [Green Version]
- Babonneau, F.; Caramanis, M.; Haurie, A. A linear programming model for power distribution with demand response and variable renewable energy. Appl. Energy 2016, 181, 83–95. [Google Scholar] [CrossRef]
- Babonneau, F.; Haurie, A. Energy Technology Environment Model with Smart Grid and Robust Nodal Electricity Prices. Ann. Oper. Res. 2019, 274, 101–117. [Google Scholar] [CrossRef] [Green Version]
- Aliakbari Sani, S.; Bahn, O.; Delage, E. Affine Decision Rule Approximation to Address Demand Response Uncertainty in Smart Grids’ Capacity Planning. Eur. J. Oper. Res. 2022; in press. [Google Scholar] [CrossRef]
- Babonneau, F.; Foguen, R.; Haurie, A.; Malhame, R. Coupling a Power Dispatch Model with a Wardrop or Mean-Field-Game Equilibrium Model. Dyn. Games Appl. 2020, 11, 217–241. [Google Scholar] [CrossRef]
- Aliakbarisani, S.; Bahn, O.; Delage, E.; Foguen, R. Robust Integration of Electric Vehicles Charging Load in Smart Grid’s Capacity Expansion Planning; GERAD, HEC Montréal: Montreal, QC, Canada, 2021; G-2021-44. [Google Scholar]
- Vaillancourt, K.; Bahn, O.; Frenette, E.; Sigvaldason, O. Exploring deep decarbonization pathways to 2050 for Canada using an optimization energy model framework. Appl. Energy 2017, 195, 774–785. [Google Scholar] [CrossRef]
- Vaillancourt, K.; Bahn, O.; Roy, P.O.; Patreau, V. Is there a future for new hydrocarbon projects in a decarbonizing energy system? A case study for Quebec (Canada). Appl. Energy 2018, 218, 114–130. [Google Scholar] [CrossRef]
- Vaillancourt, K.; Bahn, O.; Levasseur, A. The role of bioenergy in low-carbon energy transition scenarios: A case study for Quebec (Canada). Renew. Sustain. Energy Rev. 2019, 102, 24–34. [Google Scholar] [CrossRef]
- Kouchaki-Penchah, H.; Bahn, O.; Vaillancourt, K.; Levasseur, A. The contribution of forest-based bioenergy in achieving deep decarbonization: Insights for Quebec (Canada) using a TIMES approach. Energy Convers. Manag. 2022, 252, 115081. [Google Scholar] [CrossRef]
- Statistics Canada. Supply and Demand of Primary and Secondary Energy in Terajoules, Annual. Interactive Database for Years 2016–2020. Table: 25-10-0029-01 (Formerly CANSIM 128-0016). 2021. Available online: https://www150.statcan.gc.ca/t1/tbl1/en/cv.action?pid=2510002901requestlocale=en (accessed on 19 April 2020).
- Statistics Canada. Statistics Canada. Supply and Disposition of Refined Petroleum Products, Monthly. Interactive Database for Years 2016–2020. Table: 25-10-0044-01 (Formerly CANSIM 134-0004). 2021. Available online: https://www150.statcan.gc.ca/t1/tbl1/en/tv.action?pid=2510004401 (accessed on 19 April 2020).
- (OEE) Office of Energy Efficiency. Comprehensive Energy Use Database. Years 2016–2018. 2000. Available online: http://oee.nrcan.gc.ca/corporate/statistics/neud/dpa/datae/databases.cfm?attr=0 (accessed on 19 April 2020).
- (CER) Canada Energy Regulator. Canada’s Energy Future. 2021. Available online: https://www.cer-rec.gc.ca/en/data-analysis/canada-energy-future/2021/index.html (accessed on 19 April 2020).
- (EC) Environment Canada. National Inventory Report: Greenhouse Gas Sources and Sinks in Canada 1990–2018. Canada’s Submission to the United Nations Framework Convention on Climate Change. 2020. Available online: http://www.ec.gc.ca/GES-GHG/default.asp?lang=En&n=83A34A7A-1 (accessed on 19 April 2020).
- Fourer, R.; Gay, D.M.; Kernighan, B.W. A Modeling Language for Mathematical Programming. Manag. Sci. 1990, 36, 519–554. [Google Scholar] [CrossRef] [Green Version]
- Cplex, I.I. V12. 1: User’s Manual for CPLEX. Int. Bus. Mach. Corp. 2009, 46, 157. [Google Scholar]


Publisher’s Note: MDPI stays neutral with regard to jurisdictional claims in published maps and institutional affiliations. |
© 2022 by the authors. Licensee MDPI, Basel, Switzerland. This article is an open access article distributed under the terms and conditions of the Creative Commons Attribution (CC BY) license (https://creativecommons.org/licenses/by/4.0/).
Share and Cite
Aliakbari Sani, S.; Maroufmashat, A.; Babonneau, F.; Bahn, O.; Delage, E.; Haurie, A.; Mousseau, N.; Vaillancourt, K. Energy Transition Pathways for Deep Decarbonization of the Greater Montreal Region: An Energy Optimization Framework. Energies 2022, 15, 3760. https://0-doi-org.brum.beds.ac.uk/10.3390/en15103760
Aliakbari Sani S, Maroufmashat A, Babonneau F, Bahn O, Delage E, Haurie A, Mousseau N, Vaillancourt K. Energy Transition Pathways for Deep Decarbonization of the Greater Montreal Region: An Energy Optimization Framework. Energies. 2022; 15(10):3760. https://0-doi-org.brum.beds.ac.uk/10.3390/en15103760
Chicago/Turabian StyleAliakbari Sani, Sajad, Azadeh Maroufmashat, Frédéric Babonneau, Olivier Bahn, Erick Delage, Alain Haurie, Normand Mousseau, and Kathleen Vaillancourt. 2022. "Energy Transition Pathways for Deep Decarbonization of the Greater Montreal Region: An Energy Optimization Framework" Energies 15, no. 10: 3760. https://0-doi-org.brum.beds.ac.uk/10.3390/en15103760