
Comprehensive Optimisation of Biodiesel Production Conditions via Supercritical Methanolysis of Waste Cooking Oil


1
School of Engineering, London South Bank University, London SE1 0AA, UK
2
Department of Chemical Engineering, The British University in Egypt, Misr-Ismalia Road, El-Shorouk City 11837, Egypt
3
School of Chemical and Process Engineering, University of Leeds, Leeds LS2 9JT, UK
4
Department of Chemical Engineering, Port Said University, Port Said 42511, Egypt
5
Engineering Department, Lancaster University, Lancaster LA1 4YW, UK
*
Author to whom correspondence should be addressed.
Energies 2022, 15(10), 3766; https://0-doi-org.brum.beds.ac.uk/10.3390/en15103766
Submission received: 7 April 2022
/
Revised: 12 May 2022
/
Accepted: 17 May 2022
/
Published: 20 May 2022
(This article belongs to the Special Issue Biodiesel and Biofuels Production)
Abstract
:Biodiesel has been established as a promising alternative fuel to petroleum diesel. This study offers a promising energy conversion platform to valorise high acidity waste cooking oil (WCO) into biodiesel in a single-step reaction via supercritical methanol. Carbon dioxide (CO2) has been used as a co-solvent in the reaction with a catalytic effect to enhance the production of biodiesel. This work provides an in-depth assessment of the yield of four fatty acids methyl esters (FAME) from their correspondent triglycerides and fatty acids. The effects of four independent process variables, i.e., methanol to oil (M:O) molar ratio, temperature, pressure, and time, have been investigated using Response Surface Methodology (RSM). Four quadratic models have been developed between process variables and the yield of FAMEs. The statistical validation of the predicted models has been performed using analysis of variance (ANOVA). Numerical optimisation has been employed to predict the optimal conditions for biodiesel production. The predicted optimal conditions are at 25:1 M:O molar ratio, 254.7 °C, 110 bar within 17 min resulting in 99.2%, 99.3%, 99.13%, and 99.05% of methyl-oleate, methyl-palmitate, methyl-linoleate, and methyl-stearate yields, respectively. The predicted optimum conditions have been validated experimentally.
1. Introduction
The global energy demand is continuously increasing as a result of accelerated metropolitan growth and industrialisation. Currently, finite fossil fuels including crude oil, natural gas and coal are considered the main resources of energy. The petroleum price has encountered huge instability due to the high dependence on petroleum derivatives in energy generation and transportation. Global warming, energy security, and environmental pollution are the main global concerns that are continuously discussed by policymakers in recent years. Carbon mitigation strategy has been considered within the governmental agenda of many countries. The possibilities of minimising greenhouse gas (GHG) emissions, developing waste management frameworks, and securing the fuel supply chain network, could be achieved by providing more opportunities for renewable energies to take part in the decision-making system [1,2].
Both environment and energy deterioration are considered serious crises that could be controlled using alternative green and sustainable sources of energy. Bioenergy, wind, and solar energies are considered the main renewable resources that could attribute to reducing the dependence on fossil fuels. In an attempt to have double benefits for the environment, research has been directed towards waste valorisation into energy. Numerous biomass wastes could be used for biofuels production including food wastes, sewerage, animal wastes, agricultural wastes and municipal solid waste [2,3].
The essential demand on releasing the dependence on fossil fuels has boosted technical developments in the biofuels sector as a replacement for petroleum diesel [3]. Biodiesel has been considered an efficient renewable and sustainable replacement for petroleum diesel fuel. Biodiesel has several advantages over petroleum diesel including biodegradability, zero-sulphur emissions, higher cetane number, non-toxicity, lower carbon monoxide, and hydrocarbons emissions, and higher engine lubricity [4]. Currently, biodiesel is mainly produced using edible oils i.e., olive oil, sunflower oil, rapeseed oil, and palm oil. Up to the present time, the main obstacle that restricts the commercialisation of biodiesel production is the high cost of the feedstock. On the other hand, using edible oils for biodiesel production has generated competition with the food industry resulting in increased prices of edible oils. The utilisation of edible oils for biodiesel production has a noticeable effect on food security. Hence, the research has been directed towards non-edible and waste oils [5,6].
Waste cooking oil (WCO) has been considered a potential feedstock for biodiesel production. The implementation of WCO in biodiesel production has several advantages including reduction of the cost of biodiesel feedstock and minimising waste disposal. WCO is usually disposed of in the drainage, which increases the cost of wastewater treatment. Numerous researches have been conducted on biodiesel production using different methodologies i.e., homogenous catalysed processes [7,8], heterogeneously catalysed processes [9], enzymatically catalysed processes [10],and non-catalytic processes [11]. The main obstacle to biodiesel production from WCO is the existence of high free fatty acids (FFA) and water content. The presence of high FFA content in the feedstock enhances the saponification reaction, which lowers the biodiesel yield and prevents the separation of the products [12,13].
Amongst the implemented processes, supercritical alcoholysis is considered an efficient process for the conversion of WCO into biodiesel. The application of supercritical production of biodiesel has been widely implemented due to its capability in transesterification and esterification of triglycerides and FFAs, respectively [14]. Supercritical methanolysis of biodiesel has been proven as an economically favoured process due to the simplicity of the process and the elimination of catalyst preparation and separation [15,16]. Farobie and Matsumura [17] have produced a very interesting review on the supercritical production of biodiesel. They have reported different successful setups both on batch and continuous systems for a high yield of biodiesel. They have reported that the main advantage of supercritical methanol is the high- solubility with oil compared to liquid methanol and hence does not require catalytic approaches for either esterification and/transesterification reactions. Qadeer et al. [14] have also reported the influence of several process parameters affecting the supercritical process from the economic perspective. Our research group has conducted experimental work on high acidity WCO for biodiesel production where we have reported high yield of biodiesel (98%) within optimized reaction conditions at 25:1 M:O molar ratio, 265 °C temperature, 110 bar pressure and 20 min reaction time [18]. A novel integration approach between WCO supercritical methanolysis and lignin depolymerisation has been recently reported by Yusuf et al. [19] where bio-oil produced from lignin has been used to enhance the oxidation stability of biodiesel. Hasan and Smith [11] have studied the continuous supercritical methanolysis of mixed oil into biodiesel and they have achieved 91% yield at 317 °C, 351 bar and 39:1 M:O molar ratio within 15 min reaction time.
The main aim of this work is to study and to compare FAME content produced using supercritical methanolysis to the content of FAME produced using the standard methylation process which is considered as the theoretical conversion of both triglycerides and FFAs with the highest possible yield. FAME yield has been considered as the process response based on the main compositions of WCO. Four regression models have been developed to predict the FAME yield of each FAME component at different process variables. The influence of different reaction variables including M:O molar ratio, temperature, pressure, time and their interactions have been investigated. Optimum conditions have been developed for maximum FAME yield of the biodiesel compositions. Finally, the predicted optimum conditions have been validated using the experimental examination.
2. Materials and methods
2.1. Materials
WCO was collected from random local restaurants and food industries in Egypt. Methanol (>99.5%), sodium chloride, sodium methoxide, iso-octane, n-hexane, sulphuric acid, and phenolphthalein indicator were purchased from Fisher Scientific, Waltham, MA, USA. The standard pure methyl esters used for preparing calibration curves including fatty acid methyl esters (FAME) certified mixture solution (C14-C20), methyl-oleate, methyl-linoleate, methyl-palmitate, methyl-myristate, and methyl-heptadecanoate (internal standard) were purchased from Merck, UK. The liquid CO2 and nitrogen cylinders (99.9%) equipped with a dip tube were purchased from BOC Ltd., Woking, UK.
2.2. Experimental Procedures
2.2.1. Preparation of Standard Fatty Acids
Four pure standards of FAMEs, i.e., methyl-oleate, methyl-palmitate, methyl-linoleate and methyl-mysterate, were dissolved in n-hexane. Five different concentrations were prepared for each standard including 2, 4, 6, 8 and 10 g/L. For quantification purposes, five sets of each FAME standard accompanied by a constant concentration (3 g/L) of internal standard, i.e., methyl-heptadecanoate were prepared in 1.5 mL vials for chromatographic analysis. In addition, a standard mixture solution has been used to verify the retention time of each FAME through an adjusted chromatographic program.
2.2.2. Preparation of Standard Derivatised Sample
The derivatisation process was proceeded according to BS EN ISO 12966-2:2017. In summary, 50 mg of WCO was added to a 10 mL volumetric one-marked flask. Then, a known concentration (0.2 mol/L) of sodium methoxide was added and the mixture was heated to boiling point at which the solution became clear. Then, a known concentration of sulphuric acid in methanol (0.2 mol/L) was added sufficiently until the solution became colourless at which an excess of 0.2 mL of sulphuric acid solution was added. The solution was boiled for 5 min, then 4 mL and 1 mL of sodium chloride solution and iso-octane solution were added, respectively. Finally, the solution was well mixed and left for settling until the upper layer representing the FAME is clear. The produced FAME content from derivatisation was considered as the complete conversion of both triglycerides and FFAs whereas the conversion of other experimental samples was referred to as the conversion of the derivatised sample.
2.2.3. Gas Chromatographic Analysis
The reference derivatised sample and the produced experimental samples were analysed for methyl esters content using a gas chromatograph (GC) (Thermo- Scientific, Trace 1310, Waltham, MA, USA) equipped with an auto-injector (AI/AS 1310 autosampler), capillary column (TR-BD 30 m × 0.25 mm × 0.25 μm) and flame ionisation detector (FID). Both injector and detector temperatures were adjusted at 250 °C. Helium was used as a carrier gas. The temperature programme began at 60 °C and was held for 2 min. Then it ramped with 10 °C/min to 200 °C and directly ramped with 1 °C/min to 210 °C. Finally, the temperature was increased to 240 °C with a ramp rate of 20 °C/min and remained for 7 min.
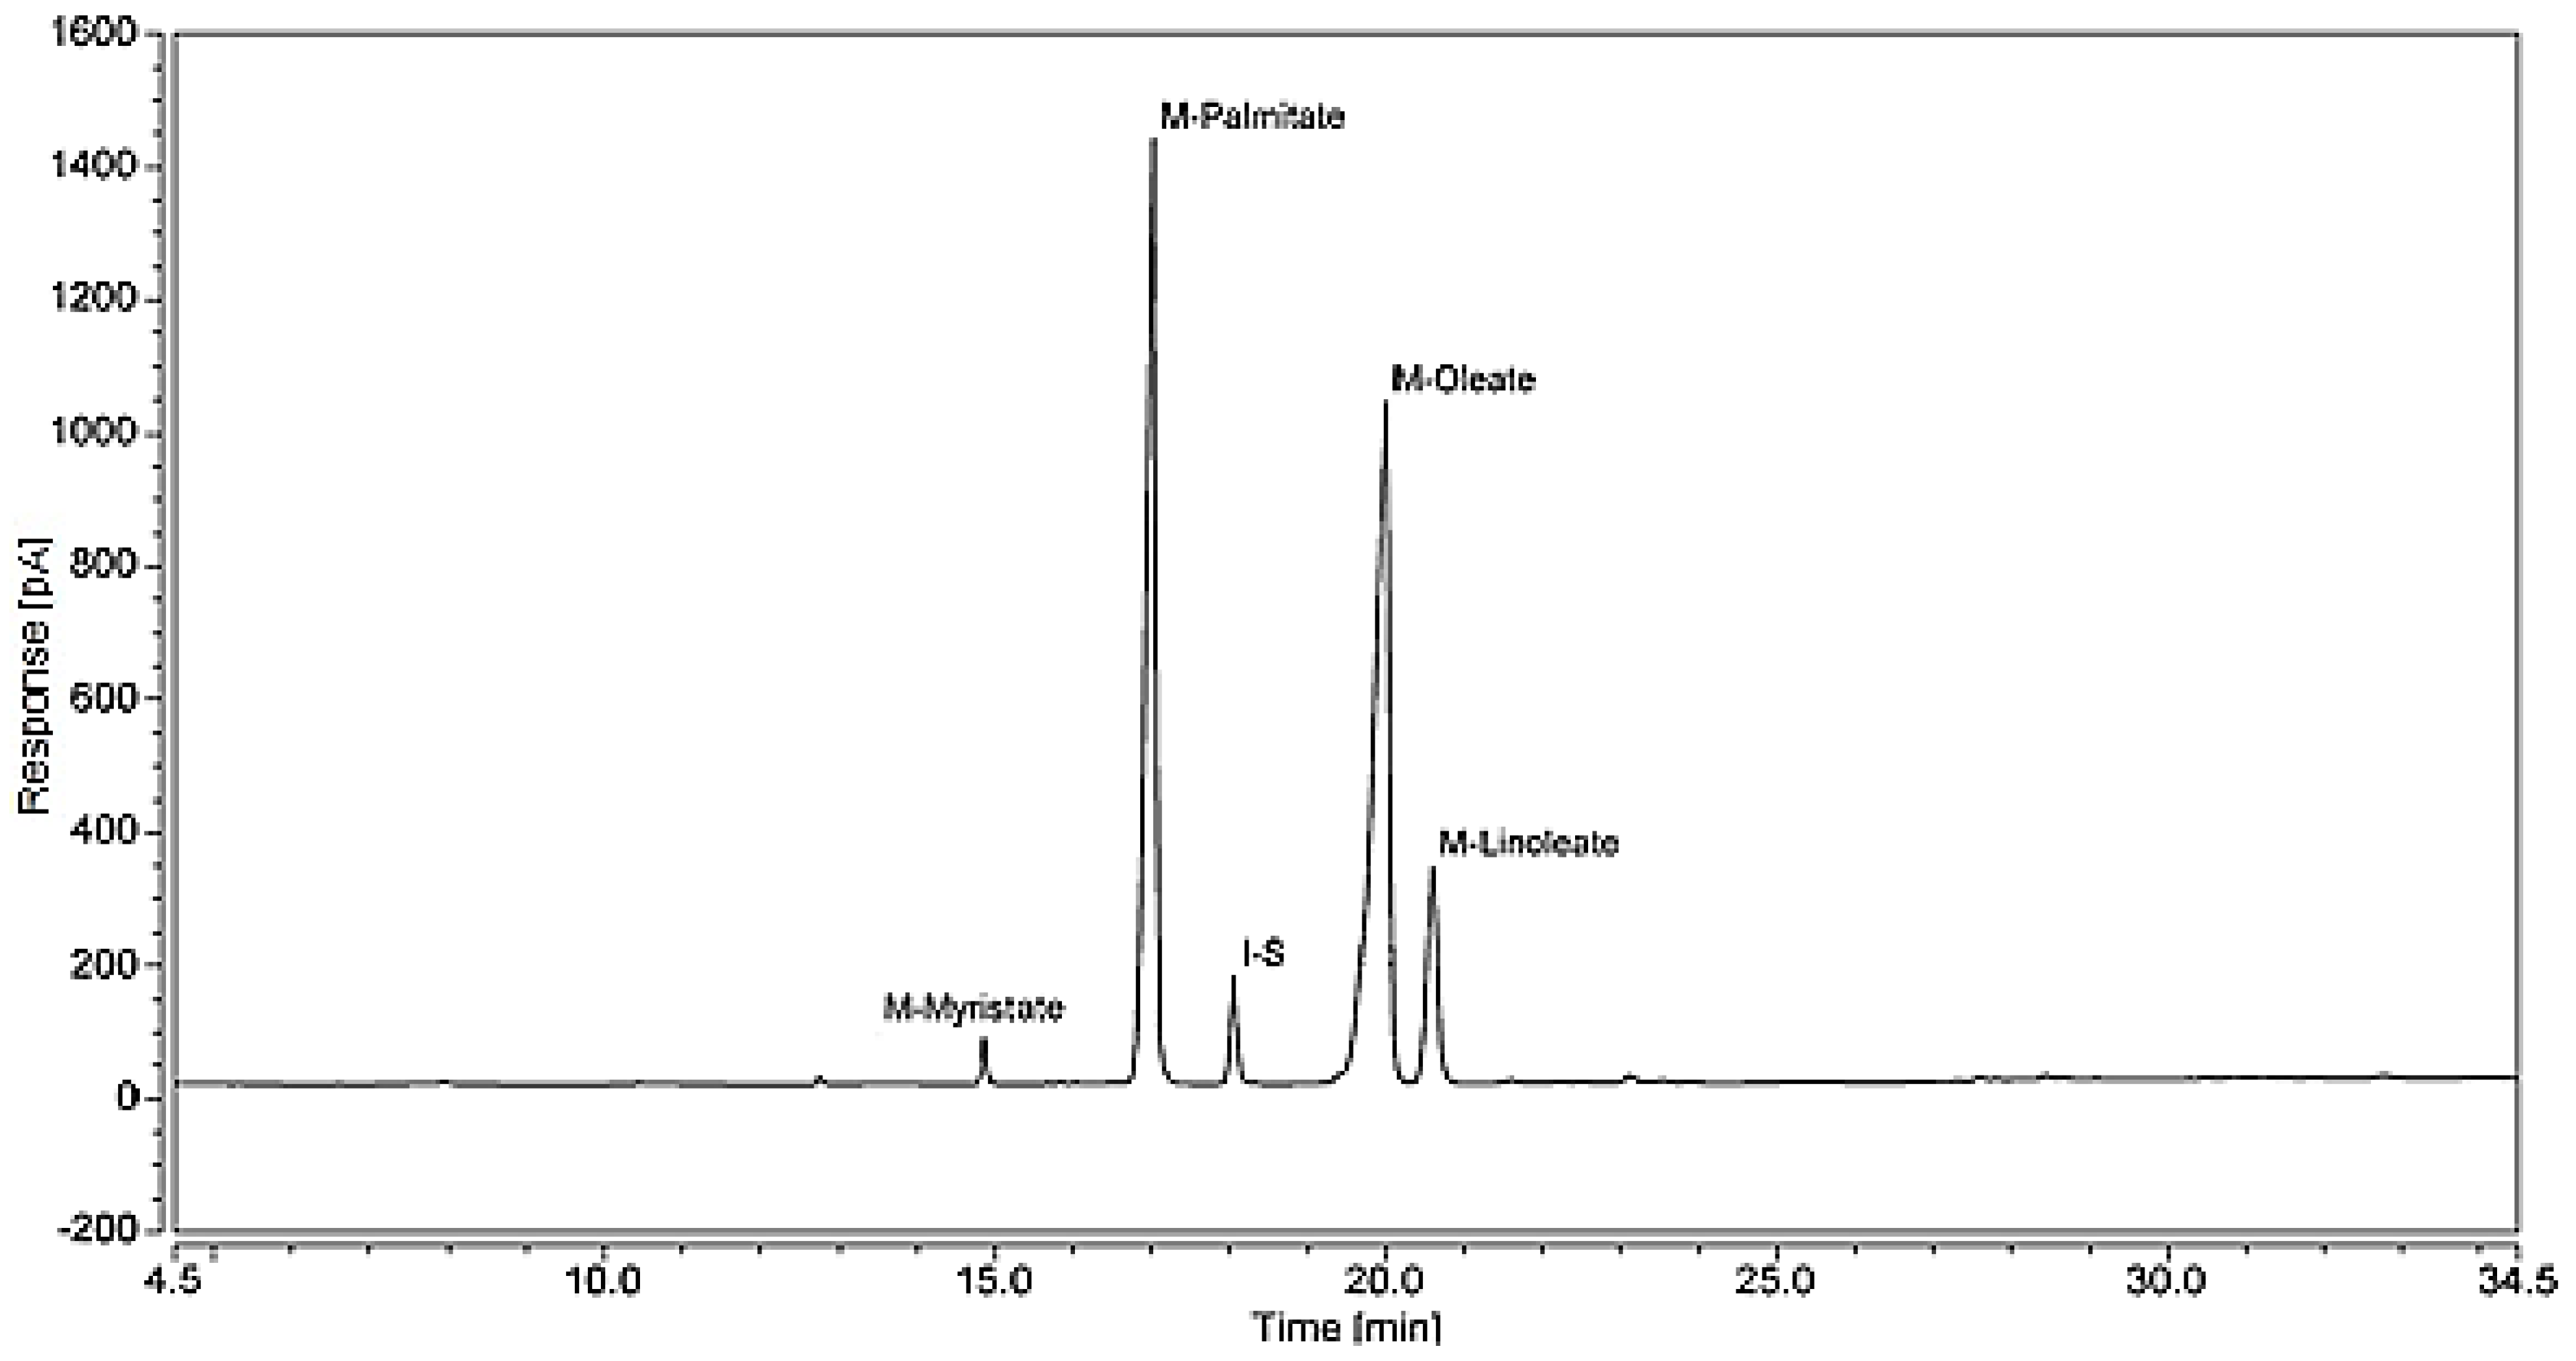
Figure A13 illustrates the chromatogram of the derivatised sample, where the main components have been well identified and separated. The peaks of the solvents for both (n-hexane and methanol) were excluded for better clarity. As shown in Table 1, four main components were identified including methyl-oleate (C18:1), methyl-linoleate (C18:2), methyl-palmitate (C16:0) and methyl-myristate (C14:0). This indicates that the four mentioned components represent the main fatty acid composition of WCO, namely oleic acid, linoleic acid, palmitic acid and myristic acid.
2.2.4. Calibration Curves for Standards
For the quantification process of the concentration of each component in WCO, the internal standard method was adopted. The response factor of each component was determined to calculate its concentration. Only the main components identified through the chromatogram results of the derivatised sample were considered. Five different concentrations of the standard samples with a fixed concentration of internal standard were prepared. A Triplicate injection of each sample was performed to ensure the reliability and consistency of the response factor. The response factor of each component was calculated using a mathematical division of different area ratios (ARi) and concentration ratios (CRi) of the component as shown in Equation (A1). Area ratio is defined as the ratio between the analyte area (Ai) and internal standard area (Ais) as shown in Equation (A2). In addition, the concentration ratio is defined as the ratio between the concentration of the analyte (Ci) and the internal standard concentration (Cis) as shown in Equation (A3). Accordingly, a plot between different area ratios and concentration ratios (calibration curve) was used to calculate the average response factor of each component.
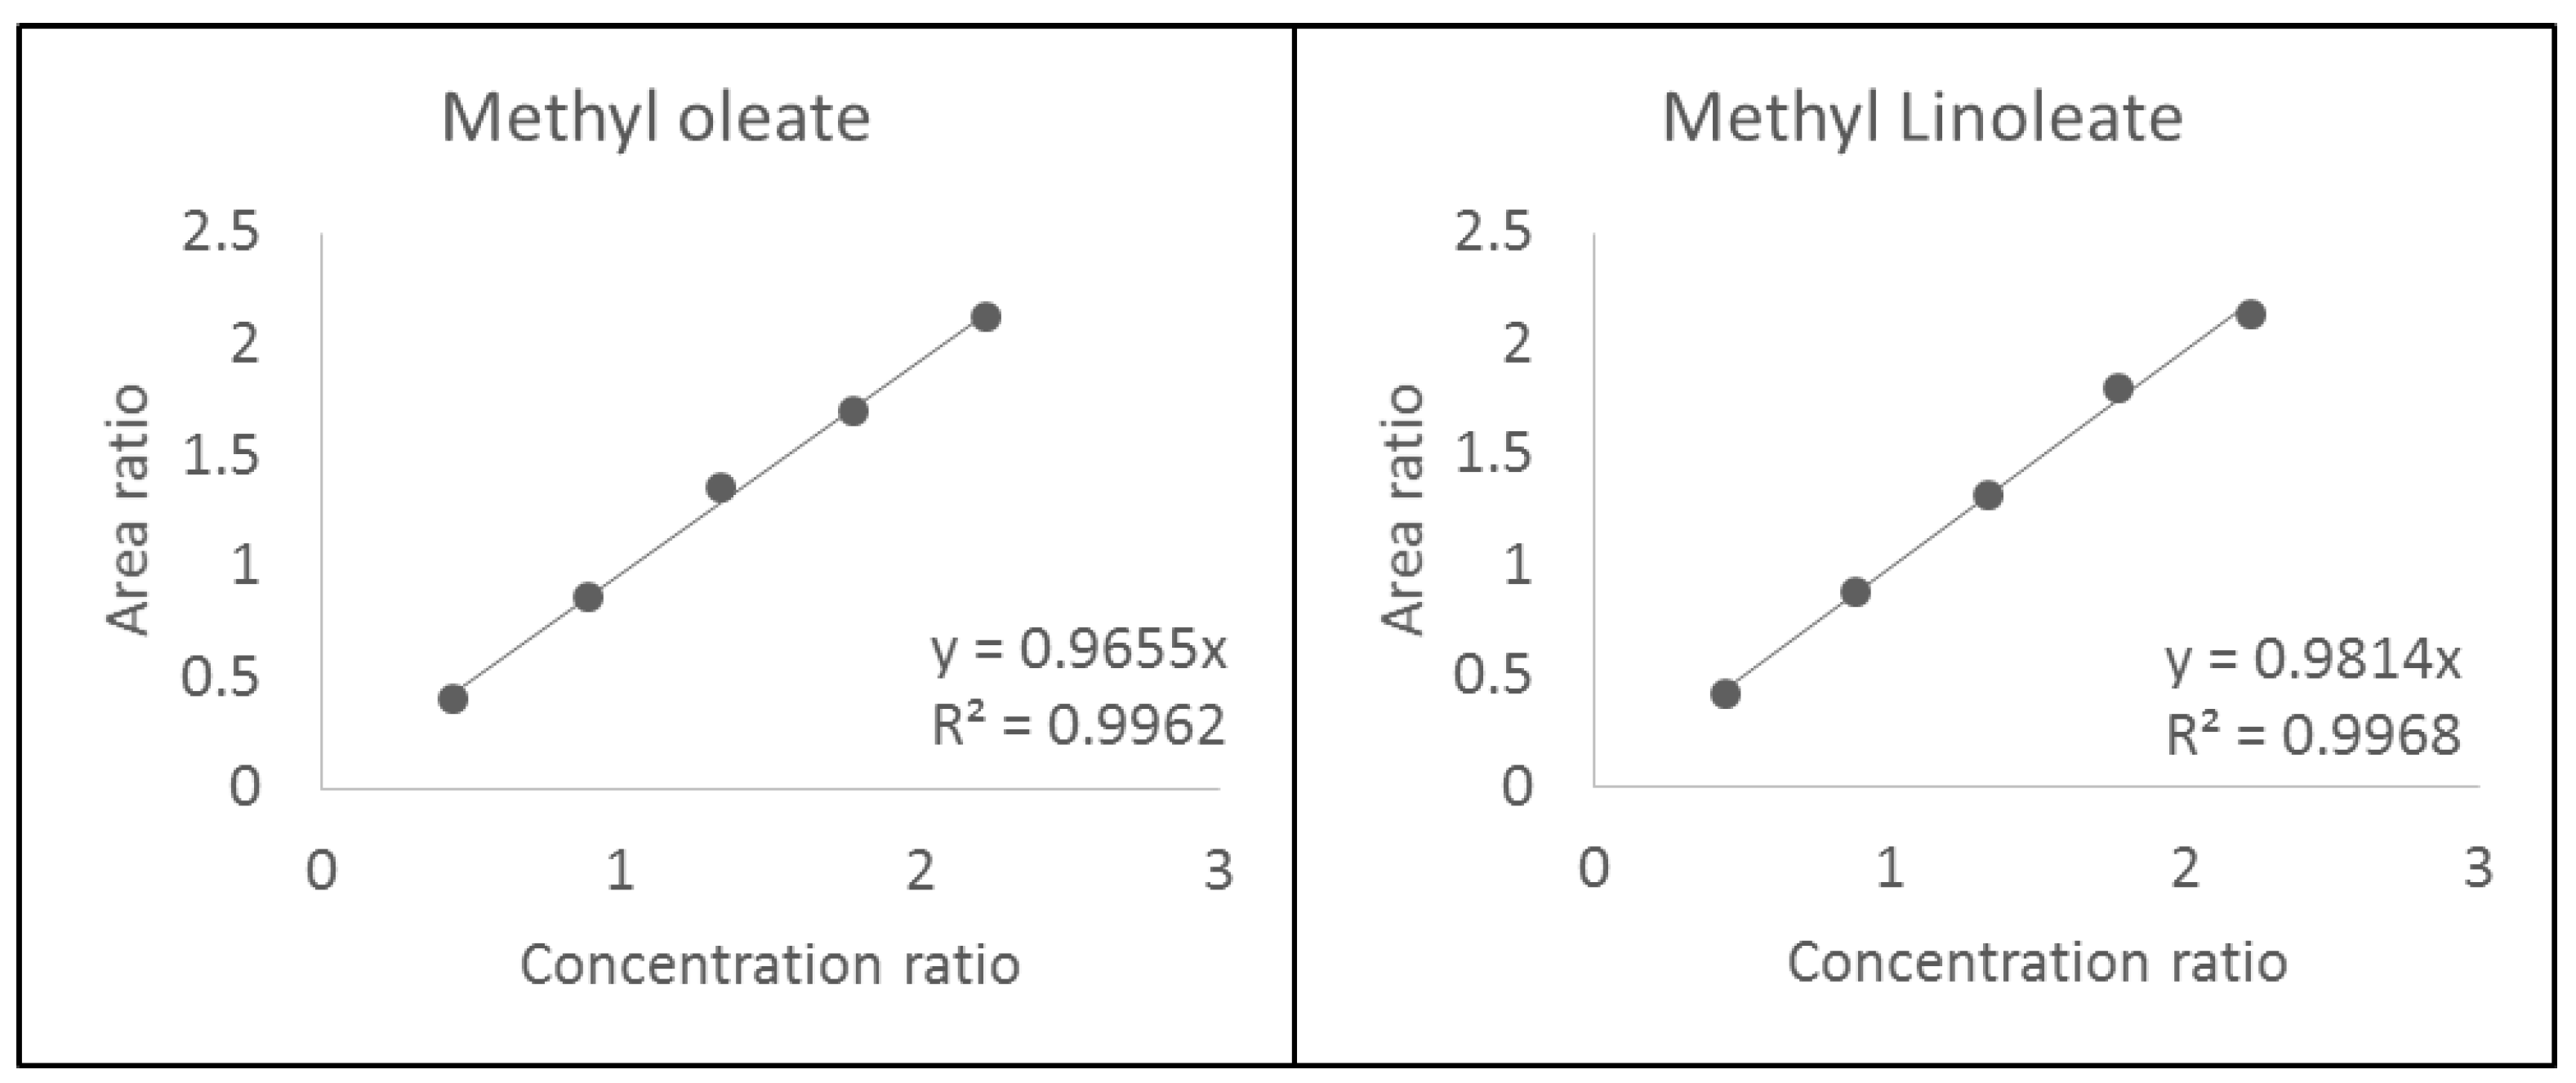
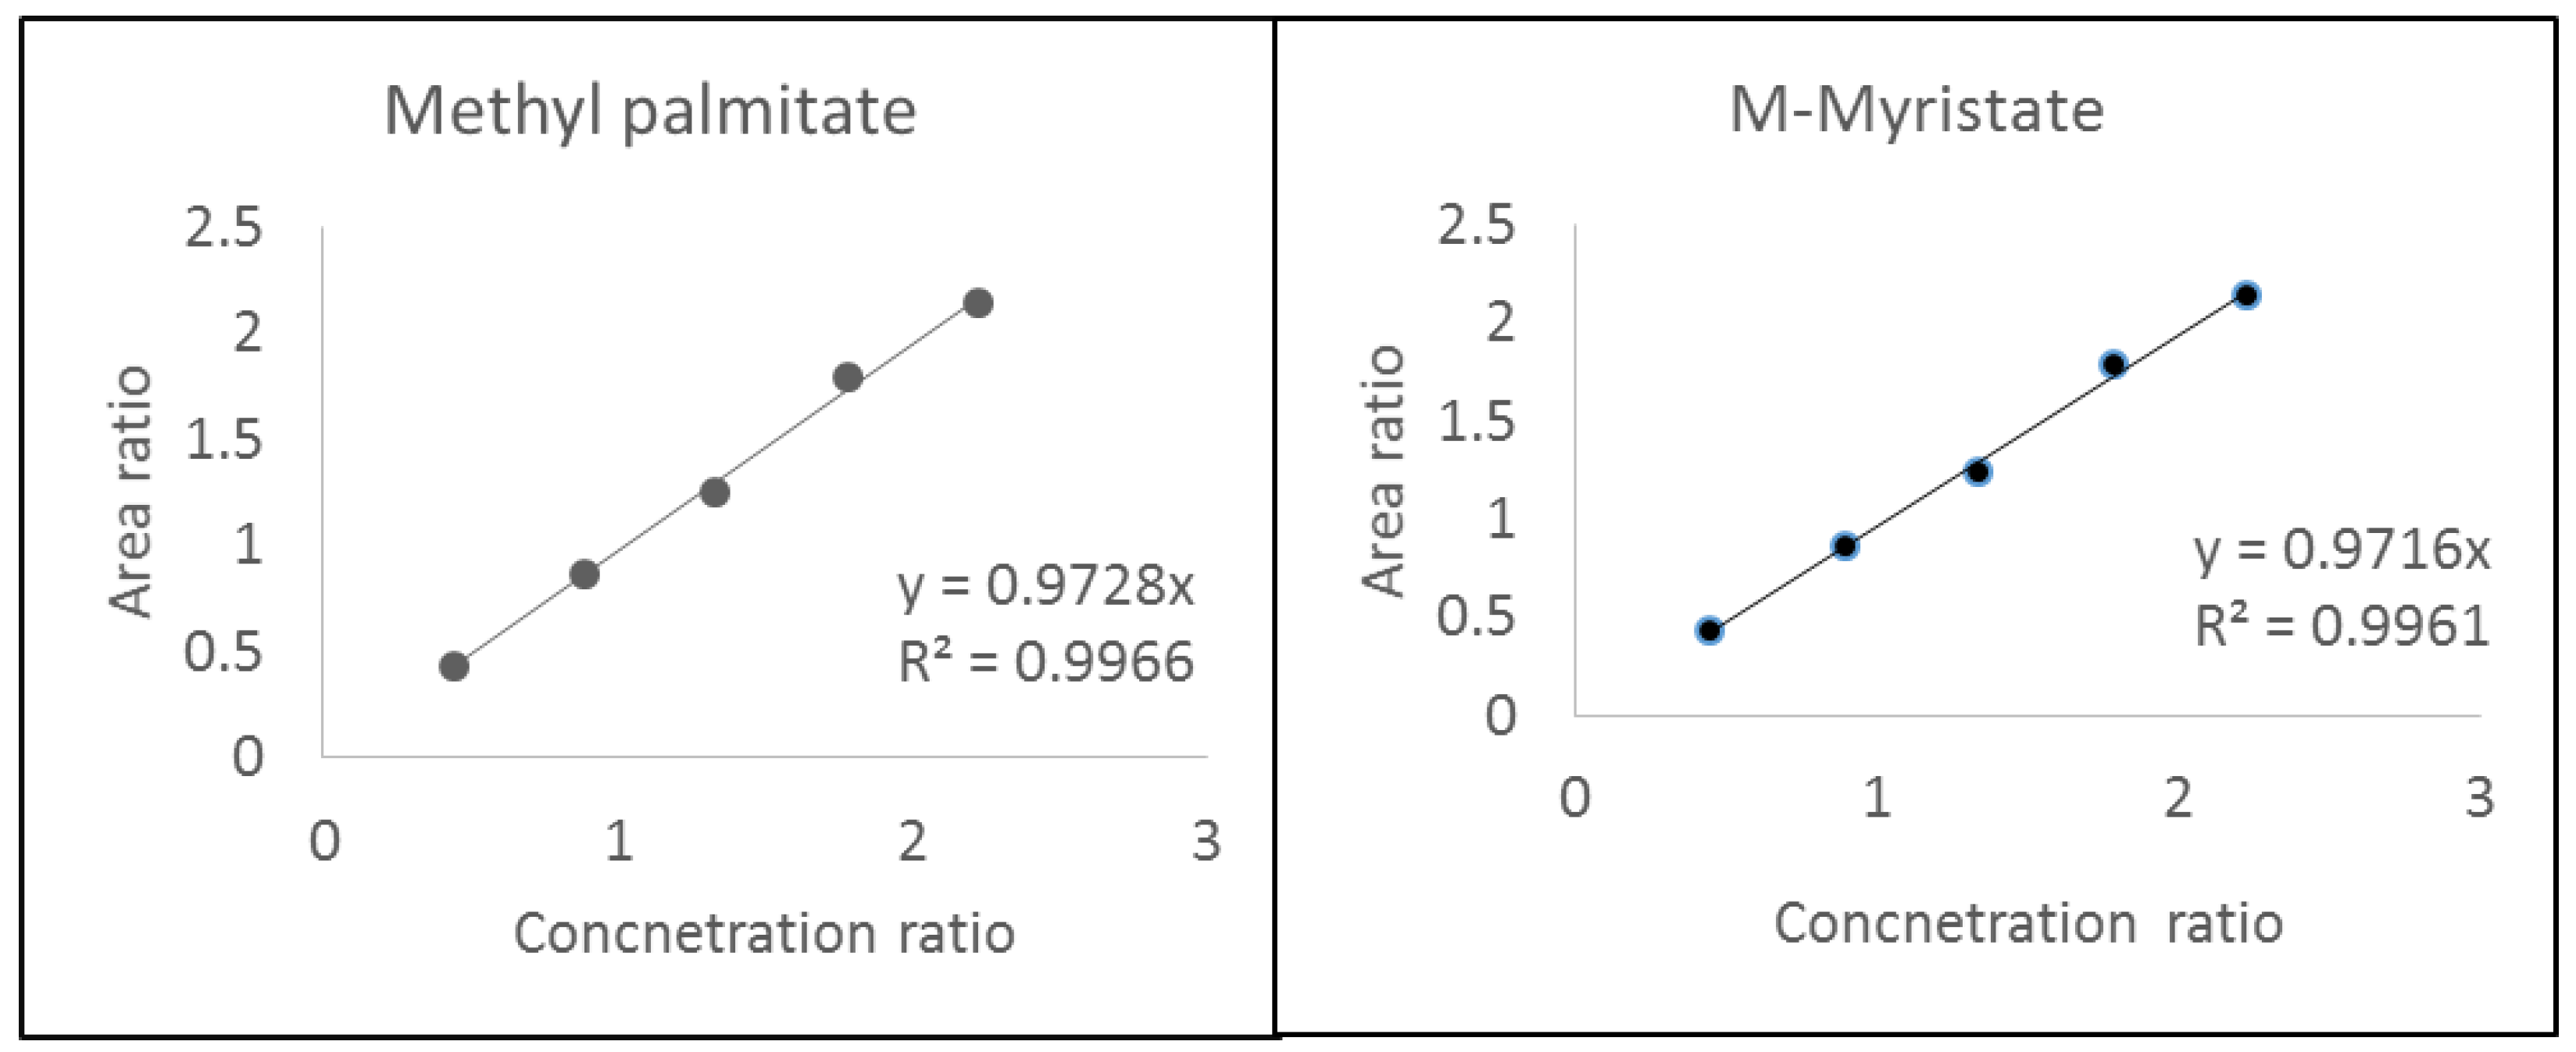
The calibration curves for FAME standard components are illustrated in Figure A1 and Figure A2 where the slope of each plot represents the response factor of each component. Hence, response factors of oleic acid, linoleic acid, palmitic acid, and myristic acid. were reported as 0.9655, 0.9814, 0.9728 and 0.9716, respectively. The consistency of the results is illustrated with the r-squared values where all the values are greater than 0.97. Accordingly, the concentration of each component (ith component) in the biodiesel sample (jth sample) could be calculated according to Equation (A4).
2.2.5. FAME Yield Calculations
FAME yield calculation for biodiesel production from WCO as a result of transesterification of triglycerides and esterification of FFAs was performed using chromatographic analysis. The FAME yield was calculated as a ratio between actual and theoretical yield as shown in Equation (1) [20]. The theoretical FAME was considered as the FAME content calculated from the derivatised sample as mostly all the fatty acids were converted to FAMEs. However, the actual FAME was varied according to each experimental condition. Yield calculations were performed from the chromatographic obtained concentration of each FAME.
2.2.6. Supercritical Methanolysis
The collected WCO proceeded for a single-step reaction without any pre-treatment steps except physical filtration to remove cooking residuals. WCO was mixed with methanol at a specified ratio for each experiment and fed to a 100-mL high-pressure batch reactor made of stainless steel (model 4590, Parr Instrument Company, Moline, IL, USA), which was fitted with a thermocouple (type J), heating mantle, controller (model 4848) and a mechanical stirrer. The mixture was then heated to the desired temperature with continuous stirring at 300 rpm. Once the desired temperature was reached, a supercritical fluid pump (model SFT-10, Analytix Ltd., East Boldon, UK) was used to compress nitrogen or CO2 from a cylinder to the reactor to achieve the desired pressure. The total time required for attaining the desired reaction conditions is approximately 15 min for each experiment. The time at which the solution reaches the targeted temperature and pressure is considered the starting time (t = 0) of the reaction. After the specified residence time for each experiment, the reactor was quenched using an ice bath to stop the reaction and then the reactor was depressurised. Unreacted methanol was recovered using simple distillation at 80 °C for 30 min. The reaction products were separated using a centrifuge (1500 rpm, 3 min per cycle) to biodiesel and glycerol. Finally, a sample of biodiesel was diluted with n-hexane for chromatographic analysis after adding methyl-heptadecanoate as an internal standard.
2.2.7. Physicochemical Properties
The physicochemical properties for both WCO and produced biodiesel were analysed based on standard calibration methods. Density, total acid number, and kinematic viscosity were calibrated according to ASTM D4052, ASTM D974 and ASTM D445 methods, respectively. The water content was determined by heating the sample to 100 °C for 3 h as shown in Equation (2). The properties of the produced biodiesel sample were compared with the European biodiesel standard (EN14214). The analysed properties have been replicated twice and the results have been obtained as an average of the two results. The physicochemical properties of waste cooking oil feedstock is presented in Table 2.
2.3. Experimental Design
Several experiments have been performed to analyse the effect of some controllable variables on the conversion of the main fatty acids of the feedstock. The controllable variables were chosen based on their significant effect on supercritical methanolysis. In addition, the variable ranges have been chosen based on previous studies [15]. Response Surface Methodology (RSM) was applied to optimise the reaction variables and for the development of a numerical model that could represent the reaction. The Central Composite Design (CCD) method of RSM was used to design the experiments where 5 levels of each variable were investigated. CCD includes central, axial, and star points that provide accurate predictions of the model curvature. In the present study, the five levels were coded as −2, −1, 0, 1, and 2, as shown in Table 3. The results of M-oleate were presented in Table 2 as an example while the rest of the results are demonstrated in Table A1. Thirty experiments were conducted in randomised order, as shown in Table 4, including 6 center points and 24 non-centre points where a total number of experiments was calculated based on Equation (3). The experimental runs were performed in a randomised order to minimise the effect of unexplained inconsistency in the responses [21].
where n is the number of controllable variables and m is a number of replicated centre points.
Total number of runs = 2n + 2n + m
The investigated controllable variables were coded as follows; M:O molar ratio (A), temperature (B, °C), pressure (C, bar) and time (D, min) while reaction responses were yield of methyl-oleate (Y1, %), the yield of methyl-palmitate (Y2, %), the yield of methyl-linoleate (Y3, %) and yield of methyl-myristate (Y4, %).
2.4. Statistical Analysis
The full quadratic equation as shown in Equation (4) was used for the development of the regression model.
where Y is the predicted response, bo is the model coefficient constant, bi, bii, and bij, are coefficients for the intercept of linear, quadratic, interactive terms respectively, while Xi, Xj are independent variables (I ≠ j). n is a number of independent variables and ε is the random error. The coefficient of correlation (R2), adjusted coefficient of determination (R2adj) and the predicted coefficient of determination (R2pred) was used to evaluate the adequacy of the model. After selecting the most accurate model that would fit the experimental data, analysis of variance (ANOVA) was used to investigate the significance of the controllable variables and their interactions by conducting Fisher’s F-test at a 95% confidence level. Design Expert 11 software (Stat-Ease Inc., Minneapolis, MN, USA) was used to design the experiments, regression analysis, graphical analysis, and numerical optimisation.
3. Results
3.1. Models Development and Adequacy Checking
RSM using CCD has been used to fit the experimental results to quadratic models using regression analysis to represent each reaction response function in reaction variables. Four quadratic models have been developed as shown in Equations (5)–(8). The predicted models have been subjected to both statistical and experimental validation. Table 3 and Table A1 demonstrate the actual experimental results and the predicted results of each response.
where Y1, Y2, Y3 and Y4 represent FAME yield of methyl-oleate, methyl-palmitate, methyl-linoleate and methyl-myristate, respectively. While, A, B, C, and D represent the process variables including M:O molar ratio, temperature, pressure and time, respectively.
Y1 = 99.37 − 0.032A + 0.089B − 0.0084C + 0.036D + 0.061AB + 0.024AC − 0.05AD + 0.052BC − 0.066BD + 0.077CD − 0.069A2 - 0.12B2 − 0.056C2 − 0.16D2
Y2 = 99.19 − 0.022A + 0.023B − 0.0045C + 0.01D + 0.044AB + 0.017AC − 0.029AD + 0.061BC − 0.047BD + 0.065CD − 0.053A2 − 0.086B2 − 0.026C2 − 0.092D2
Y3 = 99.10 − 0.038A + 0.038B − 0.010C + 0.042D + 0.054AB + 0.027AC − 0.031AD + 0.036BC − 0.049BD + 0.036CD − 0.016A2 − 0.045B2 − 0.019C2 − 0.099D2
Y4 = 98.11 − 0.038A + 0.037B − 0.009C + 0.041D + 0.053AB + 0.0265AC − 0.03AD + 0.035BC − 0.046BD + 0.034CD − 0.016A2 − 0.044B2 − 0.0179C2 − 0.098D2
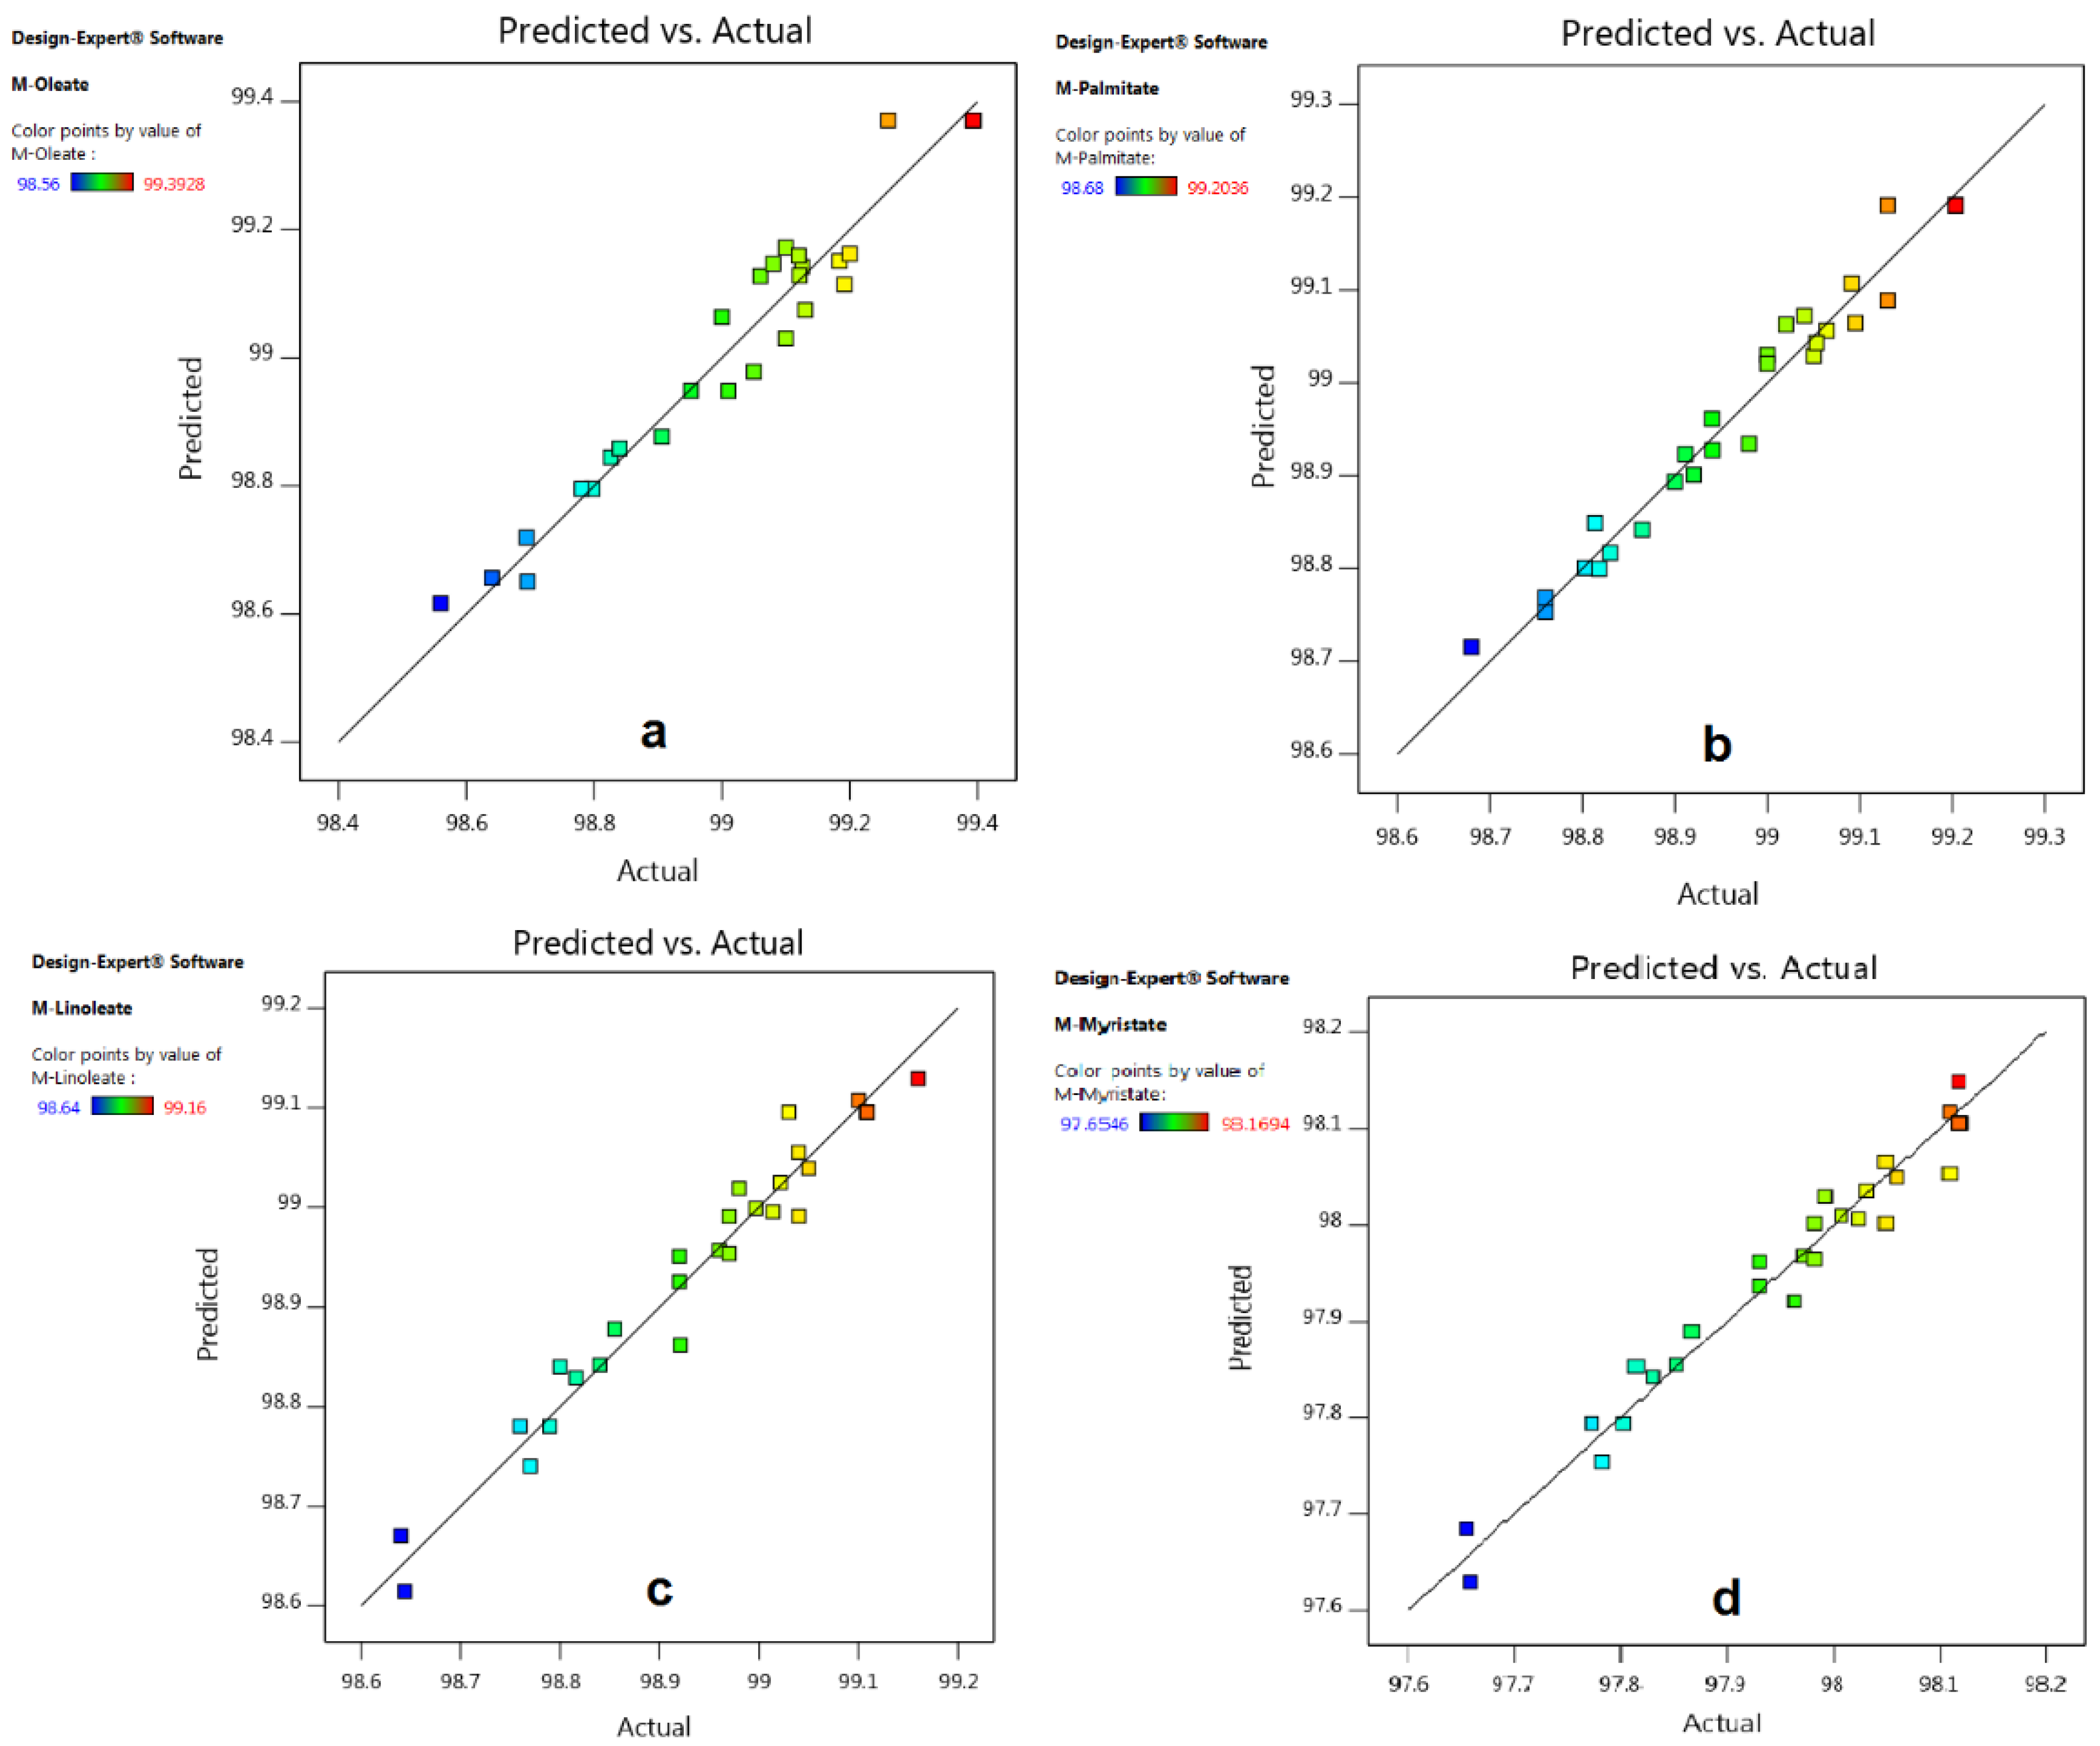
The adequacies of the predicted models have been checked through different methods in the present study. Plots for actual versus predicted values for each response are presented in Figure A3 for all the predicted models. These plots analyse the accuracy of the model in fitting the experimental data. If the predicted value is the same as the actual value, the point will exactly fit on the 45° line. The very low deviation of the points from the 45° line indicates the adequacy of the predicted models.
The adequacy of the predicted model has also been checked using the coefficient of correlation (R2) which assesses the accuracy of the predicted values. The closer the R2 value to one indicates high the accuracy of the predicted model. These values were reported as 0.992, 0.987, 0.989, and 0.979 for the models representing the FAME yield of methyl-oleate, methyl-palmitate, methyl-linoleate and methyl-myristate, respectively.
Furthermore, ANOVA has been applied to check the significance of the developed model in predicting similar data to the experimental values. Table 5 represents the ANOVA results of the predicted methyl-oleate. It has been concluded for the ANOVA tables high significance of the developed models with a very low p-value (<0.0001). This validates the adequacy of the developed model in predicting the experimental results. In addition, the lack of fit analysis has been applied to measure the fitting efficiencies of the predicted models. The lack of fit analysis resulted in non-significant results of p-values reported as 0.265 (more than 0.05) for a yield of methyl-oleate. The ANOVA results of the methyl-palmitate, methyl-linoleate and methyl-myristate have been reported in Table A2, Table A3 and Table A4, respectively.
3.2. Effect of Process Variables and Their Interactions
It has been observed from the experimental results that the supercritical methanol has successfully converted most triglycerides and FFAs to FAMEs through the transesterification/esterification reactions. Within the studied ranges of parameters, the experimental FAMEs yields have been reported between 97.6 and 99.4%. These results have verified the capability of supercritical methanolysis in the simultaneous conversion of triglycerides and FFAs with very similar yields to the theoretical yield obtained using the standard derivatisation method. In this study, the individual and interactive effects of process variables on each response have been studied. The effects of reaction variables on the yield of all studied FAMEs have been discussed in the manuscript. However, only the figures of the major FAME (methyl-oleate) have been demonstrated in the manuscript whereas the effect of process variables on the other FAMEs has been included in the Appendix A.
3.2.1. Effect of Methanol to Oil Molar Ratio
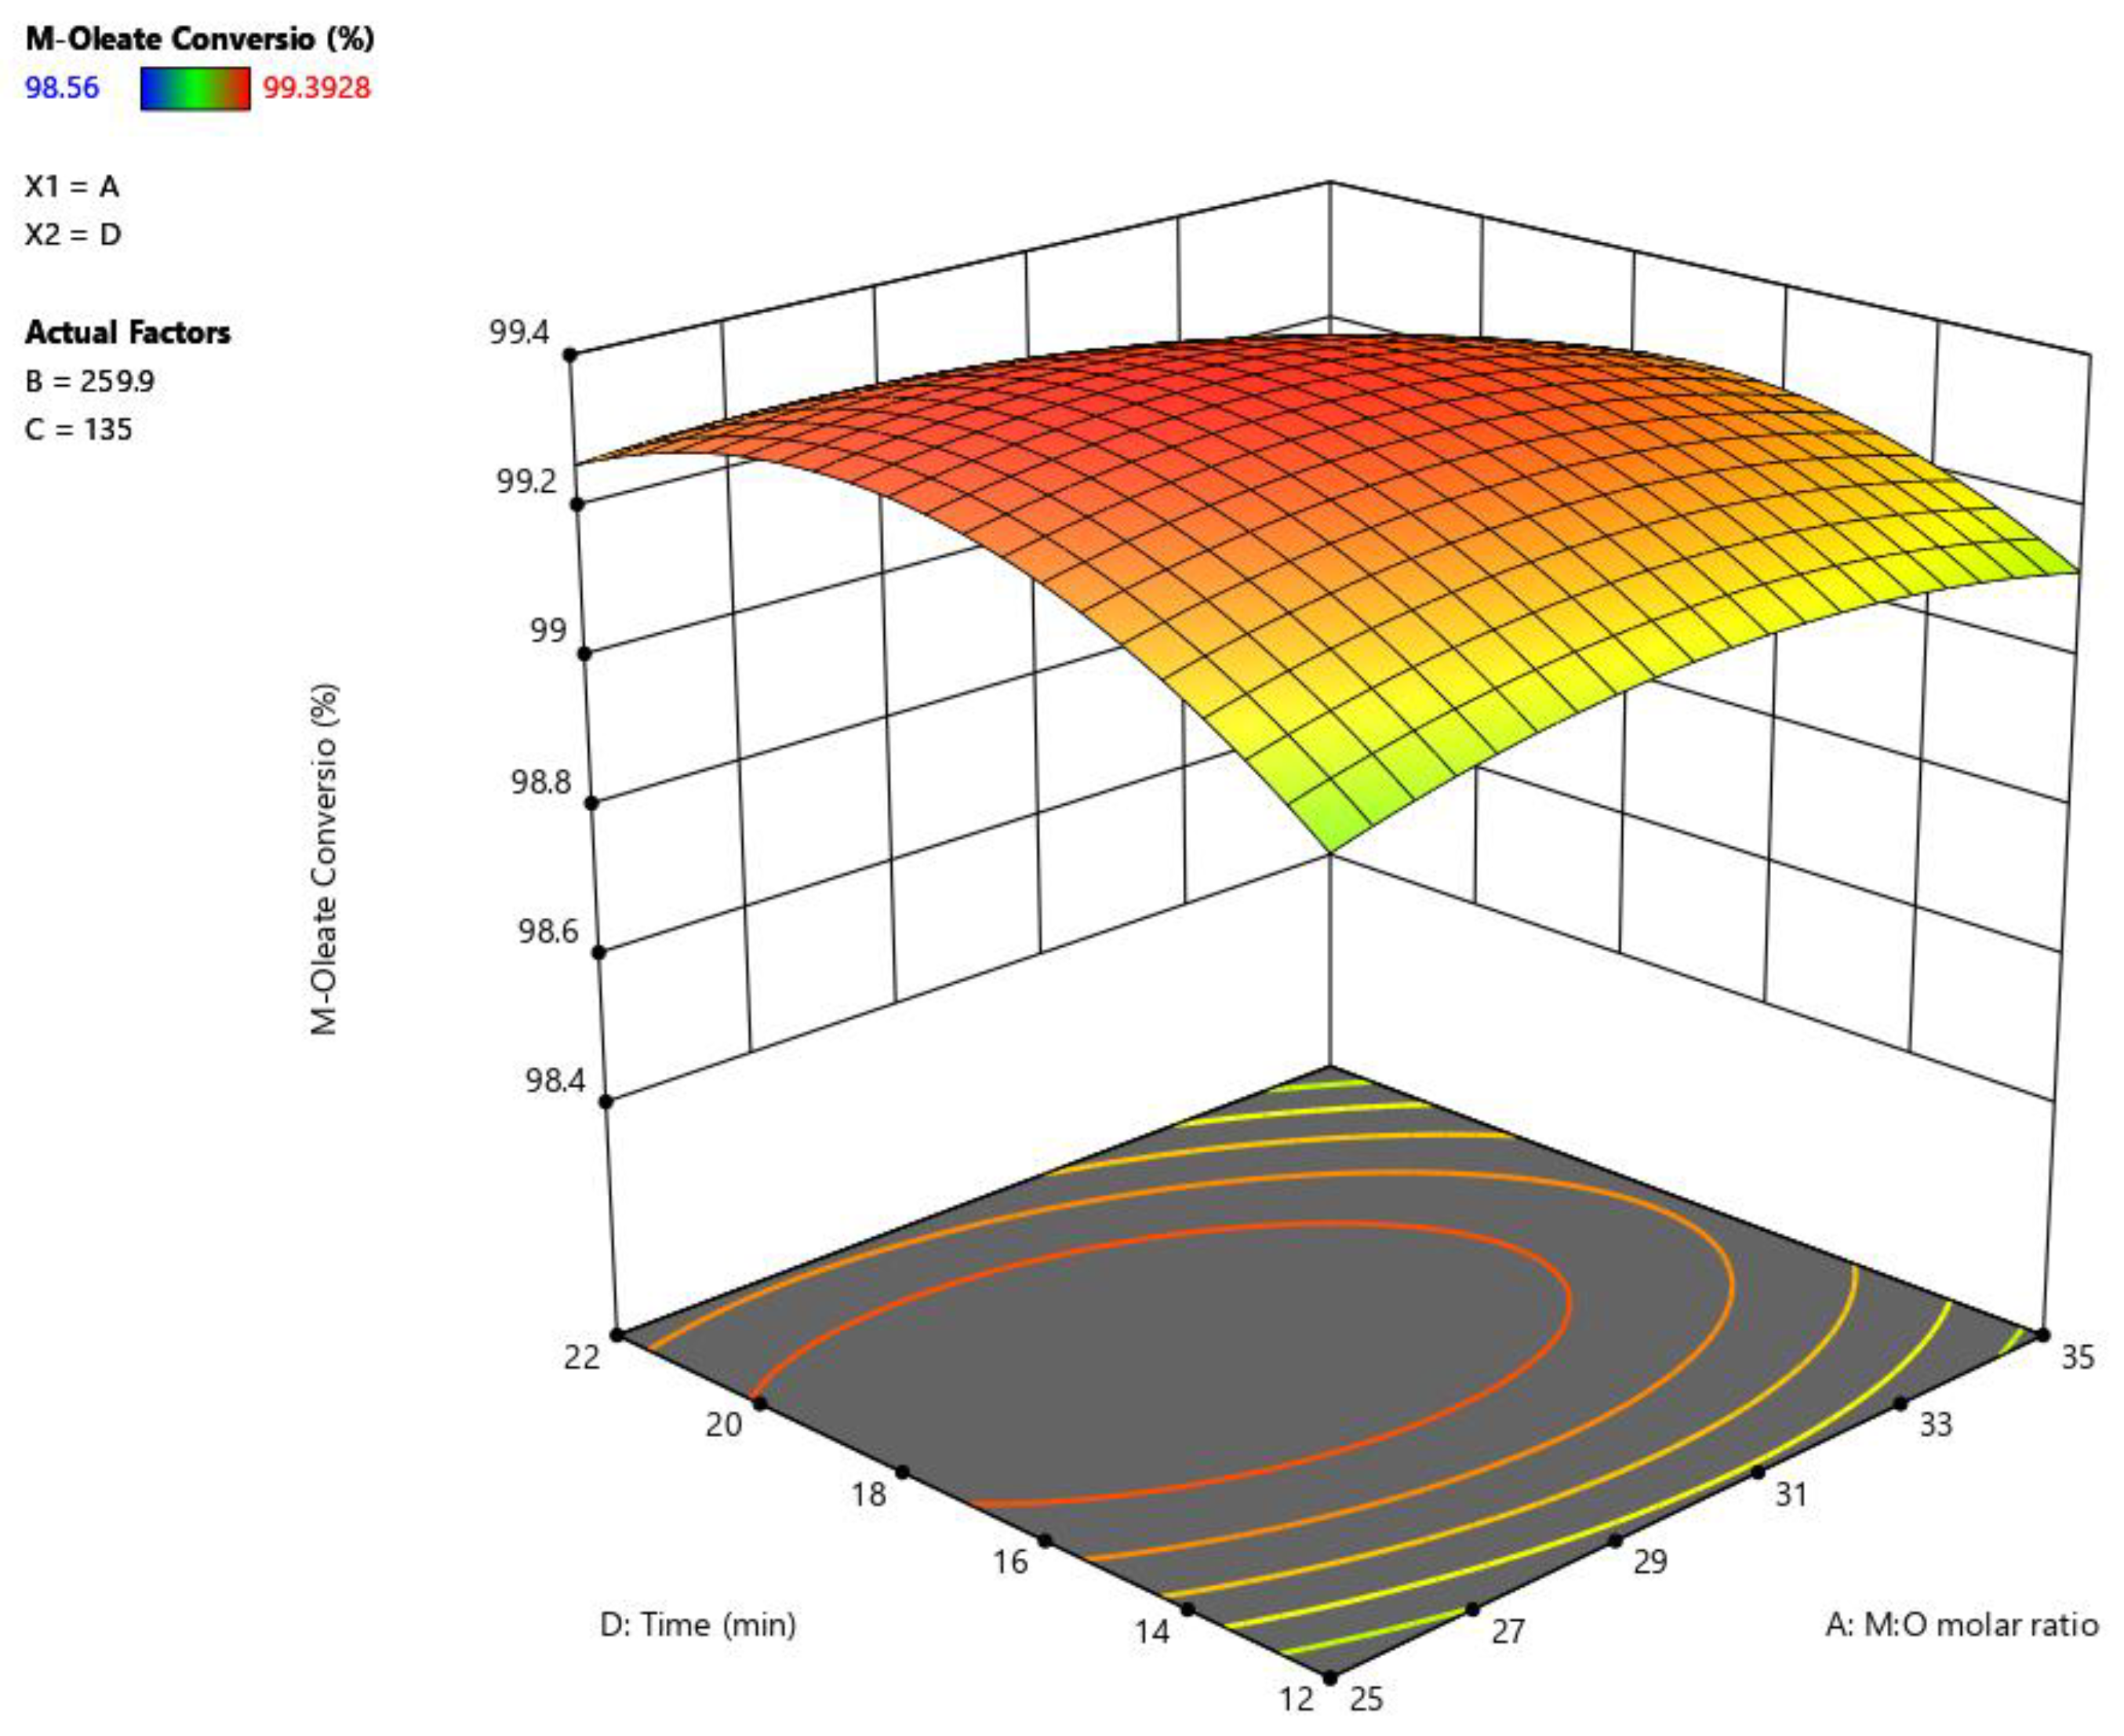
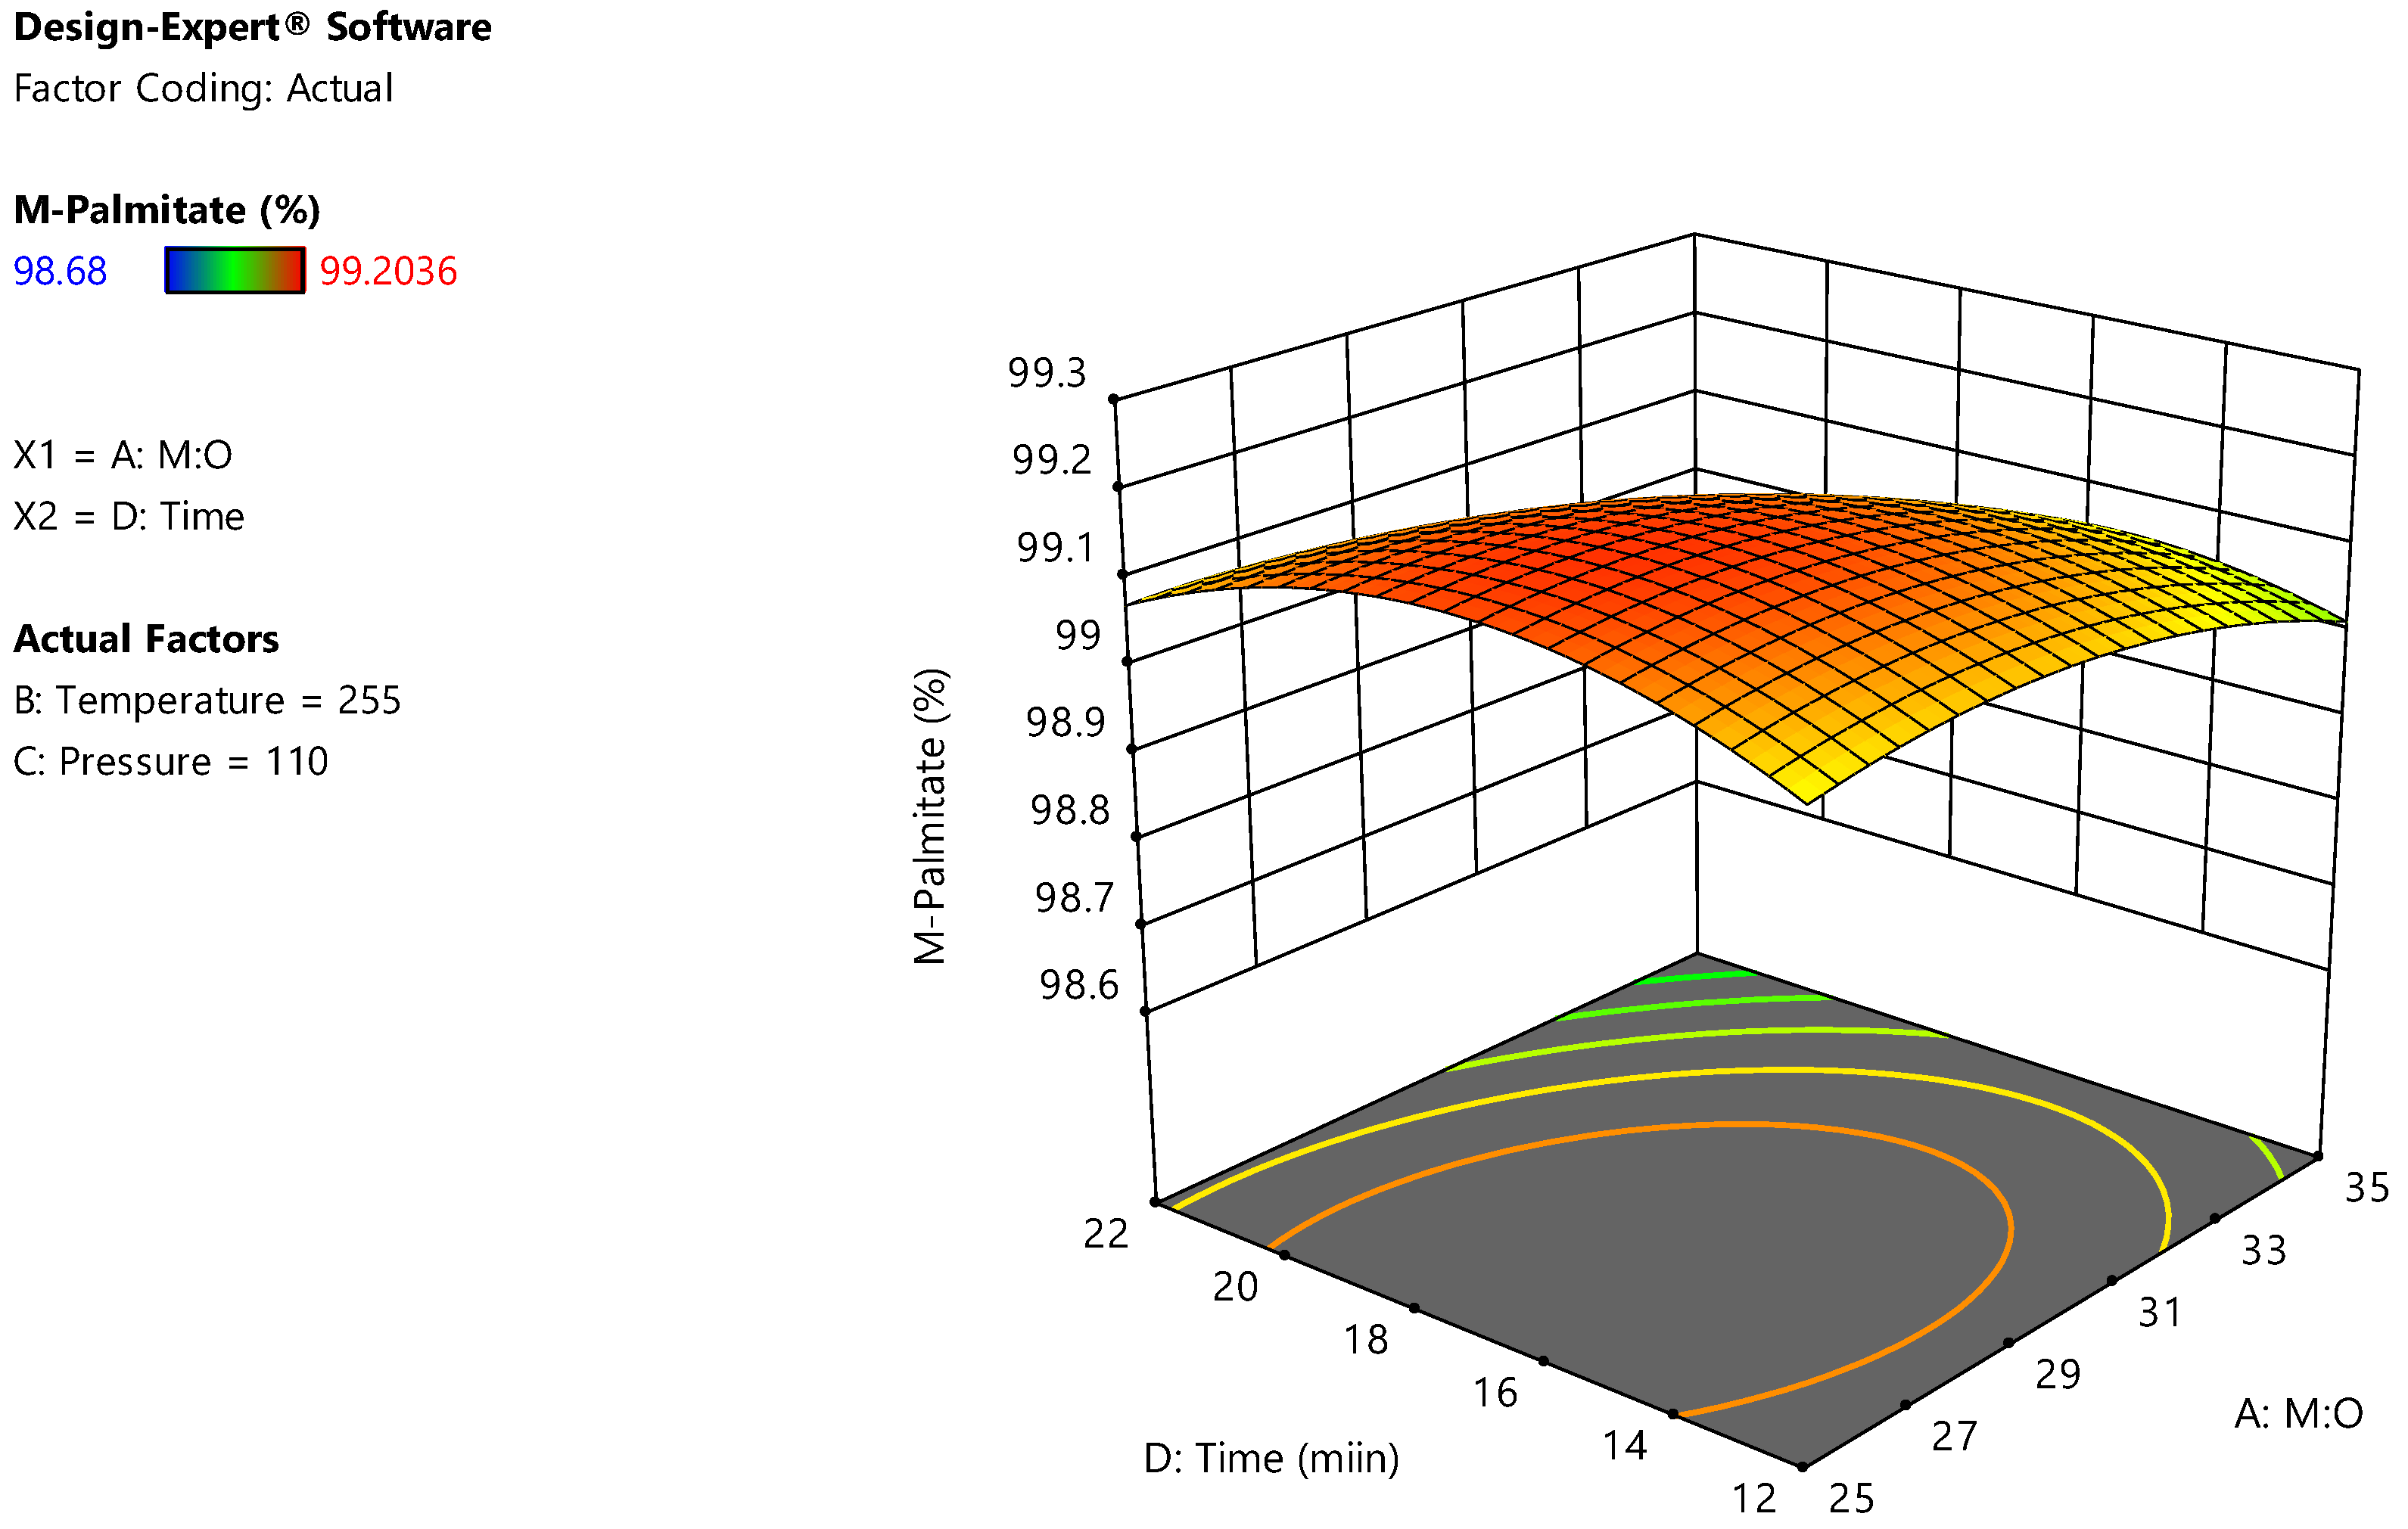
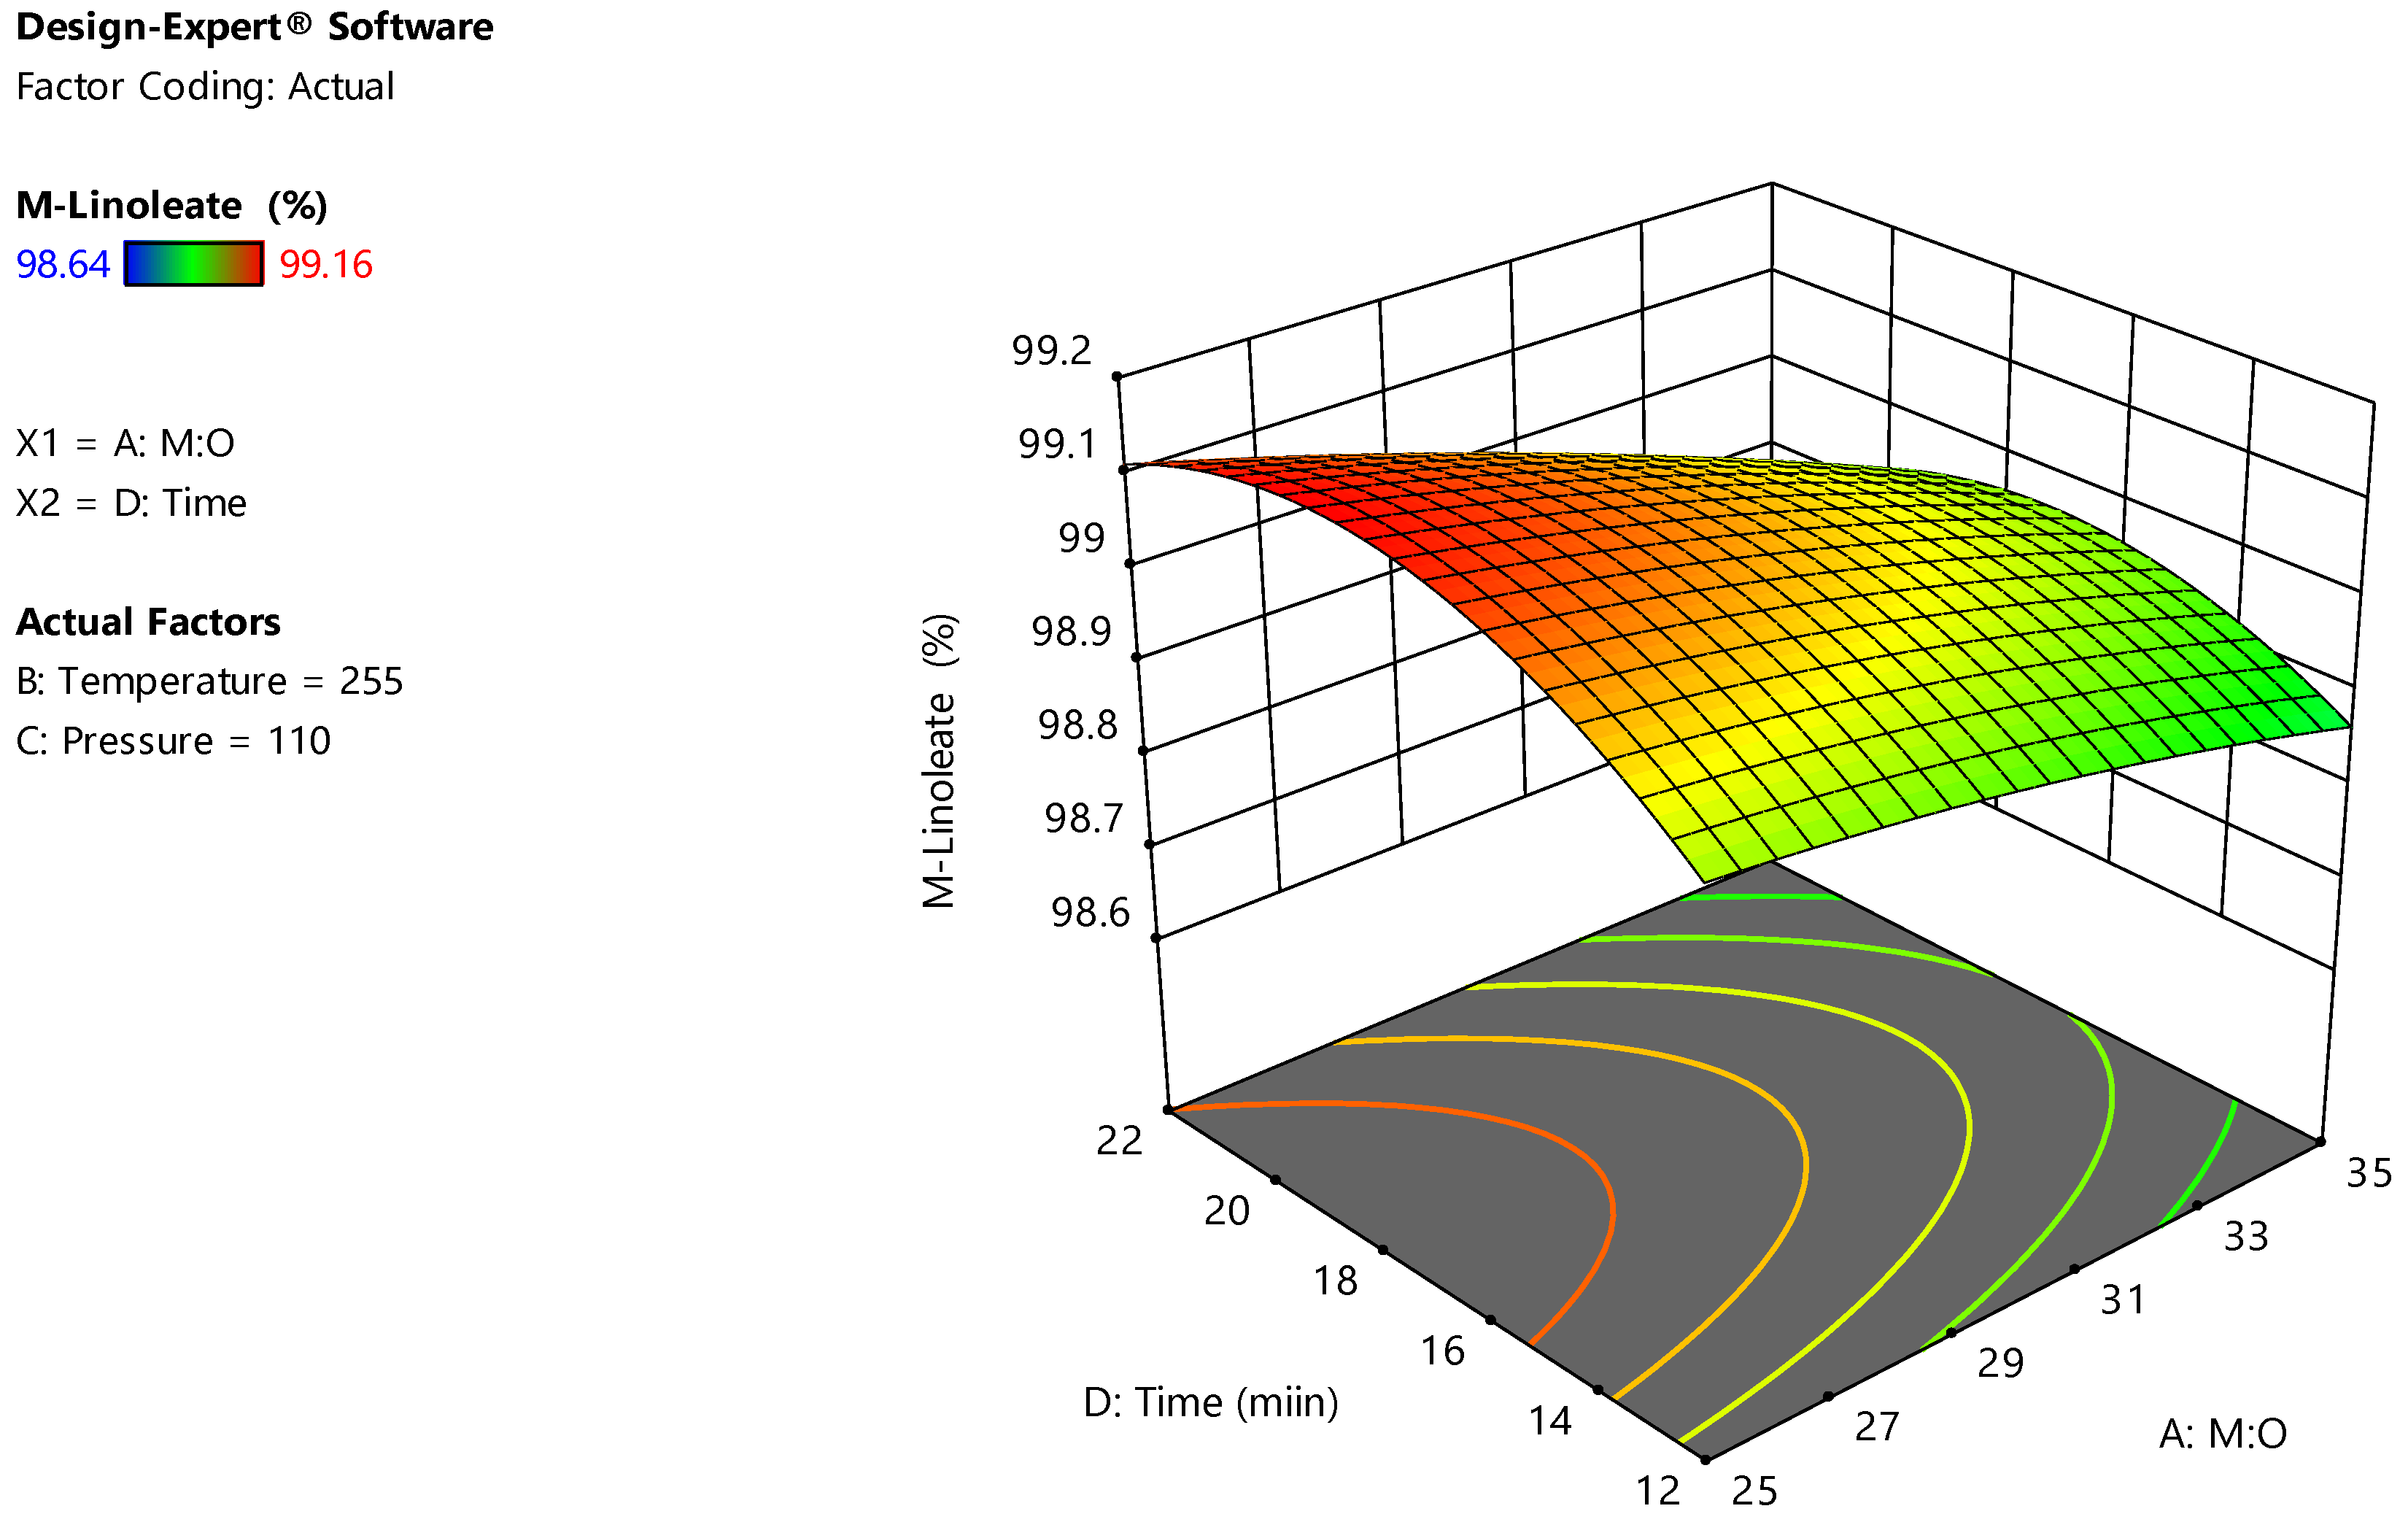
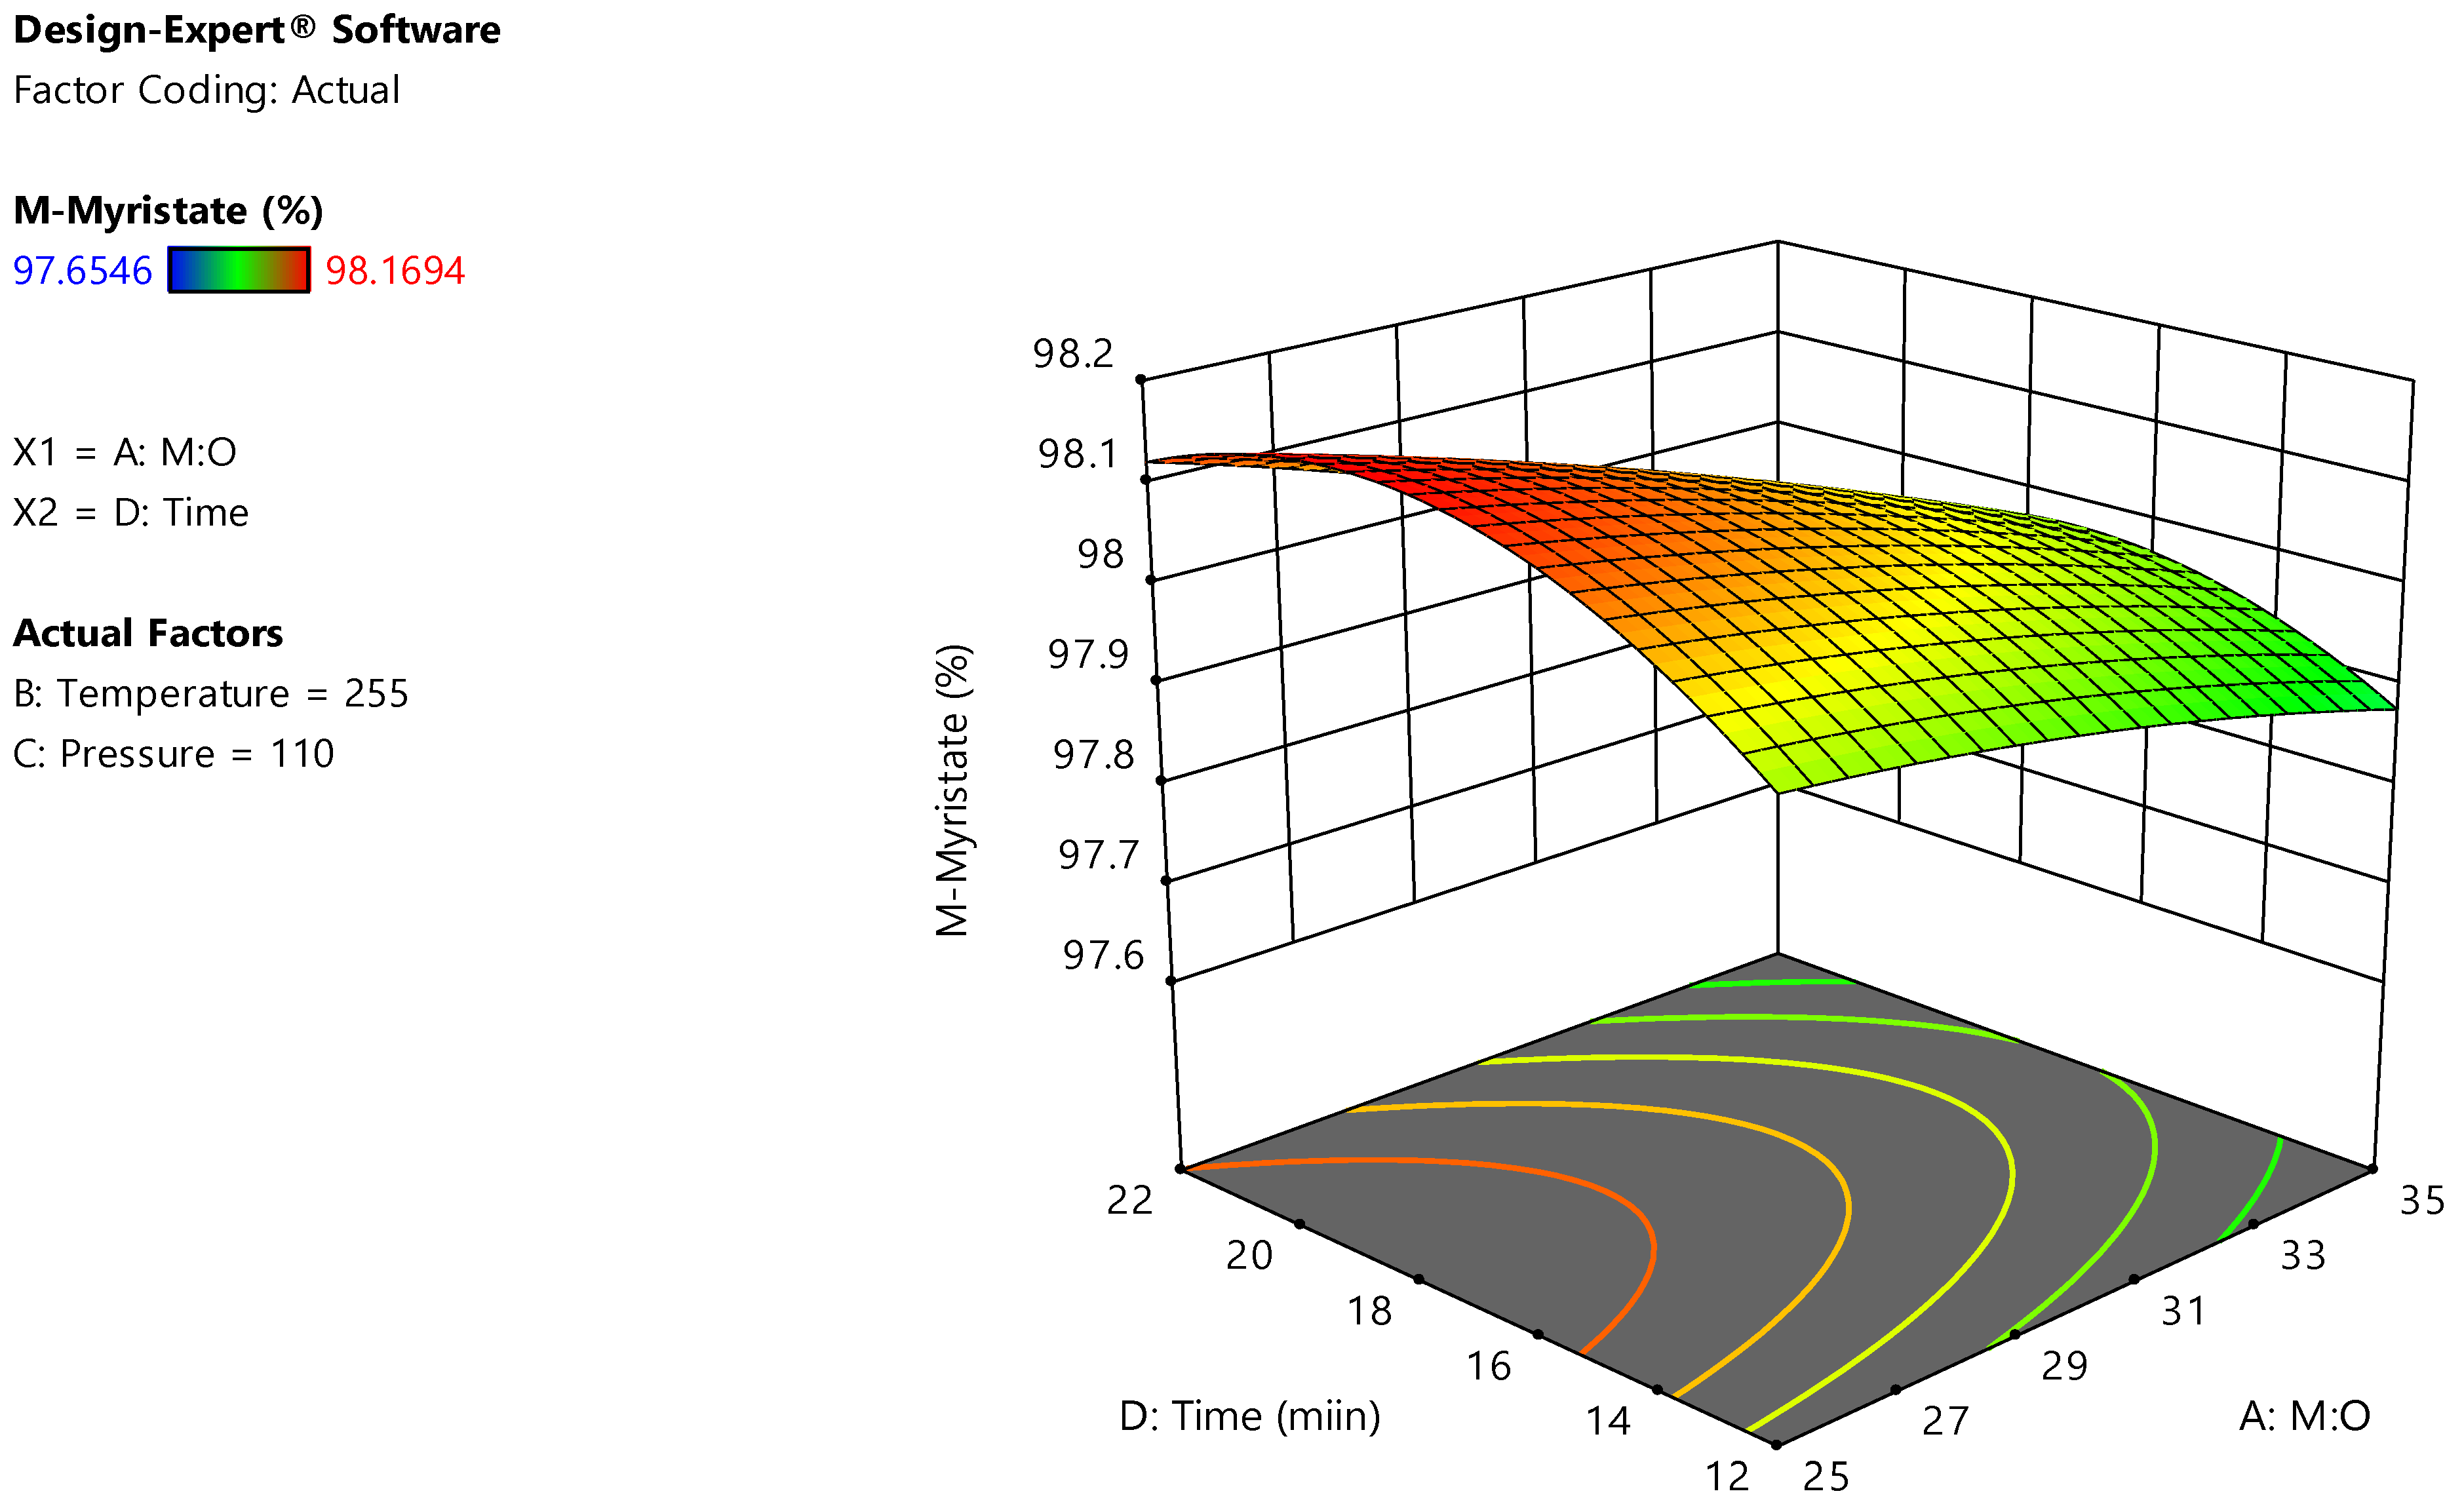
It is widely accepted that supercritical methanolysis requires high excess of methanol in the reaction within the M:O molar ratio from 20:1 up to 126:1 [22]. Through this study, the increasing effect of the methanol ratio has a marginally increasing influence on the yield of methyl-oleate at a lower reaction time. However, it has a decreasing effect at a higher reaction time as shown in Figure 1 for methyl-oleate yield. This highly interactive effect illustrates the significance of studying the interaction of the variables in addition to one factor at a time (OFAT). A similar effect of the M:O molar ratio has been reported on the yields of methyl-palmitate, methyl-linoleate, and methyl-myristate as shown in Figure A4, Figure A5 and Figure A6, respectively. According to the Le-Chatelier principle, increasing the methanol ratio should enhance the conversion of reactants by shifting the reaction equilibrium towards higher production of products [23]. However, using a large excess of methanol would dilute the reactant too much when exceeds a specific limit [22]. Hence, the effect of the M:O molar ratio on biodiesel yield varies according to the feedstock composition, FFA concentration and water content. Farobie and Matsumura [17] have reported that the esterification reaction rate in supercritical methanolysis is higher than the transesterification rate. Hence, lower excess of methanol is required for high acidity feedstock. These results are in agreement with a previous study conducted on high acid value WCO where the effect of increasing methanol has a negative effect on the biodiesel yield [18]. However, the influence of the M:O molar ratio has been reported with a significant increasing effect on biodiesel yield from WCO with low acidity [24].
3.2.2. Effect of Reaction Time
One of the main advantages of using supercritical methanolysis is the significant reduction in reaction time. In the present study, the reaction time has shown a significant influence on methyl-oleate as reported in Table 5. In addition, reaction time has been reported with a highly significant effect on the yields of methyl-palmitate, methyl-linoleate, and methyl-myristate as shown in Table A2, Table A3 and Table A4, respectively. Increasing reaction time has shown a positive effect on all FAMEs yields up to 20 min at a lower M:O molar ratio as shown in Figure 1. However, at a higher M:O molar ratio the reaction time has an increasing effect up to 17 min. The interactive effect between M:O molar ratio and reaction time has recorded a significant effect on FAMEs’ yields as illustrated in Table 5, Table A2, Table A3 and Table A4. It is clearly shown in Figure 1 that the effect of reaction time on methyl-oleate yield at a lower M:O molar ratio is not similar to its effect at a higher M:O molar ratio. Hence, a significant interactive effect between reaction time and M:O molar ratio is observed as reported in Table 5. Similar results of the effect of reaction time have been observed on the yields of methyl-palmitate, methyl-linoleate and methyl-myristate as shown in Figure A4, Figure A5 and Figure A6, respectively. Consequently, the variation of the reaction time effect should be considered within the optimisation process. These results are in agreement with previously reported studies where a significant interaction between reaction time, M:O molar ratio and the temperature has been reported previously [25]. In addition, a study on biodiesel production from high acidity tobacco seed oil has reported a significant interaction between reaction time and M:O molar ratio [26]. They have observed a decreasing effect on biodiesel yield at a longer reaction time where thermal degradation of methyl esters is considered an acceptable explanation for the yield drop.
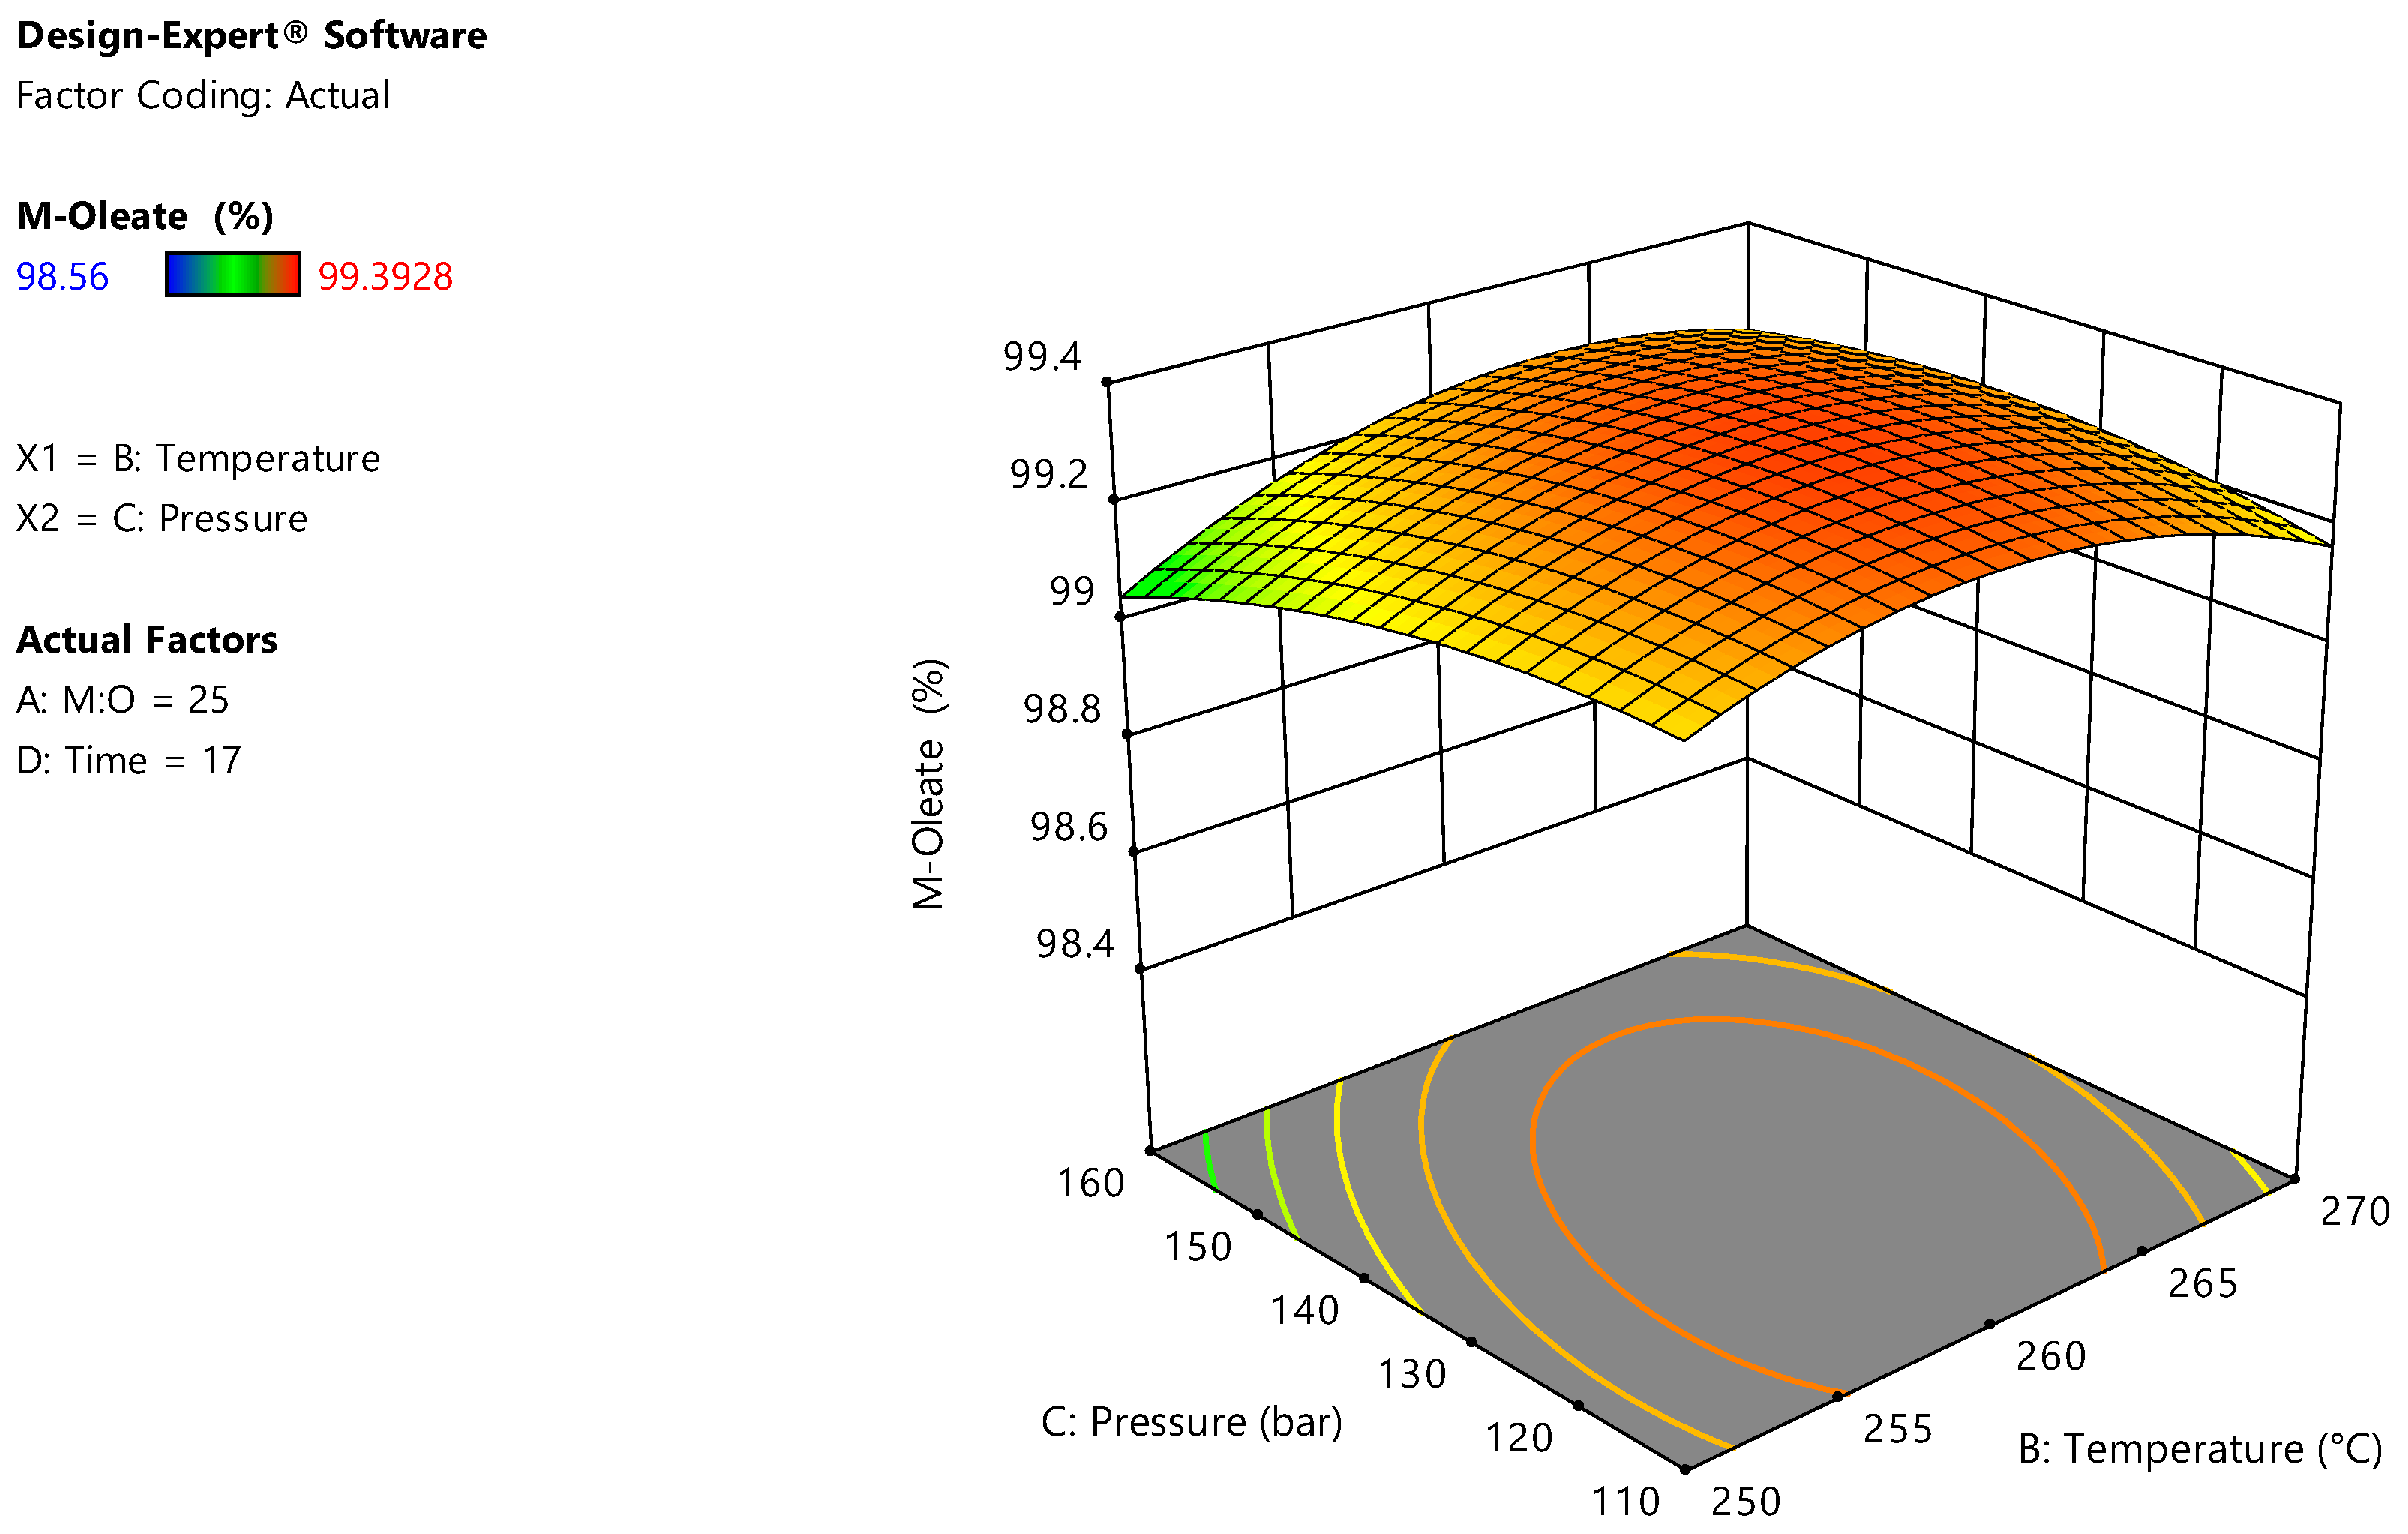
3.2.3. Effect of Reaction Temperature
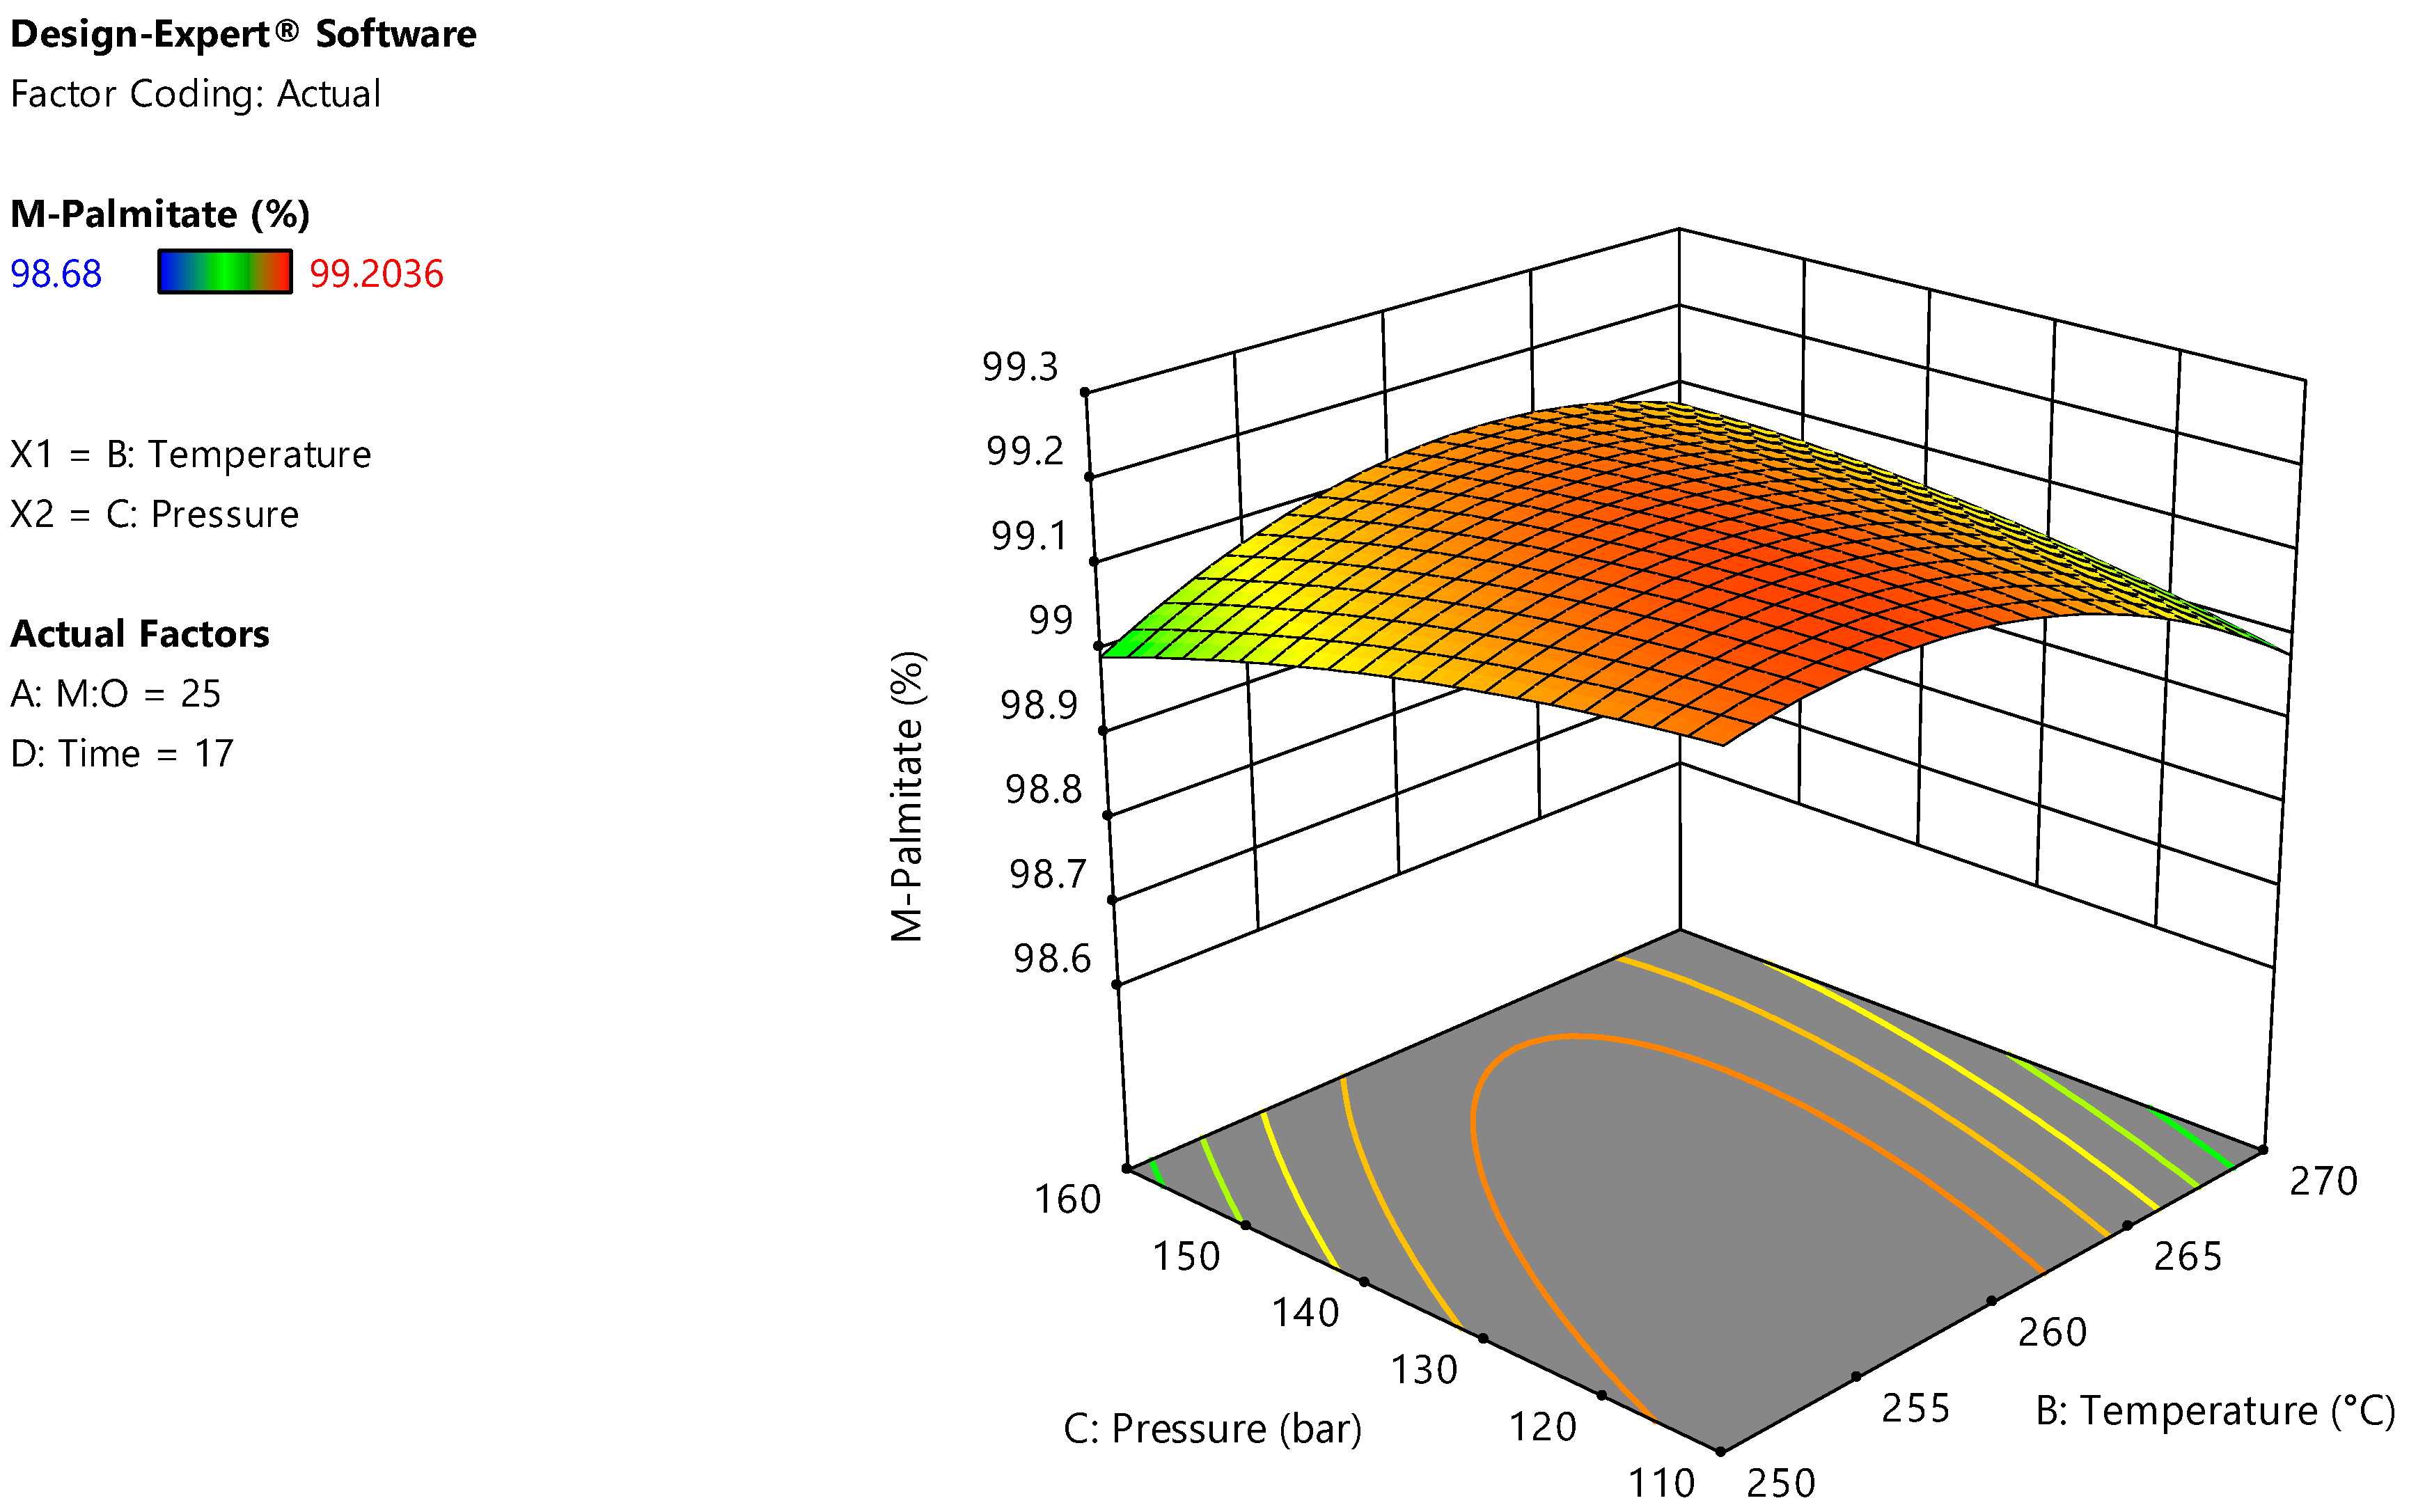
Using supercritical methanolysis, reaction temperature should be set to the critical temperature of methanol as a minimum condition. Accordingly, the temperature studied range has been started from 240 °C as shown in Table 3. The increasing effect of reaction temperature has enhanced the methyl-oleate yield as shown in Figure 2. However, at higher reaction temperatures the FAME yield starts to decrease. This phenomenon has been also observed in the yields of methyl-palmitate, methyl-linoleate and methyl-myristate as shown in Figure A4, Figure A5 and Figure A6, respectively. Thermal degradation of FAMEs is considered the main reason for decreasing the yield of FAME at temperatures higher than 265 °C [27]. Similar observations have been reported for decreasing FAMEs yield at higher temperatures than 265 °C [28,29].
3.2.4. Effect of Reaction Pressure
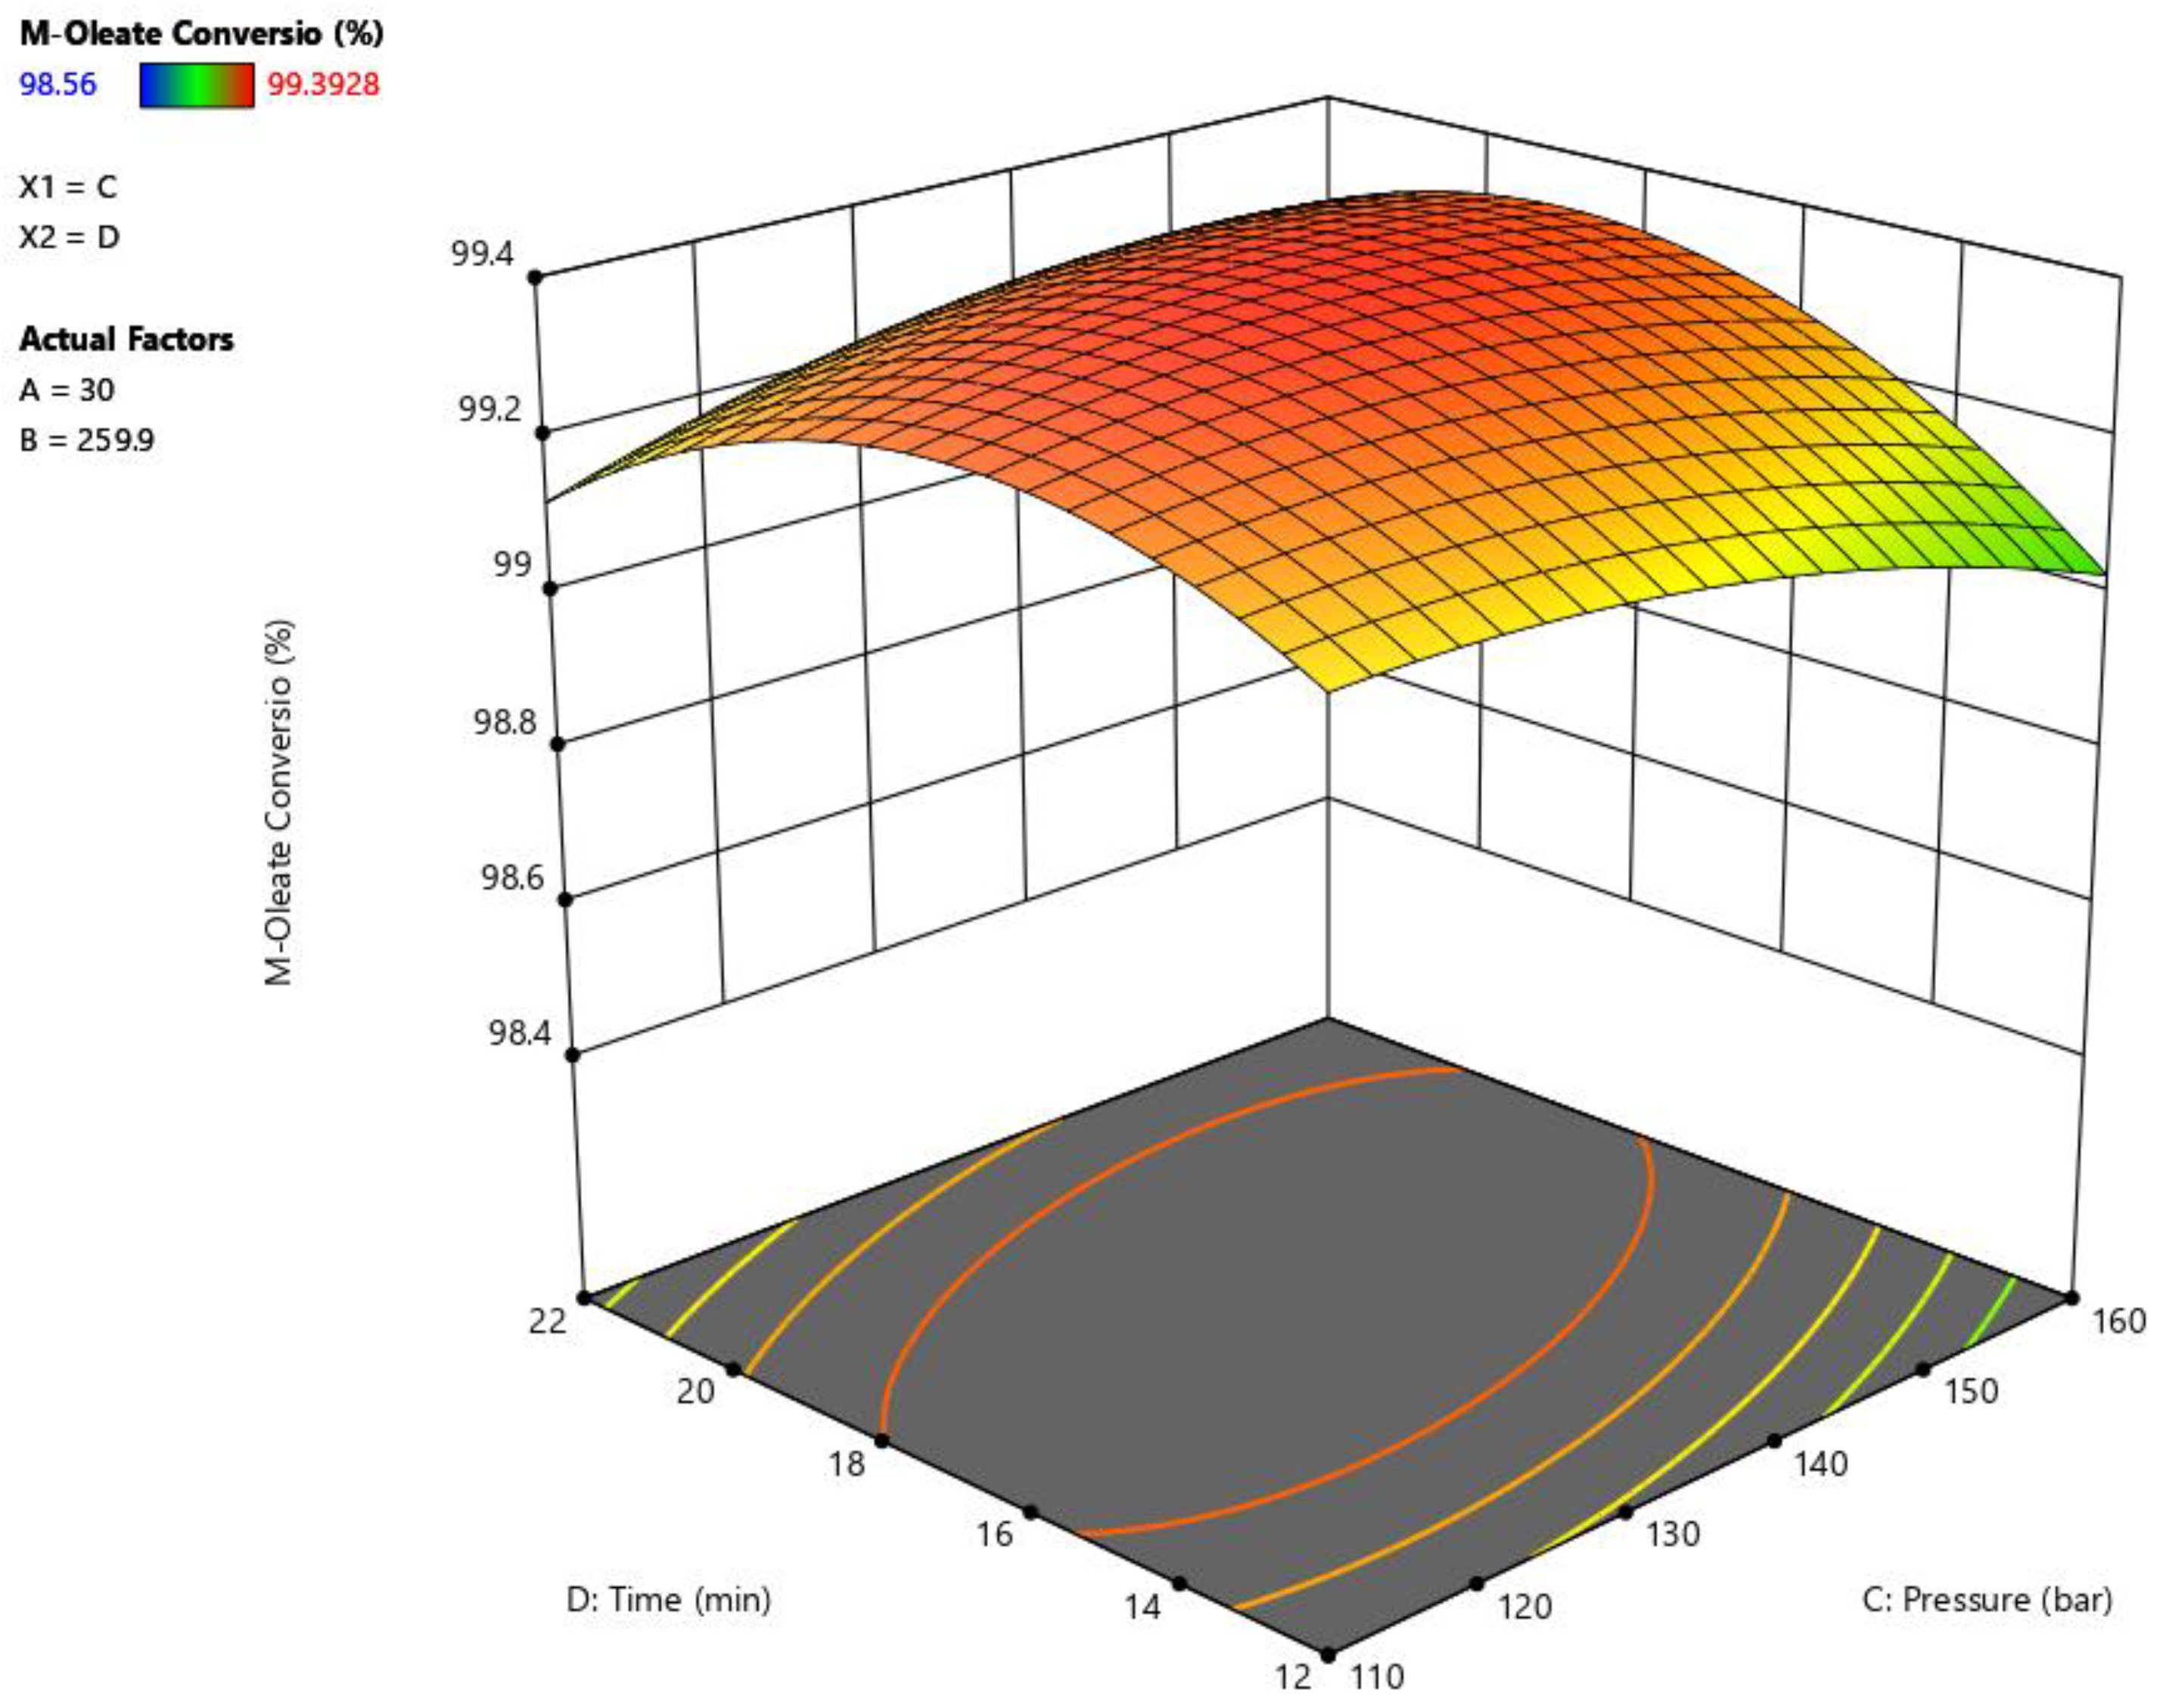
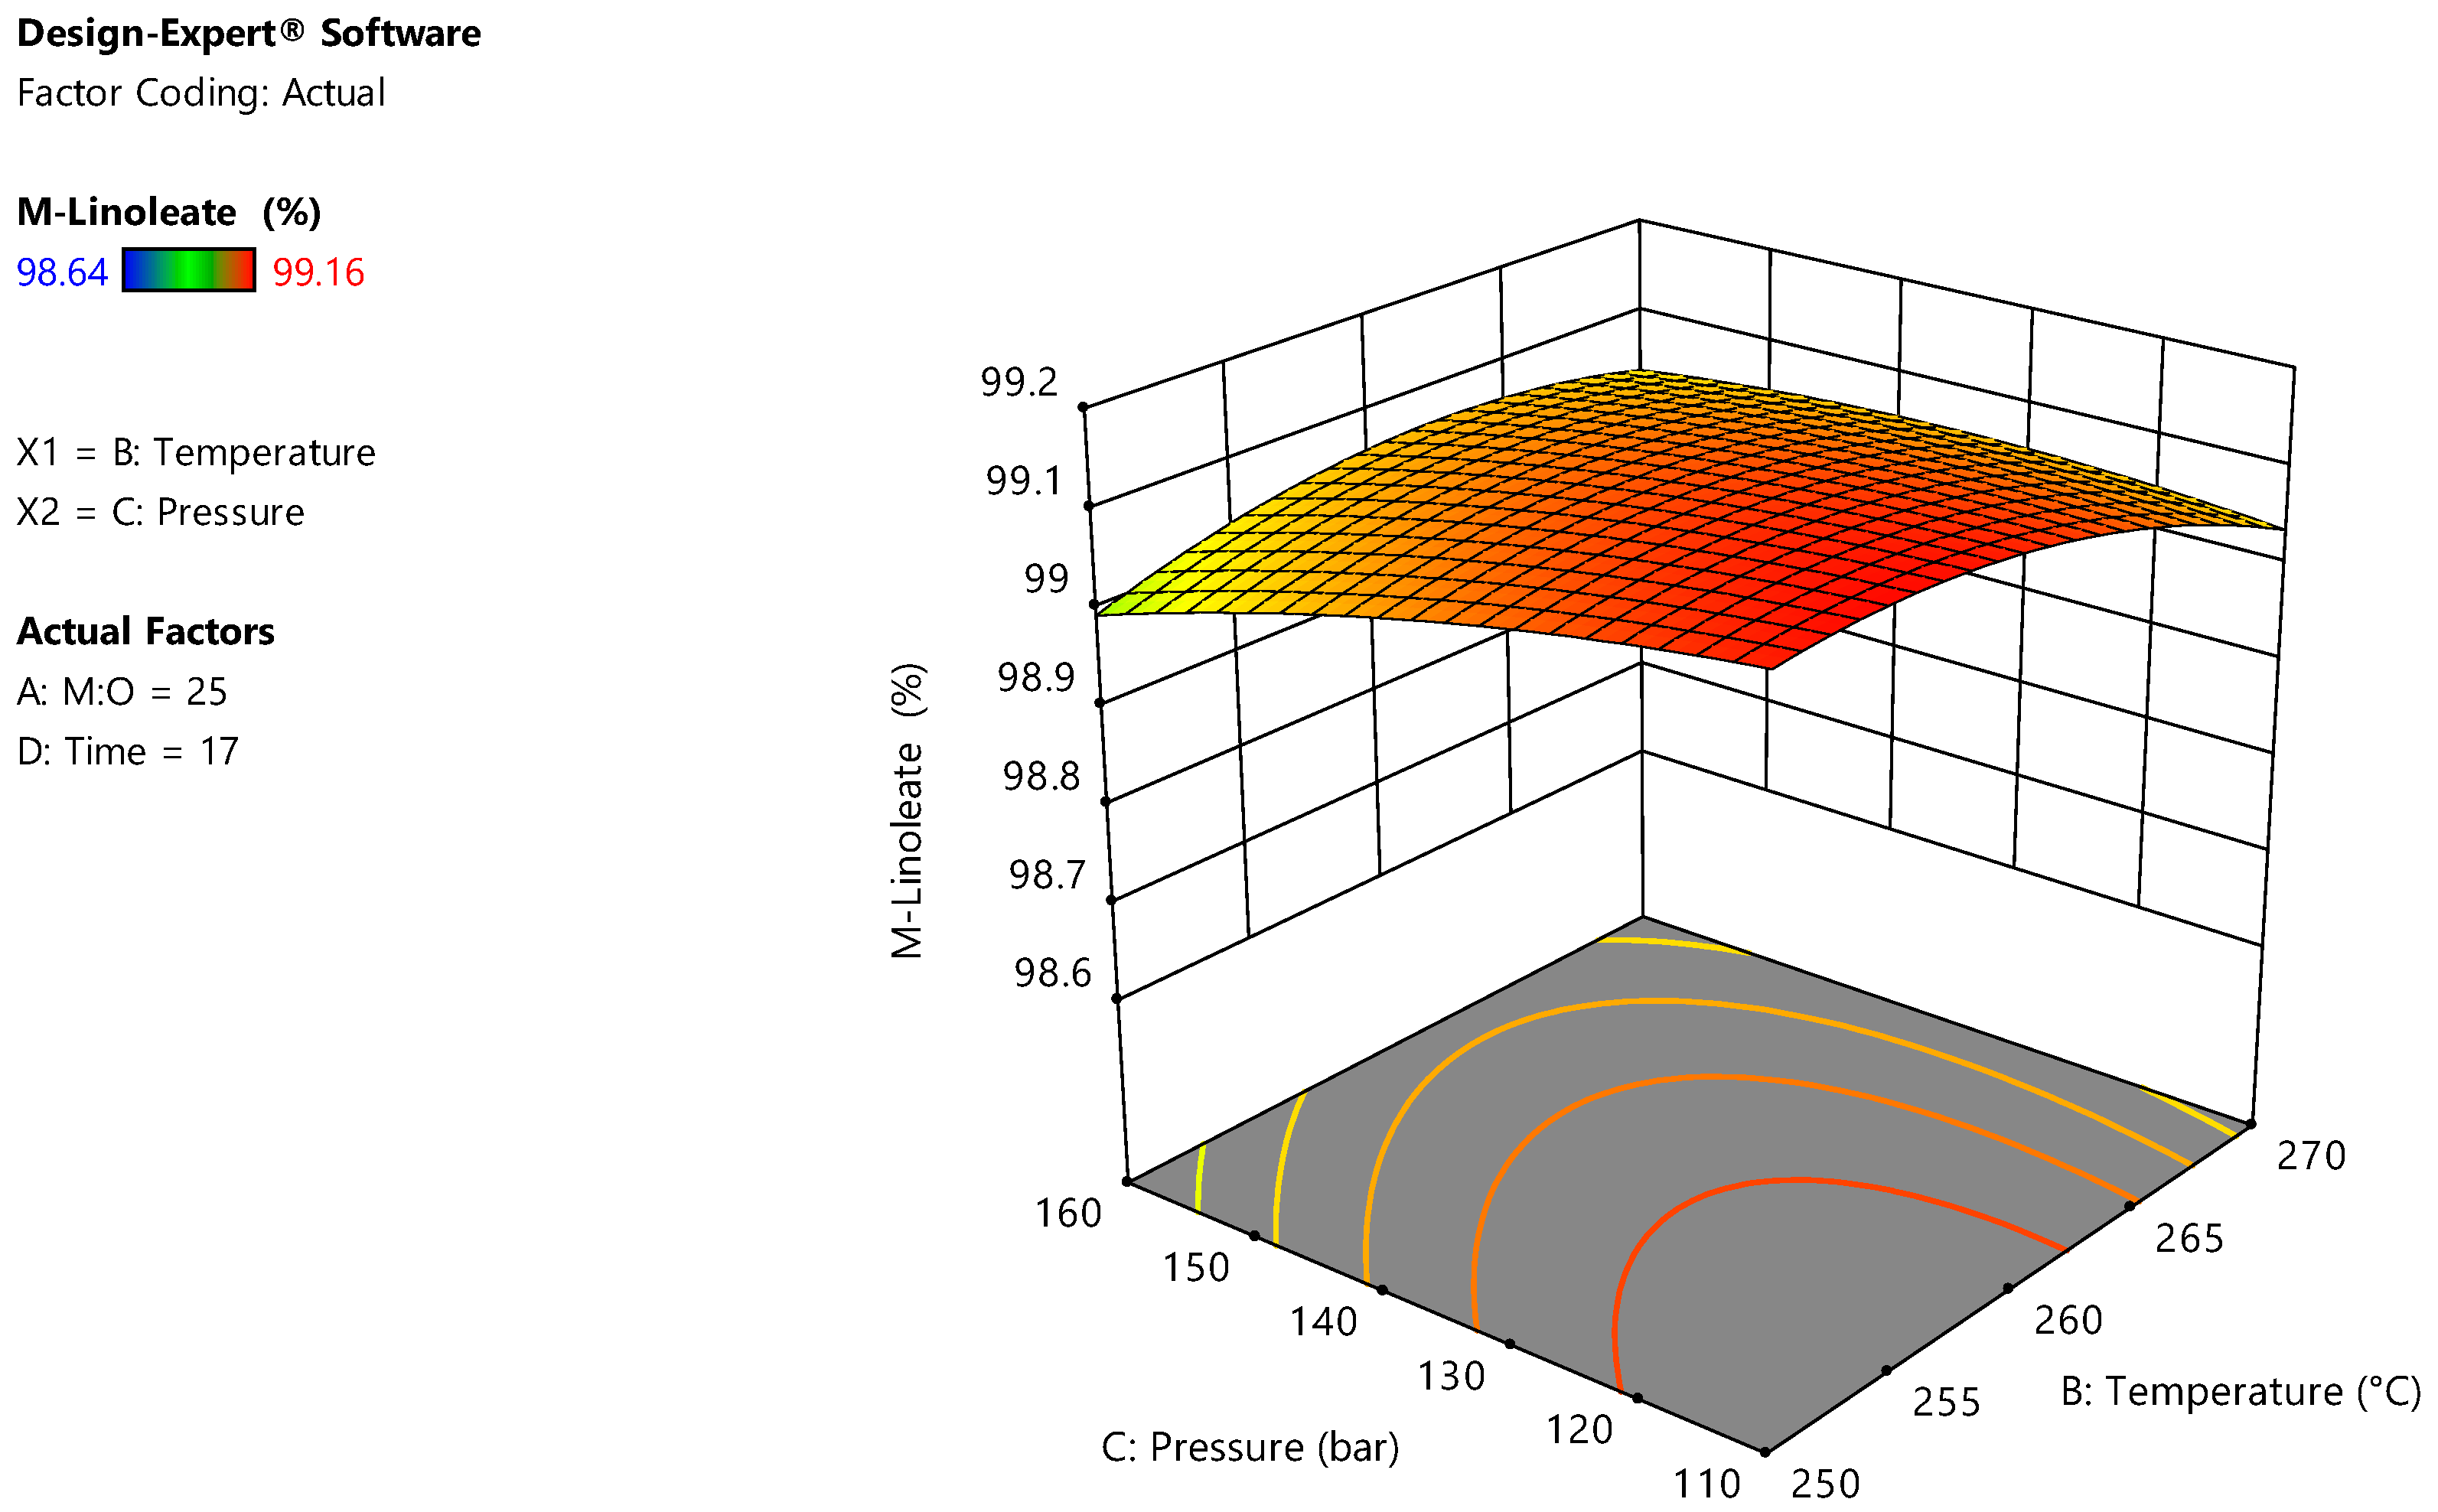
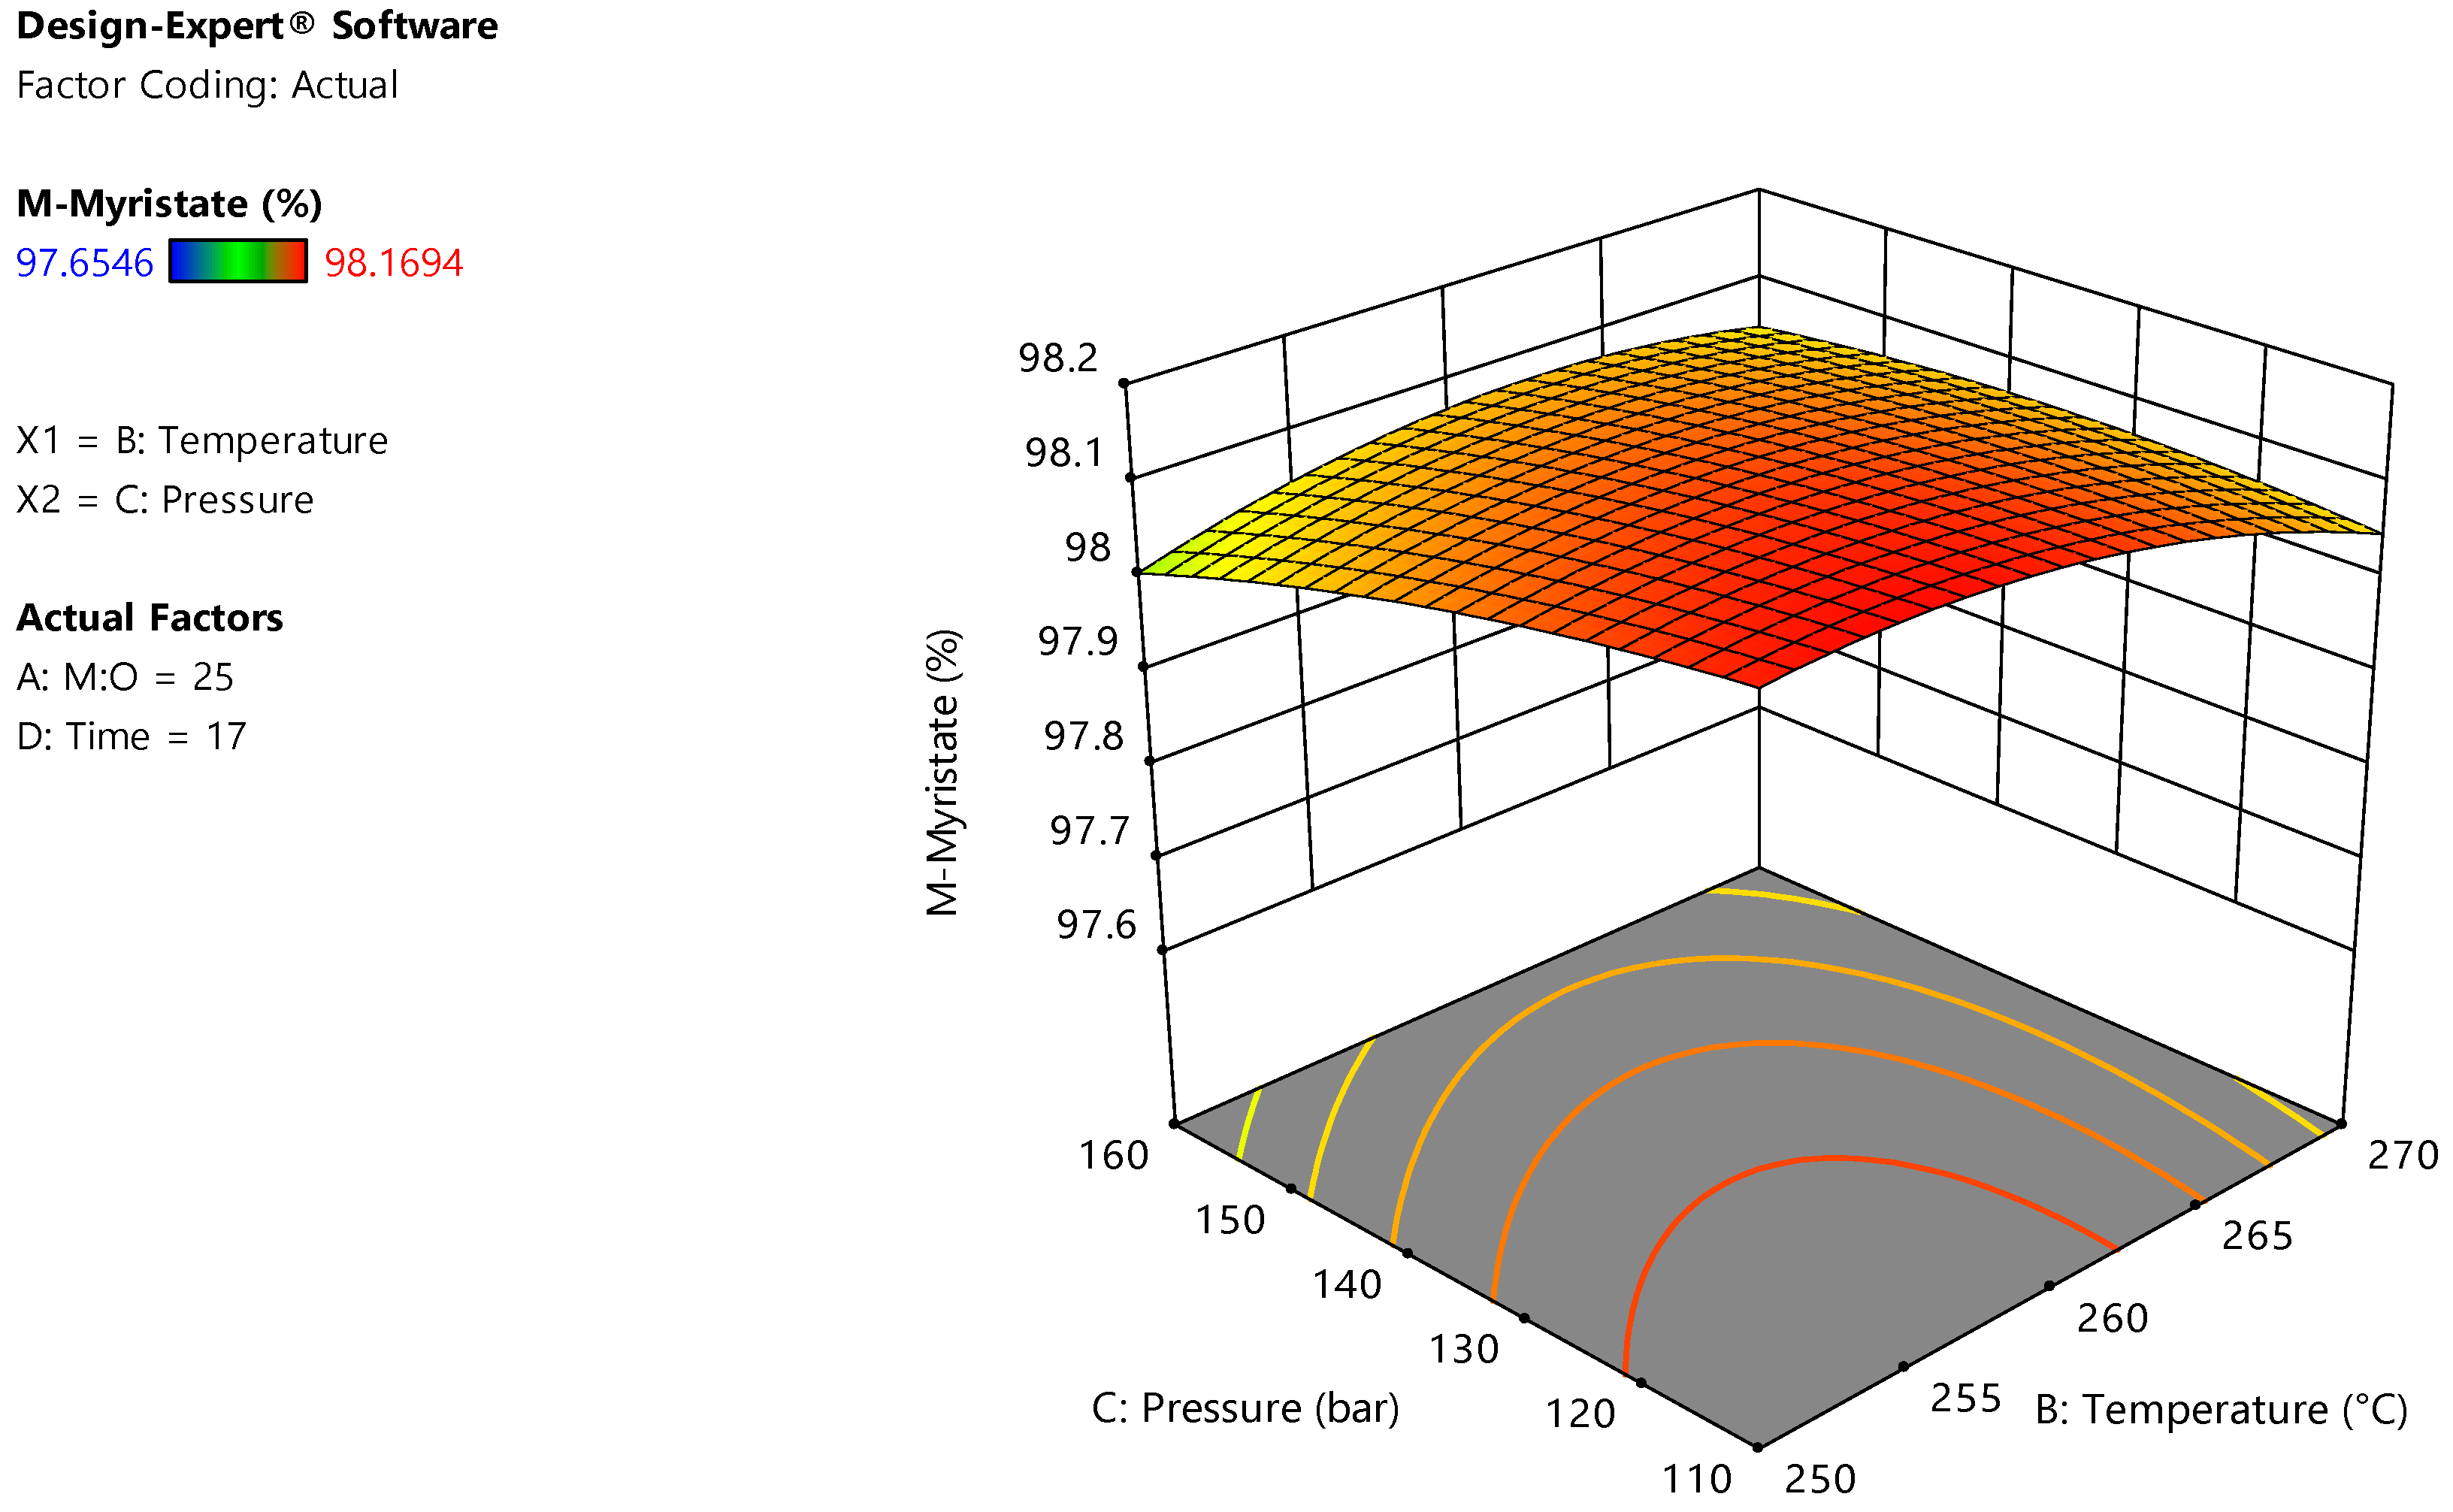
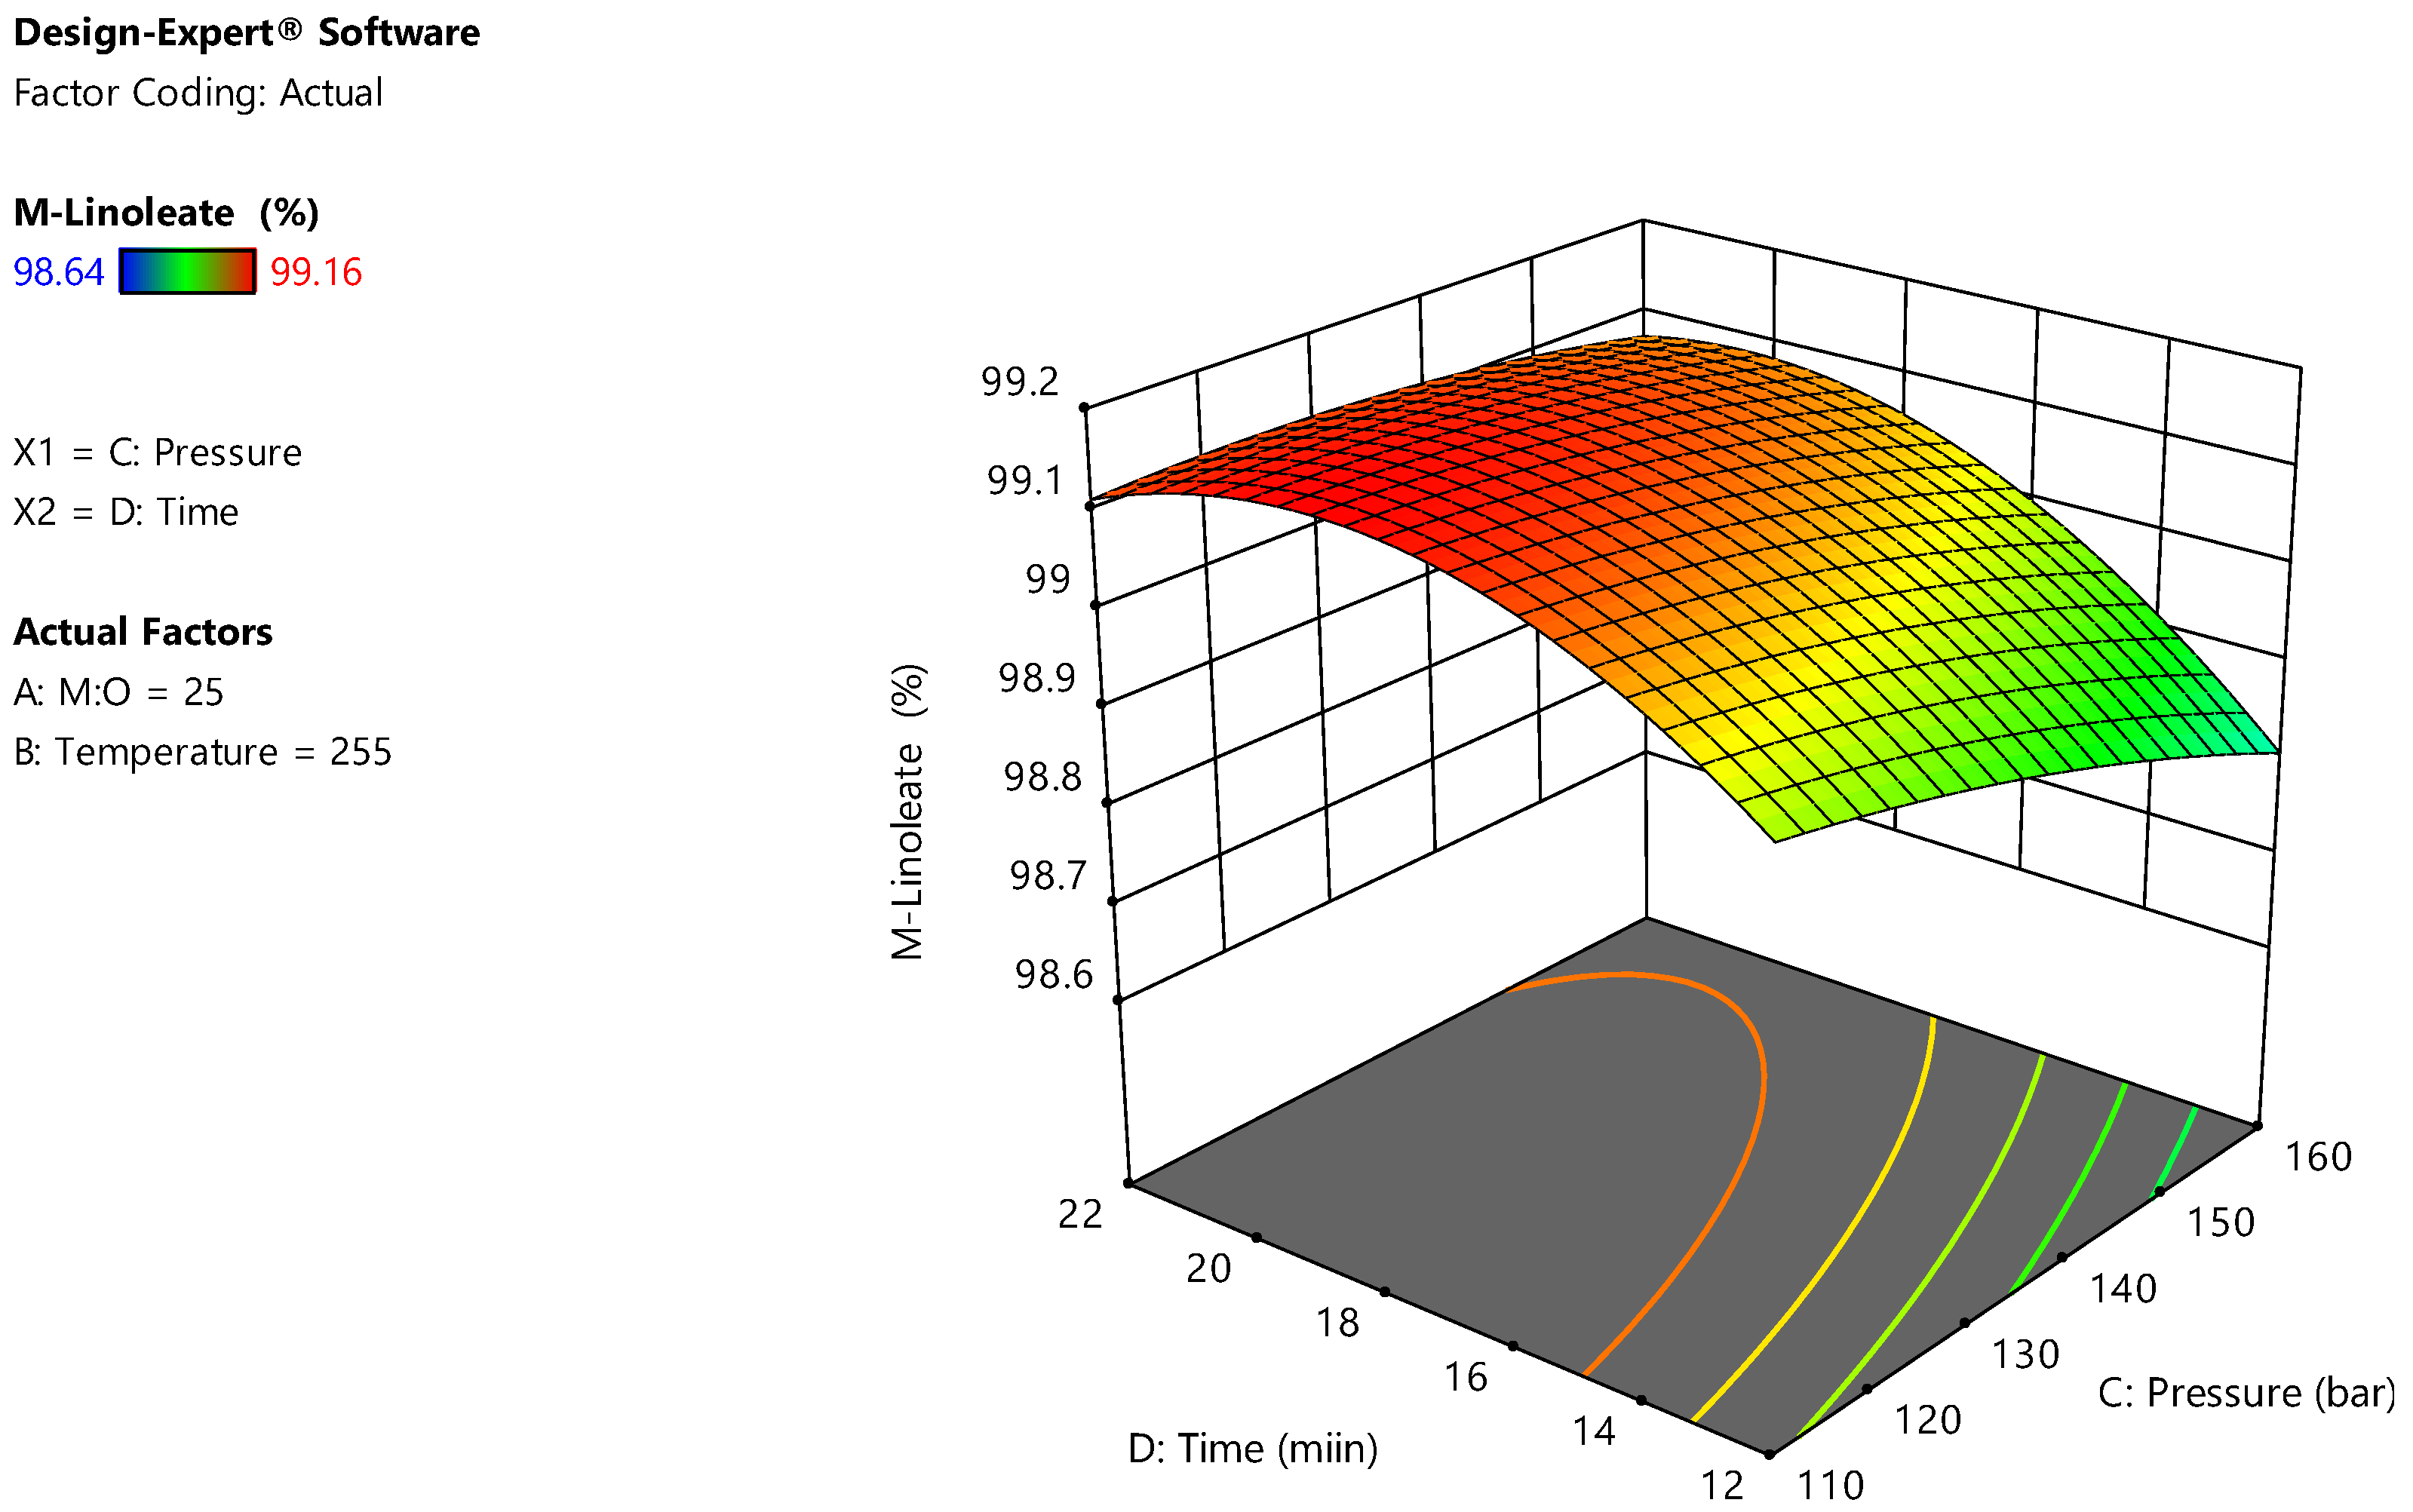
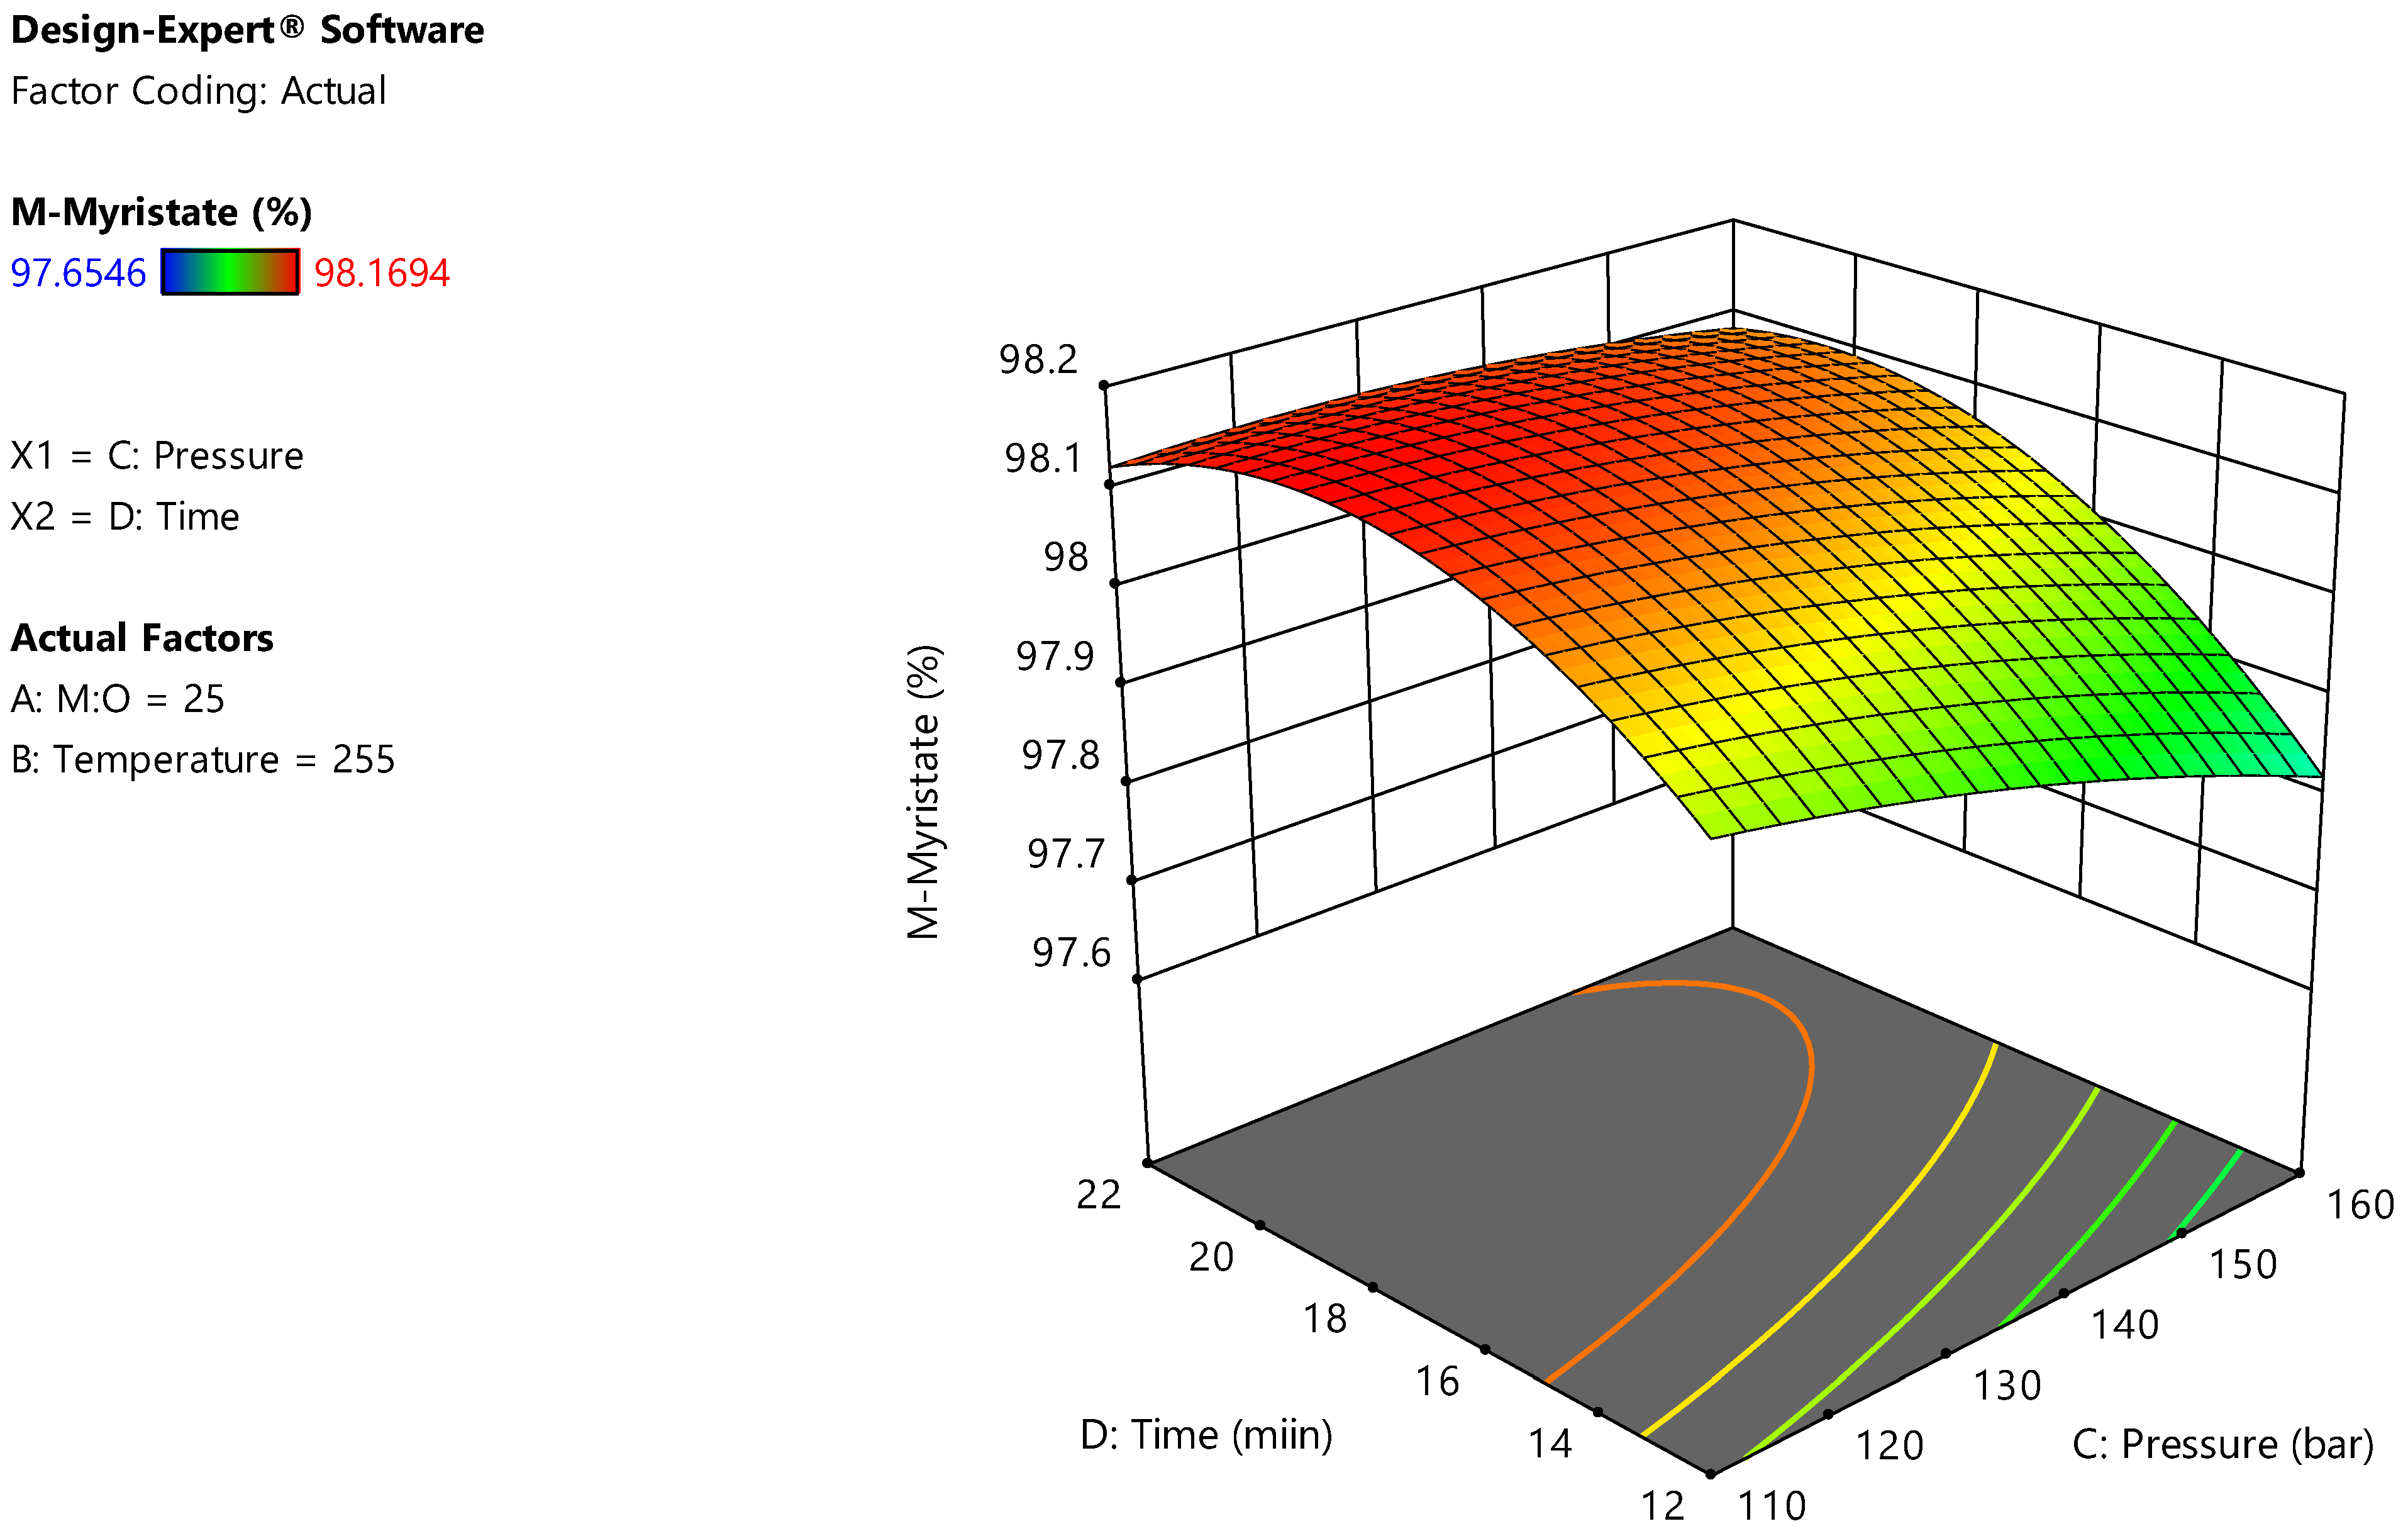
The ANOVA results shown in Table 5 have presented a significant effect of pressure on methyl-oleate yield. Reaction pressure has a significant negative effect on biodiesel yield at 250 °C, however, it has a negligible effect at higher temperatures i.e., 270 °C. This is attributed to the possible degradation of FAMEs at high pressures, in addition the presence of CO2 contributes to lowering the system’s critical point where a higher degradation rate is expected at higher temperature and pressure [30]. Similar results have been reported for the effect of high pressure on biodiesel yield [31]. They have reported that the solubility of methanol in oil decreases by increasing the pressure beyond the critical pressure. Similarly, an increase in pressure has a negative effect on biodiesel produced from soybean flakes lipids [32]. However, the total change in yield at extreme conditions has about only a 1% difference in methyl-oleate yield, which refers to the constant high yield of biodiesel from high FFA feedstock using supercritical methanolysis. The interactive effect between reaction time and pressure has been reported with a significant effect on methyl-oleate yield as shown in Figure 3. Similar significant interactions have been also observed in the yields of methyl-palmitate, methyl-linolinate and methyl-myristate as shown in Figure A7, Figure A8 and Figure A9, respectively. These results demonstrate that the effect of reaction pressure on the yield is not constant at different levels of reaction temperature and time. Similarly, a significant interaction between reaction temperature and pressure for biodiesel production from WCO has been reported previously [29].
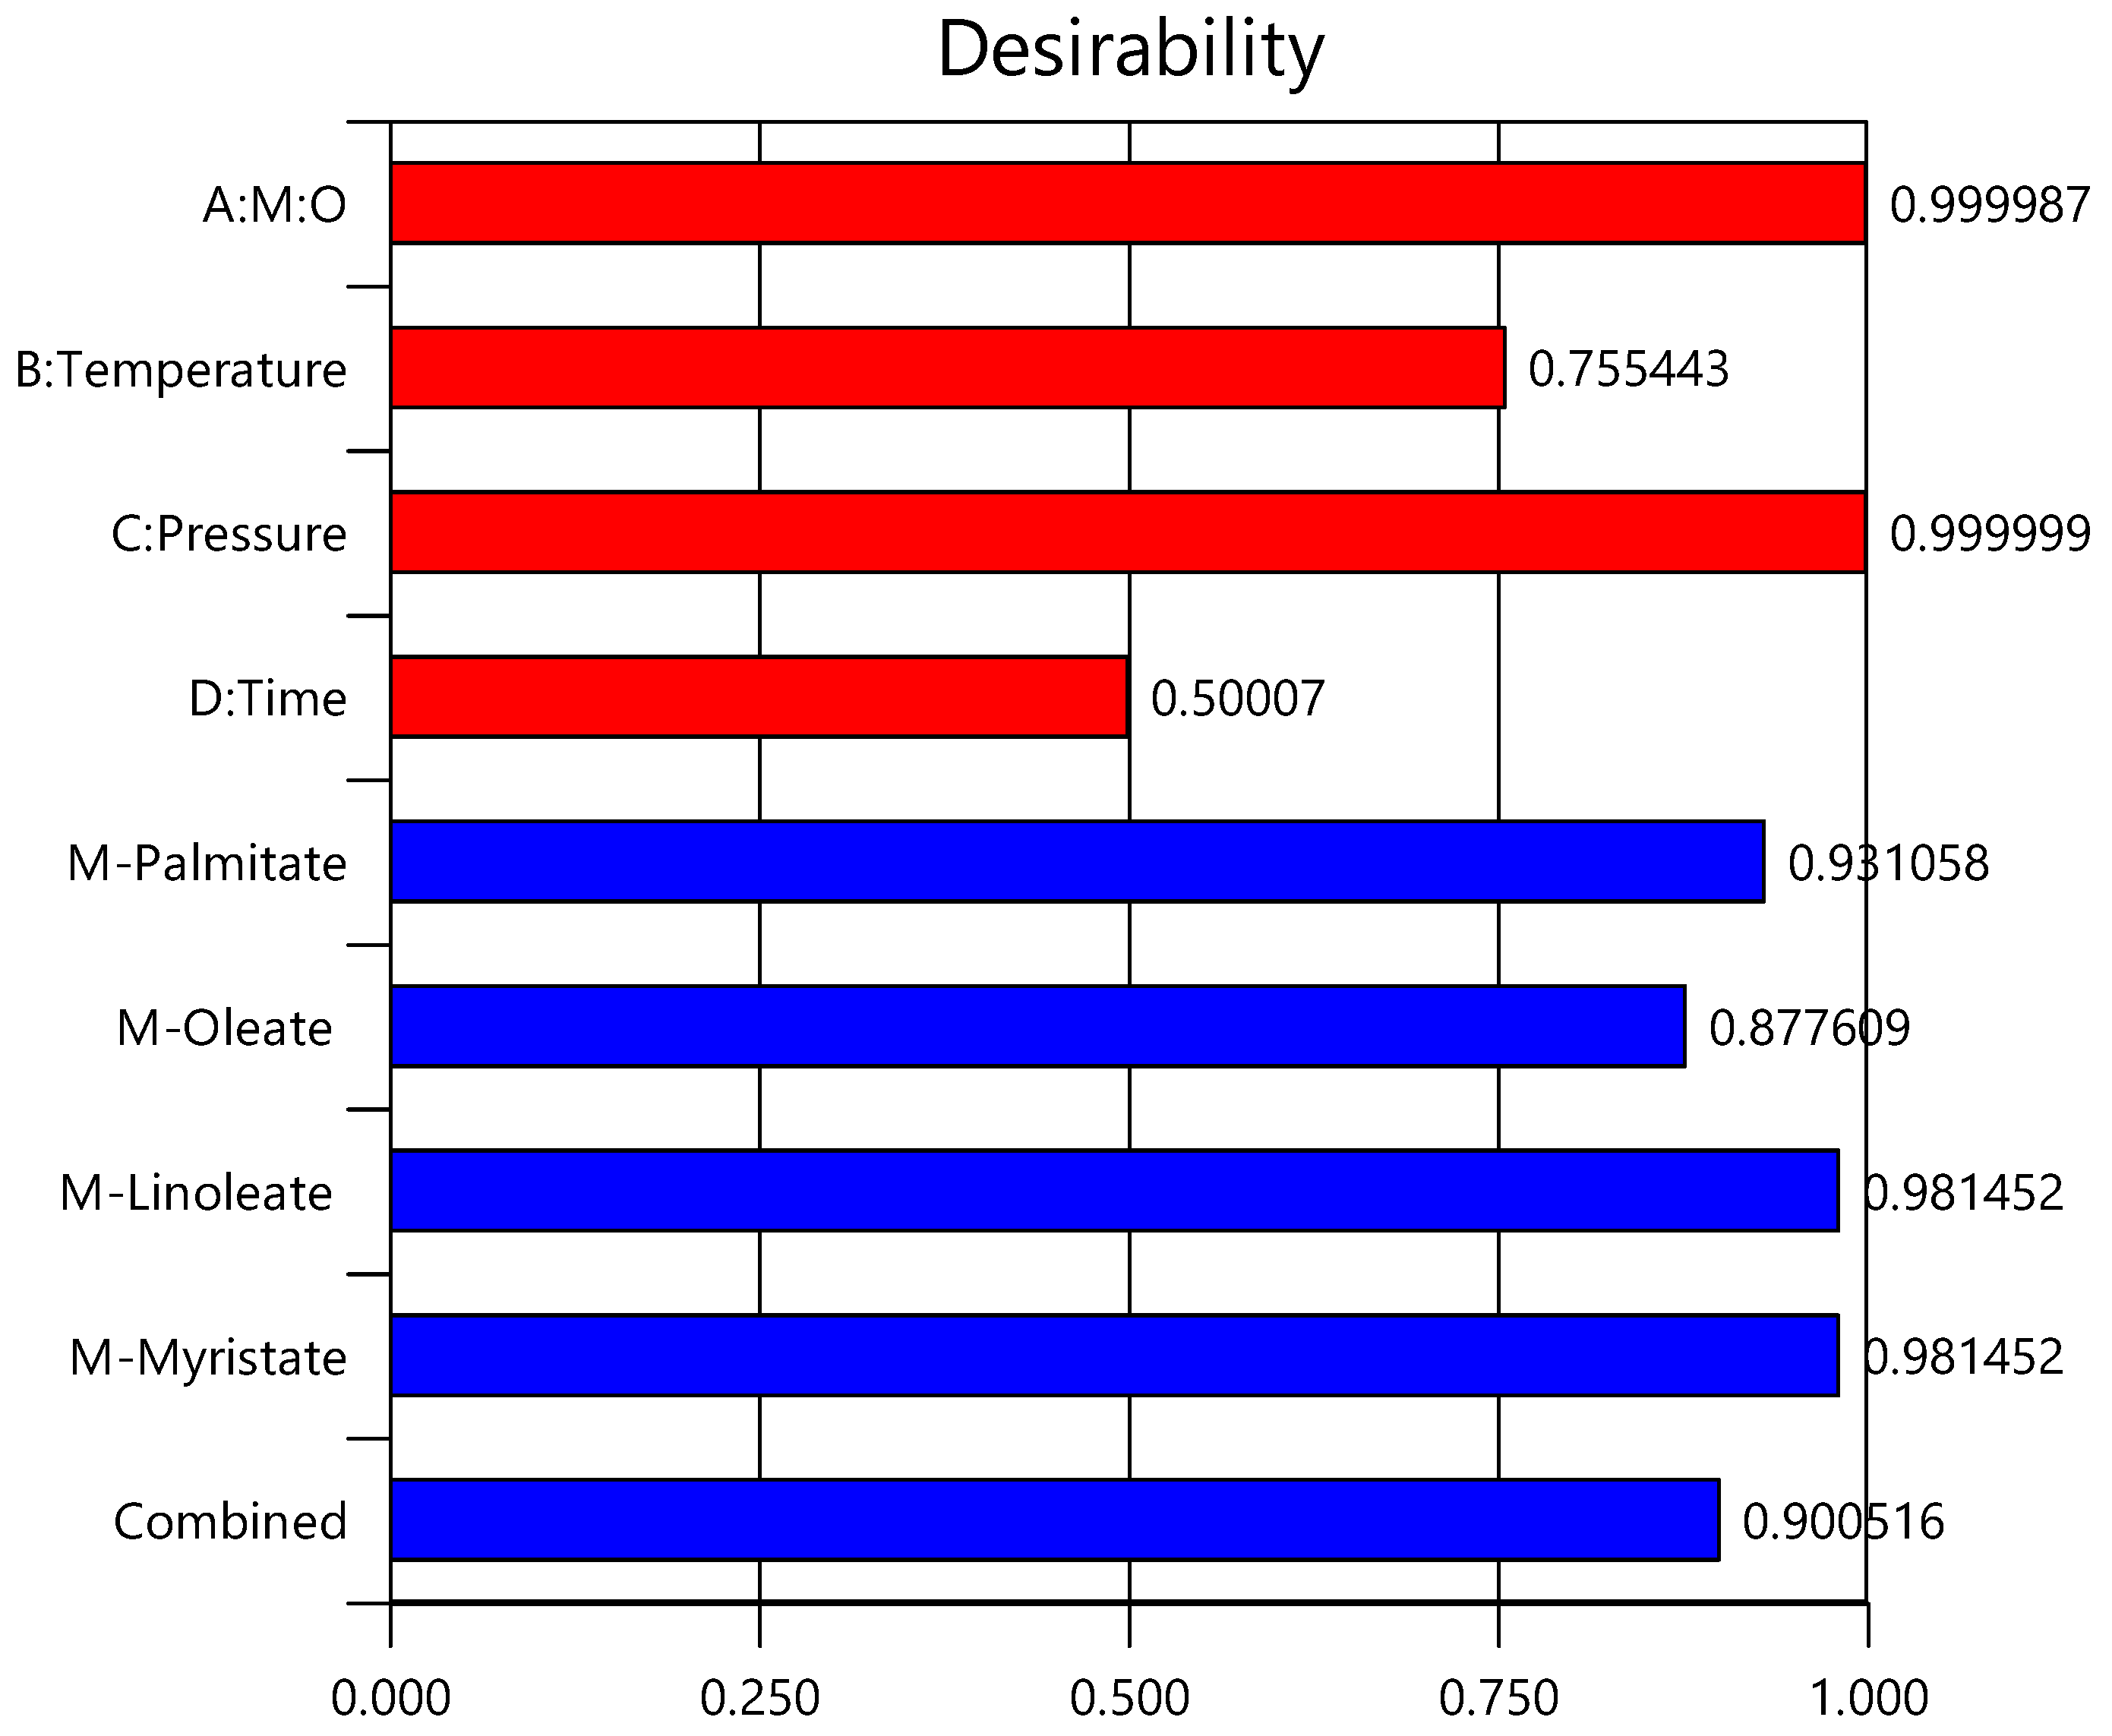
3.3. Process Optimisation
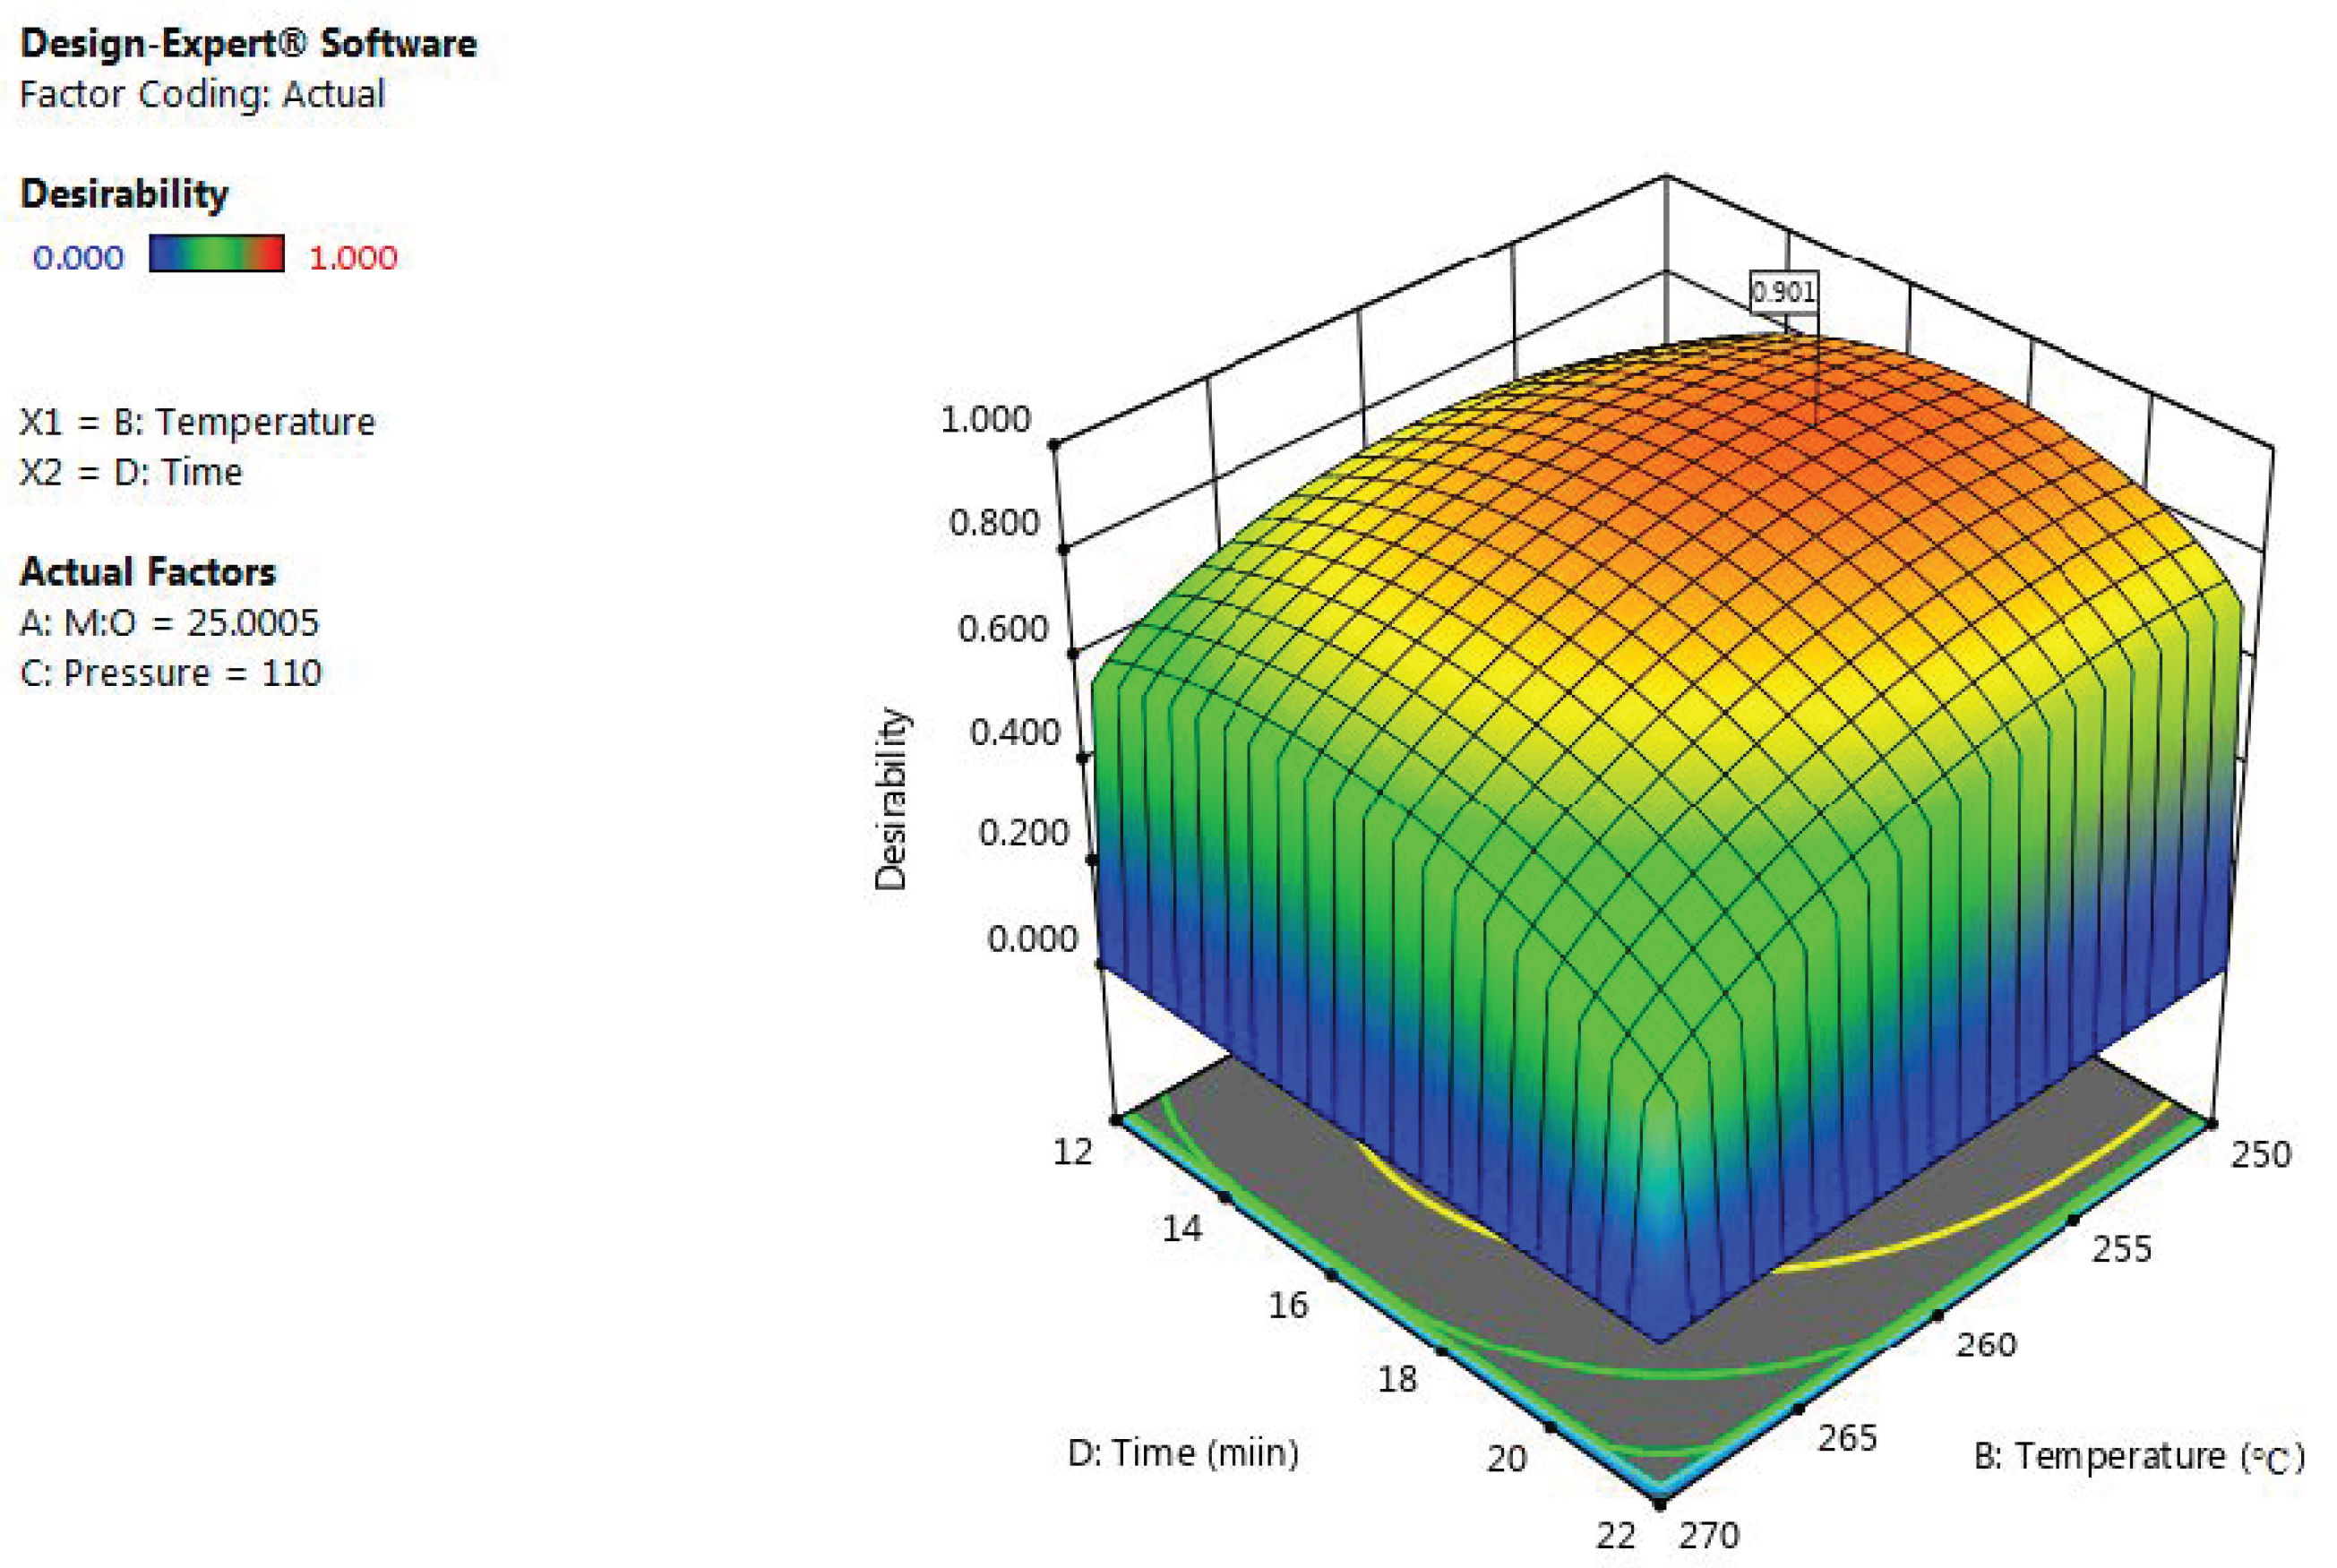
Several process variables interactions have been reported in this study where the influence of the process parameters varies according to the reaction conditions. Consequently, a multi-targeting numerical and graphical optimisation using RSM has been established to develop the optimal conditions based on a combination of the process variables’ interactions. The optimisation goals have been set to maximise all FAMEs yields while minimising reaction variables. The specific importance of each goal parameter has been identified where maximising FAMEs yields have been set to the highest importance. Minimising reaction temperature and time have been set with high importance followed by M:O molar ratio and reaction pressure as shown in Table 6. RSM has been implemented to evaluate the best combination of reaction parameters that could achieve the required goals with high desirability [26,33]. Accordingly, 34 solutions have been developed using numerical optimisation where the solution with the highest desirability has been considered. The developed conditions have resulted in achieving 99.16%, 99.3%, 99.15%, and 99.16% of methyl-oleate, methyl-palmitate, methyl-linoleate and methyl-myristate yields, respectively. The optimal conditions have been reported M:O molar ratio of 25:1, 255 °C, and 110 bar within 17 min. The desirability of each process parameter and response has been illustrated in Figure 4, in addition to the combined process desirability. Graphical optimisation has been employed to check that the developed conditions have achieved the highest desirability as shown in Figure 5. Furthermore, the predicted optimal conditions have been validated experimentally with relative errors between 0.5 and 0.85%.
3.4. Selection of Pressurising Gas
The choice of pressurizing gas in supercritical alcoholysis is a crucial step toward the production of a high yield of biodiesel. In this study, CO2 has been chosen as the pressurising gas as it has been reported that it acts as a co-solvent to enhance the solubility of oil in alcohols [34]. Additionally, a quick study has been conducted to assess the effect of the compressing gas on the yield of biodiesel. At the developed optimal conditions nitrogen was used to compress the reaction to 110 bar (optimal pressure). The reaction has resulted in a lower FAMEs yield between 94–96 % with a range of 4–6% decrease in comparison to using CO2 as a compressing gas. This quick assessment showed the ability of CO2 to act as a cosolvent to enhance the conversion of both triglycerides and FFAs into FAMEs in agreement with previous studies [30].
3.5. Physicochemical Properties of the Produced Biodiesel
To assess the applicability of the produced biodiesel to be supplied to the market, the quality and physicochemical properties have been analysed. The essential properties of the produced biodiesel have been examined including density, kinematic viscosity, and total acid number following the standard method for each calibration. The density and kinematic viscosity of the produced biodiesel is considered the most critical properties of biodiesel. Biodiesel with high viscosity leads to injection delay, ignition delay, combustion fractions and decrease the performance of diesel engine [35]. In addition, the current study has been performed on high acid value WCO where the final value of TAN is essential to evaluate the conversion of FFAs. The examined properties have been then compared with the European Biodiesel Standard, EN14214, as shown in Table 7. It has been observed in excellent agreement with the standard properties specifications which verify the proficiency of supercritical methanolysis in intensifying the production of biodiesel in a single-step reaction.
4. Conclusions
The influences of the process variables and their interactions on FAMEs yield have been investigated. The optimum yield FAMEs of methyl-oleate, methyl-palmitate, methyl-linoleate and methyl-myristate have been reported as 99.16%, 99.3%, 99.15% and 99.16%, respectively. The optimum yields have been achieved at 25:1 M:O molar ratio, 255 °C, 110 bar within 17 min. The experimental validation of the optimum conditions shows similar results to the predicted conditions with a range between 0.5 and 0.85% relative errors. The influence of using CO2 as a compressing gas has been validated to have a catalytic effect on enhancing the FAMEs yield. The quality of the produced biodiesel has been compared with the European biodiesel standard (EN14214) showing excellent agreement with the standard biodiesel properties.
Author Contributions
O.A.: Conceptualization, methodology, software, validation, visualization, formal analysis, writing—original draft preparation, M.G.: Conceptualization, writing—review and editing, formal analysis, data curation, resources, supervision, project administration, funding acquisition, B.S.: Conceptualization, writing—review and editing, formal analysis, data curation, resources, supervision, project administration, funding acquisition. All authors have read and agreed to the published version of the manuscript.
Funding
This research was funded by the Newton Fund Impact Scheme project supported by the British Council and Science, Technology & Innovation Funding Authority (STDF) Egypt (application IDs 624433253 and 43941).
Conflicts of Interest
The authors declare no conflict of interest.
Appendix A
Figure A1.
Calibration curves of methyl-oleate and methyl-linoleate.

Figure A2.
Calibration curves of methyl-palmitate and methyl-myristate.

Figure A3.
Predicted versus actual values for methyl-oleate model (a), methyl-palmitate model (b), methyl-linoleate model (c) and methyl-myristate model (d).
Figure A3.
Predicted versus actual values for methyl-oleate model (a), methyl-palmitate model (b), methyl-linoleate model (c) and methyl-myristate model (d).

Figure A4.
Response surface a for the effect of M:O molar ratio and reaction time on the yield of methyl-palmitate.
Figure A4.
Response surface a for the effect of M:O molar ratio and reaction time on the yield of methyl-palmitate.

Figure A5.
Response surface for the effect of M:O molar ratio and reaction time on the yield of methyl linoleate.
Figure A5.
Response surface for the effect of M:O molar ratio and reaction time on the yield of methyl linoleate.

Figure A6.
Response surface for the effect of M:O molar ratio and reaction time on the yield of methyl-myristate.
Figure A6.
Response surface for the effect of M:O molar ratio and reaction time on the yield of methyl-myristate.

Figure A7.
Response surface and contour plot for the effect of reaction temperature and pressure on the yield of methyl-palmitate.
Figure A7.
Response surface and contour plot for the effect of reaction temperature and pressure on the yield of methyl-palmitate.

Figure A8.
Response surface and contour plot for the effect of reaction temperature and pressure on the yield of methyl-linoleate.
Figure A8.
Response surface and contour plot for the effect of reaction temperature and pressure on the yield of methyl-linoleate.

Figure A9.
Response surface and contour plot for the effect of reaction temperature and pressure on the yield of methyl-myristate.
Figure A9.
Response surface and contour plot for the effect of reaction temperature and pressure on the yield of methyl-myristate.

Figure A10.
Response surface and contour plot for the effect of reaction pressure and time on the yield of methyl-palmitate.
Figure A10.
Response surface and contour plot for the effect of reaction pressure and time on the yield of methyl-palmitate.

Figure A11.
Response surface and contour plot for the effect of reaction pressure and time on the yield of methyl-linoleate.
Figure A11.
Response surface and contour plot for the effect of reaction pressure and time on the yield of methyl-linoleate.

Figure A12.
Response surface and contour plot for the effect of reaction pressure and time on the yield of methyl-myristate.
Figure A12.
Response surface and contour plot for the effect of reaction pressure and time on the yield of methyl-myristate.

Figure A13.
Chromatographic results of the derivatised WCO.


Table A1.
Analysis of variance for FAME yield of methyl-palmitate model.
| Run | M:O Ratio (A) | Temperature (°C) (B) | Pressure (bar) (C) | Time (min) (D) | Actual M-Oleate % | Predicted M-Oleate % | Actual M-Palmitate % | Predicted M-Palmitate % | Actual M-Linoleate % | Predicted M-Linoleate % | Actual M-Myristate % |
|---|---|---|---|---|---|---|---|---|---|---|---|
| 1 | 30 | 260 | 135 | 17 | 99.26 | 99.37 | 99.1 | 99.1 | 99.0 | 99.0 | 98.0 |
| 2 | 35 | 250 | 160 | 22 | 98.90 | 98.87 | 98.9 | 98.9 | 98.9 | 98.8 | 97.9 |
| 3 | 35 | 250 | 110 | 22 | 98.79 | 98.79 | 98.8 | 98.8 | 98.8 | 98.8 | 97.8 |
| 4 | 35 | 270 | 160 | 22 | 99.08 | 99.14 | 99.0 | 99.0 | 98.9 | 99.0 | 97.9 |
| 5 | 35 | 270 | 110 | 12 | 99.10 | 99.17 | 99.0 | 99.0 | 98.9 | 98.9 | 97.9 |
| 6 | 35 | 250 | 160 | 12 | 98.56 | 98.61 | 98.6 | 98.7 | 98.6 | 98.6 | 97.6 |
| 7 | 25 | 270 | 160 | 22 | 99.12 | 99.14 | 99.0 | 99.0 | 99.0 | 98.9 | 98.0 |
| 8 | 30 | 260 | 135 | 17 | 99.39 | 99.37 | 99.2 | 99.1 | 99.1 | 99.0 | 98.1 |
| 9 | 25 | 250 | 110 | 22 | 99.06 | 99.12 | 99.0 | 99.0 | 99.1 | 99.1 | 98.7 |
| 10 | 25 | 250 | 160 | 22 | 99.19 | 99.11 | 99.0 | 99.0 | 99.0 | 99.0 | 98.0 |
| 11 | 30 | 260 | 85 | 17 | 99.20 | 99.16 | 99.1 | 99.0 | 99.0 | 99.0 | 98.0 |
| 12 | 25 | 270 | 110 | 12 | 99.00 | 99.06 | 98.9 | 98.9 | 98.9 | 98.9 | 97.9 |
| 13 | 25 | 250 | 160 | 12 | 98.64 | 98.65 | 98.7 | 98.7 | 98.7 | 98.7 | 97.7 |
| 14 | 30 | 260 | 135 | 17 | 99.39 | 99.37 | 99.2 | 99.1 | 99.1 | 99.0 | 98.1 |
| 15 | 35 | 250 | 110 | 12 | 98.82 | 98.84 | 98.9 | 98.9 | 98.7 | 98.7 | 97.8 |
| 16 | 30 | 240 | 135 | 17 | 98.69 | 98.71 | 98.8 | 98.7 | 98.8 | 98.8 | 97.8 |
| 17 | 30 | 260 | 185 | 17 | 99.12 | 99.12 | 99.0 | 99.1 | 98.9 | 98.9 | 98.0 |
| 18 | 35 | 270 | 160 | 12 | 99.18 | 99.15 | 99.0 | 99.0 | 99.0 | 99.0 | 98.0 |
| 19 | 30 | 260 | 135 | 17 | 99.39 | 99.37 | 99.2 | 99.1 | 99.1 | 99.0 | 98.1 |
| 20 | 30 | 260 | 135 | 27 | 98.78 | 98.79 | 98.8 | 98.8 | 98.7 | 98.7 | 97.7 |
| 21 | 30 | 260 | 135 | 7 | 98.69 | 98.65 | 98.8 | 98.8 | 98.6 | 98.6 | 97.6 |
| 22 | 25 | 270 | 160 | 12 | 98.95 | 98.94 | 98.9 | 98. | 98.8 | 98.8 | 97.8 |
| 23 | 20 | 260 | 135 | 17 | 99.12 | 99.15 | 99.0 | 99.0 | 99.1 | 99.1 | 98.1 |
| 24 | 25 | 250 | 110 | 12 | 99.05 | 98.97 | 99.0 | 99.0 | 98.9 | 98.9 | 97.9 |
| 25 | 30 | 280 | 135 | 17 | 99.13 | 99.07 | 98.9 | 98.8 | 99.0 | 98.9 | 98.0 |
| 26 | 30 | 260 | 135 | 17 | 99.39 | 99.37 | 99.2 | 99.1 | 99.1 | 99.9 | 98.1 |
| 27 | 40 | 260 | 135 | 17 | 99.10 | 99.03 | 98.9 | 98.9 | 98.9 | 98.9 | 97.9 |
| 28 | 25 | 270 | 110 | 22 | 99.01 | 98.94 | 98.8 | 98.8 | 98.9 | 98.9 | 97.9 |
| 29 | 30 | 260 | 135 | 17 | 99.39 | 99.37 | 99.2 | 99.1 | 99.1 | 99.0 | 98.1 |
| 30 | 35 | 270 | 110 | 22 | 98.84 | 98.85 | 98.7 | 98.7 | 98.8 | 98.8 | 97.8 |
Table A2.
Analysis of variance for FAME yield of methyl-palmitate model.
| Fatty Acid | Sum of Squares | df | Mean Square | F-Value | p-Value | Significance |
|---|---|---|---|---|---|---|
| Model | 30.31 | 14 | 2.17 | 38.09 | <0.0001 | HS |
| A- M:O (molar ratio) | 0.88 | 1 | 0.88 | 15.45 | 0.0013 | HS |
| B-Temperature | 2.93 | 1 | 2.93 | 51.61 | <0.0001 | HS |
| C-Pressure | 5.91 | 1 | 5.91 | 104.04 | <0.0001 | HS |
| D-Time | 4.85 | 1 | 4.85 | 85.23 | <0.0001 | HS |
| AB | 0.73 | 1 | 0.73 | 12.89 | 0.0027 | HS |
| AC | 1.00 | 1 | 1.00 | 17.65 | 0.0008 | HS |
| AD | 0.067 | 1 | 0.067 | 1.18 | 0.2938 | NS |
| BC | 0.38 | 1 | 0.38 | 6.61 | 0.0213 | S |
| BD | 0.021 | 1 | 0.021 | 0.36 | 0.5558 | NS |
| CD | 0.063 | 1 | 0.063 | 1.10 | 0.3099 | NS |
| A2 | 0.0051 | 1 | 50.0051 | 0.097 | 0.7597 | NS |
| B2 | 0.023 | 1 | 0.023 | 0.40 | 0.5376 | NS |
| C2 | 5.66 | 1 | 5.66 | 99.54 | <0.0001 | HS |
| D2 | 5.87 | 1 | 5.87 | 103.24 | <0.0001 | HS |
| Residual | 0.85 | 15 | 0.057 | |||
| Lack of Fit | 0.42 | 10 | 0.042 | 0.49 | 0.8451 | NS |
| Pure Error | 0.43 | 5 | 0.087 | |||
| Cor Total | 31.17 | 29 |
Table A3.
Analysis of variance for FAME yield of methyl-linoleate model.
| Fatty Acid | Sum of Squares | df | Mean Square | F-Value | p-Value | Significance |
|---|---|---|---|---|---|---|
| Model | 30.31 | 14 | 2.17 | 38.09 | <0.0001 | HS |
| A- M:O (molar ratio) | 0.88 | 1 | 0.88 | 15.45 | 0.0013 | HS |
| B-Temperature | 2.93 | 1 | 2.93 | 51.61 | <0.0001 | HS |
| C-Pressure | 5.91 | 1 | 5.91 | 104.04 | <0.0001 | HS |
| D-Time | 4.85 | 1 | 4.85 | 85.23 | <0.0001 | HS |
| AB | 0.73 | 1 | 0.73 | 12.89 | 0.0027 | HS |
| AC | 1.00 | 1 | 1.00 | 17.65 | 0.0008 | HS |
| AD | 0.067 | 1 | 0.067 | 1.18 | 0.2938 | NS |
| BC | 0.38 | 1 | 0.38 | 6.61 | 0.0213 | S |
| BD | 0.021 | 1 | 0.021 | 0.36 | 0.5558 | NS |
| CD | 0.063 | 1 | 0.063 | 1.10 | 0.3099 | NS |
| A2 | 0.0051 | 1 | 50.0051 | 0.097 | 0.7597 | NS |
| B2 | 0.023 | 1 | 0.023 | 0.40 | 0.5376 | NS |
| C2 | 5.66 | 1 | 5.66 | 99.54 | <0.0001 | HS |
| D2 | 5.87 | 1 | 5.87 | 103.24 | <0.0001 | HS |
| Residual | 0.85 | 15 | 0.057 | |||
| Lack of Fit | 0.42 | 10 | 0.042 | 0.49 | 0.8451 | NS |
| Pure Error | 0.43 | 5 | 0.087 | |||
| Cor Total | 31.17 | 29 |
Table A4.
Analysis of variance for FAME yield of methyl-myristate model.
| Fatty Acid | Sum of Squares | df | Mean Square | F-Value | p-Value | Significance |
|---|---|---|---|---|---|---|
| Model | 30.31 | 14 | 2.17 | 38.09 | <0.0001 | HS |
| A- M:O (molar ratio) | 0.88 | 1 | 0.88 | 15.45 | 0.0013 | HS |
| B-Temperature | 2.93 | 1 | 2.93 | 51.61 | <0.0001 | HS |
| C-Pressure | 5.91 | 1 | 5.91 | 104.04 | <0.0001 | HS |
| D-Time | 4.85 | 1 | 4.85 | 85.23 | <0.0001 | HS |
| AB | 0.73 | 1 | 0.73 | 12.89 | 0.0027 | HS |
| AC | 1.00 | 1 | 1.00 | 17.65 | 0.0008 | HS |
| AD | 0.067 | 1 | 0.067 | 1.18 | 0.2938 | NS |
| BC | 0.38 | 1 | 0.38 | 6.61 | 0.0213 | S |
| BD | 0.021 | 1 | 0.021 | 0.36 | 0.5558 | NS |
| CD | 0.063 | 1 | 0.063 | 1.10 | 0.3099 | NS |
| A2 | 0.0051 | 1 | 50.0051 | 0.097 | 0.7597 | NS |
| B2 | 0.023 | 1 | 0.023 | 0.40 | 0.5376 | NS |
| C2 | 5.66 | 1 | 5.66 | 99.54 | <0.0001 | HS |
| D2 | 5.87 | 1 | 5.87 | 103.24 | <0.0001 | HS |
| Residual | 0.85 | 15 | 0.057 | |||
| Lack of Fit | 0.42 | 10 | 0.042 | 0.49 | 0.8451 | NS |
| Pure Error | 0.43 | 5 | 0.087 | |||
| Cor Total | 31.17 | 29 |
References
- Sahar, S.S.; Iqbal, J.; Ullah, I.; Bhatti, H.N.; Nouren, S.; Habib-ur-Rehman; Nisar, J.; Iqbal, M. Biodiesel production from waste cooking oil: An efficient technique to convert waste into biodiesel. Sustain. Cities Soc. 2018, 41, 220–226. [Google Scholar] [CrossRef]
- Kurowska, K.; Marks-Bielska, R.; Bielski, S.; Kryszk, H.; Jasinskas, A. Food security in the context of liquid biofuels production. Energies 2020, 13, 6247. [Google Scholar] [CrossRef]
- Yaqoob, H.; Teoh, Y.H.; Sher, F.; Farooq, M.U.; Jamil, M.A.; Kausar, Z.; Sabah, N.U.; Shah, M.F.; Rehman, H.Z.U.; Rehman, A.U. Potential of Waste Cooking Oil Biodiesel as Renewable Fuel in Combustion Engines: A Review. Energies 2021, 14, 2565. [Google Scholar] [CrossRef]
- Çamur, H.; Alassi, E. Physicochemical Properties Enhancement of Biodiesel Synthesis from Various Feedstocks of Waste/Residential Vegetable Oils and Palm Oil. Energies 2021, 14, 4928. [Google Scholar] [CrossRef]
- Xie, W.; Gao, C.; Wang, H. Biodiesel Production from Low-Quality Oils Using Heterogeneous Cesium Salts of Vanadium-Substituted Polyoxometalate Acid Catalyst. Catalysts 2020, 10, 1060. [Google Scholar] [CrossRef]
- Poudel, J.; Karki, S.; Sanjel, N.; Shah, M.; Oh, S. Comparison of Biodiesel Obtained from Virgin Cooking Oil and Waste Cooking Oil Using Supercritical and Catalytic Transesterification. Energies 2017, 10, 546. [Google Scholar] [CrossRef] [Green Version]
- Aboelazayem, O.; El-Gendy, N.S.; Abdel-Rehim, A.A.; Ashour, F.; Sadek, M.A. Biodiesel production from castor oil in Egypt: Process optimisation, kinetic study, diesel engine performance and exhaust emissions analysis. Energy 2018, 157, 843–852. [Google Scholar] [CrossRef]
- Hsiao, M.-C.; Liao, P.-H.; Lan, N.V.; Hou, S.-S. Enhancement of Biodiesel Production from High-Acid-Value Waste Cooking Oil via a Microwave Reactor Using a Homogeneous Alkaline Catalyst. Energies 2021, 14, 437. [Google Scholar] [CrossRef]
- Nisar, S.; Hanif, M.A.; Rashid, U.; Hanif, A.; Akhtar, M.N.; Ngamcharussrivichai, C. Trends in Widely Used Catalysts for Fatty Acid Methyl Esters (FAME) Production: A Review. Catalysts 2021, 11, 1085. [Google Scholar] [CrossRef]
- Budžaki, S.; Miljić, G.; Tišma, M.; Sundaram, S.; Hessel, V. Is there a future for enzymatic biodiesel industrial production in microreactors? Appl. Energy 2017, 201, 124–134. [Google Scholar] [CrossRef]
- Hassan, A.A.; Smith, J.D. Laboratory-Scale Research of Non-Catalyzed Supercritical Alcohol Process for Continuous Biodiesel Production. Catalysts 2021, 11, 435. [Google Scholar] [CrossRef]
- Aboelazayem, O.; Gadalla, M.; Saha, B. Derivatisation-free characterisation and supercritical conversion of free fatty acids into biodiesel from high acid value waste cooking oil. Renew. Energy 2019, 143, 77–90. [Google Scholar] [CrossRef]
- Ganev, E.; Ivanov, B.; Vaklieva-Bancheva, N.; Kirilova, E.; Dzhelil, Y. A Multi-Objective Approach toward Optimal Design of Sustainable Integrated Biodiesel/Diesel Supply Chain Based on First- and Second-Generation Feedstock with Solid Waste Use. Energies 2021, 14, 2261. [Google Scholar] [CrossRef]
- Qadeer, M.U.; Ayoub, M.; Komiyama, M.; Khan Daulatzai, M.U.; Mukhtar, A.; Saqib, S.; Ullah, S.; Qyyum, M.A.; Asif, S.; Bokhari, A. Review of biodiesel synthesis technologies, current trends, yield influencing factors and economical analysis of supercritical process. J. Clean. Prod. 2021, 309, 127388. [Google Scholar] [CrossRef]
- Aboelazayem, O.; Gadalla, M.; Saha, B. An experimental-based energy integrated process for Biodiesel production from waste cooking oil using supercritical methanol. Chem. Eng. Trans. 2017, 61, 1645–1650. [Google Scholar] [CrossRef]
- Aboelazayem, O.; Gadalla, M.; Alhajri, I.; Saha, B. Advanced process integration for supercritical production of biodiesel: Residual waste heat recovery via organic Rankine cycle (ORC). Renew. Energy 2021, 164, 433–443. [Google Scholar] [CrossRef]
- Farobie, O.; Matsumura, Y. State of the art of biodiesel production under supercritical conditions. Prog. Energy Combust. Sci. 2017, 63, 173–203. [Google Scholar] [CrossRef]
- Aboelazayem, O.; Gadalla, M.; Saha, B. Valorisation of high acid value waste cooking oil into biodiesel using supercritical methanolysis: Experimental assessment and statistical optimisation on typical Egyptian feedstock. Energy 2018, 162, 408–420. [Google Scholar] [CrossRef]
- Umar, Y.; Velasco, O.; Abdelaziz, O.Y.; Aboelazayem, O.; Gadalla, M.A.; Hulteberg, C.P.; Saha, B. A renewable lignin-derived bio-oil for boosting the oxidation stability of biodiesel. Renew. Energy 2022, 182, 867–878. [Google Scholar] [CrossRef]
- Eze, V.C.; Phan, A.N.; Harvey, A.P. Intensified one-step biodiesel production from high water and free fatty acid waste cooking oils. Fuel 2018, 220, 567–574. [Google Scholar] [CrossRef]
- Onyenkeadi, V.; Aboelazayem, O.; Saha, B. Systematic multivariate optimisation of butylene carbonate synthesis via CO2 utilisation using graphene-inorganic nanocomposite catalysts. Catal. Today 2020, 346, 10–22. [Google Scholar] [CrossRef]
- Zhou, D.; Qiao, B.; Li, G.; Xue, S.; Yin, J. Continuous production of biodiesel from microalgae by extraction coupling with transesterification under supercritical conditions. Bioresour. Technol. 2017, 238, 609–615. [Google Scholar] [CrossRef] [PubMed]
- Torrentes-Espinoza, G.; Miranda, B.C.; Vega-Baudrit, J.; Mata-Segreda, J.F. Castor oil (Ricinus communis) supercritical methanolysis. Energy 2017, 140, 426–435. [Google Scholar] [CrossRef]
- Aboelazayem, O.; Gadalla, M.; Saha, B. Biodiesel production from waste cooking oil via supercritical methanol: Optimisation and reactor simulation. Renew. Energy 2018, 124, 144–154. [Google Scholar] [CrossRef]
- Lee, K.T.; Tan, K.T.; Ooi, S.N.; Mohamed, A.R.; Ang, G.T. Optimization and kinetic studies of sea mango (Cerbera odollam) oil for biodiesel production via supercritical reaction. Energy Convers. Manag. 2015, 99, 242–251. [Google Scholar] [CrossRef]
- García-Martínez, N.; Andreo-Martínez, P.; Quesada-Medina, J.; de los Ríos, A.P.; Chica, A.; Beneito-Ruiz, R.; Carratalá-Abril, J. Optimization of non-catalytic transesterification of tobacco (Nicotiana tabacum) seed oil using supercritical methanol to biodiesel production. Energy Convers. Manag. 2017, 131, 99–108. [Google Scholar] [CrossRef]
- Imahara, H.; Minami, E.; Hari, S.; Saka, S. Thermal stability of biodiesel in supercritical methanol. Fuel 2008, 87, 1–6. [Google Scholar] [CrossRef]
- Jazzar, S.; Olivares-Carrillo, P.; Pérez de los Ríos, A.; Marzouki, M.N.; Acién-Fernández, F.G.; Fernández-Sevilla, J.M.; Molina-Grima, E.; Smaali, I.; Quesada-Medina, J. Direct supercritical methanolysis of wet and dry unwashed marine microalgae (Nannochloropsis gaditana) to biodiesel. Appl. Energy 2015, 148, 210–219. [Google Scholar] [CrossRef]
- Ghoreishi, S.M.; Moein, P. Biodiesel synthesis from waste vegetable oil via transesterification reaction in supercritical methanol. J. Supercrit. Fluids 2013, 76, 24–31. [Google Scholar] [CrossRef]
- Han, H.; Cao, W.; Zhang, J. Preparation of biodiesel from soybean oil using supercritical methanol and CO2 as co-solvent. Process Biochem. 2005, 40, 3148–3151. [Google Scholar] [CrossRef]
- Qiao, B.-Q.; Zhou, D.; Li, G.; Yin, J.-Z.; Xue, S.; Liu, J. Process enhancement of supercritical methanol biodiesel production by packing beds. Bioresour. Technol. 2017, 228, 298–304. [Google Scholar] [CrossRef] [PubMed]
- Xu, Q.-Q.; Li, Q.; Yin, J.-Z.; Guo, D.; Qiao, B.-Q. Continuous production of biodiesel from soybean flakes by extraction coupling with transesterification under supercritical conditions. Fuel Process. Technol. 2016, 144, 37–41. [Google Scholar] [CrossRef]
- Muthukumaran, C.; Praniesh, R.; Navamani, P.; Swathi, R.; Sharmila, G.; Manoj Kumar, N. Process optimization and kinetic modeling of biodiesel production using non-edible Madhuca indica oil. Fuel 2017, 195, 217–225. [Google Scholar] [CrossRef]
- Yuliana, M.; Santoso, S.P.; Soetaredjo, F.E.; Ismadji, S.; Ayucitra, A.; Angkawijaya, A.E.; Ju, Y.H.; Tran-Nguyen, P.L. A one-pot synthesis of biodiesel from leather tanning waste using supercritical ethanol: Process optimization. Biomass Bioenergy 2020, 142, 105761. [Google Scholar] [CrossRef]
- Can, Ö.; Öztürk, E.; Yücesu, H.S. Combustion and exhaust emissions of canola biodiesel blends in a single cylinder DI diesel engine. Renew. Energy 2017, 109, 73–82. [Google Scholar] [CrossRef]
Figure 1.
Response surface for the effect of M:O molar ratio and reaction time on the yield of methyl-oleate.
Figure 1.
Response surface for the effect of M:O molar ratio and reaction time on the yield of methyl-oleate.

Figure 2.
Response surface for the effect of reaction temperature and pressure on the yield of methyl-oleate.
Figure 2.
Response surface for the effect of reaction temperature and pressure on the yield of methyl-oleate.

Figure 3.
Response surface for the effect of reaction pressure and time on the yield of methyl-oleate.
Figure 3.
Response surface for the effect of reaction pressure and time on the yield of methyl-oleate.

Figure 4.
Summary of the achieved individual and combined desirability of the process variables and responses.
Figure 4.
Summary of the achieved individual and combined desirability of the process variables and responses.

Figure 5.
Response surface of the effect of M:O molar ratio and reaction temperature on the yield of methyl-oleate.
Figure 5.
Response surface of the effect of M:O molar ratio and reaction temperature on the yield of methyl-oleate.

Table 1.
Fatty acids composition of the waste cooking oil.
| Fatty Acid | Composition (wt%) |
|---|---|
| Oleic acid | 48.2 |
| Linoleic acid | 9.3 |
| Palmitic acid | 41.6 |
| Myristic acid | 0.8 |
Table 2.
Physicochemical properties of the feedstock.
| Property | Standard Method | Units | Results |
|---|---|---|---|
| Kinematic viscosity | ASTM D-445 | cSt | 60.5 |
| Density | ATM D-4052 | g/cm3 | 0.93 |
| TAN | ASTM-D974 | mg KOH/g oil | 18 |
| water content | wt% | 4 |
Table 3.
Experimental design variables and their coded levels.
| Fatty Acid | Code | Levels | ||||
|---|---|---|---|---|---|---|
| −2 | −1 | 0 | 1 | 2 | ||
| M:O (molar ratio) | A | 20 | 25 | 30 | 35 | 40 |
| Temperature (°C) | B | 240 | 250 | 260 | 270 | 280 |
| Pressure (bar) | C | 85 | 110 | 135 | 160 | 185 |
| Time (min) | D | 7 | 12 | 17 | 22 | 27 |
Table 4.
Experimental design variables and their coded levels of methyl oleate (M-oleate).
| Run | M:O Ratio (A) | Temperature (°C) (B) | Pressure (bar) (C) | Time (min) (D) | Actual M-Oleate (%) | Predicted M-Oleate (%) |
|---|---|---|---|---|---|---|
| 1 | 30 | 260 | 135 | 17 | 99.26 | 99.37 |
| 2 | 35 | 250 | 160 | 22 | 98.90 | 98.87 |
| 3 | 35 | 250 | 110 | 22 | 98.79 | 98.79 |
| 4 | 35 | 270 | 160 | 22 | 99.08 | 99.14 |
| 5 | 35 | 270 | 110 | 12 | 99.10 | 99.17 |
| 6 | 35 | 250 | 160 | 12 | 98.56 | 98.61 |
| 7 | 25 | 270 | 160 | 22 | 99.12 | 99.14 |
| 8 | 30 | 260 | 135 | 17 | 99.39 | 99.37 |
| 9 | 25 | 250 | 110 | 22 | 99.06 | 99.12 |
| 10 | 25 | 250 | 160 | 22 | 99.19 | 99.11 |
| 11 | 30 | 260 | 85 | 17 | 99.20 | 99.16 |
| 12 | 25 | 270 | 110 | 12 | 99.00 | 99.06 |
| 13 | 25 | 250 | 160 | 12 | 98.64 | 98.65 |
| 14 | 30 | 260 | 135 | 17 | 99.39 | 99.37 |
| 15 | 35 | 250 | 110 | 12 | 98.82 | 98.84 |
| 16 | 30 | 240 | 135 | 17 | 98.69 | 98.71 |
| 17 | 30 | 260 | 185 | 17 | 99.12 | 99.12 |
| 18 | 35 | 270 | 160 | 12 | 99.18 | 99.15 |
| 19 | 30 | 260 | 135 | 17 | 99.39 | 99.37 |
| 20 | 30 | 260 | 135 | 27 | 98.78 | 98.79 |
| 21 | 30 | 260 | 135 | 7 | 98.69 | 98.65 |
| 22 | 25 | 270 | 160 | 12 | 98.95 | 98.94 |
| 23 | 20 | 260 | 135 | 17 | 99.12 | 99.15 |
| 24 | 25 | 250 | 110 | 12 | 99.05 | 98.97 |
| 25 | 30 | 280 | 135 | 17 | 99.13 | 99.07 |
| 26 | 30 | 260 | 135 | 17 | 99.39 | 99.37 |
| 27 | 40 | 260 | 135 | 17 | 99.10 | 99.03 |
| 28 | 25 | 270 | 110 | 22 | 99.01 | 98.94 |
| 29 | 30 | 260 | 1I5 | 17 | 99.39 | 99.37 |
| 30 | 35 | 270 | 110 | 22 | 98.84 | 98.85 |
Table 5.
Analysis of variance for FAME yield of methyl-oleate model.
| Fatty Acid | Sum of Squares | df | Mean Square | F-Value | p-Value |
|---|---|---|---|---|---|
| Model | 1.577 | 14 | 0.112 | 24.822 | <0.0001 |
| A-MeOH:Oil | 0.025 | 1 | 0.025 | 5.517 | 0.032 |
| B-Temperature | 0.189 | 1 | 0.189 | 41.682 | <0.0001 |
| C-Pressure | 0.001 | 1 | 0.001 | 0.379 | 0.547 |
| D-Time | 0.031 | 1 | 0.031 | 6.923 | 0.018 |
| AB | 0.058 | 1 | 0.058 | 12.93 | 0.002 |
| AC | 0.008 | 1 | 0.008 | 1.961 | 0.181 |
| AD | 0.039 | 1 | 0.039 | 8.647 | 0.010 |
| BC | 0.042 | 1 | 0.042 | 9.414 | 0.007 |
| BD | 0.07 | 1 | 0.070 | 15.430 | 0.001 |
| CD | 0.095 | 1 | 0.095 | 21.060 | 0.0003 |
| A2 | 0.130 | 1 | 0.130 | 28.710 | <0.0001 |
| B2 | 0.384 | 1 | 0.384 | 84.72 | <0.0001 |
| C2 | 0.086 | 1 | 0.086 | 19.153 | 0.0005 |
| D2 | 0.718 | 1 | 0.718 | 158.412 | <0.0001 |
| Residual | 0.068 | 15 | 0.004 | ||
| Lack of Fit | 0.053 | 10 | 0.005 | 1.815 | 0.264 |
Table 6.
Experimental design variables and their coded levels.
| Factor | Code | Goal | Importance | Limits | |
|---|---|---|---|---|---|
| Scale 1–5 | Lower | Upper | |||
| M:O (molar ratio) | A | Minimise | 3 | 25 | 35 |
| Temperature (°C) | B | Minimise | 4 | 250 | 270 |
| Pressure (bar) | C | Minimise | 3 | 110 | 160 |
| Time (min) | D | Minimise | 4 | 12 | 22 |
| Methyl-oleate FAME yield | Y1 | Maximise | 5 | 98.3 | 100 |
| Methyl-palmitate FAME yield | Y2 | Maximise | 5 | 98.1 | 100 |
| Methyl-linoleate FAME yield | Y3 | Maximise | 5 | 98.2 | 100 |
| Methyl-myristate FAME yield | Y4 | Maximise | 5 | 97.6 | 100 |
Table 7.
Comparison between produced biodiesel properties and European biodiesel standard EN14214.
| Factor | Code | Unit | ||
|---|---|---|---|---|
| Biodiesel | EN14214 | |||
| Kinematic viscosity | ASTM-D445 | cSt | 4.54 | 3.5–5 |
| Density | ATM-D4052 | g/cm3 | 0.886 | 0.86–0.9 |
| TAN | ASTM-D974 | mg KOH/g oil | 0.28 | <0.5 |
| CFPP | ASTM-D6371 | °C | –1 | <0 |
| Flashpoint | ASMT-D93 | °C | 135 | <101 |
Publisher’s Note: MDPI stays neutral with regard to jurisdictional claims in published maps and institutional affiliations. |
© 2022 by the authors. Licensee MDPI, Basel, Switzerland. This article is an open access article distributed under the terms and conditions of the Creative Commons Attribution (CC BY) license (https://creativecommons.org/licenses/by/4.0/).
Share and Cite
MDPI and ACS Style
Aboelazayem, O.; Gadalla, M.; Saha, B. Comprehensive Optimisation of Biodiesel Production Conditions via Supercritical Methanolysis of Waste Cooking Oil. Energies 2022, 15, 3766. https://0-doi-org.brum.beds.ac.uk/10.3390/en15103766
AMA Style
Aboelazayem O, Gadalla M, Saha B. Comprehensive Optimisation of Biodiesel Production Conditions via Supercritical Methanolysis of Waste Cooking Oil. Energies. 2022; 15(10):3766. https://0-doi-org.brum.beds.ac.uk/10.3390/en15103766
Chicago/Turabian StyleAboelazayem, Omar, Mamdouh Gadalla, and Basudeb Saha. 2022. "Comprehensive Optimisation of Biodiesel Production Conditions via Supercritical Methanolysis of Waste Cooking Oil" Energies 15, no. 10: 3766. https://0-doi-org.brum.beds.ac.uk/10.3390/en15103766
Note that from the first issue of 2016, this journal uses article numbers instead of page numbers. See further details here.