
Single-Phase Universal Power Compensator with an Equal VAR Sharing Approach
by
 , , , and
Nishant Patnaik
1 ,
,
Richa Pandey
2,
Raavi Satish
3,
Balamurali Surakasi
3,
Almoataz Y. Abdelaziz
4 and
and
Adel El-Shahat
5,* 1
Department of Electrical and Electronics Engineering, Chaitanya Bharathi Institute of Technology, Hyderabad 500075, India
2
Department of Electrical and Electronics Engineering, MVGR College of Engineering, Vizianagaram 530048, India
3
Department of Electrical and Electronics Engineering, Anil Neerukonda Institute of Technology and Sciences, Visakhapatnam 531162, India
4
Faculty of Engineering and Technology, Future University in Egypt, Cairo 11835, Egypt
5
Energy Technology Program, School of Engineering, Purdue University, West Lafayette, IN 47906, USA
*
Author to whom correspondence should be addressed.
Energies 2022, 15(10), 3769; https://0-doi-org.brum.beds.ac.uk/10.3390/en15103769
Submission received: 1 April 2022
/
Revised: 14 May 2022
/
Accepted: 19 May 2022
/
Published: 20 May 2022
(This article belongs to the Special Issue Wireless Power Transfer for Electric Vehicles)
Abstract
:In this manuscript, we propose a single-phase UPC (universal power compensator) system to extensively tackle power quality issues (voltage and current) with an equal VAR (volt-ampere reactive) sharing approach between the series and shunt APF (active power filter) of a UPC system. The equal VAR sharing feature facilitates the series and shunt APF inverters to be of an equal rating. An SRF (synchronous reference frame)-based direct PA (power angle) calculation technique is implemented to realize equal VAR sharing between the APFs of the UPC. This PA estimation utilizes d and q axis current parameters derived for the reference signal generation of the shunt APF. An SRF-based method is highly useful for power estimations in distorted supply voltage conditions compared with other conventional methods, i.e., the PQ method. It comprises a reduced complexity and estimations with an easiness to retain two APF inverters of equal rating. A rigorous simulation analysis is performed with MATLAB/SIMULINK and a real-time digital simulator (OPAL-RT) for addressing different power quality-disturbing elements such as current harmonics, voltage harmonics, voltage sag/swell and load VAR demand with the proposed method.
1. Introduction
In the present age of computerization and digitalization, complex devices with fast processing controllers draw current shapes that are unwanted in the supply system. This significantly degrades the quality of the power (i.e., voltage and current) supplied or available for other loads [1,2,3,4,5]. A specific conditioning equipment known as a unified power quality conditioner (UPQC) can be employed for such types of loads to resolve both voltage- and current-related issues, thus assisting with the efficient operation of the load and preventing the supply lines from being infected with the non-linearities and reactive power demand of the load [6,7,8,9,10,11,12,13,14,15,16,17,18,19,20,21].
Various UPQC control methods considering different compensating scenarios have been considered by the research community. Along with regular voltage and current compensation, reactive power compensation by a device has also proven to be a major utilization [11]. The ability of reactive power compensation has been explored further in order to be shared among the shunt and series APFs of the device by using the power angle control (PAC) concept [11,12,13,14,18,20]. It has been effectively implemented in a three-phase three-wire system [11,12] and a three-phase four-wire system [14,20]. The PAC concept has also been implemented in a single-phase system-based UPQC, as discussed in [18].
The estimation of the PA (power angle), as discussed in the literature, is based on the PQ concept, primarily for three-phase systems utilizing power components to calculate the PA. It has already been well-established that, under non-sinusoidal supply voltage conditions, PQ concept-based harmonic compensation exhibits a poor performance compared with the SRF concept [22]. Thus, under similar conditions, a PA estimation with a PQ concept also followed a similar trail, as discussed in the manuscript. It also necessitated the regular computation of VAR sharing by each APF for the computation of the PA [11]. This regular VAR computation can be avoided by using two APFs with an equal rating, thus sharing equal reactive power.
In this paper, we present a comprehensive compensating device, termed a UPC (universal power compensator), for a single-phase system with equal APF ratings whose control action exhibits a few important features. One is the realization of equal reactive power sharing between both APFs, thus avoiding a regular VAR computation. Secondly, the equal VAR sharing is comprehended by the PA estimation without power estimations, directly utilizing the SRF current parameters (id-iq), which are estimated for current harmonic compensation. Thirdly, as only the d-q current parameters are used for the PA estimation, it remains unfazed due to the non-sinusoidal supply voltage condition. To demonstrate its effectiveness, a comparative analysis is presented in reference to PQ concept-based compensation and the PA estimation under a non-sinusoidal supply voltage condition.
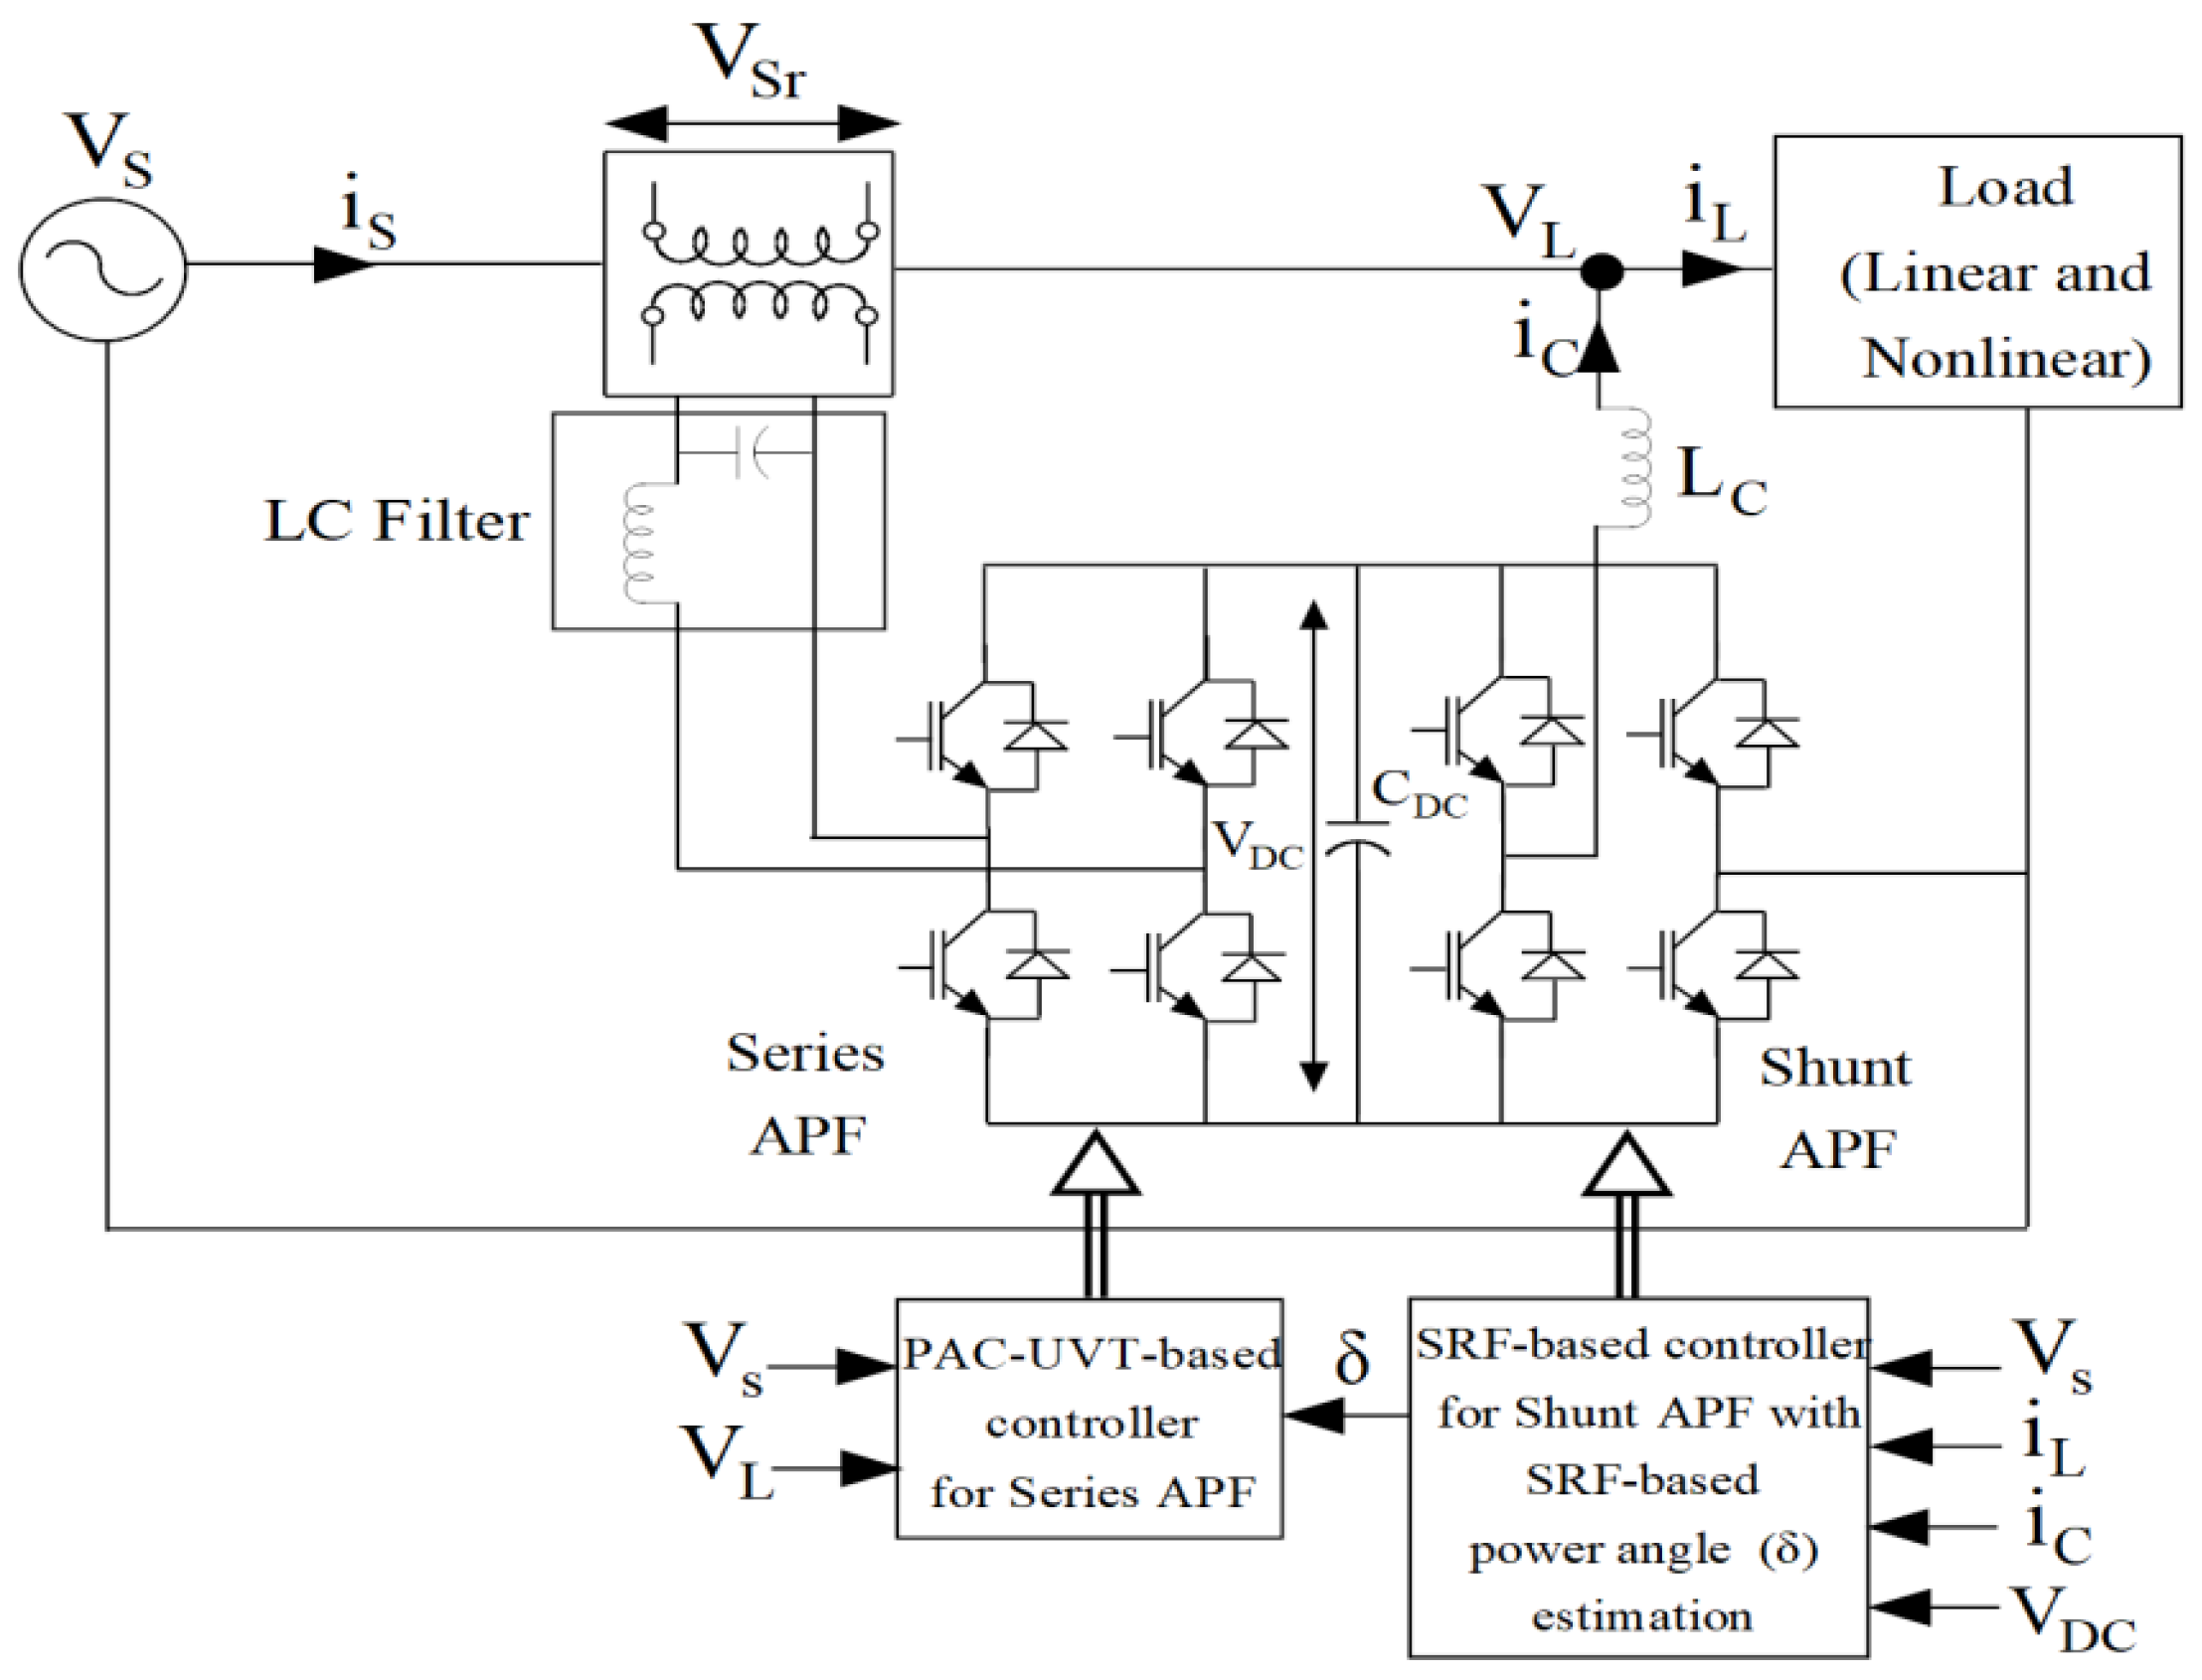
A single-phase UPC with a shunt and series APF combined through a DC-link capacitor is shown in Figure 1. The specific load is considered to be an arrangement of the linear and non-linear load. The non-linear load comprises a single-phase diode bridge rectifier with an RL load on the DC side whereas the linear load consists of only a series combination of the active and reactive load. With both loads in operation, the source current harmonics are not as high, but they have a considerable VAR demand that needs to be compensated for on an equal sharing basis by the APFs of the UPC. When the non-linear load acts alone, it contaminates the source current with the harmonics to a greater extent, which is tackled by the shunt APF. Voltage sag, voltage swell and voltage harmonics, or the supply side disturbances, should be mitigated by the series APF.
2. Shunt APF Reference Signal Generation with SRF-Based Approach
By an orthodox approach of VAR sharing between the shunt and series APFs as presented in [4,5], the series APF part of handling VAR arose after the load VAR surpassed a specific maximum.
The shunt APF of the UPC was used for serving the following two purposes in our system:
- Providing source current harmonic compensation.
- Providing 50% of load reactive power compensation.
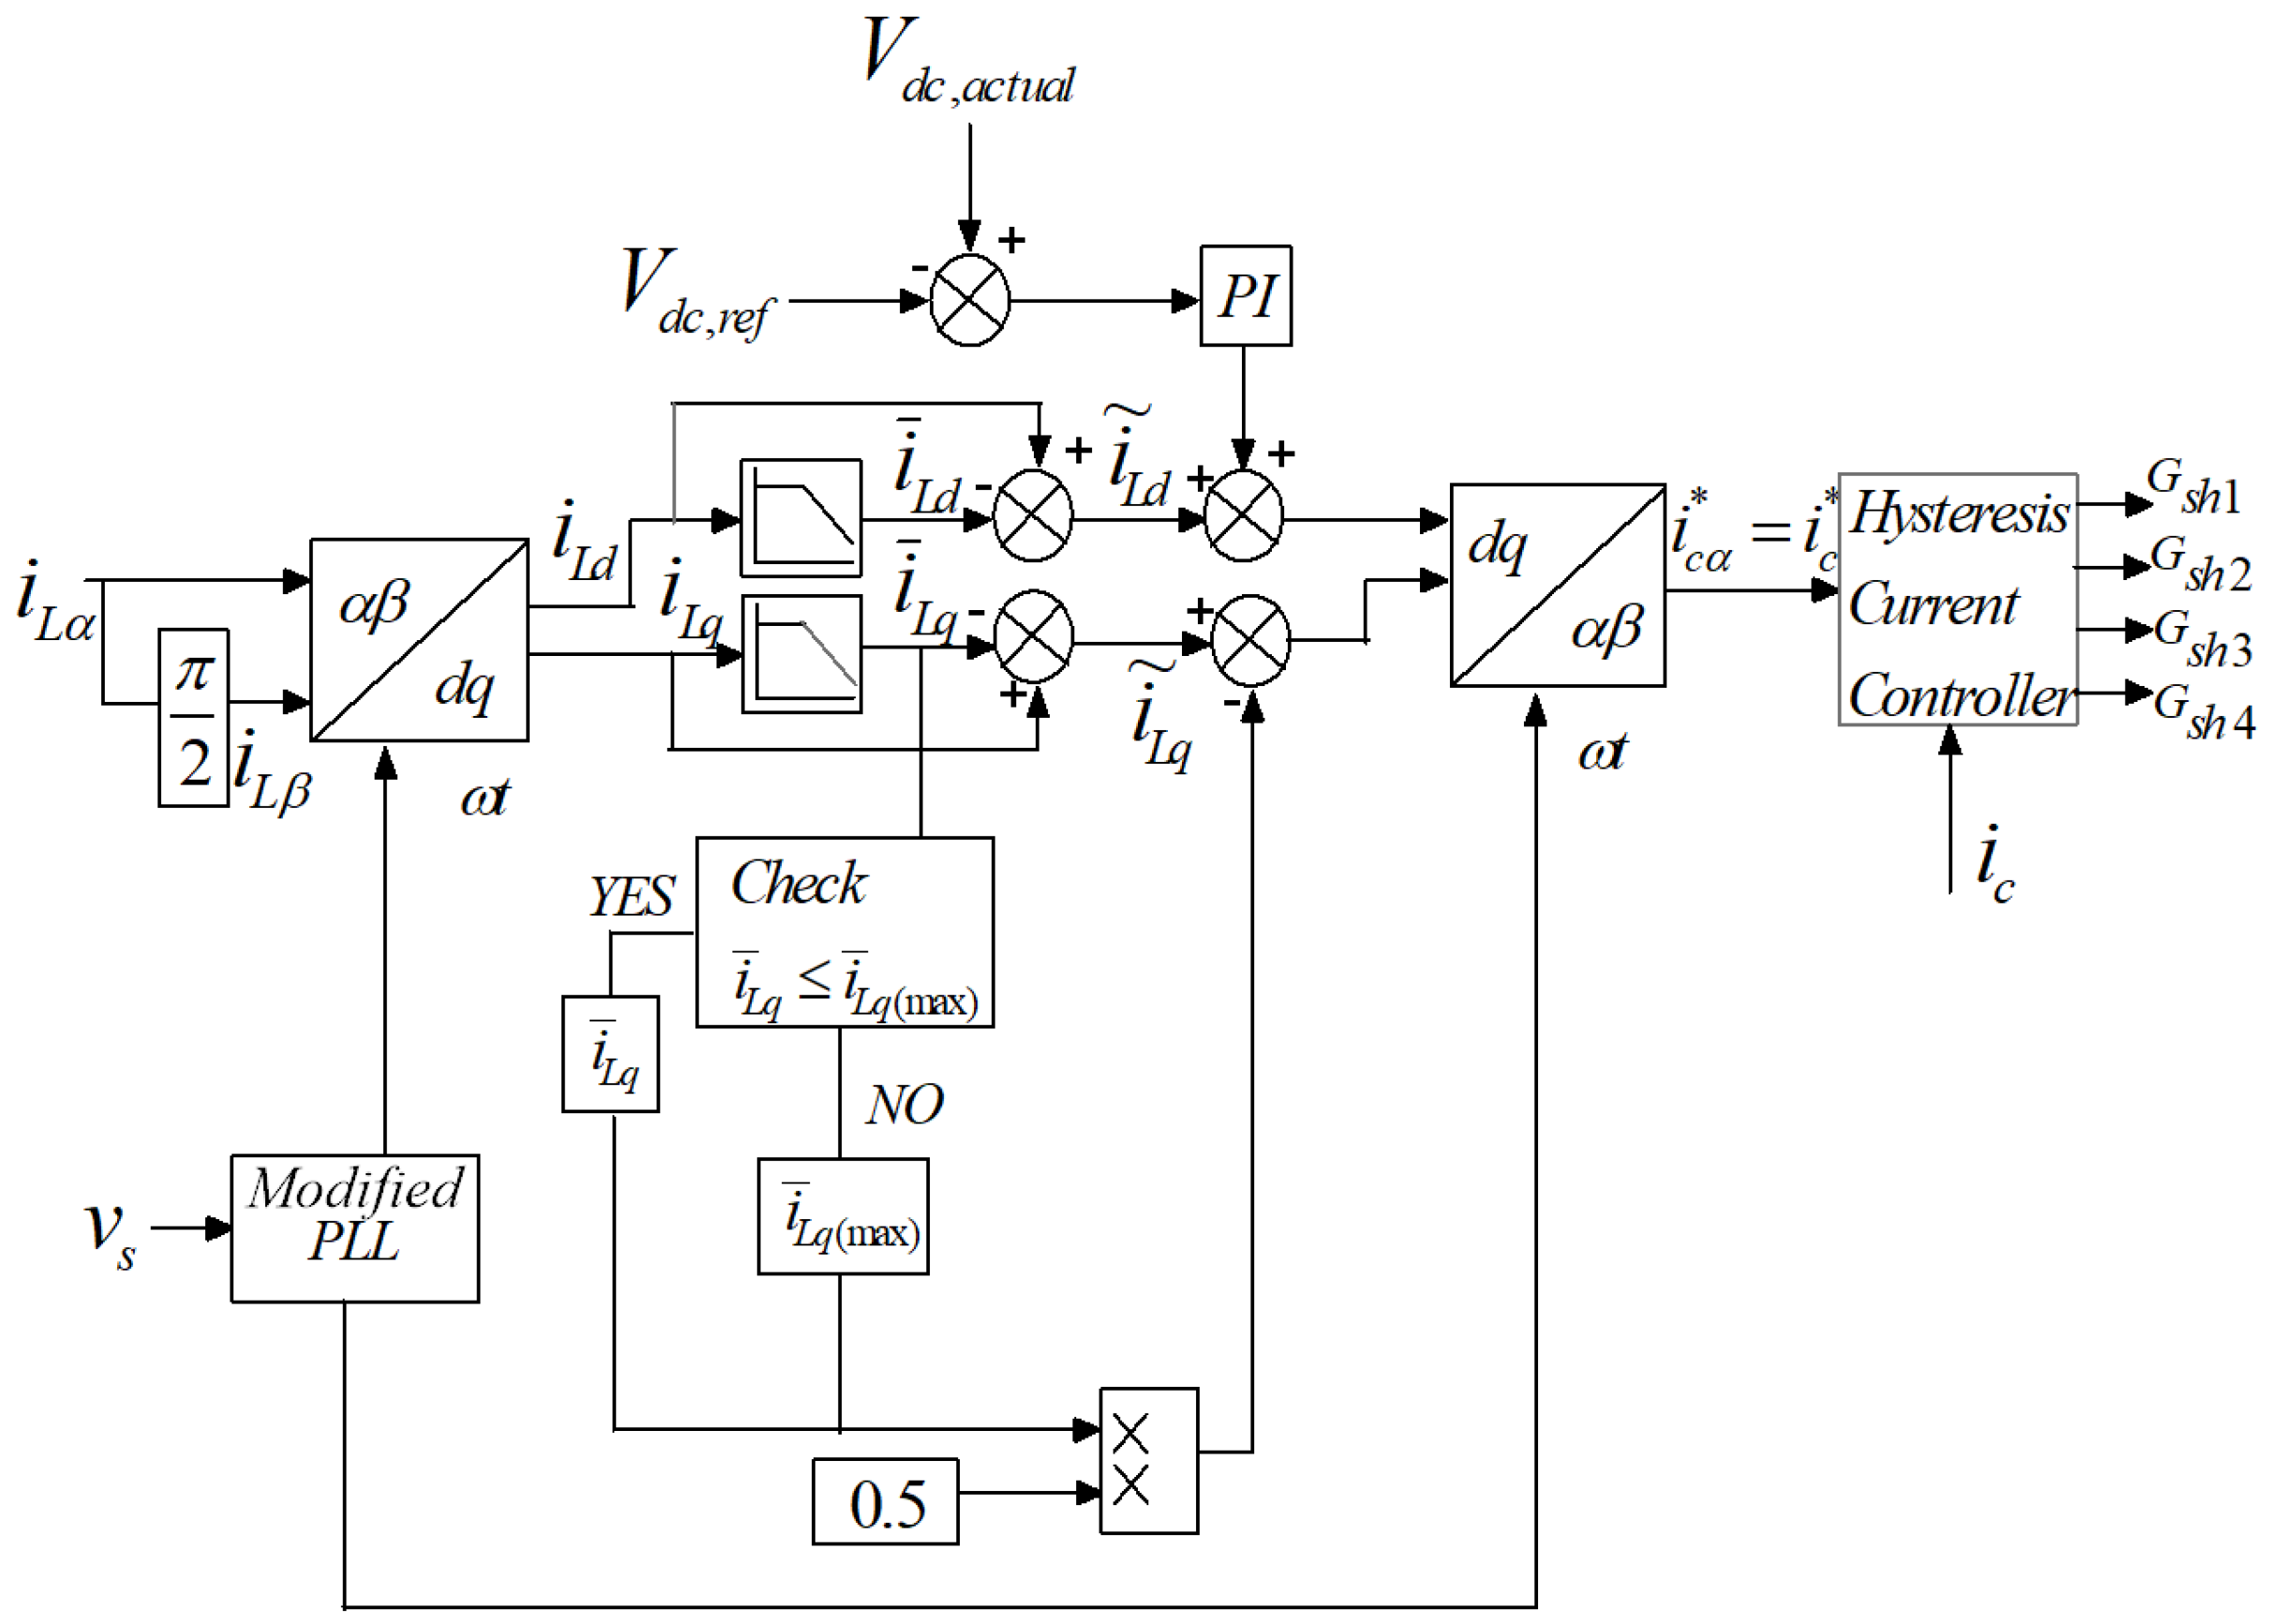
The SRF control algorithm is a popular control approach for custom power devices as it involves the direct controlling of the d (active) and q (reactive) elements of the current drawn by the load. As shown in Figure 2, initially, the single-phase load current was treated as a load component in stationary reference frame; the other component was derived by orthogonally shifting . The transformation angle ωt was generated from the modified PLL (phase-locked loop) due to the source voltage with the harmonics for a proper synchronization [14]. With the following transformations, the direct and quadrature components of the current in a rotating reference frame were obtained from and .
The direct component of the current, i.e., , was considered to be an active component of the current whereas the quadrature component of the current was considered to be a reactive element of the load current.
These two components involved fundamental and harmonic terms and could be separated by a different HPF (high-pass filter) derived from an LPF (low-pass filter). The loss element of the UPC, acquired from a PI compensator by comparing the DC-link reference voltage with the measured DC-link voltage, was combined with the harmonic content of the active current. The VAR harmonic current element was combined with 50% of the fundamental reactive current to allow half of the load VAR to be remunerated by the shunt APF. The compensating d and q axis currents thus obtained were transformed to a reference shunt APF-injecting current. This current was compared with the measured shunt APF current and fed to a hysteresis controller to produce a gating signal for the shunt APF.
3. PA Calculation for Equal Reactive Power Sharing
Considering the non-ideal conditions of the supply voltage and the load current, the d and q axis voltage and current parameters, obtained from the SRF control algorithm of the shunt APF, were utilized to estimate the power demand by load as:
The source side power could be calculated as:
where , the active component of the current drawn from the source, denotes the loss component of the UPC.
For equivalent VAR sharing among the shunt and series APF we obtained:
Therefore, from Equations (3), (4), (8) and (9), we obtained:
Thus, as is clear from the above equation, for half of the load VAR sharing by the series APF, the PA could be directly derived from the load current parameters. As the estimation of the PA was independent of any voltage component, in reference to the PA estimation presented in [11,12] (where the PA estimation was based on the PQ theory), the number of variables involved were reduced in the PA estimation. Therefore, the PA estimation was much simpler to implement. In [12], a PA estimation was carried out where the supply voltage was considered to be completely sinusoidal. With a non-sinusoidal supply voltage and the methods proposed in [11,12], an additional disturbance needs to be accounted for, as discussed in Section 4. A comparative analysis is presented in Section 5 to understand the efficacy of the SRF-based PA estimation over the others.
4. Comparison of SRF-Based Control with a Conventional PQ (Active-Reactive Power)-Based Technique
The PQ (active-reactive power) method of control for compensation by an active power filter (APF) is one of the most popular control methods. It is based on separating the average and harmonic power components. However, the SRF method is based on separating the average and harmonic components of the current. Under ideal sinusoidal supply conditions, both the SRF method and the conventional PQ method perform similarly. However, under non-sinusoidal supply conditions, the compensating power consists of additional disturbing factors in the PQ method (id-iq). Thus, under non-ideal supply voltage conditions, the SRF method is always a preferable option compared with the PQ method [5,22].
Under a non-sinusoidal supply, the compensating power by the APF for the PQ method is given by:
Under a non-sinusoidal supply, the compensating power by the APF for the SRF method is given by:
Thus, the difference between Equations (11) and (12) accounts for the additional disturbance in the PQ method. Another important degrading factor in the PQ method may arise if similar harmonic components are present in the voltage and current, resulting in a more fundamental power component.
In Section 6.4, the performance difference is presented between the PQ method and the SRF method under non-sinusoidal voltage disturbances.
5. PA-UVT Controller for Series APF
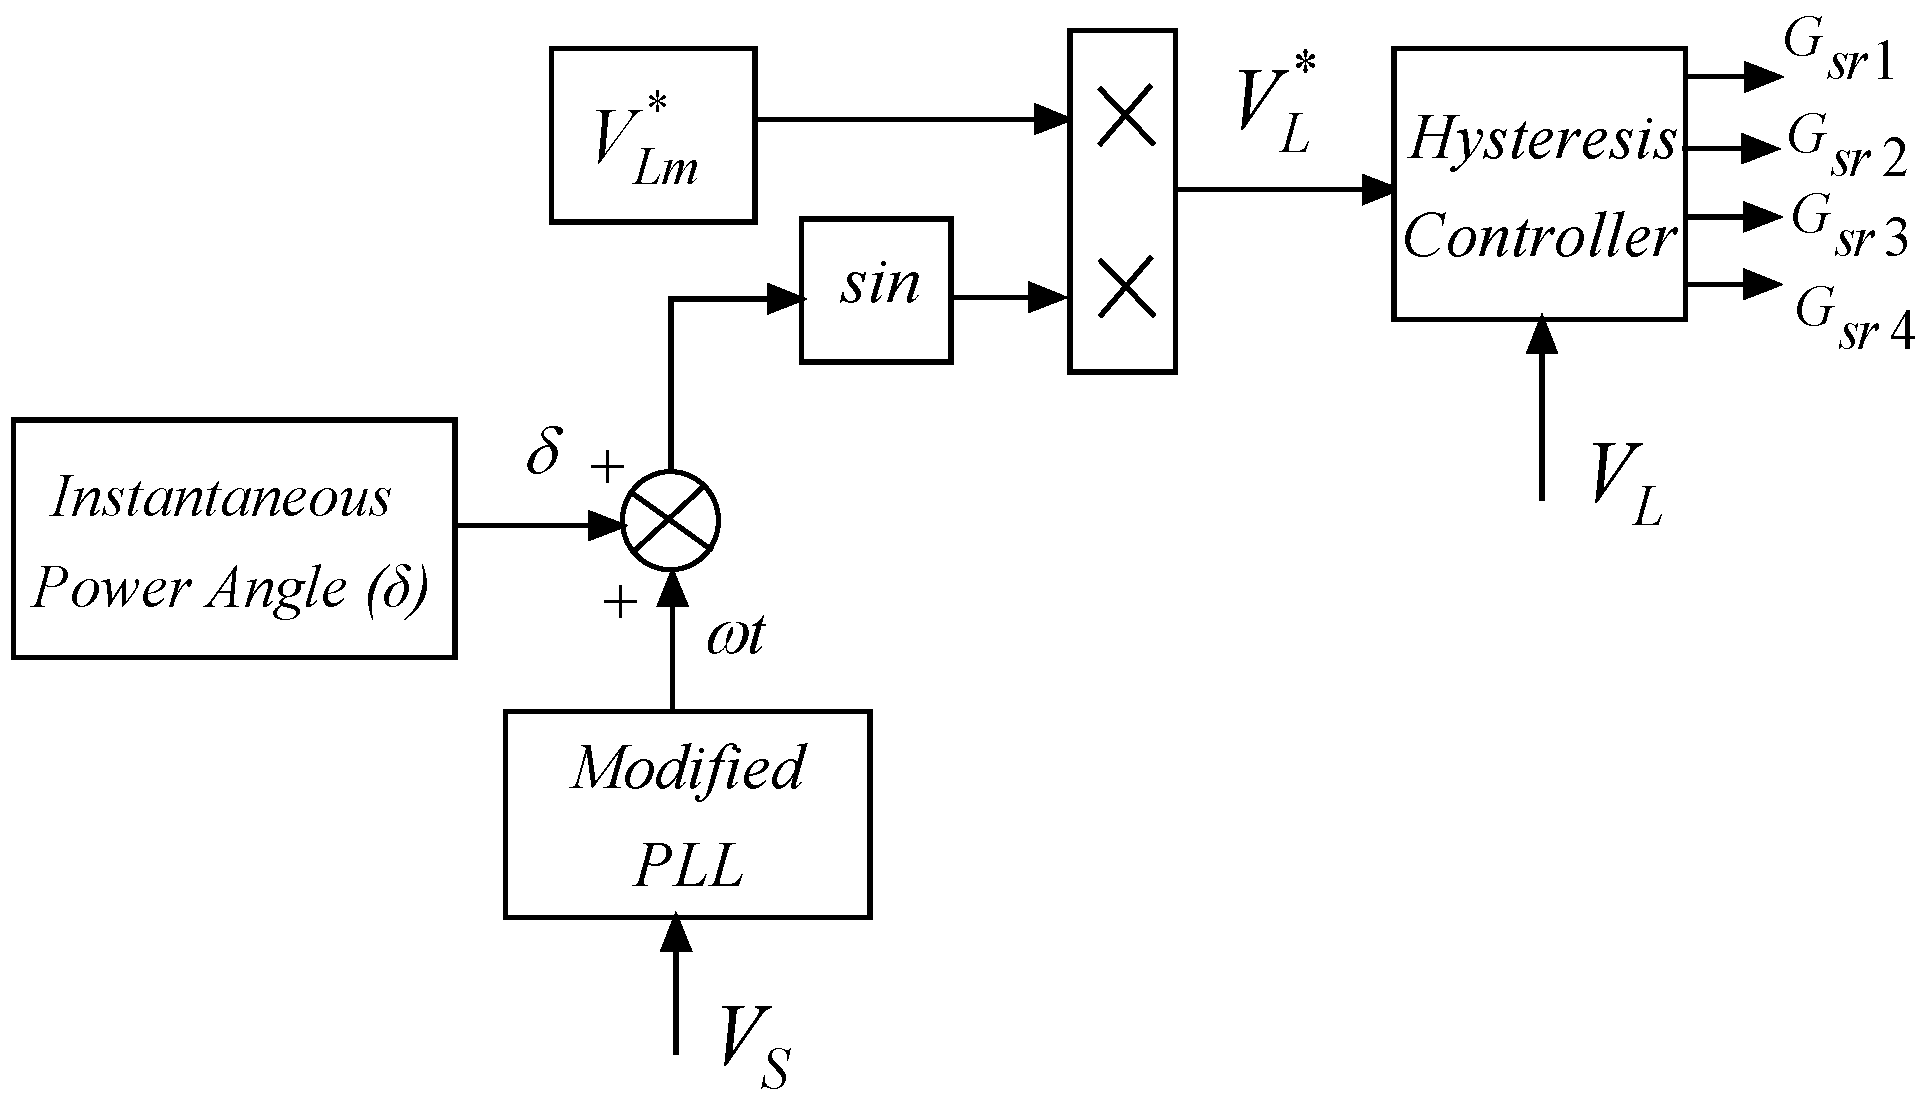
As loads operate at a rated voltage, the reference voltage could be fixed and a unit vector template (UVT) generation method could be employed for the series APF, as illustrated in Figure 3. For incorporating the PA shift in the load voltage in reference to the source voltage, the transformation angle ωt was added with the PA δ. The transformation angle ωt was generated from the modified PLL, as stated in Section 2. The reference load voltage signal generated is depicted below:
where is the maximum fixed reference rated voltage. The desired load voltage () was equated with the measured load voltage () to produce the control signals for the series APF.
6. Simulation Results
This new sharing algorithm-based UPC system was implemented in SIMULINK for an analysis considering the various operational conditions of the source and load. The three different types of disturbances in the source voltage were sag, swell and harmonics. Correspondingly, on the load side, the performance of the UPC was analyzed with three various load situations; i.e., with a non-linear load only, a linear load only and a composite type (both linear and non-linear). The parameters considered for the simulation analysis are depicted in Table 1. With source voltage disturbances being common phenomena, the simulation results were analyzed under different categories of loading conditions. The simulation time was separated into various time divisions as per the source voltage disturbance. From 0 to 0.3 s, the source voltage was in a steady state rated condition; from 0.3 to 0.6 s, a voltage sag of 20% was introduced; from 0.6 to 0.9 s, a voltage swell of 20% was incorporated along with the rated source voltage; and from 0.9 to 1.2 s, the 3rd, 5th and 7th harmonic voltage component (10% each) was injected into the steady state voltage.
6.1. Simulation Results with a Composite Load
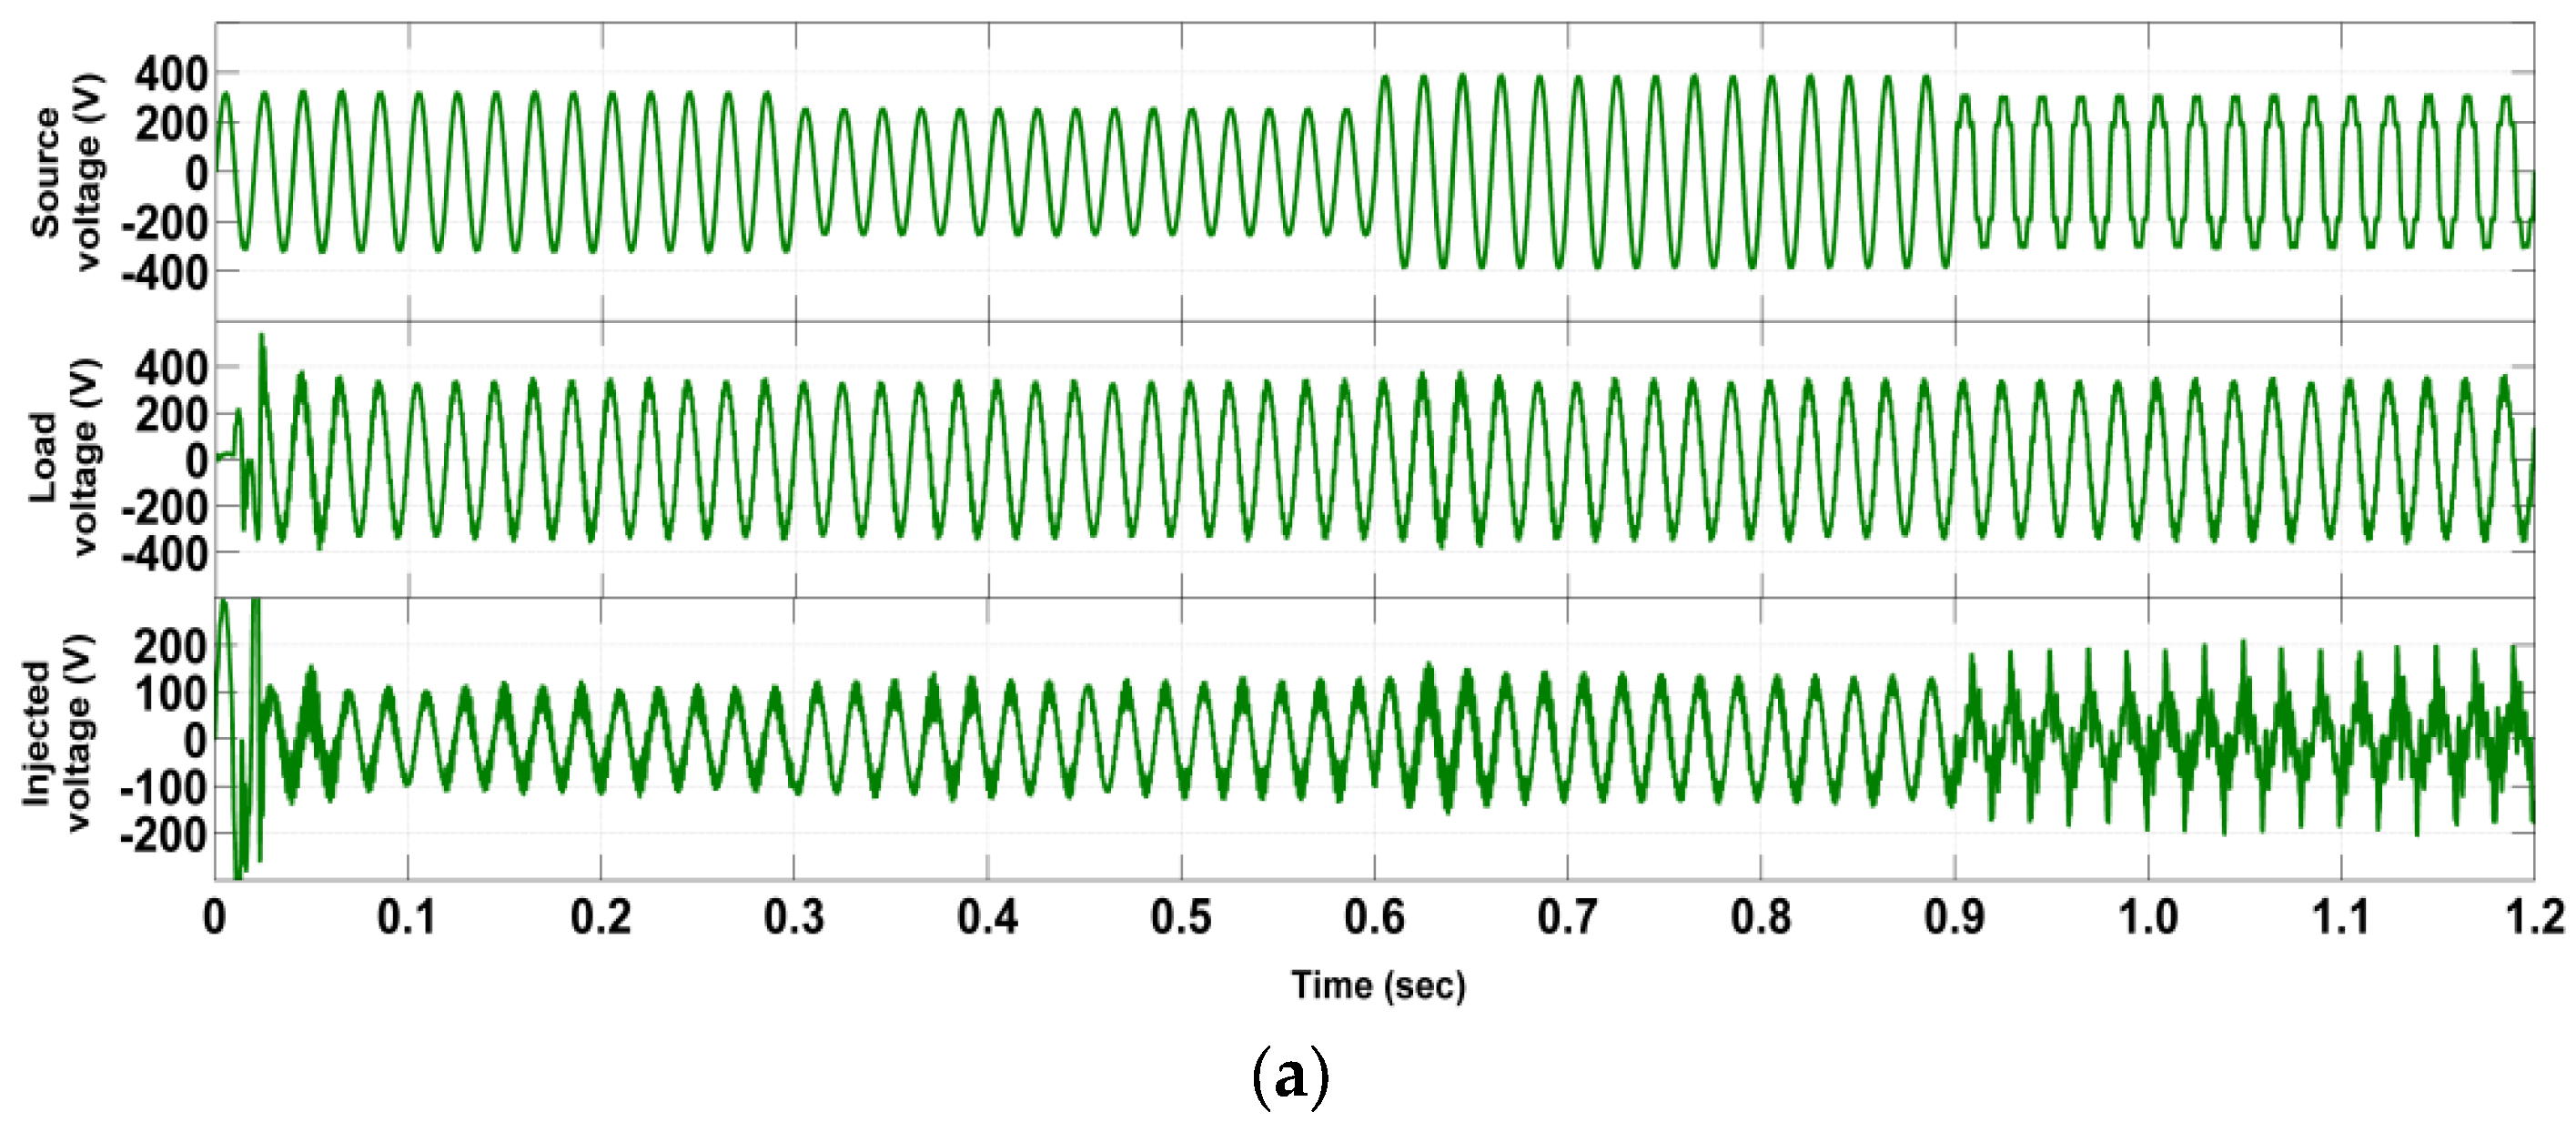
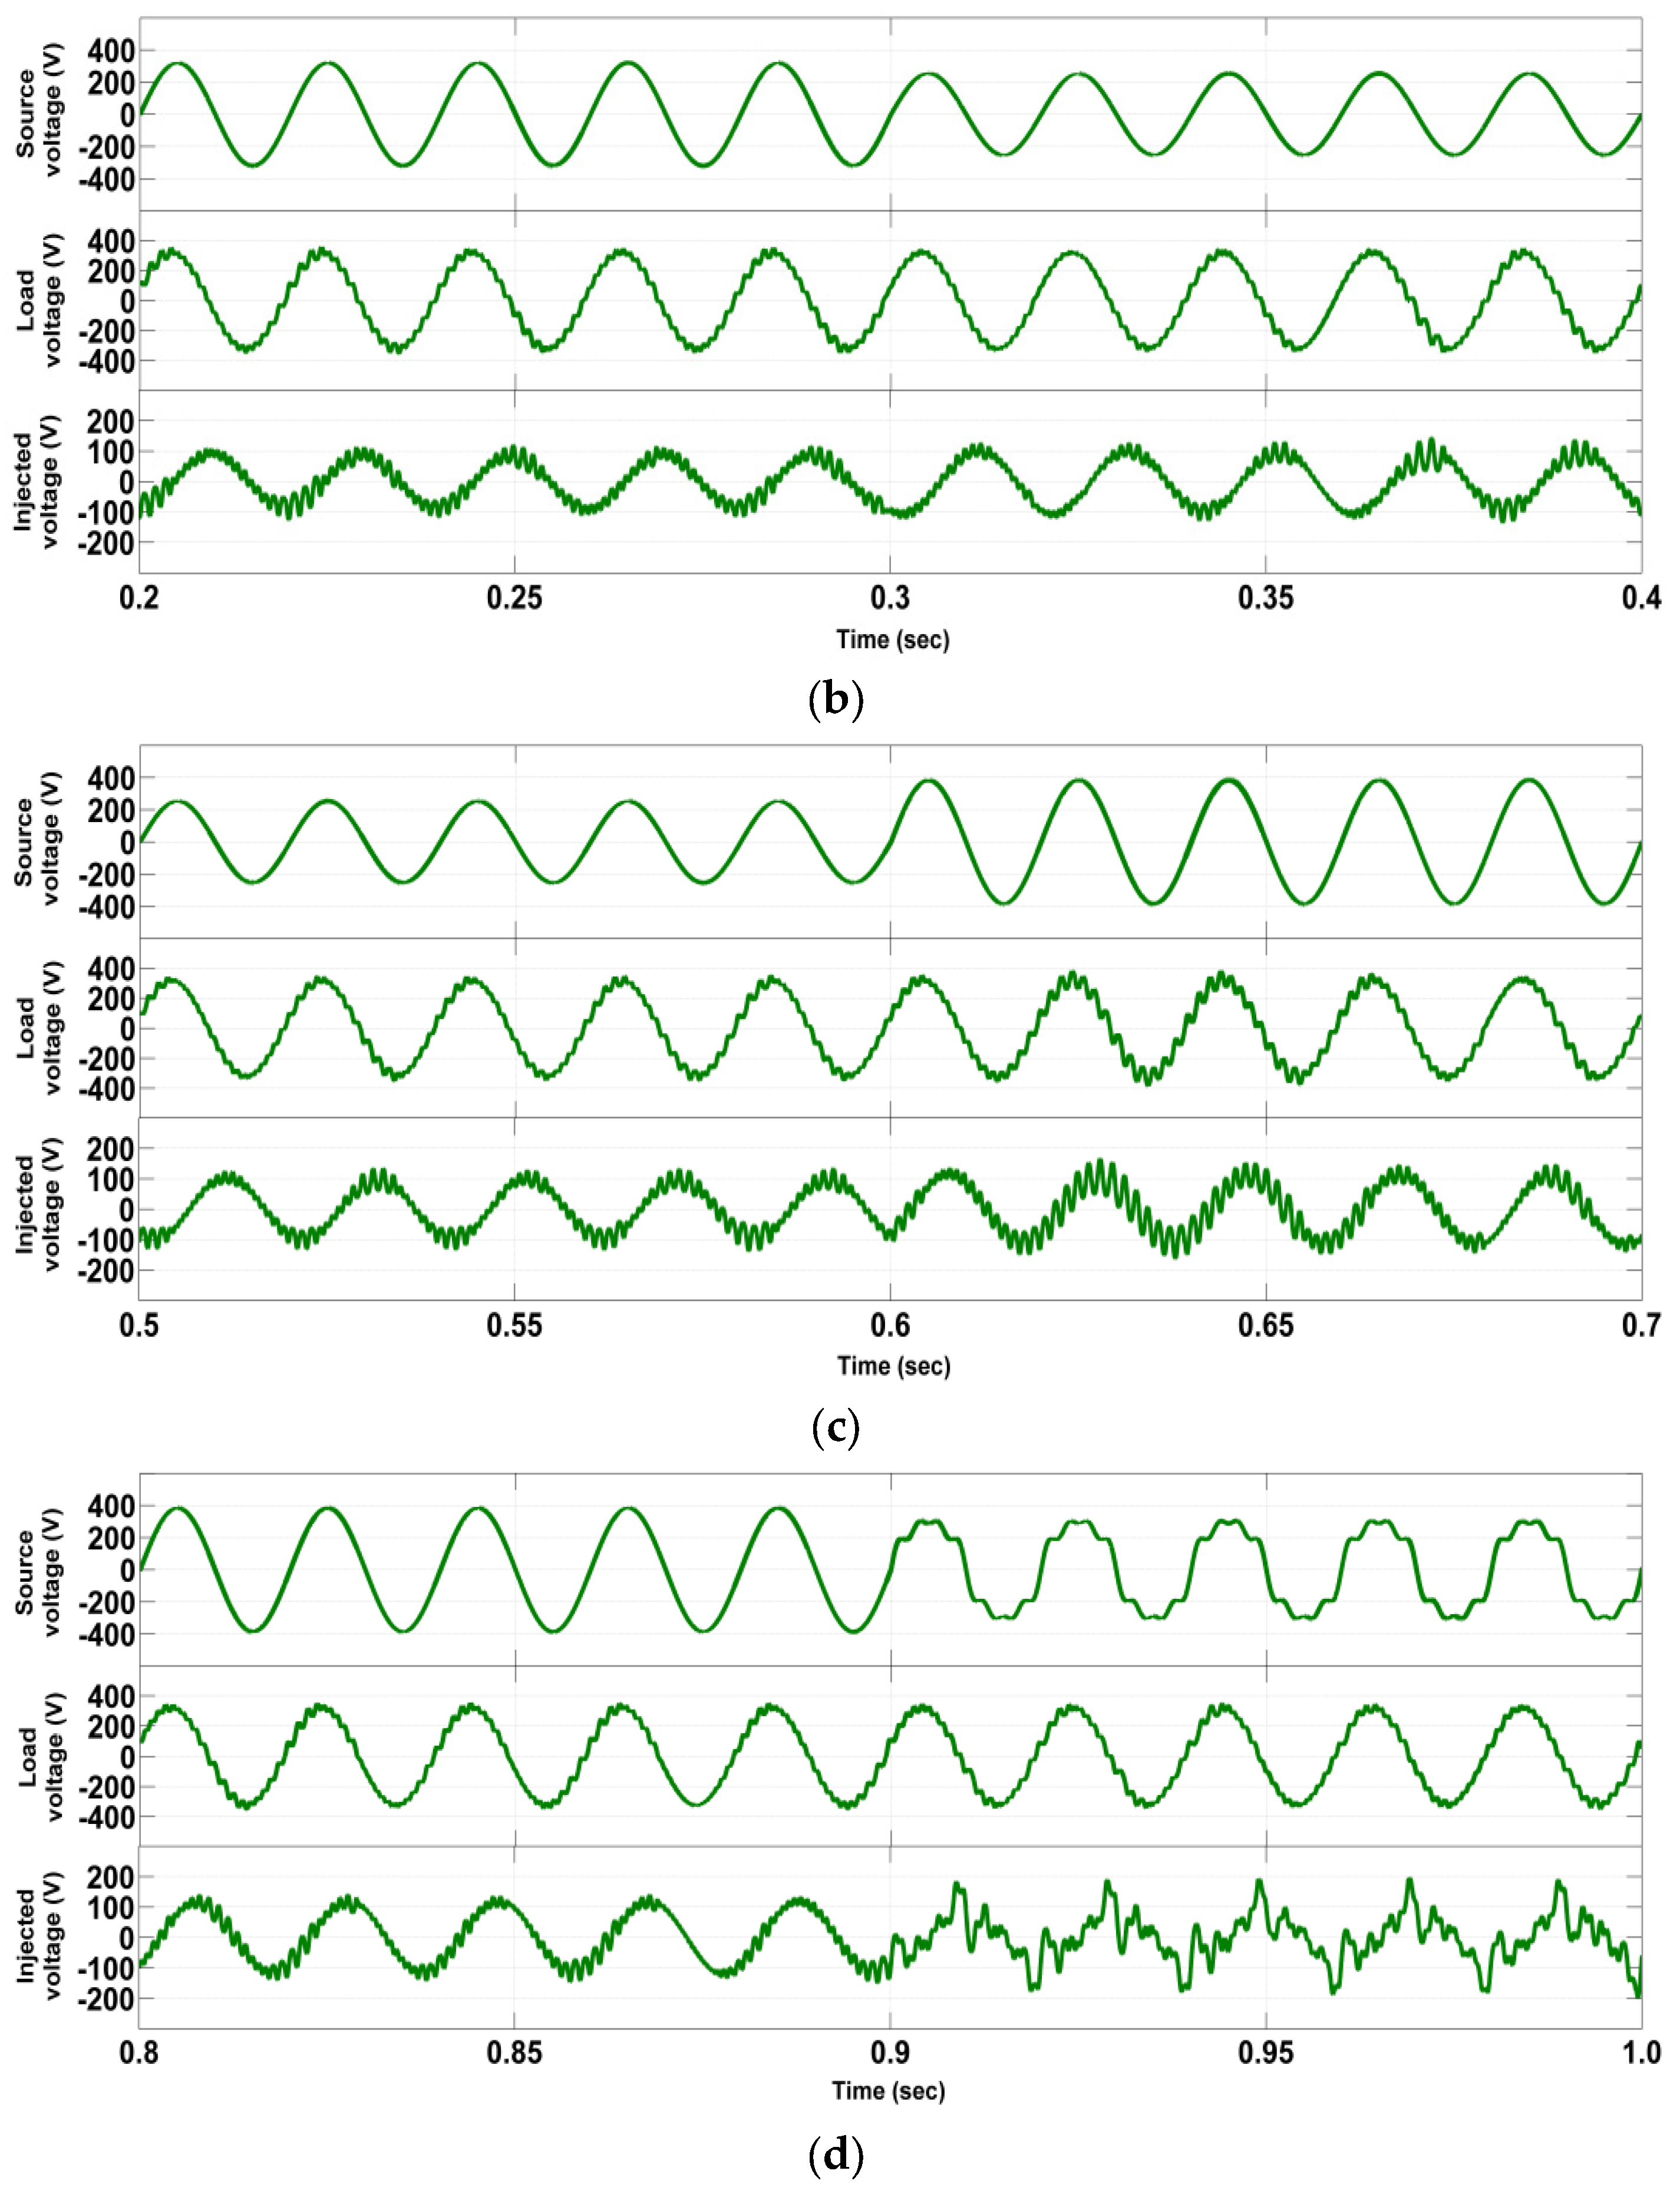
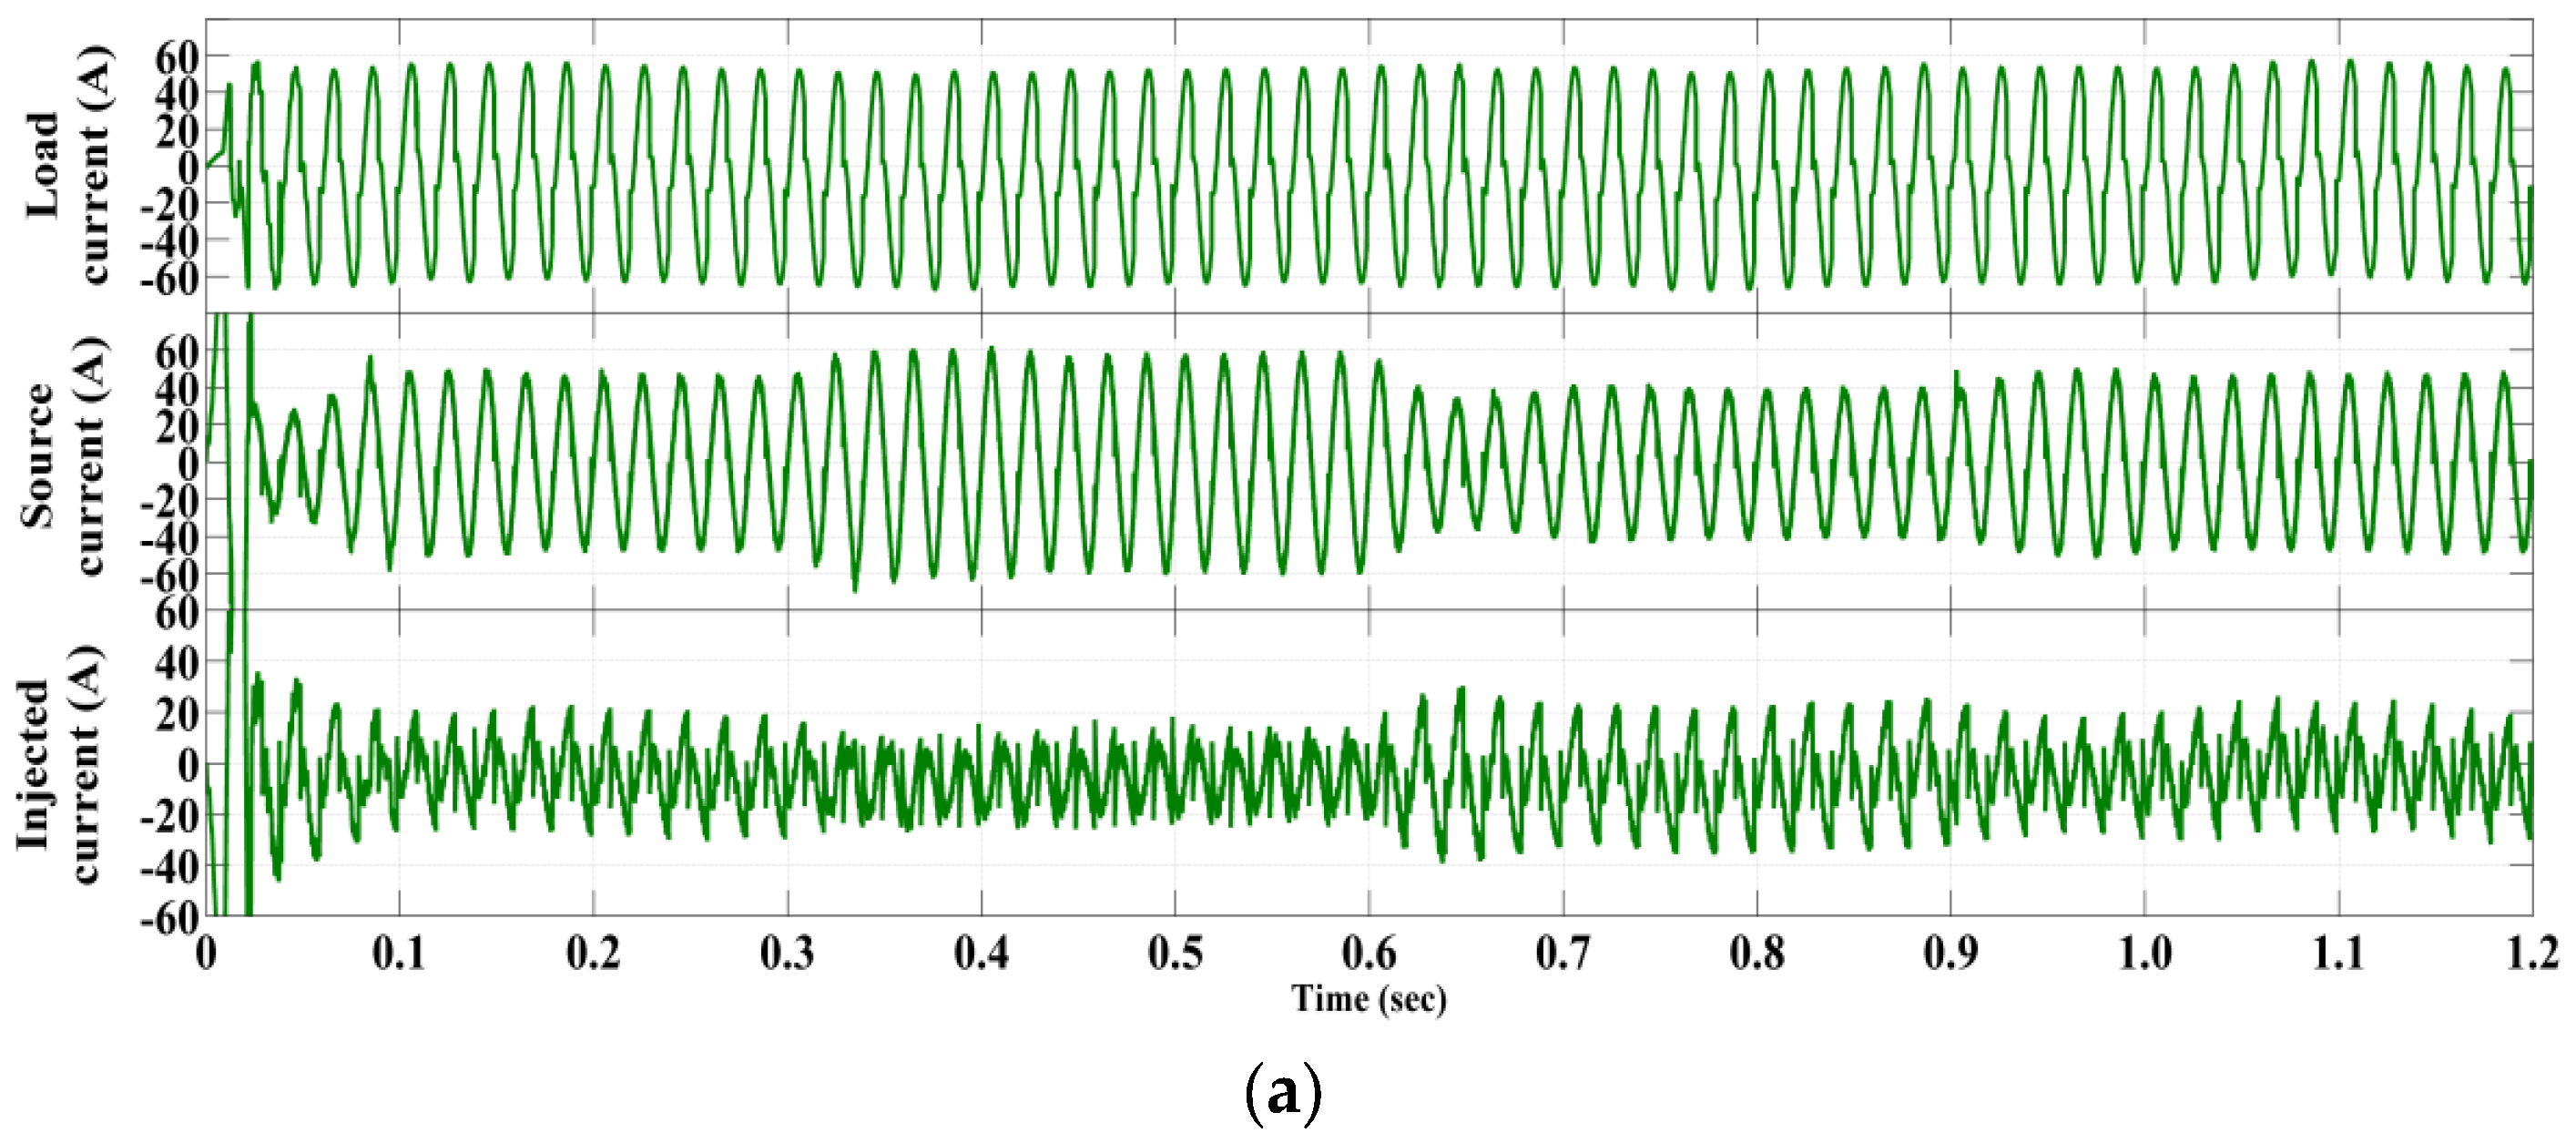
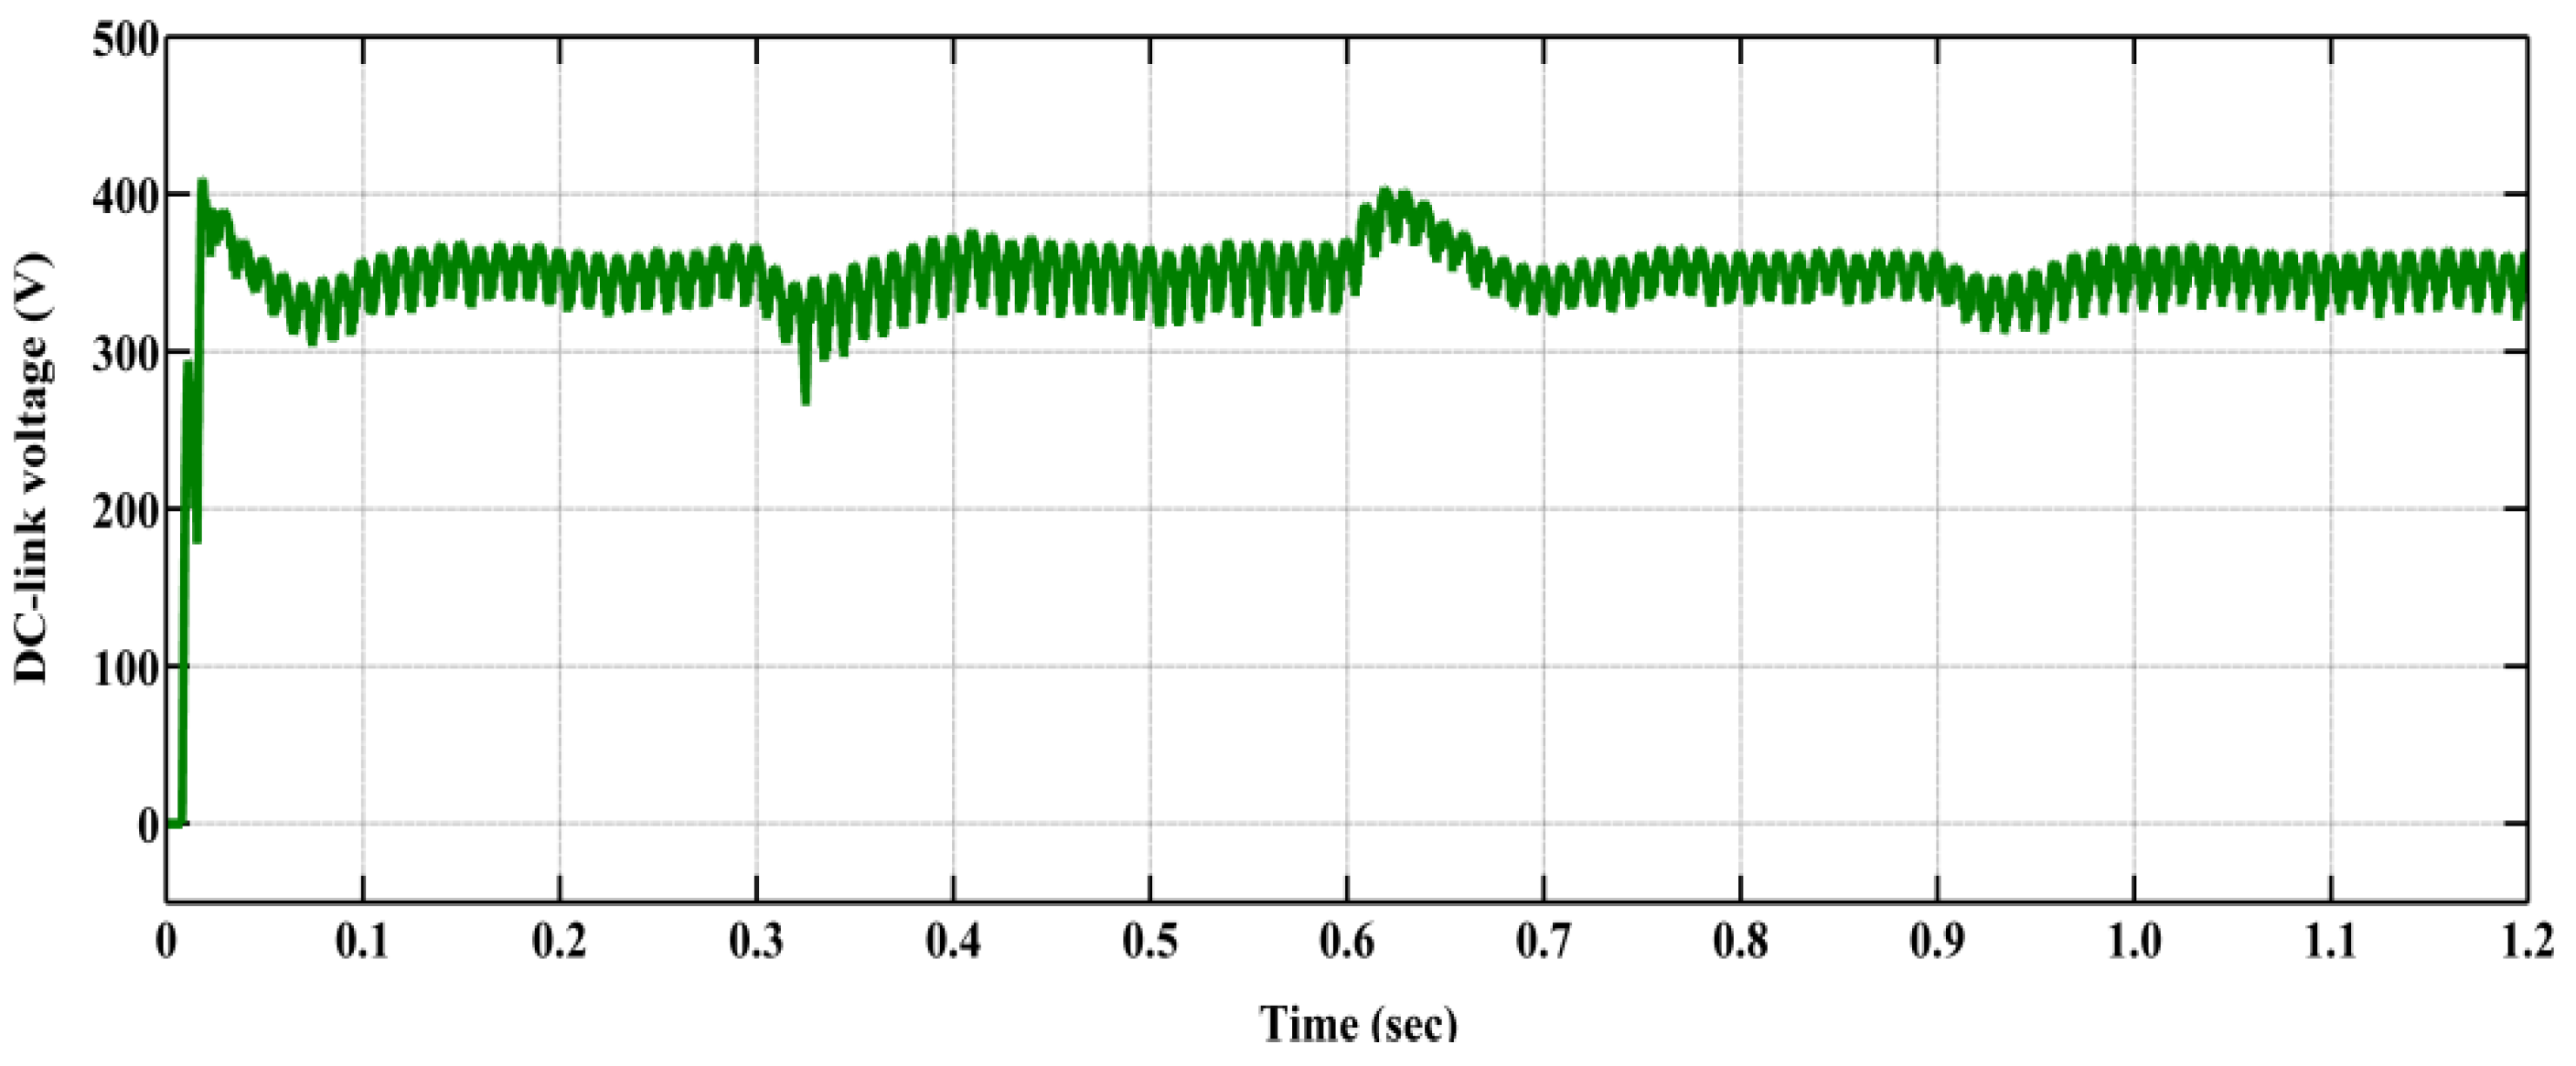
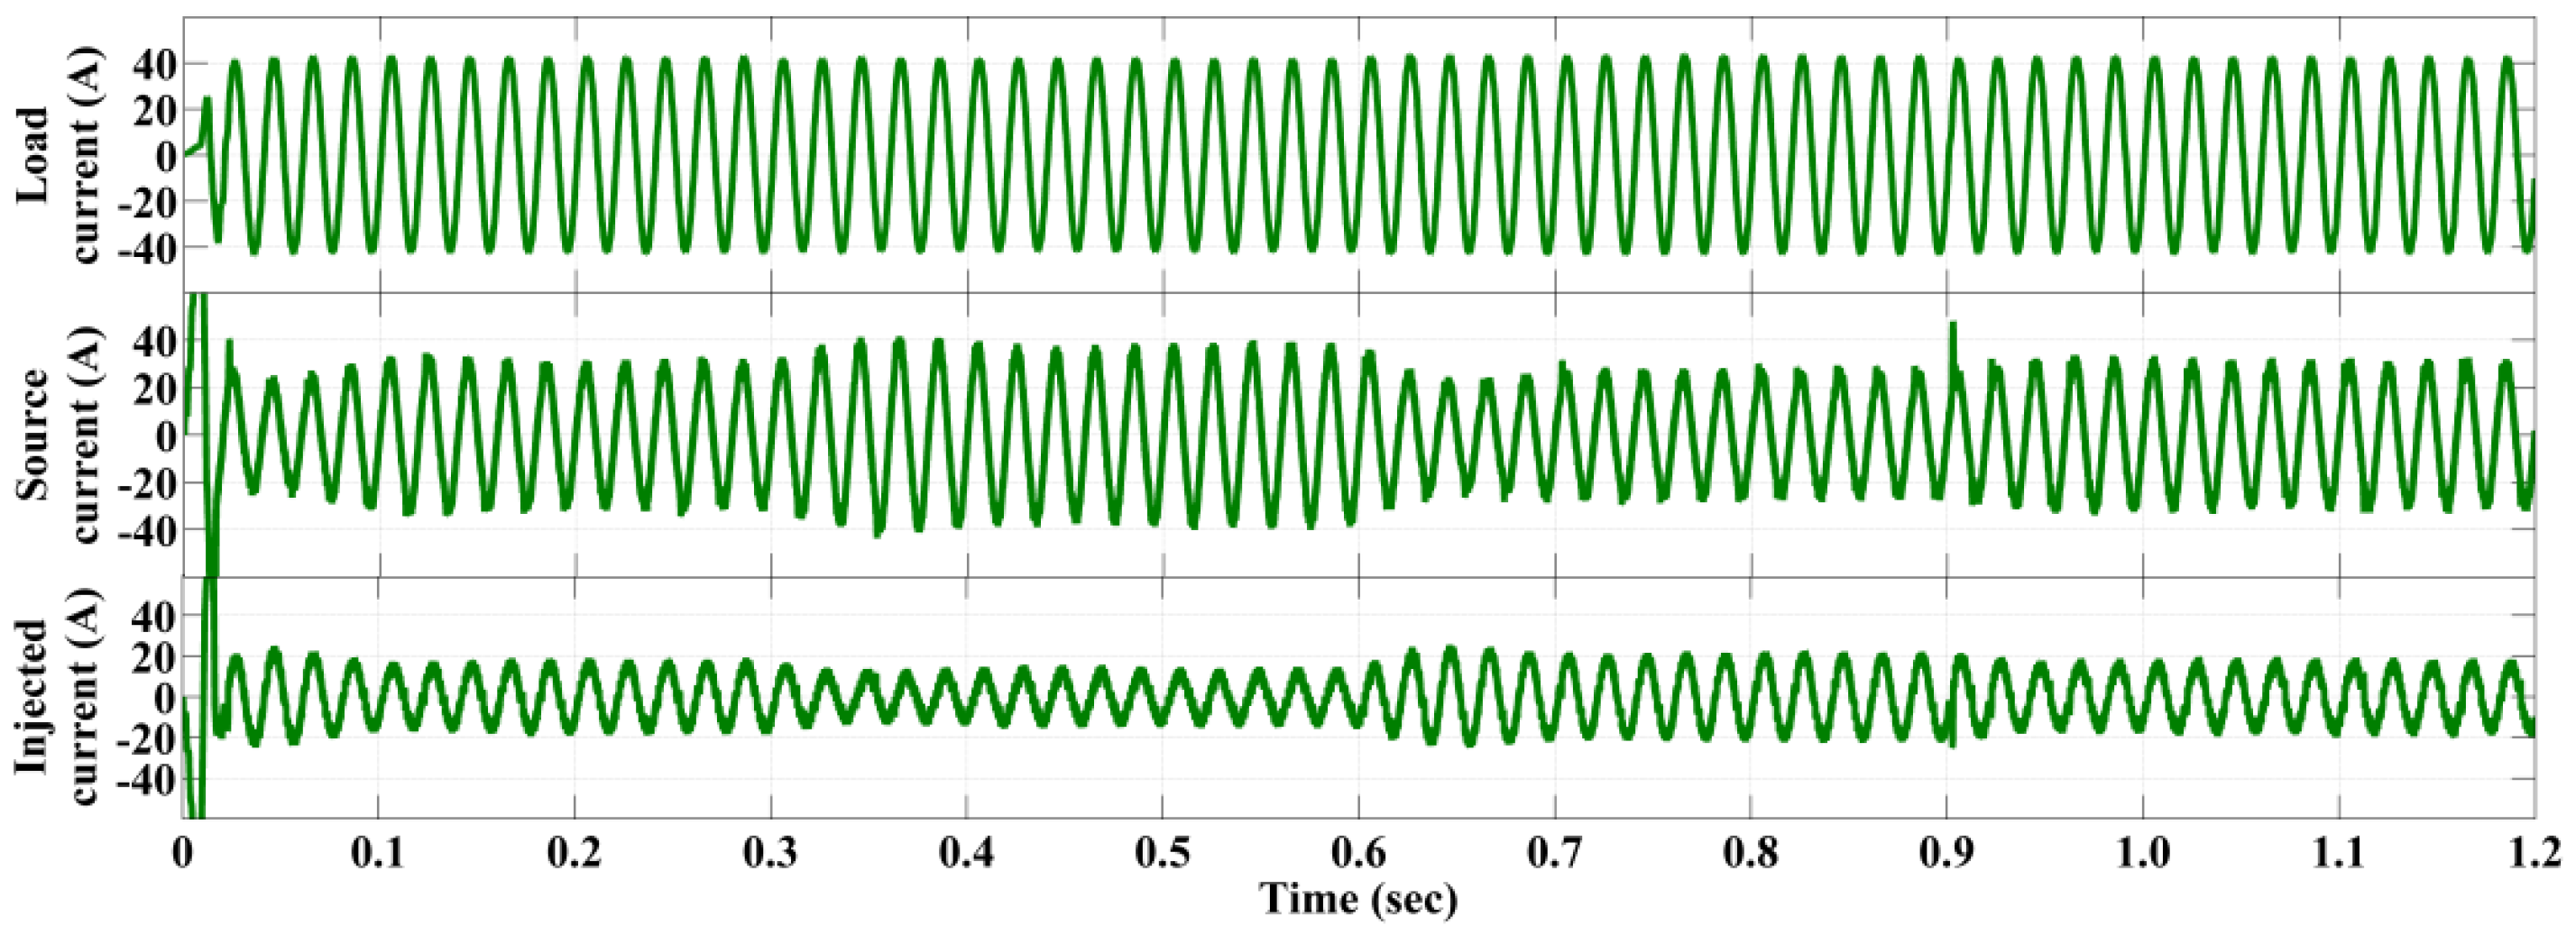
In the presence of both a linear and non-linear load, the THD content of the source current without compensation was less than that obtained with the non-linear load alone, but remained on the higher side. With a constant maximum linear load of 5 kW and 5 kVAr, the series and shunt APFs took part equally in reactive power compensation, along with their respective voltage disturbance and current harmonic compensation. Figure 4 and Figure 5 depict the different voltage and current waveforms under this load condition, respectively. Figure 4a illustrates the voltage waveforms for the complete duration of 1.2 s. Figure 4b–d depicts enlarged fragments of the voltage waveform observing the sag, swell and harmonic condition, respectively. It was observed that, under all scenarios, the load voltage was maintained as the same as the source voltage before any disturbance; i.e., before 0.3 s. Likewise, Figure 5b–d depicts enlarged fragments observing the sag, swell and harmonic condition, respectively, of the total current waveform shown in Figure 5a. The DC-link voltage profile was also maintained at its set reference value, as can be observed in Figure 6. Although a DC-link voltage ripple was observable, the UPC performance was not affected and was satisfactory with the considered operating conditions.
6.2. Simulation Results with Linear Load
In the absence of any non-linear load, the source current without compensation was free from harmonics and did not require any harmonic compensation from the shunt APF. Figure 7 illustrates the response of the UPC system with the proposed controller for a constant linear load of 5 kW and 5 kVAR. Under varying source voltage disturbances, the series injected voltage made adjustments to maintain a steady state and rated load voltage profile. The compensating current from the shunt APF was only responsible for partly compensating the VAR demand whereas an equal amount of reactive power was compensated for by the series APF.
6.3. Simulation Results with a Non-Linear Load
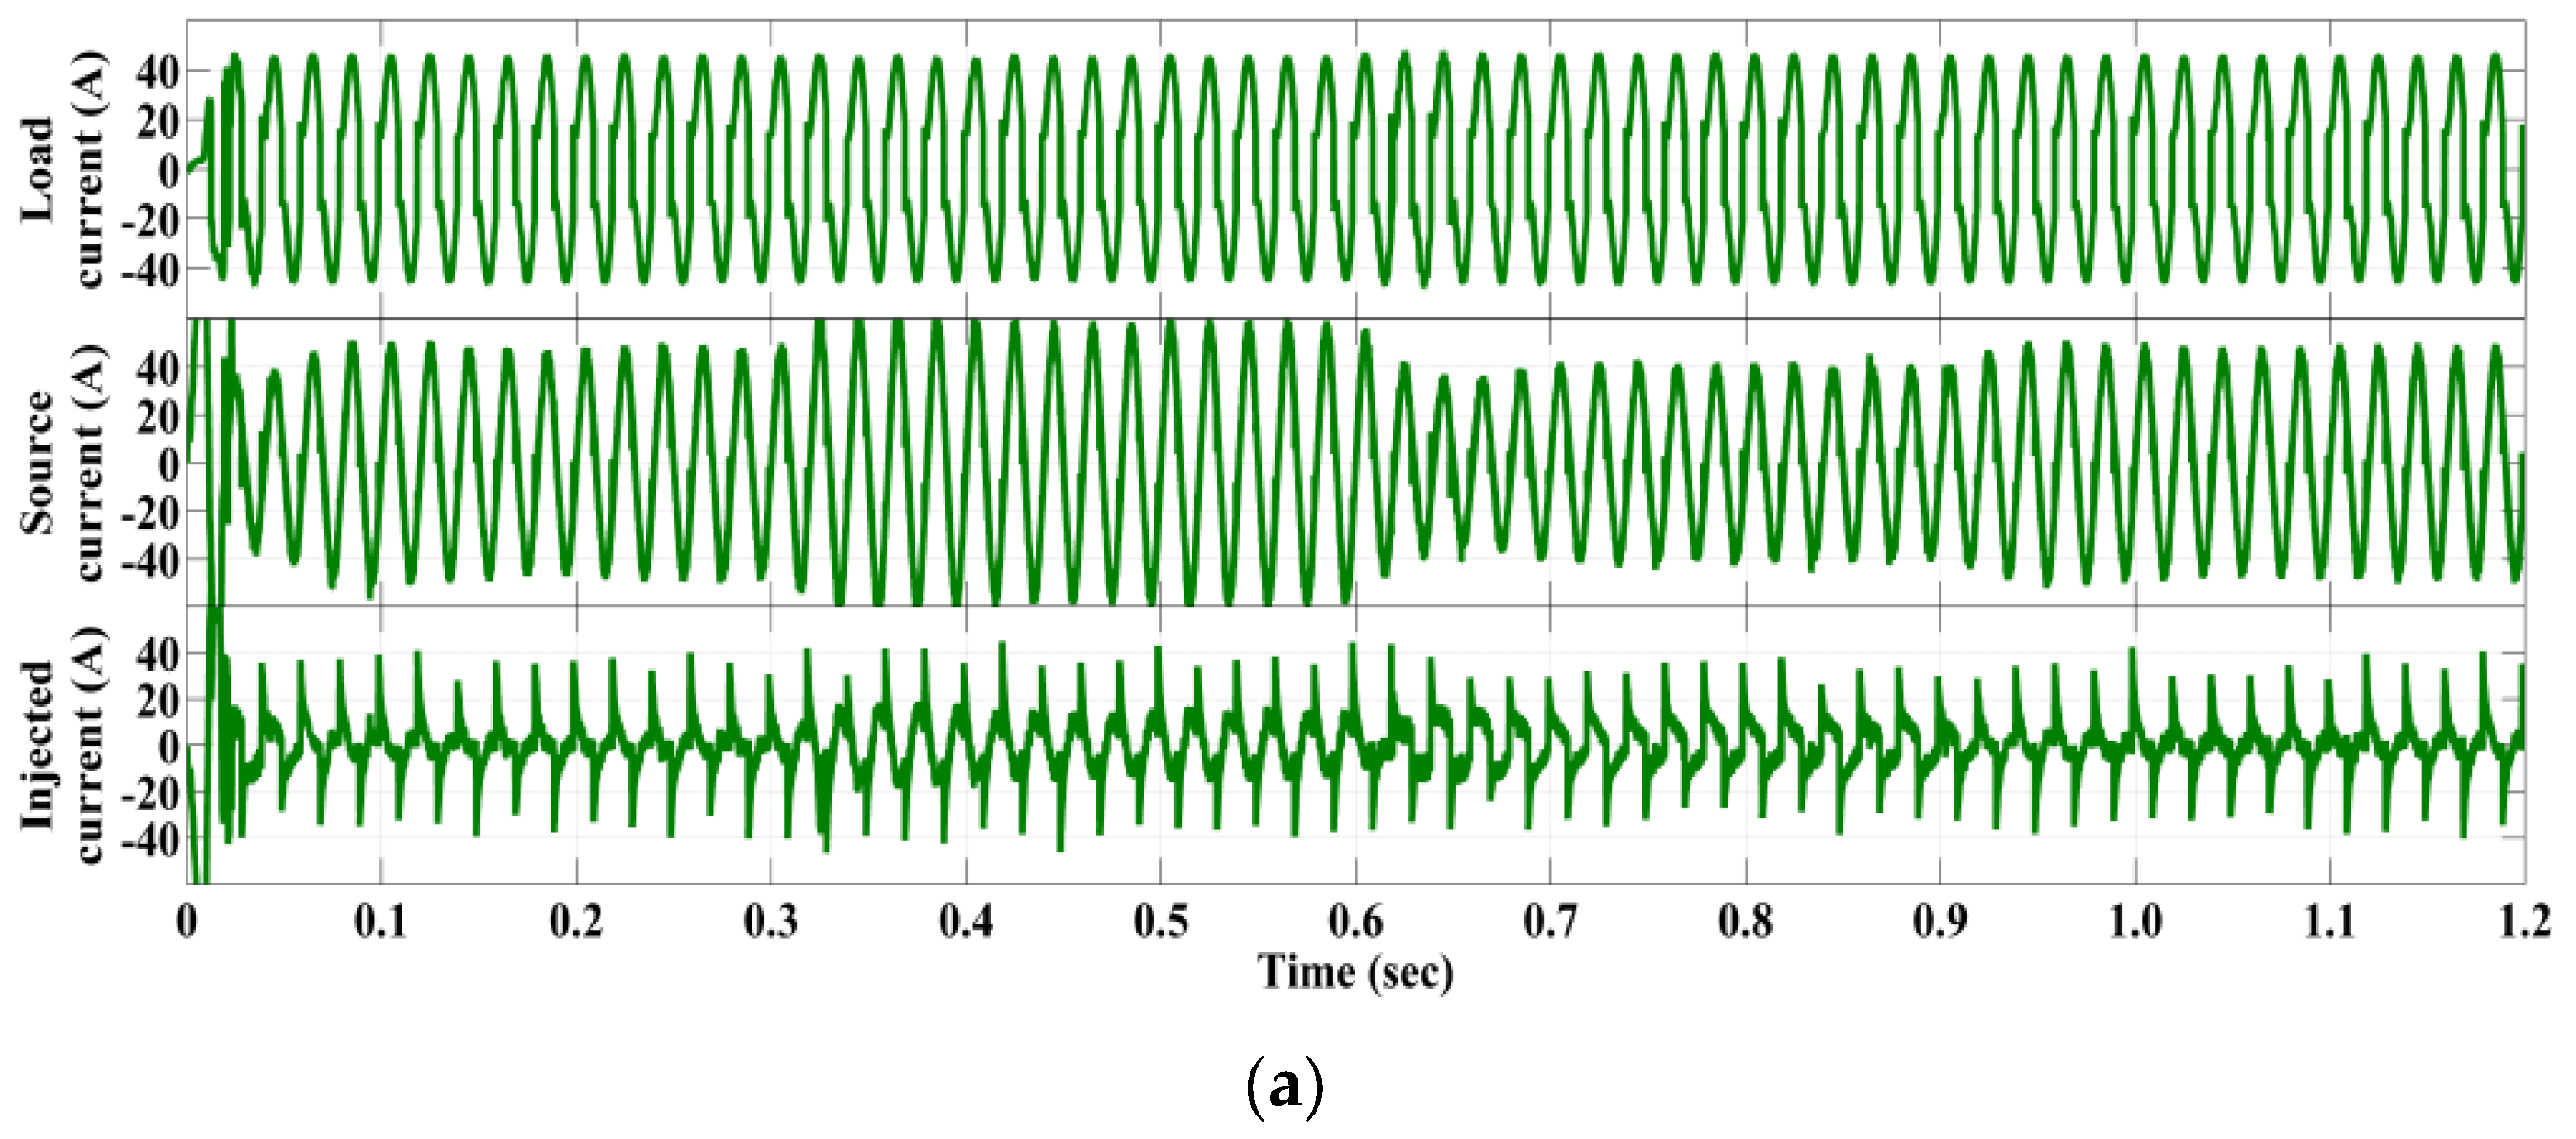
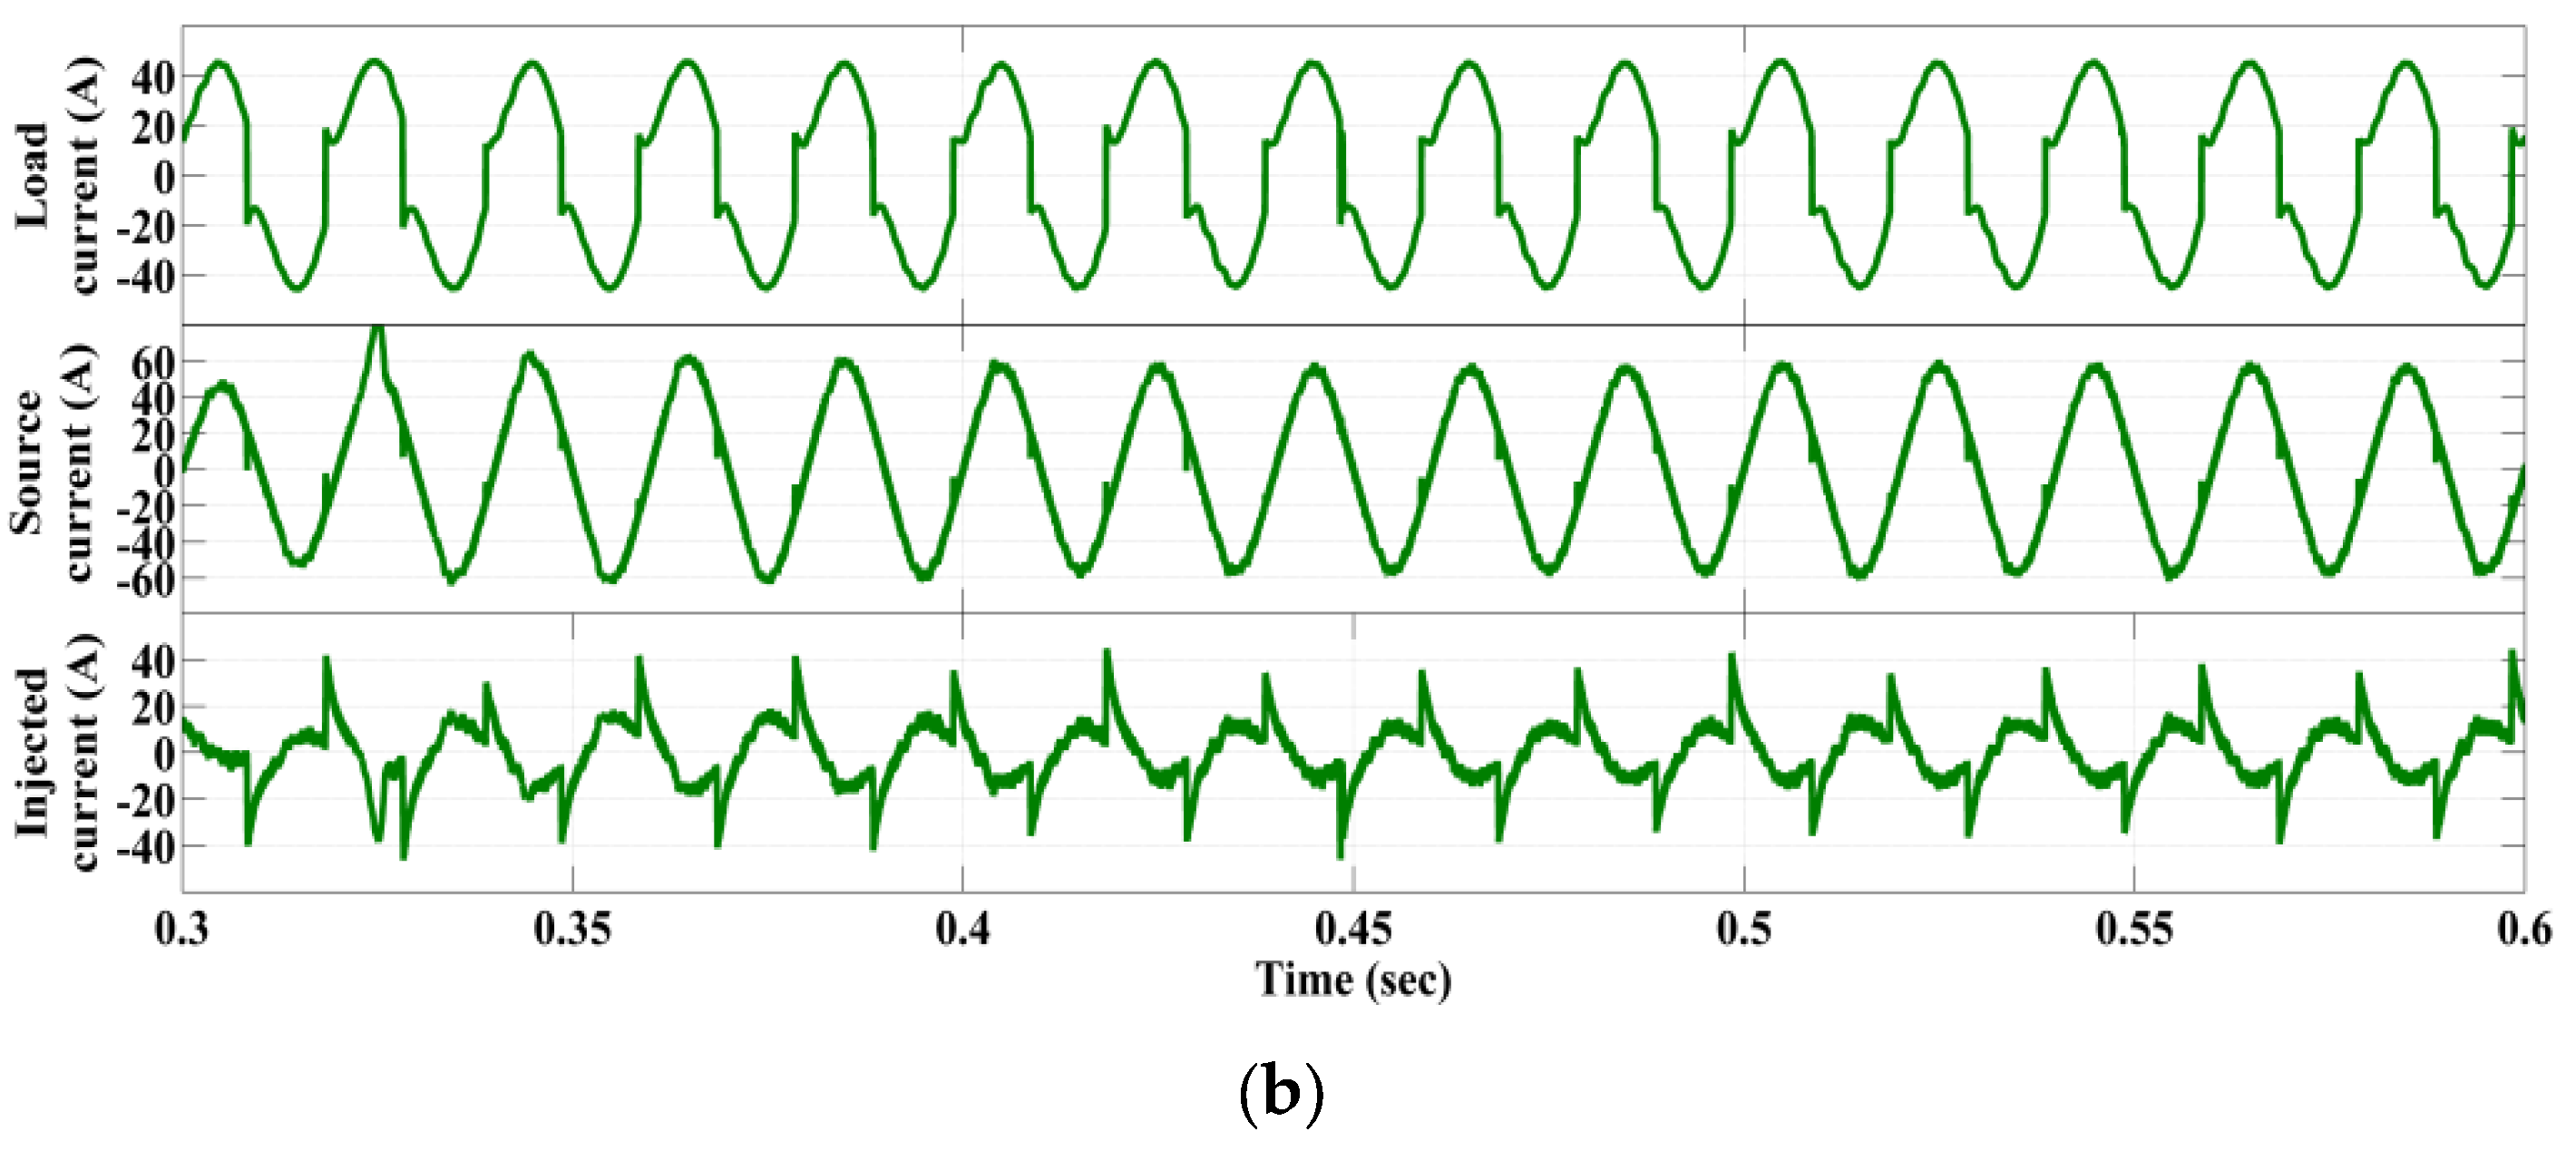
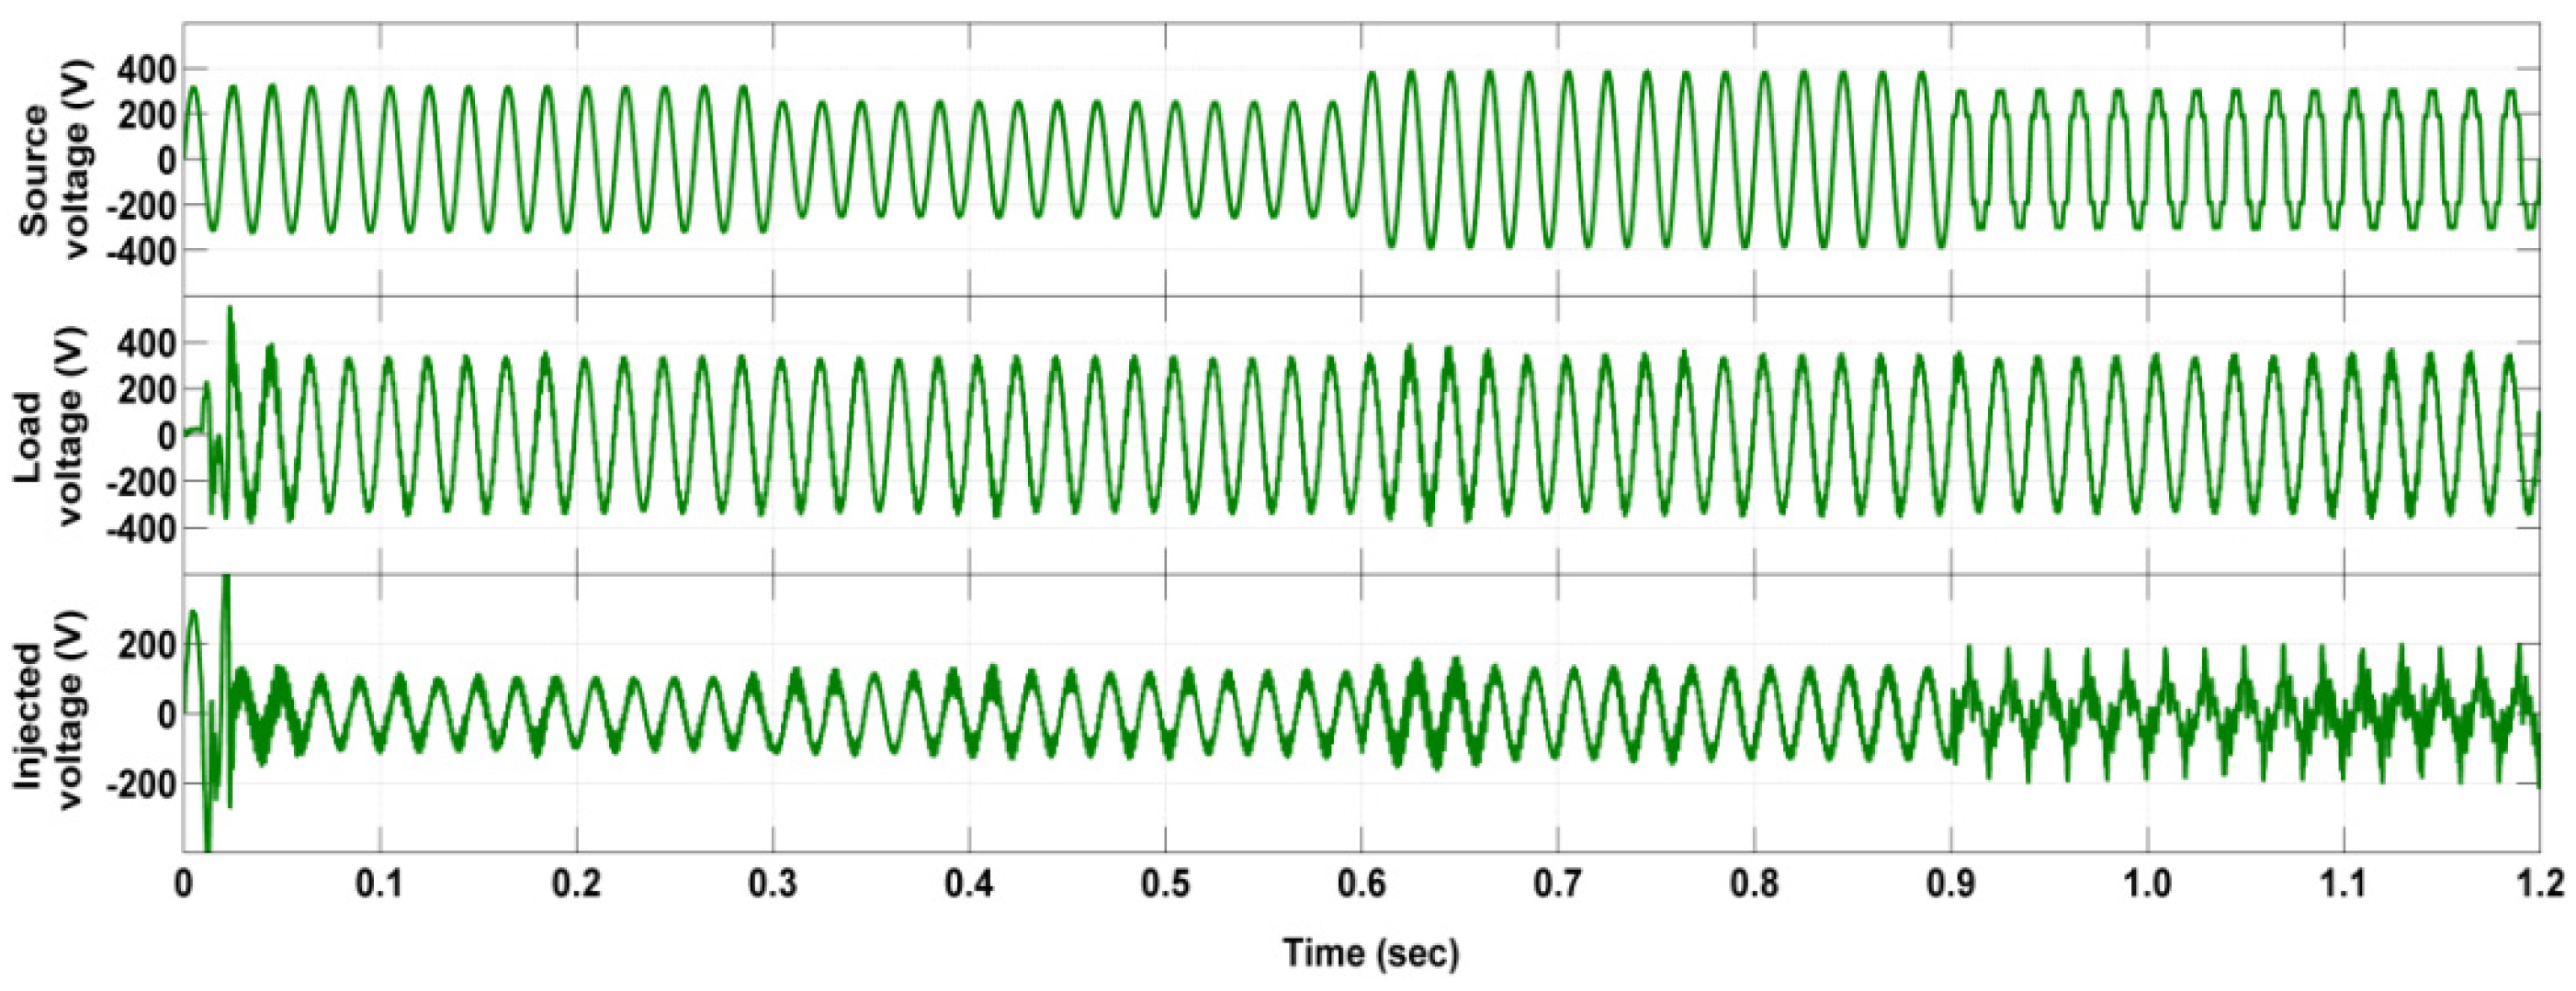
With the inclusion of only a non-linear load, the UPC system operation was confined to the compensation of source voltage disturbances and current harmonic compensation. As is clear from Figure 8, the source current profile was free from harmonics, with the THD content being reduced to 3.4% from 23.6%. Figure 8a depicts the time duration of 1.2 s whereas Figure 8b is an enlarged fragment for the time duration of 0.3–0.6 s for a better illustration of the effect of the non-linear load on the current waveform. It was evident that the source current before compensation was highly contaminated with harmonics whereas after compensation it was closer to sinusoidal. The THD analysis of the source current is discussed in detail further on in this work. With a proper compensating series injected voltage by the series APF and a compensating current by the shunt APF, the load voltage profile was maintained at its rated condition, as illustrated in Figure 9.
6.4. Cumulative UPC Performance Parameters under Different Voltages and Loading Conditions
Table 2 illustrates the various performance parameters used to obtain a better understanding of the UPC performance analysis under different voltage and loading conditions. The performance parameters listed in the table are: I: the RMS value of the load voltage in volts (without a UPC); II: the RMS value of the load voltage (with a UPC); III: the THD% of the load voltage (without a UPC); IV: the THD% of the load voltage (with a UPC); V: the THD% of the source current (without a UPC); VI: the THD% of the source current (with a UPC); and VII: the reactive power share between the shunt APF (QSH) and the series APF (QSR) in VAR (volt-ampere reactive). As observed from the table, the load voltage RMS value was maintained close to the reference RMS value of 230 V under different voltage and loading conditions. The THD% of the load voltage with the harmonics under consideration was within the limits of 5% with an appropriate compensation from the UPC in all cases. As can be seen from the table, the THD% of the source current without the UPC, considering both a linear and non-linear load (composite load), was in the range of 9–10% whereas for a non-linear load, it was in the range of 16–20%. However, with the UPC, the THD% of the source current was brought back to within a 5% limit. Thereafter, reactive power compensation sharing by the UPC APFs were observed for the composite load and linear load cases. With the composite load, the total load reactive power demand was around 6 kVAR and equal sharing was observed by the shunt and series APF. With only a linear load, the load reactive power demand was 5 kVAR and, consequently, there was equal sharing between the shunt and series APF.
6.5. Comparative Performance Analysis under Non-Sinusoidal Voltage Conditions
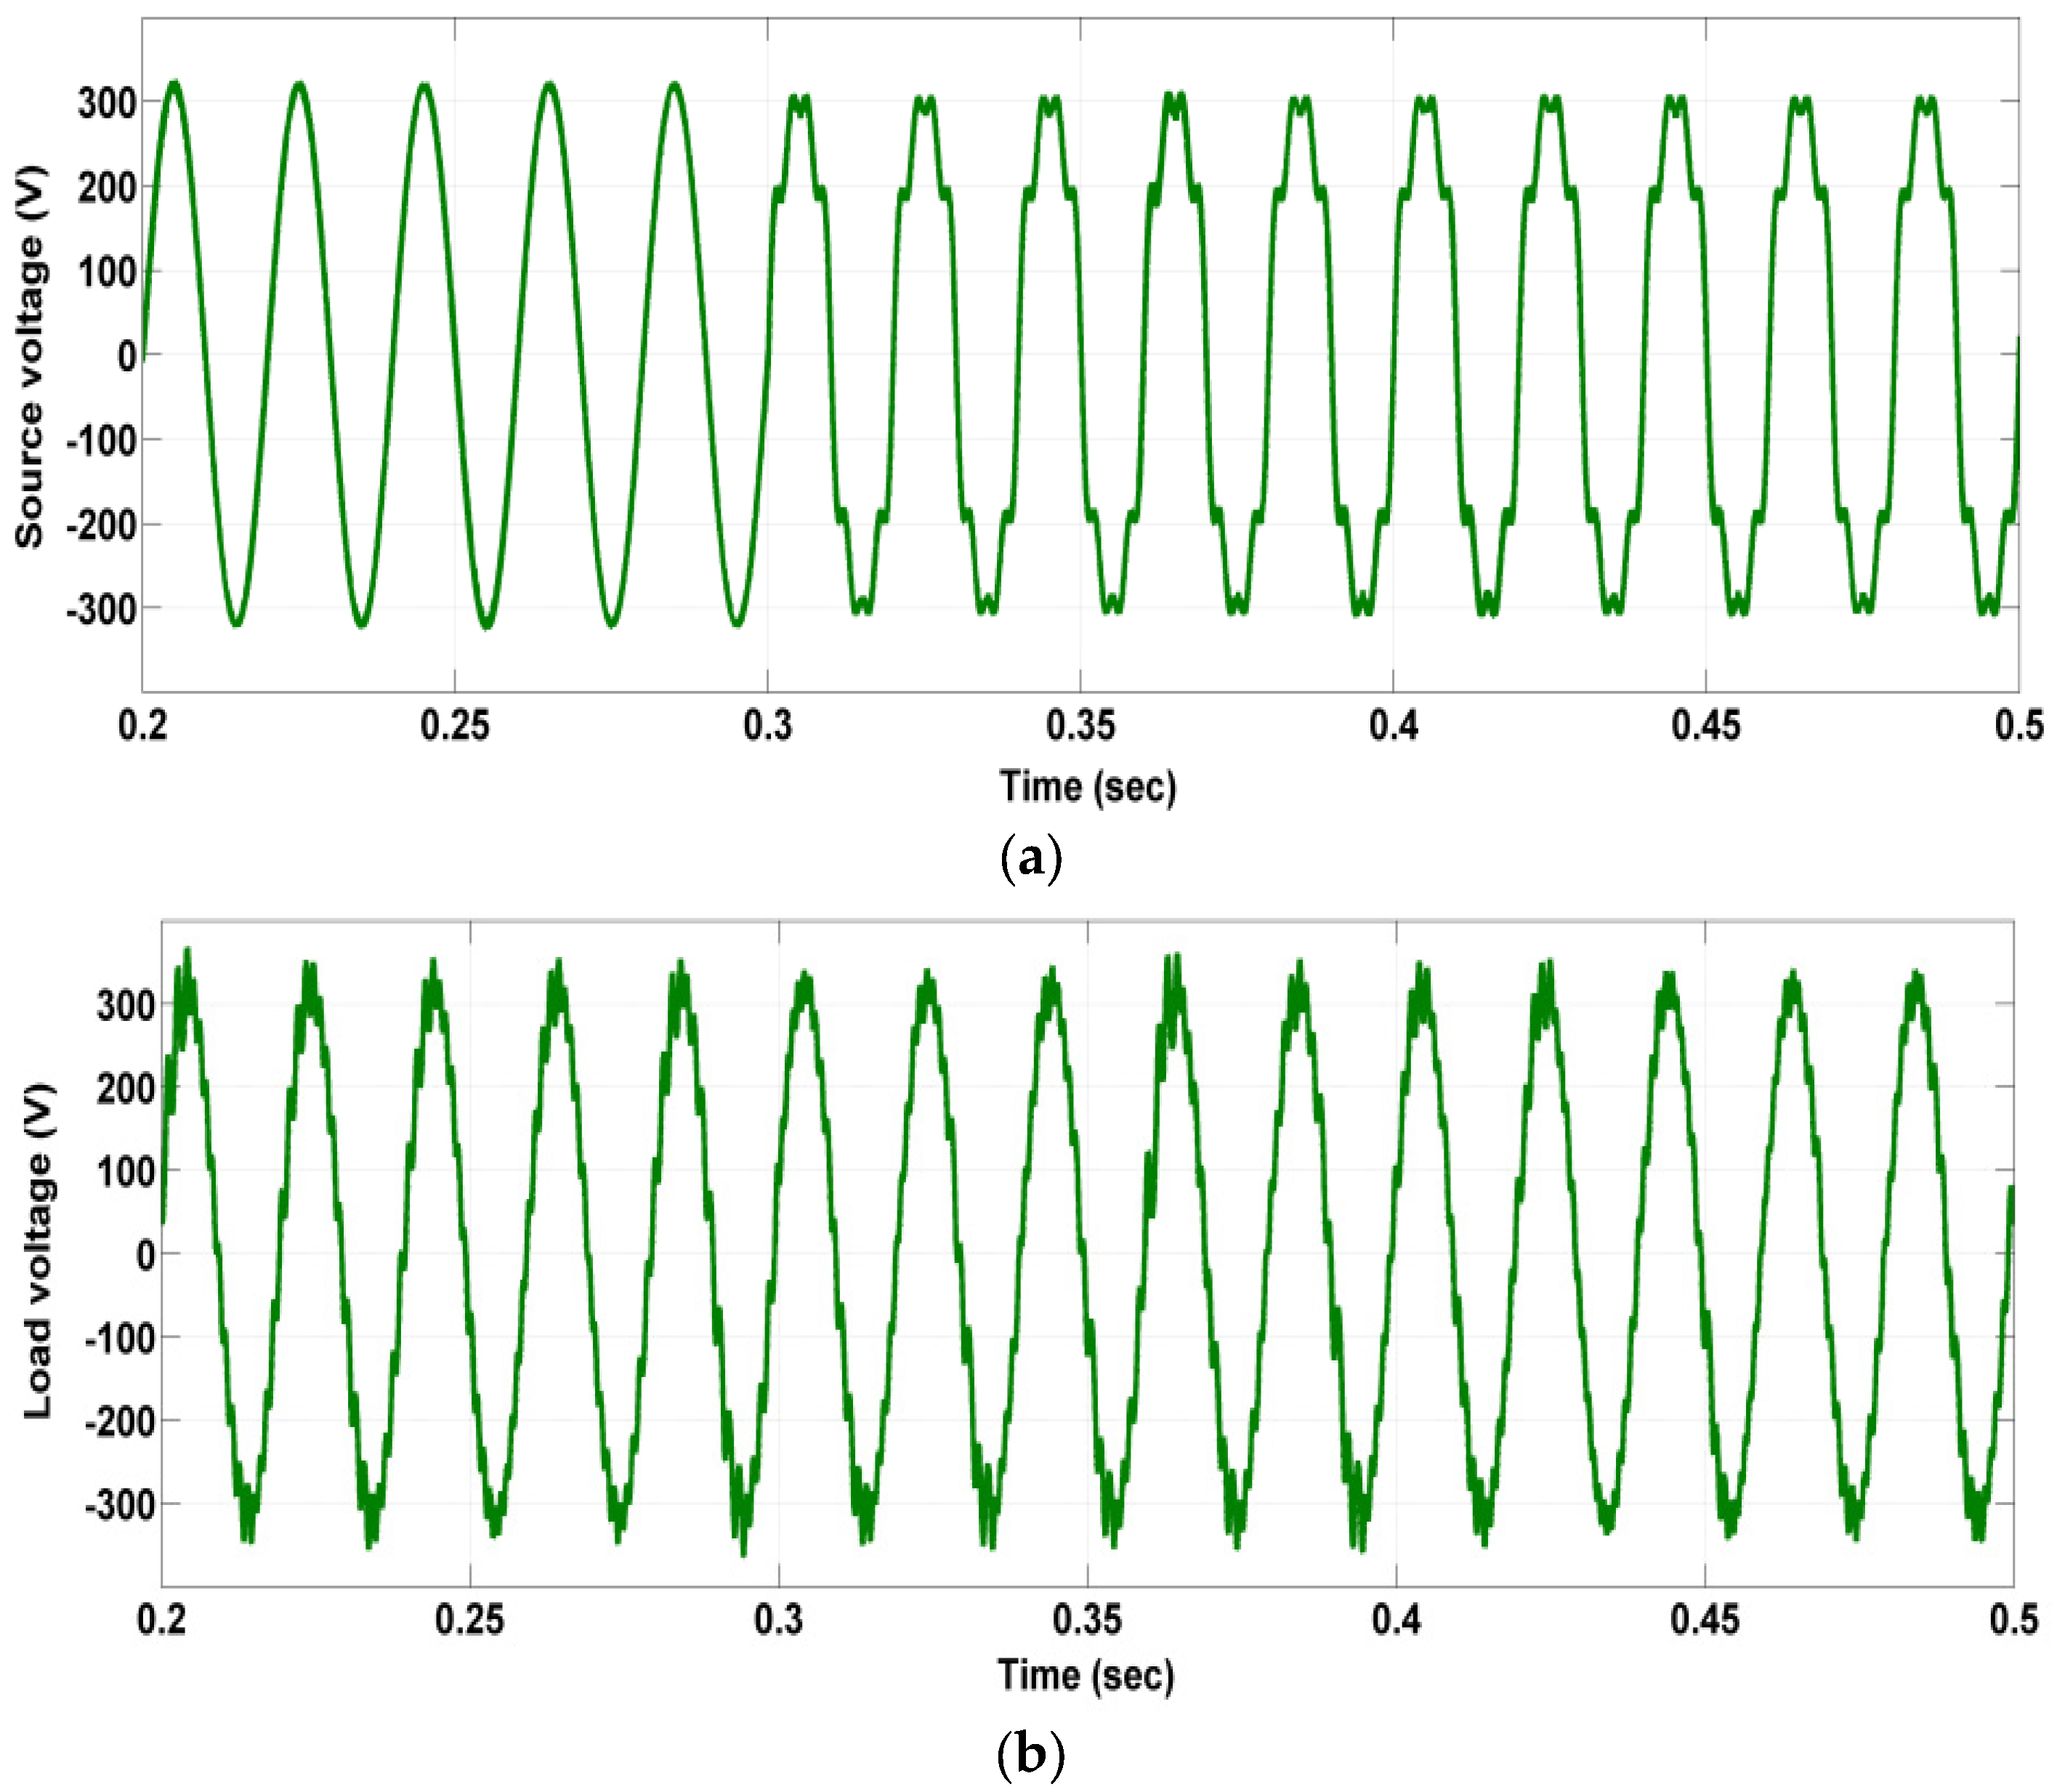
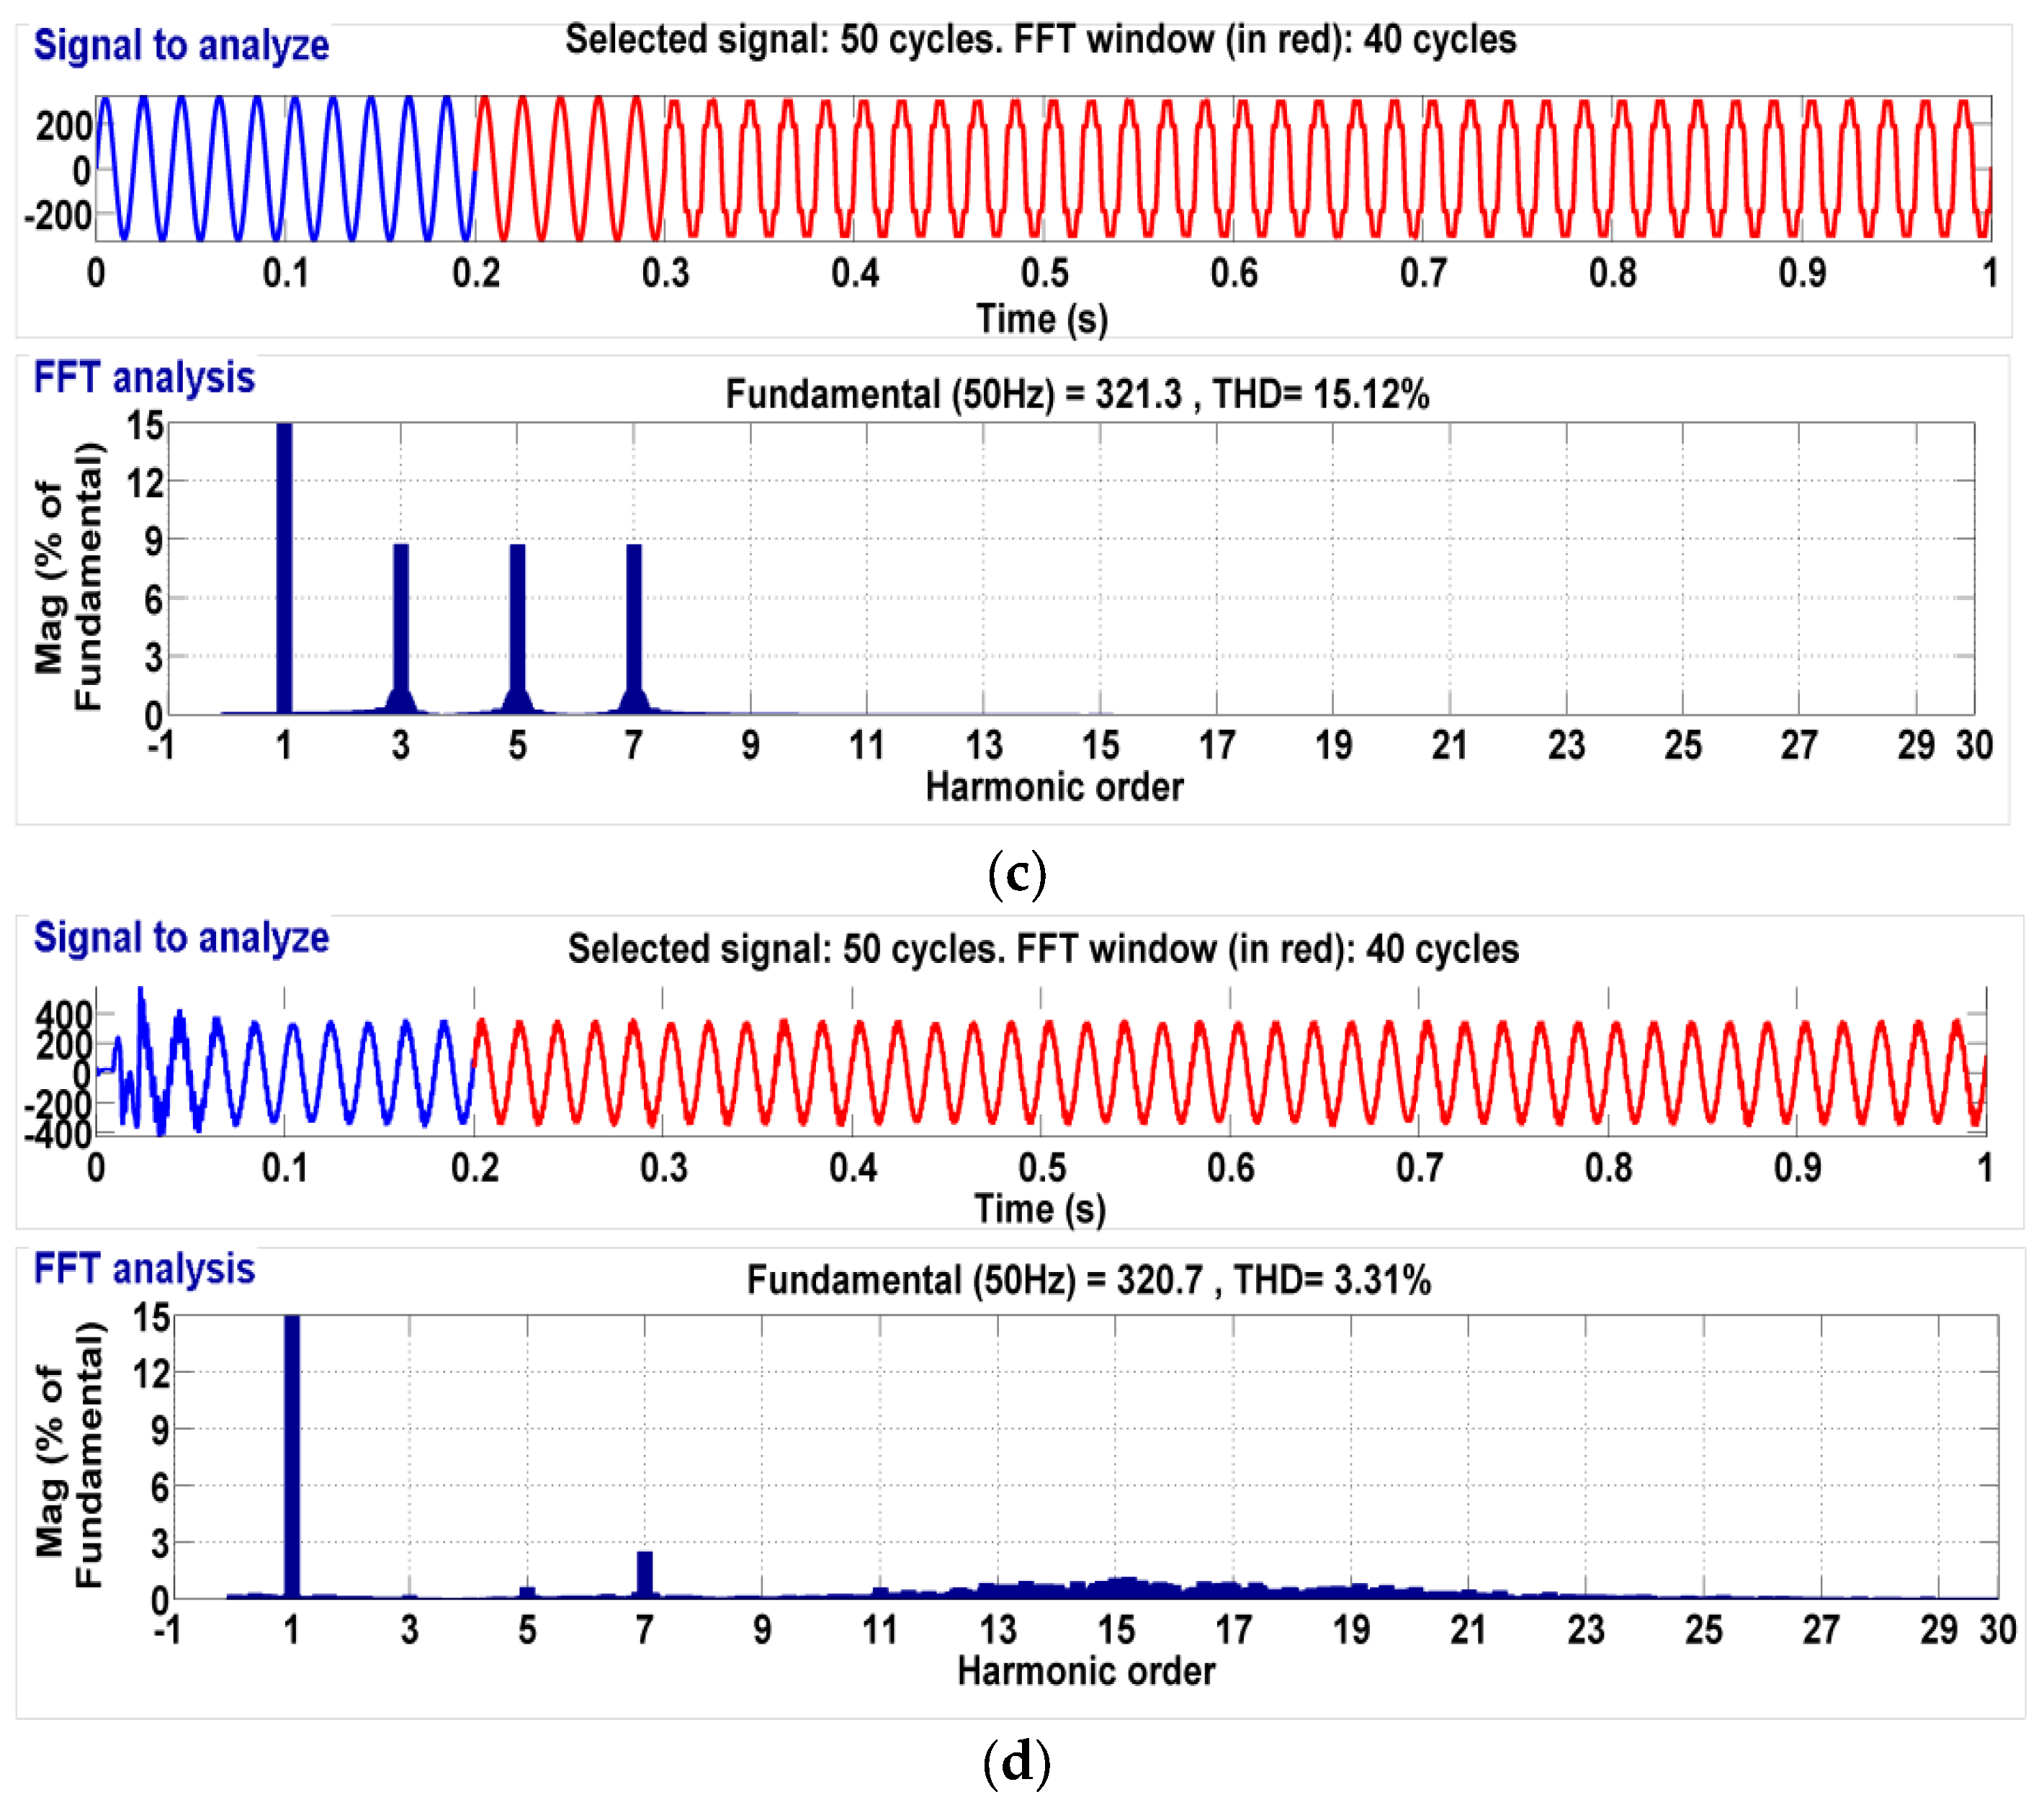
A simulation case was considered again with a non-linear load, but with a non-sinusoidal supply voltage condition only. The focus was on the current compensation by the UPC under non-sinusoidal voltage conditions. Figure 10a,b indicates the source voltage with harmonics (10% of 3rd, 5th and 7th order harmonic components) and the load voltage with compensation from the UPC system. Figure 10c,d illustrates the FFT analysis of the source voltage and load voltage, respectively. The load voltage was reduced from around 15% to 3%.
The efficacy of the SRF method of compensation over the conventional PQ method under non-sinusoidal voltage conditions in terms of current compensation and equal reactive power sharing, as discussed in Section 4, is exhibited in a further analysis.
- A.
- THD Analysis of Source Current between SRF and Conventional PQ Methods
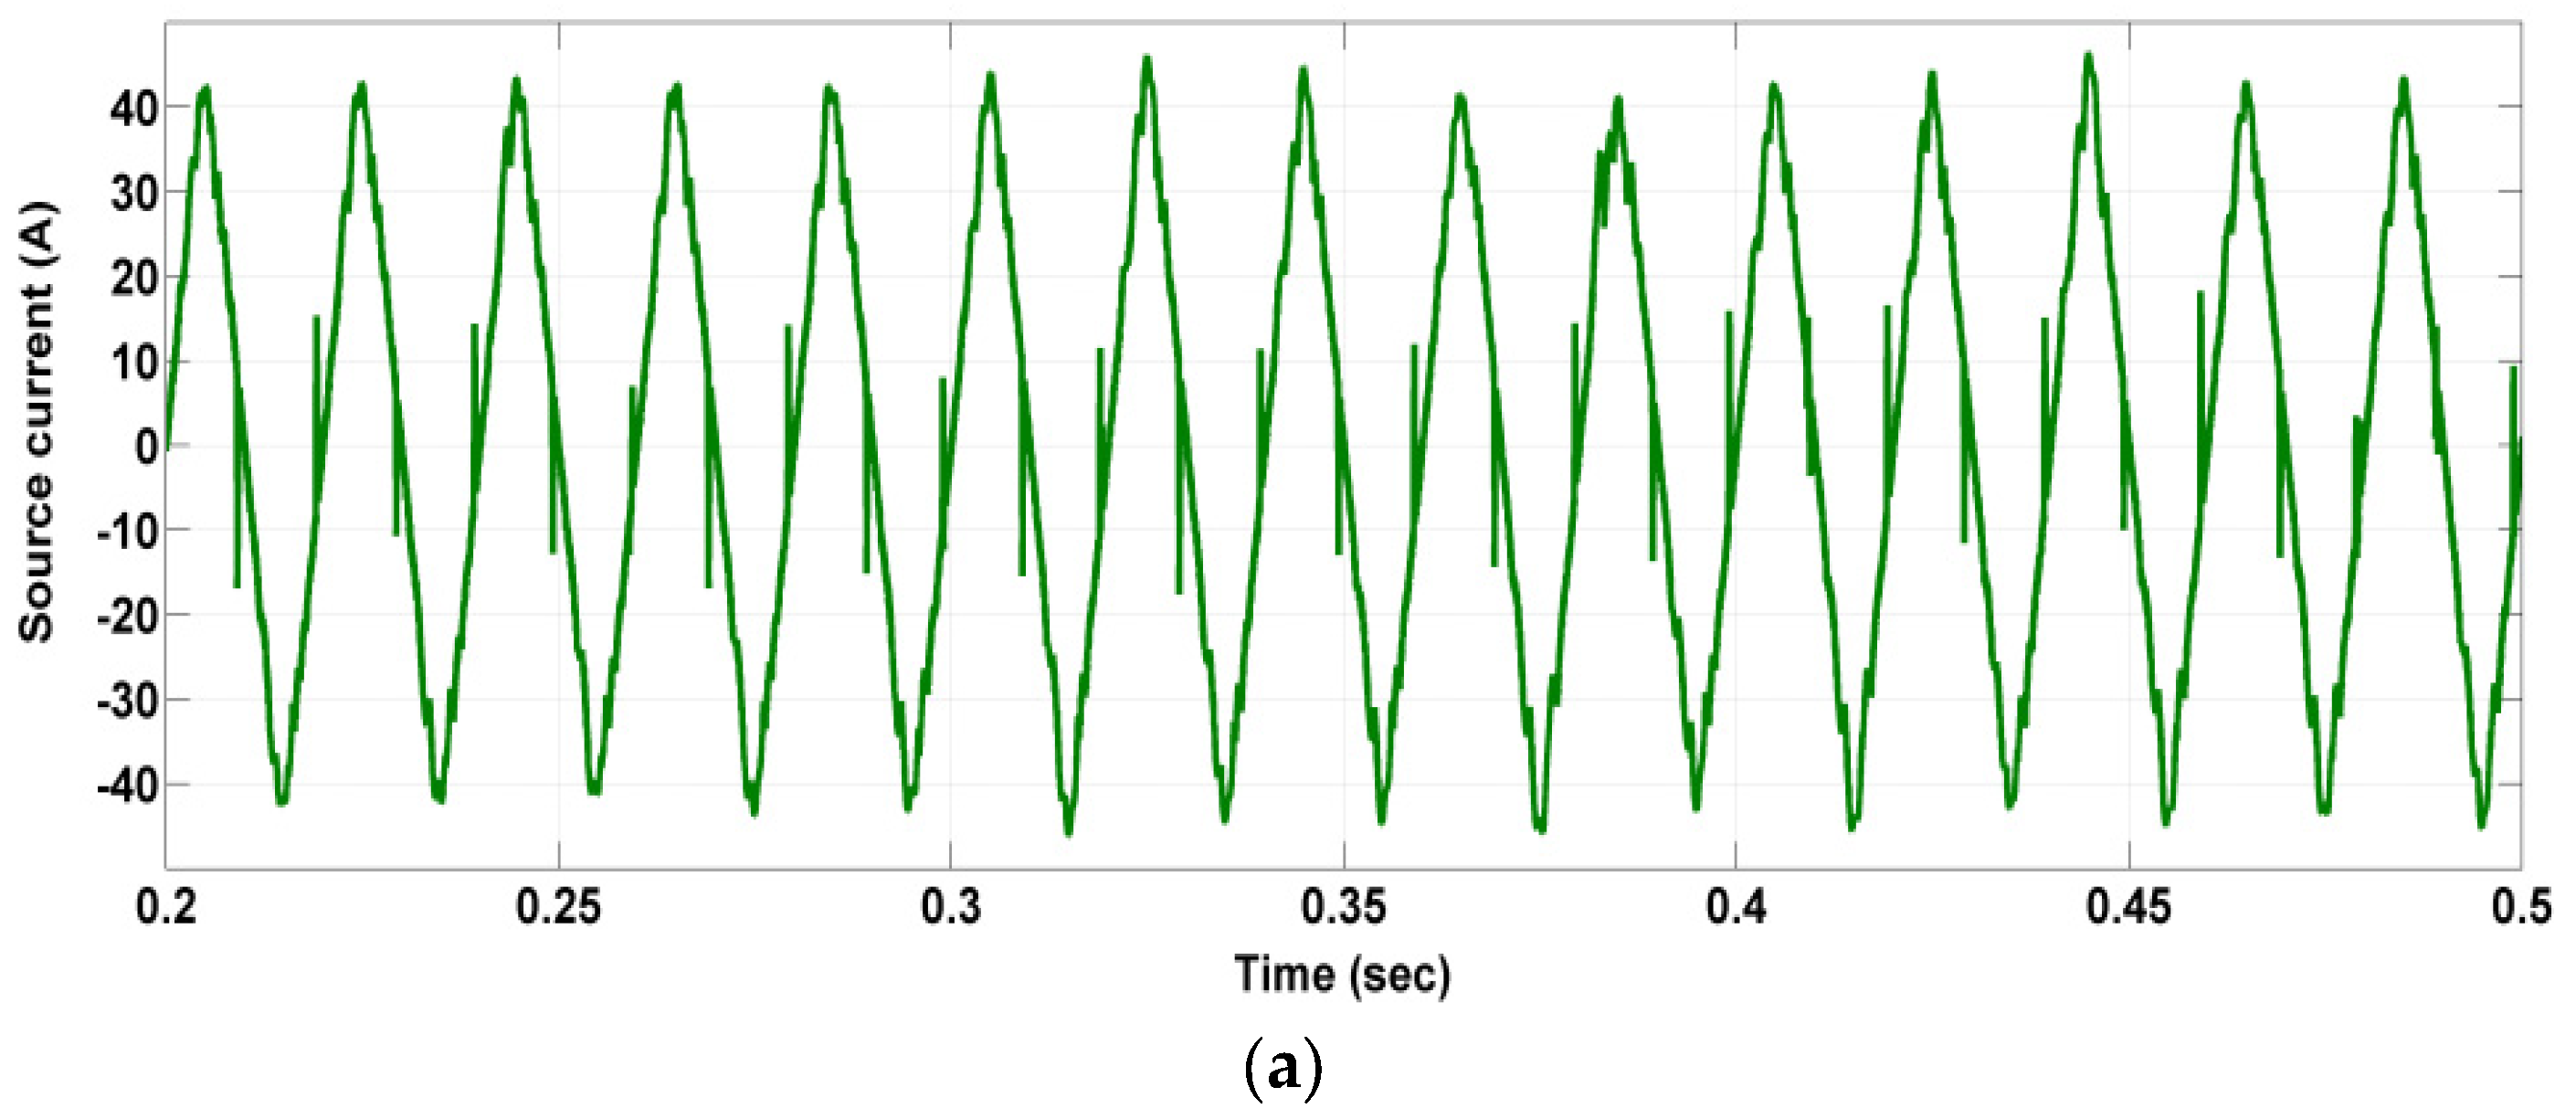
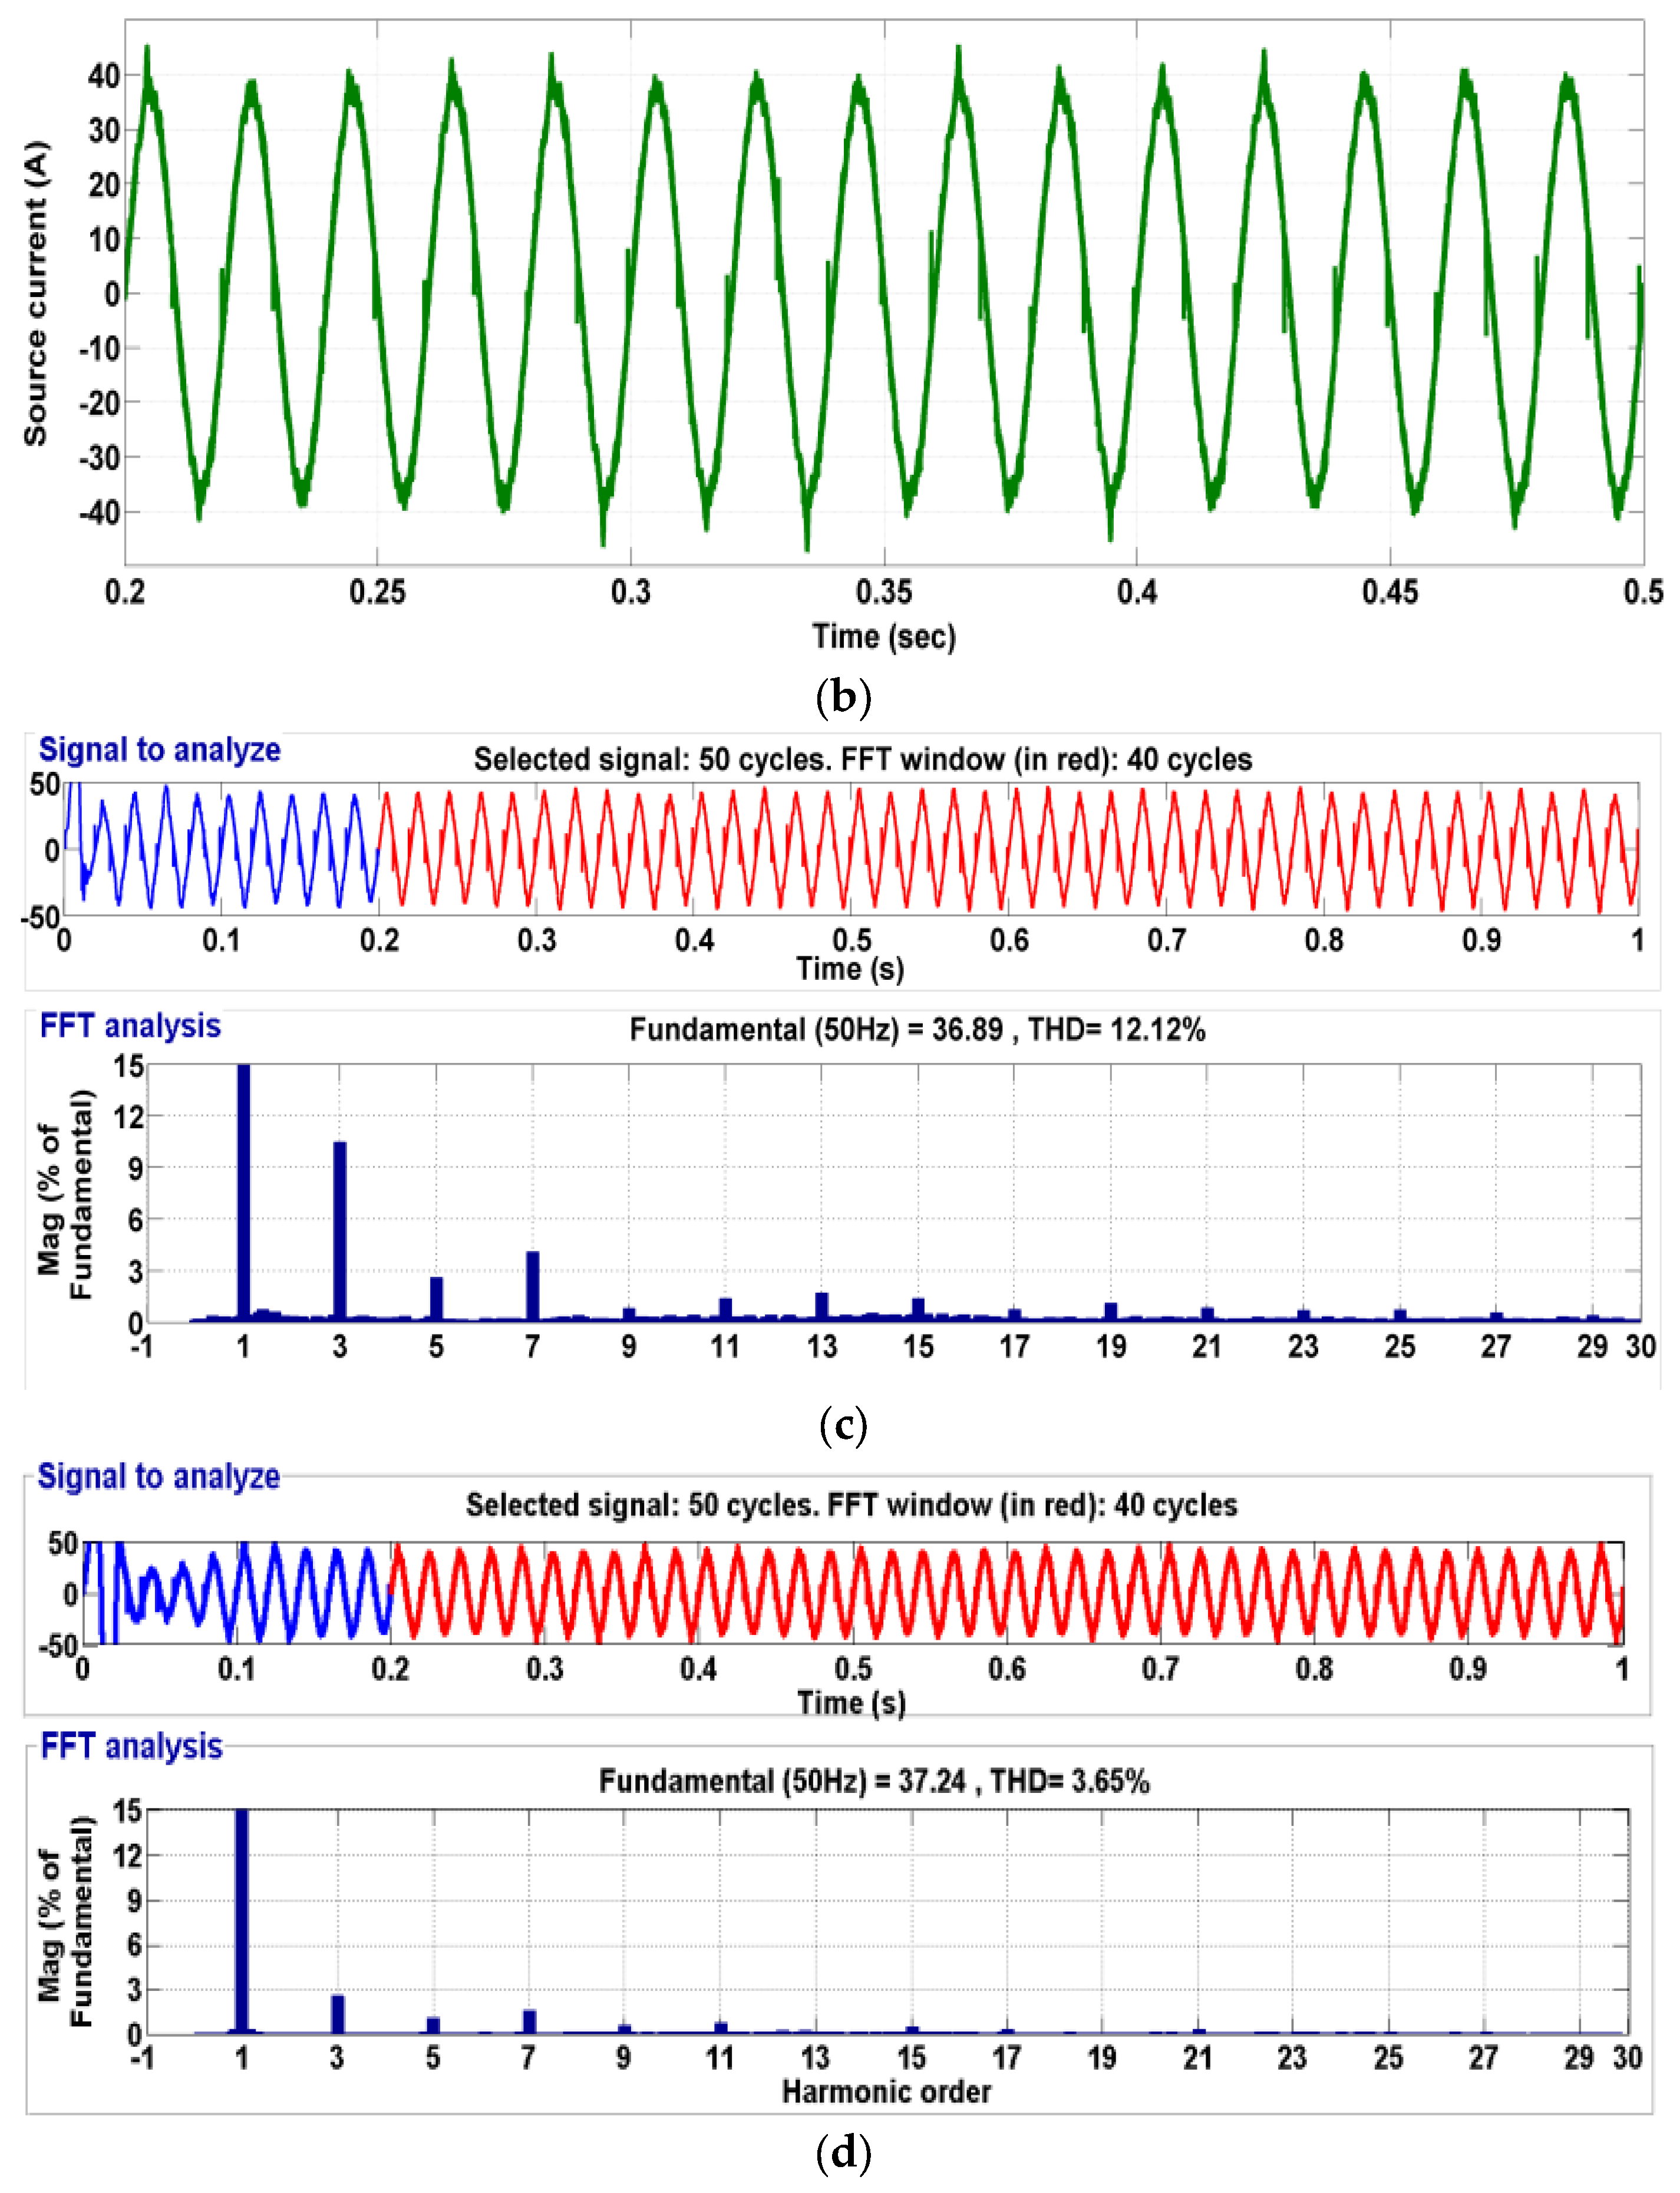
Figure 11a shows the source current waveform obtained from the PQ method. The source current waveform after compensation from the SRF method is illustrated in Figure 11b. It was clearly observable that the source current waveform obtained with the SRF method was less contaminated than with the PQ method. The current FFT analysis is presented in Figure 11c,d for the PQ and SRF methods, respectively. It was clear that the THD of the source current with the SRF method was below 5% whereas with the PQ method, it was above the allowable limit with non-sinusoidal voltage conditions.
- B.
- Comparative performance analysis between SRF-based PA estimation and conventional PQ-based PA estimation under non-sinusoidal voltage conditions
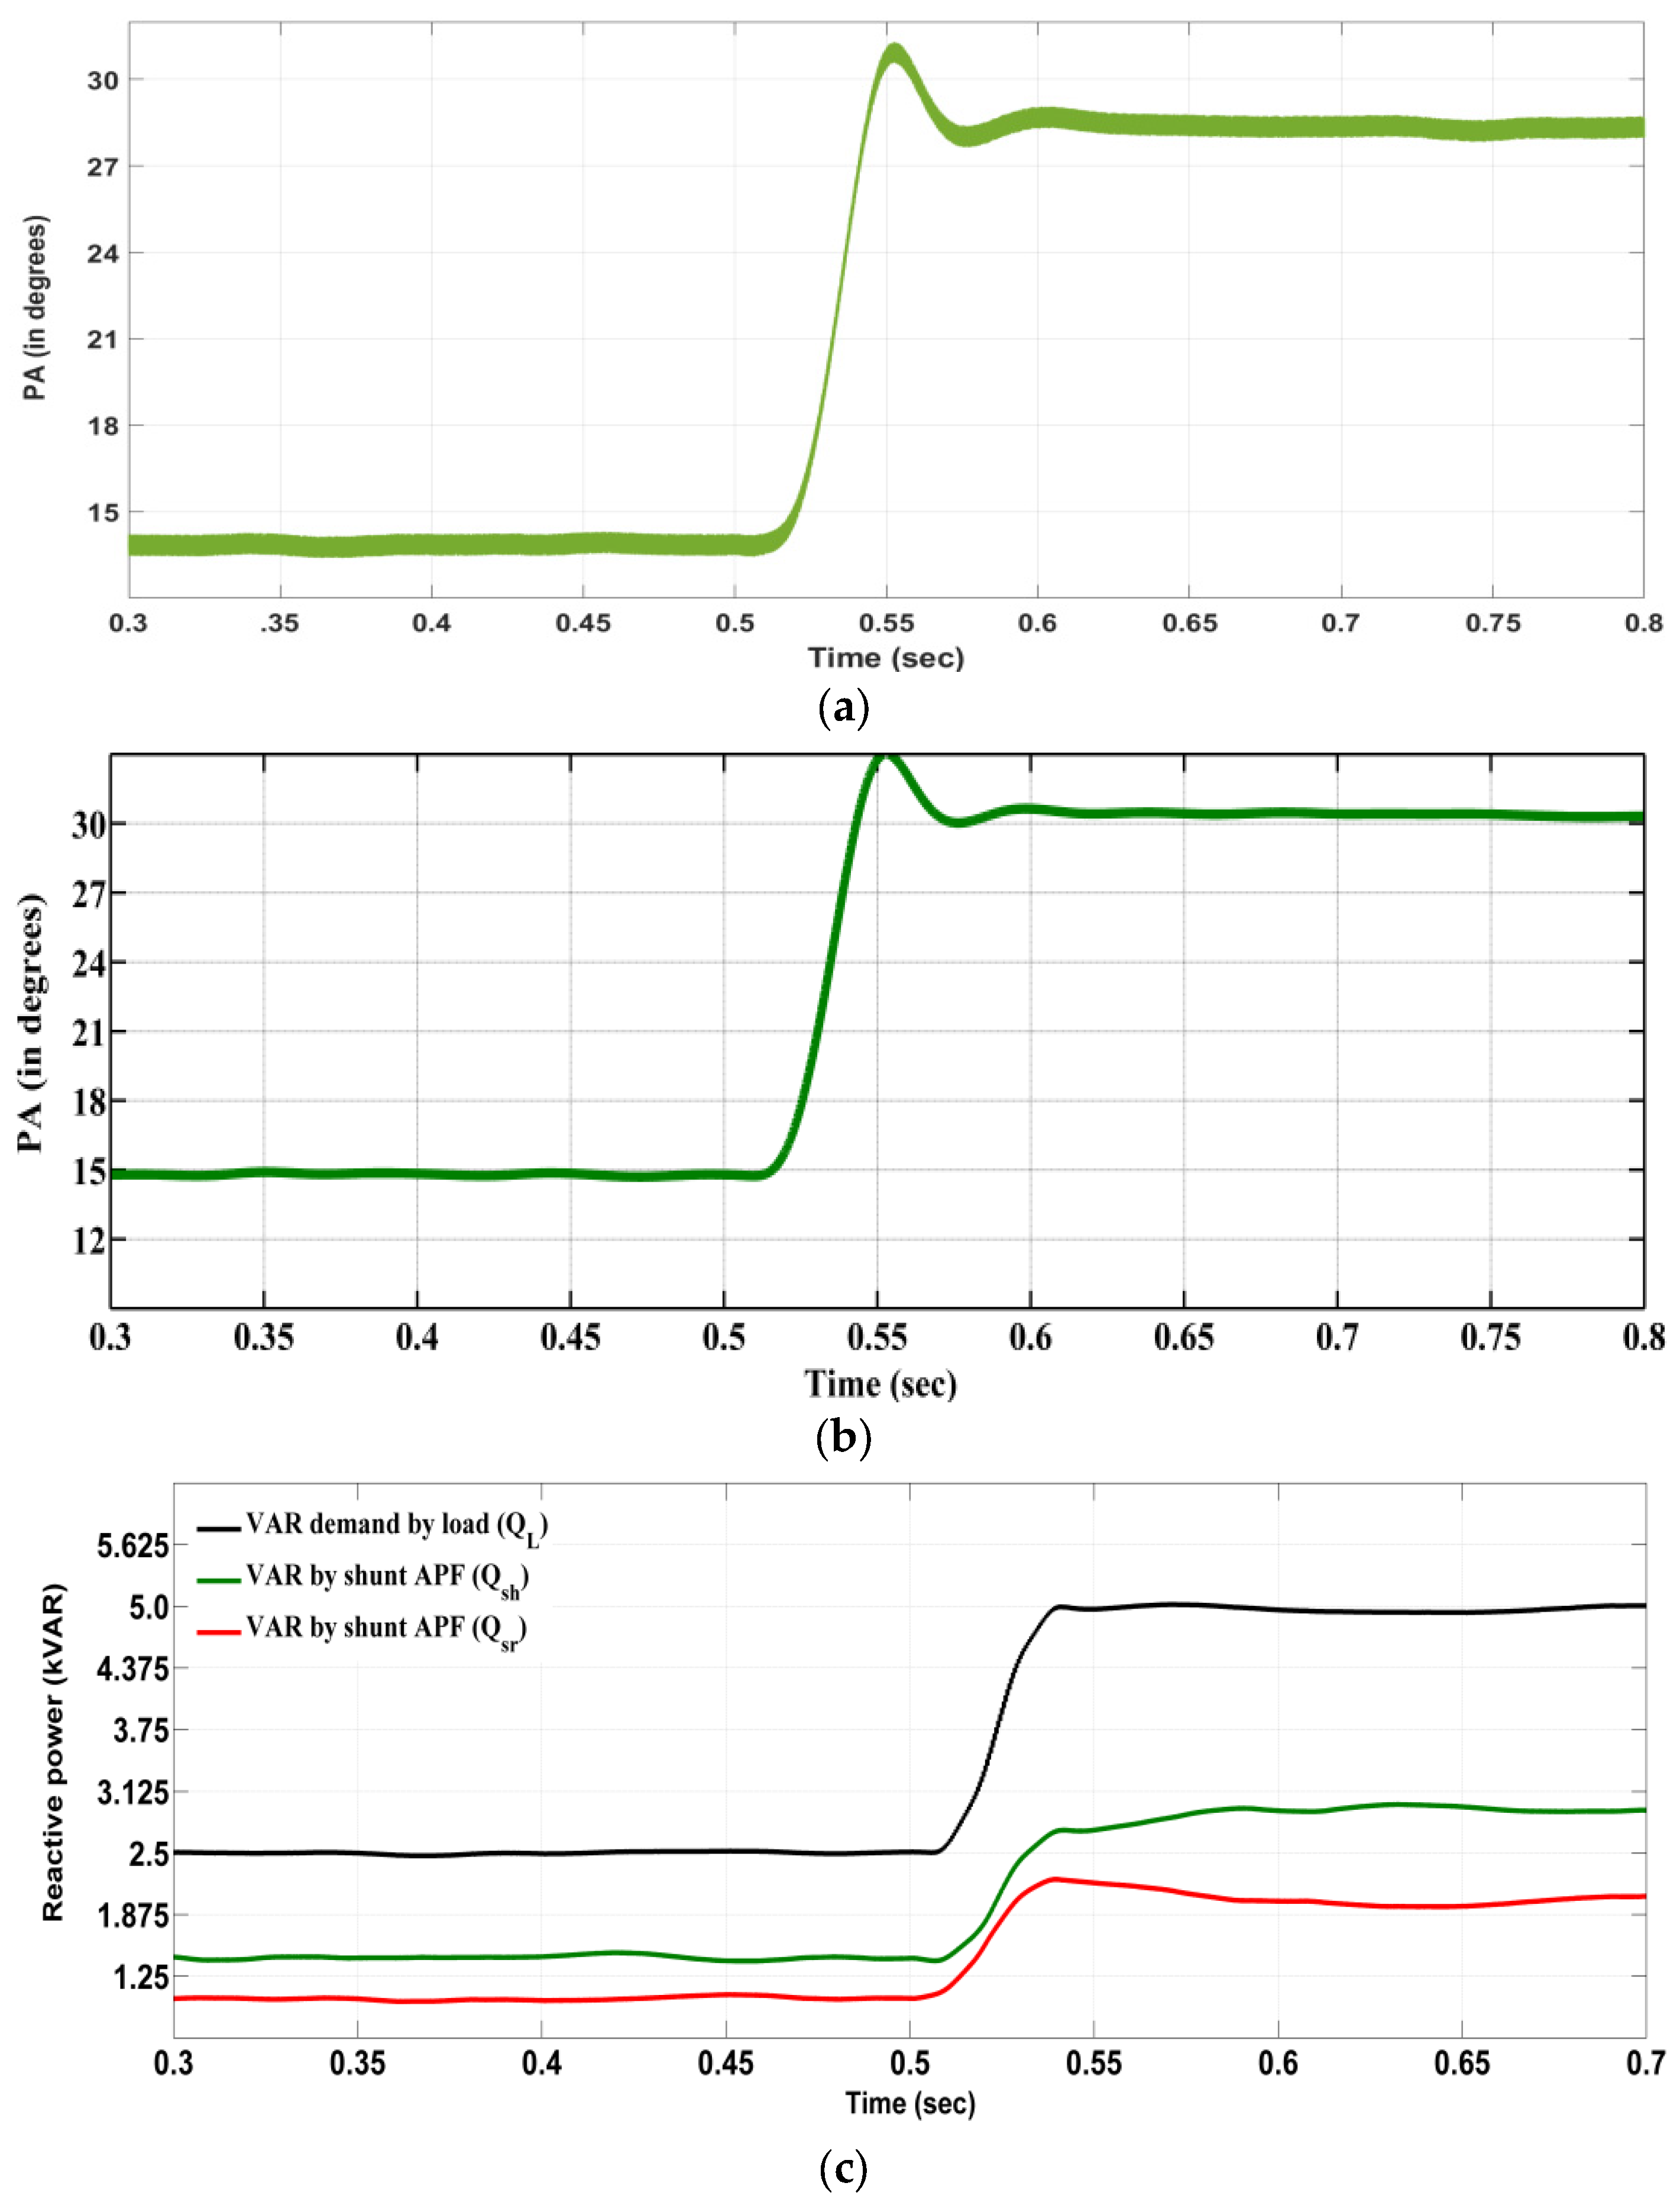
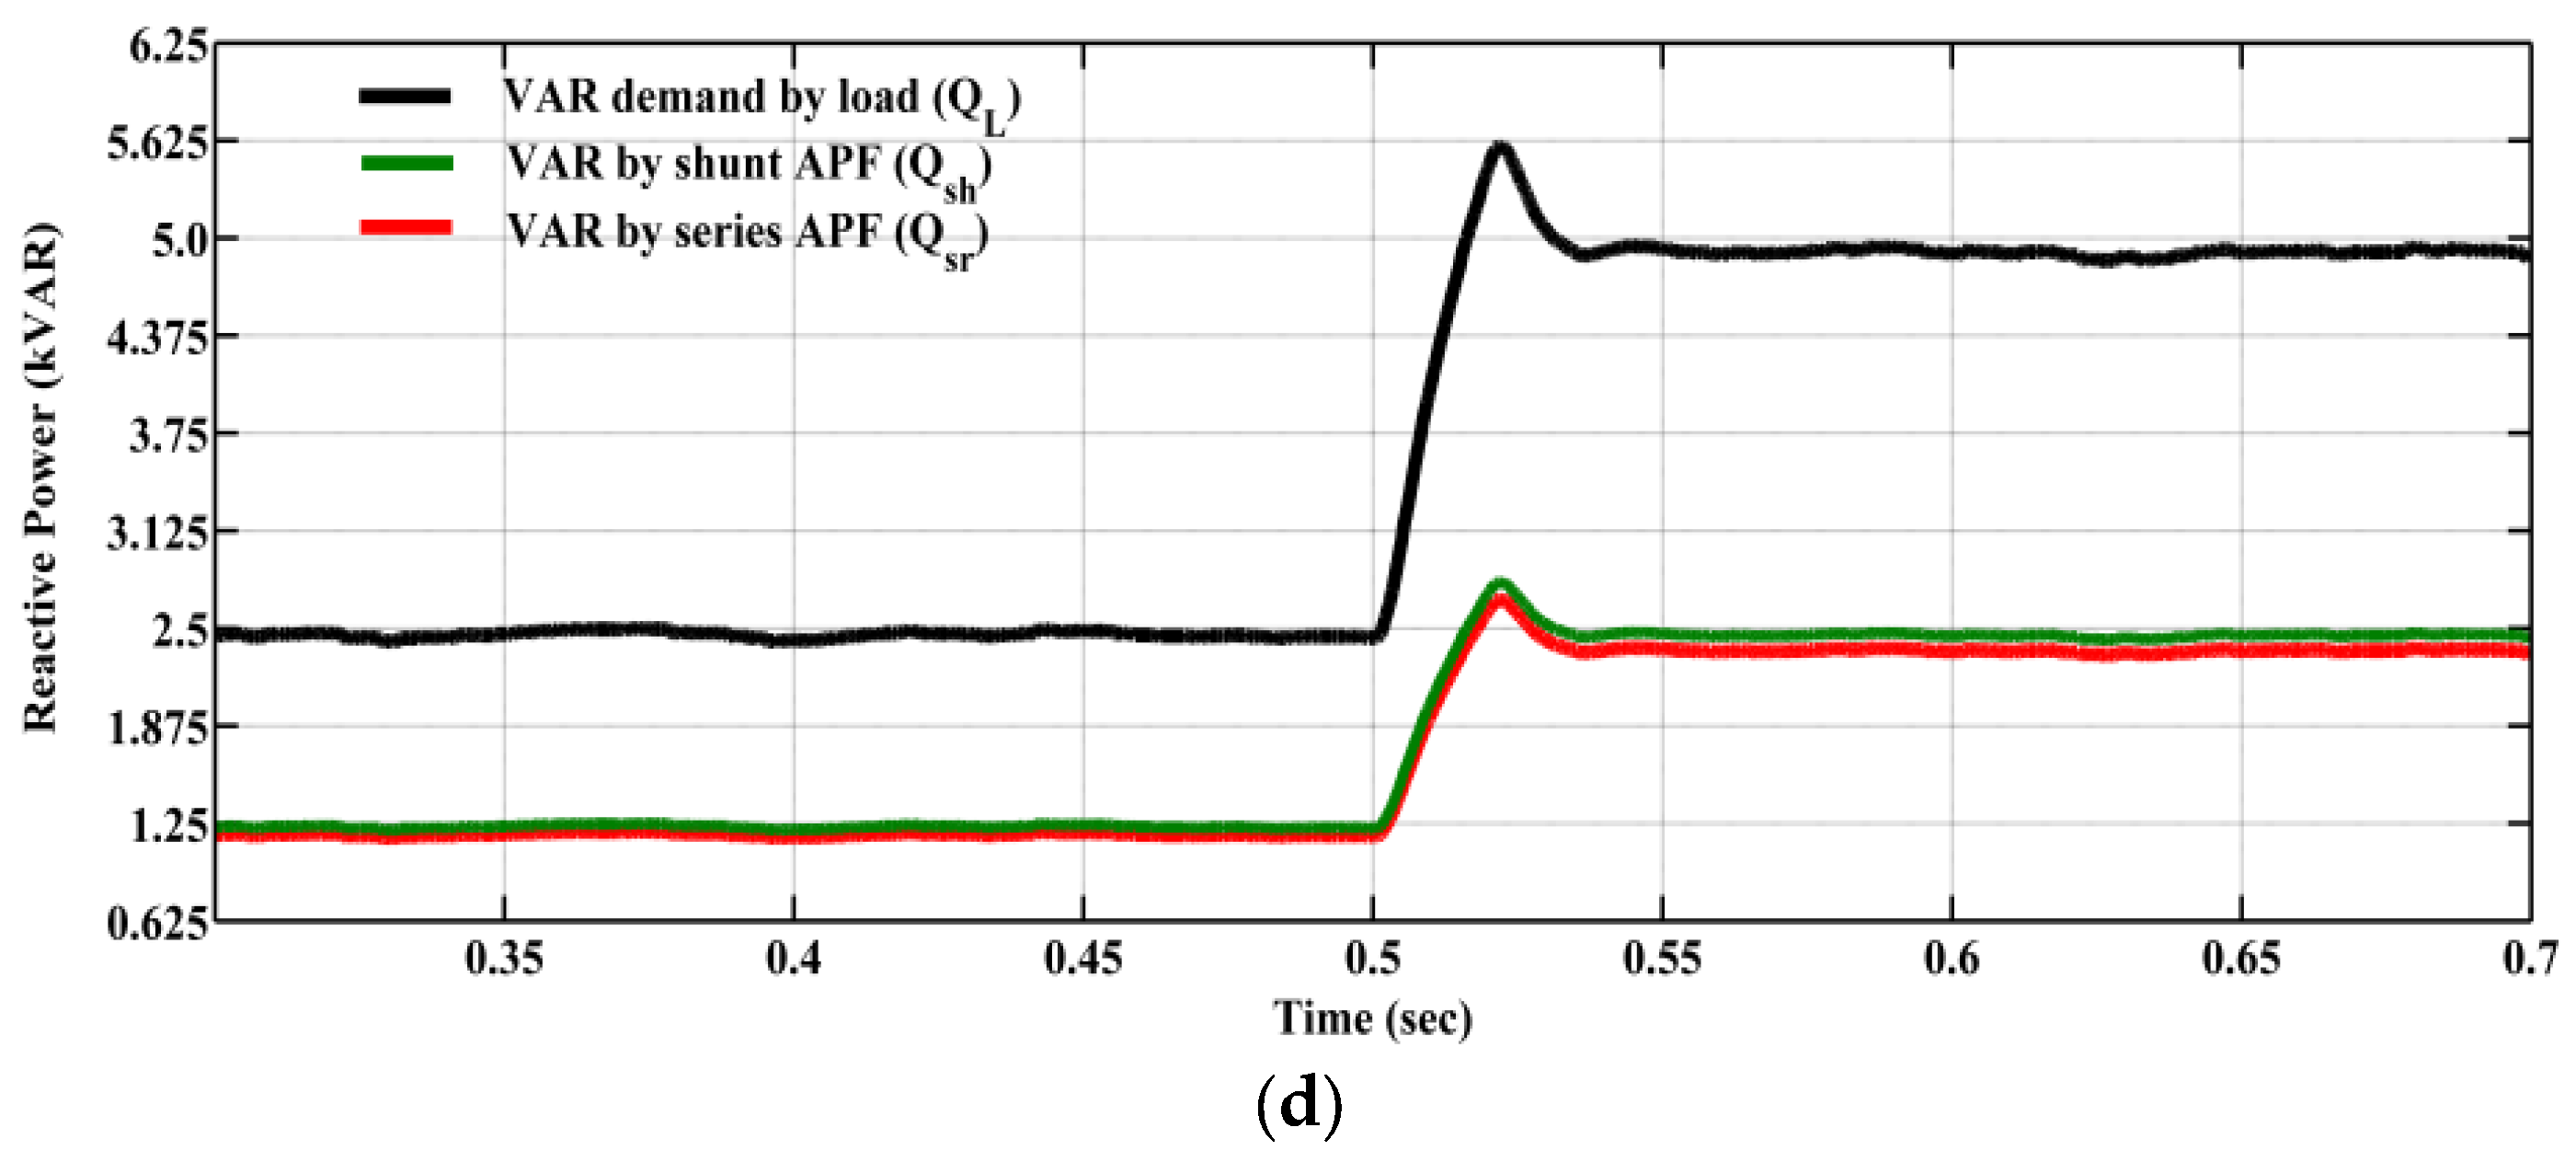
Two different PA estimation approaches were realized and a comparative analysis was presented; one was a conventional PA estimation based on the PQ concept and the second was the SRF-based PA estimation method [11,12]. A transient load condition of a sudden reactive load change was also considered. The reactive load demand was increased from 2.5 kVAr to 5 kVAr at 0.5 s. Figure 12a,b illustrates the PA estimation pattern for equal reactive power sharing based on the conventional PQ concept and the SRF concept, respectively. It was clearly observable that the PA with the PQ estimation method fluctuated and was also less than the reference value whereas the PA estimation with the SRF method followed the reference with fewer fluctuations. Both APFs with the SRF were found to be highly responsive to this sudden load change. These inconsistencies in the PA resulted in unequal reactive power sharing with the PQ concept, thus affecting the set criteria (Figure 12c). However, the PA with the SRF parameters resulted in more precise equal reactive power sharing, as depicted in Figure 12d. Table 3 illustrates a comparative analysis between the two approaches. Thus, it was clear that the SRF-based estimation of the PA involved fewer parameters for the estimation; the PA estimation errors and fluctuations were much fewer compared with the PQ method. Equal reactive power sharing between the shunt and series APF was more precise with fewer deviations from the reference (1.25 kVAR until 0.5 s and 2.5 kVAR after 0.5 s).
7. Real-Time Simulator Analysis
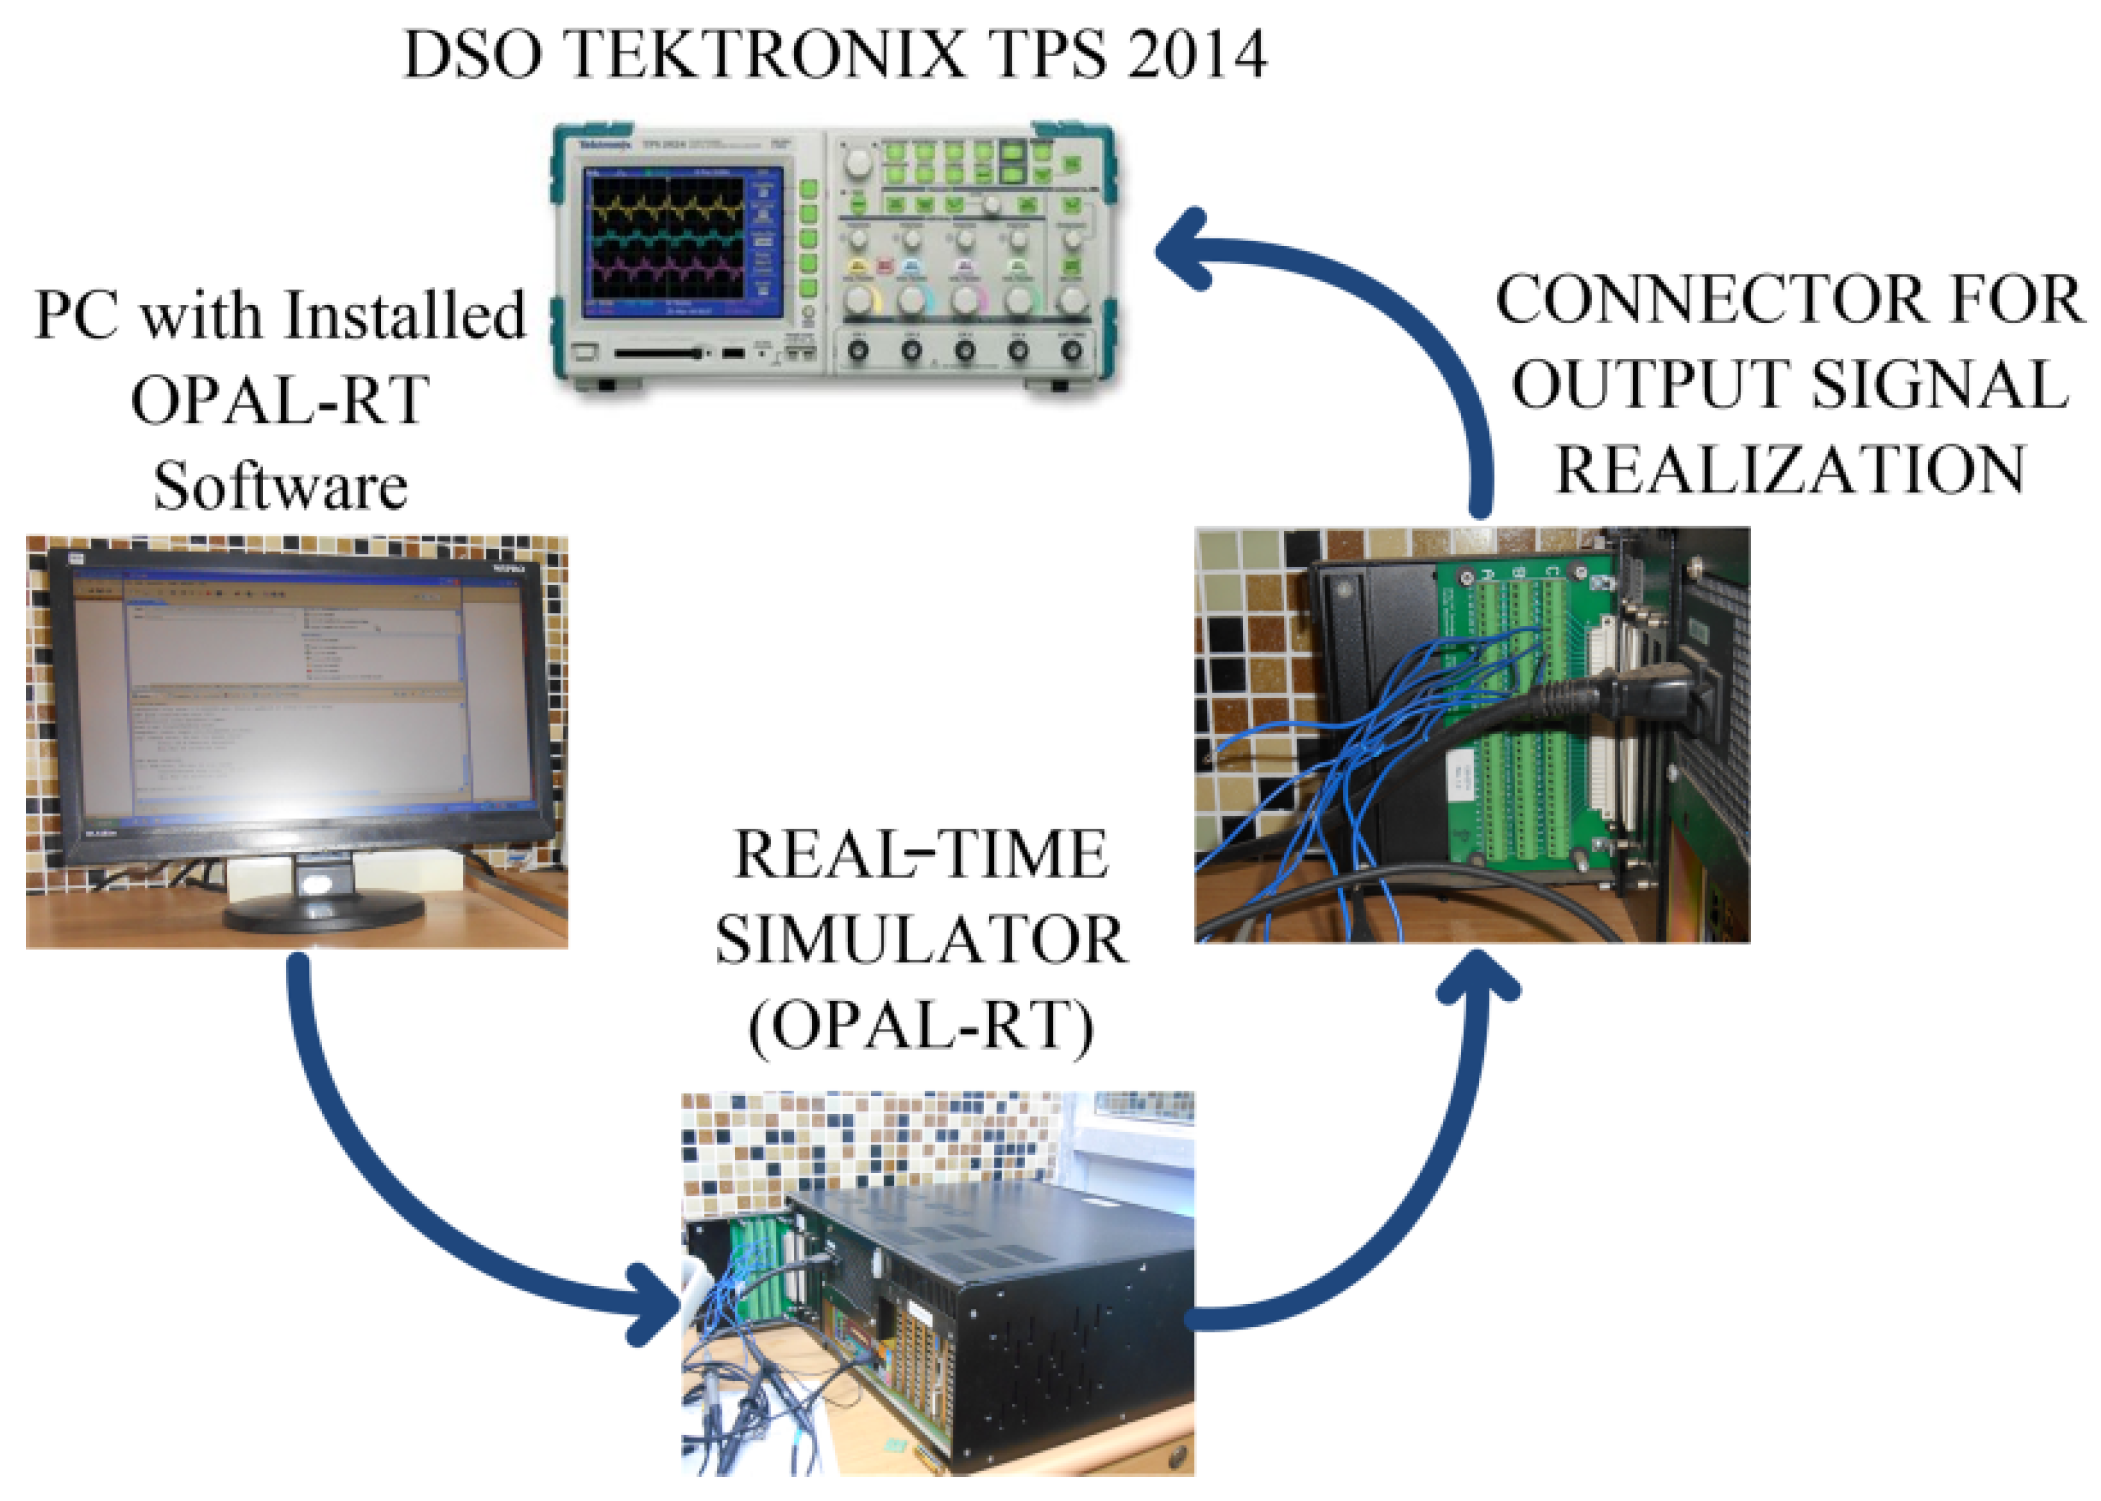
Simulators are useful in practice to protect equipment from being damaged. With the reduction in cost and increments in the performance of virtual and real-time simulative technology, its availability and applicability has been widespread [14]. The real-time simulator adapted in our work was RT-LAB, which is based on FPGA; its flexibility and scalability can be used for virtually any simulation or control system application.
A computer system with installed SIMULINK software was connected to the simulator setup via an ethernet, as shown in Figure 13. Instead of methods such as HIL (hardware in the loop), RCP (rapid control prototyping) was adapted for analyzing the behavior of the UPC system with the proposed controller.
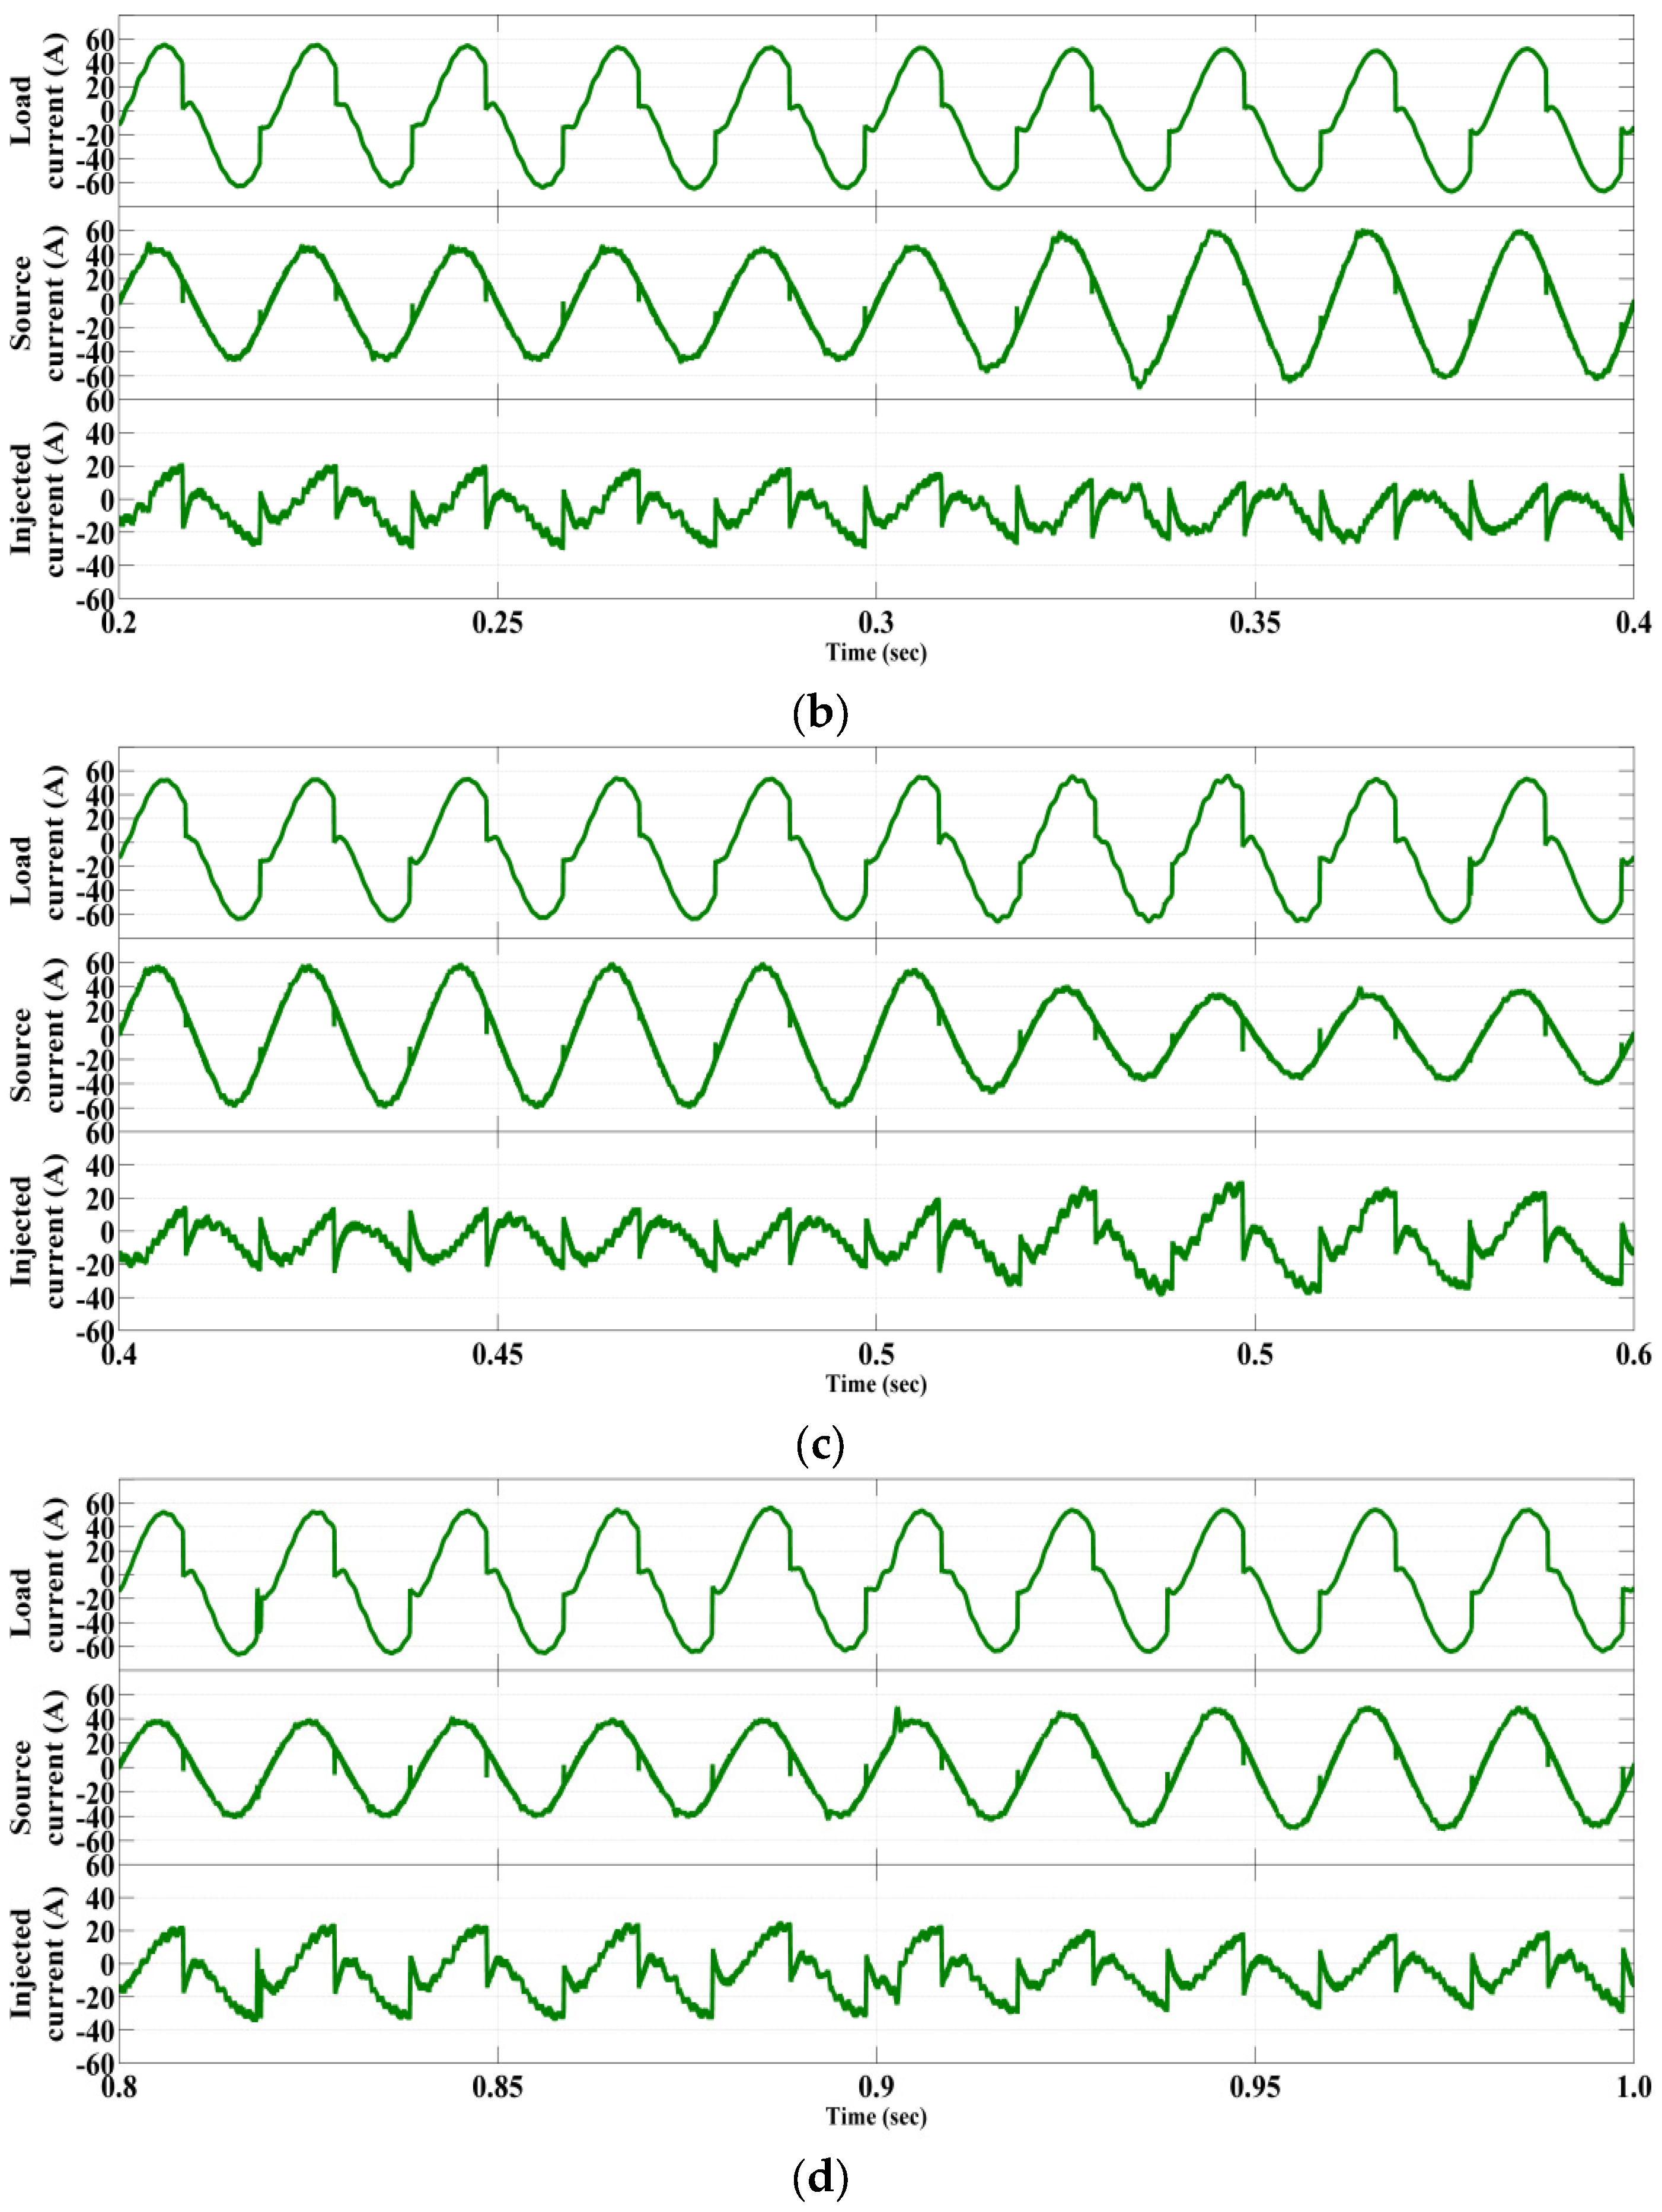
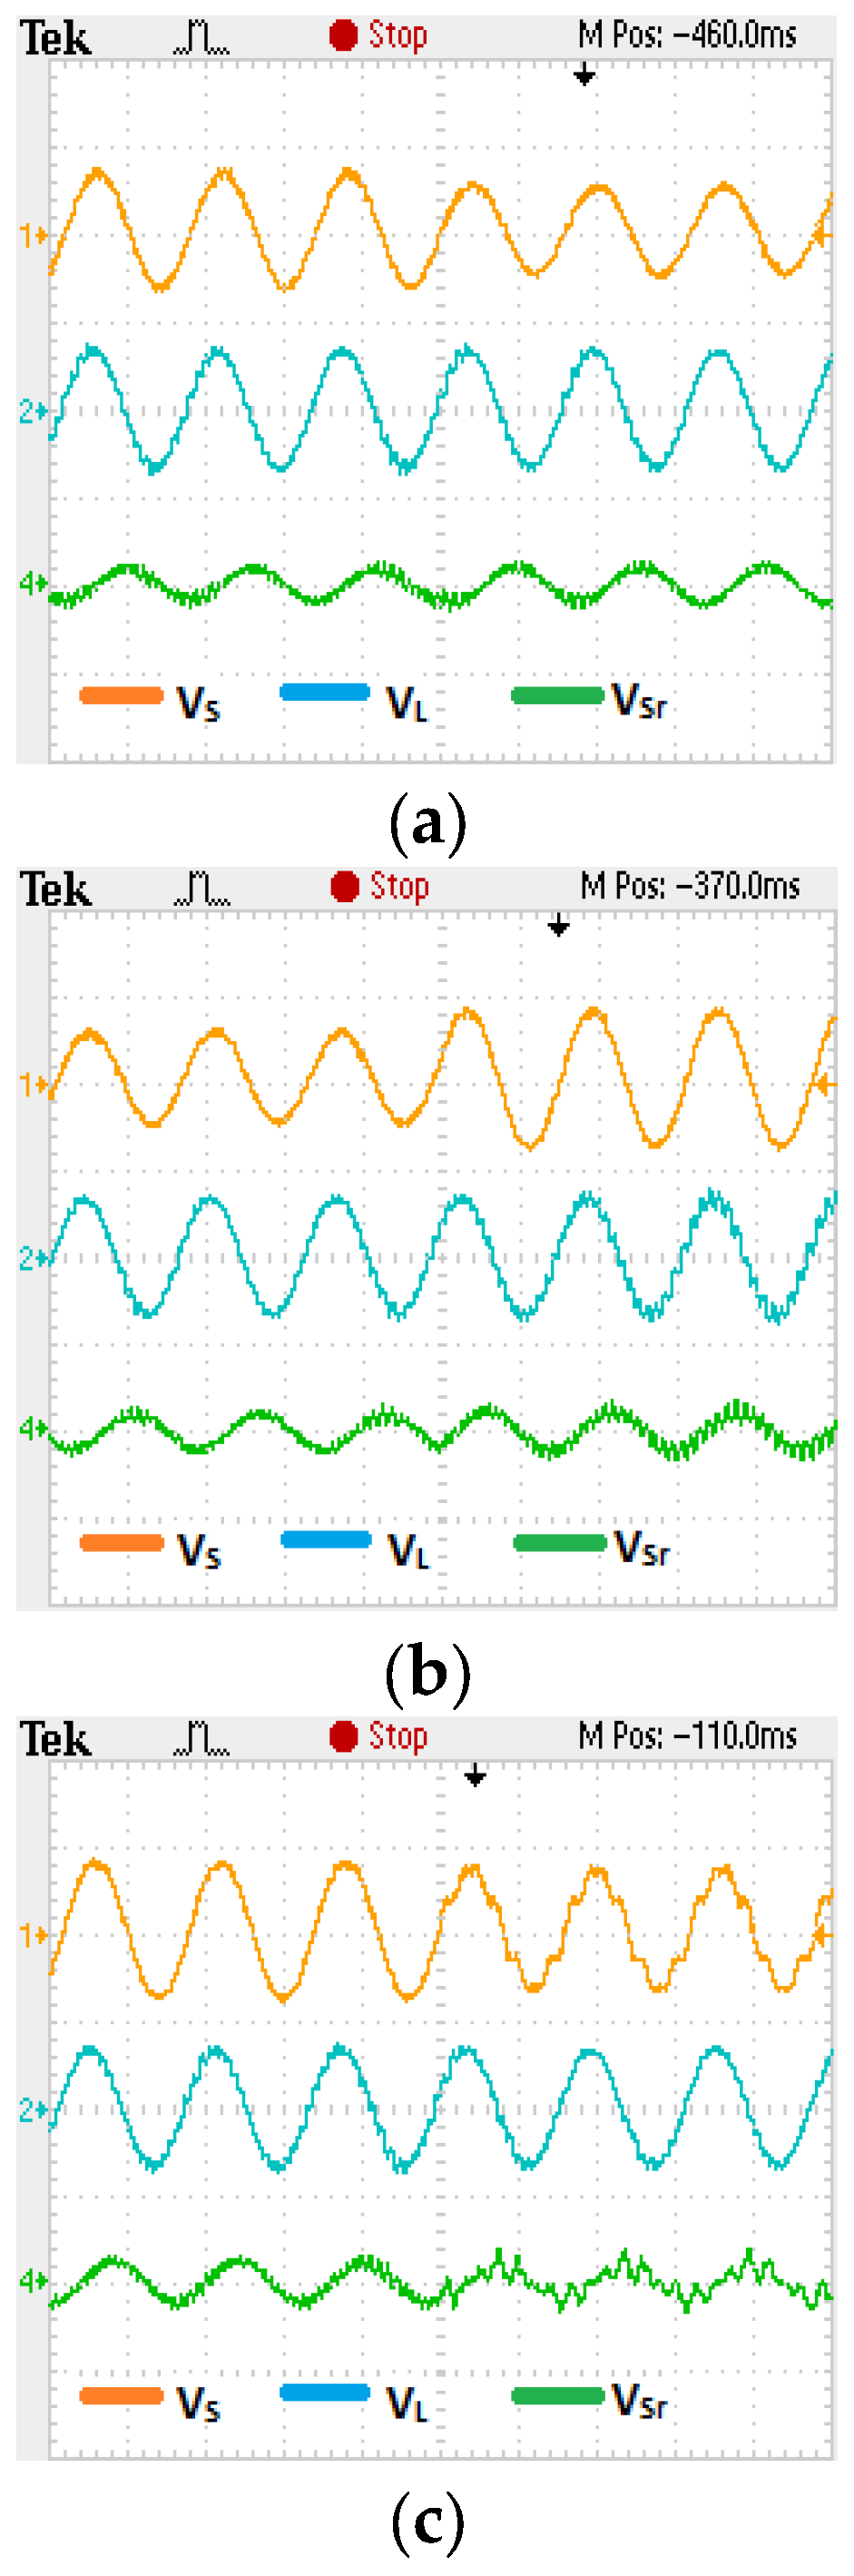
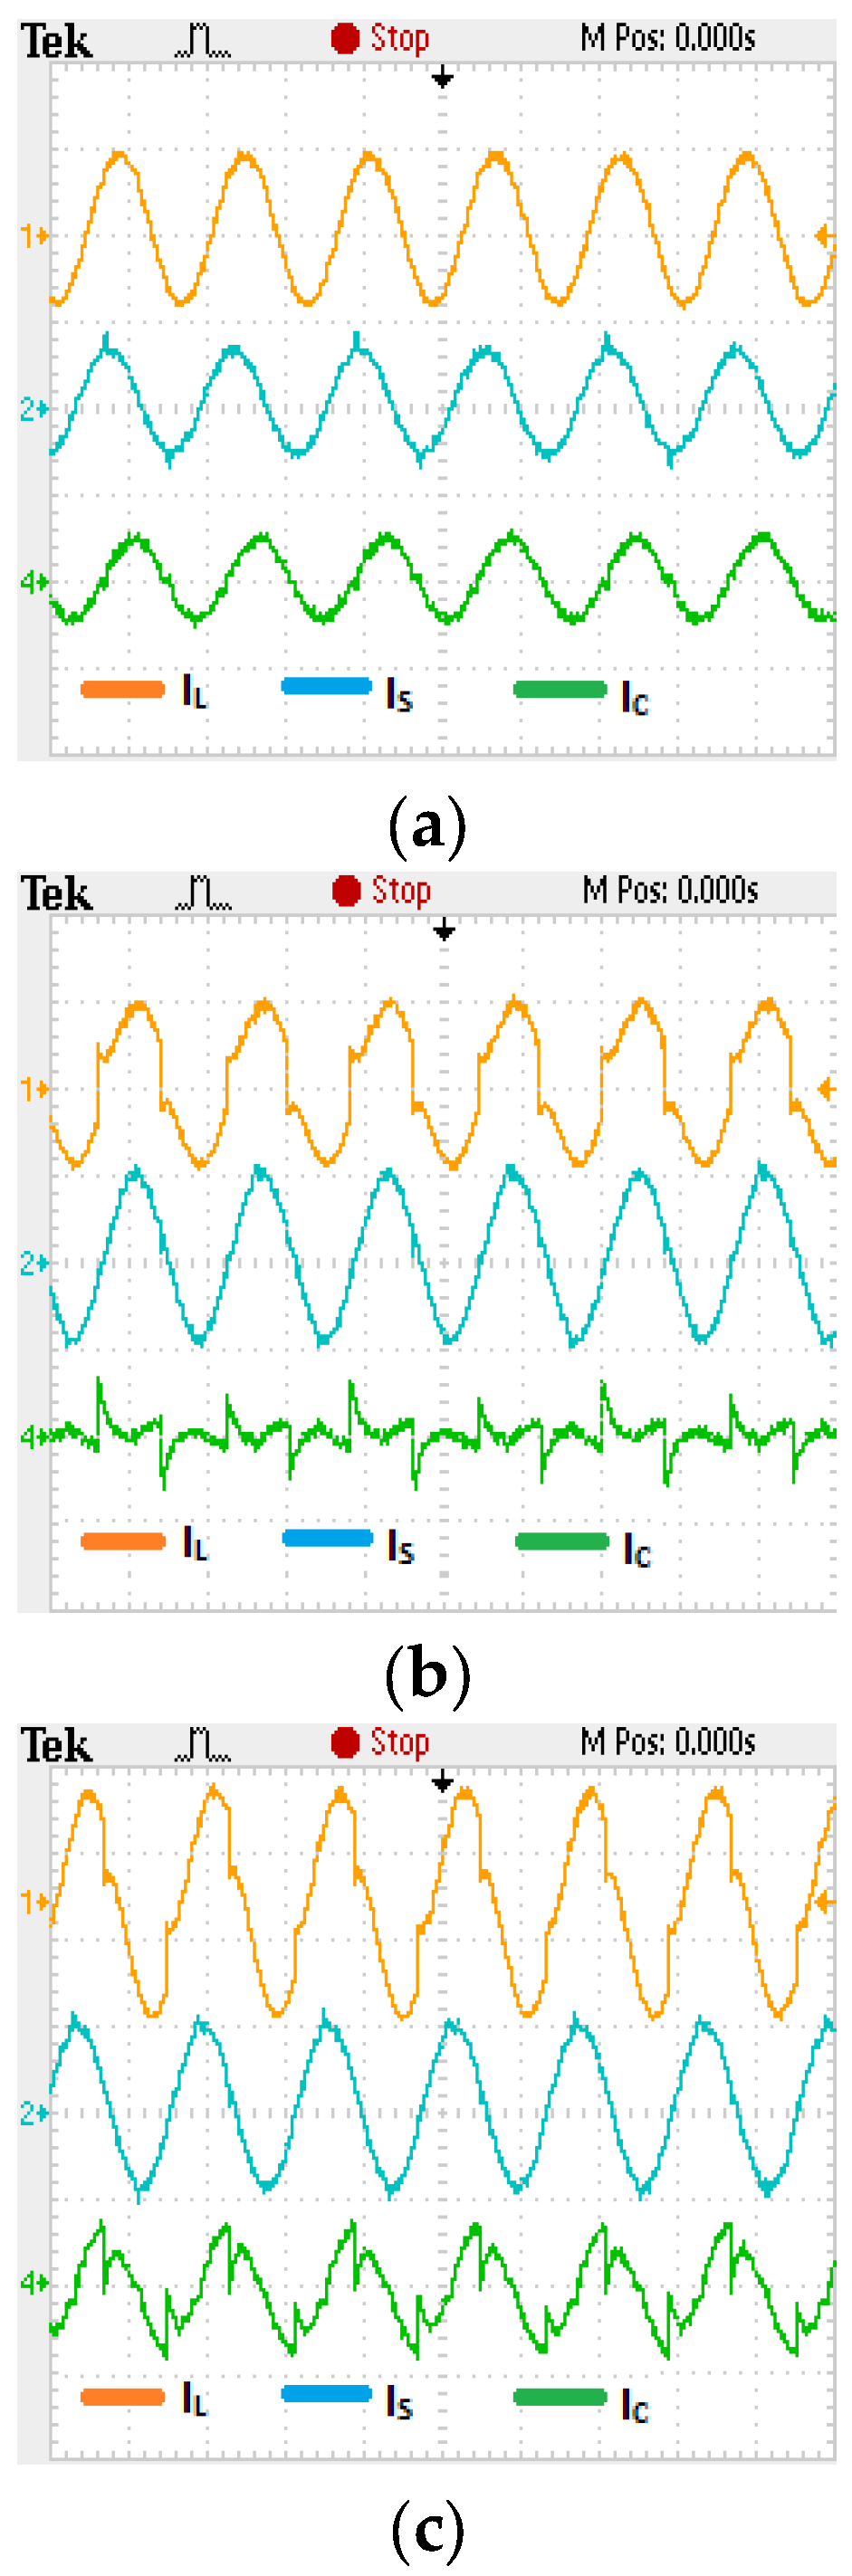
Figure 14 illustrates the waveforms of the source voltage, load voltage and series injected voltage for three different transient conditions of source voltage such as normal to sag (Figure 14a), sag to swell (Figure 14b) and swell condition to normal voltage with harmonics (Figure 14c). The series injected voltage compensated for the source voltage and the load voltage was found to be maintained at its rated value and free from harmonics irrespective of the disturbances. Figure 15 shows the waveforms of the load current, source current and compensating current for different load conditions of the linear load (Figure 15a), non-linear load (Figure 15b) and composite load (Figure 15c), respectively. The source current was found to be distortion-free in the case of the non-linear and composite loads. With the linear load condition, the presence of a compensating current was due to the partial load reactive current demand from the shunt APF; the remainder of the reactive current demand was fulfilled by the series APF.
8. Conclusions
An equal reactive power sharing strategy for a single-phase UPC system was proposed in this work as a more efficient and practical way of adapting identical APFs with the same rating. The SRF-based controller employed in this system for the shunt APF controller also proved to be helpful under non-sinusoidal conditions of supply voltage for a PA estimation to implement equal reactive power sharing. In this paper, a detailed performance analysis was presented for a UPC system under different supply voltages (i.e., voltage sag, swell and harmonics) and loading conditions (i.e., a non-linear load, linear load and composite load). The performance indices considered for this analysis were current harmonic compensation, load voltage compensation and reactive power compensation with equal sharing criteria between the shunt and series APF. It was clearly observed from the result analysis and tabular data compilation that the UPC system offered a significant compensation performance under different conditions of voltage and load. A comparative analysis was presented between the PQ method and the SRF method for current harmonic compensation, a PA estimation and equal reactive power sharing under a non-sinusoidal supply voltage. As deduced from this comparative analysis in terms of the results and comparative data tabulation, the SRF method proved to be superior than the PQ method under non-sinusoidal supply conditions. Thus, the SRF method is not only suitable for shunt APF control implementation, but also offers better reactive power sharing support under non-sinusoidal supply conditions between a shunt and series APF, utilizing only SRF parameters.
Author Contributions
Conceptualization, N.P., R.P. and B.S.; Data curation, N.P., R.P. and B.S.; Formal analysis, R.S. and A.E.-S.; Funding acquisition, N.P. and A.E.-S.; Investigation, R.P., R.S. and A.Y.A.; Methodology, N.P., R.P., R.S. and B.S.; Project administration, A.Y.A. and A.E.-S.; Resources, B.S., A.Y.A. and A.E.-S.; Software, N.P., R.S. and B.S.; Supervision, A.Y.A. and A.E.-S.; Validation, A.Y.A.; Writing—original draft, N.P. and R.S.; Writing—review & editing, A.E.-S. All authors have read and agreed to the published version of the manuscript.
Funding
This research received no external funding.
Institutional Review Board Statement
Not applicable.
Informed Consent Statement
Not applicable.
Data Availability Statement
Not applicable.
Conflicts of Interest
The authors declare no conflict of interest.
References
- Verma, P.K.; Goswami, G. Power Quality Issues Associated with Smart Grid: A Review. In Proceedings of the 10th International Conference on System Modeling & Advancement in Research Trends (SMART), Moradabad, India, 10–11 December 2021. [Google Scholar]
- Kannan, R.; Krishnan, B.; Porkumaran, K.; Prabakar, S.; Elamvazuthi, I.; Srinivasan, K. Power Quality Improvement Using UPQC for Grid Interconnected Renewable Energy Source. In Proceedings of the 8th International Conference on Intelligent and Advanced Systems (ICIAS), Kuching, Malaysia, 13–15 July 2021. [Google Scholar]
- Verma, R.; Gawre, S.K.; Patidar, N.P. An Extensive Study on Optimization and Control Techniques for Power Quality Improvement. In Proceedings of the IEEE 2nd International Conference on Electrical Power and Energy Systems (ICEPES), Bhopal, India, 10–11 December 2021. [Google Scholar]
- Sirigiri, D.; Das, N.; Bansal, R.C. Power Quality Issue and Mitigation Technique at High PV Penetration in Electricity Grid. In Proceedings of the 31st Australasian Universities Power Engineering Conference (AUPEC), Perth, Australia, 26–30 September 2021. [Google Scholar]
- Patnaik, N.; Panda, A.K. Comparative analysis on a shunt active power filter with different control strategies for composite loads. In Proceedings of the IEEE TENCON, Bangkok, Thailand, 22–25 October 2014. [Google Scholar]
- Reddy, C.R.; Prasad, A.G.; Sekhar, D.C.; Goud, B.S.; Kumari, K.; Kumar, M.D. Voltage Sag and Swell Compensation in Integrated System using Advanced UPQC. In Proceedings of the International Conference on Decision Aid Sciences and Application (DASA), Sakheer, Bahrain, 7–8 December 2021. [Google Scholar]
- Meng, L.; Ma, L.; Zhu, W.; Yan, H.; Wang, T.; Mao, W.; He, X.; Shu, Z. Control Strategy of Single-Phase UPQC for Suppressing the Influences of Low-Frequency DC-Link Voltage Ripple. IEEE Trans. Power Electron. 2022, 37, 2113–2124. [Google Scholar] [CrossRef]
- Ray, P.; Ray, P.K.; Dash, S.K. Power Quality Enhancement and Power Flow Analysis of a PV Integrated UPQC System in a Distribution Network. IEEE Trans. Ind. Appl. 2022, 58, 201–211. [Google Scholar] [CrossRef]
- Alam, S.J.; Arya, S.R. Volterra LMS/F based Control Algorithm for UPQC with Multi-Objective Optimized PI Controller Gains. IEEE J. Emerg. Sel. Top. Power Electron. 2022, in press. [Google Scholar] [CrossRef]
- Agarwal, N.K.; Saxena, A.; Prakash, A.; Singh, A.; Srivastava, A.; Baluni, A. Review on Unified Power Quality Conditioner (UPQC) to mitigate power quality problems. In Proceedings of the 2nd Global Conference for Advancement in Technology (GCAT), Bangalore, India, 1–3 October 2021. [Google Scholar]
- Khadkikar, V.; Chandra, A. A new control philosophy for a unified power quality conditioner (UPQC) to coordinate load-reactive power demand between shunt and series inverters. IEEE Trans. Power Deliv. 2008, 23, 2522–2534. [Google Scholar] [CrossRef]
- Khadkikar, V.; Chandra, A. UPQC-S: A Novel Concept of Simultaneous Voltage Sag/Swell and Load Reactive Power Compensations Utilizing Series Inverter of UPQC. IEEE Trans. Power Electron. 2011, 26, 2414–2425. [Google Scholar] [CrossRef]
- Arya, S.R.; Alam, S.J.; Ray, P. Control algorithm based on limit cycle oscillator-FLL for UPQC-S with optimized PI gains. CSEE J. Power Energy Syst. 2020, 6, 649–661. [Google Scholar]
- Patnaik, N.; Panda, A.K. Performance analysis of a 3 phase 4 wire UPQC system based on PAC based SRF controller with real time digital simulation. Int. J. Electr. Power Energy Syst. 2015, 74, 212–221. [Google Scholar] [CrossRef]
- Jeraldine Viji, A.; Victoire, T.A.A. Enhanced PLL based SRF control method for UPQC with fault protection under unbalanced load conditions. Int. J. Electr. Power Energy Syst. 2014, 58, 319–328. [Google Scholar] [CrossRef]
- Pal, Y.; Swaroop, A.; Singh, B. A comparative analysis of different magnetics supported three phase four wire unified power quality conditioners—A simulation study. Int. J. Electr. Power Energy Syst. 2013, 47, 436–447. [Google Scholar] [CrossRef]
- Modesto, R.A.; da Silva, S.A.O.; de Oliveira, A.A.; Bacon, V.D. A versatile unified power quality conditioner applied to three phase four wire distribution systems using a dual control strategy. IEEE Trans. Power Electron. 2016, 31, 5503–5514. [Google Scholar] [CrossRef]
- Panda, A.K.; Patnaik, N.; Patel, R. Power quality enhancement with PAC-SRF based single phase UPQC under non-ideal source voltage. In Proceedings of the IEEE INDICON, New Delhi, India, 17–20 December 2015. [Google Scholar]
- Garces-Gomez, Y.A.; Hoyos, F.E.; Candelo-Becerra, J.E. Classic Discrete Control Technique and 3D-SVPWM Applied to a Dual Unified Power Quality Conditioner. Appl. Sci. 2019, 9, 5087. [Google Scholar] [CrossRef] [Green Version]
- Panda, A.K.; Patnaik, N. Management of reactive power sharing & power quality improvement with SRF-PAC based UPQC under unbalanced source voltage condition. Int. J. Electr. Power Energy Syst. 2017, 84, 182–194. [Google Scholar]
- Sharma, A.; Gupta, N. GCDSC-PLL and PAC Based Control of Three-Phase Four-Wire UPQC for Power Quality Improvement. In Proceedings of the Fifth International Conference on Electrical Energy Systems (ICEES), Chennai, India, 21–22 February 2019. [Google Scholar]
- Soares, V.; Verdelho, P.; Marques, G.D. An Instantaneous Active and Reactive Current Component Method for Active Filters. Power Electron. IEEE Trans. 2000, 15, 660–669. [Google Scholar] [CrossRef]
Figure 1.
Single-phase UPC system with equal reactive power sharing approach.

Figure 2.
SRF method-based shunt APF.

Figure 3.
PAC-SRF-based series APF.

Figure 4.
Simulation results with composite load (linear and non-linear): source voltage, load voltage and series injected voltage (top to bottom) at (a) 0–1.2 s, (b) 0.2–0.4 s, (c) 0.5–0.7 s and (d) 0.8–1.0 s.
Figure 4.
Simulation results with composite load (linear and non-linear): source voltage, load voltage and series injected voltage (top to bottom) at (a) 0–1.2 s, (b) 0.2–0.4 s, (c) 0.5–0.7 s and (d) 0.8–1.0 s.


Figure 5.
Simulation results with composite load (linear and non-linear): source current before compensation, source current after compensation and injection current from shunt APF (top to bottom) at (a) 0–1.2 s, (b) 0.2–0.4 s, (c) 0.5–0.7 s and (d) 0.8–1.0 s.
Figure 5.
Simulation results with composite load (linear and non-linear): source current before compensation, source current after compensation and injection current from shunt APF (top to bottom) at (a) 0–1.2 s, (b) 0.2–0.4 s, (c) 0.5–0.7 s and (d) 0.8–1.0 s.


Figure 6.
Simulation result with composite load (linear and non-linear): DC-link voltage.

Figure 7.
Simulation results with linear load only: source current before compensation, source current after compensation and injection current from shunt APF (top to bottom).
Figure 7.
Simulation results with linear load only: source current before compensation, source current after compensation and injection current from shunt APF (top to bottom).

Figure 8.
Simulation results with non-linear load only: source current before compensation, source current after compensation and injection current from shunt APF (top to bottom) at (a) 0–1.2 s and (b) 0.3–0.6 s.
Figure 8.
Simulation results with non-linear load only: source current before compensation, source current after compensation and injection current from shunt APF (top to bottom) at (a) 0–1.2 s and (b) 0.3–0.6 s.


Figure 9.
Simulation results with non-linear load only: source voltage, load voltage and series injected voltage (top to bottom).
Figure 9.
Simulation results with non-linear load only: source voltage, load voltage and series injected voltage (top to bottom).

Figure 10.
Voltage analysis with UPC system under harmonic conditions: (a) source voltage; (b) load voltage; (c) FFT analysis of source voltage; (d) FFT analysis of load voltage.
Figure 10.
Voltage analysis with UPC system under harmonic conditions: (a) source voltage; (b) load voltage; (c) FFT analysis of source voltage; (d) FFT analysis of load voltage.


Figure 11.
Source current analysis with UPC system under non-sinusoidal voltage conditions: (a) source current waveform with PQ method; (b) source current waveform with SRF method; (c) FFT analysis of source current with PQ method; (d) FFT analysis of source current with SRF method.
Figure 11.
Source current analysis with UPC system under non-sinusoidal voltage conditions: (a) source current waveform with PQ method; (b) source current waveform with SRF method; (c) FFT analysis of source current with PQ method; (d) FFT analysis of source current with SRF method.


Figure 12.
Comparative performance analysis between PQ and SRF methods: (a) PA estimation by PQ method; (b) PA estimation by SRF method; (c) reactive power share by PQ method; (d) reactive power share by SRF method.
Figure 12.
Comparative performance analysis between PQ and SRF methods: (a) PA estimation by PQ method; (b) PA estimation by SRF method; (c) reactive power share by PQ method; (d) reactive power share by SRF method.


Figure 13.
OPAL-RT simulator connected to the host PC via ethernet and to the DSO via connecting probes.
Figure 13.
OPAL-RT simulator connected to the host PC via ethernet and to the DSO via connecting probes.

Figure 14.
OPAL-RT results of source voltage (VS), load voltage (VL) and series injected voltage (VSr) for different disturbance conditions: (a) normal to sag; (b) sag to swell; (c) swell to normal with harmonics.
Figure 14.
OPAL-RT results of source voltage (VS), load voltage (VL) and series injected voltage (VSr) for different disturbance conditions: (a) normal to sag; (b) sag to swell; (c) swell to normal with harmonics.

Figure 15.
OPAL-RT results of load current (IL), source current (IS) and compensating current (IC) for different load conditions: (a) linear load only; (b) non-linear load only; (c) composite load (both linear and non-linear).
Figure 15.
OPAL-RT results of load current (IL), source current (IS) and compensating current (IC) for different load conditions: (a) linear load only; (b) non-linear load only; (c) composite load (both linear and non-linear).


Table 1.
Parameters for simulation and real-time analysis.
| Supply system | Source impedance | R = 0.06 Ω, L = 0.05 mH |
| Source voltage | 230 V (RMS), 50 Hz | |
| Shunt APF | Coupling inductor | 2.0 mH |
| PI parameters | Kp = 0.2, KI = 10.34 | |
| Series APF | Filter components | L = 1.5 mH, C = 65 µF |
| Transformer | 1:1, 3 kVA | |
| DC-link | Capacitor | 1600 µF |
| Desired voltage | 350 V | |
| Load system | Linear load | Pmax = 5 kW, Qmax = 5 kVAR |
| Non-linear load | One-phase diode bridge rectifier with R = 8 Ω, L = 10.5 mH |
Table 2.
Performance parameters under different source voltage and loading conditions.
| Composite Load | Linear Load Only | Non-Linear Load Only | |||||||||||||||||||
|---|---|---|---|---|---|---|---|---|---|---|---|---|---|---|---|---|---|---|---|---|---|
| Voltage Condition | I | II | III | IV | V | VI | VII | I | II | III | IV | V | VI | VII | I | II | III | IV | V | VI | VII |
| Normal | 228 | 227 | 0.5 | 4.0 | 9.9 | 3.4 | QSH = 3015 QSR = 2962 | 229 | 227 | 0.4 | 4.4 | 0.4 | 3.3 | QSH = 2563 QSR = 2495 | 228 | 228 | 0.5 | 2.22 | 18.5 | 3.6 | - |
| Sag (20%) | 180 | 225 | 0.5 | 3.7 | 9.8 | 3.8 | QSH = 3045 QSR = 2923 | 182 | 226 | 0.5 | 3.4 | 0.5 | 3.2 | QSH = 2542 QSR = 2478 | 180 | 226 | 0.5 | 3.26 | 18.63 | 3.6 | - |
| Swell (20%) | 275 | 229 | 0.5 | 2.2 | 9.0 | 3.3 | QSH = 3023 QSR = 2943 | 273 | 232 | 0.3 | 3.2 | 0.4 | 3.4 | QSH = 2558 QSR = 2423 | 275 | 227 | 0.5 | 3.55 | 16.78 | 3.7 | - |
| Harmonics (10% each 3rd, 5th and 7th) | 230 | 226 | 17.4 | 3.0 | 9.7 | 4.6 | QSH = 3010 QSR = 2941 | 227 | 225 | 17.2 | 4.7 | 0.9 | 3.5 | QSH = 2574 QSR = 2456 | 230 | 226 | 17.26 | 4.08 | 20.65 | 3.9 | - |
Table 3.
Comparative analysis between PQ and SRF methods for PA estimation.
| Performance factors | PQ-based estimation of PA | SRF-based estimation of PA |
| Parameters involved | Load voltage and load current | Only load current |
| PA estimation error with reference | 8% | 2% |
| PA fluctuation with average | 6.5% approximately | 1.5% approximately |
| Percent error in equal reactive power sharing between shunt and series APF | For QL = 2.5 kVAR: Qsh = 16%, QSr = −17.6% For QL = 5 kVAR: Qsh = 18%, QSr = −20% | For QL = 2.5 kVAR: QSh = 1.5%, QSr = −2.3% For QL = 5 kVAR: QSh = 1.1%, QSr = −2.6% |
Publisher’s Note: MDPI stays neutral with regard to jurisdictional claims in published maps and institutional affiliations. |
© 2022 by the authors. Licensee MDPI, Basel, Switzerland. This article is an open access article distributed under the terms and conditions of the Creative Commons Attribution (CC BY) license (https://creativecommons.org/licenses/by/4.0/).
Share and Cite
MDPI and ACS Style
Patnaik, N.; Pandey, R.; Satish, R.; Surakasi, B.; Abdelaziz, A.Y.; El-Shahat, A. Single-Phase Universal Power Compensator with an Equal VAR Sharing Approach. Energies 2022, 15, 3769. https://0-doi-org.brum.beds.ac.uk/10.3390/en15103769
AMA Style
Patnaik N, Pandey R, Satish R, Surakasi B, Abdelaziz AY, El-Shahat A. Single-Phase Universal Power Compensator with an Equal VAR Sharing Approach. Energies. 2022; 15(10):3769. https://0-doi-org.brum.beds.ac.uk/10.3390/en15103769
Chicago/Turabian StylePatnaik, Nishant, Richa Pandey, Raavi Satish, Balamurali Surakasi, Almoataz Y. Abdelaziz, and Adel El-Shahat. 2022. "Single-Phase Universal Power Compensator with an Equal VAR Sharing Approach" Energies 15, no. 10: 3769. https://0-doi-org.brum.beds.ac.uk/10.3390/en15103769
Note that from the first issue of 2016, this journal uses article numbers instead of page numbers. See further details here.