
The Role of Crypto Trading in the Economy, Renewable Energy Consumption and Ecological Degradation


1
Faculty of Economics, Finance and Management, University of Szczecin, 70-453 Szczecin, Poland
2
Luma Holding, 4010 St. Julian, Malta
3
Liberal Economics Unit, Warsaw School of Economics, 02-554 Warsaw, Poland
*
Author to whom correspondence should be addressed.
Energies 2022, 15(10), 3805; https://0-doi-org.brum.beds.ac.uk/10.3390/en15103805
Submission received: 6 May 2022
/
Revised: 18 May 2022
/
Accepted: 19 May 2022
/
Published: 22 May 2022
(This article belongs to the Special Issue Green Economics and Sustainable Management of Energy Sources)
Abstract
:The rapid growth of information technology and industrial revolutions provoked digital transformation of all sectors, from the government to households. Moreover, digital transformations led to the development of cryptocurrency. However, crypto trading provokes a dilemma loop. On the one hand, crypto trading led to economic development, which allowed attracting additional resources to extending smart and green technologies for de-carbonising the economic growth. On the other hand, crypto trading led to intensifying energy sources, which provoked an increase in greenhouse gas emissions and environmental degradation. The paper aims to analyse the connections between crypto trading, economic development of the country, renewable energy consumption, and environmental degradation. The data for analysis were obtained from: Our World in Data, World Data Bank, Eurostat, Ukrstat, Crystal Blockchain, and KOF Globalisation Index. To check the hypothesis, the paper applied the Pedroni and Kao panel cointegration tests, FMOLS and DOLS panel cointegration models, and Vector Error Correction Models. The findings concluded that the increasing crypto trading led to enhanced GDP, real gross fixed capital formation, and globalisation. However, in the long run, the relationship between crypto trading and the share of renewable energies in total energy consumption was not confirmed by the empirical results. For further directions, it is necessary to analyse the impact of crypto trading on land and water pollution.
1. Introduction
The innovation development, industry revolution, and digital transformation provoke the development of a new currency type—cryptocurrency. The main feature of cryptocurrency is its apolitical and decentralised nature [1]. The study [2] called cryptocurrency the most significant innovation of this century. Bitcoins appeared in 2008 and restructured the financial market. Considering the official report of the company Triple A [3], the bitcoin price has increased by 540% in the period from 2012 to 2021. Moreover, the experts forecast that the cryptocurrency market will continue to grow with a compound annual growth rate of 56.4% from 2019 to 2025 [3]. Considering [3] in 2021, Ukraine has the highest share of the crypto owners’ population—12.73%; Venezuela—10.34%; and the USA—8.31%.
The study [4] analysed the perspectives of bioeconomy development as the way for the EU countries to achieve the indicated goals of green growth based on smart and innovative technologies. Thus, Chiriac I. highlighted that cryptocurrency was the core financial source of bioeconomy development [4]. At the same time, cryptocurrency development requires a high volume of electrical energy consumption, which leads to environmental degradation. Considering the Bitcoin Energy Consumption Index [5], total bitcoin footprints could be characterised as follows:
- Electricity consumption is 204.50 TWh (Terawatt-hour) which is comparable to the power consumption of Thailand;
- The carbon footprint is 114.06 Mt of CO2, which is comparable to the carbon footprint of the Czech Republic;
- The electronic waste is 34.36 kt which is comparable to the small IT equipment waste of the Netherlands [5].
Moreover, a single bitcoin transaction led to 358.10 g of electronic waste. It is equivalent to the weight of 2.18 iPhones 12 or 0.73 iPads [5].
Thus, crypto trading provokes a dilemma loop: on the one hand, crypto trading led to economic development, which allows attracting additional resources to extending smart and green technologies for decarbonising economic growth; on the other hand, crypto trading led to the intensification of energy sources, the use of which provoked an increase in greenhouse gas emissions and environmental degradation. Thus, the paper aims to analyse the links between crypto trading, economic development of the country, renewable energy consumption, and environmental degradation.
The paper has the following structure: the Section 1 highlights the topicality of the paper’s purpose; the Section 2 analyses the critical view on crypto trading development to justify the research hypothesis; the Section 3 explains the methodology and steps of the research; the fourth part contains the findings on links between crypto trading, economic development of the country, renewable energy consumption, and environmental degradation; and the fifth part summarises the research results and compares them with the previous results.
2. Literature Review
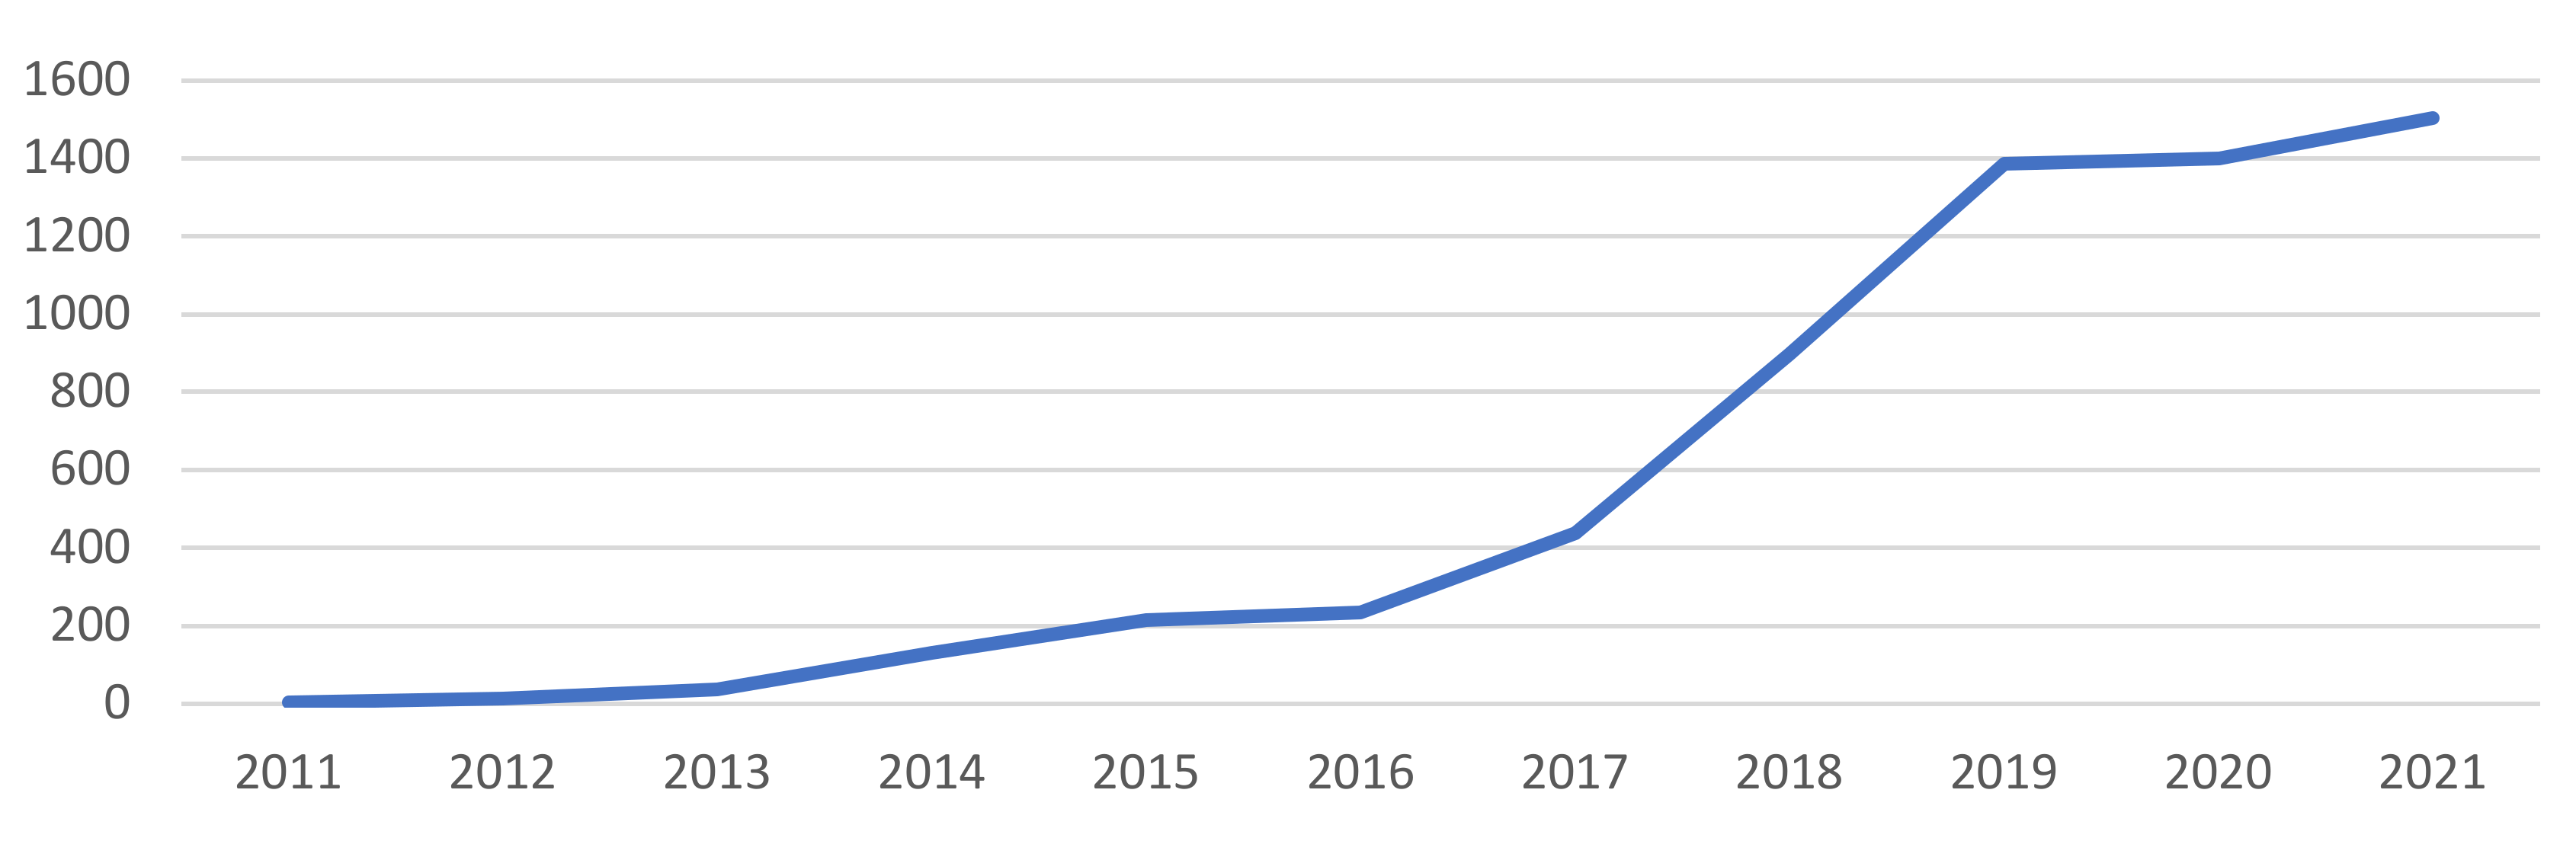
The rapid penetration of innovations and information technologies in all spheres provoked the snowballing digitalisation of all economic sectors (financial, energy, agriculture, etc.) [6,7,8,9,10,11,12,13,14,15,16,17,18,19,20,21,22,23,24,25]. The dynamics of the research publications on cryptocurrency development has demonstrated the rapid growth since 2015. In 2021, the number of publications showed a 6-times increase compared to 2015 (Figure 1). The following parameters were applied for analysis:
- Keywords: cryptocurrency, bitcoin*;
- Boolean operators: OR;
- Subject areas: Business, Management, Accounting, Economics, Econometrics and Finance;
- Year: 2011–2021;
- Language: English.
Moreover, most papers were published by scientists from the United States of America, China, India, the United Kingdom, and Germany. These findings confirmed that the scientists’ interests have been increasing from year to year, highlighting the theme’s topicality.
Figure 1.
The dynamic of publications on researching cryptocurrency development (Scopus data).

Cryptocurrency development was highlighted by the worldwide community as a dilemma of future growth. Scientists [4,26,27,28,29,30,31,32,33,34,35] confirmed that cryptocurrency was the power for future economic growth. At the same time, studies showed that the development of cryptocurrency provoked the intensification of greenhouse gas emissions. Consequently, this could restrict reaching the goals of a decarbonised economy and mitigate climate changes under the Green Deal Policy and Sustainable Development Goals. In this case, it is topical to analyse the cryptocurrency development from different points of view.
2.1. Economic Growth and Cryptocurrency
The industry revolution provoked the development of blockchain technologies and transformation of the economy [16,17,18,19,20,21,22,23,24,25], education [26,27,28], and financial market [29,30,31,32], which boosted economic growth. Thus, it led to the development of cryptocurrency. The digital currency allowed the contractual costs to decline and transformed the institutional framework of economic growth [32]. Masharsky and Skvortsov [33] justified the positive role of cryptocurrency in economic development. At the same time, they concluded the necessity of relevant government reregulation in the financial market. The study [34] confirmed that bitcoin influenced economic growth positively. At the same time, the shocks in the bitcoin market destroyed the stable traditional market, impacted on investors’ decisions, and reduced the macroeconomic indicators. The opposite conclusion was obtained in the paper [35], which confirmed that the exchange rate had a positive, statistically significant impact on bitcoin prices, while influencing the economic openness negatively. The study [36] concluded that bitcoin complicated the monetary policy and could restrict stable economic development.
2.2. Cryptocurrency and Energy Consumption
The paper [37] emphasised that the crypto market’s development led to an increase in energy consumption. However, de Vries A. indicated that the bitcoin boom provoked rapid economic growth and changes in financial market architecture [37]. Trubby J. [38] justified that bitcoin led to increasing energy consumption. However, he emphasised that a relevant law and fiscal policy could decolonise bitcoin and allow a reduction in energy consumption. The studies [39,40,41,42,43,44,45,46,47,48,49,50,51,52] confirmed that energy consumption is a core factor of a country’s energy security. Moreover, the economic dependence on energy sources and ecological issues required renewable energy development and increasing their share in total energy consumption. In this case, the country should allocate alternative financing sources to enhance renewable energy in the country. Considering the findings of the bibliometric analyses in the studies [53,54,55,56,57,58,59,60,61], the energy consumption should be greening through the development of smart and digital technologies, alternative energies, blockchain technology, and incentive financial instruments. Thus, the paper [61] confirmed that innovative approaches and smart technologies promoted renewable energies in the country.
Furthermore, the studies [62,63] concluded that a smart grid is a key to declining energy consumption from the traditional sources and increasing from renewable ones. Moreover, the studies [64,65] emphasised that extending energy resources required additional financing. It should be noted that the study [66] remarked that if the bitcoin cost was lower than the energy cost, it limited the bitcoin mining. O’Dwyer and Malone [67] concluded that the mining equipment and hardware should become energy efficient and fruitful. Additionally, Vranken H. [68] suggested that bitcoin mining could consume less energy due to use of alternative technologies for mining, such as “proof-of-stake”. Similar conclusions were obtained in the studies [67,69]. However, the study confirmed the bidirectional relationship between energy consumption and bitcoin profitability. The studies [70,71,72] confirmed that the development of bitcoin led to inefficient use of traditional energy resources. Thus, it is topical to justify the character of the links between energy consumption and crypto trading.
2.3. Cryptocurrency and Environment Degradation
Applying the Toda–Yamamoto and bootstrap-augmented Toda–Yamamoto test, the study [73] confirmed the causal relationship between bitcoin development and ecological degradation. The core indicator of ecological degradation was carbon dioxide emissions. The papers [74,75,76] highlighted that cryptocurrency harmed the environment by increasing energy consumption and mining pollution. The study constructed the index of cryptocurrency environmental attention [74]. Based on the findings, the study concluded that cryptocurrency development and effective government policy allowed a decline in the negative anthropogenic impact on the environment. Similar conclusions were obtained in the paper [75], which forecasted that in 2024 Chinese energy consumption from bitcoins mining could increase to 296.59 TWh. This would provoke an increase in air pollution by 130.50 million metric tons of CO2. In this case, the study justified the necessity of government regulation by providing a strict tax policy on carbon emissions and limiting the mining pollution through quotas.
The study [77] applied the MVMQ-CAViaR model (multivariate-quantile conditional autoregressive) and Granger causality to check the relationship between bitcoin price and the carbon credit market. Considering the empirical results, bitcoins’ prices significantly impacted the carbon credit market. At the same time, the causality impact of the carbon credit market on bitcoin price was not confirmed. The study [78] empirically justified that cryptocurrency provoked an increase in the electricity waste, which polluted ground water and land. Thus, digital currency development requires the relevant mechanisms to overcome environmental issues through the development of alternative energy. Thus, the studies [79,80,81,82,83] confirmed that smart grids and green financing allowed overcoming the issues of air pollution. On the example of China and the USA, the paper [76] confirmed that USD 1 bitcoin value provoked health damage of USD 0.49 in the USA and 0.37 in China. The opposite conclusion was proved in the study [84]. Cocco L., Pinna A. and Marchesi M. justified that blockchain technologies and bitcoin allowed bootstrapping of the development of green technologies and achievement of the Sustainable Development Goals.
Considering the results mentioned above, the following hypothesis was tested:
H1.
There is a causal relation between crypto trading and economic development.
H2.
Crypto trade growth requires the increase in energy consumption.
H3.
GDP growth allows attracting investment into renewable energy.
H4.
Renewable energy decreases the carbon dioxide emissions.
The general hypothesis: there is a causal relationship among crypto trading, renewable energy consumption, and ecological degradation.
3. Materials and Methods
The analysis was based on the data of the top European crypto-trader countries for 2013–2020: the United Kingdom, Germany, Ukraine, Italy, Poland, the Netherlands, and France [3].
The study was based on the modified Cobb–Douglas function (which analysed the economic development). However, along with traditional factors of production (labour and capital), the modified function considered the energy resources and sources generated from the crypto trading:
where GDP is gross domestic product; LF is labour force; GFCF is gross capital formation; RE is a share of renewable energy in the final energy consumption; and CT is crypto trading.
At the same time, the explanation of the variables ‘globalisation’ and ‘economic openness’ were added to the model. The studies [85,86,87,88] confirmed that the country’s involvement in the globalisation process was the core determinant of the ecological and economic development of the country. Consequently, it would influence the value and volume of crypto trading. Furthermore, the paper [85,86,87,88] (based on the panel data) proved the long-term relationship between globalisation and economic, social, and political indices of economic growth. The study [80,88] justified that economic openness allowed attracting and implementing innovation and information technology in the country. Thus, it could provoke intensification of crypto trading, which supports economic and ecological development.
It should be noted that each coefficient of function (1) could be interpreted as an indicator of elasticity. In this case, converting data into a natural logarithm eliminates their dynamism. This (1) could be presented as a panel cointegration equation:
where ,…, are regression’s coefficients which were estimated and explain the elasticity of output related to total labour force (LF), real gross fixed capital formation (GFCF), share of renewable energy in final energy consumption (RE), crypto trading (CT), globalisation (GI), and economic openness (EO); GDP is gross domestic product per capita; is the country-specific intercept; is the error term; i = 1, …, N; t = 1, …, T.
The study [89,90] applied the Environmental Kuznets Curve (EKC) hypothesis to estimate the level of ecological degradation. The EKC hypothesis is based on the quadratic function of dependence:
where is carbon dioxide emissions.
All data were linearised by being taken in logarithm. The logarithmic linear models allowed receiving more accurate findings than linear ones [91]. Thus, the model of the research could be presented as:
where ,…, are regression’s coefficients which were estimated and explain the elasticity of output related to total real gross fixed capital formation (GFCF), share of renewable energy in final energy consumption, crypto trading (CT), globalisation (GI), and economic openness (EO); is the country-specific intercept; is the error term; i = 1, …, N; t = 1, …, T.
To test the causal relation between variables, the following steps were applied.
At the first stage, the analysis of the data stationarity was applied. For this purpose, the panel unit root test was applied:
where is the series for country, is the number of lags selected for the ADF regression, and is the error term i = 1, …, N; t = 1, …, T.
If the data were stationary, the cointegration between data could be tested by applying the Pedroni and Kao panel cointegration tests (the second stage).
At the third stage, the long-term relationship was checked by applying the FMOLS (Least Square) and DOLS (Dynamic Ordinary Least Square) panel cointegration models.
At the next stage, based on the methodology [89], the study applied Vector Error Correction Models (VECM) to test the causality among selected parameters. Thus, the equations for VECM could be written as:
where are the lagged error correction terms; is the error terms. ψ, ϕ, θ, τ are the coefficient parameters; Δ is the first difference operator; k is the lagged length of each variable chosen by the Schwarz data criteria (SIC).
Table 1 contains the description of variables and sources.
All calculations were completed using the software EViews. The descriptive statistics of the variables are shown in Table 2.
4. Results
At the first stage, the stationarity of the selected variables was checked by the tests by Levin, Lin and Chu, Im, Pesaran and Shin W-stat, ADF-Fisher Chi-square, and Hadri. The findings of the panel unit root test are shown in Table 3.
Considering the findings, the following variables were stationary at a level: GDP, CT, GFCF, and GI in Levin, Lin and Chu test; GDP and GI in Im, Pesaran and Shin W-stat; GDP and GI in ADF-Fisher Chi-square; and CO2, RE, GFCF, LF, GI, and OE in PP-Fisher Chi-square. However, all variables become stationary at the first level according to all tests (Table 3). This allowed rejecting the hypothesis of non-stationarity at 1% significance. If the data were stationary, the cointegration test could be applied. The findings of the cointegration test using the Pedroni panel cointegration technique are shown in Table 4.
The findings of the Pedroni panel cointegration test proved that6 out of 11 probabilities of the test had statistical significance at 1% and 5% levels. It allowed rejecting the hypothesis of non-cointegration between the Series: GDP, LF, GFCF, RE, CT, GI, EO and Series: CO2, GDP, RE, CT, GI, EO. Furthermore, it allowed confirming the long-term relationship between the variables analysed. Table 5 contains the findings of the Kao Residual Cointegration Test.
The empirical results (Table 5) allowed rejecting the null hypothesis—no cointegration at the level of 1% significance for Series: CO2, GDP, RE, CT, GI, EO and 5% for Series: GDP, LF, GFCF, RE, CT, GI, EO. It confirmed the long-term relationship between the analysed variables for selected countries.
Considering the findings of the tests mentioned above, the FMOLS and DOLS panel cointegration techniques could be applied. Table 6 and Table 7 contain the findings of FMOLS and DOLS panel cointegration techniques.
The findings in Table 6 allowed concluding that the increase in the real gross fixed capital formation, the share of renewable energies in total energy consumption and crypto trading led to GDP growth by 0.802 (significance at 1%), 0.064 (significance at 5%), and 0.017 (significance at 10%), respectively. The increase in gross domestic product per capita and real gross fixed capital formation led to RE growth to 2.214 and 2.558. However, the LF growth led to the decline in RE by 2.094. It should be noted that no parameters influenced crypto trading. However, the growth of crypto trading by 1% leads to the CO2 increase by 0.019.
The findings of long-term relationship analysis confirmed that both tests FMOLS and DOLS had similar results (Table 7). A 1% increase in the share of renewable energies in total energy consumption, crypto trading, real gross fixed capital formation, labour force led to GDP growth by 0.208 (significance at 1%), 0.006 (significance at 5%), 1.018 (significance at 1%), and 0.941 (significance at 1%), respectively. At the same time, a 1% increase in crypto trading provoked the increase in carbon dioxide emissions by 0.013 (significance at 1%) and gross fixed capital formation by 0.005 (significance at 10%). Moreover, a 1% growth of crypto trading does not influence the change in the share of renewable energy in the total energy consumption. The elasticity of carbon dioxide emissions relative to real income and quadratic real income is positive and negative, respectively. It allows confirming the EKC hypothesis for Equation (4). Thus, the GDP growth results in the environment improvement after the countries analysed have overcome the threshold. In this case, the crypto trade’s positive and statistically significant impact on GDP, the rapid growth of IT, and activisation of information society influence the government capacity to improve the environment and achieve the targets on the renewable energy share in the long-term.
At the next stage, the study applied VECM Granger causality analysis (Table 8).
The first column in Table 8 shows the GDP impact on other variables, the second on the real gross fixed capital formation, and the third on the labour force. The fourth and fifth columns demonstrate the impact of the share of renewable energies in the total energy consumption and crypto trading on other variables. The sixth and seventh columns show the impact of globalisation and economic openness on other variables. The last column shows the long-term relationship between variables. Thus, the findings in the first column confirm that GDP had a positive and statistically significant impact on real gross fixed capital formation, the share of renewable energies in total energy consumption, crypto trading, and economic openness. At the same time, crypto trading had a positive and statistically significant impact on GDP, real gross fixed capital formation, and globalisation. However, in the long-term, the relationship between crypto trading and the share of renewable energies in the total energy consumption was not confirmed by the empirical results. The error correction terms were negative and statistically significant for GDP, labour force, renewable energies, and crypto trading models in the long-term. It showed that short-term adjustments to equilibrium were driven by adjustment back to the long-term equilibrium through the error correction term.
The Pairwise Granger Causality Tests (Table 9) allowed concluding the bidirectional causality between GFCF and GDP, RE and GDP, CT and GDP, GI and GDP, and CT and CO2. At the same time, the unidirectional causality was among GDP → LF, GFCF → RE, GFCF → CT, GFCF → GI, OE → GFCF, GI → LF, CO2 → GDP, and RE → CO2.
Thus, it confirmed no bidirectional or unidirectional causality between crypto trading and renewable energy. It should be noted that an increase in renewable energy consumption requires a significant investment in the relevant infrastructure and long-term planning. Moreover, the renewable energy, crypto, and real income could be used for further forecasting of carbon dioxide emissions. The findings of Pairwise Granger Causality Tests jointly with DOLS and FMOLS confirmed the Granger causality. It proved that the high rates of renewable energy development and crypto trade could negatively influence carbon dioxide emissions in the long-term for the selected countries. The bidirectional causality between RE and GDP and CT and GDP allowed confirming that the decline in renewable energy and crypto trade could hinder economic development.
5. Discussion and Conclusions
The rapid growth of information technology and its penetration in all sectors justified the crypto market and currency development. In this case, a lot of scientific discussions focus on the economic, ecological, and energy efficiency of cryptocurrency. The empirical findings confirmed the bidirectional causality between the share of renewable energy in the final energy consumption and gross domestic product per capita, international blockchain transactions received and gross domestic product per capita, carbon dioxide emissions and unidirectional causality from real gross fixed capital formation to share of renewable energy in final energy consumption, international blockchain transactions received, and the share of renewable energy in the final energy consumption to carbon dioxide emissions.
Moreover, considering the findings, the increase in crypto trading led to enhancing GDP, real gross fixed capital formation, and globalisation. However, in the long-term, the relationship between crypto trading and the share of renewable energies in the total energy consumption was not confirmed by the empirical results. Similar conclusions were obtained in the studies [32,33,34,37,38]. However, the papers [74,84] justified the opposite view on energy consumption and crypto trading development.
The core reasons for the opposite conclusions in the long-term relationship could be explained and caused by the convergence of government policies to support the cryptocurrency market and green transformation. Moreover, the crypto traders’ social responsibility plays a crucial role in decreasing carbon dioxide emissions. Thus, the government should promote the principles of Create Share Value theory [97]. The crypto traders should understand that profitability and socially responsible behaviour are interdependent. Thus, the countries analysed differ in the level of social responsibility penetration among businesses. Furthermore, the gaps and social distance between society and crypto traders provoked the misunderstanding and limitation of green technologies’ implementation. Thus, the collaboration between crypto traders and local community allows diminishing the negative effect on the environment [98].
Furthermore, the country’s technological readiness influences efficiency and capability to apply smart technologies. It has a direct effect both on the carbon dioxide emissions and on the crypto trade development.
Considering the findings and recommendations in the studies [69,70,71,72,73,74,78], crypto traders should implement innovative technology, hardware, and protocols for mining and storing cryptocurrency. It allowed eliminating the energy over-consumption and environmental degradation from crypto trading. Although the core feature of cryptocurrency is freedom and absence of government regulation, the government should try to implement effective instruments to encourage crypto traders to direct part of their profit towards solving ecological problems. Moreover, the green tax on carbon dioxide emissions from crypto trading could be provided as proposed by the studies [99,100]. It would allow accumulation of additional funding to overcome the damage from carbon dioxide emissions and to extend green energy.
Furthermore, according to the paper [101], the EU climate policy on decarbonisation should be updated considering the rapid growth of the digital economy. However, for further directions, it is necessary to extend the number of countries and time for analysis. It allows empirically justified recommendations on approaching cryptocurrency development without increasing the negative impact on the environment. Moreover, it is necessary to analyse the impact of crypto trading on land and water pollution.
Author Contributions
Conceptualisation, J.K. and K.M.; methodology, R.M.; validation, R.M., K.M. and J.K.; formal analysis, R.M.; resources, R.M., K.M. and J.K.; data curation, R.M.; writing—original draft preparation, R.M.; writing—review and editing, R.M.; visualisation, R.M.; supervision, R.M.; project administration R.M. All authors have read and agreed to the published version of the manuscript.
Funding
This research received no external funding.
Institutional Review Board Statement
Not applicable.
Informed Consent Statement
Not applicable.
Data Availability Statement
Not applicable.
Conflicts of Interest
The authors declare no conflict of interest.
References
- Soni, A.; Maheshwari, S. A survey of attacks on the bitcoin system. In Proceedings of the 2018 IEEE International Students’ Conference on Electrical, Electronics and Computer Science (SCEECS), Bhopal, India, 24–25 February 2018. [Google Scholar] [CrossRef]
- Li, J.-P.; Naqvi, B.; Rizvi, S.K.A.; Chang, H.-L. Bitcoin: The biggest financial innovation of the fourth industrial revolution and a portfolio’s efficiency booster. Technol. Forecast. Soc. Chang. 2021, 162, 120383. [Google Scholar] [CrossRef]
- Web Site of the Company “Triple A”. Cryptocurrency across the World. Available online: https://triple-a.io/crypto-ownership/ (accessed on 16 April 2022).
- Chiriac, I. The influence of intangible assets on the new economy at European level. In Proceedings of the 32nd International Business Information Management Association Conference, IBIMA 2018—Vision 2020: Sustainable Economic Development and Application of Innovation Management from Regional Expansion to Global Growth, Seville, Spain, 15–16 November 2018; pp. 506–514. [Google Scholar]
- Bitcoin Energy Consumption Index. Available online: https://digiconomist.net/bitcoin-energy-consumption (accessed on 1 April 2022).
- Dzwigol, H.; Dzwigol-Barosz, M.; Kwilinski, A. Formation of global competitive enterprise environment based on industry 4.0 concept. Int. J. Entrep. 2020, 24, 1–6. [Google Scholar]
- Kwilinski, A.; Dielini, M.; Mazuryk, O.; Filippov, V.; Kitseliuk, V. System Constructs for the Investment Security of a Country. J. Secur. Sustain. Issues 2020, 10, 345–358. [Google Scholar] [CrossRef]
- Kwilinski, A.; Volynets, R.; Berdnik, I.; Holovko, M.; Berzin, P. E-Commerce: Concept and legal regulation in modern economic conditions. J. Leg. Ethical Regul. Issues 2019, 22, 1–7. [Google Scholar]
- Kwilinski, A.; Dalevska, N.; Kravchenko, S.; Hroznyi, I.; Kovalenko, O. Formation of the entrepreneurship model of e-business in the context of the introduction of information and communication technologies. J. Entrep. Educ. 2019, 22, 1–7. [Google Scholar]
- Tkachenko, V.; Kwilinski, A.; Klymchuk, M.; Tkachenko, I. The Economic-Mathematical Development of Buildings Construction Model Optimization on the Basis of Digital Economy. Manag. Syst. Prod. Eng. 2019, 27, 119–123. [Google Scholar] [CrossRef] [Green Version]
- Trzeciak, M.; Kopec, T.P.; Kwilinski, A. Constructs of Project Programme Management Supporting Open Innovation at the Strategic Level of the Organisation. J. Open Innov. Technol. Mark. Complex. 2022, 8, 58. [Google Scholar] [CrossRef]
- Kwilinski, A.; Dalevska, N.; Dementyev, V.V. Metatheoretical Issues of the Evolution of the International Political Economy. J. Risk Financ. Manag. 2022, 15, 124. [Google Scholar] [CrossRef]
- Kwilinski, A.; Vyshnevskyi, O.; Dzwigol, H. Digitalization of the EU Economies and People at Risk of Poverty or Social Exclusion. J. Risk Financ. Manag. 2020, 13, 142. [Google Scholar] [CrossRef]
- Melnychenko, O. Is Artificial Intelligence Ready to Assess an Enterprise’s Financial Security? J. Risk Financ. Manag. 2020, 13, 191. [Google Scholar] [CrossRef]
- Ciężki, D.; Drożdż, W. Using multicurrency cash pooling in the liquidity management of a capital group. Polityka Energetyczna 2019, 22, 137–150. [Google Scholar] [CrossRef]
- Petroye, O.; Lyulyov, O.; Lytvynchuk, I.; Paida, Y.; Pakhomov, V. Effects of information security and innovations on country’s image: Governance aspect. Int. J. Saf. Secur. Eng. 2020, 10, 459–466. [Google Scholar] [CrossRef]
- Yang, C.; Kwilinski, A.; Chygryn, O.; Lyulyov, O.; Pimonenko, T. The green competitiveness of enterprises: Justifying the quality criteria of digital marketing communication channels. Sustainability 2021, 13, 13679. [Google Scholar] [CrossRef]
- Kuzior, A.; Lyulyov, O.; Pimonenko, T.; Kwilinski, A.; Krawczyk, D. Post-industrial tourism as a driver of sustainable development. Sustainability 2021, 13, 8145. [Google Scholar] [CrossRef]
- Kwilinski, A.; Litvin, V.; Kamchatova, E.; Polusmiak, J.; Mironova, D. Information support of the entrepreneurship model complex with the application of cloud technologies. Int. J. Entrep. 2021, 25, 1–8. [Google Scholar]
- Bogachov, S.; Kwilinski, A.; Miethlich, B.; Bartosova, V.; Gurnak, A. Artificial intelligence components and fuzzy regulators in entrepreneurship development. Entrep. Sustain. Issues 2020, 8, 487–499. [Google Scholar] [CrossRef]
- Kwilinski, A.; Dzwigol, H.; Dementyev, V. Model of entrepreneurship financial activity of the transnational company based on intellectual technology. Int. J. Entrep. 2020, 24, 1–5. [Google Scholar]
- Kwilinski, A.; Kuzior, A. Cognitive Technologies in the Management and Formation of Directions of the Priority Development of Industrial Enterprises. Manag. Syst. Prod. Eng. 2020, 28, 133–138. [Google Scholar] [CrossRef]
- Kwilinski, A.; Tkachenko, V.; Kuzior, A. Transparent cognitive technologies to ensure sustainable society development. J. Secur. Sustain. Issues 2019, 9, 561–570. [Google Scholar] [CrossRef]
- Melnychenko, O. Application of artificial intelligence in control systems of economic activity. Virtual Econ. 2019, 2, 30–40. [Google Scholar] [CrossRef] [Green Version]
- Bilan, Y.; Pimonenko, T.; Starchenko, L. Sustainable business models for innovation and success: Bibliometric analysis. E3S Web Conf. 2020, 159, 04037. [Google Scholar] [CrossRef] [Green Version]
- Rahmanov, F.; Mursalov, M.; Rosokhata, A. Consumer Behavior in Digital Era: Impact of COVID-19. Mark. Manag. Innov. 2021, 2, 243–251. [Google Scholar] [CrossRef]
- Cosmulese, C.G.; Grosu, V.; Hlaciuc, E.; Zhavoronok, A. The Influences of the Digital Revolution on the Educational System of the EU Countries. Mark. Manag. Innov. 2019, 3, 242–254. [Google Scholar] [CrossRef]
- Shkarlet, S.; Kholiavko, N.; Dubyna, M.; Zhuk, O. Innovation, Education, Research Components of the Evaluation of Information Economy Development (as Exemplified by Eastern Partnership Countries). Mark. Manag. Innov. 2019, 1, 70–83. [Google Scholar] [CrossRef]
- Ahmed, A.A.A.; Paruchuri, H.; Vadlamudi, S.; Ganapathy, A. Cryptography in financial markets: Potential channels for future financial stability. Acad. Account. Financ. Stud. J. 2021, 25, 1–9. [Google Scholar]
- Kwilinski, A. Implementation of Blockchain Technology in Accounting Sphere. Acad. Account. Financ. Stud. J. 2019, 23, 1–6. [Google Scholar]
- Semenova, K.D.; Tarasova, K.I. Establishment of the new digital world and issues of cyber-risks management. Mark. Manag. Innov. 2017, 3, 236–244. [Google Scholar] [CrossRef] [Green Version]
- Hazard, J.; Sclavounis, O.; Stieber, H. Are transaction costs drivers of financial institutions? contracts made in heaven, hell, and the cloud in between. In Banking Beyond Banks and Money. New Economic Windows; Springer International Publishing: Cham, Switzerland, 2016; pp. 213–237. [Google Scholar] [CrossRef]
- Masharsky, A.; Skvortsov, I. Problems and prospects of cryptocurrency development. In Grabchenko’s International Conference on Advanced Manufacturing Processes; Springer International Publishing: Cham, Switzerland, 2022; pp. 435–444. [Google Scholar] [CrossRef]
- Bojaj, M.M.; Muhadinovic, M.; Bracanovic, A.; Mihailovic, A.; Radulovic, M.; Jolicic, I.; Milosevic, I.; Milacic, V. Forecasting macroeconomic effects of stablecoin adoption: A Bayesian approach. Econ. Model. 2022, 109, 105792. [Google Scholar] [CrossRef]
- Sadraoui, T.; Nasr, A.; Mgadmi, N. Studding relationship between bitcoin, exchange rate and financial development: A panel data analysis. Int. J. Manag. Financ. Account. 2021, 13, 232–252. [Google Scholar] [CrossRef]
- Hunter, G.W.; Kerr, C. Virtual money illusion and the fundamental value of non-fiat anonymous digital payment methods: Coining a (bit of) theory to describe and measure the bitcoin phenomenon. Int. Adv. Econ. Res. 2019, 25, 151–164. [Google Scholar] [CrossRef]
- De Vries, A. Bitcoin boom: What rising prices mean for the network’s energy consumption. Joule 2021, 5, 509–513. [Google Scholar] [CrossRef]
- Truby, J. Decarbonizing Bitcoin: Law and policy choices for reducing the energy consumption of Blockchain technologies and digital currencies. Energy Res. Soc. Sci. 2018, 44, 399–410. [Google Scholar] [CrossRef]
- Us, Y.; Pimonenko, T.; Lyulyov, O. Energy efficiency profiles in developing the free-carbon economy: On the example of Ukraine and the V4 countries. Polityka Energetyczna 2021, 23, 49–66. [Google Scholar] [CrossRef]
- Kharazishvili, Y.; Kwilinski, A.; Sukhodolia, O.; Dzwigol, H.; Bobro, D.; Kotowicz, J. The Systemic Approach for Estimating and Strategizing Energy Security: The Case of Ukraine. Energies 2021, 14, 2126. [Google Scholar] [CrossRef]
- Kotowicz, J.; Węcel, D.; Kwilinski, A.; Brzęczek, M. Efficiency of the power-to-gas-to-liquid-to-power system based on green methanol. Appl. Energy 2022, 314, 118933. [Google Scholar] [CrossRef]
- Kyrylov, Y.; Hranovska, V.; Boiko, V.; Kwilinski, A.; Boiko, L. International Tourism Development in the Context of Increasing Globalization Risks: On the Example of Ukraine’s Integration into the Global Tourism Industry. J. Risk Financ. Manag. 2020, 13, 303. [Google Scholar] [CrossRef]
- Drożdż, W.; Kinelski, G.; Czarnecka, M.; Wójcik-Jurkiewicz, M.; Maroušková, A.; Zych, G. Determinants of Decarbonization—How to Realize Sustainable and Low Carbon Cities? Energies 2021, 14, 2640. [Google Scholar] [CrossRef]
- Drożdż, W. The development of electromobility in Poland. Virtual Econ. 2019, 2, 61–69. [Google Scholar] [CrossRef]
- Saługa, P.W.; Szczepańska-Woszczyna, K.; Miśkiewicz, R.; Chłąd, M. Cost of Equity of Coal-Fired Power Generation Projects in Poland: Its Importance for the Management of Decision-Making Process. Energies 2020, 13, 4833. [Google Scholar] [CrossRef]
- Hussain, H.I.; Haseeb, M.; Kamarudin, F.; Dacko-Pikiewicz, Z.; Szczepańska-Woszczyna, K. The Role of Globalization, Economic Growth and Natural Resources on the Ecological Footprint in Thailand: Evidence from Nonlinear Causal Estimations. Processes 2021, 9, 1103. [Google Scholar] [CrossRef]
- Drab-Kurowska, A.; Drożdż, W. Digital Postal Operator as an Important Element of the National Energy Security System. Energies 2021, 15, 231. [Google Scholar] [CrossRef]
- Drożdż, W.; Mróz-Malik, O.J. Challenges for the Polish energy policy in the field of offshore wind energy development. Polityka Energetyczna-Energy Policy J. 2020, 23, 5–18. [Google Scholar] [CrossRef]
- Lyulyov, O.; Chortok, Y.; Pimonenko, T.; Borovik, O. Ecological and economic evaluation of transport system functioning according to the territory sustainable development. Int. J. Ecol. Dev. 2015, 30, 1–10. [Google Scholar]
- Pimonenko, T.; Prokopenko, O.; Dado, J. Net zero house: EU experience in Ukrainian conditions. Int. J. Ecol. Econ. Stat. 2017, 38, 46–57. [Google Scholar]
- Cebula, J.; Pimonenko, T. Comparison financing conditions of the development biogas sector in Poland and Ukraine. Int. J. Ecol. Dev. 2015, 30, 20–30. [Google Scholar]
- Prokopenko, O.; Cebula, J.; Chayen, S.; Pimonenko, T. Wind energy in Israel, Poland and Ukraine: Features and opportunities. Int. J. Ecol. Dev. 2017, 32, 98–107. [Google Scholar]
- Us, Y.; Pimonenko, T.; Lyulyov, O. The impact of energy efficiency policy on Ukraine’s green brand: A bibliometrics analysis. Polityka Energetyczna 2021, 24, 5–18. [Google Scholar] [CrossRef]
- Kharazishvili, Y.; Kwilinski, A.; Grishnova, O.; Dzwigol, H. Social Safety of Society for Developing Countries to Meet Sustainable Development Standards: Indicators, Level, Strategic Benchmarks (with Calculations Based on the Case Study of Ukraine). Sustainability 2020, 12, 8953. [Google Scholar] [CrossRef]
- Miśkiewicz, R. The Impact of Innovation and Information Technology on Greenhouse Gas Emissions: A Case of the Visegrád Countries. J. Risk Financ. Manag. 2021, 14, 59. [Google Scholar] [CrossRef]
- Miśkiewicz, R. Challenges facing management practice in the light of Industry 4.0: The example of Poland. Virtual Econ. 2019, 2, 37–47. [Google Scholar] [CrossRef] [Green Version]
- Drożdż, W.; Mróz-Malik, O.; Kopiczko, M. The Future of the Polish Energy Mix in the Context of Social Expectations. Energies 2021, 14, 5341. [Google Scholar] [CrossRef]
- Letunovska, N.; Lyuolyov, O.; Pimonenko, T.; Aleksandrov, V. Environmental management and social marketing: A bibliometric analysis. E3S Web Conf. 2021, 234, 00008. [Google Scholar] [CrossRef]
- Pimonenko, T.; Us, Y.; Lyulyova, L.; Kotenko, N. The impact of the macroeconomic stability on the energy-efficiency of the European countries: A bibliometric analysis. E3S Web Conf. 2021, 234, 00013. [Google Scholar] [CrossRef]
- Starchenko, L.; Lyeonov, S.; Vasylieva, T.; Pimonenko, T.; Lyulyov, O. Environmental management and green brand for sustainable entrepreneurship. E3S Web Conf. 2021, 234, 00015. [Google Scholar] [CrossRef]
- Sotnyk, I.; Shvets, I.; Momotiuk, L.; Chortok, Y. Management of Renewable Energy Innovative Development in Ukrainian Households: Problems of Financial Support. Mark. Manag. Innov. 2018, 4, 150–160. [Google Scholar] [CrossRef]
- Vakulenko, I.; Saher, L.; Lyulyov, O.; Pimonenko, T. A systematic literature review of smart grids. E3S Web Conf. 2021, 250, 08006. [Google Scholar] [CrossRef]
- Lyulyov, O.; Vakulenko, I.; Pimonenko, T.; Kwilinski, A.; Dzwigol, H.; Dzwigol-Barosz, M. Comprehensive assessment of smart grids: Is there a universal approach? Energies 2021, 14, 3497. [Google Scholar] [CrossRef]
- Cebula, J.; Chygryn, O.; Chayen, S.V.; Pimonenko, T. Biogas as an alternative energy source in Ukraine and Israel: Current issues and benefits. Int. J. Environ. Technol. Manag. 2018, 21, 421–438. [Google Scholar] [CrossRef]
- Lyulyov, O.; Paliienko, M.; Prasol, L.; Vasylieva, T.; Kubatko, O.; Kubatko, V. Determinants of shadow economy in transition countries: Economic and environmental aspects. Int. J. Glob. Energy Issues 2021, 43, 166–182. [Google Scholar] [CrossRef]
- O’Dwyer, K.J.; Malone, D. Bitcoin Mining and its Energy Footprint. In Proceedings of the 5th IET Irish Signals & Systems Conference 2014 and 2014 China-Ireland International Conference on Information and Communities Technologies (ISSC 2014/CIICT 2014), Limerick, Ireland, 26–27 June 2014. [Google Scholar] [CrossRef] [Green Version]
- Küfeoğlu, S.; Özkuran, M. Bitcoin mining: A global review of energy and power demand. Energy Res. Soc. Sci. 2019, 58, 101273. [Google Scholar] [CrossRef]
- Vranken, H. Sustainability of bitcoin and blockchains. Curr. Opin. Environ. Sustain. 2017, 28, 1–9. [Google Scholar] [CrossRef] [Green Version]
- Sedlmeir, J.; Buhl, H.U.; Fridgen, G.; Keller, R. The energy consumption of blockchain technology: Beyond myth. Bus. Inf. Syst. Eng. 2020, 62, 599–608. [Google Scholar] [CrossRef]
- Huynh, A.N.Q.; Duong, D.; Burggraf, T.; Luong, H.T.T.; Bui, N.H. Energy Consumption and Bitcoin Market. Asia-Pac. Financ. Mark. 2021, 29, 79–93. [Google Scholar] [CrossRef]
- Howson, P. Tackling climate change with blockchain. Nat. Clim. Chang. 2019, 9, 644–645. [Google Scholar] [CrossRef]
- Mora, C.; Rollins, R.L.; Taladay, K.; Kantar, M.B.; Chock, M.K.; Shimada, M.; Franklin, E.C. Bitcoin emissions alone could push global warming above 2 c. Nat. Clim. Chang. 2018, 8, 931. [Google Scholar] [CrossRef]
- Erdogan, S.; Ahmed, M.Y.; Sarkodie, S.A. Analysing asymmetric effects of cryptocurrency demand on environmental sustainability. Environ. Sci. Pollut. Res. 2022, 29, 31723–31733. [Google Scholar] [CrossRef]
- Wang, Y.; Lucey, B.; Vigne, S.A.; Yarovaya, L. An index of cryptocurrency environmental attention (ICEA). China Financ. Rev. Int. 2022. [Google Scholar] [CrossRef]
- Jiang, S.; Li, Y.; Lu, Q.; Hong, Y.; Guan, D.; Xiong, Y.; Wang, S. Policy assessments for the carbon emission flows and sustainability of bitcoin blockchain operation in China. Nat. Commun. 2021, 12, 1–10. [Google Scholar] [CrossRef]
- Goodkind, A.L.; Jones, B.A.; Berrens, R.P. Cryptodamages: Monetary value estimates of the air pollution and human health impacts of cryptocurrency mining. Energy Res. Soc. Sci. 2020, 59, 101281. [Google Scholar] [CrossRef]
- Di Febo, E.; Ortolano, A.; Foglia, M.; Leone, M.; Angelini, E. From bitcoin to carbon allowances: An asymmetric extreme risk spillover. J. Environ. Manag. 2021, 298, 113384. [Google Scholar] [CrossRef]
- De Vries, A.; Stoll, C. Bitcoin’s growing e-waste problem. Resour. Conserv. Recycl. 2021, 175, 105901. [Google Scholar] [CrossRef]
- Kwilinski, A.; Lyulyov, O.; Dzwigol, H.; Vakulenko, I.; Pimonenko, T. Integrative smart grids’ assessment system. Energies 2022, 15, 545. [Google Scholar] [CrossRef]
- Pimonenko, T.; Lyulyov, O.; Us, Y. Cointegration between economic, ecological and tourism development. J. Tour. Serv. 2021, 12, 169–180. [Google Scholar] [CrossRef]
- Polcyn, J.; Us, Y.; Lyulyov, O.; Pimonenko, T.; Kwilinski, A. Factors influencing the renewable energy consumption in selected European countries. Energies 2022, 15, 108. [Google Scholar] [CrossRef]
- Chygryn, O.; Lyulyov, O.; Pimonenko, T.; Mlaabdal, S. Efficiency of oil-production: The role of institutional factors. Eng. Manag. Prod. Serv. 2020, 12, 92–104. [Google Scholar] [CrossRef]
- Chygryn, O.; Pimonenko, T.; Luylyov, O.; Goncharova, A. Green bonds like the incentive instrument for cleaner production at the government and corporate levels: Experience from EU to Ukraine. J. Environ. Manag. Tour. 2018, 9, 1443–1456. [Google Scholar] [CrossRef]
- Cocco, L.; Pinna, A.; Marchesi, M. Banking on blockchain: Costs savings thanks to the blockchain technology. Future Internet 2017, 9, 25. [Google Scholar] [CrossRef] [Green Version]
- Sokolovska, A.; Zatonatska, T.; Stavytskyy, A.; Lyulyov, O.; Giedraitis, V. The impact of globalisation and international tax competition on tax policies. Res. World Econ. 2020, 11, 1–15. [Google Scholar] [CrossRef]
- Tambovceva, T.; Ivanov, I.H.; Lyulyov, O.; Pimonenko, T.; Stoyanets, N.; Yanishevska, K. Food security and green economy: Impact of institutional drivers. Int. J. Glob. Environ. Issues 2020, 19, 158–176. [Google Scholar] [CrossRef]
- Melnyk, L.; Sineviciene, L.; Lyulyov, O.; Pimonenko, T.; Dehtyarova, I. Fiscal decentralisation and macroeconomic stability: The experience of Ukraine’s economy. Probl. Perspect. Manag. 2018, 16, 105–114. [Google Scholar] [CrossRef] [Green Version]
- Lyulyov, O.; Pimonenko, T.; Kwilinski, A.; Us, Y. The heterogeneous effect of democracy, economic and political globalisation on renewable energy. E3S Web Conf. 2021, 250, 03006. [Google Scholar] [CrossRef]
- Lyulyov, O.; Lyeonov, S.; Tiutiunyk, I.; fzPodgórska, J. The impact of tax gap on macroeconomic stability: Assessment using panel VEC approach. J. Int. Stud. 2021, 14, 139–152. [Google Scholar] [CrossRef]
- Our World in Data. Available online: https://ourworldindata.org/co2-emissions (accessed on 17 April 2022).
- Shahbaz, M.; Lean, H.H.; Shabbir, M.S. Environmental Kuznets curve hypothesis in Pakistan: Cointegration and Granger causality. Renew. Sustain. Energy Rev. 2012, 16, 2947–2953. [Google Scholar] [CrossRef] [Green Version]
- World Data Bank. Available online: https://databank.worldbank.org/reports.aspx?source=2&series=NY.GDP.PCAP.CD&country= (accessed on 17 April 2022).
- Eurostat. Available online: https://ec.europa.eu/eurostat/databrowser/view/sdg_07_40/default/table?lang=en (accessed on 17 April 2022).
- Ukrstat. Available online: http://www.ukrstat.gov.ua (accessed on 17 April 2022).
- Crystal Blockchain. Available online: https://crystalblockchain.com/geography-of-international-blockchain-transactions/ (accessed on 17 April 2022).
- Gygli, S.; Haelg, F.; Potrafke, N.; Sturm, J.E. The KOF globalisation index–revisited. Rev. Int. Organ. 2019, 14, 543–574. [Google Scholar] [CrossRef] [Green Version]
- Porter, M.; Kramer, M. Creating Shared Value. Harv. Bus. Rev. 2011, 89, 62–77. [Google Scholar]
- Truby, J.; Brown, R.D.; Dahdal, A.; Ibrahim, I. Blockchain, climate damage, and death: Policy interventions to reduce the carbon emissions, mortality, and net-zero implications of non-fungible tokens and Bitcoin. Energy Res. Soc. Sci. 2022, 88, 102499. [Google Scholar] [CrossRef]
- Benetton, M.; Compiani, G.; Morse, A. Crypto Mining: Pollution, Government Incentives, and Energy Crowding-Out. 2019. Available online: https://www.nber.org/system/files/chapters/c14530/c14530.pdf (accessed on 17 April 2022).
- Putranti, I.R. Crypto Mining: Indonesia Carbon Tax Challenges and Safeguarding International Commitment on Human Security. Int. J. Bus. Econ. Soc. Dev. 2022, 3, 10–18. [Google Scholar] [CrossRef]
- Jakob, M. Globalization and climate change: State of knowledge, emerging issues, and policy implications. Wiley Interdiscip. Rev. Clim. Chang. 2022, 85, e771. [Google Scholar] [CrossRef]

Table 1.
The variables of the research and sources.
| Variables | Symbol | Sources |
|---|---|---|
| Carbon dioxide emissions | CO2 | Our World in Data [90] |
| Gross domestic product per capita | GDP | World Data Bank [92] |
| A share of renewable energy in final energy consumption | RE | Eurostat [93]; Ukrstat [94] |
| International blockchain transactions received | CT | Crystal Blockchain [95] |
| Real gross fixed capital formation | GFCF | World Data Bank [92] |
| Labour force | LF | World Data Bank [92] |
| Globalisation | GI | KOF Globalisation Index [96] |
| Economic openness (Trade (% of GDP)) | EO | World Data Bank [92] |
Table 2.
The findings of descriptive statistics of the selected variables.
| Variables | Mean | Median | Maximum | Minimum | Std. Dev. | Skewness | Kurtosis | Jarque–Bera |
|---|---|---|---|---|---|---|---|---|
| CO2 | 3.74 × 10⁸ | 3.37 × 10⁸ | 8.31 × 10⁸ | 1.54 × 10⁸ | 1.90 × 10⁸ | 1.275 | 3.715 | 13.734 |
| GDP | 33,152.39 | 40,578.64 | 53,018.63 | 2124.662 | 16,392.180 | −0.773 | 2.172 | 6.023 |
| RE | 11.421 | 11.495 | 18.267 | 2.6 | 5.036 | −0.288 | 1.692 | 4.004 |
| CT | 117,665.5 | 10.199 | 4,681,000 | 0.006 | 691,092.7 | 6.347 | 42.252 | 3332.823 |
| GFCF | 3.66 × 10¹¹ | 3.62 × 10¹¹ | 8.71 × 10¹¹ | 1.45 × 10¹¹ | 2.62 × 10¹¹ | 0.261 | 1.799 | 3.357 |
| LF | 26,034,725 | 25,875,327 | 44,351,163 | 9,019,570 | 10,632,838 | 0.045 | 2.175 | 1.348 |
| GI | 84.501 | 87.185 | 92.838 | 70.241 | 5.744 | −0.802 | 2.869 | 5.072 |
| EO | 88.954 | 86.246 | 158.823 | 54.868 | 32.627 | 0.916 | 2.787 | 6.657 |
Table 3.
The empirical results of data stationarity using the panel unit root test (at 1st difference).
Table 3.
The empirical results of data stationarity using the panel unit root test (at 1st difference).
| Variables | Statistical Values | Levin, Lin and Chu | Im, Pesaran and Shin W-Stat | ADF-Fisher Chi-Square | Hadri |
|---|---|---|---|---|---|
| CO2 | statistics | −1.334 | 1.248 | 14.034 | 2.216 |
| probability | 0.091 | 0.089 | 0.059 | 0.000 | |
| GDP | statistics | −14.937 | −3.870 | 47.044 | 2.437 |
| probability | 0.000 | 0.000 | 0.000 | 0.007 | |
| RE | statistics | −9.527 | −2.248 | 38.056 | 2.991 |
| probability | 0.000 | 0.012 | 0.001 | 0.001 | |
| CT | statistics | −3.629 | −0.952 | 41.061 | 5.916 |
| probability | 0.000 | 0.017 | 0.000 | 0.000 | |
| GFCF | statistics | −8.942 | −1.866 | 31.092 | 6.091 |
| probability | 0.000 | 0.031 | 0.013 | 0.000 | |
| LF | statistics | −1.825 | 1.929 | 6.060 | 3.589 |
| probability | 0.034 | 0.073 | 0.087 | 0.000 | |
| GI | statistics | −8.190 | −4.337 | 68.398 | 4.622 |
| probability | 0.000 | 0.003 | 0.000 | 0.000 | |
| OE | statistics | −1.789 | 1.327 | 23.990 | 3.789 |
| probability | 0.036 | 0.009 | 0.089 | 0.000 |
Table 4.
The empirical results of the Pedroni panel cointegration.
| Statistical Values | Panel v-Statistic | Panel Rho-Statistic | Panel PP-Statistic | Panel ADF-Statistic | Statistic Values | Group Rho-Statistic | Group PP-Statistic | Group ADF-Statistic |
|---|---|---|---|---|---|---|---|---|
| Series: GDP, LF, GFCF, RE, CT, GI, EO | ||||||||
| Within-dimension | Between-dimension | |||||||
| statistics | −0.797 | 1.905 | −4.372 | −2.409 | statistics | 2.552 | −8.918 | −0.504 |
| probability | 0.787 | 0.972 | 0.000 | 0.008 | probability | 0.995 | 0.000 | 0.007 |
| Weighted | ||||||||
| statistics | −1.416 | 1.352 | −6.527 | −1.979 | ||||
| probability | 0.922 | 0.912 | 0.000 | 0.024 | ||||
| Series: CO2, GDP, RE, CT, GI, EO | ||||||||
| statistics | 2.922 | 0.518 | 1.117 | 1.493 | statistics | 1.805 | 1.627 | 1.582 |
| probability | 0.002 | 0.008 | 0.068 | 0.932 | probability | 0.065 | 0.948 | 0.943 |
| Weighted | ||||||||
| statistics | 3.461 | 0.426 | 1.122 | 0.777 | ||||
| probability | 0.000 | 0.065 | 0.869 | 0.781 | ||||
Table 5.
Kao Residual Cointegration Test.
| Series: GDP, LF, GFCF, RE, CT, GI, EO Model Specification: No Deterministic Trend | t-Statistic | Prob. |
|---|---|---|
| ADF | −2.111216 | 0.0174 |
| Residual variance | 0.001322 | |
| HAC variance | 0.000894 | |
| Series: CO2, GDP, RE, CT, GI, EO Model specification: No deterministic trend | ||
| ADF | −3.49021 | 0.0002 |
| Residual variance | 0.008482 | |
| HAC variance | 0.007344 | |
Table 6.
The findings of the FMOLS panel cointegration technique.
| Dependent Variables | Independent Variables | Coefficient | Probability | Dependent Variables | Independent Variables | Coefficient | Probability |
|---|---|---|---|---|---|---|---|
| GDP | GFCF | 0.802 | 0.002 | RE | GDP | 2.214 | 0.042 |
| LF | −1.598 | 0.498 | GFCF | 2.558 | 0.024 | ||
| RE | 0.064 | 0.027 | LF | −2.094 | 0.075 | ||
| CT | 0.017 | 0.081 | CT | −0.024 | 0.271 | ||
| GI | −0.126 | 0.937 | GI | −1.290 | 0.303 | ||
| OE | 0.519 | 0.348 | OE | −0.177 | 0.593 | ||
| GFCF | GDP | 0.840 | 0.001 | CT | GDP | 7.533 | 0.423 |
| LF | 1.845 | 0.378 | GFCF | −5.842 | 0.552 | ||
| RE | 0.034 | 0.846 | LF | 6.742 | 0.461 | ||
| CT | 0.010 | 0.268 | RE | −1.492 | 0.623 | ||
| GI | −0.688 | 0.621 | GI | −3.732 | 0.800 | ||
| OE | −0.298 | 0.569 | OE | −3.428 | 0.369 | ||
| LF | GDP | −1.026 | 0.000 | CO2 | GDP | −5.722 | 0.316 |
| GFCF | 1.079 | 0.000 | GDP2 | 0.235 | 0.359 | ||
| RE | −0.207 | 0.129 | RE | 1.043 | 0.026 | ||
| CT | 0.005 | 0.580 | CT | 0.019 | 0.071 | ||
| GI | −0.057 | 0.915 | GI | 11.939 | 0.106 | ||
| OE | −0.033 | 0.803 | EO | −0.451 | 0.366 |
Table 7.
The findings of the DOLS panel cointegration technique.
| Dependent Variables | Independent Variables | Coefficient | Probability | Dependent Variables | Independent Variables | Coefficient | Probability |
|---|---|---|---|---|---|---|---|
| GDP | GFCF | 1.018 | 0.000 | RE | GDP | 1.479 | 0.006 |
| LF | 0.941 | 0.000 | GFCF | 1.864 | 0.000 | ||
| RE | 0.208 | 0.002 | LF | −1.409 | 0.007 | ||
| CT | 0.006 | 0.078 | CT | −0.003 | 0.870 | ||
| GI | 0.005 | 0.990 | GI | −1.662 | 0.155 | ||
| OE | −0.021 | 0.838 | OE | −0.045 | 0.885 | ||
| GFCF | GDP | 0.932 | 0.000 | CT | GDP | 7.529 | 0.268 |
| LF | 0.873 | 0.000 | GFCF | −6.314 | 0.377 | ||
| RE | 0.240 | 0.000 | LF | 6.482 | 0.325 | ||
| CT | 0.005 | 0.085 | RE | −0.484 | 0.852 | ||
| GI | 0.347 | 0.367 | GI | −1.896 | 0.890 | ||
| OE | −0.037 | 0.709 | OE | −1.964 | 0.575 | ||
| LF | GDP | 1.010 | 0.000 | CO2 | GDP | 1.239 | 0.026 |
| GFCF | 1.024 | 0.000 | GDP2 | −0.081 | 0.502 | ||
| RE | 0.213 | 0.003 | RE | 0.382 | 0.239 | ||
| CT | 0.006 | 0.334 | CT | 0.013 | 0.043 | ||
| GI | 0.277 | 0.510 | GI | 3.814 | 0.197 | ||
| OE | −0.078 | 0.467 | EO | −0.520 | 0.142 |
Table 8.
The VECM Granger causality analysis.
| Variables | Characteristics | Short-Term | Long-Term | ||||||
|---|---|---|---|---|---|---|---|---|---|
| D(GDP) | D(GFCF) | D(LF) | D(RE) | D(CT) | D(GI) | D(OE) | |||
| D(GDP) | statistics | - | 0.636 | 0.985 | 0.113 | 0.000 | −0.726 | −0.732 | −0.426 |
| probability | 0.000 | 0.556 | 0.073 | 0.070 | 0.349 | 0.055 | 0.010 | ||
| D(GFCF) | statistics | 0.771 | - | 0.723 | 0.185 | 0.009 | 0.360 | 0.506 | −0.176 |
| probability | 0.000 | 0.695 | 0.286 | 0.096 | 0.675 | 0.238 | 0.354 | ||
| D(LF) | statistics | 0.012 | 0.007 | - | 0.007 | −0.001 | 0.072 | 0.007 | −0.040 |
| probability | 0.556 | 0.695 | 0.699 | 0.267 | 0.407 | 0.874 | 0.030 | ||
| D(RE) | statistics | 0.158 | 0.212 | 0.764 | - | 0.002 | −0.257 | −0.811 | −0.297 |
| probability | 0.073 | 0.086 | 0.699 | 0.720 | 0.780 | 0.073 | 0.042 | ||
| D(CT) | statistics | 0.259 | 10.105 | −67.307 | 2.076 | - | 56.250 | 11.184 | −12.373 |
| probability | 0.070 | 0.096 | 0.267 | 0.720 | 0.041 | 0.435 | 0.044 | ||
| D(GI) | statistics | −0.042 | 0.017 | 0.332 | −0.011 | 0.002 | - | −0.065 | −0.043 |
| probability | 0.349 | 0.675 | 0.407 | 0.780 | 0.041 | 0.490 | 0.305 | ||
| D(OE) | statistics | 0.166 | 0.094 | 0.127 | −0.132 | 0.002 | -0.256 | - | 0.018 |
| probability | 0.055 | 0.238 | 0.874 | 0.073 | 0.435 | 0.490 | 0.829 | ||
Table 9.
The empirical results of Pairwise Granger Causality Tests.
| H0 | F-Stat. | Prob. | H0 | F-Stat. | Prob. | H0 | F-Stat. | Prob. | H0 | F-Stat. | Prob. |
|---|---|---|---|---|---|---|---|---|---|---|---|
| GFCF → GDP | 4.470 | 0.018 | GFCF → LF | 1.383 | 0.264 | GI → LF | 6.631 | 0.004 | CT → OE | 1.935 | 0.161 |
| GDP → GFCF | 5.808 | 0.006 | RE → GFCF | 1.706 | 0.196 | LF → GI | 1.527 | 0.234 | OE → GI | 0.240 | 0.788 |
| LF → GDP | 0.288 | 0.751 | GFCF → RE | 5.608 | 0.008 | OE → LF | 1.987 | 0.152 | GI → OE | 1.393 | 0.264 |
| GDP → LF | 2.419 | 0.003 | CT → GFCF | 1.824 | 0.178 | LF → OE | 1.058 | 0.358 | GDP → CO2 | 0.239 | 0.789 |
| RE → GDP | 2.527 | 0.094 | GFCF → CT | 4.286 | 0.022 | CT → RE | 0.676 | 0.516 | CO2 → GDP | 14.476 | 0.000 |
| GDP → RE | 2.672 | 0.083 | GI → GFCF | 1.405 | 0.261 | RE → CT | 1.328 | 0.279 | RE → CO2 | 4.436 | 0.019 |
| CT → GDP | 2.714 | 0.082 | GFCF → GI | 2.629 | 0.089 | GI → RE | 0.687 | 0.511 | CO2 → RE | 0.669 | 0.518 |
| GDP → CT | 4.119 | 0.026 | OE → GFCF | 6.857 | 0.003 | RE → GI | 0.607 | 0.552 | CT → CO2 | 3.492 | 0.043 |
| GI → GDP | 3.285 | 0.051 | GFCF → OE | 0.305 | 0.739 | OE → RE | 2.430 | 0.102 | CO2 → CT | 2.656 | 0.086 |
| GDP → GI | 6.649 | 0.004 | RE → LF | 0.497 | 0.613 | RE → OE | 0.044 | 0.957 | GI → CO2 | 0.280 | 0.757 |
| OE → GDP | 0.259 | 0.773 | LF → RE | 2.133 | 0.133 | GI → CT | 0.361 | 0.701 | CO2 → GI | 1.971 | 0.157 |
| GDP → OE | 0.349 | 0.708 | CT → LF | 0.524 | 0.597 | CT → GI | 0.165 | 0.849 | OE → CO2 | 0.784 | 0.464 |
| LF → GFCF | 0.367 | 0.695 | LF → CT | 1.183 | 0.320 | OE → CT | 1.250 | 0.300 | CO2 → OE | 0.157 | 0.855 |
Note: →—is not Granger cause; H0—null hypothesis; F-Stat.—F-Statistic.
Publisher’s Note: MDPI stays neutral with regard to jurisdictional claims in published maps and institutional affiliations. |
© 2022 by the authors. Licensee MDPI, Basel, Switzerland. This article is an open access article distributed under the terms and conditions of the Creative Commons Attribution (CC BY) license (https://creativecommons.org/licenses/by/4.0/).
Share and Cite
MDPI and ACS Style
Miśkiewicz, R.; Matan, K.; Karnowski, J. The Role of Crypto Trading in the Economy, Renewable Energy Consumption and Ecological Degradation. Energies 2022, 15, 3805. https://0-doi-org.brum.beds.ac.uk/10.3390/en15103805
AMA Style
Miśkiewicz R, Matan K, Karnowski J. The Role of Crypto Trading in the Economy, Renewable Energy Consumption and Ecological Degradation. Energies. 2022; 15(10):3805. https://0-doi-org.brum.beds.ac.uk/10.3390/en15103805
Chicago/Turabian StyleMiśkiewicz, Radosław, Krzysztof Matan, and Jakub Karnowski. 2022. "The Role of Crypto Trading in the Economy, Renewable Energy Consumption and Ecological Degradation" Energies 15, no. 10: 3805. https://0-doi-org.brum.beds.ac.uk/10.3390/en15103805
Note that from the first issue of 2016, this journal uses article numbers instead of page numbers. See further details here.