
A Numerical Evaluation of Coal Seam Permeability Derived from Borehole Gas Flow Rate

CSIRO Mineral Recourses, QCAT, 1, Technology Court, Pullenvale, QLD 4069, Australia
*
Author to whom correspondence should be addressed.
Energies 2022, 15(10), 3828; https://0-doi-org.brum.beds.ac.uk/10.3390/en15103828
Submission received: 27 April 2022
/
Revised: 18 May 2022
/
Accepted: 18 May 2022
/
Published: 23 May 2022
(This article belongs to the Special Issue Gas Production from Coal Seam Gas/Deep Coal Seam Gas Reservoirs)
Abstract
:Coal seam permeability is a critical factor in coal seam gas extraction and gas outburst control. In Australian coal mines, coal seam permeability is normally estimated using a packer test or drill stem test. In contrast, Chinese coal mines generally estimate a parameter called the “gas conductivity coefficient” by measuring natural gas flow rates from an underground borehole drilled through a coal seam. With this method, it has been frequently reported that the permeability of many Chinese coal seams is between 0.0001 mD and 0.01 mD, which is extremely low compared to that of Australian coal seams (1–100 mD). It is therefore natural to wonder how closely the Chinese method measures permeability. Resolving this question will allow knowledge and experience in outburst management to be shared between Australian and Chinese coal mines. This question is investigated by the numerical modelling of gas desorption and flow through a seam of known permeability and by using the model’s borehole gas flow rate to estimate the permeability using the Chinese method. A total of 126 simulations were run with various input reservoir parameters. The results suggest that the Chinese method estimates permeability at an accuracy of 85% to 100%, which is adequate for mine pre-drainage design and outburst control. For the high diffusion rate (e.g., high gas content and short desorption time) and low Darcy flow rates (e.g., low permeability), these errors are reduced.
1. Introduction
The permeability of coal seams is an intrinsic quantity, quantifying the ease of fluid flow through the coal. It is a critical factor in determining the efficiency of gas extraction from coal seams for coal seam gas development and coal mine gas drainage [1,2,3]. It is also an important parameter to assess and control the risk of outburst [4,5], which refers to a sudden and violent injection of gas and coal/rock materials from underground coal working faces.
Coal seam permeability may be inferred using a number of experimental methods, such as the drill stem test (DST) [1,6,7], packer test [8,9], and slug test [1,10,11]. These methods generally involve measuring the water pressure (or water head) and flow rate response during the controlled injection into, or withdrawal from, an isolated section of a borehole drilled from the ground surface. The hydraulic conductivity, and hence the permeability of a coal seam, can be estimated from the testing data. These types of methods are commonly used in Australia [1,6,7,8] and some other countries, such as the USA [1,9,10] and Poland [11].
In contrast, the underground borehole gas flow test [12,13,14,15,16], which involves measuring the natural flow rate of gas (desorbed from coal) into a testing borehole drilled through the entire cross-section of the seam, is used in Chinese coal mines to infer coal seam permeability. The method estimates a parameter called the gas conductivity coefficient (GCC) of coal (though some literature refers to it as the permeability coefficient of coal). The GCC can be interpreted as the volume of gas that flows through one square meter of coalface of one-meter length within a day under certain pressure conditions explained fully below. When converting to permeability, the GCC of 1 m2/(MPa2 day) corresponds to approximately (0.025 mD) of the permeability [16].
The method of the GCC measurement and analysis, normally referred to as the borehole radial flow (BRF) method in China, was developed by Zhou [17,18] and is based on the approximate piecewise solution of a two-dimensional single-phase planar transient radial flow of gas towards a borehole through a porous coal seam. The approximate solution was obtained by numerical simulations and the similarity technique. Sun et al. [19] found that the approximate solution can encounter situations of no solution existing or two solutions existing, in some cases, due to a discontinuity at the intersections of the piecewise segments. Despite this shortcoming, the BRF method has been widely used in China since 1980 and has become a standard method of estimating coal seam permeability for the coal mining industry [20]. Jiang [21] reported that the BRF method has higher accuracy than other borehole gas measurement-based methods, including the Marconi gas pressure method, the Krichevsky gas pressure method, and the Krichevsky gas flow quantity method.
With this method, it has been frequently reported that the coal seam permeability in Chinese coal seams is mostly between 0.0001 mD and 0.01 mD [22], which is extremely low in comparison to Australian coal seam permeabilities, which typically range between 1–100 mD [23,24]. The 2D solution used in the method may or may not describe the reality because the idealised models ignore potentially important phenomena, such as gas desorption during the days of observation. Therefore, it is natural to wonder how accurately the method predicts permeability. Resolving this question will allow knowledge and experience in outburst management and gas pre-drainage to be shared between Australian and Chinese coal mines.
In recent years, numerical modelling has been used as an approach to investigate the effect of BRF’s assumptions and operational parameters on the accuracy of the method [25,26,27]. Liu et al. [25] assessed two assumptions of the BRF method, i.e., the single porosity model and the parabolic expression of gas content and gas pressure, by comparing the gas pressure distribution and borehole gas flow rate. They reported that the coal permeability inferred by the BRF method is always smaller than the actual value and that coal seams with large cleat spacing or high Langmuir volume will lead to very low accuracy. Lin et al. [26] investigated the parameters affecting the accuracy of the BRF method by employing a finite volume flow method to simulate the borehole gas flow rate. They used a golden section search method to match numerically calculated the borehole flow rate under a different GCC to the measured borehole flow rate. The model input GCC that results in the best match is taken as the GCC of the coal seam. With this method, they found that the initial gas pressure and the borehole radius are the key factors that affect the prediction of coal seam permeability.
In this paper, the BRF method is further investigated by using a numerical model with a focus on quantifying how closely the Chinese standard BRF method predicts coal seam permeability. The purpose of this quantification is to facilitate a comparison of the differences and adaptability of an outburst risk assessment and gas pre-drainage technologies between China and Australia. The numerical model involves a horizontal coal seam of uniform thickness, with a hole at its centre representing the borehole. A permeability and an initial gas content are prescribed to the model. Single-phase flow is used, along with gas desorption from the coal matrix. The model is initialised to a pore pressure corresponding to the initial gas content, and the gas flow rate from the borehole is measured. Using the synthetic data, the Chinese BRF method is used to infer coal permeability, and the results are compared with the known permeability prescribed to the model.
2. The Methodology of Measuring GCC
2.1. Fundamentals of GCC
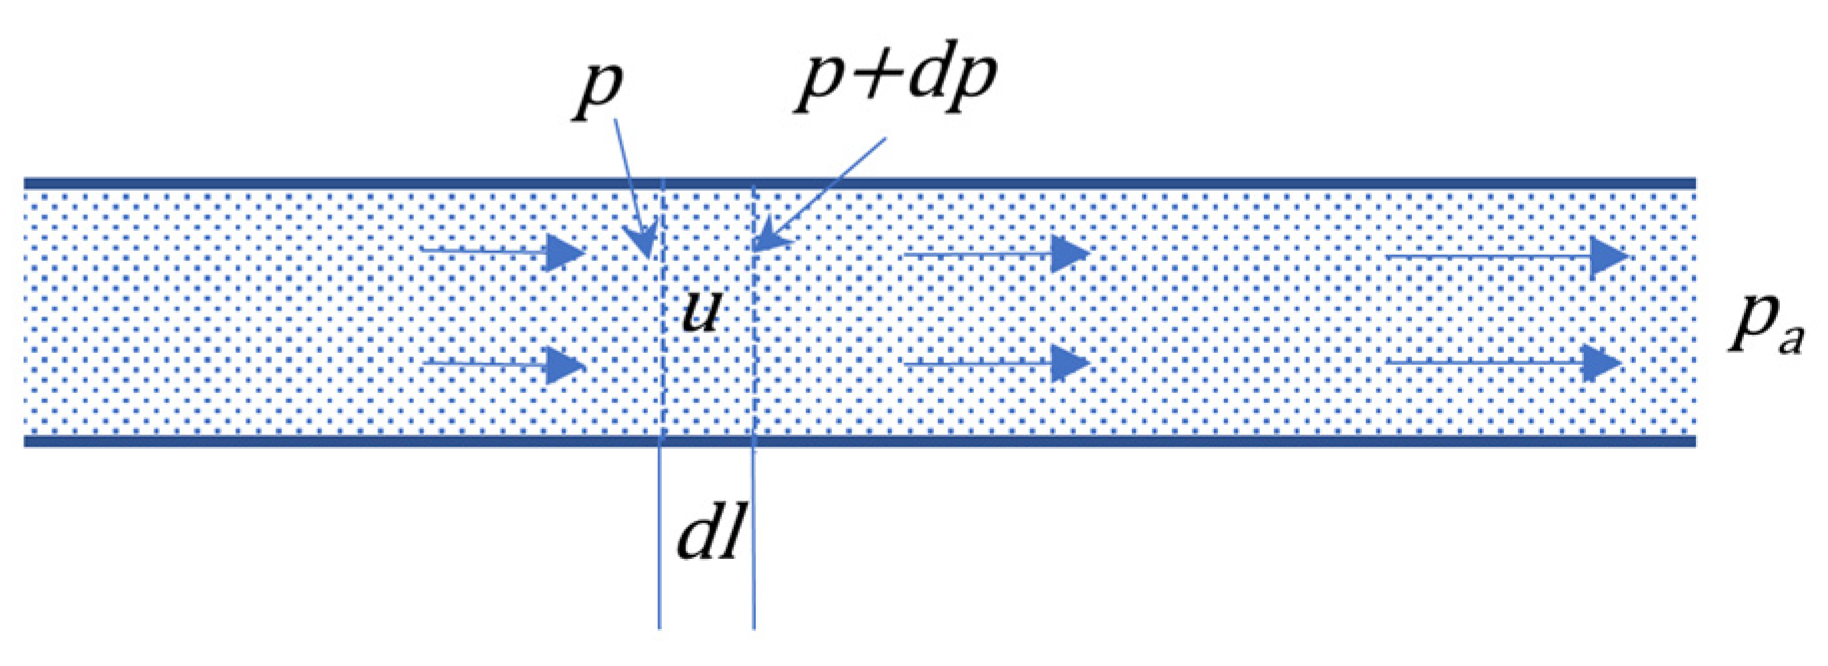
The flow of gas in a porous coal seam is considered the laminar flow (Figure 1) and obeys Darcy’s law. The velocity u (m/s) of gas is given by:
where is the permeability of the coal seam (m2), which varies in different types and structures of coal, is the dynamic viscosity of the gas (Pa · s), and is the pressure gradient in the direction of flowing (Pa/m). The value of this velocity can also be treated as the volume of gas passing through a unit area of A (m2), perpendicular to the flowing direction within the unit time. This is the flow rate, (m3/s), at the pressure, p, through the area:
As gas is compressible, the gas flow rate varies with the changing pressure along the path of the flow. The gas flow rate is often measured and expressed in standard temperature and pressure. Assuming the temperature in the seam does not change, and applying the Boyle’s law to the flow rate, qp, at the pressure, p, and the flow rate, q, at the atmosphere pressure, pa:
The flow rate at the atmosphere pressure is:
where and
is the so-called gas conductivity coefficient (GCC) of the coal (m2/(Pa2 · s)). The GCC, , relates to the permeability of coal, the dynamic viscosity of the gas, and the atmospheric pressure. Some literature, for example, Liu et al. [25], have translated the GCC as the permeability coefficient. However, as it contains the flowing properties of the gas, it is more proper to call it the gas conductivity coefficient of coal.
In practice, the unit of the GCC is often converted to m2/(MPa2 · day). Applying = 1.05 × 10⁻⁵ Pa · s and = 101,325 Pa, the permeability, , equivalent to = 1 m2/(MPa2 · day), can be calculated as:
2.2. Estimating GCC by the Borehole Radial Flow (BRF) Method
According to Equation (4), the GCC of coal, which varies in different coal seams, can be estimated by measuring the flow rate of gas desorbed from coal and flowing into a borehole. Three different methods can be used: (1) the radial flow into a borehole, (2) the spherical flow into a borehole, and (3) the linear flow into a roadway. Of them, the borehole radial flow (BRF) method is the most popular one and has been set as the coal industry standard in China [20].
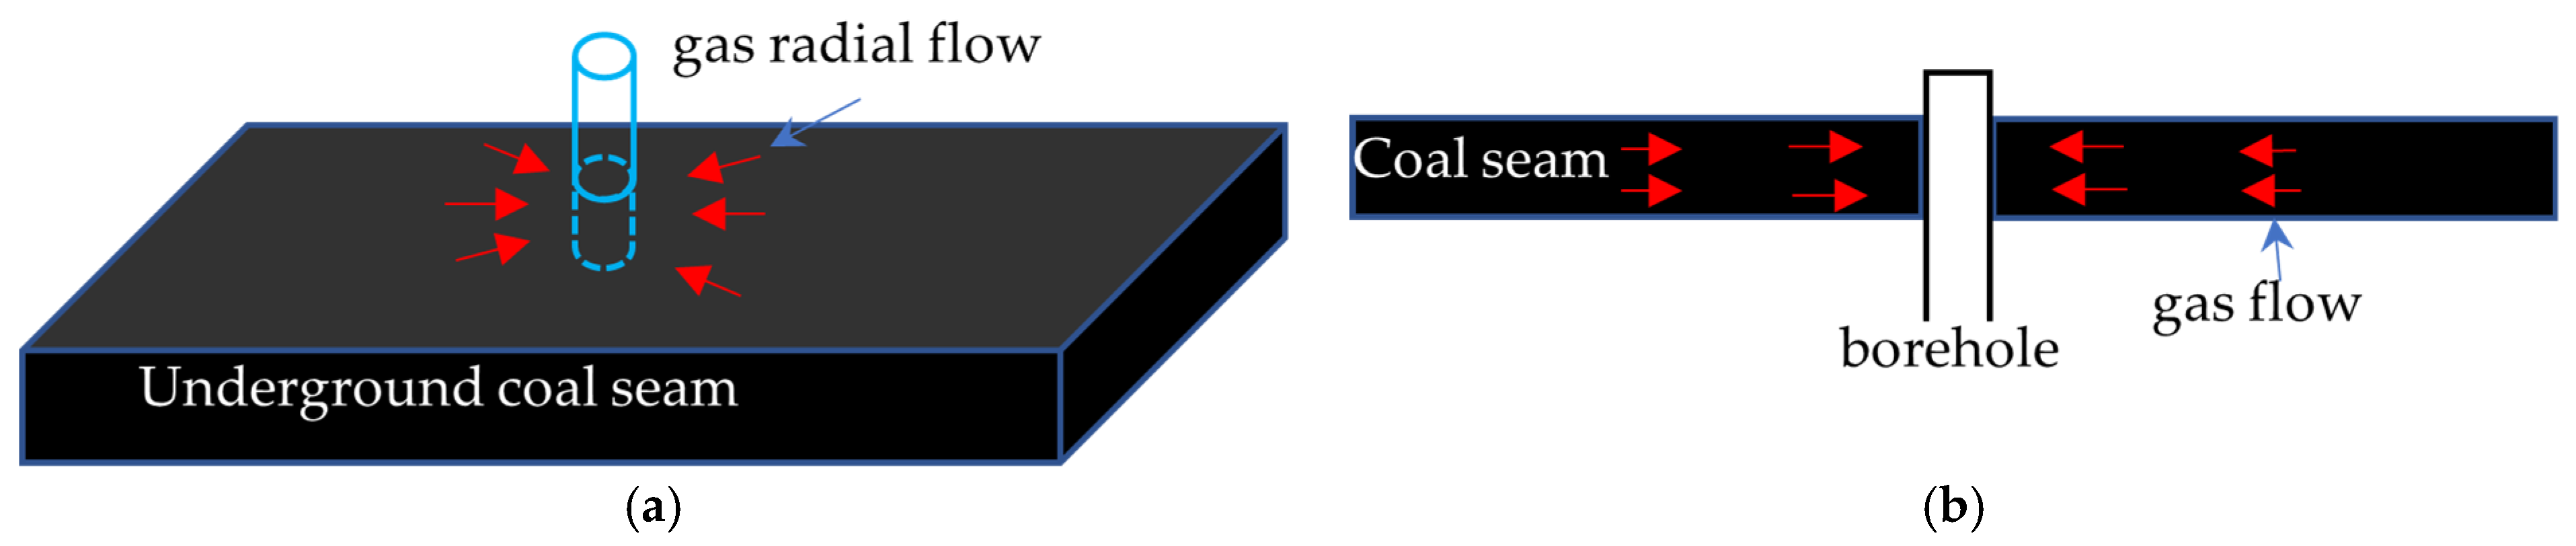
The BRF method is based on the solution of the planar radial flow of gas into a borehole drilled perpendicularly to and through the coal seam (Figure 2). Details of the method can be found in Zhou and Lin [16]. To better understand the method, a brief description is given here.
The BRF method has the following assumptions:
- The single-phase (gas) flow is considered; the gas behaves as an ideal gas, and the gas flow is laminar.
- Only the Darcy flow along the macropores/cleats is considered. The gas desorption and diffusion rate is assumed to dominate the Darcy flow and is therefore excluded.
- The gas content and gas pressure have a parabolic relationship and are expressed by the gas content coefficient, : . (This relationship is commonly expressed by the Langmuir formula).
- The roof and floor of the coal seam are impervious rock layers and do not contain gas.
- The gas flow in the coal seam is isothermal.
- The permeability of the coal seam is not impacted by gas desorption from the coal matrix.
Applying the expression in Equation (4) to the continuity equation of the gas in the radial flow (Figure 2), Zhou and Lin [16] presented the governing partial differential equation,
This is a non-linear second-order equation, and its exact analytical solution cannot be obtained. Instead, with numerical solutions for various parameters and the similarity theory, Zhou and Lin [16] presented a piecewise approximate relationship between the dimensionless flow rate, Y, and the dimensionless time, F0,
where
and the regression constants, a and b, have different values within different time ranges. A and B are defined in Equation (9); p0 and p1 are the in situ gas pressure in the coal seam and the pressure in the borehole (generally taken as the atmosphere pressure), respectively, with a unit of MPa; t is the time (days) when the flow rate is measured since the sealing valve is opened; R is the radius of the borehole with a unit of m; (m3/ (m3 · MPa1/2)) is the gas content coefficient. is the average of the gas flow rate through the unit area of the borehole surface and is given by the flow rate through the borehole surface, Qf (m3/day), at measuring time of t:
where h is the thickness of the coal seam, with a unit of m.
Substituting Equation (9) into Equation (8), the following general expression for can be obtained:
where the new regression constants are , and . The values of these new constants at different time ranges are given in Table 1.
Since the ranges are given for F0, which depends on as in (9), the computed value of must be checked to satisfy the corresponding validity range of . It was suggested that for a short time t, those for the low value of F0 could be used to check first, and for a long time, those for a high value of F0 are checked first.
The calculation step can be summarised as follows:
- Use Equation (10) to calculate the average flow rate per day per unit area of the borehole surface, ;
- Calculate the gas content coefficient, , with the known in situ gas content, Q, and the in situ gas pressure of the coal seam, p0;
- Calculate A and B from Equation (8) with and t together with the in situ gas pressure, p0, in the coal seam, the pressure p1 in the borehole, and the gas content coefficient, .
- Calculate from Equation (11) with a set of regression constants.
- Calculate the value of . If the value is within the corresponding range, then the value of is chosen as the GCC of the seam for the measurement. If not, then calculate with another set of the regression constants. Repeat the calculation till the range is satisfied.
A simple example was given by Zhou and Lin [16]. The data of the example are: the borehole radius is R = 0.05 m; the thickness of the coal seam is h = 3.5 m; the in situ gas pressure is p0 = 4.0 MPa; the pressure at the borehole is p1 = 0.1 MPa; the gas content coefficient is α = 1.328 m3/(m3·MPa1/2); the flow rate from the borehole measured on the 42nd day is 3.53 m3/d. With these data, it was found that
and 10−2 m2/(MPa2·day). If the dynamic viscosity of methane is 1.05 × 10⁻⁵ Pa·s, then the permeability of the coal seam is 1.29 × 10⁻¹⁸ m2.
A = 1.0 × 10⁻², B = 3.95 × 10⁵
2.3. Field Measurement of Borehole Radial Gas Flow Rate
A general procedure is summarised below.
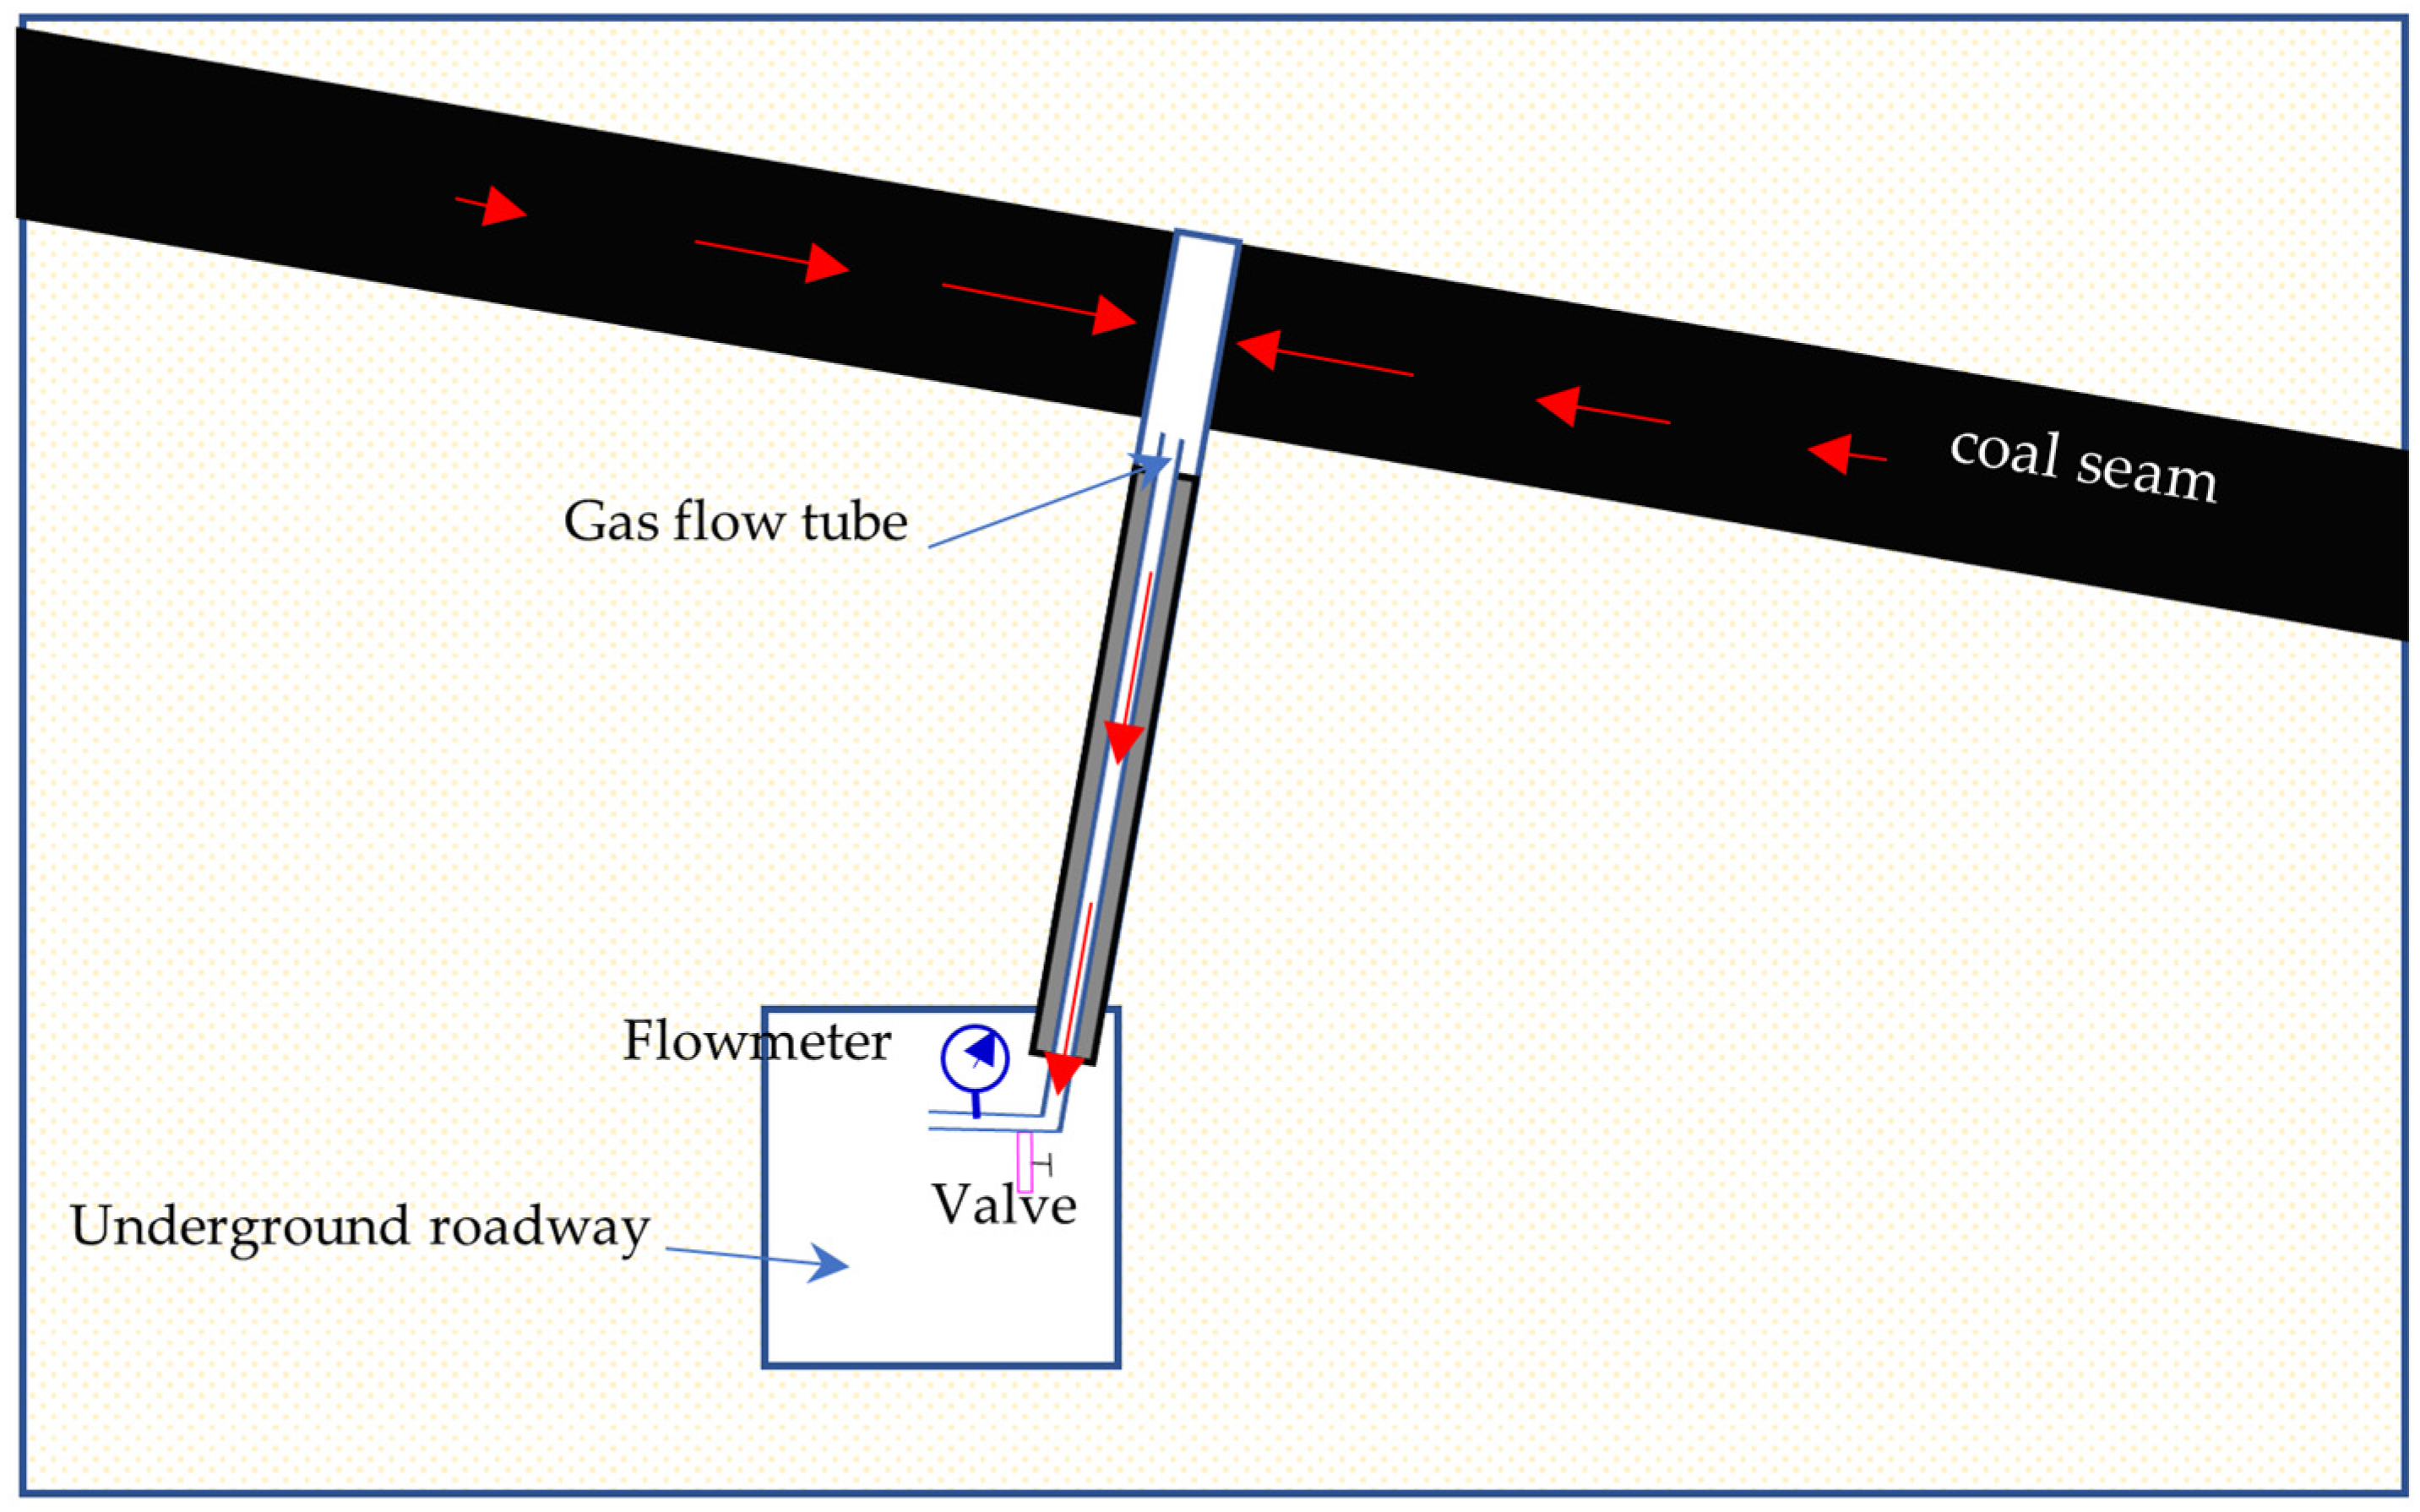
- Drill a borehole perpendicularly to and through the coal seam (Figure 3). Generally, the borehole is drilled from a roadway up into the coal seam.
- Seal the borehole and measure the in situ gas pressure, p0, in the coal seam. The duration of the gas pressure measurement can take 5~30 days, depending on the seam permeability, in situ gas pressure, and whether an inert gas is used to accelerate the measurement.
- Open the sealing valve so that the pressure in the borehole reduces to the ambient air pressure in the roadway.
- Measure the volume of the gas, Qf, emitted naturally from the coal seam into the borehole after the sealing valve was opened. Usually, the gas flow rate is measured several times on different days until the flow rate becomes stable or a less than 10% difference in two measurement intervals (usually 24 h).
Estimate the GCC according to the method described in Section 2.2.
3. The Numerical Model and Assumptions of Gas Flow in Coal Seam
3.1. Mathematical Models
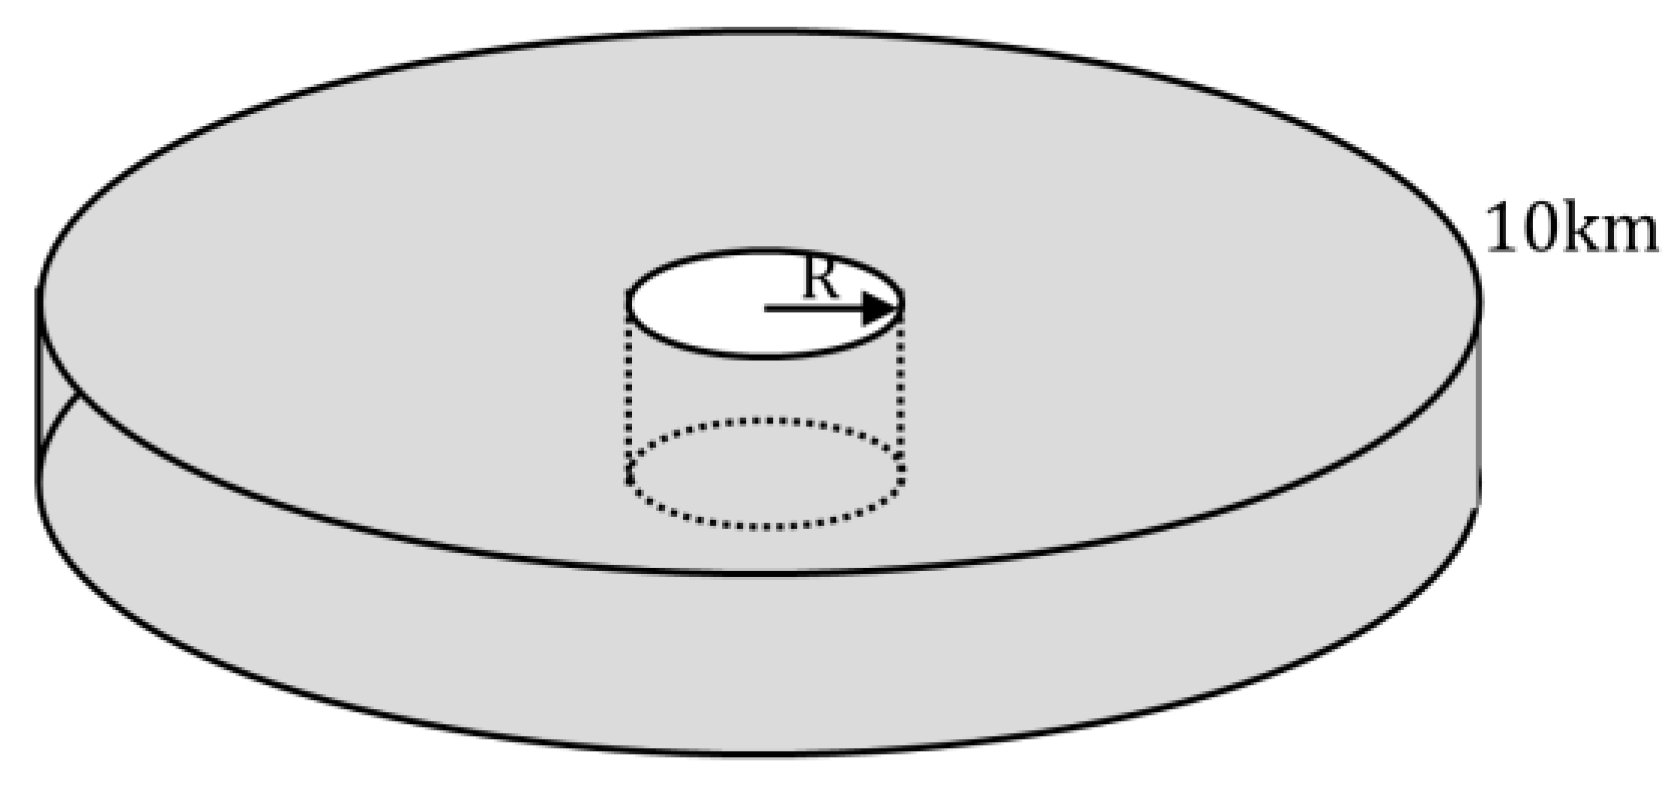
We employed a numerical model for the gas radial flow into a borehole perpendicular to the coal seam to produce the gas flow rate in the borehole for checking the accuracy of the BRF method. The numerical model, as shown in Figure 4, involves a single, flat, horizontal coal seam of uniform thickness and large extent. The uniform thickness is the same as the assumption used in the Chinese method. The large extent of a 10 km radius is designed to minimise the boundary effect for high permeability simulation cases (no spurious effect from the models’ boundary is seen in the modelling results).
The thickness of the seam is mostly irrelevant; for instance, doubling the thickness merely doubles the observed gas flow rate. Therefore, the flow rate is from the thickness of the unit length (m). The seam is pierced by a borehole of a radius of R, as shown in Figure 4. It is assumed that the coal has single porosity (as in the BRF method and with no distinguishment of the pore and cleats), and there is no water in the seam; so, the two-phase flow, water saturation, and the capillarity and relative permeability are not included. This assumption also reflects the field reservoir condition at the time of the borehole flow rate measurement, which would be carried out after the 5~30 days of gas pressure measurement.
The gas flow is assumed to be governed by the conservation of mass, which is Darcy’s equation augmented with the change in gas concentration:
where is the coal porosity (dimensionless); is the adsorbed gas concentration (kg/m3); is the gas density (kg/m3); denotes the vector of the spatial derivatives (m−1); other variables are as used previously.
The gas desorption, which is neglected in the assumptions of the BRF method, is considered in the numerical model. Gas stored in coal is mainly in the adsorbed state. The source of the gas flow in the borehole is due to the desorption governed by the Langmuir equation:
where is the desorption time constant (s); is the Langmuir density (kg(gas)/m3); is the Langmuir pressure (Pa).
These equations are mass-based, rather than based on volumes. However, it is more conventional for engineers to work with gas volumes at a standard temperature and pressure rather than masses. For the conversion, it is assumed that the density of the gas at a standard temperature and pressure is
The adsorbed gas concentration may also be quoted in m3(gas)/tonne (coal), and it is assumed here that the density of coal is
For the adsorbed gas concentration, , given in the unit m3(gas)/tonne (coal), the numerical model will use (with units kg(gas)/m3 (coal)). For the Langmuir volume, , given in m3(gas)/tonne (coal), the numerical model will use (with units kg(gas)/m3(coal)).
3.2. Reservoir Parameters
The initial conditions for the adsorbed gas concentration are homogeneous and fixed as per Table 2, which shows the typical values of the parameters used in the numerical simulations. The radius of the borehole is the typical value used in the Chinese guideline. The initial conditions for the gas pore pressure are homogeneous and equal to
This means that the pore space is fully saturated with gas, and any reduction of the gas pressure will result in gas being desorbed. The boundary conditions are zero fluid flux at the outer edge (10 km from the borehole) and the atmospheric pressure within the borehole.
3.3. Model Results
The above mathematical problem was solved with the finite element framework, MOOSE, for the multiphysics process [28,29]. The model is axially symmetric, and the physics are independent of the vertical position. Close to the borehole, the mesh elements have a size of 7 cm in the radial direction, and this size is increased with the distance from the borehole to become 600 m closer to the outer boundary. Figure 5 and Figure 6 demonstrate some results of the model.
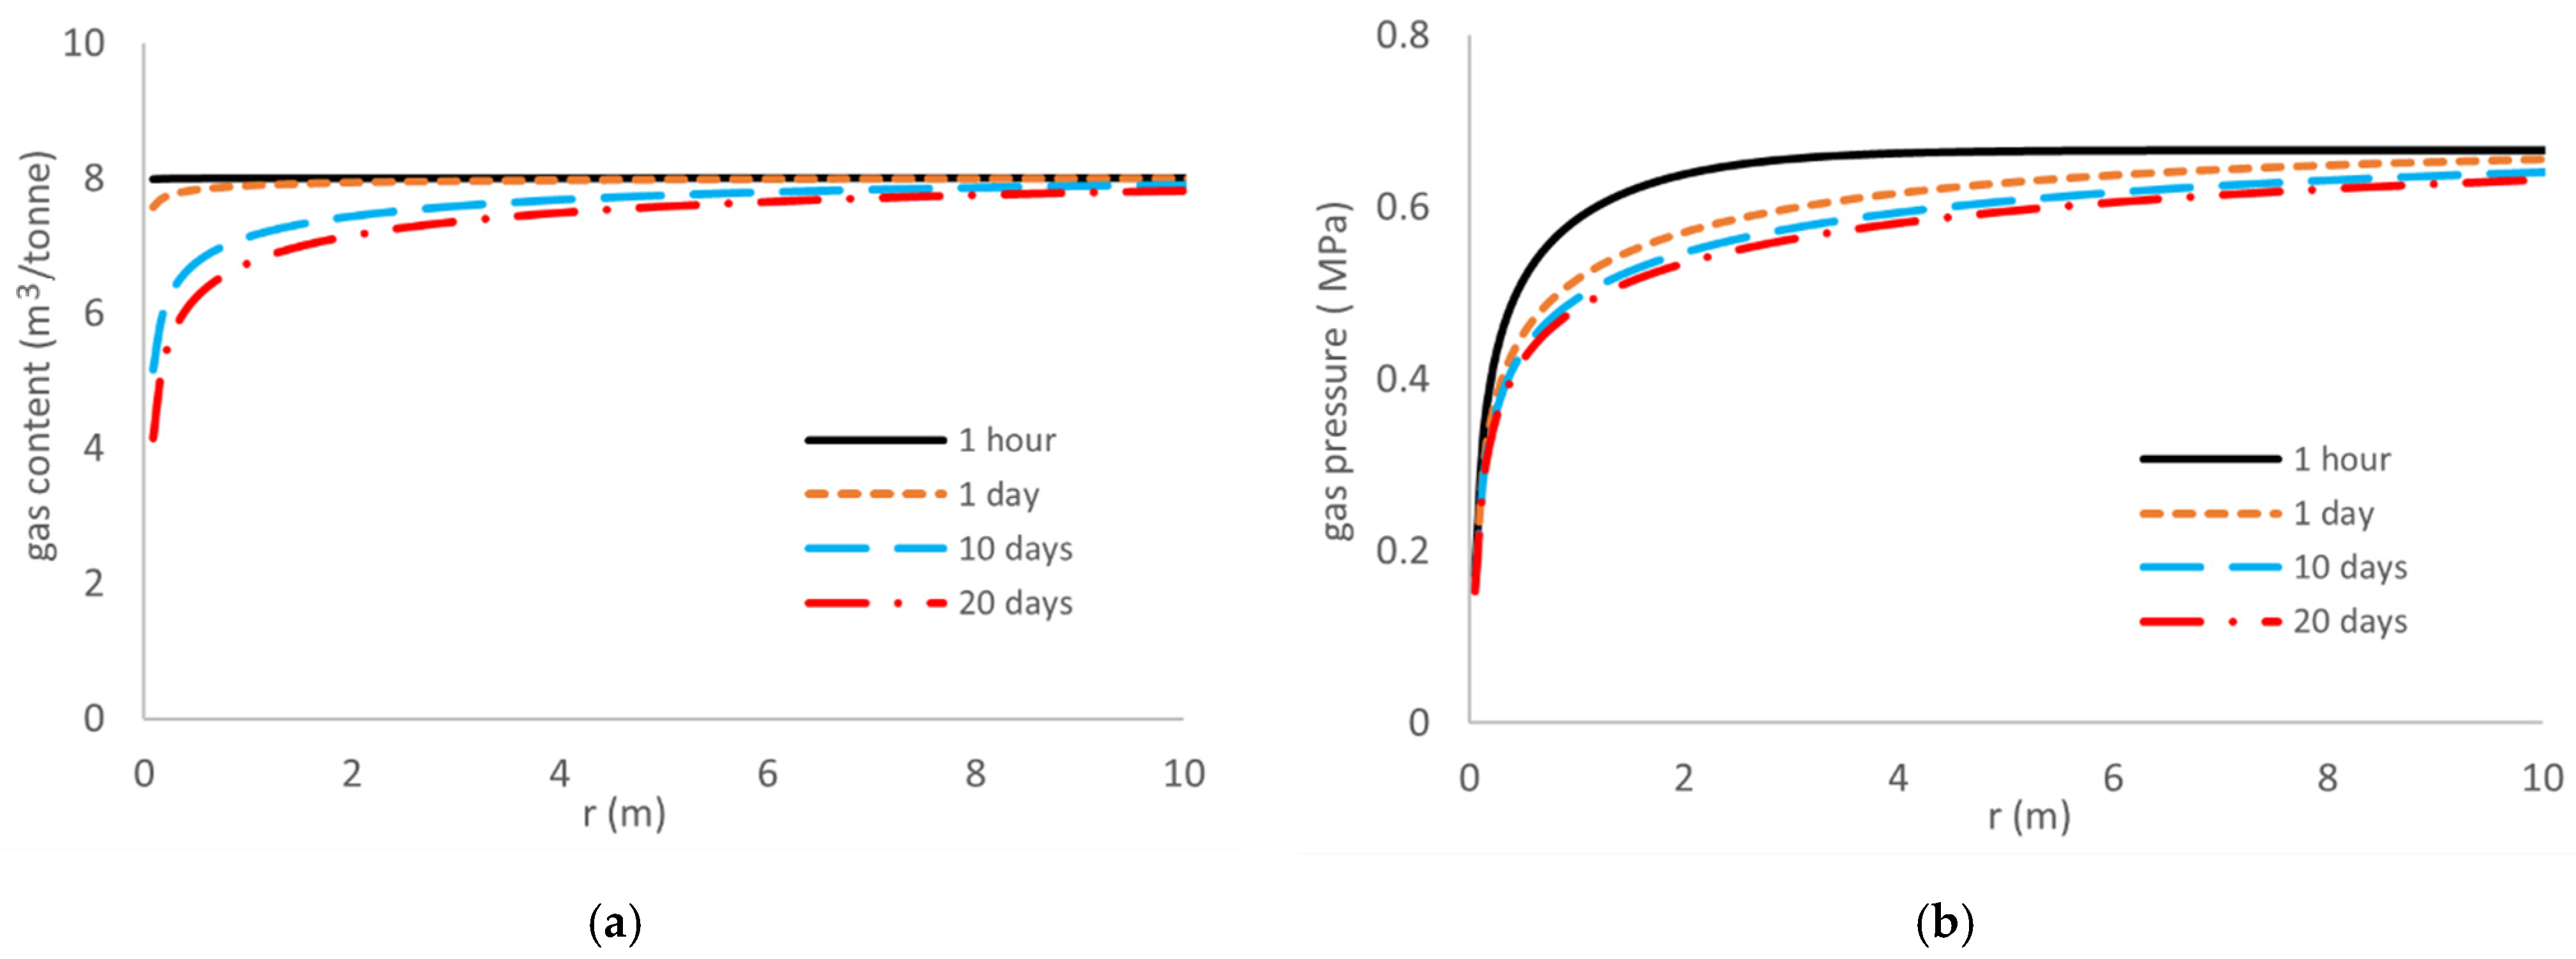
Figure 5 shows the distributions of the gas content and pressure along a radial line at four time instants: 1 h, 1 day, 10 days, and 20 days. The input parameters for these cases are the desorption time constant = 10 days, in situ gas content = 8 m3/tonne, porosity = 0.1, and the permeability = 10−15 m2. The results clearly show the drawdown effect of the gas drainage. The distribution patterns of the gas content and gas pressure around the drainage borehole and their evolution with time are consistent with the numerical modelling results conducted by other researchers [25,30,31].
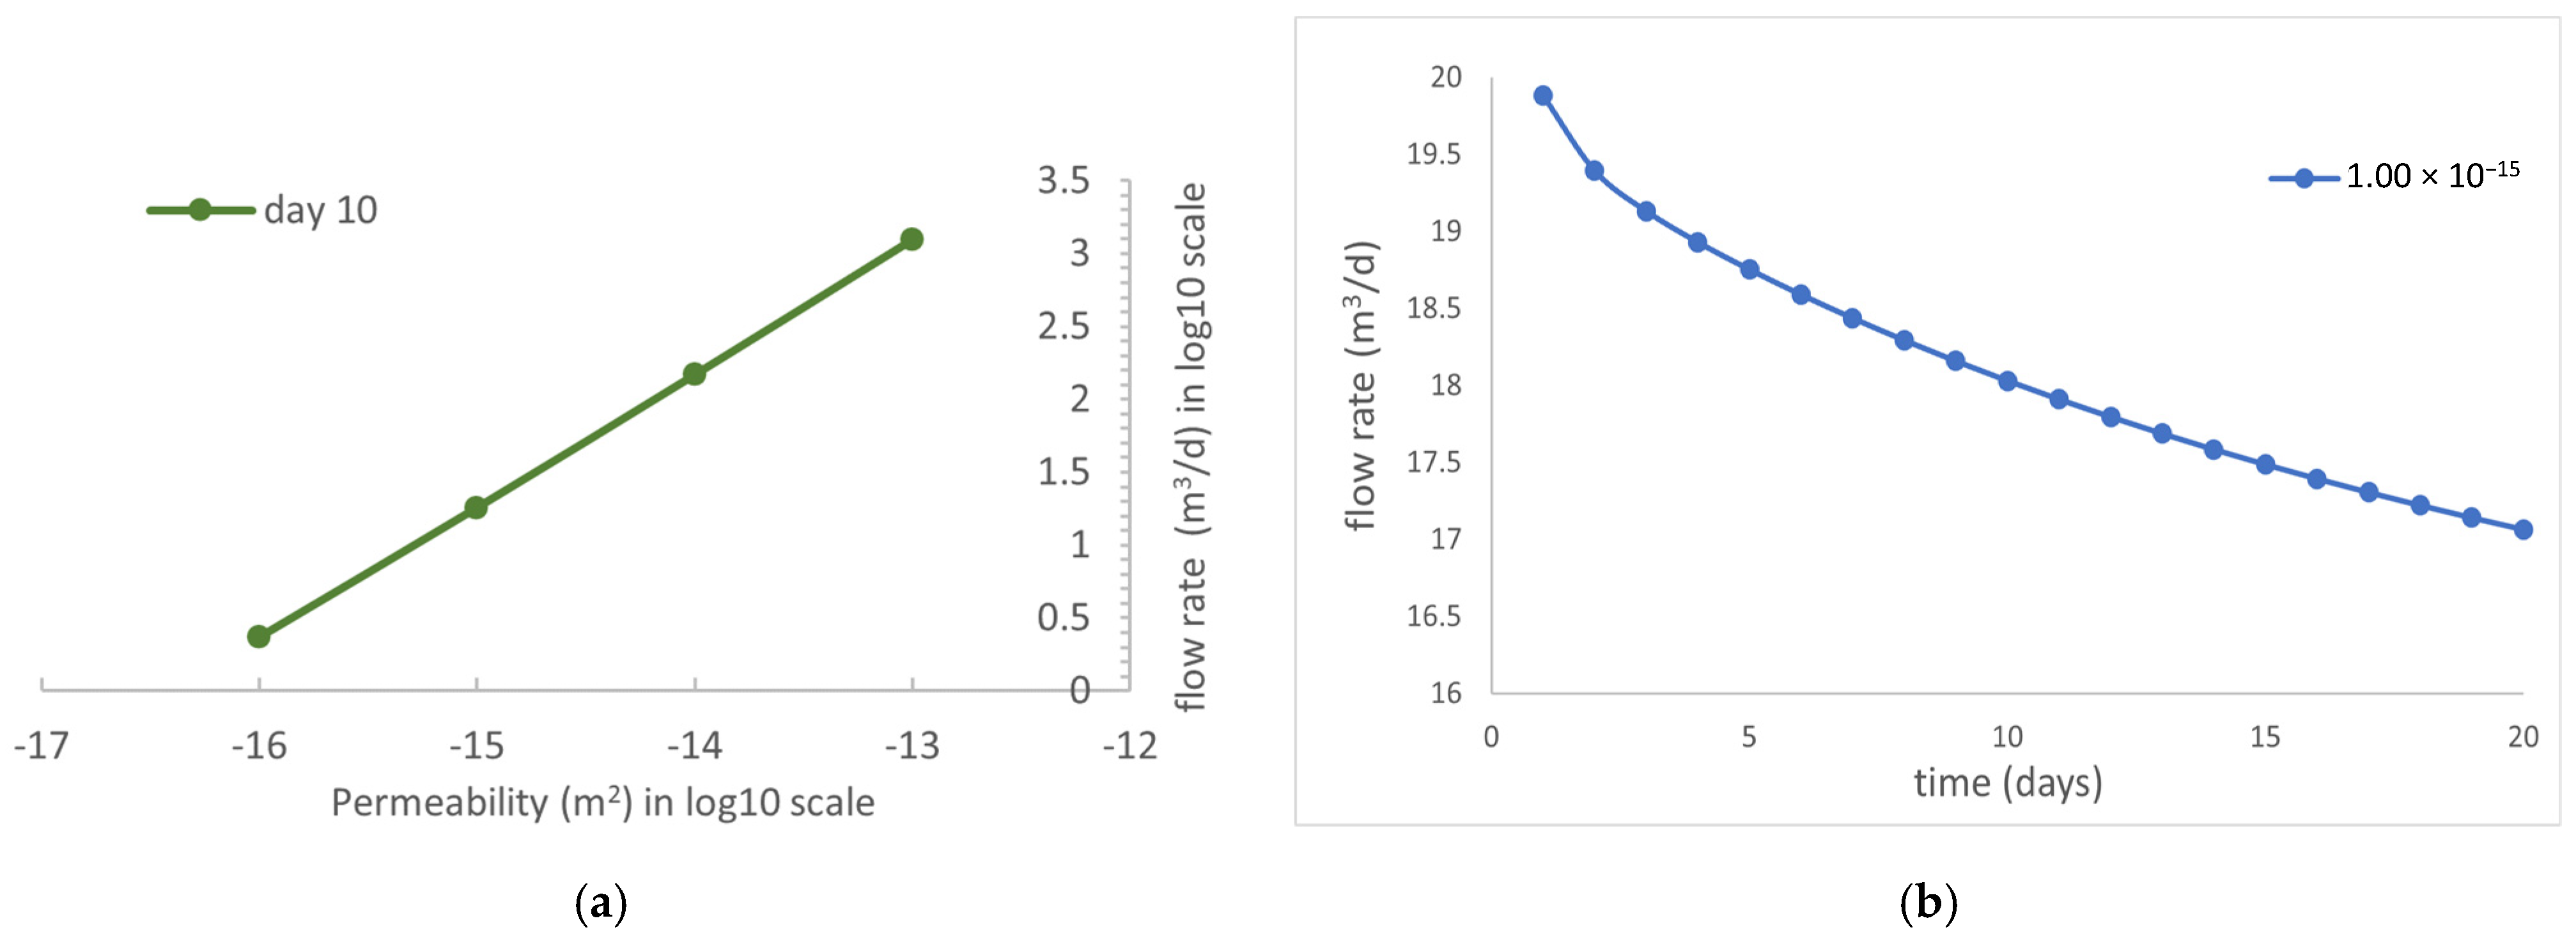
Figure 6 shows variations of the gas flow rate in the borehole with different permeability values and time. Four permeability values are compared in Figure 6a: 10−16 m2, 10−15 m2, 10−14 m2, and 10−13 m2. The model shows that the gas flow rate in the borehole depends on the seam permeability: an increase of permeability by one order of magnitude results in around 8 times greater flow. In addition, the borehole flow rate decreases with the drainage time. Liu et al. [25] found similar trends.
4. Estimation of Permeability from Model Output Using the BRF Method
To thoroughly evaluate the BRF method, a total of 126 cases were simulated, with two porosities, each porosity with seven permeabilities, each permeability with three gas desorption times, and each gas desorption time with three in situ gas contents, as listed in Table 2.
Using the outputs of the flow rates of the 126 numerical simulations, the permeabilities were calculated according to the BRF method, and the impacts of various parameters on the accuracy are presented in the following subsections.
4.1. Impact of Measurement Duration on the Accuracy
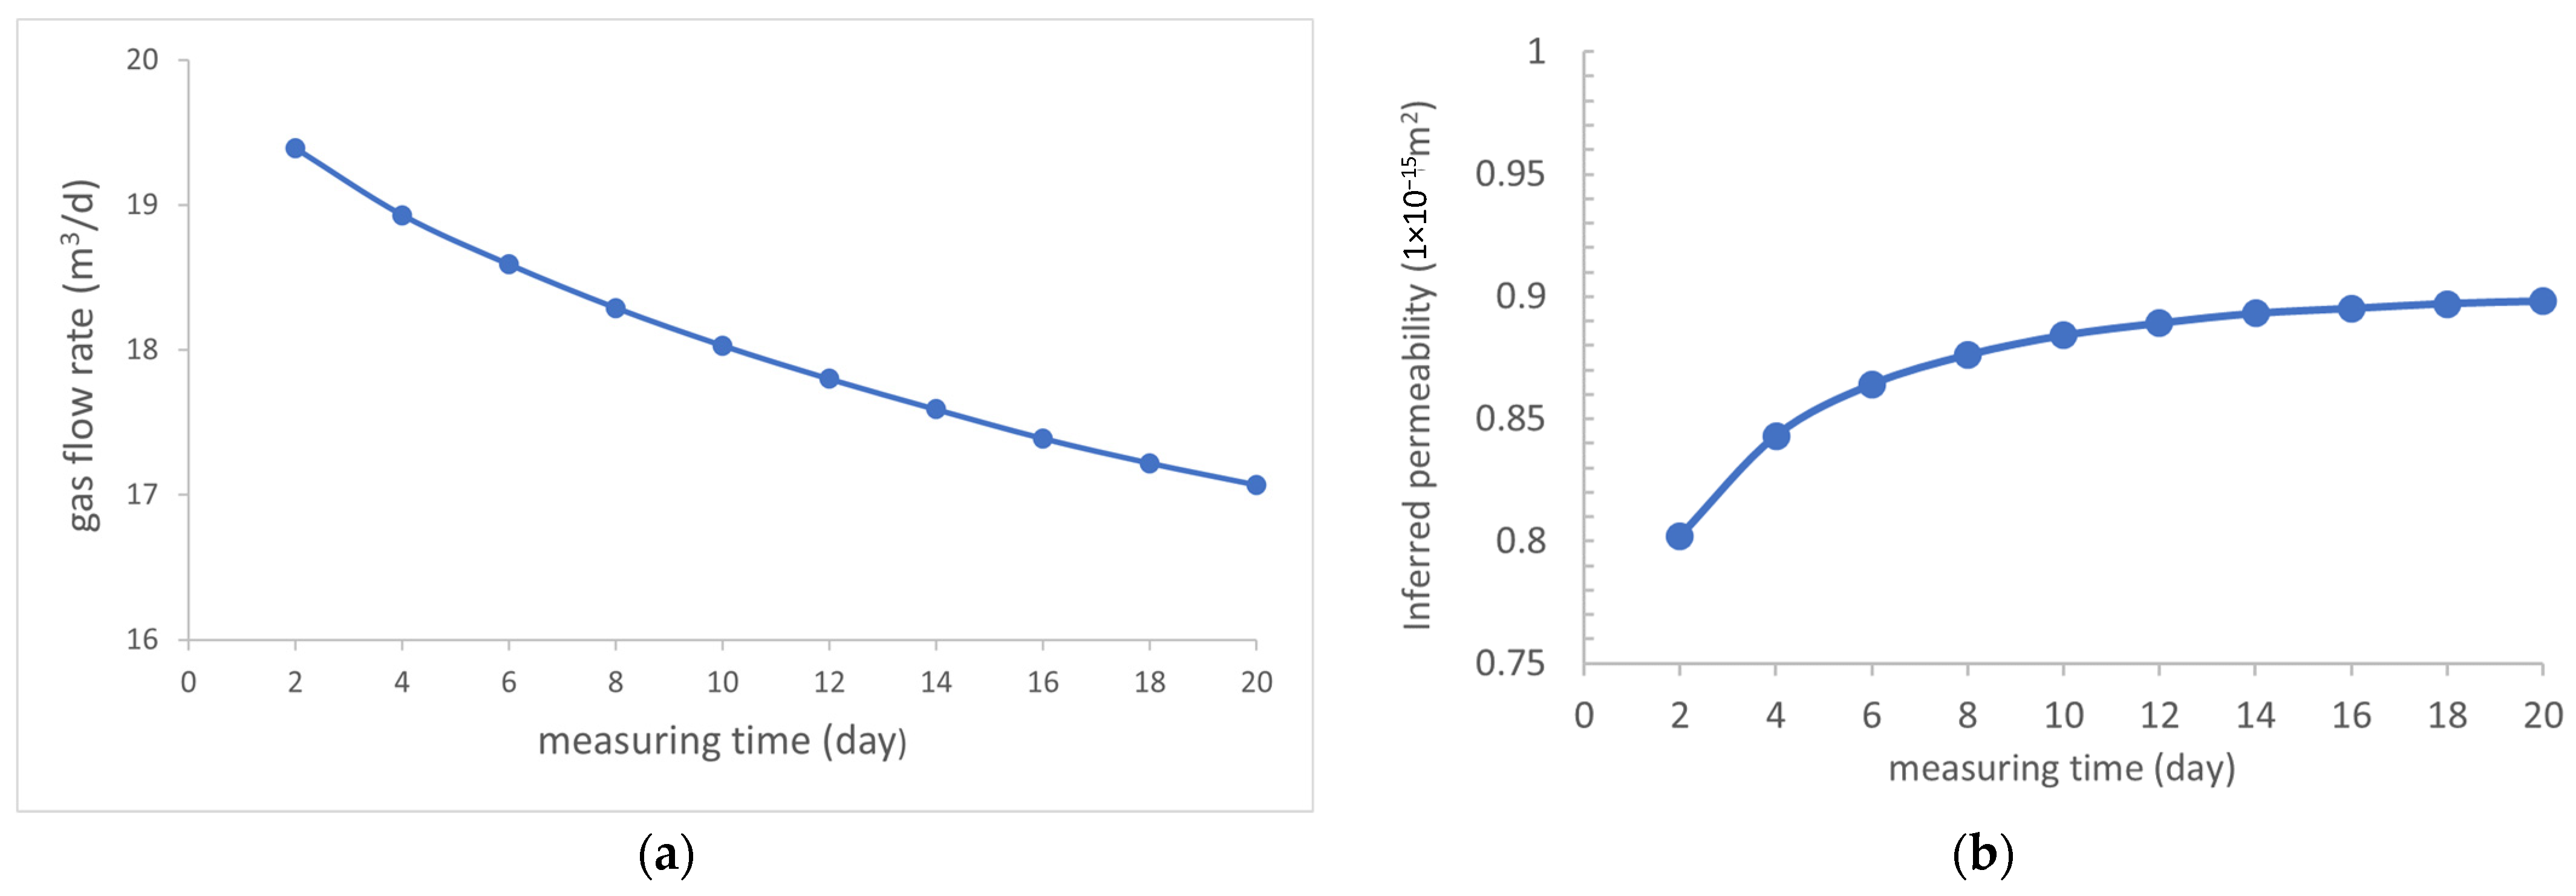
Table 3 shows the predicted permeabilities by the BRF method at different measuring times for the case with an input permeability of 10−15 m2, in situ gas content of 8 m3/tonne, a porosity of 0.1, and a sorption time of 10 days. It contains measurements at 2, 4, 6, …, 20 days. Figure 7 further plots the changes in the borehole flow rate and the estimated permeability with the measurement time. The estimated permeability values increase with the day of measurement, from 0.80 × 10⁻¹⁵ m2 on day 2 to 0.90 × 10⁻¹⁵ m2 on day 20. These values are 80% to 90% of the prescribed model permeability of 10−15 m2. Given that the experimental permeability measurements are always subject to considerable error, this accuracy is acceptable for the purpose of the gas drainage design and outburst control.
The trend of the estimated permeability with a measurement time indicates that the longer the measurement, the better the accuracy. However, after 10 days, the accuracy is not improved significantly; so, in the following analyses, the average permeability between 10 and 20 days is used to define the permeability of each study case.
4.2. Impact of Input Permeability on the Accuracy
The effect of permeability of the coal seam on the prediction accuracy of the BRF method is shown in Table 4, in which the in situ gas content is 8 m3/tonne, and the desorption time constant is 10 days.
With model input permeability varying between 10−13 m2 and 10−18 m2, the BRF method predicts permeability with an accuracy of 86–100%. This suggests that the BRF method is applicable for coal seams within this permeability range.
The accuracy decreases with increasing input permeability. At the very low permeability of 10−18 m2, the accuracy is almost 100%. In contrast, the accuracy at the relatively high permeability of 10−13 m2 is 86%. The declining accuracy with increasing permeability is likely to be related to the assumption of the BRF method that gas diffusion dominates Darcy flow. Higher permeability of coal seam means higher Darcy flow rate or lower domination of the gas diffusion, and thus lead to reduced accuracy. This observation also agrees with findings by Liu et al. [25] who reported that coal matrix with large cleat spacing (this also means high permeability) cannot be adequately represented by a single porosity model as that assumed by the BRF method.
4.3. Impact of Gas Sorption Time on the Accuracy
Table 5 shows the predicted permeabilities for three sorption times. The predicted permeability is the same for the physically realistic sorption times (1 day and 10 days), suggesting that for real mining scenarios, sorption time will not impact the prediction accuracy. However, for the extreme case that has an unrealistically slow sorption time of 106 days, the accuracy is only 71%.
The sorption time constant (the time needed to adsorb 63.2% gas volume) reflects the gas diffusion rate. An extremely long sorption time (e.g., 106 days) leads to a distinguishably low diffusion rate and reduced domination of the gas diffusion over the Darcy flow. This departure from the assumption of the BRF method explains the low accuracy of the extreme case.
4.4. Impact of Gas Content on the Accuracy
The gas volume contained in the coal seam (gas content) is the most critical factor controlling the magnitude of an outburst if it occurs. Table 6 demonstrates that gas content has a limited impact on the prediction accuracy. The case with a low gas content of 4 m3/t is only 1% less in the prediction accuracy than the other two cases with high gas contents of 8 m3/t and 12 m3/t.
A lower gas content results in a lower diffusion rate in the initial period of gas desorption; so, the gas diffusion is less dominant, meaning the BRF method estimation for the low gas content case is slightly less accurate. The gas content is also a reflection of the level of gas pressure in the coal seam through the relationship in Equation (16). Therefore, these results also show the impact of the initial gas pressure on the accuracy.
4.5. Impact of Porosity on the Accuracy
Table 7 compares the effect of coal porosity on the predicted permeability against various model input permeability values. The results indicate that the coal seam porosity has virtually no impact on the accuracy.
5. Summary and Conclusions
Accurately estimating coal seam permeability is critical in coal seam gas extraction and gas outburst control. In Australia, coal seam permeability is normally inferred using the drill stem test or packer test, but Chinese coal mines estimate a parameter called the “gas conductivity coefficient” by measuring the borehole gas flow rate. It is, therefore, natural to wonder how closely the distinct Chinese method estimates coal seam permeability. Resolving this question will allow knowledge and experience in gas drainage and outburst management to be shared between Australian and Chinese coal mines.
Using a numerical modelling approach, this paper evaluates the accuracy of the Chinese method under various reservoir parameters. The model includes the gas desorption process, which is neglected in the assumptions of the Chinese method. The following conclusions can be drawn from the modelling results.
- (1)
- The borehole flow rate method predicts the permeability with an accuracy of approximately 85–100% under typical seam reservoir parameters. This accuracy would be adequate for a mine pre-drainage design and outburst control.
- (2)
- The actual permeability of the coal seam impacts the prediction accuracy more than any other parameters. The Chinese method is more accurate for lower permeability: it is almost 100% at a permeability of 10−18 m2 (0.001 mD) but around 85% at a relatively high permeability of 10−13 m2 (100 mD).
- (3)
- Other reservoir parameters, including the sorption time, porosity, and gas content/pressure have a negligible effect on the prediction accuracy.
- (4)
- The duration of the measurement could slightly affect the prediction accuracy. The longer the measurement, the higher the accuracy. However, for practical purposes, the accuracy is not improved significantly after 10 days of measurement.
- (5)
- The ease of the gas flow in the coal seam compared to the speed of the gas diffusion from the micropores to macropores controls the accuracy of the Chinese method. The reservoir parameters, which mean a low Darcy flow rate, such as a low permeability, or high diffusion rate, such as an extremely short sorption time, give high accuracy.
Author Contributions
Conceptualization, Q.Q.; methodology, J.S., Q.Q. and A.W.; validation, J.S. and A.W.; formal analysis, J.S. and A.W.; writing—original draft preparation, J.S. and Q.Q.; writing—review and editing, Q.Q., J.S. and A.W.; project administration, Q.Q.; funding acquisition, Q.Q. All authors have read and agreed to the published version of the manuscript.
Funding
This research was funded by the Australian Coal Association through the ACARP program.
Institutional Review Board Statement
Not applicable.
Informed Consent Statement
Not applicable.
Data Availability Statement
Not applicable.
Acknowledgments
Special thanks are due to the industry monitors from ACARP of this research project for their suggestions, monitoring, and management of the project. The authors also wish to express their gratitude to Hongwei Jin of Xi’an of the University of Science and Technology, China, for sharing his knowledge.
Conflicts of Interest
The authors declare no conflict of interest.
References
- Pan, Z.; Connell, L.D. Modelling permeability for coal reservoirs: A review of analytical models and testing data. Int. J. Coal Geol. 2012, 92, 1–44. [Google Scholar] [CrossRef]
- Mehdi, N.; Rafiee, R. Development of a new index for methane drainageability of a coal seam using the fuzzy rock engineering system. Rud.-Geol.-Naft. Zb. 2019, 34, 33–44. [Google Scholar] [CrossRef]
- Qu, Q.; Guo, H.; Balusu, R. Methane emissions and dynamics from adjacent coal seams in a high permeability multi-seam mining environment. Int. J. Coal Geol. 2022, 253, 103969. [Google Scholar] [CrossRef]
- Lama, R.; Bodziony, J. Management of outburst in underground coal mines. Int. J. Coal Geol. 1998, 35, 83–115. [Google Scholar] [CrossRef]
- Black, D. Investigations into the identification and control of outburst risk in Australian underground coal mines. Int. J. Min. Sci. Technol. 2017, 27, 749–753. [Google Scholar] [CrossRef]
- Kabir, A.; McCalmont, S.; Street, T.; Johnson, R. Reservoir characterisation of Surat Basin coal seams using drill stem tests. In Proceedings of the SPE Asia Pacific Oil and Gas Conference and Exhibition, Jakarta, Indonesia, 20–22 September 2011. [Google Scholar] [CrossRef]
- Kamenar, A.; Taco, G.; Edgoose, J. How to plan a safe and successful permeability test program in coal seams. In Proceedings of the 17th Coal Operators’ Conference, University of Wollongong, Wollongong, Australia, 8–10 February 2017; pp. 341–349. [Google Scholar]
- Busse, J.; Scheuermann, A.; Bringemeier, D.; Hossack, A.; Li, L. In-situ coal seam and overburden permeability char-acterization combining downhole flow meter and temperature logs. Contemp. Trends. Geosci. 2016, 5, 1–17. [Google Scholar] [CrossRef]
- Andrews, K.; Keim, S. Underground mine stream crossing assessment: A multi-disciplinary approach. Int. J. Min. Sci. Technol. 2020, 31, 59–65. [Google Scholar] [CrossRef]
- Rushing, J.A.; Blasingame, T.A.; Johnstone, J.L.; Lee, W.J. Slug testing in multiple coal seams intersected by a single, vertical fracture. In Proceedings of the 66th Annual Technical Conference and Exhibition of the Society of Petroleum Engineers, Dallas, TX, USA, 6–9 October 1991. [Google Scholar]
- Szpunar, T.; Budak, P. Methods for evaluation of “in situ” coal permeability in underground coal mines using hydrodynamic test data. Nafta Gaz 2018, 74, 443–450. [Google Scholar] [CrossRef]
- Hua, J.J.; Li, Z.; Zhang, M.J. Simple measurement method of permeability coefficient of coal seam. Coal 2011, 140, 92–94. (In Chinese) [Google Scholar]
- Xing, Y.Q.; Zhou, L.C. Application of measurement method of permeability coefficient of coal seam in methane extraction. Coal Sci. Tech. Mag. 2011, 4, 51–52. (In Chinese) [Google Scholar]
- Zhang, L.; Zhou, L.C.; Wang, H.W.; Pan, Y.Q.; Sun, J.L.; Sun, B.L. Application of measurement method of permeability coefficient of coal seam in Pinggou Coal Mine. Hydraul. Coal Min. Pipeline Transp. 2011, 1, 3–5. (In Chinese) [Google Scholar]
- Zhou, S.X. Study on measurement technology of permeability coefficient of coal seam in Yanghe Coal Industry Company. China Energy Environ. Prot. 2018, 40, 81–84. (In Chinese) [Google Scholar]
- Zhou, S.N.; Lin, B.Q. The Theory of Gas Flow and Storage in Coal Seams; China Coal Industry Publishing House: Beijing, China, 1998. (In Chinese) [Google Scholar]
- Zhou, S.N. Measurement and calculation of coal seam permeability coefficient. J. China Inst. Min. Technol. 1980, 1, 1–5. (In Chinese) [Google Scholar]
- Zhou, S.N. Testing on the two kinds of coal seam permeability coefficient of determination methods with computer. J. China Inst. Min. Technol. 1984, 13, 38–47. (In Chinese) [Google Scholar]
- Sun, J.; Ma, P.; Chen, J. Problems and solutions of formula for calculating permeability coefficient of coal seam by radial flow method. Saf. Coal Mines 2008, 39, 89–90. [Google Scholar]
- National Coal Mine Safety Administration. Measuring Method for Gas Permeability Coefficient of Coal Seam—Radial Flow Method; MT/T 1173–2019; National Coal Mine Safety Administration: Arlington, VA, USA, 2019.
- Jiang, C. Study on the method of measuring permeability coefficient of coal seam. J. China Inst. Min. Technol. 1988, 2, 77–83. [Google Scholar]
- Wang, L.; Liu, S.; Cheng, Y.; Yin, G.; Zhang, D.; Guo, P. Reservoir reconstruction technologies for coalbed methane recovery in deep and multiple seams. Int. J. Min. Sci. Technol. 2017, 27, 277–284. [Google Scholar] [CrossRef]
- Pinetown, K.L. Regional coal seam gas distribution and burial history of the Hunter Coalfield, Sydney Basin. Aust. J. Earth Sci. 2014, 61, 409–426. [Google Scholar] [CrossRef]
- Shu, D.M.; Chamberlain, J.A.; Lakshmanan, C.C. Estimation of in-situ coal permeability and modelling of methane pre-drainage from in-seam holes. In Proceedings of the International Symposium-Cum Workshop on Management & Control of High Gas Emission & Outbursts, Wollongong, NSW, Australia, 20–24 March 1995. [Google Scholar]
- Liu, Q.; Chu, P.; Zhu, J.; Cheng, Y.; Wang, D.; Lu, Y.; Liu, Y.; Xia, L.; Wang, L. Numerical assessment of the critical factors in determining coal seam permeability based on the field data. J. Nat. Gas Sci. Eng. 2019, 74, 103098. [Google Scholar] [CrossRef]
- Lin, M.; Lin, B.; Yang, W.; Zhao, Y.; Wang, Z. In-situ testing method of the permeability coefficient in a coal seam based on the finite volume method and its application. J. Nat. Gas Sci. Eng. 2021, 97, 104370. [Google Scholar] [CrossRef]
- Li, B.R.; Deng, P.J.; Li, Z.W.; Wang, R.M. Optimized methods for calculating permeability coefficient of coal seam based on COMSOL Multiphysics. Coal Mine Saf. 2018, 49, 156–159. (In Chinese) [Google Scholar]
- Wilkins, A.; Green, C.P.; Ennis-King, J. PorousFlow: A multiphysics simulation code for coupled problems in porous media. J. Open Source Softw. 2020, 5, 2176. [Google Scholar] [CrossRef]
- Wilkins, A.; Green, C.P.; Ennis-King, J. An open-source multiphysics simulation code for coupled problems in porous media. Comput. Geosci. 2021, 154, 104820. [Google Scholar] [CrossRef]
- Wei, P.; Huang, C.; Li, X.; Peng, S.; Lu, Y. Numerical simulation of boreholes for gas extraction and effective range of gas extraction in soft coal seams. Energy Sci. Eng. 2019, 7, 1632–1648. [Google Scholar] [CrossRef]
- Xu, H.; Wang, G.; Guo, Y.Y.; Chang, B.; Hu, Y.; Fan, J. Theoretical, numerical, and experimental analysis of effective extraction radius of coalbed methane boreholes by a gas seepage model based on defined criteria. Energy Sci. Eng. 2019, 8, 880–897. [Google Scholar] [CrossRef]
Figure 1.
Laminar flow of gas in a coal seam.

Figure 2.
Illustration of gas radial flow around a borehole through a coal seam: (a) oblique view; (b) cross-section view.
Figure 2.
Illustration of gas radial flow around a borehole through a coal seam: (a) oblique view; (b) cross-section view.

Figure 3.
Schematic of the field configuration of the BRF method (modified from [20,25]). The seam gas pressure, which equals the critical desorption pressure of the seam, is first measured before opening the valve to measure the borehole gas flow rate.

Figure 4.
Model geometry: a single coal seam with a radius of 10 km is pierced by a borehole with a radius of R.
Figure 4.
Model geometry: a single coal seam with a radius of 10 km is pierced by a borehole with a radius of R.

Figure 5.
Radial distribution of (a) gas content and (b) gas pressure around the borehole at four different times.
Figure 5.
Radial distribution of (a) gas content and (b) gas pressure around the borehole at four different times.

Figure 6.
Variation of borehole flow rate with (a) permeability on day 10 and (b) time under a permeability of 10−15 m2.
Figure 6.
Variation of borehole flow rate with (a) permeability on day 10 and (b) time under a permeability of 10−15 m2.

Figure 7.
Time variation of (a) gas flow rate and (b) predicted permeability for the case of the input model permeability, 10−15 m2.
Figure 7.
Time variation of (a) gas flow rate and (b) predicted permeability for the case of the input model permeability, 10−15 m2.


Table 1.
The values of the regression constants in Equation (11) at different time ranges of F0 (Zhou and Lin [16]).
Table 1.
The values of the regression constants in Equation (11) at different time ranges of F0 (Zhou and Lin [16]).
| F0 | |||
|---|---|---|---|
| 10−2–1.0 | 1.00 | 1.61 | 0.61 |
| 1.0–10 | 1.00 | 1.39 | 0.39 |
| 10–102 | 1.10 | 1.25 | 0.25 |
| 102–103 | 1.83 | 1.14 | 0.14 |
| 103–105 | 2.10 | 1.11 | 0.11 |
| 105–107 | 3.14 | 1.07 | 0.07 |
Table 2.
Values of parameters used in the numerical study.
| Parameter | Value(s) | Notes |
|---|---|---|
| Borehole radius, R [m] | 0.05 | Typical small borehole size used in the Chinese method. |
| Simulation time [days] | 20 | This is typical of experiments performed in the field. |
| Coal porosity, | 0.05, 0.1 | Without gas desorption, time would scale with , meaning could be scaled out of the problem, but with desorption, this is not the case. |
| Coal permeability, [m2] | 10−12, 10−13, 10−14, 10−15, 10−16, 10−17, 10−18 | Without gas desorption, permeability could be scaled out of the problem. For comparison with hydraulic (water flow) problems: . |
| Desorption time constant, [days] | 1, 10, 106 | The case of means that no desorption will occur. |
| Langmuir pressure, [MPa] | 1 | |
| Langmuir volume, [m3/tonne] | 20 | |
| Initial gas content, [m3/tonne] | 4, 8, 12 | Must be less than the Langmuir volume. |
| Gas density and viscosity | Variable | A high-precision equation of state for methane is used, which is in contrast to the ideal gas assumption used in the Chinese method. |
| In situ temperature [K] | 303 | This impacts the gas density and viscosity through the equation of state. The temperature is assumed fixed. |
| Atmospheric pressure [kPa] | 101 | Assumed to be fixed. |
Table 3.
Predicted permeabilities for different measuring times. The prescribed permeability for the case is 10−15 m2.
Table 3.
Predicted permeabilities for different measuring times. The prescribed permeability for the case is 10−15 m2.
| Measuring Time (day) | Flow Rate (m3/d) | Predicted Permeability (× 10−15 m2) |
|---|---|---|
| 2 | 19.39 | 0.802 |
| 4 | 18.93 | 0.843 |
| 6 | 18.59 | 0.864 |
| 8 | 18.29 | 0.876 |
| 10 | 18.03 | 0.884 |
| 12 | 17.80 | 0.889 |
| 14 | 17.59 | 0.893 |
| 16 | 17.39 | 0.895 |
| 18 | 17.22 | 0.897 |
| 20 | 17.07 | 0.898 |
Table 4.
Effect of input permeability on the accuracy (gas content = 8 m3/t, τ = 10 days, porosity = 0.10).
Table 4.
Effect of input permeability on the accuracy (gas content = 8 m3/t, τ = 10 days, porosity = 0.10).
| Model input permeability (m2) | 1.0 × 10⁻¹⁸ | 1.0 × 10⁻¹⁷ | 1.0 × 10⁻¹⁶ | 1.0 × 10⁻¹⁵ | 1.0 × 10⁻¹⁴ | 1.0 × 10⁻¹³ |
| Predicted permeability (m2) | 0.99 × 10⁻¹⁸ | 0.98 × 10⁻¹⁷ | 0.91 × 10⁻¹⁶ | 0.89 × 10⁻¹⁵ | 0.88 × 10⁻¹⁴ | 0.86 × 10⁻¹³ |
Table 5.
Effect of sorption time on the accuracy (gas content = 8 m3/t, porosity = 0.10).
| Model Input Permeability (m2) | Estimated Permeability (m2) by the BRF Method | ||
|---|---|---|---|
| τ = 1 day | τ = 10 days | τ = 106 days | |
| 1.0 × 10⁻¹⁵ | 0.89 × 10⁻¹⁵ | 0.89 × 10⁻¹⁵ | 0.71 × 10⁻¹⁵ |
Table 6.
Effect of gas content (GC) on the accuracy (with τ = 10 days and porosity = 0.10).
| Model Input Permeability (m2) | Estimated Permeability (m2) by the BRF Method | ||
|---|---|---|---|
| GC = 4 m3/t | GC = 8 m3/t | GC = 12 m3/t | |
| 1.0 × 10⁻¹⁵ | 0.88 × 10⁻¹⁵ | 0.89 × 10⁻¹⁵ | 0.89 × 10⁻¹⁵ |
Table 7.
Effect of porosity on the accuracy (gas content = 8 m3/t and τ = 10 days).
| Model input permeability (m2) | 1.0 × 10⁻¹⁸ | 1.0 × 10⁻¹⁷ | 1.0 × 10⁻¹⁶ | 1.0 × 10⁻¹⁵ | 1.0 × 10⁻¹⁴ | 1.0 × 10⁻¹³ |
| Predicted permeability (m2) at 0.05 porosity | 0.99 × 10⁻¹⁸ | 0.98 × 10⁻¹⁷ | 0.91 × 10⁻¹⁶ | 0.89 × 10⁻¹⁵ | 0.88 × 10⁻¹⁴ | 0.86 × 10⁻¹³ |
| Predicted permeability (m2) at 0.10 porosity | 0.99 × 10⁻¹⁸ | 0.99 × 10⁻¹⁷ | 0.91 × 10⁻¹⁶ | 0.89 × 10⁻¹⁵ | 0.88 × 10⁻¹⁴ | 0.86 × 10⁻¹³ |
Publisher’s Note: MDPI stays neutral with regard to jurisdictional claims in published maps and institutional affiliations. |
© 2022 by the authors. Licensee MDPI, Basel, Switzerland. This article is an open access article distributed under the terms and conditions of the Creative Commons Attribution (CC BY) license (https://creativecommons.org/licenses/by/4.0/).
Share and Cite
MDPI and ACS Style
Qu, Q.; Shi, J.; Wilkins, A. A Numerical Evaluation of Coal Seam Permeability Derived from Borehole Gas Flow Rate. Energies 2022, 15, 3828. https://0-doi-org.brum.beds.ac.uk/10.3390/en15103828
AMA Style
Qu Q, Shi J, Wilkins A. A Numerical Evaluation of Coal Seam Permeability Derived from Borehole Gas Flow Rate. Energies. 2022; 15(10):3828. https://0-doi-org.brum.beds.ac.uk/10.3390/en15103828
Chicago/Turabian StyleQu, Qingdong, Jingyu Shi, and Andy Wilkins. 2022. "A Numerical Evaluation of Coal Seam Permeability Derived from Borehole Gas Flow Rate" Energies 15, no. 10: 3828. https://0-doi-org.brum.beds.ac.uk/10.3390/en15103828
Note that from the first issue of 2016, this journal uses article numbers instead of page numbers. See further details here.