Article

Degradation Evaluation Method with a Test Device for Aging Diagnosis in PV Modules †

Department of Electrical Engineering, Korea University of Technology & Education, Cheonan 31253, Korea
*
Author to whom correspondence should be addressed.
The present work is an extension of the paper “Degradation Evaluation Method with Test Device for Aging Diagnosis in PV Modules” presented to APAP 2021 Conference, Jeju, Korea, 11–14 October, and published in Energy Procedia.
Submission received: 30 March 2022 / Revised: 26 April 2022 / Accepted: 20 May 2022 / Published: 24 May 2022

Abstract

:
Generally, PV (photovoltaic) modules are known as devices which are used semi-permanently for more than 20 years, but the electrical performance and lifespan of PV modules can be significantly degraded due to various environmental factors. Thus, a proper evaluation method for aging phenomenon of PV modules is required. Although there already are methods which compare adjusted PV output power based on STC (standard test condition) with initial PV module specification, or perform direct comparison by conducting the test under STC, there are issues with objectivity or efficiency in the existing evaluation method of aging phenomenon due to the data distortion while adjusting measured data or difficulties in implementation. Therefore, in order to overcome the above-mentioned disadvantage of the existing evaluation method for deterioration in PV modules and evaluate the aging characteristics of PV modules based on on-site measurement data in an accurate and efficient manner, this paper implements a test device for aging diagnosis to measure and collect actual data from a PV module section, and presents a modeling of data analysis for aging phenomenon with MATLAB S/W in order to minimize the variability of PV output, communication error, delay, etc. Furthermore, this paper confirms the usefulness of the presented test device for aging diagnosis of the PV modules which is accurately evaluated by considering on-site measurement of PV output power by season.

1. Introduction

Even though the global economy has substantially slowed down due to the COVID-19 pandemic, the PV industry has tended to grow continuously, according to the report from HIS Markit [1] and MERCOM [2]. Specifically, the installation capacity of PV systems across the world in 2021 is expected to grow up to 171 GW, which is increased by 22% compared with 138.2 GW of installation capacity in 2020, from the report of Solarpower Europe. It is also predicted that the PV installation will surpass the barrier of 200 GW for the first time in an article published by institute for energy economics and financial analysis [3,4].
Accordingly, the government of South Korea has been promoting projects which aim to expand the capacity of RES (renewable energy source) up to 35% by 2040 based on the “third energy master plan”. Consequently, a massive amount of PV systems are being installed across the country [5,6]. However, a proper evaluation method of aging phenomenon of PV modules is required as the electrical performance and lifespan of PV modules can be significantly degraded due to various environmental factors, while PV modules are generally known as devices which are used semi-permanently for more than 20 years [7,8].
The existing evaluation methods for aging characteristics are either performed by comparing the adjusted measurement data compensated by the STC (standard test condition) with the initial specification data provided by the PV manufacturer or carried out by conducting the test under the STC for the evaluation [9,10]. Although the former method considers diverse environmental parameters such as temperature, solar radiation, humidity, etc., by substituting them into mathematical expressions in order to evaluate the degradation rate of electrical characteristics such as output power, voltage, or current with respect to STC, the reliability of calculated results may lack due to errors, which inevitably occur during data compensation depending on the complexity of the calculation process [11]. Additionally, the latter method, which does not require the process of mathematical compensation for environmental parameters, can accurately evaluate the aging characteristics through direct comparison between the output characteristics of aged PV module under the STC and the initial specification data provided by the manufacturer, however, this method is very inefficient for the users because it requires specific equipment to establish testing facilities, which precisely satisfies the STC, and needs to separate the PV modules from the entire circuit connections in order to conduct the evaluation test [12].
Therefore, in order to overcome the problem of reliability of the former method due to errors, and the problem of inefficiency of the latter method, which requires facilities for STC, this paper evaluates the deterioration range of PV modules by calculating the output power reduction rate, based on the difference in actual measurement output power between aged PV modules, which have been operating in an actual PV power plant for 18 years, and new PV modules, which were manufactured in 2019, under the same operation conditions. However, since environmental factors such as solar radiation and temperature affect the output characteristics of PV modules, which is a significant index for deterioration evaluation to a large extent, the environmental factors should be considered for evaluation of the deterioration rate in PV modules. These environmental factors are directly related to the weather conditions, especially the solar radiation and temperature in each season of Korea, which can be distinctly classified. Specifically, the solar radiation decreases in the order of summer, fall, spring and winter, while the temperature increases in the same order. Furthermore, due to the characteristics of PV modules that the output power increases along with solar radiation and decreases when temperature increases, this paper evaluates the characteristics of output power in PV modules by considering the distinct difference in solar radiation and temperature in each season, and then calculates the entire period and yearly degradation rate of aged PV modules, accordingly.
Therefore, in order to proceed the deterioration evaluation in PV modules by obtaining the actual measurement of output power of aged and new PV modules, this paper implements a test device for aging diagnosis in a PV system, which consists of a PV module section and a monitoring section, where the real-time data measured in a PV module section is transmitted to the monitoring section to be collected and monitored. Furthermore, this paper proposes a modeling of data evaluation for aging characteristics with MATLAB S/W in order to minimize the variability of PV output power, communication error, delay, etc., and to enhance the accuracy of collected data by smoothing the 1 min measured solar radiation, temperature of PV modules, and module-basis output data. On the other hand, this paper presents aging characteristics of PV modules by evaluating monthly, yearly and season-basis parameters based on the on-site measurement data such as solar radiation and module temperature from January to October of 2020, in order to evaluate output power and aging characteristics in an accurate manner.

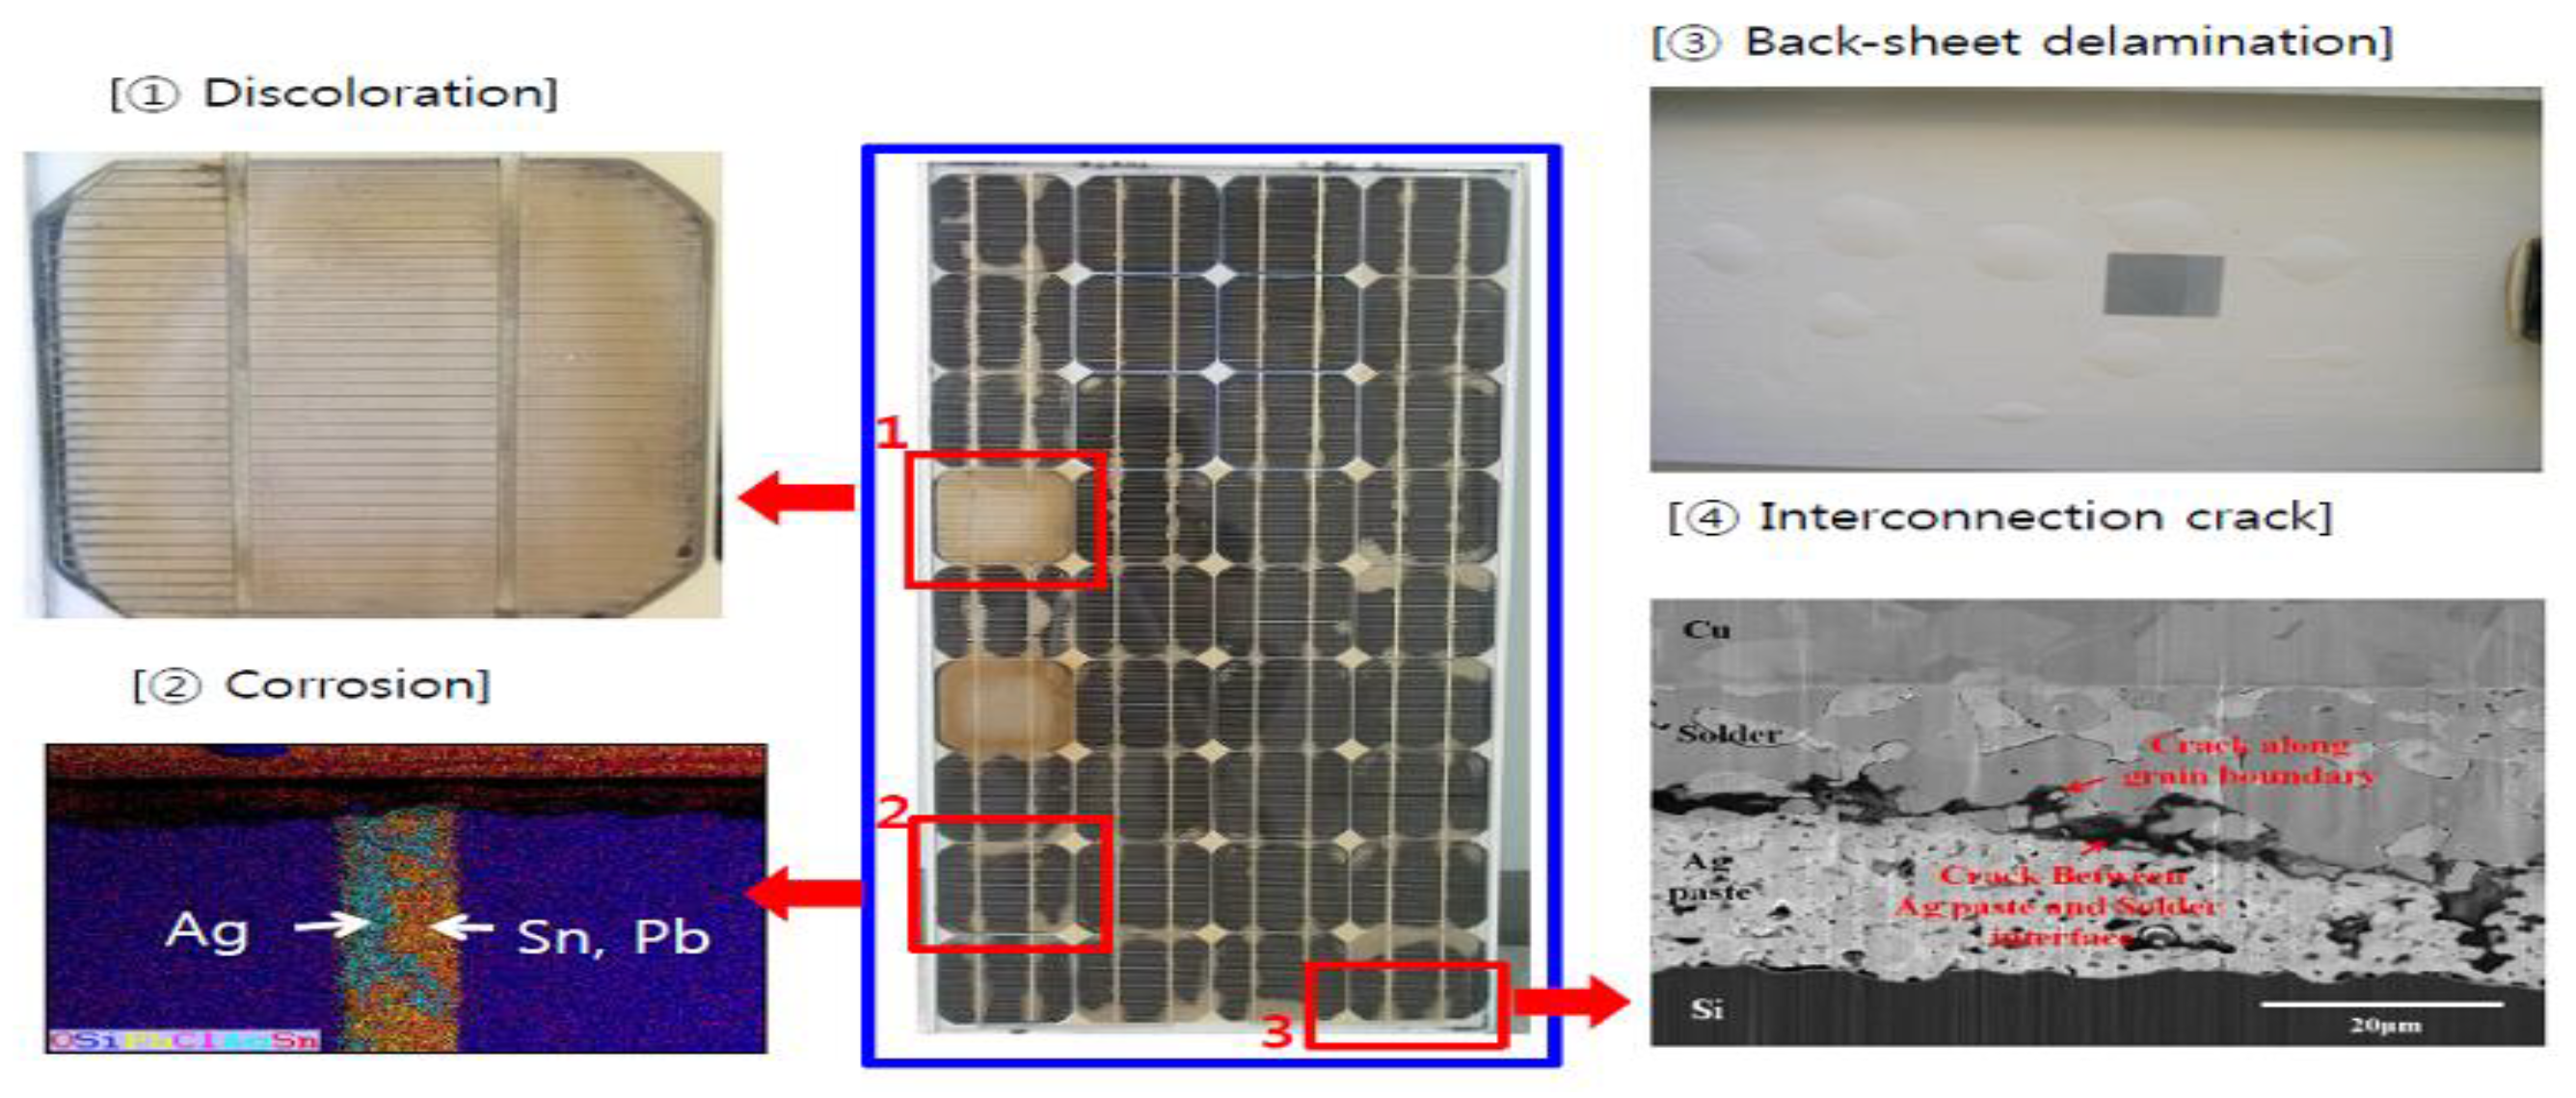
2. Characteristics of Aging Factors in PV Modules

The core component of a PV system, the PV module, can be operated for more than 20 years semi-permanently, and installation capacity and site of the PV system are flexible depending on the application conditions [13,14]. However, the electrical performance and life span of a PV module may be degraded due to various aging factors such as ultraviolet effect, temperature, humidity, and so on, as shown in Figure 1, if the abnormal conditions including cell crack, abnormalities of terminal box, degradation of component materials, and electrodes at solar cell surface, and so on, have occurred [15,16].
Commonly, aging phenomena such as encapsulant discoloration, ribbon wire corrosion, back sheet delamination, cell crack, and so on, have occurred in PV modules because of the sustained external environmental conditions. When PV modules are exposed to high temperature and ultraviolet for a long period, encapsulant discoloration, which causes reduction in the transmittance rate of the sun’s rays and short-circuit of currents can occur [17]. Additionally, the corrosion phenomenon of ribbon wire can occur with the moisture permeation into the PV module, and then the internal resistance may increase [18]. On the other hand, the delamination phenomenon of back sheets at the backside of the PV module may occur due to the humidity and temperature variation, and then short-circuit of currents may be reduced [19]. The crack phenomenon of the solar cell terminal may occur from the repeated progress of expansion and contraction due to temperature variation, and then the internal resistance of the solar cell may increase [20]. Therefore, the aging phenomena of PV modules are categorized with the relevant environmental factors and electrical characteristics as shown in Table 1.

3. Implementation of a Test Device for Aging Diagnosis in PV Modules

In order to evaluate the aging characteristics of PV modules, this paper implements a test device for aging diagnosis in PV modules, which is composed of a PV module section and a monitoring section to monitor real-time data measured from PV modules.

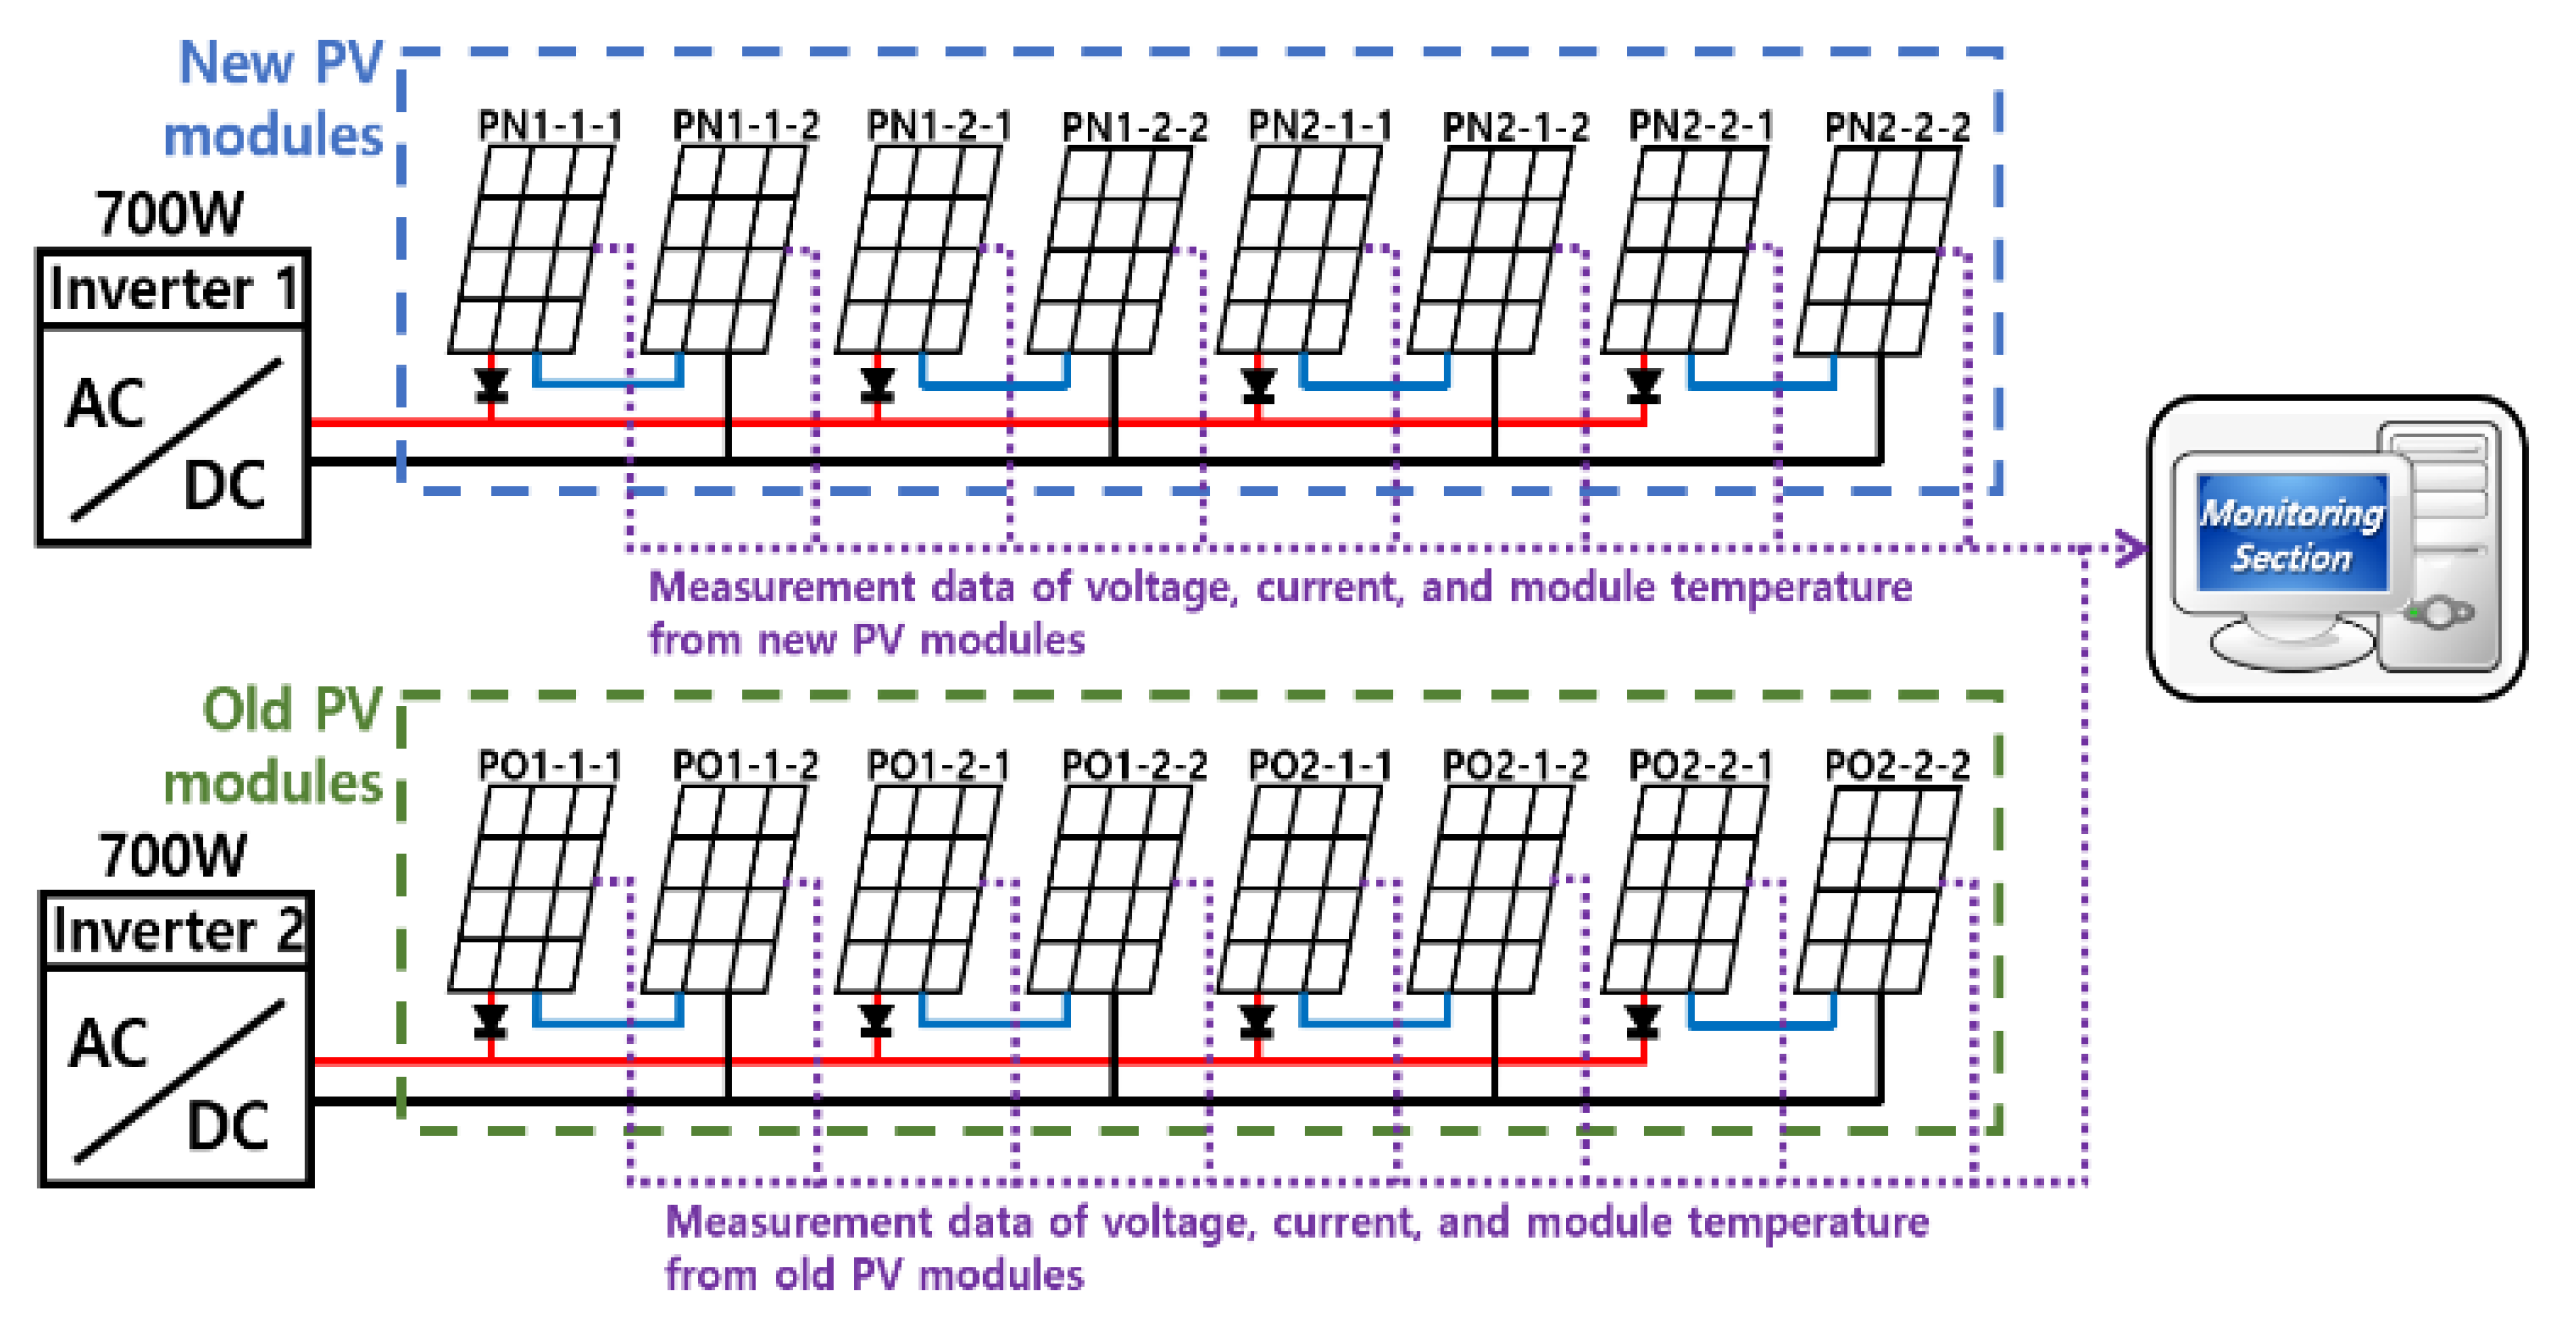
3.1. PV Module Section

As shown in Table 2, the PV module section consists of the aged PV modules, which have been in operation for 19 years, and the new PV modules, which were manufactured in 2019. The new PV modules should have the same rated output power as the aged ones, which is 53 W, in order to evaluate aging characteristics based on output characteristics of new and aged PV modules. However, due to the discontinuance of aged PV modules, this paper adopts 50 W of new PV modules, which is close to the output characteristics.

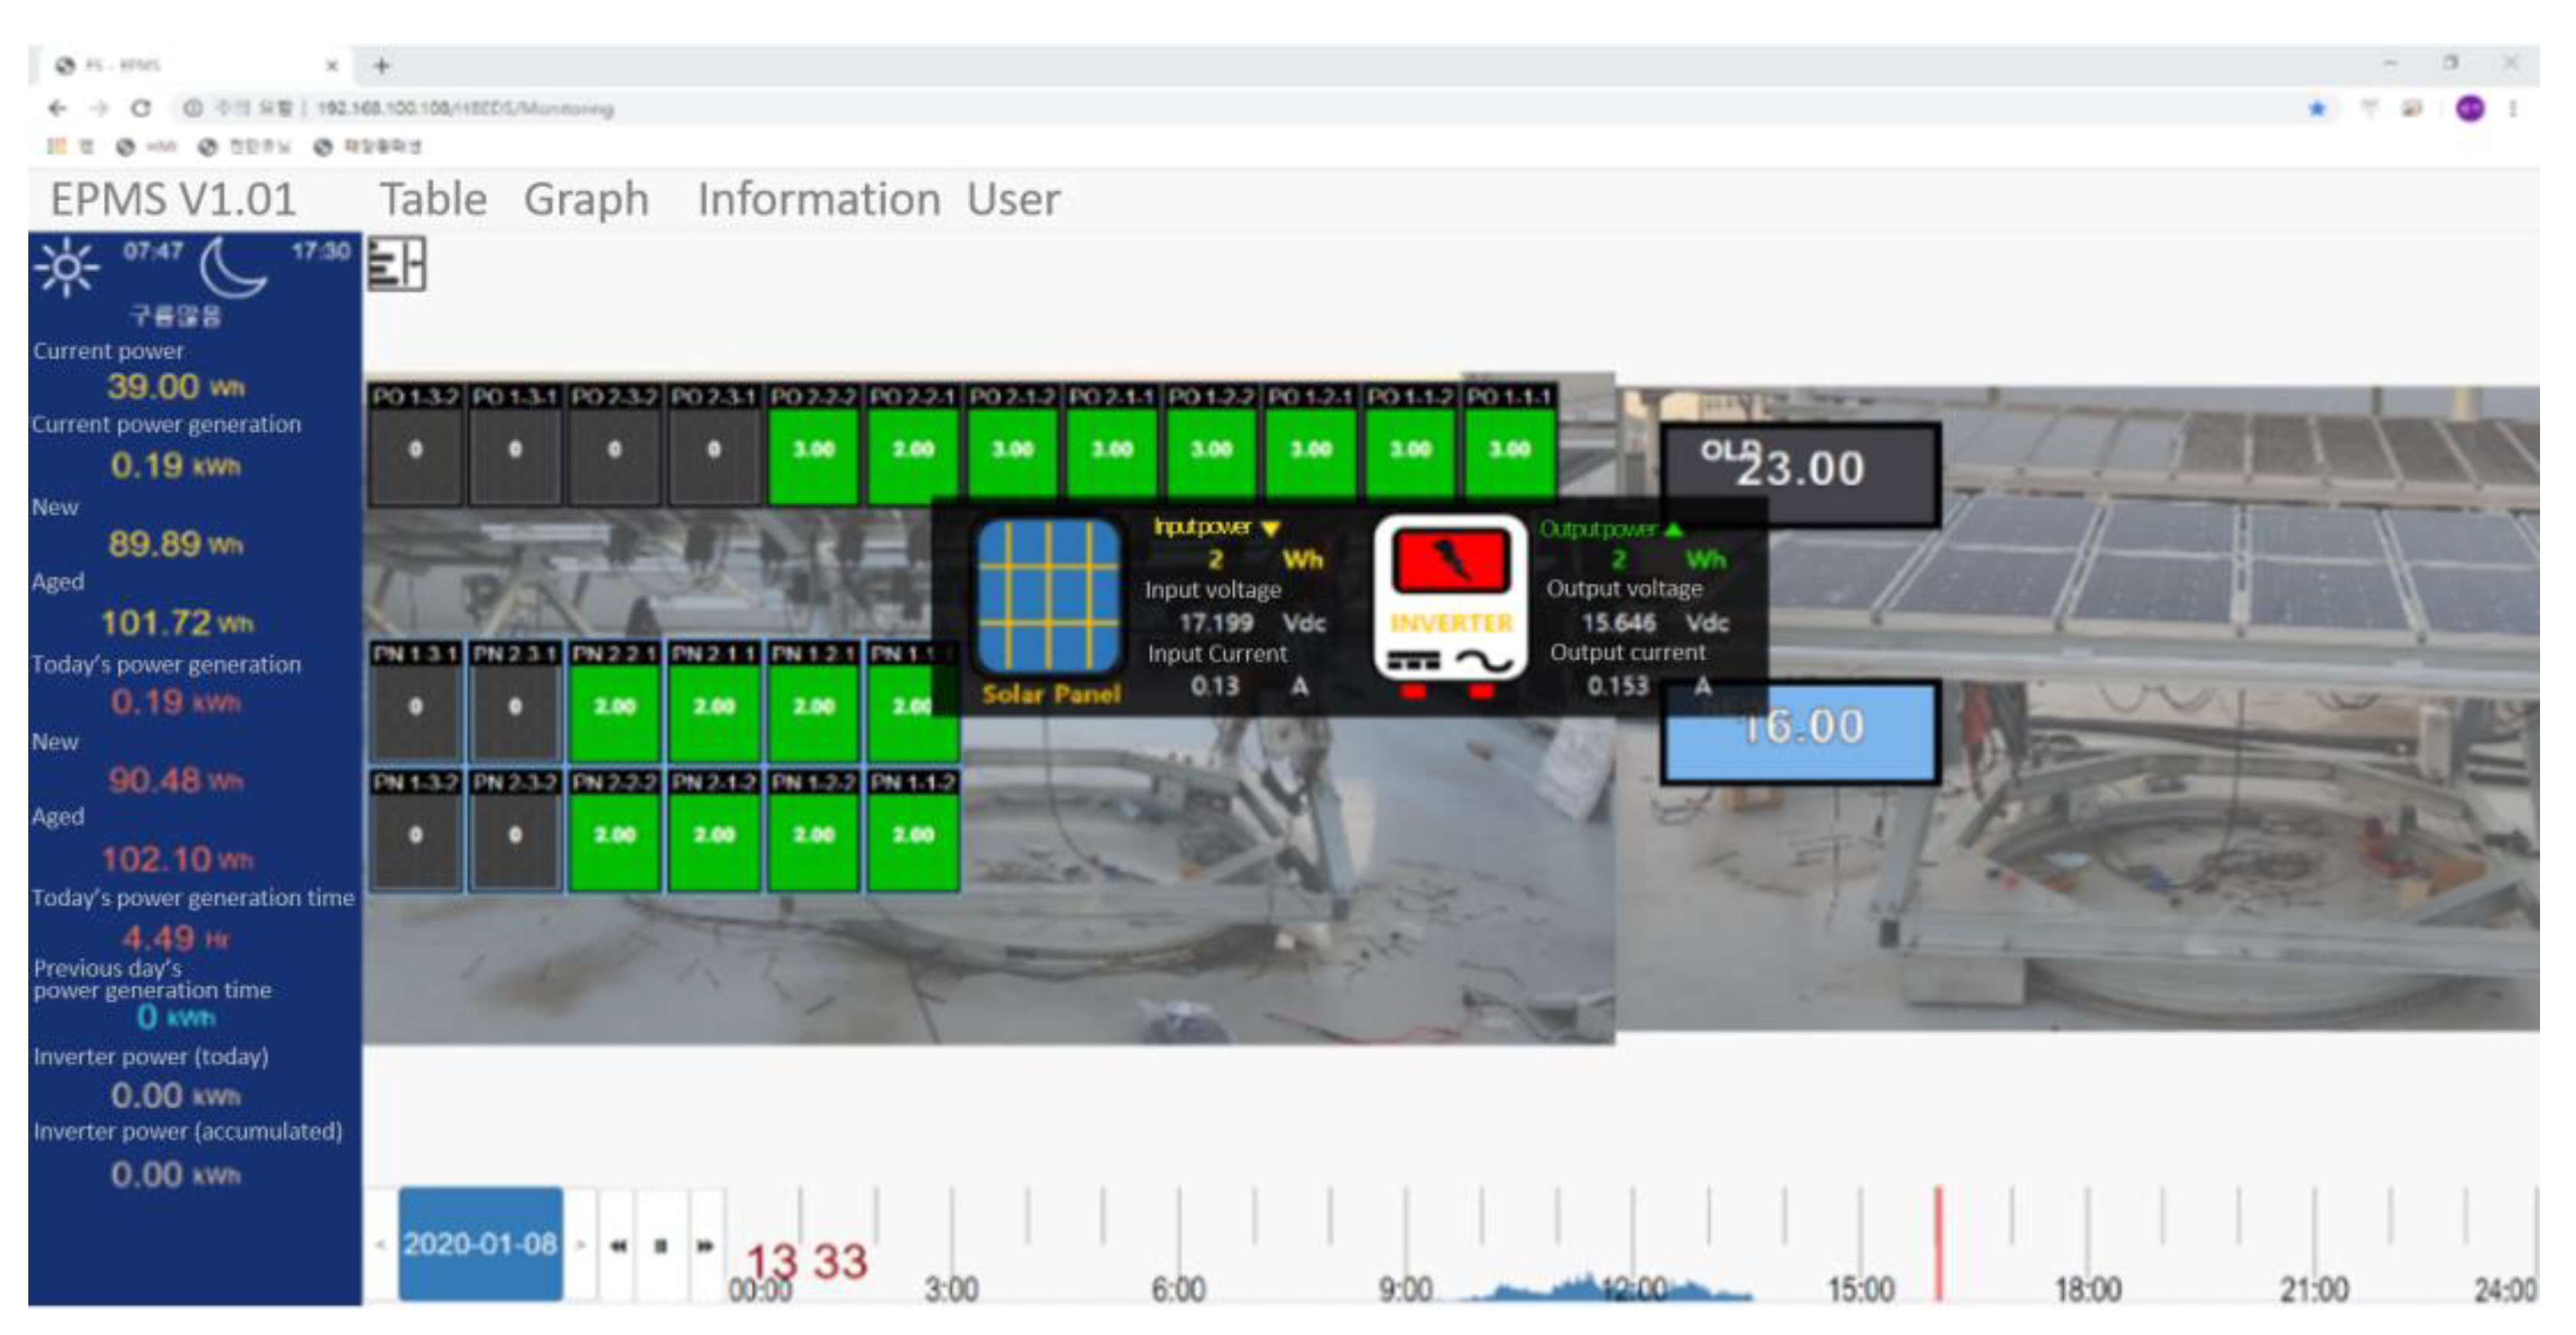
3.2. Monitoring Section

The monitoring section of the proposed test device performs measurements of voltage, current and output data of each PV module in real-time, and monitoring of the visual condition in PV modules as shown in Figure 2. Additionally, it performs monitoring of the input and output current, voltage, and power of grid-interconnected inverters, which are interconnected with aged and new PV modules, in order to confirm the operation conditions of PV modules.

3.3. Entire Configuration of the Test Device

As shown in Figure 3, the test device for aging diagnosis is composed of strings with 8 new PV modules (PN1-1-1~PN2-2-2) and 8 aged PV modules (PA1-1-1~PA2-2-2), which are, respectively, in a manner of 2 series by 4 parallel, and each string is connected to 700 W DC-AC inverters, of which the input power range is from 0 W to 700 W.

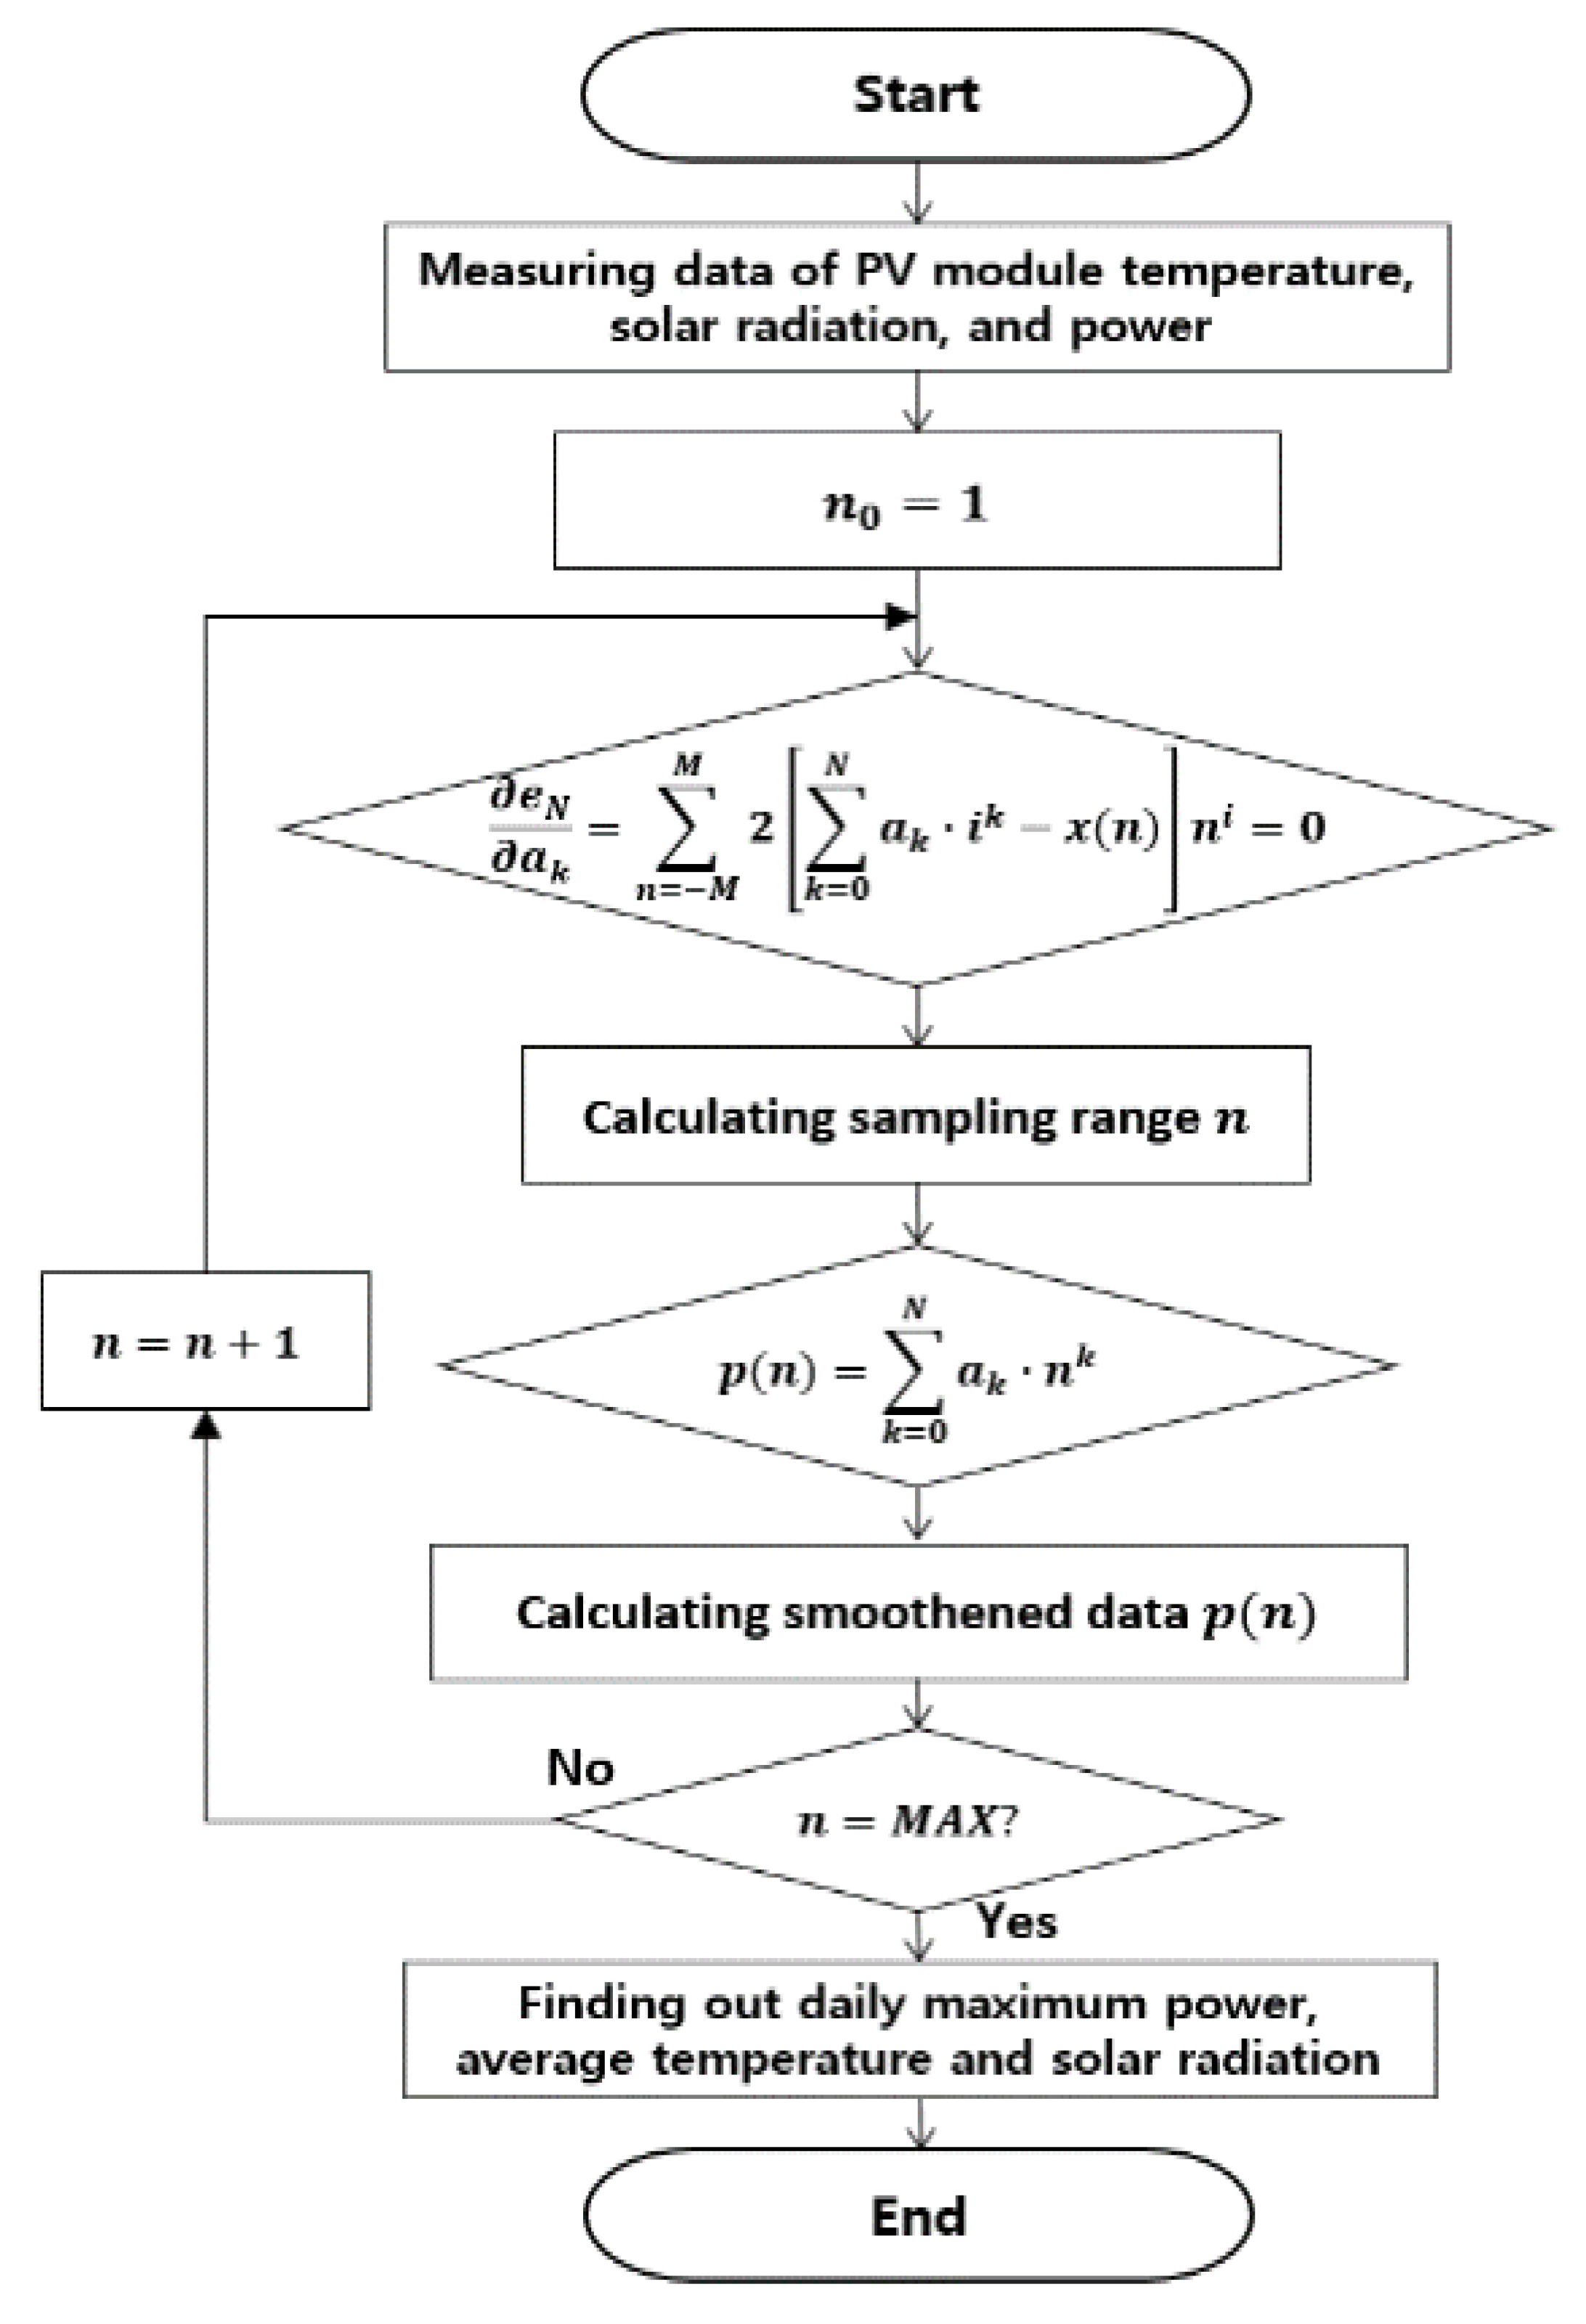
4. Degradation Evaluation Modeling Using MATLAB

In this paper, measurement data, such as solar radiation, temperature, and module-basis output data, which are collected by one-minute basis, are smoothened based on modeling of polynomial regression filter using MATLAB S/W in order to minimize the variability of PV output power, communication error, delay, etc. [21]. Generally, moving the average filtering method, which is based on polynomial regression model, is simple to implement, but there is a weakness in that it is vulnerable to instantaneous peak values, as the sampling range is selected in a comprehensive manner. To overcome such problems, the Savitzky–Golay (S–G) filtering method, which can effectively calculate the optimized sampling range for each set of data, is mostly adopted [22,23,24]. Concretely, the optimized regression model p ( n ) , applied with an S–G filter, is composed of N th order polynomial equation for n as follows:
p ( n ) = k = 0 N a k n k
where, p ( n ) is smoothed data in the rage of M n M , n is a random number between 0 and M , a k is a coefficient to minimize error, k is a whole number between 1 and N , and N is the degree of polynomial regression model. The error e N between p ( n ) and actual measurement data x ( n ) can be calculated as follows:
e N = n = M M ( k = 0 N a k n k x ( n ) ) 2
where, e N is an error between polynomial regression model and on-site measurement data, and M is the data sampling range. Where, as shown in Equation (3), the optimized data sampling range ( M ) is calculated by finding the solution which satisfies the condition that partial differentiation of e N is equal to 0 , and then smoothened data p ( n ) can be obtained by substituting the calculated M into Equation (1):
δ e N δ a k = n = M M 2 ( k = 0 N a k n k x ( n ) ) n k = 0
Namely, the data smoothing procedure can be illustrated, as shown in Figure 4, based on the above-mentioned S–G filtering method. Where, p ( n ) , which is smoothened by one-hour basis with an S–G filtering function, is calculated based on the measured solar radiation, temperature, and module-basis output data, which are collected in the monitoring section. Then, the daily maximum output power among the smoothened data is obtained by using “maximum function” in MATLAB library, and one-hour basis solar radiation and temperature data are calculated using “average function”.

5. Case Studies

5.1. Operation Conditions

Figure 5 shows the hourly average data of solar radiation between 7 am to 5 pm, from January to October, in 2020. Where, it was found that the lowest solar radiation measurement was in the winter season, while the highest one was in summer season. Especially, it is shown that the solar radiation in spring and summer season has a similar pattern as the average solar radiation in the summer season was significantly reduced due to the tremendous rainy weather which lasted for weeks in the summer of 2020. Therefore, it was found that the output characteristics in such extraordinary weather conditions should be considered because the output power of PV modules is proportional to the condition of solar radiation.
With the same method of evaluating the solar radiation, hourly average temperature by season can be illustrated as shown in Figure 6, and also, it can be seen that the temperature change by each season was identical with the conventional trend in general. Furthermore, it was found that such temperature conditions should be considered as well, due to the characteristics of PV modules in that the output power of PV modules increases with decreasing temperature.

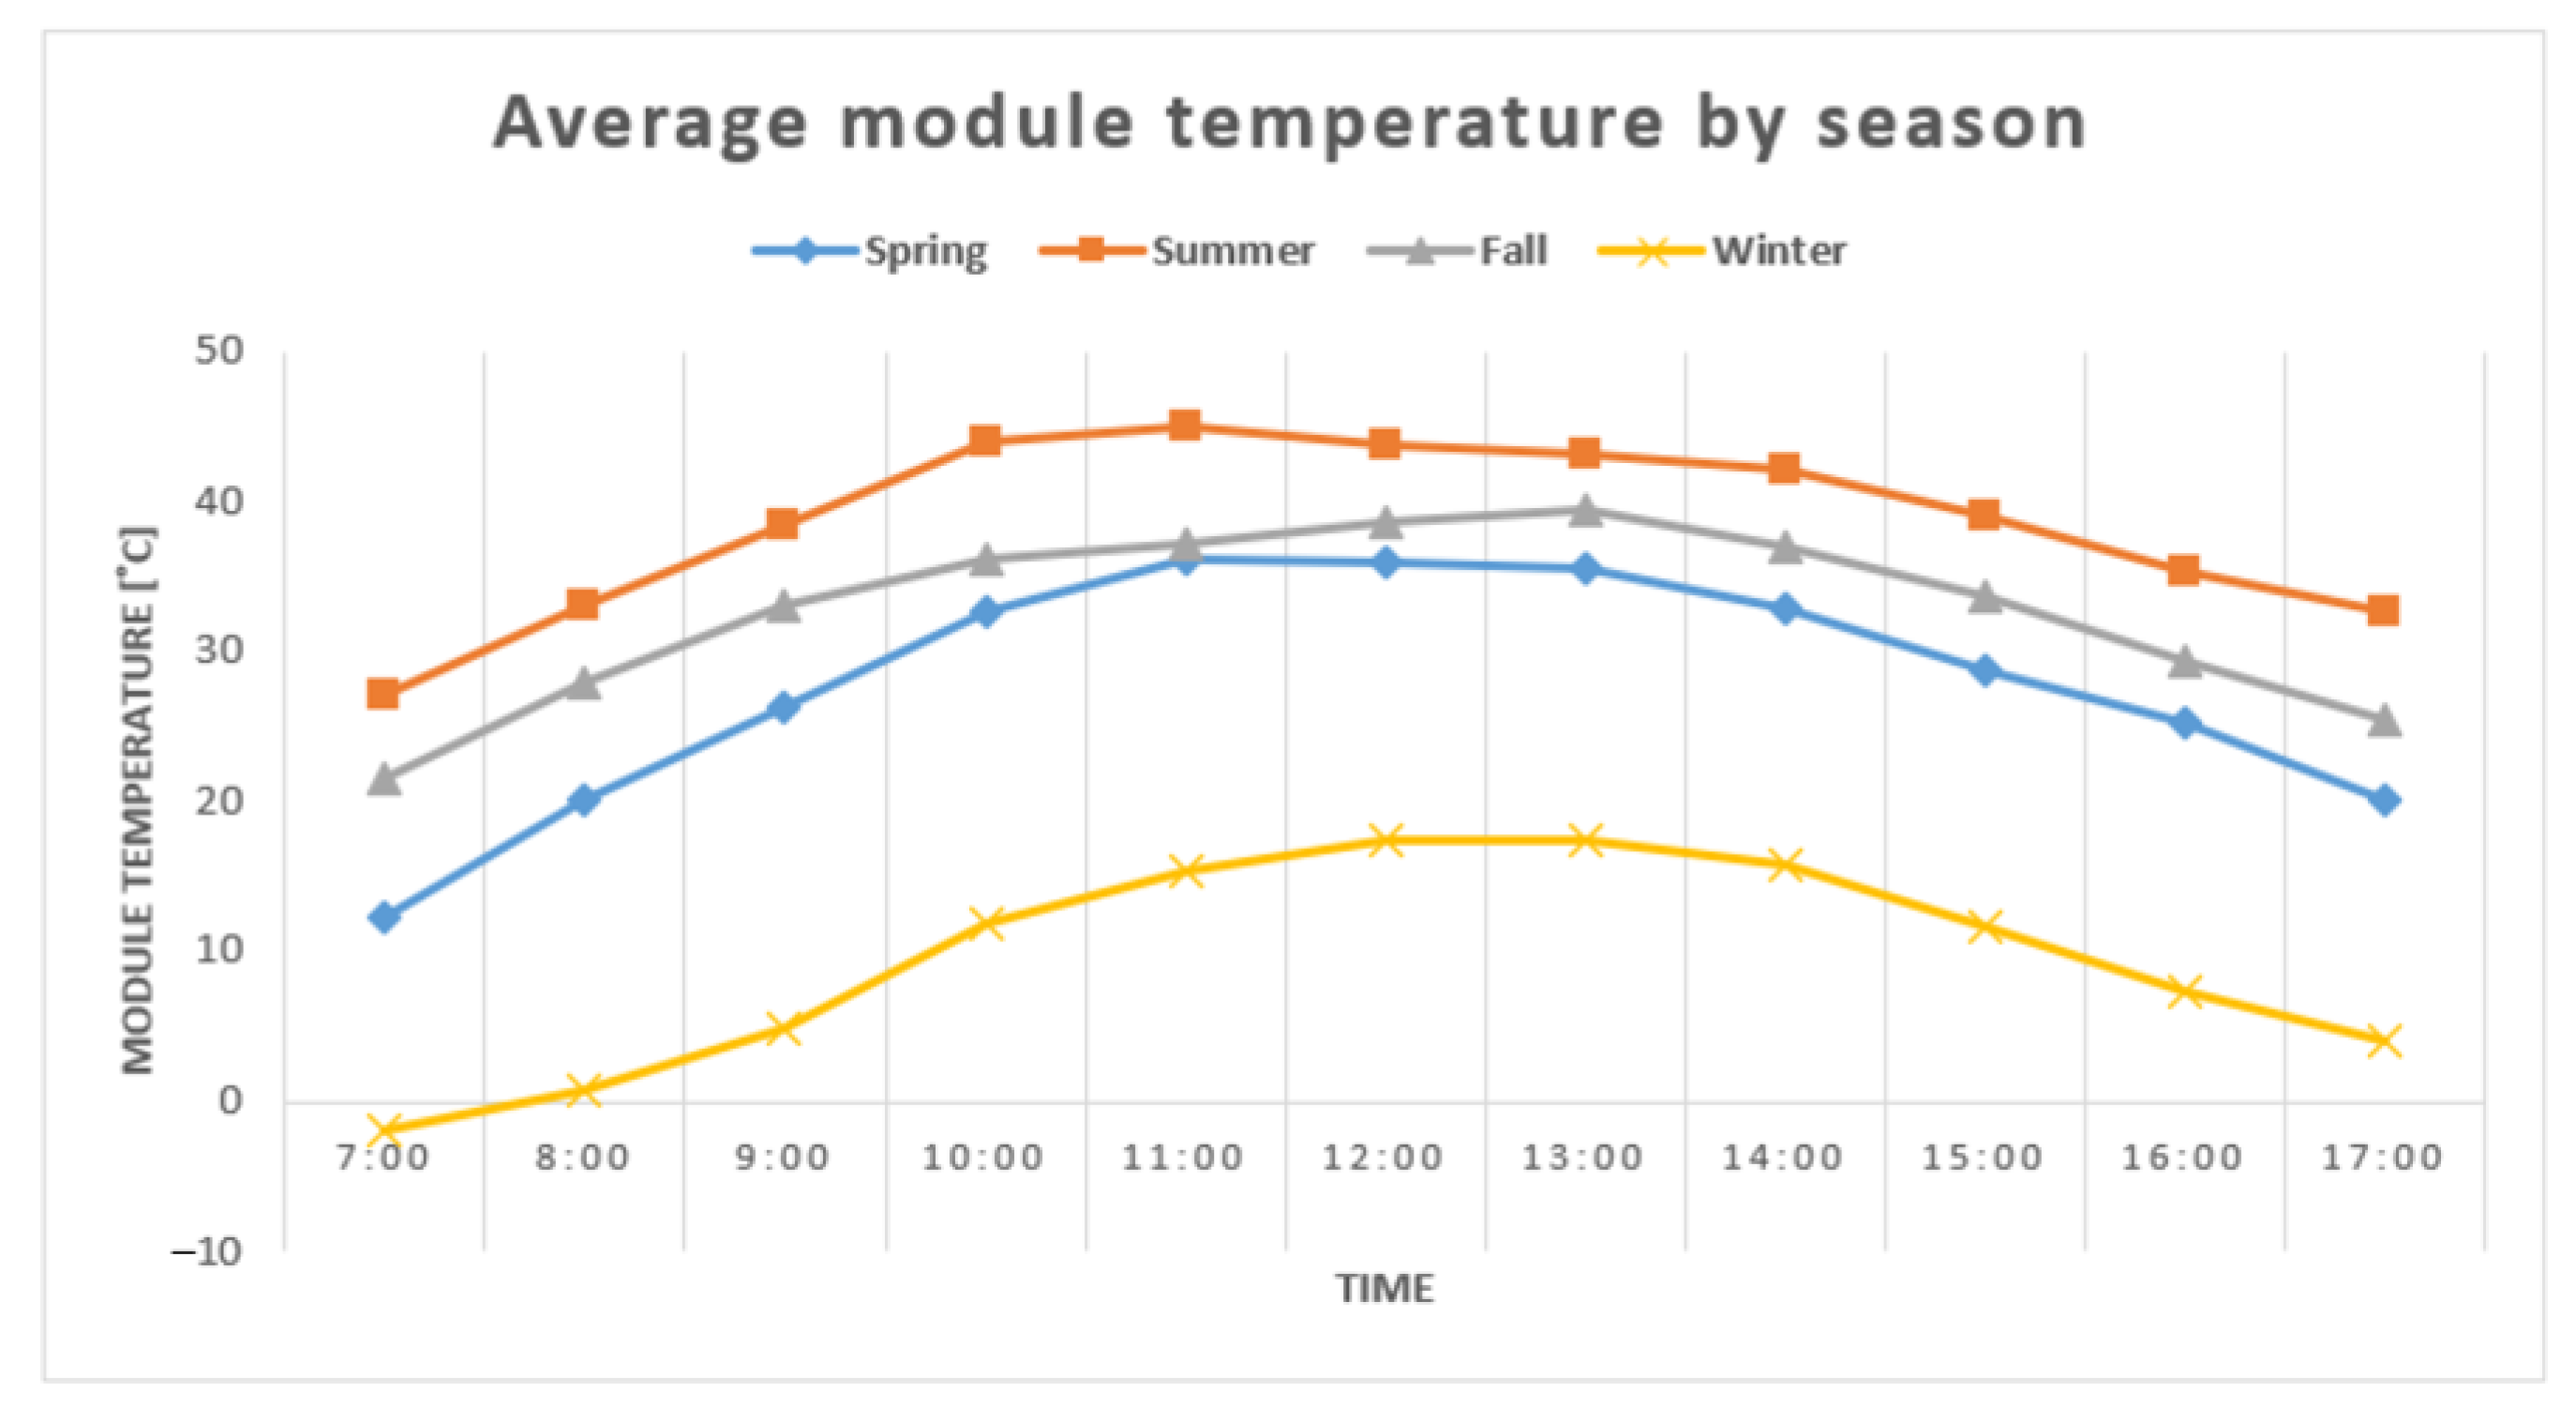
5.2. Season-Basis Output Characteristics in PV Modules

Output characteristics of aged and new PV modules, which were measured in spring using the test device for aging diagnosis, are shown in Table 3. Where, average PV output power for each module was calculated by finding the monthly average of daily maximum output data by using the proposed degradation evaluation modeling, and then, season-basis average in spring was calculated by finding the average of PV output power in March, April, and May, respectively. On the other hand, for the purpose of evaluating the aging characteristics of PV modules in an accurate manner, the compensation coefficient of 1.06 was multiplied with season-basis average of new PV modules (50 W of rated output power) in order to convert it to the equivalent value of aged PV modules (53 W of rated output power).
The output characteristics of new and aged PV modules by season using the same evaluation method as the one used for finding output characteristics of PV modules in spring are shown in Table 4 and Table 5, respectively. As shown in Table 4, the maximum average PV output power among new PV modules in spring, summer, fall, and winter were calculated as 40.75 W in module PN1-2-2, 36.15 W in module PN2-2-1, 28.56 W in module PN1-1-2, and 37.26 W in module PN1-1-2, respectively. In addition, the maximum value of yearly average output power was obtained as 35.65 W in module PN1-2-2.
As shown in Table 5, the maximum average PV output power among aged PV modules in spring, summer, fall, and winter were calculated as 26.89 W in module PA1-2-2, 20.44 W in module PA2-1-2, 27.38 W in module PA2-2-1, and 33.76 W in module PA1-2-1, respectively. Additionally, the maximum value of yearly average output power was obtained as 25.18 W in module PA1-2-2.
Therefore, in order to perform evaluation on aging characteristics of aged PV modules based on Table 4 and Table 5, the reduction rate of output power of aged PV modules compared to new PV modules in the spring season are shown in Figure 7. Where, it is clear that the aged PV module had degraded since the maximum output power of new and aged PV modules were respectively calculated as 40.75 W in PN1-2-2 and 26.89 W in PA1-2-2, which means the reduction rate of output power of the aged PV module was 34.01% compared to the new one. Additionally, it was confirmed that the entire aged PV modules were degraded as the overall average output power of new and aged PV modules were respectively calculated as 34.18 W and 24.52 W, namely, the output power of entire aged PV modules was reduced to 28.25% compared to new PV modules.
According to the above-mentioned evaluation method for the spring season, the output characteristics of new and aged PV modules for all the seasons were calculated. Where, in the case of the summer season as shown in Figure 8, it was found that the aged PV module had degraded since the maximum output power of new and aged PV modules were respectively calculated as 36.15 W in PN2-2-1 and 20.44 W in PA2-1-2, which means the reduction rate of output power of the aged PV module was 43.46% compared to the new one. Additionally, it was confirmed that the entire aged PV modules were degraded as the overall average output power of new and aged PV modules were respectively calculated as 27.57 W and 13.64 W, in other words, the output power of the entire aged PV modules was reduced to 50.53% compared to new PV modules.
In the case of the fall season, as shown in Figure 9, it was found that the aged PV module had degraded since the maximum output power of new and aged PV modules were respectively calculated as 28.71 W in PN1-2-2 and 27.38 W in PA2-2-1, which means the reduction rate of output power of the aged PV module was 4.63% compared to the new one. Additionally, it was confirmed that the entire aged PV modules were degraded as the overall average output of new and aged PV modules were respectively calculated as 27.89 W and 26.43 W, that is, the output power of the entire aged PV modules was reduced to 5.23% compared to new PV modules.
On the other hand, Figure 10 shows the case of the winter season. Where, it was clear that the aged PV module had degraded since the maximum output of new and aged PV modules were respectively calculated as 37.26 W in PN1-1-2 and 33.76 W in PA2-2-1, which means the reduction rate of output power of aged PV module was 9.39% compared to the new one. Additionally, it was confirmed that the entire aged PV modules were degraded as the overall average output power of new and aged PV modules were respectively calculated as 34.56 W and 27.6 W, that is, the output of the entire aged PV modules was reduced to 20.01% compared to new PV modules.

5.3. Aging Characteristics in PV Modules

Based on the output characteristics of PV modules, the total degradation rate and yearly-basis degradation rate of aged PV modules are shown in Table 6 and Figure 11. Where, in the case of summer in 2020, when the rainy weather lasted for weeks, the minimum and maximum reduction rates of output power were respectively calculated as 10.39% and 62.75%, and the average was 50.53% due to low solar radiation and high temperature. On the other hand, in the fall season of 2020, when there was more solar radiation and a lower temperature than the summer season, it was found that the output characteristics of aged PV modules varied significantly depending on the environmental conditions from the calculated reduction rate of output power, which ranged from 3.91% to 5.66%, and the average was 5.24%. Based on the aging characteristics of aged PV modules for all seasons, it was found that there was a considerable deviation among modules since the total degradation rates in PA1-2-2 module and PA1-1-1 module for 19 years were calculated as 29.35% and 22.69%, while yearly-basis degradation rates were calculated as 1.81% and 1.35%, respectively. Furthermore, it was found that the average and yearly-basis degradation rate of the entire aged PV modules were calculated as 25.73% and 1.55%, respectively.

6. Conclusions

In order to evaluate on-site data-based aging characteristics of PV modules, this paper implements a test device for aging diagnosis in PV modules, and evaluates output power and aging characteristics of aged and new PV modules based on the presented evaluation modeling using MATLAB S/W. The main results of this paper are summarized as follows.
(1)
The measurement data, such as solar radiation, temperature, and module-basis output data, which are collected by one-minute basis, are smoothened based on modeling of polynomial regression filter using MATLAB S/W in order to minimize the variability of PV output, communication error, delay, etc.
(2)
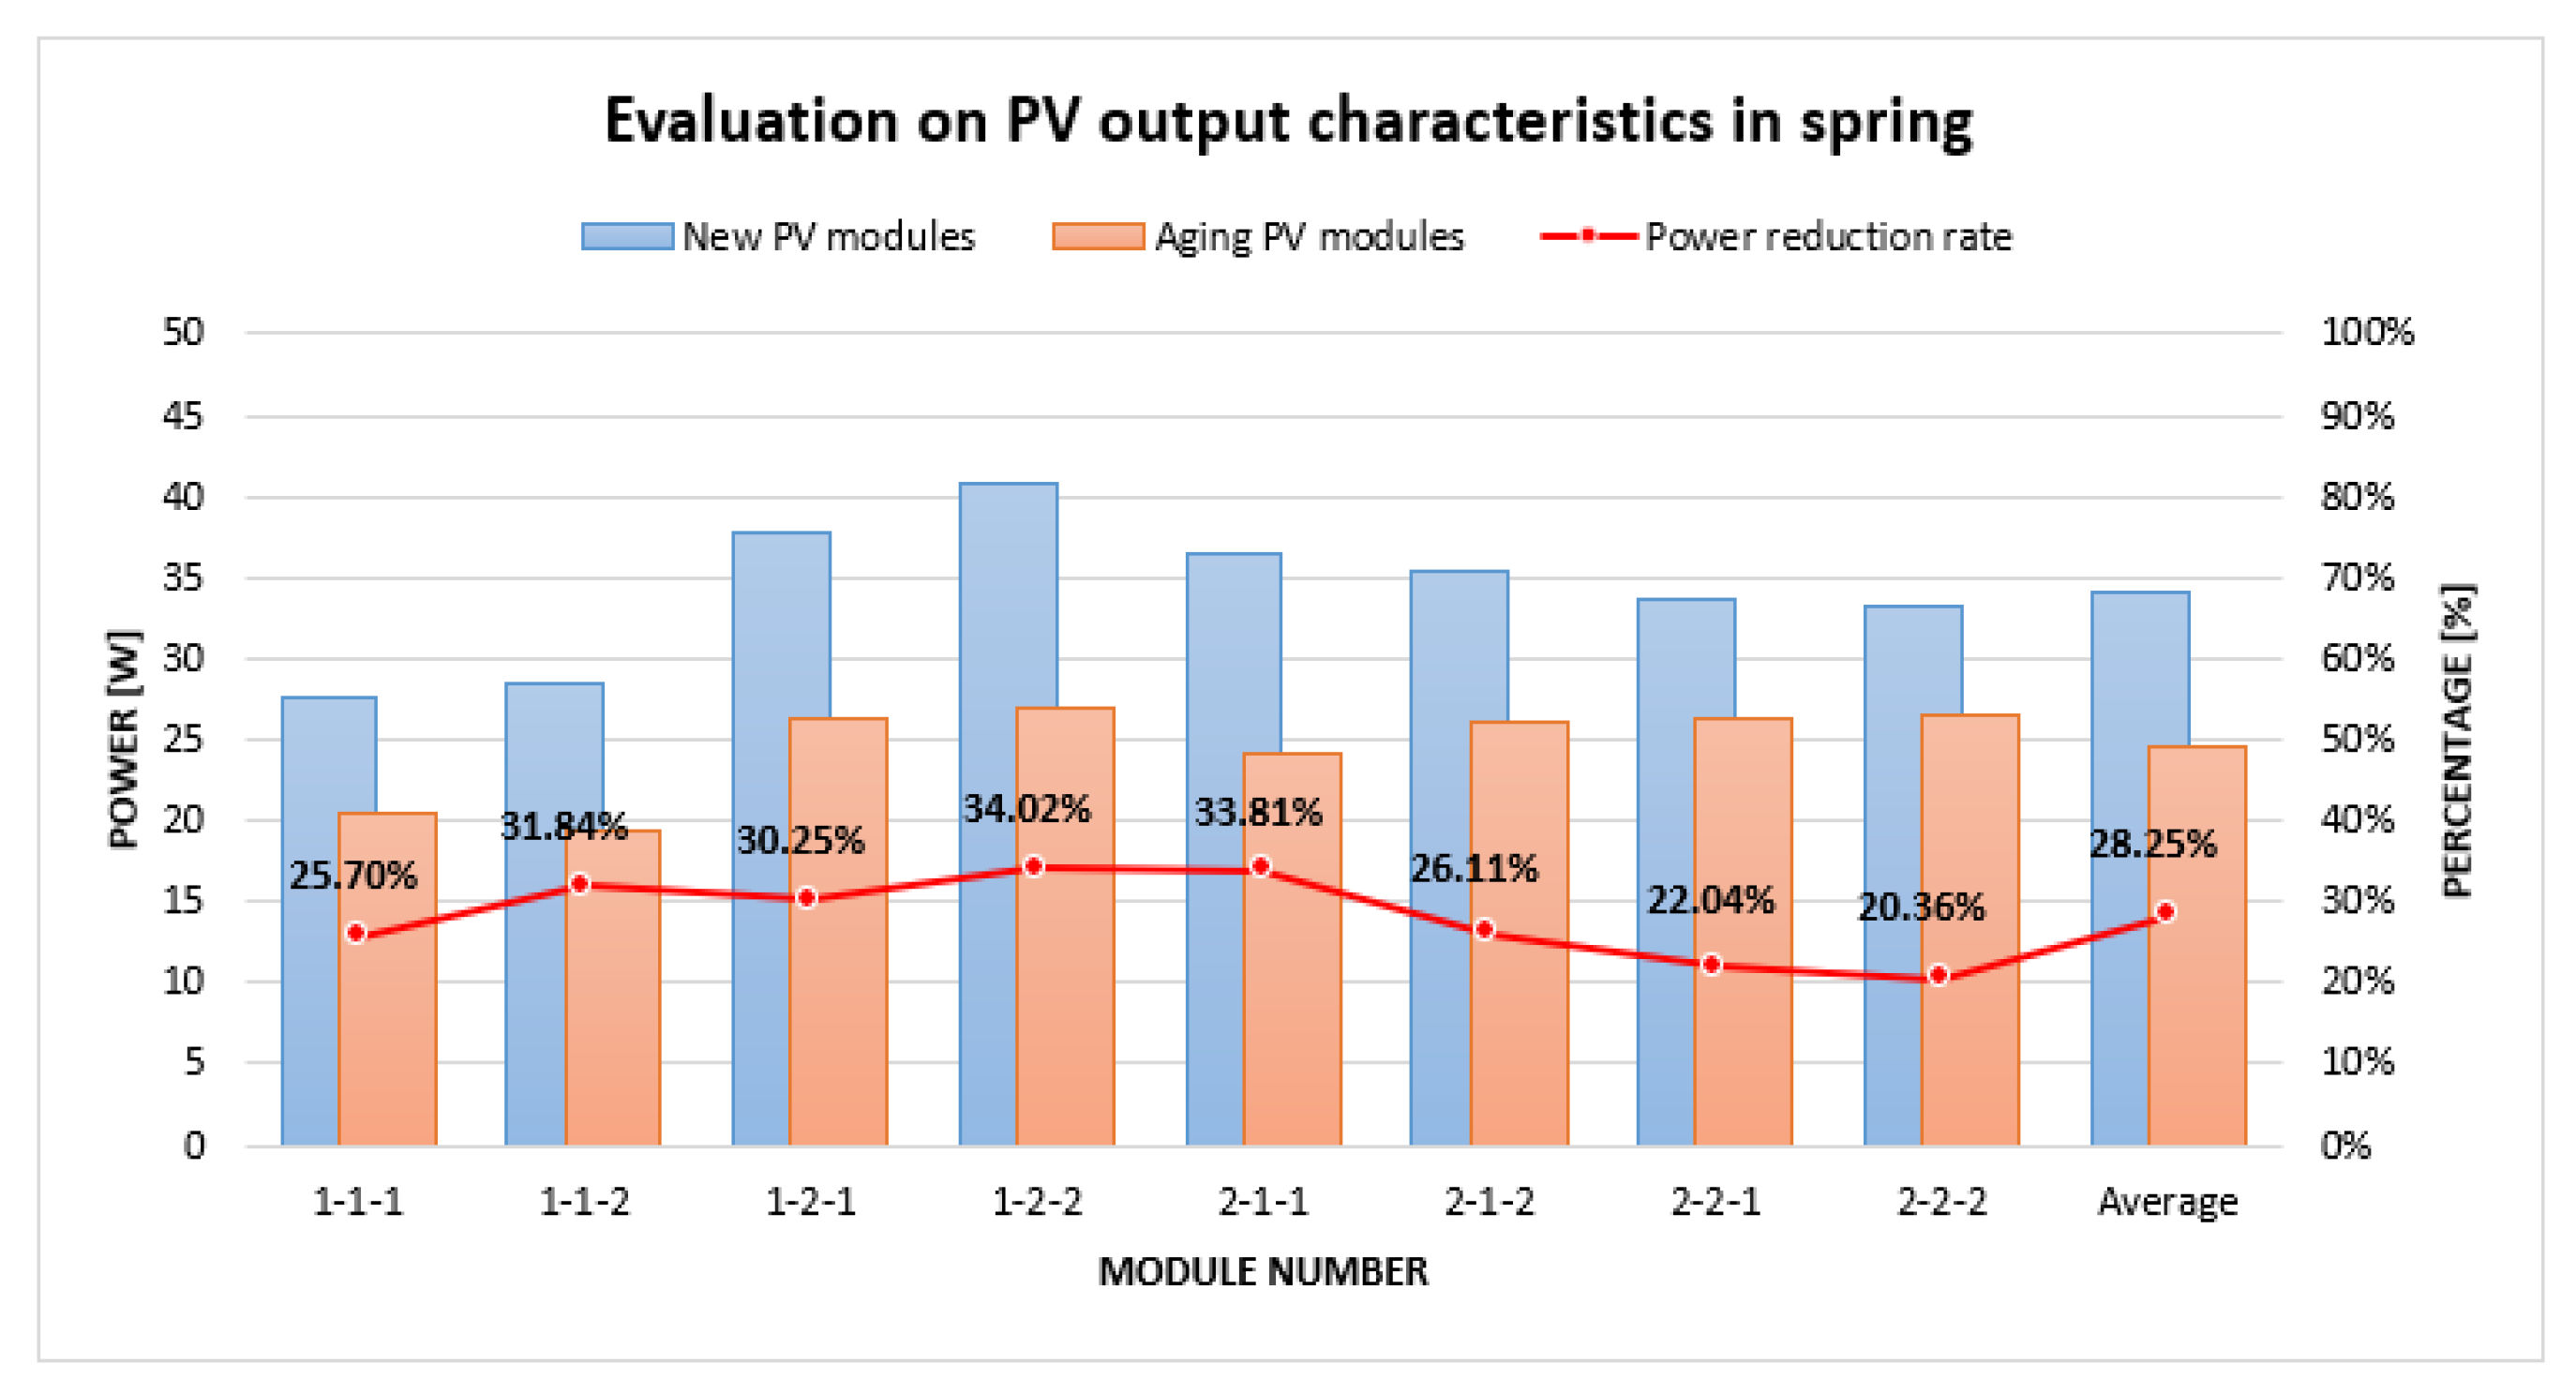
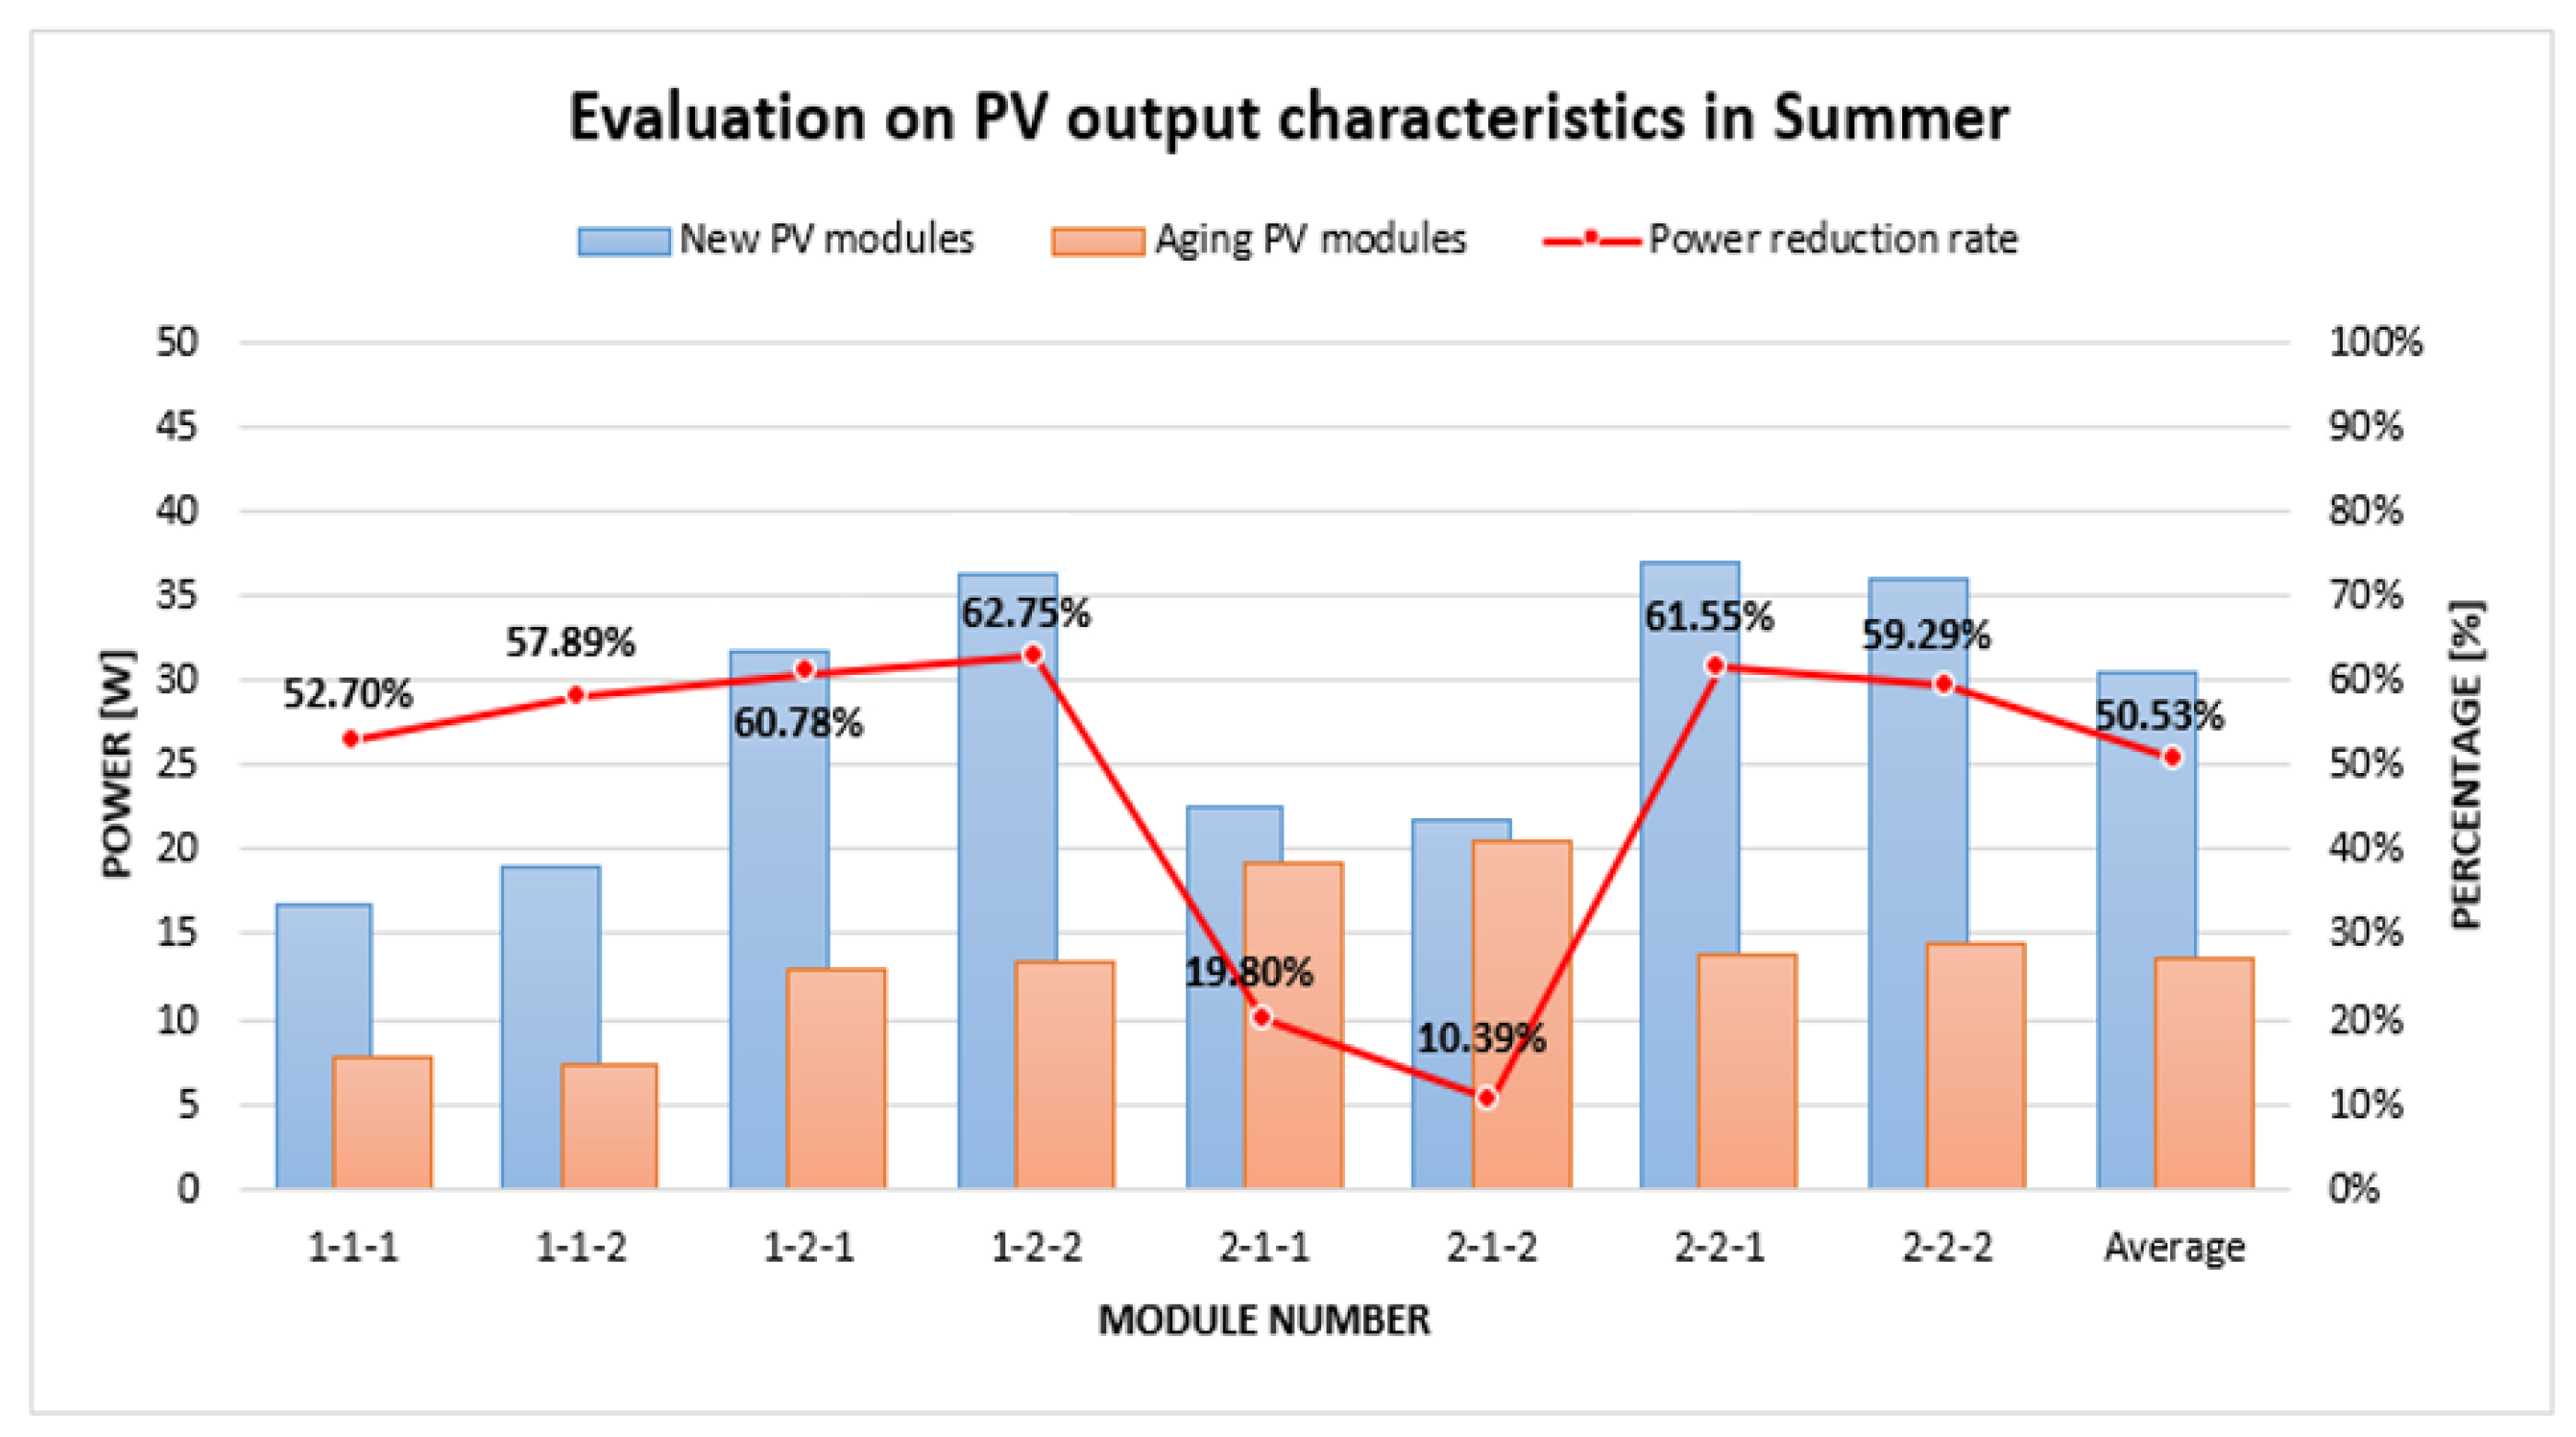
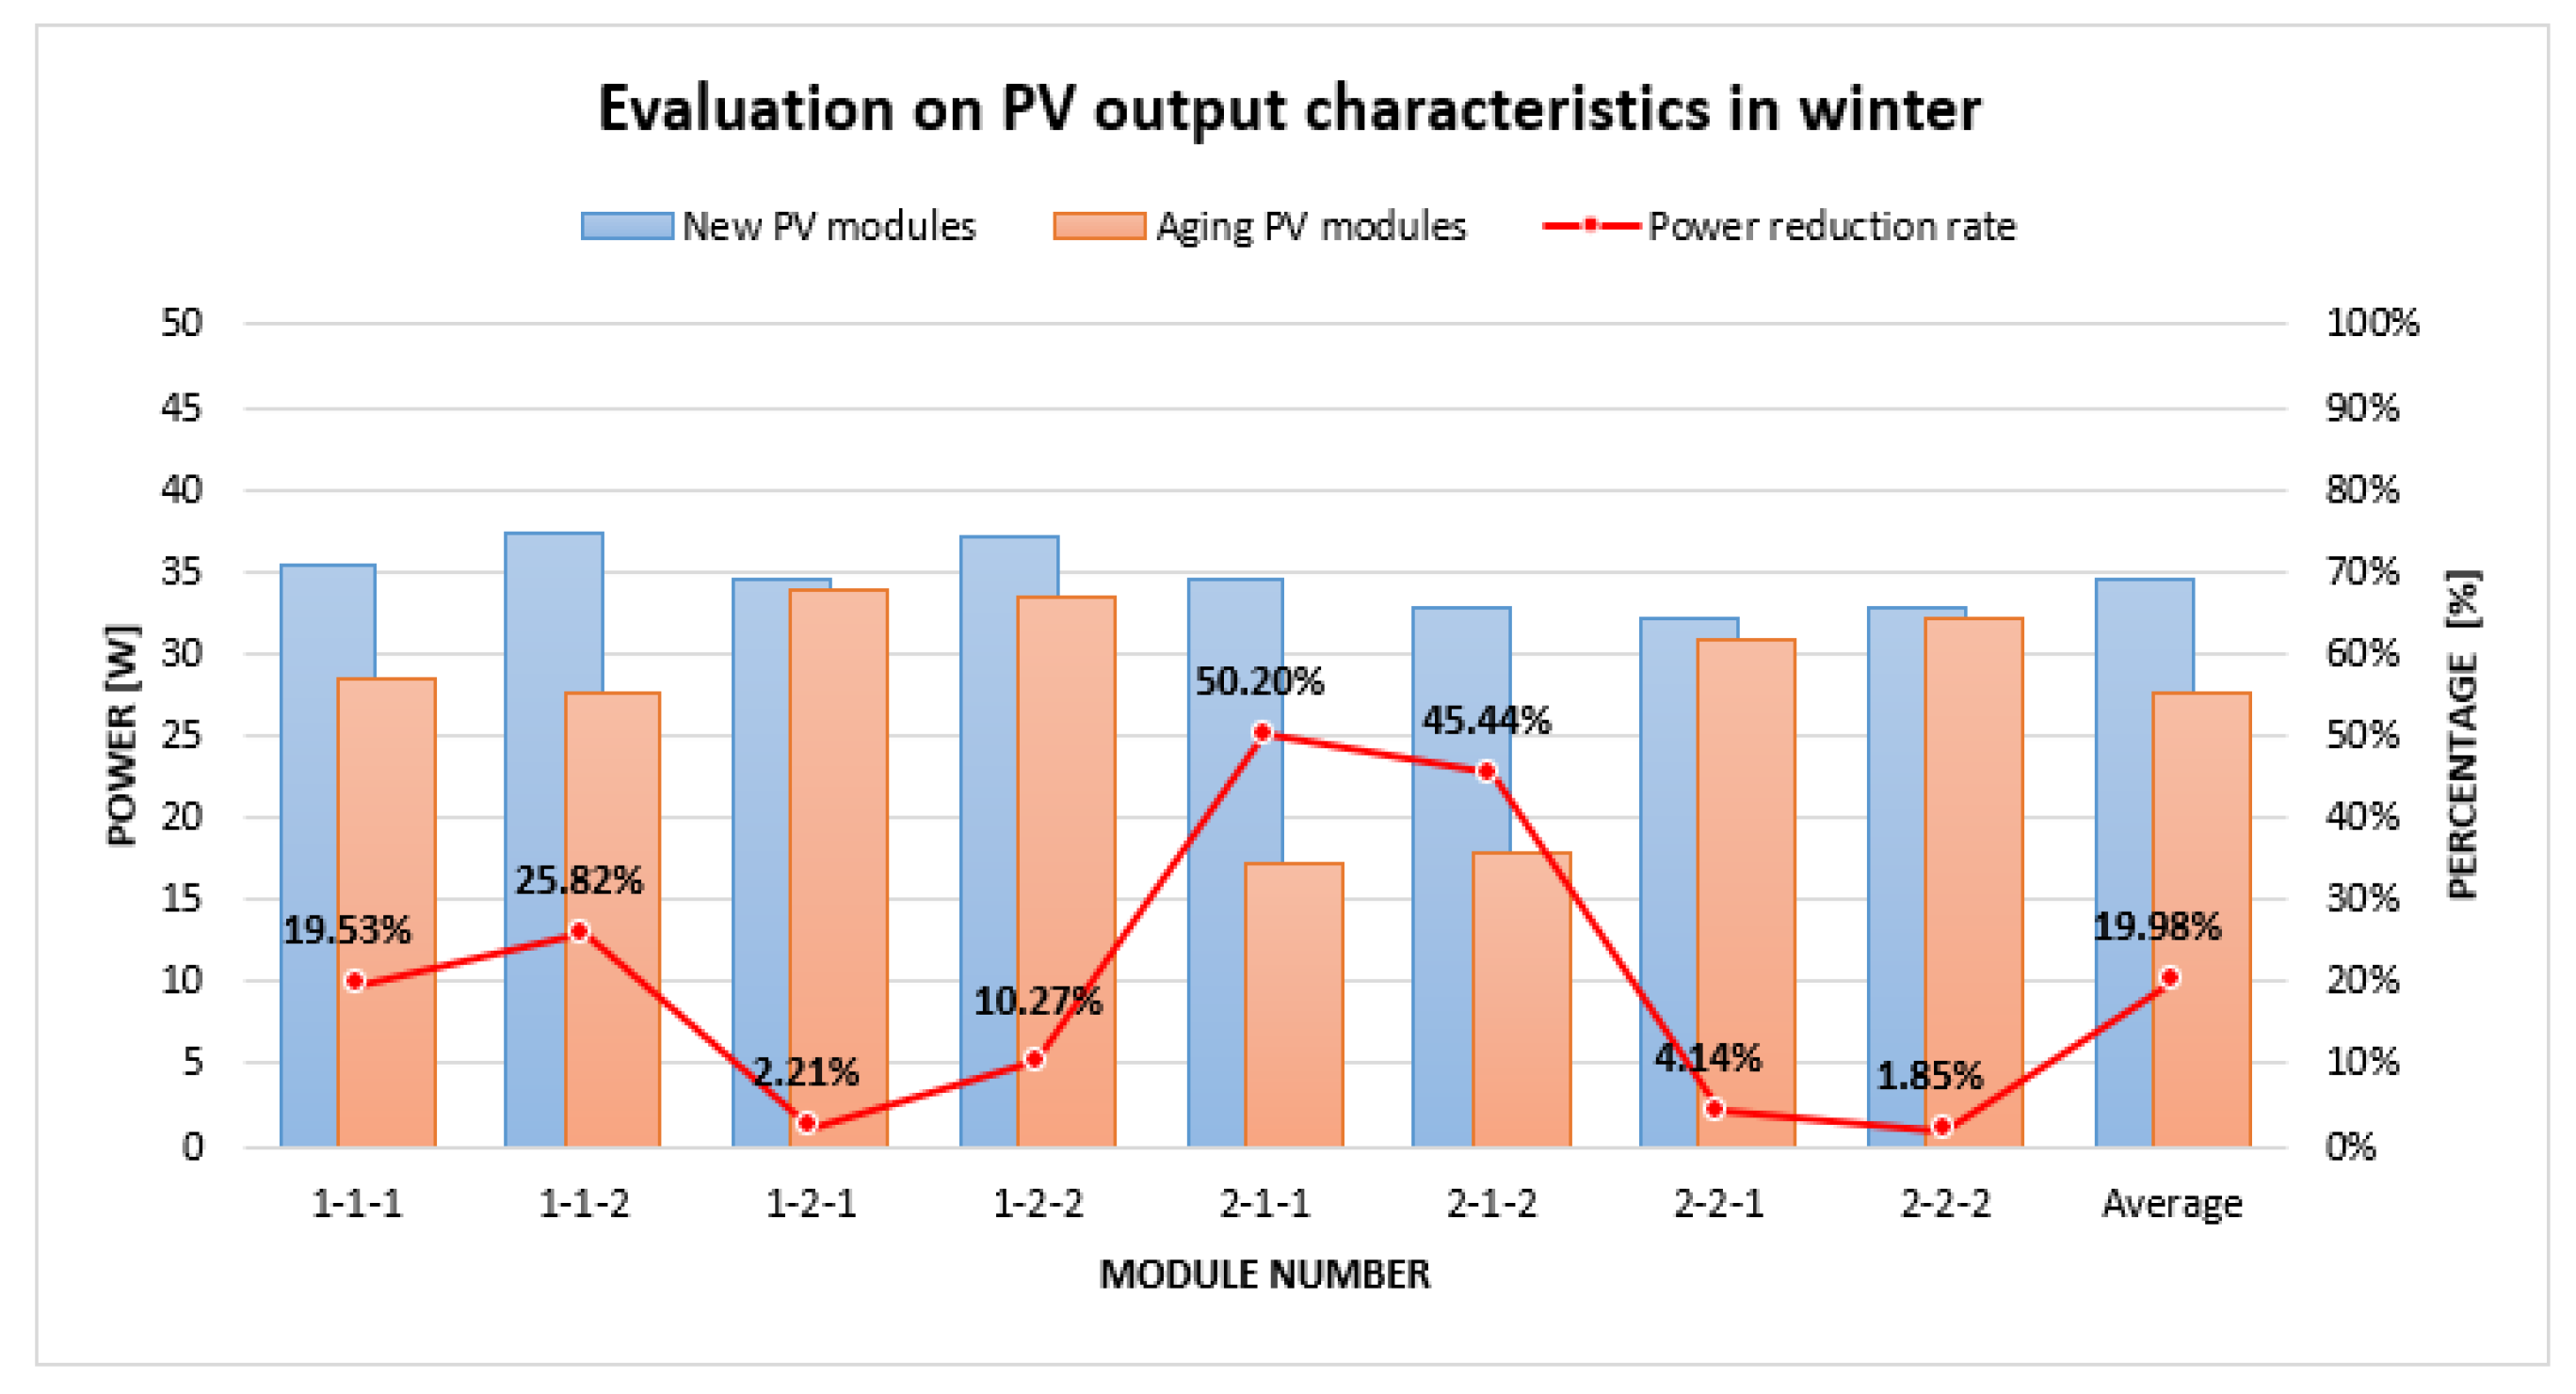
From the evaluation results of output power characteristics of new and aged PV modules between January and October in 2020, it was found that the average reduction rates of output power of aged PV modules for each season were calculated as 28.25%, 50.53%, 5.23%, and 20.01%, and the maximum reduction rate was obtained as 50.53% in the summer season.
(3)
In the case of summer in 2020, when the rainy weather lasted for weeks, the minimum and maximum reduction rates of output power were respectively calculated as 10.39% and 62.75%, and the average was 50.53% due to low solar radiation and high temperature. Namely, the characteristics of output power in aged PV modules can be reduced much more than new PV modules when the solar radiation is very low as the output voltage of the aged PV modules can be decreased below the range of operation voltage, while new PV modules can still maintain within the range of operation voltage.
(4)
Based on the aging characteristics of aged PV modules for all seasons, it was found that there was a considerable deviation among modules since the total degradation rates for 19 years were calculated as 29.35% and 22.69%, while yearly-basis degradation rates were calculated as 1.81% and 1.35%, respectively, and also, it was found that the average and yearly-basis degradation rate of the entire aged PV modules were calculated as 25.73% and 1.55%, respectively.
(5)
From the test results performed by season and year, based on the actual measurement data of new and aged PV modules, it was confirmed that the proposed method can evaluate the deterioration rate of PV modules in an objective manner, by minimizing the errors from the process of compensation calculation, using the proposed test device for deterioration diagnosis in PV modules, and effectively performing the aging diagnosis without implementing facilities for STC.

Author Contributions

Conceptualization, J.S. and D.-S.R.; Data curation, J.S., J.-M.K. and S.-M.C.; Formal analysis, J.S.; Funding acquisition, D.-S.R.; Investigation, D.-S.R.; Methodology, J.S. and H.-D.L. and D.-S.R.; Project administration, D.-S.R.; Resources, D.-S.R.; Software, B.-G.H. and K.-H.K.; Supervision, D.-S.R.; Validation, S.-M.C. and D.-H.T.; Visualization, B.-G.H. and J.-M.K.; Writing—original draft, J.S.; Writing—review & editing, D.-S.R. All authors have read and agreed to the published version of the manuscript.

Funding

This work was supported by the Power Generation & Electricity Delivery Core Technology Program of the Korea Institute of Energy Technology Evaluation and Planning (KETEP) granted financial resource from the Ministry of Trade, Industry & Energy, Republic of Korea (No. 20214910100010). This paper was supported by Korea Institute for Advancement of Technology (KIAT) grant funded by the Korea Government (MOTIE) (P0008458, The Competency Development Program for Industry Specialist).

Acknowledgments

This is a translation of “A Study on Degradation Phenomenon Based on Test Device for Aging Diagnosis in PV Modules” originally published in Korean by Journal of the Korea Academia-Industrial cooperation Society, 2021/Volume 22, pp. 27–35. This translation was prepared by Jian Shen, Hu-Dong Lee, Dong-Hyun Tae, and Dae-Seok Rho with support from Technology development Program(S2854105) funded by the Ministry of SMEs and Startups and University Innovation Support Project in 2020. Permission was granted by (Journal of the Korea Academia-Industrial cooperation Society, Jian Shen, Hu-Dong Lee, Dong-Hyun Tae, and Dae-Seok Rho.

Conflicts of Interest

The authors declare no conflict of interest.

References

  1. IHS Markit. Global Solar PV Installations to Grow 20% in 2022, Despite Rising Costs: IHS Markit. 2021. Available online: https://cleanenergynews.ihsmarkit.com/research-analysis/global-solar-pv-installations-to-grow-20-in-2022-despite-risin.html (accessed on 2 February 2022).
  2. MERCOM. Golobal Installed Solar Capacity Could Reach 3000 GW by 2030. 2021. Available online: https://mercomindia.com/global-installed-solar-capacity-could-reach-3000-gw-by-2030-report/ (accessed on 2 February 2022).
  3. SolarPower Europe. Solar Continues to Break Installation Records, on Track for Terawatt Scale by 2022. 2021. Available online: https://www.solarpowereurope.org/solar-continues-to-break-installation-records-on-track-for-terawatt-scale-by-2022/ (accessed on 2 February 2022).
  4. Institute for Energy Economics and Financial Analysis. Global solar installations to hit 191GW in 2021—BNEF 2021. Available online: https://ieefa.org/global-solar-installations-to-hit-191gw-in-2021-bnef/ (accessed on 2 February 2022).
  5. Ministry of Trade, Industry and Energy of Korea. Third Energy Master Plan; Ministry of Trade, Industry and Energy of Korea: Sejong, Korea, 2019.
  6. Energy & Environment News. Carbon Neutrality Should Be Brought Forward to 2040, Not 2050. 2021. Available online: http://www.e2news.com/news/articleView.html?idxno=235732 (accessed on 2 February 2022).
  7. Shen, J.; Choi, S.M.; Han, B.G.; Jung, J.B.; Rho, D.S. Degradation Evaluation Method with Test Device for Aging Diagnosis in PV Modules. In Proceedings of the APAP 2021 Conference, Jeju, Korea, 11–14 October 2021. [Google Scholar]
  8. Lee, Y.J.; Kim, Y.S. Prediction and Accuracy Analysis of Photovoltaic Module Temperature based on Predictive Models in Summer. J. Korean Sol. Energy Soc. 2017, 37, 25–38. [Google Scholar] [CrossRef] [Green Version]
  9. Bouraiou, A.; Hamouda, M.; Chaker, A.; Lachtar, A.; Neçaibia, A.; Boutasseta, N.; Mostefaoui, M. Experimental evaluation of the performance and degradation of single crystalline silicon photovoltaic modules in the Saharan environment. Energy 2017, 132, 22–30. [Google Scholar] [CrossRef]
  10. Belluardo, G.; Ingenhoven, P.; Sparber, W.; Wagner, J.; Weihs, P.; Moser, D. Novel method for the improvement in the evaluation of outdoor performance loss rate in different PV technologies and comparison with two other methods. Sol. Energy 2015, 117, 139–152. [Google Scholar] [CrossRef]
  11. Ndiaye, A.; Kébé, C.M.F.; Charki, A.; Ndiaye, P.A.; Sambou, V.; Kobi, A. Degradation evaluation of crystalline-silicon photovoltaic modules after a few operation years in a tropical environment. Solar Energy 2014, 103, 70–77. [Google Scholar] [CrossRef]
  12. JRC Scientific and Technical Reports. Guidelines for PV Power Measurement in Industry. 2010. Available online: https://op.europa.eu/en/publication-detail/-/publication/b8d58e51-7d17-4706-8766-ef16c588891f/language-en (accessed on 16 April 2022).
  13. Park, J.H.; Lee, H.D.; Tae, D.H.; Ferreira, M.; Rho, D.S. A Study on Disposal Diagnosis Algorithm of PV Modules Considering Performance Degradation Rate. Korea Acad. Ind. Coop. Soc. 2019, 20, 493–502. [Google Scholar]
  14. Lee, K.H.; Choi, S.S.; Kim, B.K.; Jung, J.Y.; Kim, C.H.; Rho, D.S. Development of Aging Diagnosis Algorithm for Photovoltaic Modules by Considering Electric Characteristics and Environment Factors. Korean Inst. Electr. Eng. 2015, 64, 1411–1417. [Google Scholar]
  15. Shen, J. A Study on Deterioration Diagnosis Algorithm for Photovoltaic Modules by Considering Electrical Characteristics and Environmental Factors. Master’s Thesis, Graduate School, Koreatech, Korea, 2018. [Google Scholar]
  16. Polverini, D.; Field, M.; Dunlop, E.; Zaaiman, W. Polycrystalline silicon PV modules performance and degradation over 20 years. Photovoltaics 2012, 21, 1004–1015. [Google Scholar] [CrossRef]
  17. Sinha, A.; Sastry, O.S.; Gupta, R. Nondestructive characterization of encapsulant discoloration effects in crystalline-silicon PV modules. Sol. Energy Mater. Sol. Cells 2016, 155, 234–242. [Google Scholar] [CrossRef]
  18. Oh, W.W.; Chan, S.I. Corrosion mitigation of photovoltaic ribbon using a sacrificial anode. Korea Acad. Ind. Coop. Soc. 2017, 18, 681–686. [Google Scholar]
  19. Oreski, G.; Wallner, G.M. Delamination behaviour of multi-layer films for PV encapsulation. Sol. Energy Mater. Sol. Cells 2005, 89, 139–151. [Google Scholar] [CrossRef]
  20. Song, Y.H.; Kang, G.H.; Yu, G.J.; Ahn, H.G.; Han, D.Y. A Study on the Electrical Characteristics of Photovoltaic Module Depending on Micro-Crack Patterns of Crystalline Silicon Solar Cell. Korean Inst. Electr. Eng. 2012, 61, 407–412. [Google Scholar]
  21. Barak, P. Smoothing and Differentiation by an Adaptive-Degree Polynomial Filter. Anal. Chem. 1955, 67, 2758–2762. [Google Scholar] [CrossRef]
  22. Lee, D.K. Cross Correlation based Signal Classification for Monitoring System of Abnormal Respiratory Status. Korea Acad. Ind. Coop. Soc. 2020, 21, 7–13. [Google Scholar]
  23. Zhao, A.X.; Tang, X.J.; Zhang, Z.H.; Liu, J.H. The parameters optimization selection of Savitzky-Golay filter and its application in smoothing pretreatment for FTIR spectra. In Proceedings of the 9th IEEE Conference on Industrial Electronics and Applications, Hangzhou, China, 9–11 June 2014. [Google Scholar]
  24. Dombi, J.; Dineva, A. Adaptive Multi-round Smoothing Based on the Savitzky-Golay Filter. Soft Comput. Appl. Adv. Intell. Syst. Comput. 2016, 633, 446–454. [Google Scholar]
Figure 1. Aging phenomena in PV modules.
Energies 15 03851 g001
Figure 2. Configuration of the PV monitoring section.
Energies 15 03851 g002
Figure 3. Configuration of the entire system of the test device.
Energies 15 03851 g003
Figure 4. Procedure of the degradation analysis modeling.
Energies 15 03851 g004
Figure 5. Characteristics of season-basis solar radiation.
Energies 15 03851 g005
Figure 6. Characteristics of season-basis temperature.
Energies 15 03851 g006
Figure 7. Output characteristics between new and aged PV modules in spring.
Energies 15 03851 g007
Figure 8. Output characteristics between new and aged PV modules in summer.
Energies 15 03851 g008
Figure 9. Output characteristics between new and aged PV modules in fall.
Energies 15 03851 g009
Figure 10. Output characteristics between new and aged PV modules in winter.
Energies 15 03851 g010
Figure 11. Total period and yearly-basis degradation rate.
Energies 15 03851 g011
Table 1. Aging characteristics of a PV module.
Aging FactorAging PhenomenonElectrical Characteristics
  • ultraviolet high temperature
  • encapsulant discoloration (yellowing, whitening)
  • I SC decrease efficiency decrease
  • high temperature humidity
  • ribbon wire corrosion
  • R S increase FF decrease
  • temperature difference humidity
  • back sheet delamination
  • I SC decrease efficiency decrease
  • temperature difference
  • cell crack
  • R S increase FF decrease
Table 2. Specification of aged and new PV modules.
ClassificationAged Modules (PA)New Modules (PN)
manufacturerLH
modelGMG01530KWSP50
date of manufacture2001~20022019
type of crystalmonocrystalmonocrystal
maximum output power (W)5350
open-circuit voltage (V)21.721.5
short-circuit current (A)3.253.19
voltage at maximum power point (V)17.417.5
current at maximum power point (A)3.052.86
Table 3. Output characteristics of new PV modules in spring.
Module
No.
Monthly Average PV Output (W)Season-Basis Average (W)Adjusted Season-Basis Average (W)
MarAprMay
PN1-1-127.3824.7526.0826.0727.63
PN1-1-229.0324.7926.7526.8528.46
PN1-2-135.8333.9337.3135.6937.83
PN1-2-238.1635.9641.2238.4440.75
PN2-1-138.3436.0428.7834.3936.45
PN2-1-237.4135.1727.5633.3835.38
PN2-2-128.5129.1537.5431.7333.64
PN2-2-228.8128.5436.6231.3333.21
Table 4. Output characteristics of new PV modules by season.
Module No.Season-Basis Average PV Output (W)Yearly Average
Output (W)
SpringSummerFallWinter
PN 1-1-127.6316.1426.7735.4126.49
PN 1-1-228.4617.2528.5637.2627.90
PN 1-2-137.8332.8726.0934.5332.83
PN 1-2-240.7535.9328.7137.2035.65
PN 2-1-136.4523.8328.3334.4830.77
PN 2-1-235.3822.8028.0632.7029.74
PN 2-2-133.6436.1528.4932.2032.62
PN 2-2-233.2135.6228.1432.6932.42
Table 5. Output characteristics of aged PV modules by season.
Module No.Season-Basis Average PV Output (W)Yearly Average Output (W)
SpringSummerFallWinter
PA1-1-120.537.6425.2628.4920.48
PA1-1-219.447.2626.9527.6420.32
PA1-2-126.3912.8924.6133.7624.41
PA1-2-226.8913.3827.0833.3825.18
PA2-1-124.1319.1127.1717.1721.89
PA2-1-226.1420.4426.4717.8422.72
PA2-2-126.2213.9027.3830.8624.59
PA2-2-226.4414.5026.5532.0924.90
Table 6. Degradation rate of aged PV modules.
Module No.Season-Basis Reduction Rate of Output (%)Degradation Rate (%)
SpringSummerFallWinterTotal PeriodYearly Average
PA1-1-125.7052.705.6619.5322.691.35
PA1-1-231.8457.895.6625.8227.161.65
PA1-2-130.2560.785.662.2125.641.55
PA1-2-234.0262.755.6610.2729.351.81
PA2-1-133.8119.804.1050.2028.851.78
PA2-1-226.1110.395.6645.4423.591.41
PA2-2-122.0461.553.914.1424.611.48
PA2-2-220.3659.295.661.8523.201.38
average28.2550.535.2419.9825.731.55
Publisher’s Note: MDPI stays neutral with regard to jurisdictional claims in published maps and institutional affiliations.

